ratios analysis
TRANSCRIPT
UNIVERSITY OF MUMBAI PROJECT REPORT ON RATIO ANALYSIS
BY Mr. OJAS NITIN NARSALE M.COM (Part-II) (SEM-III) (Roll No.28) ACADEMIC YEAR 2016-2017 PROJECT GUIDE
Prof. KARIM
PARLE TILAK VIDYALAYA ASSOCIATION’S M.L. DAHANUKAR COLLEGE OF COMMERCE DIXIT ROAD, VILE PARLE ( E) MUMBAI- 400057

DECLERATION
I, Mr. OJAS NITIN NARSALE of PARLE TILAK VIDYALAYA ASSOCIATION’S M.L. DAHANUKAR COLLEGE OF COMMERCE of M.COM(Part-II) (SEM-III) (Roll No.28) hereby declare that I have completed this project on RATIO ANALYSIS in the ACADEMIC YEAR 2016-2017. This information submitted is true and original to the best of my knowledge.
(Signature of Student)

ACKNOWLEDGEMENT
To list who all helped me is difficult because they are so numerous and the depth is so enormous. I would like to acknowledge the following as being idealistic channels and fresh dimensions in the completion of this project. I would firstly thank the University of Mumbai for giving me chance to do this project. I would like to thank my Principal, Dr. Madhavi Pethe for providing the necessary facilities required for completion of this project. I even will like to thank our co-ordinator, for the moral support that I received. I would like to thank our College Library, for providing various books and magazines related to my project. Finally I proudly thank my Parents and Friends for their support throughout the Project.
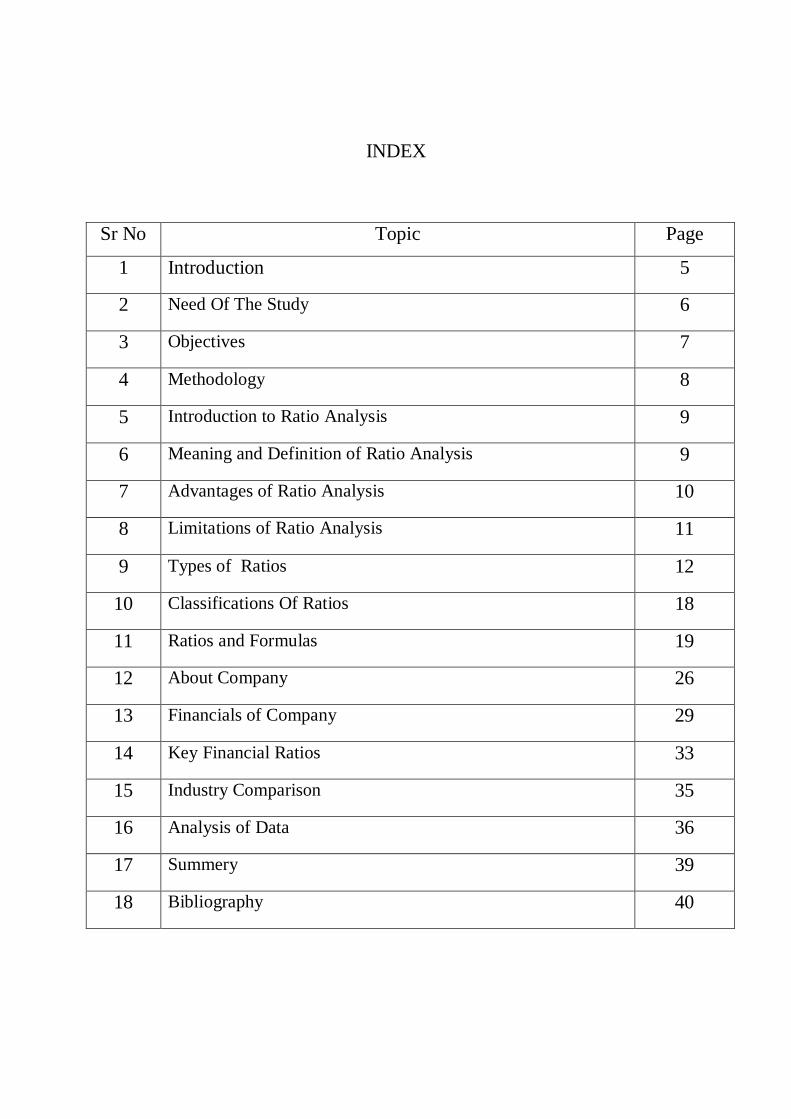
INDEX
Sr No Topic Page
1 Introduction 5
2 Need Of The Study 6
3 Objectives 7
4 Methodology 8
5 Introduction to Ratio Analysis 9
6 Meaning and Definition of Ratio Analysis 9
7 Advantages of Ratio Analysis 10
8 Limitations of Ratio Analysis 11
9 Types of Ratios 12
10 Classifications Of Ratios 18
11 Ratios and Formulas 19
12 About Company 26
13 Financials of Company 29
14 Key Financial Ratios 33
15 Industry Comparison 35
16 Analysis of Data 36
17 Summery 39
18 Bibliography 40

Introduction
Financial Management is the specific area of finance dealing with the financial decision corporations make, and the tools and analysis used to make the decisions. The discipline as a whole may be divided between long-term and short-term decisions and techniques. Both share the same goal of enhancing firm value by ensuring that return on capital exceeds cost of capital, without taking excessive financial risks.
Capital investment decisions comprise the long-term choices about which projects receive investment, whether to finance that investment with equity or debt, and when or whether to pay dividends to shareholders. Short-term corporate finance decisions are called working capital management and deal with balance of current assets and current liabilities by managing cash, inventories, and short-term borrowings and lending (e.g., the credit terms extended to customers).
Corporate finance is closely related to managerial finance, which is slightly broader in scope, describing the financial techniques available to all forms of business enterprise, corporate or not
Role of Financial Managers:
The role of a financial manager can be discussed under the following heads:
1. Nature of work
2. Working conditions
3. Employment
4. Training, Other qualifications and Advancement
5. Job outlook
6. Earnings
7. Related occupations.
Need Of The Study
1. The study has great significance and provides benefits to various parties whom directly or indirectly interact with the company.
2. It is beneficial to management of the company by providing crystal clear picture regarding important aspects like liquidity, leverage, activity and profitability.
3. The study is also beneficial to employees and offers motivation by showing how actively they are contributing for company’s growth.
4. The investors who are interested in investing in the company’s shares will also get benefited by going through the study and can easily take a decision whether to invest or not to invest in the company’s shares.

Objectives
The major objectives of the resent study are to know about financial strengths and weakness of LANCO through FINANCIAL RATIO ANALYSIS.
The main objectives of resent study aimed as:
To evaluate the performance of the company by using ratios as a yardstick to measure the efficiency of the company. To understand the liquidity, profitability and efficiency positions of the company during the study period. To evaluate and analyze various facts of the financial performance of the company. To make comparisons between the ratios during different periods.
OBJECTIVES
1. To study the present financial system at Genting Lanco.
2. To determine the Profitability, Liquidity Ratios.
3. To analyze the capital structure of the company with the help of Leverage ratio.
4. To offer appropriate suggestions for the better performance of the organization.

Methodology
The information is collected through secondary sources during the project. That information was utilized for calculating performance evaluation and based on that, interpretations were made.
Sources of secondary data:
1. Most of the calculations are made on the financial statements of the company provided statements.
2. Referring standard texts and referred books collected some of the information regarding theoretical aspects.
3. Method- to assess the performance of the company method of observation of the work in finance department in followed.

Introduction to Ratio Analysis
The term “ratio analysis” refers to the analysis of the financial statements in conjunction with the
interpretations of financial results of a particular period of operations, derived with the help of
'ratio'. Ratio analysis is used to determine the financial soundness of a business concern.
In this blog post, we will introduce ratio analysis, what it is used for, what are the advantages and
disadvantages of it and its limitations.
Meaning and Definition of Ratio Analysis
Ratio analysis is a conceptual technique which dates back to the inception of accounting, as a
concept. Financial analysis as a scientific tool is used to carry out the calculations in the area of
accounting. In order to appraise the valid and existent worth of an enterprise, financial tool
comes handy, regularly. Besides, it also allows the firms to observe the performance spanning
across a long period of time along with the impediments and shortcomings. Financial analysis is
an essential mechanism for a clear interpretation of financial statements. It aids the process of
discovering, the existence of any cross-sectional and time series linkages between various ratios.
Formerly, Security qualified as a major requisite for banks and financial institutions, to consider
and grant loans and advances. However, there’s been a complete paradigm shift in the structure.
Currently, lending is based on the evaluation of the actual need of the firms. Financial viability
of a proposal, as a base to grant loans, is now been given precedence over security. Further, an
element of risk is an imperative in every business decision. Credits, run a higher risk, as a part of
any decision making in business and so, Ratio analysis and other quantitative techniques mitigate
the risk to some extent by providing a fair and rational assessment of risks.
Ratio analysis broadly explains the process of computing, acts as a vital tool in determination
and presentation of the relationship of related items and groups of items of the financial
statements. Financial position of a unit is concretely and clearly encapsulated by the means of
ratio analysis. The significance of Ratio Analysis for a holistic Financial Analysis remains
unflinchingly supreme.

Ratio can be used in the form of percentage, Quotient and Rates. In other words, it can be
expressed as a to b; a: b (a is to b) or as a simple fraction, integer and decimal. A ratio is
calculated by dividing one item or figure by another item or figure.
Analysis of Ratio
Analysis using ratios can be done in following ways.
Analysis of an individual (or) Single Ratio
Analysis of referring to a Group of Ratio
Analysis of ratios by Trend
Analysis by inter-firm comparison
Advantages of Ratio Analysis
In order to establish the relationship between two accounting figures, application of Ratio
Analysis is necessary. Application of the same provides the significant information to the
management or users who can analyse the business situation. It also facilitates meaningful and
productive monitoring of the annual performance of the firm. Illustrated below are the
advantages of ratio analysis:
It facilitates the accounting information to be summarized and simplified in a concise and
concrete form which is comprehensible to the user.
It depicts the inter-relationship between the facts and figures of various segments of business
which are instrumental in taking important financial decisions.
Ratio analysis clears all the impediments and inefficiencies related to performance of the
firm/individual.
It equips the management with the requisite information enables them to take prompt business -
decisions.
It helps the management in effectively discharging its functions/operations such as planning,
organizing, controlling, directing and forecasting.

Ratio analysis provides a detailed account of profitable and unprofitable activities. Thus, the
management is able to concentrate on unprofitable activities and consider the necessary steps to
overcome the existential shortcomings.
Ratio analysis is used as a benchmark for effective control of performance of business activities.
Ratios are an effectual means of communication and informing about financial soundness made
by the business concern to the proprietors, investors, creditors and other parties.
Ratio analysis is an effective tool which is used for measuring the operating results of the
enterprises.
It facilitates control over the operation as well as resources of the business.
Ratio analysis provides all assistance to the management to discharge responsibilities.
Ratio analysis aids in accurate determination of the performance of liquidity, profitability and
solvency position of the business concern.
Limitations of Ratio Analysis
Various environmental conditions such as regulation, market structures etc. vary for different
companies, operating in different industries. Significance of such factors is extremely high. This
variation may lead to a difference or an element of discrepancy, while comparing the two
companies from diverse industries.
Financial accounting information is impacted and often subject to change, by estimates and
assumptions. Accounting standards allow scope for incorporating different accounting policies,
which impairs comparability and hence functionality of ratio analysis is less in such situations.
Ratio analysis explicates association between past information while current and future
information is of more relevance and application to the users.

Financial Ratios
Financial ratios are relationships determined from a company's financial information and used
for comparison purposes. Examples include such often referred to measures as return on
investment (ROI), return on assets (ROA), and debt-to-equity, to name just three. These ratios
are the result of dividing one account balance or financial measurement with another. Usually
these measurements or account balances are found on one of the company's financial
statements—balance sheet, income statement, cashflow statement, and/or statement of changes
in owner's equity. Financial ratios can provide small business owners and managers with a
valuable tool with which to measure their progress against predetermined internal goals, a certain
competitor, or the overall industry. In addition, tracking various ratios over time is a powerful
means of identifying trends in their early stages. Ratios are also used by bankers, investors, and
business analysts to assess a company's financial status.
Ratios are calculated by dividing one number by another, total sales divided by number of
employees, for example. Ratios enable business owners to examine the relationships between
items and measure that relationship. They are simple to calculate, easy to use, and provide
business owners with insight into what is happening within their business, insights that are not
always apparent upon review of the financial statements alone. Ratios are aids to judgment and
cannot take the place of experience. But experience with reading ratios and tracking them over
time will make any manager a better manager. Ratios can help to pinpoint areas that need
attention before the looming problem within the area is easily visible.
Virtually any financial statistics can be compared using a ratio. In reality, however, small
business owners and managers only need to be concerned with a small set of ratios in order to
identify where improvements are needed.
It is important to keep in mind that financial ratios are time sensitive; they can only present a
picture of the business at the time that the underlying figures were prepared. For example, a
retailer calculating ratios before and after the Christmas season would get very different results.
In addition, ratios can be misleading when taken singly, though they can be quite valuable when
a small business tracks them over time or uses them as a basis for comparison against company
goals or industry standards.

Perhaps the best way for small business owners to use financial ratios is to conduct a formal ratio
analysis on a regular basis. The raw data used to compute the ratios should be recorded on a
special form monthly. Then the relevant ratios should be computed, reviewed, and saved for
future comparisons. Determining which ratios to compute depends on the type of business, the
age of the business, the point in the business cycle, and any specific information sought. For
example, if a small business depends on a large number of fixed assets, ratios that measure how
efficiently these assets are being used may be the most significant. In general, financial ratios can
be broken down into four main categories—1) profitability or return on investment; 2) liquidity;
3) leverage, and 4) operating or efficiency—with several specific ratio calculations prescribed
within each.
Profitability Or Return On Investment Ratios
Profitability ratios provide information about management's performance in using the resources
of the small business. Many entrepreneurs decide to start their own businesses in order to earn a
better return on their money than would be available through a bank or other low-risk
investments. If profitability ratios demonstrate that this is not occurring—particularly once a
small business has moved beyond the start-up phase—then entrepreneurs for whom a return on
their money is the foremost concern may wish to sell the business and reinvest their money
elsewhere. However, it is important to note that many factors can influence profitability ratios,
including changes in price, volume, or expenses, as well as the purchase of assets or the
borrowing of money. Some specific profitability ratios follow, along with the means of
calculating them and their meaning to a small business owner or manager.
Gross profitability: Gross Profits/Net Sales—measures the margin on sales the company is
achieving. It can be an indication of manufacturing efficiency, or marketing effectiveness.
Net profitability: Net Income/Net Sales—measures the overall profitability of the company, or
how much is being brought to the bottom line. Strong gross profitability combined with weak net
profitability may indicate a problem with indirect operating expenses or non-operating items,
such as interest expense. In general terms, net profitability shows the effectiveness of
management. Though the optimal level depends on the type of business, the ratios can be
compared for firms in the same industry.
Return on assets: Net Income/Total Assets—indicates how effectively the company is deploying
its assets. A very low return on asset, or ROA, usually indicates inefficient management, whereas
a high ROA means efficient management. However, this ratio can be distorted by depreciation or
any unusual expenses.
Return on investment 1: Net Income/Owners' Equity—indicates how well the company is
utilizing its equity investment. Due to leverage, this measure will generally be higher than return
on assets. ROI is considered to be one of the best indicators of profitability. It is also a good
figure to compare against competitors or an industry average. Experts suggest that companies
usually need at least 10-14 percent ROI in order to fund future growth. If this ratio is too low, it
can indicate poor management performance or a highly conservative business approach. On the
other hand, a high ROI can mean that management is doing a good job, or that the firm is
undercapitalized.
Return on investment 2: Dividends +/- Stock Price Change/Stock Price Paid—from the investor's
point of view, this calculation of ROI measures the gain (or loss) achieved by placing an
investment over a period of time.
Earnings per share: Net Income/Number of Shares Outstanding—states a corporation's profits on
a per-share basis. It can be helpful in further comparison to the market price of the stock.
Investment turnover: Net Sales/Total Assets—measures a company's ability to use assets to
generate sales. Although the ideal level for this ratio varies greatly, a very low figure may mean
that the company maintains too many assets or has not deployed its assets well, whereas a high
figure means that the assets have been used to produce good sales numbers.
Sales per employee: Total Sales/Number of Employees—can provide a measure of productivity.
This ratio will vary widely from one industry to another. A high figure relative to one's industry
average can indicate either good personnel management or good equipment.

Liquidity Ratios
Liquidity ratios demonstrate a company's ability to pay its current obligations. In other words,
they relate to the availability of cash and other assets to cover accounts payable, short-term debt,
and other liabilities. All small businesses require a certain degree of liquidity in order to pay their
bills on time, though start-up and very young companies are often not very liquid. In mature
companies, low levels of liquidity can indicate poor management or a need for additional capital.
Any company's liquidity may vary due to seasonality, the timing of sales, and the state of the
economy. But liquidity ratios can provide small business owners with useful limits to help them
regulate borrowing and spending. Some of the best-known measures of a company's liquidity
include:
Current ratio: Current Assets/Current Liabilities—measures the ability of an entity to pay its
near-term obligations. "Current" usually is defined as within one year. Though the ideal current
ratio depends to some extent on the type of business, a general rule of thumb is that it should be
at least 2:1. A lower current ratio means that the company may not be able to pay its bills on
time, while a higher ratio means that the company has money in cash or safe investments that
could be put to better use in the business.
Quick ratio (or "acid test"): Quick Assets (cash, marketable securities, and receivables)/Current
Liabilities—provides a stricter definition of the company's ability to make payments on current
obligations. Ideally, this ratio should be 1:1. If it is higher, the company may keep too much cash
on hand or have a poor collection program for accounts receivable. If it is lower, it may indicate
that the company relies too heavily on inventory to meet its obligations.
Cash to total assets: Cash/Total Assets—measures the portion of a company's assets held in cash
or marketable securities. Although a high ratio may indicate some degree of safety from a
creditor's viewpoint, excess amounts of cash may be viewed as inefficient.
Sales to receivables (or turnover ratio): Net Sales/Accounts Receivable—measures the annual
turnover of accounts receivable. A high number reflects a short lapse of time between sales and
the collection of cash, while a low number means collections take longer. Because of seasonal
changes this ratio is likely to vary. As a result, an annual floating average sales to receivables
ratio is most useful in identifying meaningful shifts and trends.
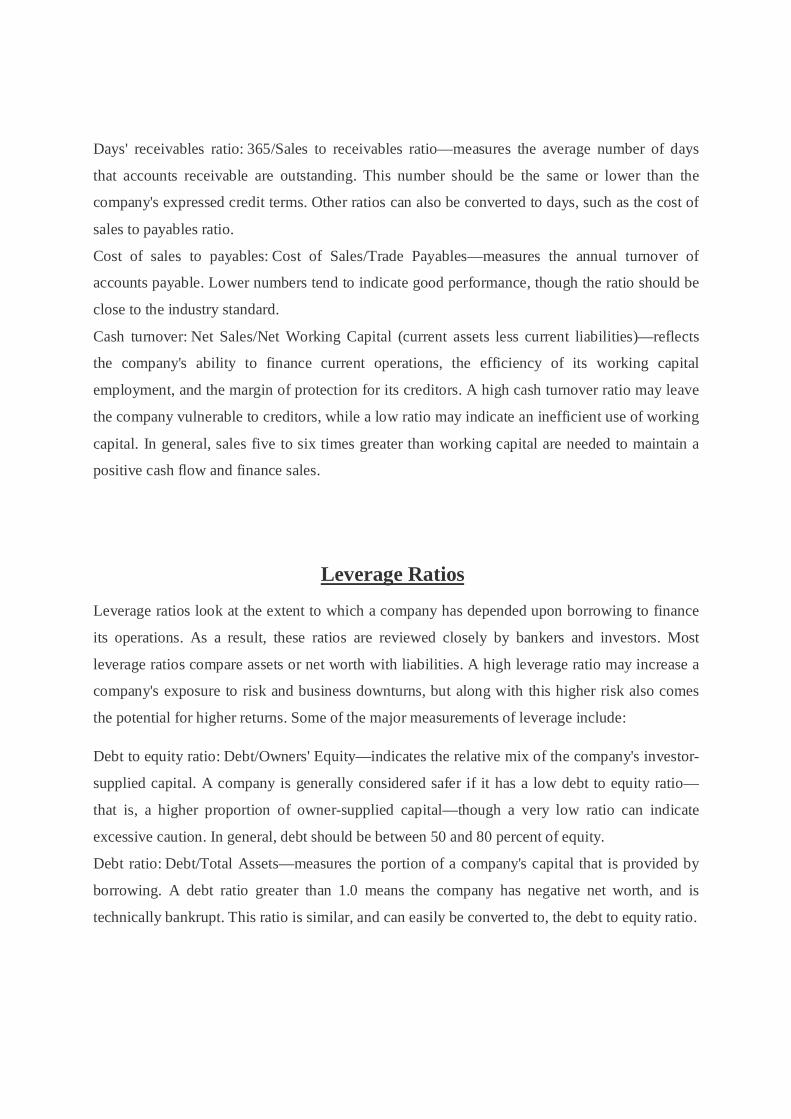
Days' receivables ratio: 365/Sales to receivables ratio—measures the average number of days
that accounts receivable are outstanding. This number should be the same or lower than the
company's expressed credit terms. Other ratios can also be converted to days, such as the cost of
sales to payables ratio.
Cost of sales to payables: Cost of Sales/Trade Payables—measures the annual turnover of
accounts payable. Lower numbers tend to indicate good performance, though the ratio should be
close to the industry standard.
Cash turnover: Net Sales/Net Working Capital (current assets less current liabilities)—reflects
the company's ability to finance current operations, the efficiency of its working capital
employment, and the margin of protection for its creditors. A high cash turnover ratio may leave
the company vulnerable to creditors, while a low ratio may indicate an inefficient use of working
capital. In general, sales five to six times greater than working capital are needed to maintain a
positive cash flow and finance sales.
Leverage Ratios
Leverage ratios look at the extent to which a company has depended upon borrowing to finance
its operations. As a result, these ratios are reviewed closely by bankers and investors. Most
leverage ratios compare assets or net worth with liabilities. A high leverage ratio may increase a
company's exposure to risk and business downturns, but along with this higher risk also comes
the potential for higher returns. Some of the major measurements of leverage include:
Debt to equity ratio: Debt/Owners' Equity—indicates the relative mix of the company's investor-
supplied capital. A company is generally considered safer if it has a low debt to equity ratio—
that is, a higher proportion of owner-supplied capital—though a very low ratio can indicate
excessive caution. In general, debt should be between 50 and 80 percent of equity.
Debt ratio: Debt/Total Assets—measures the portion of a company's capital that is provided by
borrowing. A debt ratio greater than 1.0 means the company has negative net worth, and is
technically bankrupt. This ratio is similar, and can easily be converted to, the debt to equity ratio.

Fixed to worth ratio: Net Fixed Assets/Tangible Net Worth—indicates how much of the owner's
equity has been invested in fixed assets, i.e., plant and equipment. It is important to note that
only tangible assets (physical assets like cash, inventory, property, plant, and equipment) are
included in the calculation, and that they are valued less depreciation. Creditors usually like to
see this ratio very low, but the large-scale leasing of assets can artificially lower it.
Interest coverage: Earnings before Interest and Taxes/Interest Expense—indicates how
comfortably the company can handle its interest payments. In general, a higher interest coverage
ratio means that the small business is able to take on additional debt. This ratio is closely
examined by bankers and other creditors.
Efficiency Ratios
By assessing a company's use of credit, inventory, and assets, efficiency ratios can help small
business owners and managers conduct business better. These ratios can show how quickly the
company is collecting money for its credit sales or how many times inventory turns over in a
given time period. This information can help management decide whether the company's credit
terms are appropriate and whether its purchasing efforts are handled in an efficient manner. The
following are some of the main indicators of efficiency:
Annual inventory turnover: Cost of Goods Sold for the Year/Average Inventory—shows how
efficiently the company is managing its production, warehousing, and distribution of product,
considering its volume of sales. Higher ratios—over six or seven times per year—are generally
thought to be better, although extremely high inventory turnover may indicate a narrow selection
and possibly lost sales. A low inventory turnover rate, on the other hand, means that the
company is paying to keep a large inventory, and may be overstocking or carrying obsolete
items.
Inventory holding period: 365/Annual Inventory Turnover—calculates the number of days, on
average, that elapse between finished goods production and sale of product.
Inventory to assets ratio Inventory/Total Assets—shows the portion of assets tied up in
inventory. Generally, a lower ratio is considered better.
Accounts receivable turnover Net (credit) Sales/Average Accounts Receivable—gives a measure
of how quickly credit sales are turned into cash. Alternatively, the reciprocal of this ratio
indicates the portion of a year's credit sales that are outstanding at a particular point in time.
Collection period 365/Accounts Receivable Turnover—measures the average number of days the
company's receivables are outstanding, between the date of credit sale and collection of cash.
Classifications Of Ratios
The use of ratio analysis is not confined to financial manager only. There are different parties interested in the ratio analysis for knowing the financial position of a firm for different purposes. Various accounting ratios can be classified as follows:
1.Traditional Classification
2.Functional Classification
3.Significance ratios
1.Traditional Classification
It includes the following.
•Balance sheet (or) position statement ratio: They deal with the relationship between two balance sheet items, e.g. the ratio of current assets to current liabilities etc., both the items must, however, pertain to the same balance sheet.
•Profit & loss account (or) revenue statement ratios: These ratios deal with the relationship between two profit & loss account items, e.g. the ratio of gross profit to sales etc.
•Composite (or) inter statement ratios: These ratios exhibit the relation between a profit & loss account or income statement item and a balance sheet items, e.g. stock turnover ratio, or the ratio of total assets to sales.
2. Functional Classification
These include liquidity ratios, long term solvency and leverage ratios, activity ratios and profitability ratios.

3. Significance ratios
Some ratios are important than others and the firm may classify them as primary and secondary ratios. The primary ratio is one, which is of the prime importance to a concern. The other ratios that support the primary ratio are called secondary ratios
IN THE VIEW OF FUNCTIONAL CLASSIFICATION THE RATIOS ARE
1. Liquidity ratio
2. Leverage ratio
3. Activity ratio
4. Profitability ratio
Liquidity Ratios
Liquidity refers to the ability of a concern to meet its current obligations as & when there becomes due. The short term obligations of a firm can be met only when there are sufficient liquid assets. The short term obligations are met by realizing amounts from current, floating (or)circulating assets The current assets should either be calculated liquid (or)near liquidity. They should be convertible into cash for paying obligations of short term nature. The sufficiency (or) insufficiency of current assets should be assessed by comparing them with short-term current liabilities. If current assets can pay off current liabilities, then liquidity position will be satisfactory. To measure the liquidity of a firm the following ratios can be calculated
•Current ratio
•Quick (or) Acid-test (or) Liquid ratio
•Absolute liquid ratio (or) Cash position ratio
Ratios and Formulas
Financial statement analysis is a judgmental process. One of the primary objectives is identification of major changes in trends, and relationships and the investigation of the reasons underlying those changes. The judgment process can be improved by experience and the use of analytical tools. Probably the most widely used financial analysis technique is ratio analysis, the analysis of relationships between two or more line items on the financial statement. Financial ratios are usually expressed in percentage or times. Generally, financial ratios are calculated for
the purpose of evaluating aspects of a company's operations and fall into the following categories:
liquidity ratios measure a firm's ability to meet its current obligations. profitability ratios measure management's ability to control expenses and to earn a return
on the resources committed to the business. leverage ratios measure the degree of protection of suppliers of long-term funds and can
also aid in judging a firm's ability to raise additional debt and its capacity to pay its liabilities on time.
efficiency, activity or turnover ratios provide information about management's ability to control expenses and to earn a return on the resources committed to the business.
A ratio can be computed from any pair of numbers. Given the large quantity of variables included in financial statements, a very long list of meaningful ratios can be derived. A standard list of ratios or standard computation of them does not exist. The following ratio presentation includes ratios that are most often used when evaluating the credit worthiness of a customer. Ratio analysis becomes a very personal or company driven procedure. Analysts are drawn to and use the ones they are comfortable with and understand.
Liquidity Ratios
Working Capital Working capital compares current assets to current liabilities, and serves as the liquid reserve available to satisfy contingencies and uncertainties. A high working capital balance is mandated if the entity is unable to borrow on short notice. The ratio indicates the short-term solvency of a business and in determining if a firm can pay its current liabilities when due.
Formula Current Assets
- Current Liabilities
Acid Test or Quick Ratio A measurement of the liquidity position of the business. The quick ratio compares the cash plus cash equivalents and accounts receivable to the current liabilities. The primary difference between the current ratio and the quick ratio is the quick ratio does not include inventory and prepaid expenses in the calculation. Consequently, a business's quick ratio will be lower than its current ratio. It is a stringent test of liquidity.
Formula Cash + Marketable Securities + Accounts Receivable
Current Liabilities
Current Ratio Provides an indication of the liquidity of the business by comparing the amount of current assets

to current liabilities. A business's current assets generally consist of cash, marketable securities, accounts receivable, and inventories. Current liabilities include accounts payable, current maturities of long-term debt, accrued income taxes, and other accrued expenses that are due within one year. In general, businesses prefer to have at least one dollar of current assets for every dollar of current liabilities. However, the normal current ratio fluctuates from industry to industry. A current ratio significantly higher than the industry average could indicate the existence of redundant assets. Conversely, a current ratio significantly lower than the industry average could indicate a lack of liquidity.
Formula Current Assets
Current Liabilities
Cash Ratio Indicates a conservative view of liquidity such as when a company has pledged its receivables and its inventory, or the analyst suspects severe liquidity problems with inventory and receivables.
Formula Cash Equivalents + Marketable Securities
Current Liabilities
Profitability Ratios
Net Profit Margin (Return on Sales) A measure of net income dollars generated by each dollar of sales.
Formula Net Income *
Net Sales
* Refinements to the net income figure can make it more accurate than this ratio computation. They could include removal of equity earnings from investments, "other income" and "other expense" items as well as minority share of earnings and nonrecuring items.
Return on Assets Measures the company's ability to utilize its assets to create profits.
Formula Net Income *
(Beginning + Ending Total Assets) / 2
Operating Income Margin A measure of the operating income generated by each dollar of sales.

Formula Operating Income
Net Sales
Return on Investment Measures the income earned on the invested capital.
Formula Net Income *
Long-term Liabilities + Equity
Return on Equity Measures the income earned on the shareholder's investment in the business.
Formula Net Income *
Equity
Du Pont Return on Assets A combination of financial ratios in a series to evaluate investment return. The benefit of the method is that it provides an understanding of how the company generates its return.
Formula Net Income *
Sales x Sales Assets x Assets
Equity
Gross Profit Margin Indicates the relationship between net sales revenue and the cost of goods sold. This ratio should be compared with industry data as it may indicate insufficient volume and excessive purchasing or labor costs.
Formula Gross Profit
Net Sales
Financial Leverage Ratio
Total Debts to Assets Provides information about the company's ability to absorb asset reductions arising from losses without jeopardizing the interest of creditors.
Formula Total Liabilities
Total Assets

Capitalization Ratio Indicates long-term debt usage.
Formula Long-Term Debt
Long-Term Debt + Owners' Equity
Debt to Equity Indicates how well creditors are protected in case of the company's insolvency.
Formula Total Debt
Total Equity
Interest Coverage Ratio (Times Interest Earned) Indicates a company's capacity to meet interest payments. Uses EBIT (Earnings Before Interest and Taxes)
Formula EBIT
Interest Expense
Long-term Debt to Net Working Capital Provides insight into the ability to pay long term debt from current assets after paying current liabilities.
Formula Long-term Debt
Current Assets - Current Liabilities
Efficiency Ratios
Cash Turnover Measures how effective a company is utilizing its cash.
Formula Net Sales
Cash
Sales to Working Capital (Net Working Capital Turnover) Indicates the turnover in working capital per year. A low ratio indicates inefficiency, while a high level implies that the company's working capital is working too hard.
Formula Net Sales
Average Working Capital
Total Asset Turnover Measures the activity of the assets and the ability of the business to generate sales through the use of the assets.
Formula Net Sales
Average Total Assets
Fixed Asset Turnover Measures the capacity utilization and the quality of fixed assets.
Formula Net Sales
Net Fixed Assets
Days' Sales in Receivables Indicates the average time in days, that receivables are outstanding (DSO). It helps determine if a change in receivables is due to a change in sales, or to another factor such as a change in selling terms. An analyst might compare the days' sales in receivables with the company's credit terms as an indication of how efficiently the company manages its receivables.
Formula Gross Receivables
Annual Net Sales / 365
Accounts Receivable Turnover Indicates the liquidity of the company's receivables.
Formula Net Sales
Average Gross Receivables
Accounts Receivable Turnover in Days Indicates the liquidity of the company's receivables in days.
Formula Average Gross Receivables
Annual Net Sales / 365
Days' Sales in Inventory Indicates the length of time that it will take to use up the inventory through sales.
Formula Ending Inventory
Cost of Goods Sold / 365

Inventory Turnover Indicates the liquidity of the inventory.
Formula Cost of Goods Sold Average Inventory
Inventory Turnover in Days Indicates the liquidity of the inventory in days.
Formula Average Inventory
Cost of Goods Sold / 365
Operating Cycle Indicates the time between the acquisition of inventory and the realization of cash from sales of inventory. For most companies the operating cycle is less than one year, but in some industries it is longer.
Formula Accounts Receivable Turnover in Days
+ Inventory Turnover in Day
Days' Payables Outstanding Indicates how the firm handles obligations of its suppliers.
Formula Ending Accounts Payable
Purchases / 365
Payables Turnover Indicates the liquidity of the firm's payables.
Formula Purchases
Average Accounts Payable
Payables Turnover in Days Indicates the liquidity of the firm's payables in days.
Formula
Average Accounts Payable Purchases / 365

About Company
Patel Integrated Logistics Ltd., incorporated in the year 1962, is a Small Cap company (having a
market cap of Rs 135.59 Cr.) operating in Service sector.
Patel Integrated Logistics Ltd. key Products/Revenue Segments include Cargo Income which
contributed Rs 337.82 Cr to Sales Value (57.45% of Total Sales), Freight which contributed Rs
172.65 Cr to Sales Value (29.36% of Total Sales), Commission which contributed Rs 77.48 Cr to
Sales Value (13.17% of Total Sales), Other Operating Revenue which contributed Rs 0.03 Cr to
Sales Value (0.00% of Total Sales), for the year ending 31-Mar-2015.
For the quarter ended 30-Jun-2016, the company has reported a Standalone sales of Rs. 122.20
Cr., up 0.25% from last quarter Sales of Rs. 121.90 Cr. and down -8.53% from last year same
quarter Sales of Rs. 133.60 Cr. Company has reported net profit after tax of Rs. 2.37 Cr. in latest
quarter.
The company’s management includes Mr.Nitin B Akolkar, Mr.Areef A Patel, Mr. Asgar S Patel,
Mr. Farukh S Wadia, Mr. P S G Nair, Mr. Sandeep P Parikh, Mr. Syed K Husain, Mr. Vilas
Unavane, Ms. Bhumika L Batra, Mr. Deepak M Keni, Mr. Mahesh Fogla, Mr. Nitin B Akolkar.
Company has MSP & Co as its auditors. As on 30-Jun-2016, the company has a total of
15,886,612 shares outstanding.
Company Profile
Set up as a one-truck activity in 1959, Patel Roadways rapidly shifted gears to grow into one of
the largest surface logistics and road transportation companies in Asia. With a network that spans
500 stations countrywide and a workforce of over 1,000 highly trained people, Patel Roadways is
reputed for its prompt, reliable service and strict adherence to delivery schedules that facilitate
movement of cargo worth Rs 120 billion annually. The Company today has more than 75,000
satisfied customers, which include multinationals, public and private sector organizations and
small-scale industries as well as the trading community.
The Company is steadily delivering on its promise of providing the swift service Investment in
IT and state-of-the art tracking systems, coupled with containerization of its entire fleet, help
Patel Roadways to maintain distinctive edge over competition while simultaneously offering
enhanced and value-added services to the industry.
Vision, Mission And Values
VISION
“A leader in domestic logistics through excellence in delivery”
MISSION
Create benchmarks of quality, consistency and commitment in the integrated logistics business
across nation. Create better value for clients and for us through ingenuity supported by
knowledge, expertise, technology and imagination. Nurture long term relationships with all
stakeholders through growth, trust and by delivering on promises.
VALUES
Customer Oriented Approach: To anticipate and meet present and future customer
expectations coherent with the “Win-Win” philosophy.
Learning and Development: To facilitate continuous development by obtaining knowledge that
will pave the way for improvement and positive change and give a sense of direction to our
conduct.
Employee Satisfaction: To offer more than the expectations of our employees. To increase
social sharing and mutual respect with the objective of ensuring social communication.
Team Spirit: Solving problems and sharing the success together.
Respecting the Environment and Society: Be responsible about society’s expectations and the
need to protect the environment.
Reliability, Honesty and Ethics: To keep promises given to shareholders, be honest and respect
ethical values.
Taking Responsibility: requires pushing the limits of knowledge and skills, even with the tasks
that are way too challenging.
54
As per our report of even dateFor M S P & Co. For and on behalf of the Board,Chartered Accountants(Registration No. 107565W)
M. S. PARIKH AREEF A. PATEL P. S. G. NAIRPartner Executive Vice Chairman DirectorMembership No. 08684
Mumbai, NITIN B. AKOLKAR MAHESH FOGLADated : 27th May, 2016 Company Secretary Chief Financial Offi cer
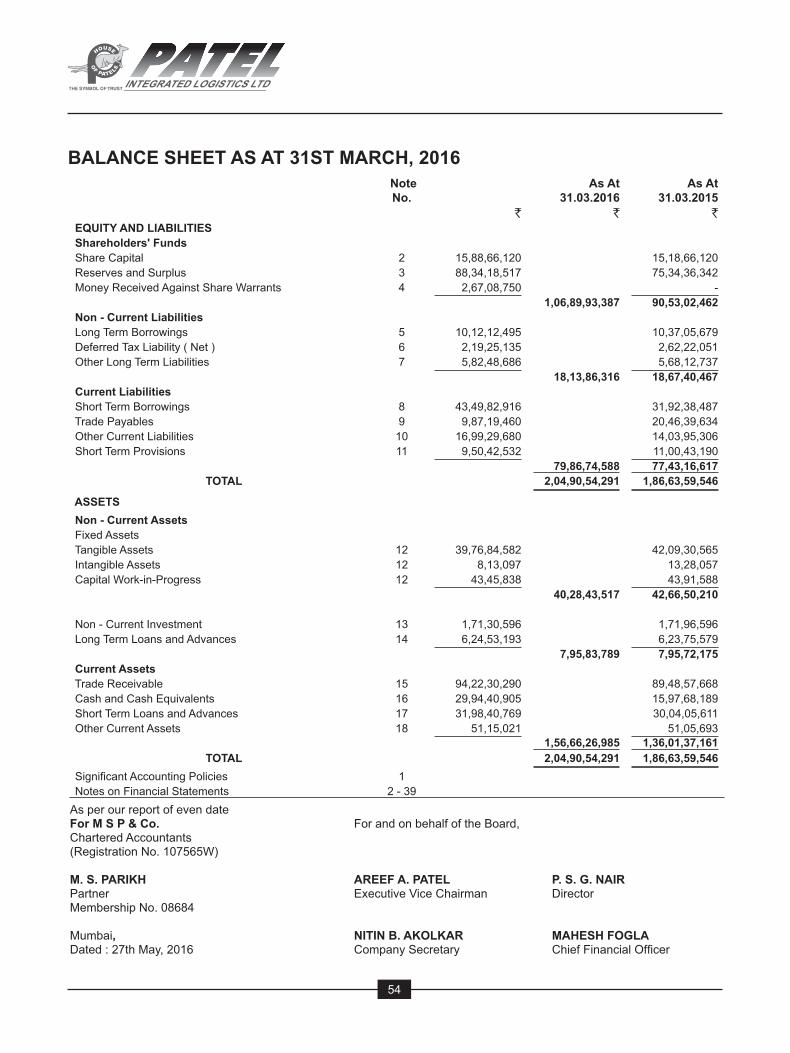
BALANCE SHEET AS AT 31ST MARCH, 2016 NoteNo.
`
As At 31.03.2016
`
As At 31.03.2015
` EQUITY AND LIABILITIES Shareholders' Funds Share Capital 2 15,88,66,120 15,18,66,120 Reserves and Surplus 3 88,34,18,517 75,34,36,342 Money Received Against Share Warrants 4 2,67,08,750 -
1,06,89,93,387 90,53,02,462 Non - Current Liabilities Long Term Borrowings 5 10,12,12,495 10,37,05,679 Deferred Tax Liability ( Net ) 6 2,19,25,135 2,62,22,051 Other Long Term Liabilities 7 5,82,48,686 5,68,12,737
18,13,86,316 18,67,40,467 Current Liabilities Short Term Borrowings 8 43,49,82,916 31,92,38,487 Trade Payables 9 9,87,19,460 20,46,39,634 Other Current Liabilities 10 16,99,29,680 14,03,95,306 Short Term Provisions 11 9,50,42,532 11,00,43,190
79,86,74,588 77,43,16,617 TOTAL 2,04,90,54,291 1,86,63,59,546
ASSETS Non - Current Assets Fixed Assets Tangible Assets 12 39,76,84,582 42,09,30,565 Intangible Assets 12 8,13,097 13,28,057 Capital Work-in-Progress 12 43,45,838 43,91,588
40,28,43,517 42,66,50,210
Non - Current Investment 13 1,71,30,596 1,71,96,596 Long Term Loans and Advances 14 6,24,53,193 6,23,75,579
7,95,83,789 7,95,72,175 Current Assets Trade Receivable 15 94,22,30,290 89,48,57,668 Cash and Cash Equivalents 16 29,94,40,905 15,97,68,189 Short Term Loans and Advances 17 31,98,40,769 30,04,05,611 Other Current Assets 18 51,15,021 51,05,693
1,56,66,26,985 1,36,01,37,161 TOTAL 2,04,90,54,291 1,86,63,59,546
Signifi cant Accounting Policies 1 Notes on Financial Statements 2 - 39

55
54th Annual Report 2015-16
PROFIT AND LOSS STATEMENT FOR THE YEAR ENDED 31ST MARCH, 2016 NoteNo.
For the Year 2015-16
`
For the Year 2014-15
` INCOME
Revenue from Operations 19 5,11,36,32,878 5,87,98,07,110
Other Income 20 2,65,11,853 1,67,75,865
Total Revenue 5,14,01,44,731 5,89,65,82,975
EXPENSES
Operating Cost 21 4,37,32,32,533 5,19,46,74,300
Employee Benefi ts Expense 22 28,29,50,985 26,45,79,970
Finance Costs 23 9,02,21,969 9,01,25,965
Depreciation and Amortization Expense 12 4,28,11,531 4,51,34,183
Other Expenses 24 24,02,58,735 22,21,45,729
Total Expenses 5,02,94,75,753 5,81,66,60,147
Profi t Before Tax 11,06,68,978 7,99,22,828
Tax Expense
Current Tax 3,26,00,000 2,42,00,000
Deferred Tax (42,96,916) (41,32,202)
( Excess ) / Short Provision of Income Tax for earlier years (13,75,782) (44,210)
Profi t for the year 8,37,41,676 5,98,99,240
Earning per Equity Share of face value of ` 10/- each
Basic ( in ` ) 25 5.46 3.94
Diluted ( in ` ) 25 4.98 3.94
Signifi cant Accounting Policies 1
Notes on Financial Statements 2 - 39
As per our report of even dateFor M S P & Co. For and on behalf of the Board,Chartered Accountants(Registration No. 107565W)
M. S. PARIKH AREEF A. PATEL P. S. G. NAIRPartner Executive Vice Chairman DirectorMembership No. 08684
Mumbai, NITIN B. AKOLKAR MAHESH FOGLADated : 27th May, 2016 Company Secretary Chief Financial Offi cer
56
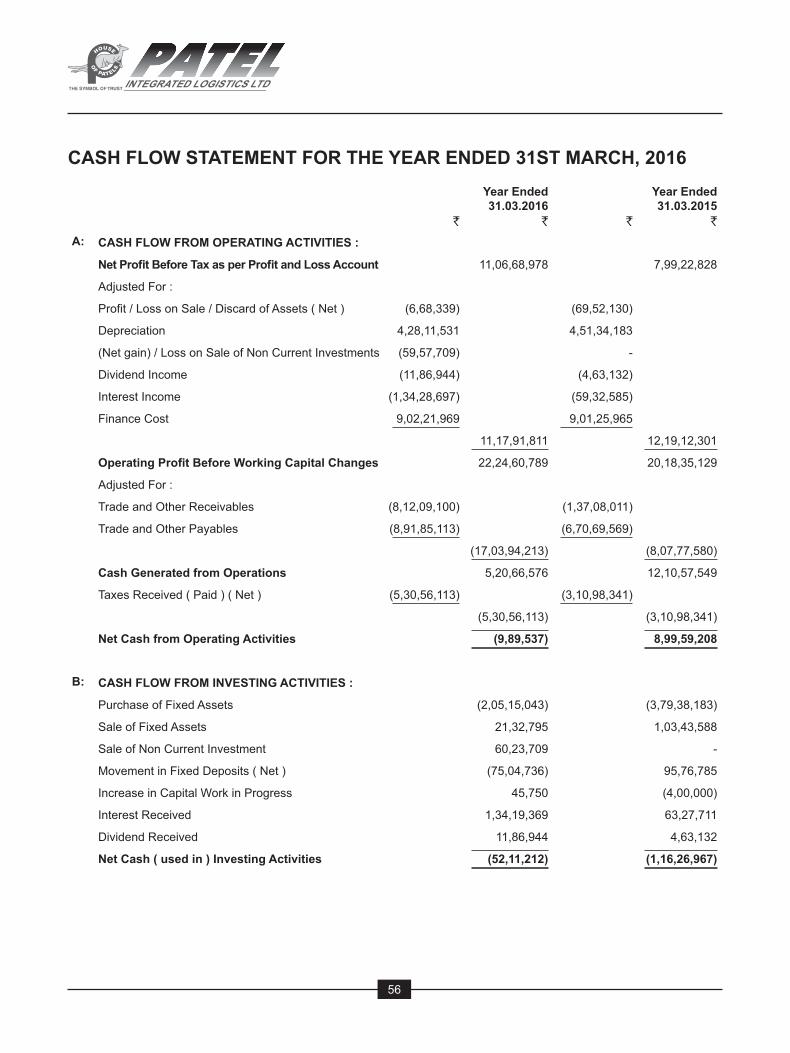
CASH FLOW STATEMENT FOR THE YEAR ENDED 31ST MARCH, 2016
`
Year Ended 31.03.2016
` `
Year Ended 31.03.2015
`A: CASH FLOW FROM OPERATING ACTIVITIES :
Net Profi t Before Tax as per Profi t and Loss Account 11,06,68,978 7,99,22,828
Adjusted For :
Profi t / Loss on Sale / Discard of Assets ( Net ) (6,68,339) (69,52,130)
Depreciation 4,28,11,531 4,51,34,183
(Net gain) / Loss on Sale of Non Current Investments (59,57,709) -
Dividend Income (11,86,944) (4,63,132)
Interest Income (1,34,28,697) (59,32,585)
Finance Cost 9,02,21,969 9,01,25,965
11,17,91,811 12,19,12,301
Operating Profi t Before Working Capital Changes 22,24,60,789 20,18,35,129
Adjusted For :
Trade and Other Receivables (8,12,09,100) (1,37,08,011)
Trade and Other Payables (8,91,85,113) (6,70,69,569)
(17,03,94,213) (8,07,77,580)
Cash Generated from Operations 5,20,66,576 12,10,57,549
Taxes Received ( Paid ) ( Net ) (5,30,56,113) (3,10,98,341)
(5,30,56,113) (3,10,98,341)
Net Cash from Operating Activities (9,89,537) 8,99,59,208
B: CASH FLOW FROM INVESTING ACTIVITIES :
Purchase of Fixed Assets (2,05,15,043) (3,79,38,183)
Sale of Fixed Assets 21,32,795 1,03,43,588
Sale of Non Current Investment 60,23,709 -
Movement in Fixed Deposits ( Net ) (75,04,736) 95,76,785
Increase in Capital Work in Progress 45,750 (4,00,000)
Interest Received 1,34,19,369 63,27,711
Dividend Received 11,86,944 4,63,132
Net Cash ( used in ) Investing Activities (52,11,212) (1,16,26,967)

57
54th Annual Report 2015-16
CASH FLOW STATEMENT FOR THE YEAR ENDED 31ST MARCH, 2016
`
Year Ended 31.03.2016
` `
Year Ended 31.03.2015
`C: CASH FLOW FROM FINANCING ACTIVITIES :
Proceeds from Public Deposits ( Net ) 2,32,80,000 36,70,000
Preceeds from Issue of Equity Shares 8,05,00,000 -
Preceeds from Issue of Share Warrants 2,67,08,750 -
Proceeds from Long Term Borrowings ( Net ) (88,01,418) (52,67,252)
Proceeds from Short Term Borrowings ( Net ) 11,57,44,429 2,38,27,723
Interest Paid (8,99,23,907) (8,84,87,617)
Dividend Paid (91,39,125) (88,83,796)
Net Cash ( used in ) / from Financing Activities 13,83,68,729 (7,51,40,942)
Net Increase/(Decrease) in Cash and Cash Equivalents 13,21,67,980 31,91,299
Opening Balance of Cash and Cash Equivalents 10,43,85,780 10,11,94,481
Closing Balance of Cash and Cash Equivalents 23,65,53,760 10,43,85,780
Note :1) Cash and Cash Equivalents do not include Fixed Deposits with Banks.2) Amount of ` 10,72,08,750/- received as preferential money is included in above Current Account Balance.3) Figures in bracket denote outfl ow of cash.4) The above Cash Flow Statement has been prepared under the “Indirect Method” set out in Accounting Standard (AS-3)
“Cash Flow Statement”.5) Previous year’s fi gures have been restated/recasted, wherever necessary, to confi rm to this year’s classifi cation.
As per our report of even dateFor M S P & Co. For and on behalf of the Board,Chartered Accountants(Registration No. 107565W)
M. S. PARIKH AREEF A. PATEL P. S. G. NAIRPartner Executive Vice Chairman DirectorMembership No. 08684
Mumbai, NITIN B. AKOLKAR MAHESH FOGLADated : 27th May, 2016 Company Secretary Chief Financial Offi cer

Key Financial Ratios of Patel Integrated Logistics Ltd.
Periods Mar-16 Mar-15 Mar-14 Mar-13 Mar-12 Mar-11 "------------------- in Rs. Cr. -------------------"
Per Share Ratios
Basic EPS (Rs.) 5.46 3.94 1.55 1.59 1.77 2.11 Diluted EPS (Rs.) 4.98 3.94 1.55 1.59 1.77 2.11 Cash EPS (Rs.) 7.97 6.92 4.5 4.84 4.58 4.68 Book Value [ExclRevalReserve]/Share (Rs.) 67.29 59.61 59.2 58.84 57.84 57.51
Book Value [InclRevalReserve]/Share (Rs.) 67.29 59.61 59.2 58.84 57.84 57.51
Dividend / Share(Rs.) 0.5 0.5 0.5 0.5 1.2 1 Revenue from Operations/Share (Rs.) 321.88 387.17 359.39 335.73 297.93 283.27
PBDIT/Share (Rs.) 15.34 14.23 11.02 11.83 10.98 10.77 PBIT/Share (Rs.) 12.65 11.26 8.06 8.59 8.17 8.2 PBT/Share (Rs.) 6.97 5.26 2.03 2.54 3.28 3.31 Net Profit/Share (Rs.) 5.27 3.94 1.55 1.59 1.77 2.11
Profitability Ratios
PBDIT Margin (%) 4.76 3.67 3.06 3.52 3.68 3.8 PBIT Margin (%) 3.92 2.9 2.24 2.55 2.74 2.89 PBT Margin (%) 2.16 1.35 0.56 0.75 1.1 1.16 Net Profit Margin (%) 1.63 1.01 0.43 0.47 0.59 0.74 Return on Networth / Equity (%) 7.83 6.61 2.61 2.7 3.05 3.66 Return on Capital Employed (%) 6.69 5.48 2.09 2.13 2.53 3.04 Return on Assets (%) 4.08 3.2 1.22 1.22 1.47 1.75 Total Debt/Equity (X) 0.5 0.47 0.44 0.48 0.45 0.42 Asset Turnover Ratio (%) 249.56 315.04 284.58 259.11 249.43 235.35

Liquidity Ratios
Current Ratio (X) 1.96 1.76 1.68 1.61 1.6 1.6 Quick Ratio (X) 1.96 1.76 1.68 1.61 1.6 1.6 Dividend Payout Ratio (NP) (%) 9.15 12.67 32.32 31.47 67.93 47.3 Dividend Payout Ratio (CP) (%) 6.05 7.22 11.1 10.33 26.2 21.31 Earnings Retention Ratio (%) 90.85 87.33 67.68 68.53 32.07 52.7 Cash Earnings Retention Ratio (%) 93.95 92.78 88.9 89.67 73.8 78.69
Valuation Ratios
Enterprise Value (Cr.) 169.28 209.16 47.87 52.16 57.04 53.06 EV/Net Operating Revenue (X) 0.33 0.36 0.09 0.1 0.13 0.12 EV/EBITDA (X) 6.95 9.68 2.86 2.9 3.42 3.26 MarketCap/Net Operating Revenue (X) 0.28 0.31 0.05 0.05 0.07 0.08
Retention Ratios (%) 90.84 87.32 67.67 68.52 32.06 52.69 Price/BV (X) 1.36 2.02 0.27 0.3 0.38 0.39 Price/Net Operating Revenue 0.28 0.31 0.05 0.05 0.07 0.08 Earnings Yield 0.06 0.03 0.1 0.09 0.08 0.09
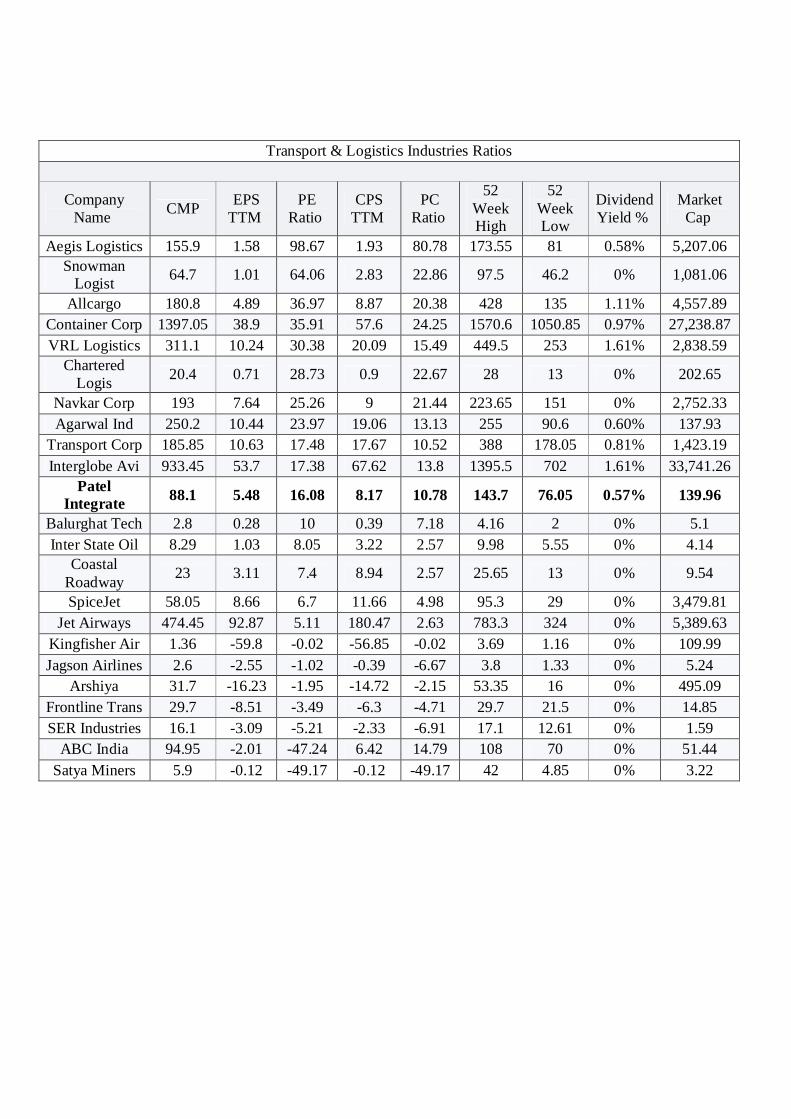
Transport & Logistics Industries Ratios
Company
Name
CMP EPS TTM
PE Ratio
CPS TTM
PC Ratio
52 Week High
52 Week Low
Dividend Yield %
Market Cap
Aegis Logistics 155.9 1.58 98.67 1.93 80.78 173.55 81 0.58% 5,207.06 Snowman
Logist
64.7 1.01 64.06 2.83 22.86 97.5 46.2 0% 1,081.06
Allcargo 180.8 4.89 36.97 8.87 20.38 428 135 1.11% 4,557.89 Container Corp 1397.05 38.9 35.91 57.6 24.25 1570.6 1050.85 0.97% 27,238.87 VRL Logistics 311.1 10.24 30.38 20.09 15.49 449.5 253 1.61% 2,838.59
Chartered Logis
20.4 0.71 28.73 0.9 22.67 28 13 0% 202.65
Navkar Corp 193 7.64 25.26 9 21.44 223.65 151 0% 2,752.33 Agarwal Ind 250.2 10.44 23.97 19.06 13.13 255 90.6 0.60% 137.93
Transport Corp 185.85 10.63 17.48 17.67 10.52 388 178.05 0.81% 1,423.19 Interglobe Avi 933.45 53.7 17.38 67.62 13.8 1395.5 702 1.61% 33,741.26
Patel Integrate
88.1 5.48 16.08 8.17 10.78 143.7 76.05 0.57% 139.96
Balurghat Tech 2.8 0.28 10 0.39 7.18 4.16 2 0% 5.1 Inter State Oil 8.29 1.03 8.05 3.22 2.57 9.98 5.55 0% 4.14
Coastal Roadway
23 3.11 7.4 8.94 2.57 25.65 13 0% 9.54
SpiceJet 58.05 8.66 6.7 11.66 4.98 95.3 29 0% 3,479.81 Jet Airways 474.45 92.87 5.11 180.47 2.63 783.3 324 0% 5,389.63
Kingfisher Air 1.36 -59.8 -0.02 -56.85 -0.02 3.69 1.16 0% 109.99 Jagson Airlines 2.6 -2.55 -1.02 -0.39 -6.67 3.8 1.33 0% 5.24
Arshiya 31.7 -16.23 -1.95 -14.72 -2.15 53.35 16 0% 495.09 Frontline Trans 29.7 -8.51 -3.49 -6.3 -4.71 29.7 21.5 0% 14.85 SER Industries 16.1 -3.09 -5.21 -2.33 -6.91 17.1 12.61 0% 1.59
ABC India 94.95 -2.01 -47.24 6.42 14.79 108 70 0% 51.44 Satya Miners 5.9 -0.12 -49.17 -0.12 -49.17 42 4.85 0% 3.22

Analysis of Data
Current Ratios
Interpretation:
As a rule, the current ratio with 2:1 (or) more is considered as not so satisfactory position of the firm. When
compared with 2011, we can see that firm is increasing their performance and their ratios in 2016 is 1.96
which is almost near to 2
Quick Ratios
Interpretation:
Quick assets are those assets which can be converted into cash within a short period of time, say to six
months. So, here the sundry debtors which are with the long period does not include in the quick assets.
Compare with 2011, as well as industry standard it is very good sign as company constantly showing
good quick ratio.
Proprietary Ratio
Interpretation:
The proprietary ratio establishes the relationship between shareholders funds to total assets. It
determines the long-term solvency of the firm. This ratio indicates the extent to which the assets of the
company can be lost without affecting the interest of the company. There is no increase in the capital
from the year 2011. The shareholder’s funds include capital and reserves and surplus. The reserves and
surplus is increased due to the increase in balance in profit and loss account, which is caused by the
increase of income from services. Total assets, includes fixed and current assets.
Working Capital Turnover Ratio
Interpretation:
Income from services is greatly increased due to the extra invoice for Operations & Maintenance fee and
the working capital is also increased greater due to the increase in from services because the huge
increase in current assets. The income from services is raised and the current assets are also raised
together resulted in the decrease of the ratio of 2016 compared with 2015.
Fixed Assets Turnover Ratio
Interpretation:
Fixed assets are used in the business for producing the goods to be sold. This ratio shows the firm’s
ability in generating sales from all financial resources committed to total assets. The ratio indicates the
account of one rupee investment in fixed assets. The income from services is greatly increased in the
current year due to the increase in the Operations & Maintenance fee due to the increase in extra invoice
and the net fixed assets are reduced because of the increased charge of depreciation. Finally, that
affected a huge increase in the ratio compared with the previous year’s ratio.
Capital Turnover Ratio
Interpretation:
This is another ratio to judge the efficiency and effectiveness of the company like profitability ratio. The
income from services is greatly increased compared with the previous year and the total capital
employed includes capital and reserves & surplus. Due to increase in the net profit the capital employed
is also increased along with income from services. Both are affected in the increment of the ratio of
current year.

Net Profit Ratio
Interpretation:
The net profit ratio is the overall measure of the firm’s ability to turn each rupee of income from
services in net profit. If the net margin is in adequate the firm will fail to achieve return on shareholder’s
funds. High net profit ratio will help the firm service in the fall of income from services, rise in cost of
production or declining demand. The net profit is increased because the income from services is
increased. The increment resulted in a significant increase in 2015 ratio compared with the year 2016.
Operating Ratio
Interpretation:
The operating profit ratio is used to measure the relationship between net profits and sales of a firm.
Depending on the concept, it will decide. The operating profit ratio is increased compared with the last
year. The earnings are increased due to the increase in the income from services fee. So, the ratio is
increased slightly compared with the previous year.
Return on Total Assets Ratio
Interpretation:
This is the ratio between net profit and total assets. The ratio indicates the return on total assets in the
form of profits. The net profit is increased in the current year because of the increment in the income
from services. The fixed assets are reduced due to the charge of depreciation and no major increments in
fixed assets but the current assets are increased because of sundry debtors and that effects in increase in
the ratio compared with the last year i.e. 2015.

Earnings Per Share
Interpretation:
Earnings per share ratio are used to find out the return that the shareholder’s earn from their shares.
After charging depreciation and after payment of tax, the remaining amount will be distributed by all
theshareholders.Net profit after tax is increased due to the huge increase in the income from services.
That is the amount which is available to the shareholders to take. There are 1.589 Cr. shares of Rs.10/-
each. The share capital is constant from the year 2016. Due to the huge increase in net profit the
earnings per share is greatly increased in 2016.
P/E Ratio
Interpretation:
The ratio is calculated to make an estimate of application in the value of share of a company. The market
price per share is increased due to the increase in the reserves & surplus. The earnings per share are also
increased greatly compared with the last year because of increase in the net profit.

Summary
Although they may seem intimidating at first glance, all of the aforementioned financial ratios
can be derived by simply comparing numbers that appear on a small business's income statement
and balance sheet. Small business owners would be well-served by familiarizing themselves with
ratios and their uses as a tracking device for anticipating changes in operations.
Financial ratios can be an important tool for small business owners and managers to measure
their progress toward reaching company goals, as well as toward competing with larger
companies. Ratio analysis, when performed regularly over time, can also help small businesses
recognize and adapt to trends affecting their operations. Yet another reason small business
owners need to understand financial ratios is that they provide one of the main measures of a
company's success from the perspective of bankers, investors, and business analysts. Often, a
small business's ability to obtain debt or equity financing will depend on the company's financial
ratios.
Despite all the positive uses of financial ratios, however, small business managers are still
encouraged to know the limitations of ratios and approach ratio analysis with a degree of caution.
Ratios alone do not make give one all the information necessary for decision making. But
decisions made without a look at financial ratios, the decision is being made without all the
available data.

Bibliography
M.Com Study Materials
ICAI Study Materials
www.Moneycontrol.com
Casteuble, Tracy. "Using Financial Ratios to Assess Performance." Association
Management. July 1997.
Clark, Scott. "Financial Ratios Hold the Key to Smart Business." Birmingham Business
Journal. 11 February 2000.
Clark, Scott. "You Can Read the Tea Leaves of Financial Ratios." Birmingham Business
Journal. 25 February 2000.
Gil-Lafuente, Anna Maria. Fuzzy Logic In Financial Analysis. Springer, 2005.
Hey-Cunningham, David. Financial Statements Demystified. Allen & Unwin, 2002.
Taulli, Tom. The Edgar Online Guide to Decoding Financial Statements. J. Ross
Publishing, 2004.