reebok mock presentation & analysis tools presented by investment club officers
Post on 20-Dec-2015
219 views
TRANSCRIPT

ReebokReebok
Mock PresentationMock Presentation
&&
Analysis ToolsAnalysis Tools
Presented by Presented by
Investment Club OfficersInvestment Club Officers

OverviewOverview
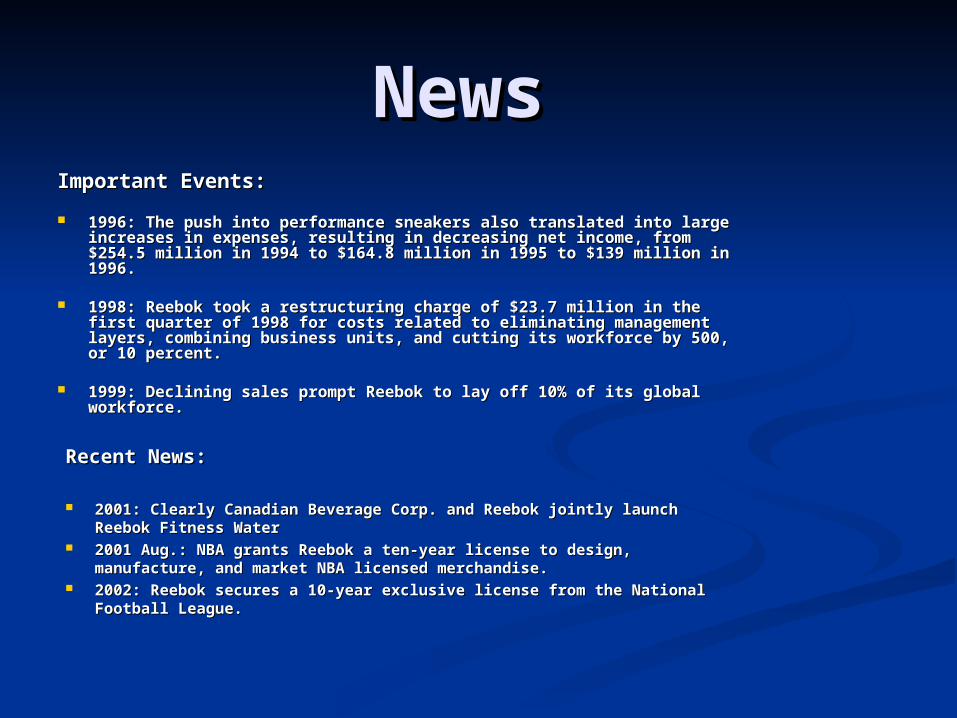
NewsNewsImportant Events:Important Events:
1996: The push into performance sneakers also translated into large 1996: The push into performance sneakers also translated into large increases in expenses, resulting in decreasing net income, from increases in expenses, resulting in decreasing net income, from $254.5 million in 1994 to $164.8 million in 1995 to $139 million in $254.5 million in 1994 to $164.8 million in 1995 to $139 million in 1996.1996.
1998: Reebok took a restructuring charge of $23.7 million in the 1998: Reebok took a restructuring charge of $23.7 million in the first quarter of 1998 for costs related to eliminating management first quarter of 1998 for costs related to eliminating management layers, combining business units, and cutting its workforce by 500, layers, combining business units, and cutting its workforce by 500, or 10 percent. or 10 percent.
1999: Declining sales prompt Reebok to lay off 10% of its global 1999: Declining sales prompt Reebok to lay off 10% of its global workforce. workforce.
Recent News:Recent News:
2001: Clearly Canadian Beverage Corp. and Reebok jointly launch 2001: Clearly Canadian Beverage Corp. and Reebok jointly launch Reebok Fitness Water Reebok Fitness Water
2001 Aug.: NBA grants Reebok a ten-year license to design, 2001 Aug.: NBA grants Reebok a ten-year license to design, manufacture, and market NBA licensed merchandise.manufacture, and market NBA licensed merchandise.
2002: Reebok secures a 10-year exclusive license from the National 2002: Reebok secures a 10-year exclusive license from the National Football League.Football League.
Du Pont Du Pont AnalysisAnalysis
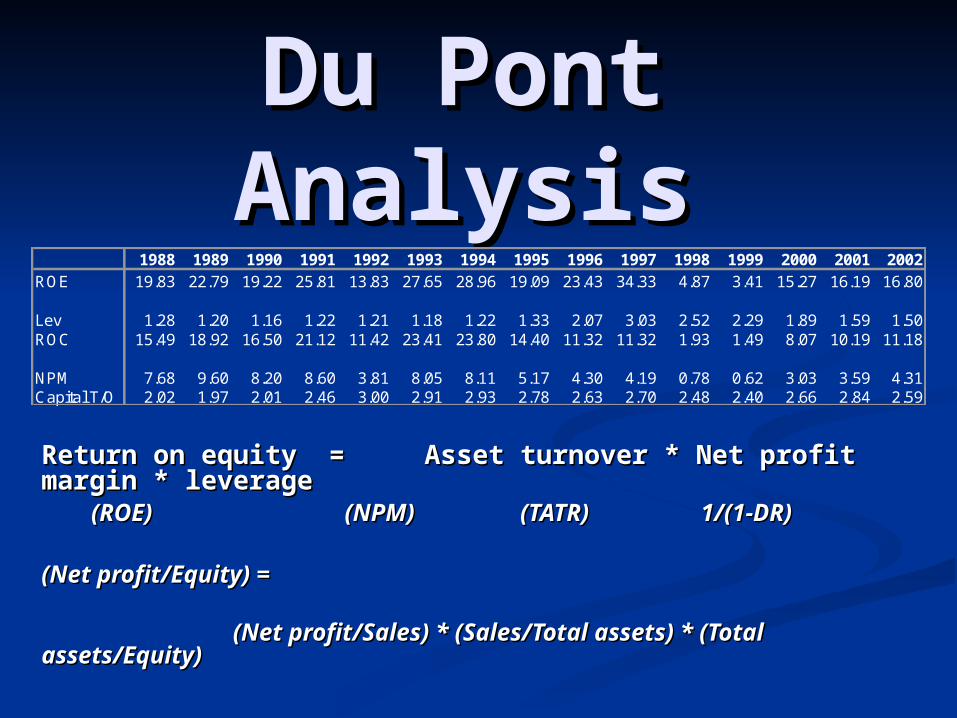
1988 1989 1990 1991 1992 1993 1994 1995 1996 1997 1998 1999 2000 2001 2002ROE 19.83 22.79 19.22 25.81 13.83 27.65 28.96 19.09 23.43 34.33 4.87 3.41 15.27 16.19 16.80
Lev 1.28 1.20 1.16 1.22 1.21 1.18 1.22 1.33 2.07 3.03 2.52 2.29 1.89 1.59 1.50ROC 15.49 18.92 16.50 21.12 11.42 23.41 23.80 14.40 11.32 11.32 1.93 1.49 8.07 10.19 11.18
NPM 7.68 9.60 8.20 8.60 3.81 8.05 8.11 5.17 4.30 4.19 0.78 0.62 3.03 3.59 4.31Capital T/O 2.02 1.97 2.01 2.46 3.00 2.91 2.93 2.78 2.63 2.70 2.48 2.40 2.66 2.84 2.59
Return on equity = Return on equity = Asset turnover * Net profit Asset turnover * Net profit margin * leveragemargin * leverage (ROE) (ROE) (NPM) (NPM) (TATR) (TATR) 1/(1-DR) 1/(1-DR)
(Net profit/Equity) = (Net profit/Equity) =
(Net profit/Sales) * (Sales/Total assets) * (Total (Net profit/Sales) * (Sales/Total assets) * (Total assets/Equity) assets/Equity)

Key RatiosKey Ratios1988 1989 1990 1991 1992 1993 1994 1995 1996 1997 1998 1999 2000 2001 2002
LiquidityCurrent 2.79 3.88 3.50 2.42 2.75 2.84 2.65 3.09 2.84 2.53 2.22 1.99 2.51 2.88 2.78
ActivityAv Coll Prd 56.48 56.61 57.50 54.49 50.91 55.22 55.08 54.47 57.58 57.75 61.11 58.86 53.58 49.22 46.98Inv T/O 3.70 3.71 3.99 4.08 4.13 3.57 3.40 3.30 3.56 4.05 3.70 3.74 4.29 4.91 5.05
SolvencyX Int Earnd 11.45 20.33 15.75 14.45 13.90 15.88 27.19 12.16 6.56 3.53 1.61 1.56 7.14 9.84 14.45

Key Index Key Index TrendsTrends
100
120
140
160
180
200
220
240
1988 1989 1990 1991 1992 1993 1994 1995 1996 1997 1998 1999 2000 2001 2002
Sales
Gross Pft
Income Statement:Income Statement:

Key Index Key Index TrendsTrendsBalance Sheet:Balance Sheet:
0
100
200
300
400
500
600
700
800
900
1000
1988 1989 1990 1991 1992 1993 1994 1995 1996 1997 1998 1999 2000 2001 2002
Excess Cash
Working Cap
L.T. Debt
EV/EBITDAEV/EBITDA
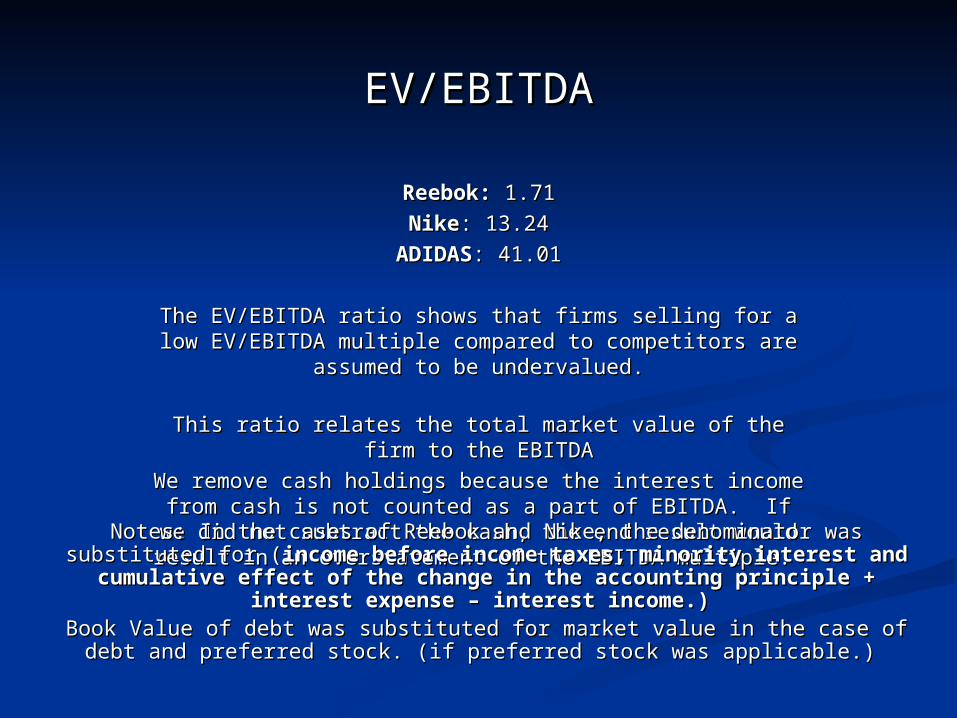
Reebok:Reebok: 1.71 1.71
NikeNike: 13.24: 13.24
ADIDASADIDAS: 41.01: 41.01
The EV/EBITDA ratio shows that firms selling for a low The EV/EBITDA ratio shows that firms selling for a low EV/EBITDA multiple compared to competitors are assumed EV/EBITDA multiple compared to competitors are assumed
to be undervalued.to be undervalued.
This ratio relates the total market value of the firm to the This ratio relates the total market value of the firm to the EBITDAEBITDA
We remove cash holdings because the interest income from We remove cash holdings because the interest income from cash is not counted as a part of EBITDA. If we did not cash is not counted as a part of EBITDA. If we did not
subtract the cash, the end result would result in an subtract the cash, the end result would result in an overstatement of the EBITDA multiple. overstatement of the EBITDA multiple.
Notes: In the cases of Reebok and Nike, the denominator was substituted for Notes: In the cases of Reebok and Nike, the denominator was substituted for ((income before income taxes, minority interest and cumulative effect income before income taxes, minority interest and cumulative effect
of the change in the accounting principle + interest expense – interest of the change in the accounting principle + interest expense – interest income.) income.)
Book Value of debt was substituted for market value in the case of debt and Book Value of debt was substituted for market value in the case of debt and preferred stock. (if preferred stock was applicable.) preferred stock. (if preferred stock was applicable.)
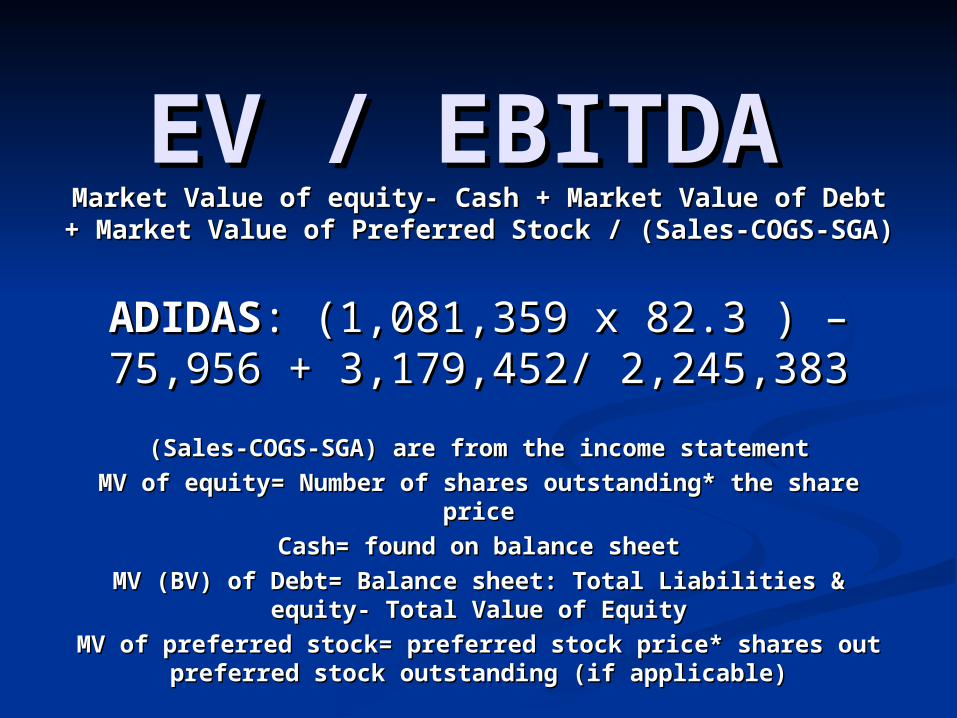
EV / EBITDAEV / EBITDAMarket Value of equity- Cash + Market Value of Debt + Market Value of equity- Cash + Market Value of Debt +
Market Value of Preferred Stock / (Sales-COGS-SGA)Market Value of Preferred Stock / (Sales-COGS-SGA)
ADIDASADIDAS: (1,081,359 x 82.3 ) – 75,956 : (1,081,359 x 82.3 ) – 75,956 + 3,179,452/ 2,245,383+ 3,179,452/ 2,245,383
(Sales-COGS-SGA) are from the income statement(Sales-COGS-SGA) are from the income statement
MV of equity= Number of shares outstanding* the share priceMV of equity= Number of shares outstanding* the share price
Cash= found on balance sheetCash= found on balance sheet
MV (BV) of Debt= Balance sheet: Total Liabilities & equity- MV (BV) of Debt= Balance sheet: Total Liabilities & equity- Total Value of EquityTotal Value of Equity
MV of preferred stock= preferred stock price* shares out MV of preferred stock= preferred stock price* shares out preferred stock outstanding (if applicable)preferred stock outstanding (if applicable)

ConclusionConclusion
Buy More!Buy More!

Any Any Questions?Questions?

Analytical Analytical ToolsTools
Du Pont AnalysisDu Pont Analysis
Index AnalysisIndex Analysis
Common Size AnalysisCommon Size Analysis
EV / EBITDAEV / EBITDA

Reebok Balance Sheet($ millions, except share data)
1988 1989 1990 1991 1992 1993 1994 1995 1996 1997 1998 1999 2000 2001 2002Inv 302 276 367 436 434 514 625 635 545 564 535 415 394 363 400Accs Rec 276 289 391 425 418 457 532 507 591 562 518 417 424 383 422Other 36 47 44 80 103 76 96 111 105 130 129 129 139 135 150Cash 99 172 227 86 105 79 84 80 222 209 180 282 269 413 642Total C.A. 714 784 1,030 1,027 1,060 1,127 1,337 1,333 1,463 1,465 1,362 1,243 1,225 1,295 1,614
PPE 74 106 111 146 127 131 165 192 185 157 173 178 142 134 135Goodwill 1 0 0 0 0 0 0 0 0 0 0 0 0 31 23Intangibles 265 261 255 245 103 94 96 64 70 66 69 69 64 45 44Other F.A. 11 15 7 12 55 40 51 62 68 68 137 74 32 38 45Total F.A. 351 382 374 403 285 265 312 319 323 291 378 321 238 248 247
Total Ass 1,064 1,166 1,403 1,430 1,345 1,392 1,649 1,652 1,786 1,756 1,740 1,564 1,463 1,543 1,861
S.T. Debt 76 2 70 40 8 27 69 68 85 162 135 213 23 19 19Accs Pay 137 148 166 308 281 138 171 166 196 192 203 154 172 127 166Other 43 52 58 76 96 231 266 198 235 224 274 257 293 303 395Total C.L. 256 202 294 424 385 396 506 432 516 578 612 624 488 449 580
L.T. Debt 113 110 106 170 116 134 132 254 854 639 554 370 345 351 353Other 5 9 7 12 5 15 22 70 34 32 49 41 22 23 43Total L.T. 118 119 113 182 121 149 153 324 888 671 603 411 367 374 396
Com Eqty 691 845 997 824 839 847 991 895 382 507 524 529 608 720 885
Total L&E 1,064 1,166 1,403 1,430 1,345 1,392 1,649 1,652 1,786 1,756 1,740 1,564 1,463 1,543 1,861
Shares ('000)(Bolded figures are weighted averages) # Shares 113,767 114,176 114,654 97,216 90,742 86,462 82,228 78,317 67,370 56,162 56,394 56,065 56,852 58,551 59,478Diluted # Sh.… … … 98,958 92,697 88,348 84,311 79,487 68,617 58,309 57,029 56,530 57,724 65,495 68,013
Source: SEC, Mergent Online
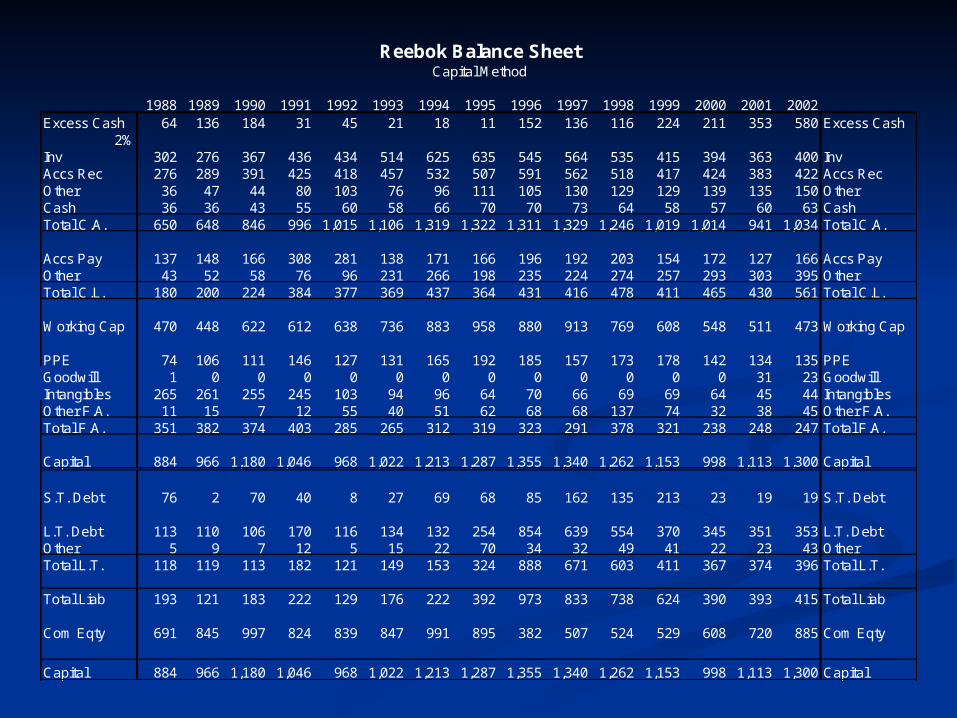
Reebok Balance SheetCapital Method
1988 1989 1990 1991 1992 1993 1994 1995 1996 1997 1998 1999 2000 2001 2002Excess Cash 64 136 184 31 45 21 18 11 152 136 116 224 211 353 580 Excess Cash
2%Inv 302 276 367 436 434 514 625 635 545 564 535 415 394 363 400 InvAccs Rec 276 289 391 425 418 457 532 507 591 562 518 417 424 383 422 Accs RecOther 36 47 44 80 103 76 96 111 105 130 129 129 139 135 150 OtherCash 36 36 43 55 60 58 66 70 70 73 64 58 57 60 63 CashTotal C.A. 650 648 846 996 1,015 1,106 1,319 1,322 1,311 1,329 1,246 1,019 1,014 941 1,034 Total C.A.
Accs Pay 137 148 166 308 281 138 171 166 196 192 203 154 172 127 166 Accs PayOther 43 52 58 76 96 231 266 198 235 224 274 257 293 303 395 OtherTotal C.L. 180 200 224 384 377 369 437 364 431 416 478 411 465 430 561 Total C.L.
Working Cap 470 448 622 612 638 736 883 958 880 913 769 608 548 511 473 Working Cap
PPE 74 106 111 146 127 131 165 192 185 157 173 178 142 134 135 PPEGoodwill 1 0 0 0 0 0 0 0 0 0 0 0 0 31 23 GoodwillIntangibles 265 261 255 245 103 94 96 64 70 66 69 69 64 45 44 IntangiblesOther F.A. 11 15 7 12 55 40 51 62 68 68 137 74 32 38 45 Other F.A.Total F.A. 351 382 374 403 285 265 312 319 323 291 378 321 238 248 247 Total F.A.
Capital 884 966 1,180 1,046 968 1,022 1,213 1,287 1,355 1,340 1,262 1,153 998 1,113 1,300 Capital
S.T. Debt 76 2 70 40 8 27 69 68 85 162 135 213 23 19 19 S.T. Debt
L.T. Debt 113 110 106 170 116 134 132 254 854 639 554 370 345 351 353 L.T. DebtOther 5 9 7 12 5 15 22 70 34 32 49 41 22 23 43 OtherTotal L.T. 118 119 113 182 121 149 153 324 888 671 603 411 367 374 396 Total L.T.
Total Liab 193 121 183 222 129 176 222 392 973 833 738 624 390 393 415 Total Liab
Com Eqty 691 845 997 824 839 847 991 895 382 507 524 529 608 720 885 Com Eqty
Capital 884 966 1,180 1,046 968 1,022 1,213 1,287 1,355 1,340 1,262 1,153 998 1,113 1,300 Capital

Reebok Income Stmt($ millions, except per share data)
1988 1989 1990 1991 1992 1993 1994 1995 1996 1997 1998 1999 2000 2001 2002Sales 1,785 1,822 2,159 2,734 3,022 2,893 3,280 3,481 3,479 3,644 3,225 2,900 2,865 2,993 3,128COS 1,118 1,072 1,282 1,638 1,798 1,694 1,933 2,079 2,101 2,247 2,034 1,776 1,733 1,858 1,926Gross Pft 667 750 877 1,096 1,224 1,199 1,347 1,402 1,378 1,397 1,191 1,124 1,132 1,135 1,202SG&A 410 453 556 666 807 769 889 999 1,066 1,069 1,043 972 915 914 955Dep 9 15 21 23 28 35 36 38 43 47 3 5 46 37 32Op Inc 248 282 300 407 389 395 422 365 269 281 144 147 170 184 215Int 22 15 20 29 20 25 16 25 42 65 61 50 22 18 15Non-op Inc 4 23 15 12 -111 2 13 -61 7 -51 -46 -69 -12 -11 -6Tax Inc 230 290 295 390 258 372 419 279 234 165 37 28 136 156 195Taxes 93 115 118 155 143 139 153 99 84 12 12 10 49 48 61Net Inc 137 175 177 235 115 233 266 180 150 153 25 18 87 108 135
EPS 1.20 1.53 1.54 2.37 1.24 2.53 3.09 2.10 2.06 2.41 0.42 0.2 1.42 1.75 2.12Dil. EPS … … … … 1.23 2.53 3.02 2.07 2.03 2.32 0.42 0.20 1.40 1.66 1.97Div. PS 0.30 0.30 0.30 0.30 0.30 0.30 0.30 0.30 0.23 0.00 0.00 0.00 0.00 0.00 0.00
Source: SEC, Mergent Online

Du Pont Du Pont AnalysisAnalysis
1988 1989 1990 1991 1992 1993 1994 1995 1996 1997 1998 1999 2000 2001 2002ROE 19.83 22.79 19.22 25.81 13.83 27.65 28.96 19.09 23.43 34.33 4.87 3.41 15.27 16.19 16.80
Lev 1.28 1.20 1.16 1.22 1.21 1.18 1.22 1.33 2.07 3.03 2.52 2.29 1.89 1.59 1.50ROC 15.49 18.92 16.50 21.12 11.42 23.41 23.80 14.40 11.32 11.32 1.93 1.49 8.07 10.19 11.18
NPM 7.68 9.60 8.20 8.60 3.81 8.05 8.11 5.17 4.30 4.19 0.78 0.62 3.03 3.59 4.31Capital T/O 2.02 1.97 2.01 2.46 3.00 2.91 2.93 2.78 2.63 2.70 2.48 2.40 2.66 2.84 2.59
Return on equity = Return on equity = Asset turnover * Net profit Asset turnover * Net profit margin * leveragemargin * leverage (ROE) (ROE) (NPM) (NPM) (TATR) (TATR) 1/(1-DR) 1/(1-DR)
(Net profit/Equity) = (Net profit/Equity) =
(Net profit/Sales) * (Sales/Total assets) * (Total (Net profit/Sales) * (Sales/Total assets) * (Total assets/Equity) assets/Equity)

Reebok Balance Sheet: Index Analysis
1988 1989 1990 1991 1992 1993 1994 1995 1996 1997 1998 1999 2000 2001 2002Excess Cash 100 213 289 49 70 34 29 17 239 214 182 352 332 555 911 Excess Cash
Inv 100 91 122 144 144 170 207 210 181 187 177 137 130 120 132 InvAccs Rec 100 105 142 154 151 166 193 183 214 203 187 151 153 139 153 Accs RecOther 100 130 122 221 285 211 266 306 290 359 356 357 384 373 414 OtherCash 100 102 121 153 169 162 184 195 195 204 181 162 161 168 175 CashTotal C.A. 100 100 130 153 156 170 203 203 202 204 192 157 156 145 159 Total C.A.
Accs Pay 100 108 121 225 205 101 124 121 143 140 148 112 125 93 121 Accs PayOther 100 121 134 176 223 536 617 460 545 519 636 596 680 703 915 OtherTotal C.L. 100 111 124 213 209 205 242 202 239 231 265 228 258 239 311 Total C.L.
Working Cap 100 95 132 130 136 157 188 204 187 194 164 129 117 109 101 Working Cap
PPE 100 143 150 197 171 176 222 259 250 212 233 240 191 181 182 PPEGoodwill 100 0 0 0 0 0 0 0 0 0 0 0 0 3129 2343 GoodwillIntangibles 100 99 96 93 39 36 36 24 26 25 26 26 24 17 17 IntangiblesOther F.A. 100 131 66 107 494 356 457 559 613 612 1226 665 285 340 405 Other F.A.Total F.A. 100 109 106 115 81 75 89 91 92 83 108 92 68 71 70 Total F.A.
Capital 100 109 133 118 109 116 137 146 153 152 143 130 113 126 147 Capital
S.T. Debt 100 3 93 53 11 36 91 89 112 214 178 281 30 25 25 S.T. Debt
L.T. Debt 100 98 94 151 103 119 117 226 758 567 492 329 306 312 314 L.T. DebtOther 100 180 139 240 100 291 431 1404 680 640 971 822 441 452 859 OtherTotal L.T. 100 101 96 155 103 126 130 276 755 570 512 350 312 318 337 Total L.T.
Total Liab 100 63 95 115 67 91 115 203 503 431 382 323 202 203 215 Total Liab
Com Eqty 100 122 144 119 121 123 143 130 55 73 76 77 88 104 128 Com Eqty
Capital 100 109 133 118 110 116 137 146 153 152 143 130 113 126 147 Capital
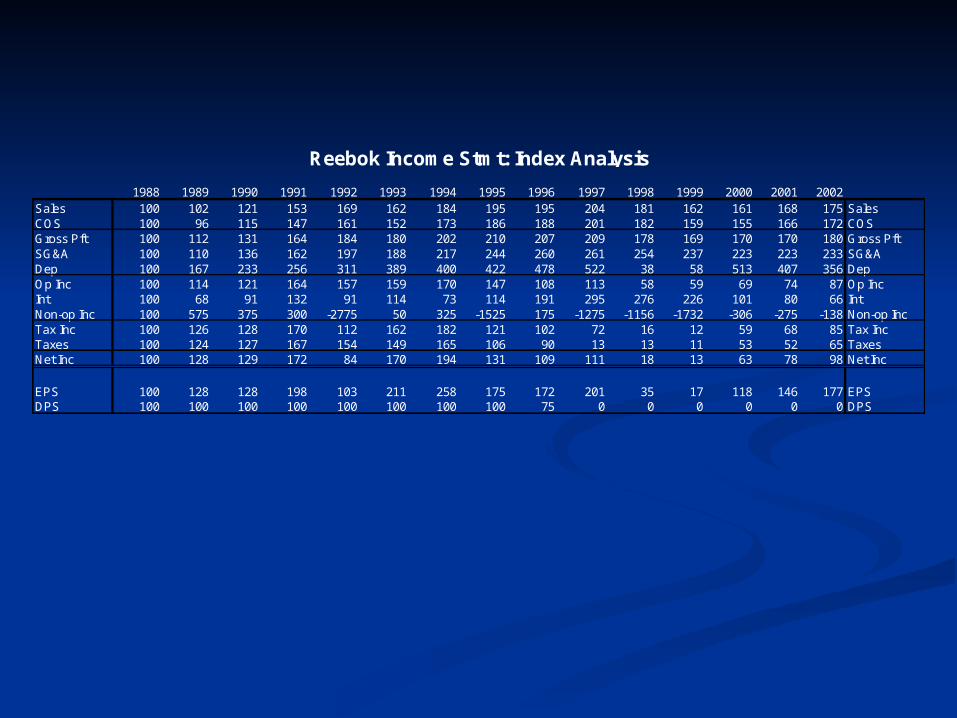
Reebok Income Stmt: Index Analysis
1988 1989 1990 1991 1992 1993 1994 1995 1996 1997 1998 1999 2000 2001 2002Sales 100 102 121 153 169 162 184 195 195 204 181 162 161 168 175 SalesCOS 100 96 115 147 161 152 173 186 188 201 182 159 155 166 172 COSGross Pft 100 112 131 164 184 180 202 210 207 209 178 169 170 170 180 Gross PftSG&A 100 110 136 162 197 188 217 244 260 261 254 237 223 223 233 SG&ADep 100 167 233 256 311 389 400 422 478 522 38 58 513 407 356 DepOp Inc 100 114 121 164 157 159 170 147 108 113 58 59 69 74 87 Op IncInt 100 68 91 132 91 114 73 114 191 295 276 226 101 80 66 IntNon-op Inc 100 575 375 300 -2775 50 325 -1525 175 -1275 -1156 -1732 -306 -275 -138 Non-op IncTax Inc 100 126 128 170 112 162 182 121 102 72 16 12 59 68 85 Tax IncTaxes 100 124 127 167 154 149 165 106 90 13 13 11 53 52 65 TaxesNet Inc 100 128 129 172 84 170 194 131 109 111 18 13 63 78 98 Net Inc
EPS 100 128 128 198 103 211 258 175 172 201 35 17 118 146 177 EPSDPS 100 100 100 100 100 100 100 100 75 0 0 0 0 0 0 DPS

Reebok Balance Sheet: Common Size Analysis
1988 1989 1990 1991 1992 1993 1994 1995 1996 1997 1998 1999 2000 2001 2002Excess Cash 7 14 16 3 5 2 2 1 11 10 9 19 21 32 45 Excess Cash
Inv 34 29 31 42 45 50 51 49 40 42 42 36 39 33 31 InvAccs Rec 31 30 33 41 43 45 44 39 44 42 41 36 42 34 32 Accs RecOther 4 5 4 8 11 7 8 9 8 10 10 11 14 12 12 OtherCash 4 4 4 5 6 6 5 5 5 5 5 5 6 5 5 CashTotal C.A. 74 67 72 95 105 108 109 103 97 99 99 88 102 85 80 Total C.A.
Accs Pay 16 15 14 29 29 14 14 13 14 14 16 13 17 11 13 Accs PayOther 5 5 5 7 10 23 22 15 17 17 22 22 29 27 30 OtherTotal C.L. 20 21 19 37 39 36 36 28 32 31 38 36 47 39 43 Total C.L.
Working Cap 53 46 53 58 66 72 73 74 65 68 61 53 55 46 36 Working Cap
PPE 8 11 9 14 13 13 14 15 14 12 14 15 14 12 10 PPEGoodwill 0 0 0 0 0 0 0 0 0 0 0 0 0 3 2 GoodwillIntangibles 30 27 22 23 11 9 8 5 5 5 5 6 6 4 3 IntangiblesOther F.A. 1 2 1 1 6 4 4 5 5 5 11 6 3 3 3 Other F.A.Total F.A. 40 40 32 39 29 26 26 25 24 22 30 28 24 22 19 Total F.A.
Capital 100 100 100 100 100 100 100 100 100 100 100 100 100 100 100 Capital
S.T. Debt 9 0 6 4 1 3 6 5 6 12 11 18 2 2 1 S.T. Debt
L.T. Debt 13 11 9 16 12 13 11 20 63 48 44 32 35 32 27 L.T. DebtOther 1 1 1 1 1 1 2 5 3 2 4 4 2 2 3 OtherTotal L.T. 13 12 10 17 13 15 13 25 66 50 48 36 37 34 30 Total L.T.
Total Liab 22 13 15 21 13 17 18 30 72 62 58 54 39 35 32 Total Liab
Com Eqty 78 87 85 79 87 83 82 70 28 38 42 46 61 65 68 Com Eqty
Capital 100 100 100 100 100 100 100 100 100 100 100 100 100 100 100 Capital

Reebok Income Stmt: Common Size Analysis
1988 1989 1990 1991 1992 1993 1994 1995 1996 1997 1998 1999 2000 2001 2002Sales 100.0 100.0 100.0 100.0 100.0 100.0 100.0 100.0 100.0 100.0 100.0 100.0 100.0 100.0 100.0COS 62.6 58.8 59.4 59.9 59.5 58.6 58.9 59.7 60.4 61.7 63.1 61.2 60.5 62.1 61.6Gross Pft 37.4 41.2 40.6 40.1 40.5 41.4 41.1 40.3 39.6 38.3 36.9 38.8 39.5 37.9 38.4SG&A 23.0 24.9 25.8 24.4 26.7 26.6 27.1 28.7 30.6 29.3 32.4 33.5 31.9 30.5 30.5Dep 0.5 0.8 1.0 0.8 0.9 1.2 1.1 1.1 1.2 1.3 0.1 0.2 1.6 1.2 1.0Op Inc 13.9 15.5 13.9 14.9 12.9 13.7 12.9 10.5 7.7 7.7 4.5 5.1 5.9 6.2 6.9Int 1.2 0.8 0.9 1.1 0.7 0.9 0.5 0.7 1.2 1.8 1.9 1.7 0.8 0.6 0.5Non-op Inc 0.2 1.3 0.7 0.4 -3.7 0.1 0.4 -1.8 0.2 -1.4 -1.4 -2.4 -0.4 -0.4 -0.2Tax Inc 12.9 15.9 13.7 14.3 8.5 12.9 12.8 8.0 6.7 4.5 1.1 1.0 4.7 5.2 6.2Taxes 5.2 6.3 5.5 5.7 4.7 4.8 4.7 2.8 2.4 0.3 0.4 0.3 1.7 1.6 1.9Net Inc 7.7 9.6 8.2 8.6 3.8 8.1 8.1 5.2 4.3 4.2 0.8 0.6 3.0 3.6 4.3
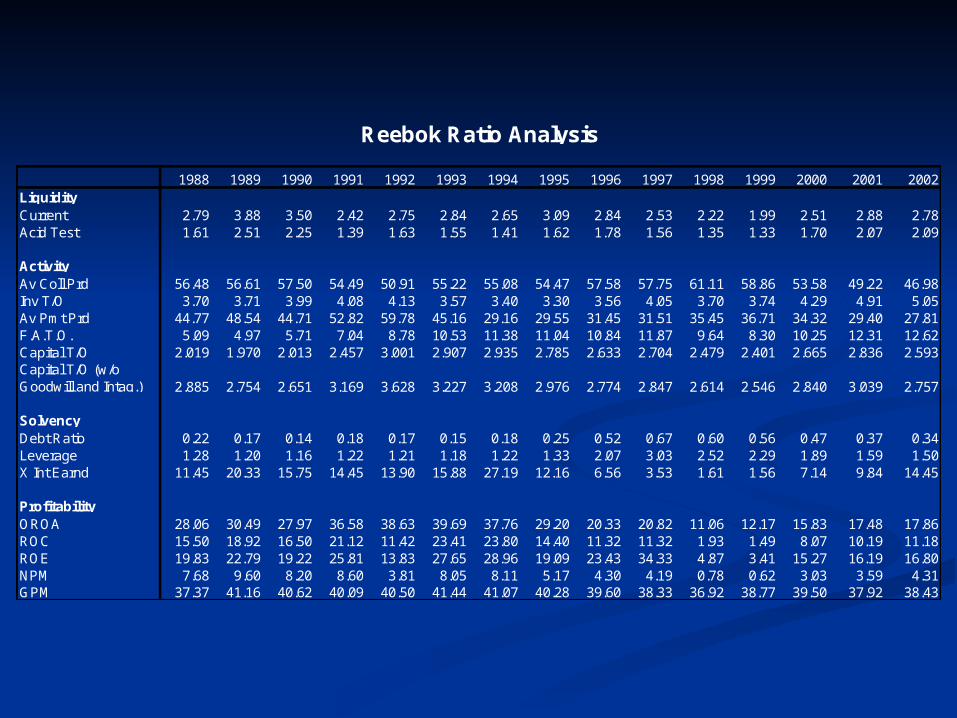
Reebok Ratio Analysis
1988 1989 1990 1991 1992 1993 1994 1995 1996 1997 1998 1999 2000 2001 2002LiquidityCurrent 2.79 3.88 3.50 2.42 2.75 2.84 2.65 3.09 2.84 2.53 2.22 1.99 2.51 2.88 2.78Acid Test 1.61 2.51 2.25 1.39 1.63 1.55 1.41 1.62 1.78 1.56 1.35 1.33 1.70 2.07 2.09
ActivityAv Coll Prd 56.48 56.61 57.50 54.49 50.91 55.22 55.08 54.47 57.58 57.75 61.11 58.86 53.58 49.22 46.98Inv T/O 3.70 3.71 3.99 4.08 4.13 3.57 3.40 3.30 3.56 4.05 3.70 3.74 4.29 4.91 5.05Av Pmt Prd 44.77 48.54 44.71 52.82 59.78 45.16 29.16 29.55 31.45 31.51 35.45 36.71 34.32 29.40 27.81F.A.T.O. 5.09 4.97 5.71 7.04 8.78 10.53 11.38 11.04 10.84 11.87 9.64 8.30 10.25 12.31 12.62Capital T/O 2.019 1.970 2.013 2.457 3.001 2.907 2.935 2.785 2.633 2.704 2.479 2.401 2.665 2.836 2.593Capital T/O (w/o Goodwill and Intag.) 2.885 2.754 2.651 3.169 3.628 3.227 3.208 2.976 2.774 2.847 2.614 2.546 2.840 3.039 2.757
SolvencyDebt Ratio 0.22 0.17 0.14 0.18 0.17 0.15 0.18 0.25 0.52 0.67 0.60 0.56 0.47 0.37 0.34Leverage 1.28 1.20 1.16 1.22 1.21 1.18 1.22 1.33 2.07 3.03 2.52 2.29 1.89 1.59 1.50X Int Earnd 11.45 20.33 15.75 14.45 13.90 15.88 27.19 12.16 6.56 3.53 1.61 1.56 7.14 9.84 14.45
ProfitabilityOROA 28.06 30.49 27.97 36.58 38.63 39.69 37.76 29.20 20.33 20.82 11.06 12.17 15.83 17.48 17.86ROC 15.50 18.92 16.50 21.12 11.42 23.41 23.80 14.40 11.32 11.32 1.93 1.49 8.07 10.19 11.18ROE 19.83 22.79 19.22 25.81 13.83 27.65 28.96 19.09 23.43 34.33 4.87 3.41 15.27 16.19 16.80NPM 7.68 9.60 8.20 8.60 3.81 8.05 8.11 5.17 4.30 4.19 0.78 0.62 3.03 3.59 4.31GPM 37.37 41.16 40.62 40.09 40.50 41.44 41.07 40.28 39.60 38.33 36.92 38.77 39.50 37.92 38.43

EV / EBITDAEV / EBITDAMarket Value of equity- Cash + Market Value of Debt + Market Value of equity- Cash + Market Value of Debt + Market Value of Preferred Stock / (Sales-COGS-SGA)Market Value of Preferred Stock / (Sales-COGS-SGA)

OutcomeOutcome