regional transportation plan for southern nevada … · regional transportation plan for southern...
TRANSCRIPT

Enhancing Mobility for Southern Nevada Residents
REGIONAL TRANSPORTATION PLAN for
SOUTHERN NEVADA
2017 - 2040
| ACCESS2040 1 |
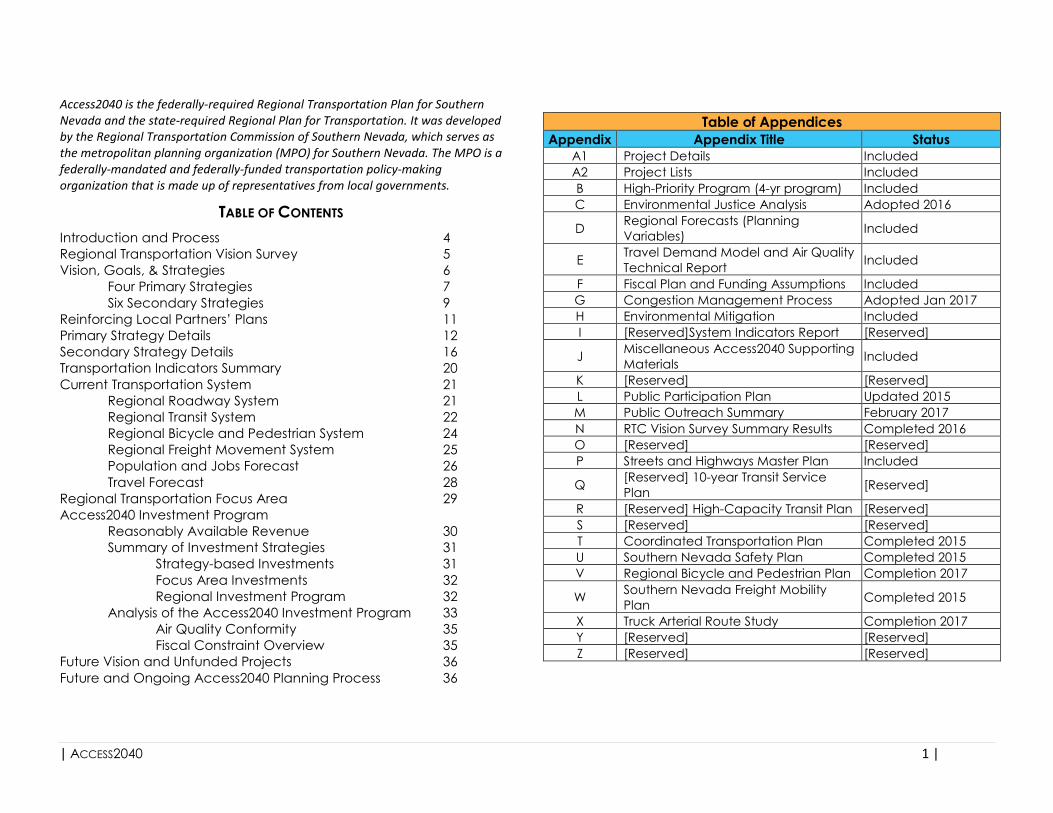
Access2040 is the federally-required Regional Transportation Plan for Southern
Nevada and the state-required Regional Plan for Transportation. It was developed
by the Regional Transportation Commission of Southern Nevada, which serves as
the metropolitan planning organization (MPO) for Southern Nevada. The MPO is a
federally-mandated and federally-funded transportation policy-making
organization that is made up of representatives from local governments.
TABLE OF CONTENTS
Introduction and Process 4
Regional Transportation Vision Survey 5
Vision, Goals, & Strategies 6
Four Primary Strategies 7
Six Secondary Strategies 9
Reinforcing Local Partners’ Plans 11
Primary Strategy Details 12
Secondary Strategy Details 16
Transportation Indicators Summary 20
Current Transportation System 21
Regional Roadway System 21
Regional Transit System 22
Regional Bicycle and Pedestrian System 24
Regional Freight Movement System 25
Population and Jobs Forecast 26
Travel Forecast 28
Regional Transportation Focus Area 29
Access2040 Investment Program
Reasonably Available Revenue 30
Summary of Investment Strategies 31
Strategy-based Investments 31
Focus Area Investments 32
Regional Investment Program 32
Analysis of the Access2040 Investment Program 33
Air Quality Conformity 35
Fiscal Constraint Overview 35
Future Vision and Unfunded Projects 36
Future and Ongoing Access2040 Planning Process 36
Table of Appendices
Appendix Appendix Title Status
A1 Project Details Included
A2 Project Lists Included
B High-Priority Program (4-yr program) Included
C Environmental Justice Analysis Adopted 2016
D Regional Forecasts (Planning
Variables) Included
E Travel Demand Model and Air Quality
Technical Report Included
F Fiscal Plan and Funding Assumptions Included
G Congestion Management Process Adopted Jan 2017
H Environmental Mitigation Included
I [Reserved]System Indicators Report [Reserved]
J Miscellaneous Access2040 Supporting
Materials Included
K [Reserved] [Reserved]
L Public Participation Plan Updated 2015
M Public Outreach Summary February 2017
N RTC Vision Survey Summary Results Completed 2016
O [Reserved] [Reserved]
P Streets and Highways Master Plan Included
Q [Reserved] 10-year Transit Service
Plan [Reserved]
R [Reserved] High-Capacity Transit Plan [Reserved]
S [Reserved] [Reserved]
T Coordinated Transportation Plan Completed 2015
U Southern Nevada Safety Plan Completed 2015
V Regional Bicycle and Pedestrian Plan Completion 2017
W Southern Nevada Freight Mobility
Plan Completed 2015
X Truck Arterial Route Study Completion 2017
Y [Reserved] [Reserved]
Z [Reserved] [Reserved]

| ACCESS2040 2 |
The preparation of this document has been financed in part through grants from
the Federal Highway Administration and Federal Transit Administration, U.S.
Department of Transportation, under the Metropolitan Planning Program, Section
104(f) of Title 23, U.S. Code. The contents of this report do not necessarily reflect
the official views or policies of the U.S. Department of Transportation.
Adopted February 9, 2017
Published by
The Regional Transportation Commission of Southern Nevada
600 South Grand Central Parkway
Las Vegas, Nevada 89106-4512
www.rtcsnv.com
Regional Transportation Commission of Southern Nevada
Clark County Commissioner Larry Brown, Chair
City of Henderson Councilwoman Debra March, Vice Chair
City of Las Vegas Mayor Carolyn Goodman
City of North Las Vegas Mayor John Lee
City of Boulder City Mayor Rod Woodbury
Clark County Commissioner Chris Giunchigliani
City of Las Vegas Councilwoman Lois Tarkanian
City of Mesquite Councilman David Ballweg
RTC Executive Management
General Manager Tina Quigley
Deputy General Manager M.J. Maynard
Deputy General Manager Fred Ohene
Resolution of Adoption

| ACCESS2040 3 |
Air Quality Conformity Determination Certification Statement

| ACCESS2040 4 |
Introduction and Process
ACCESS2040 is the primary vehicle through which the RTC’s
planning process is implemented. Inputs to ACCESS2040
came from a large number of sources, including results from
the RTC’s Transportation Vision Survey, priorities expressed
by the RTC’s Boards and Committees, Federal and state
planning requirements, current regional practices, and best
practices from professional transportation planning.
Underlying Access2040 is an assessment of the current
transportation system, its impacts on Southern Nevadans,
and identifying transportation infrastructure projects that
will improve quality-of-life for residents and visitors to
Southern Nevada.
About Southern Nevada
Approximately two million people reside within Clark
County and the regional economy supports nearly 900,000
jobs. More than 42 million people visit the region each year,
contributing to the regional economy.
Southern Nevada continues to experience rapid growth
with recent estimates suggesting population gains
approaching 30,000 new residents each year, about half of
whom are moving to the region from other parts of the
nation and world. As a consequence, the region displays tremendous ethnic
and cultural diversity.
The mobility needs of Southern Nevada are similarly varied, and the goals,
strategies, and investment program documented within ACCESS2040 reflect a
continuous, comprehensive and coordinated approach to transportation
planning.

| ACCESS2040 5 |
Regional Transportation Vision Survey
From January to July 2016, the Regional Transportation Commission of
Southern Nevada conducted an online survey of our region’s transportation
priorities. Participants ranked priorities, selected trade-off preferences, and
identified broad investment strategies. With nearly 7,000 people
participating, the Regional Transportation Commission Vision Survey is the
largest-ever review of Southern Nevadans’ attitudes about transportation.
Survey results show that Southern Nevadans want a transportation system
that allows them to safely and efficiently access the places they need or
want to go while also providing choices for how they travel. Safety and
congestion emerged as the top priorities, but all issues received significant
support.
• On a scale of 1 (high) to 5 (low), all eight issues surveyed had average
rankings between 2.6 and 3.5;
• Seven issues were ranked as priorities by more than half of all
participants;
• 90 percent of respondents supported investments beyond their top
five priorities; and
• Even the lowest-ranked priority received investment support from
more than half of participants.
| ACCESS2040 6 |
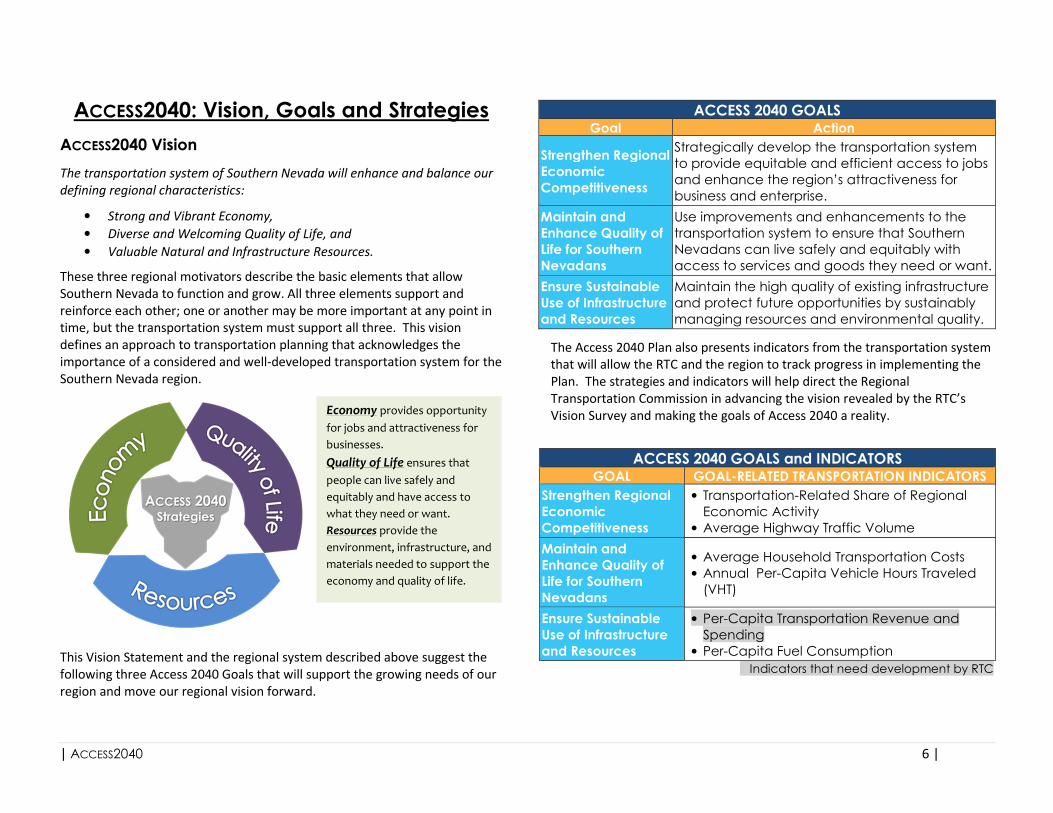
ACCESS2040: Vision, Goals and Strategies
ACCESS2040 Vision
The transportation system of Southern Nevada will enhance and balance our
defining regional characteristics:
• Strong and Vibrant Economy,
• Diverse and Welcoming Quality of Life, and
• Valuable Natural and Infrastructure Resources.
These three regional motivators describe the basic elements that allow
Southern Nevada to function and grow. All three elements support and
reinforce each other; one or another may be more important at any point in
time, but the transportation system must support all three. This vision
defines an approach to transportation planning that acknowledges the
importance of a considered and well-developed transportation system for the
Southern Nevada region.
This Vision Statement and the regional system described above suggest the
following three Access 2040 Goals that will support the growing needs of our
region and move our regional vision forward.
The Access 2040 Plan also presents indicators from the transportation system
that will allow the RTC and the region to track progress in implementing the
Plan. The strategies and indicators will help direct the Regional
Transportation Commission in advancing the vision revealed by the RTC’s
Vision Survey and making the goals of Access 2040 a reality.
ACCESS 2040 GOALS Goal Action
Strengthen Regional
Economic
Competitiveness
Strategically develop the transportation system
to provide equitable and efficient access to jobs
and enhance the region’s attractiveness for
business and enterprise.
Maintain and
Enhance Quality of
Life for Southern
Nevadans
Use improvements and enhancements to the
transportation system to ensure that Southern
Nevadans can live safely and equitably with
access to services and goods they need or want.
Ensure Sustainable
Use of Infrastructure
and Resources
Maintain the high quality of existing infrastructure
and protect future opportunities by sustainably
managing resources and environmental quality.
ACCESS 2040 GOALS and INDICATORS GOAL GOAL-RELATED TRANSPORTATION INDICATORS
Strengthen Regional
Economic
Competitiveness
• Transportation-Related Share of Regional Economic Activity
• Average Highway Traffic Volume
Maintain and
Enhance Quality of
Life for Southern
Nevadans
• Average Household Transportation Costs • Annual Per-Capita Vehicle Hours Traveled (VHT)
Ensure Sustainable
Use of Infrastructure
and Resources
• Per-Capita Transportation Revenue and Spending
• Per-Capita Fuel Consumption
. Indicators that need development by RTC
Economy provides opportunity
for jobs and attractiveness for
businesses.
Quality of Life ensures that
people can live safely and
equitably and have access to
what they need or want.
Resources provide the
environment, infrastructure, and
materials needed to support the
economy and quality of life.

| ACCESS2040 7 |
Four Primary Strategies
ACCESS 2040 establishes strategies that will implement the plan’s goals.
This section presents the four primary strategies, and a set of six
secondary strategies are outlined in the next section. Indicators are also
established for each strategy.
1. Improve Safety
The ability to safely travel throughout the region is a top priority for
Southern Nevadans. All users of the transportation system can be at
risk, including motorists, pedestrians, and cyclists. Safety has long
been a focus of the transportation profession, yet transportation
users continue to suffer fatalities, injuries, and other losses at
unacceptable rates. To improve safety beyond what current design
and engineering practices provide, they will be supplemented with
innovations that can reduce high-risk travel behavior and enhance
other features of the region that tend to increase safety for all users.
Addressing transportation safety will not only benefit our health, but
the community’s quality of life, and economic competitiveness.
2. Manage Congestion
The ability to manage congestion will help sustain the Southern
Nevada economy – and better position us to maintain our status in
the future as an attractive place to live and visit. Successful
implementation of this strategy will ensure that residents will be
able to travel and work efficiently and reliably using whichever
mode of transportation they desire.
Peak Travel Hour Congestion (one-day example)
Fatal and Serious Injury Crashes, 2010 to 2015
Source: Inrix traffic flow data,
May 11, 2016 (www.inrix.com)

| ACCESS2040 8 |
3. Enhance Multimodal Connectivity
Providing multimodal transportation connections to basic needs and
quality-of-life amenities for Southern Nevadans enhances their
health and wellness, and makes the region more inviting and
appealing for visitors and new commerce. A connected multimodal
transportation system of highways, roads, buses, sidewalks, and
bicycle facilities can increase access to jobs, housing, schools and
amenities locally and regionally, and ensures that the transportation
system allows people or goods to get where they need and want to
go, how they need or want to go.
4. Maintain Current Infrastructure
Maintaining a safe and reliable transportation system helps ensure
optimal system performance for people and goods. With limited
resources available for transportation infrastructure confronting the
growing region, we must maintain an acceptable state of repair for
system assets, and consider replacement costs for aging facilities.
ACCESS 2040 GOALS and PRIMARY STRATEGIES
PRIMARY
STRATEGIES
Maintain and
Enhance Quality of
Life for Southern
Nevadans
Strengthen
Regional
Economic
Competitiveness
Ensure Sustainable
Use of Infrastructure
and Resources
TRANSPORTATION SYSTEM
INDICATORS
Improve Safety ■ ■ □ • Death Rates • Serious Injury Rates • Per-Capita Death Rates
Manage Congestion ■ ■ ■
• System Reliability • Average Commute Delay • Bus On-Time Performance • Incident Response Time
Enhance Multimodal Connectivity ■ ■ ■ • Commute Mode Split • Network Connectivity • Complete Streets Infrastructure
Maintain Current Infrastructure ■ ■ ■ • Regional Pavement Condition Index • Vehicle Operating Costs • Transit System State of Good Repair
■ Directly Related □ Indirectly Related . Indicators that need development by RTC

| ACCESS2040 9 |
Six Secondary Strategies
1. Improve Access to Essential Services
The Southern Nevada region prospers when all residents and visitors
have access to the employment, housing, education, medical,
shopping, cultural, and recreational opportunities they need. Our
region’s transportation system is critical to enabling this movement
and providing access to these basic needs and quality-of-life
amenities that allow Southern Nevadans to succeed and invites
visitors to return.
2. Provide an Accountable and Transparent Planning Process
Southern Nevadans need to know that the resources available for
transportation projects and programs are well-spent. A transparent
planning and project selection process will help ensure that the
goals and strategies of Access2040 are followed, so that residents
are provided with a transportation system that meets their needs.
3. Enhance Freight Movement
Facilitating freight mobility and delivery accessibility within the
region helps ensure that Southern Nevada continues to remain an
inviting place for businesses to thrive and that residents have the
goods and materials they need and want. Keeping the region well-
connected to neighboring and national markets helps maintain
economic competitiveness.
4. Improve Public Health Related to Transportation
A deliberate focus on the transportation system’s influence on
mobility choices, air quality, physical activity, access to healthy food,
and the natural environment supports the opportunity for Southern
Nevadans to lead healthy and active lifestyles throughout the
region, both as part of how they travel, but also through how they
live. In addition, ensuring that the transportation system’s impact on
air quality is not detrimental to Southern Nevadans is an important
part of providing that system.
Sources: “Accessibility Across America, Auto 2015” and “Accessibility Across America,
Transit 2015”, University of Minnesota, 2016
Accessibility Comparison by Auto and Transit
Jobs Reachable within 30 Minutes (Auto)
Jobs Reachable within 30 Minutes (Transit)

| ACCESS2040 10 |
5. Conserve and Protect Natural Resources
Significant impacts to natural resources are often a consequence of
economic growth and increasing travel demand such as those
experienced in our region. Identifying these potential impacts and
supporting the conservation and enhancement of natural resources
will promote a higher quality of life and help ensure long-term
economic opportunity. Protecting natural resources helps residents
to lead healthy lifestyles, and enjoy clean air and water by
promoting opportunities for active transportation.
6. Use Innovative Planning to Address Emerging Technologies &
Trends
Emerging technologies and their growing use will disrupt traditional
transportation planning practices. To respond proactively, the RTC
will develop innovative planning approaches to address these trends
that change how priorities are identified and how decisions are
made.
ACCESS 2040 GOALS and SECONDARY STRATEGIES
SECONDARY
STRATEGIES
Maintain and
Enhance Quality
of Life for
Southern
Nevadans
Strengthen
Regional
Economic
Competitiveness
Ensure
Sustainable Use of
Infrastructure and
Resources
TRANSPORTATION SYSTEM
INDICATORS
Improve Access to Essential Services ■ ■ □ • Job Accessibility • Jobs within 30 minute Commute • Accessibility to Essential Services
Provide Accountable & Transparent
Planning Process ■ □ ■ • Planning Process Measures • Project Delivery Time • Performance Measures Attainment
Improve Freight Movement □ ■ □ • Truck Congestion Cost • Freight Delay (FHWA Perf. Measure)
Improve Public Health Related to
Transportation ■ ■ □ • Active Transportation Participation • Health Incidents Related to AQ
Conserve & Protect Natural Resources ■ ■ ■ • Air Quality Compliance • Projects Requiring Mitigation • Land Conversion Rate
Use Innovative Planning to Address
Emerging Technologies & Trends ■ ■ ■
• Technology Impact Tracking • Transportation Network Company (TNC) Travel Share
• Autonomous Vehicle Travel Share
■ Directly Related □ Indirectly Related . Indicators that need development by RTC

| ACCESS2040 11 |
Reinforcing Existing Local Partners’ Transportation Plans
The table below shows how the ACCESS2040 Plan reinforces similar goals
developed and included in the Transportation Plans or Plan elements from
each of the local governments in Southern Nevada, as well as the Southern
Nevada Strong Regional Plan.
ACCESS 2040 Goals and Strategies Compared to Local Agency Transportation Plans
ACCESS 2040 Goals Clark County Las Vegas Henderson
North Las
Vegas
Boulder
City Mesquite
Southern
Nevada Strong
Maintain and Enhance Quality-of-Life for
Southern Nevadans ���� ���� ���� ���� ���� ���� ����
Strengthen Regional Economic Competitiveness ���� ���� ���� ���� ���� ���� ���� Ensure Sustainable Use of Infrastructure and
Resources ���� ���� ���� ���� ���� ���� ����
ACCESS 2040: Primary Strategies
Improve Safety ���� ���� ���� ���� ���� ���� ���� Manage Congestion ���� ���� ���� ���� ���� ���� ���� Expand Multimodal Network ���� ���� ���� ���� ���� ���� ���� Maintain Current Infrastructure ���� ���� ���� ���� ���� ���� ����
ACCESS 2040: Secondary Strategies
Improve Access to Essential Services ���� ���� ���� ���� ���� ���� ���� Provide Accountable & Transparent Planning
Process ���� ���� ���� ���� ���� ���� ����
Improve Freight Movement ���� ���� ���� ���� ���� ���� ���� Improve Public Health Related to Transportation ���� ���� ���� ���� ���� ���� ���� Conserve & Protect Natural Resources ���� ���� ���� ���� ���� ���� ���� Use Innovative Planning to Address Emerging
Technologies and Trends ���� ���� ���� ���� ���� ���� ����
Legend: ���� Directly Related ���� Indirectly Related ���� Not Mentioned ���� Contradicts (none identified)

| ACCESS2040 12 |
PRIMARY STRATEGY: Improve Safety
The ability to safely travel throughout the region is a top priority for Southern
Nevadans. All users of the transportation system can be at risk, and will
benefit from fewer traffic crashes, fatalities, and injuries. Safety has long
been a focus of the transportation profession and this attention has reduced
fatalities and injuries, yet transportation users continue to suffer fatalities,
injuries, and other losses at unacceptable rates. To continue improving safety
beyond what traditional design and engineering practices provide, designs
might be supplemented with innovations that can reduce high-risk travel
behavior and enhance other features of the region that tend to increase
safety for all users. Addressing transportation safety will not only benefit our
health, but the community’s quality of life, and economic competitiveness.
Current approaches to transportation safety concentrate on engineering
solutions that create an environment with less potential risk from vehicle
crashes by removing obstacles and barriers from where vehicles travel. Those
same improvements, however, can result in higher vehicle travel speeds that
in turn decrease the ability of a driver to regain control of a vehicle, and that
substantially increases the risks for vulnerable users like pedestrians, cyclists,
or transit users. (See graphic) Recent engineering advancements in safety
have included “Complete Streets” standards, road diets, and improved
infrastructure for pedestrians and cyclists, which slow vehicles and reduce
risks to vulnerable users without dramatically impacting system efficiency.
Although motorists are the largest group of system users injured or killed in
crashes, pedestrians and cyclists are also at risk. Improving transportation
safety will not only benefit Southern Nevadans’ quality of life, but will also
improve visitors’ perceptions of safety and strengthen the region’s economic
competitiveness.
Access2040 Safety Innovations Planning Factor Traditional Paradigm New Considerations
Overall Goal Make driving safer Make travel safer
How risks are measured Travel volume-based crash rates Per-capita crash rates
Modes considered
Focused on motor-vehicle travel;
considers pedestrians, cyclists,
and transit riders to be high-risk
groups
Considers impacts on all
modes and road users;
recognizes that shifts from
automobiles to alternate
modes can help increase
overall safety
Consideration of other
impacts
Tends to consider traffic safety
impacts in isolation of other
community factors
Uses comprehensive
analysis which recognizes
indirect impacts and non-
safety benefits
Types of projects
Engineering improvements and
countermeasures focused on
vehicle occupants and their
interactions with vulnerable users
Enhancements for all
modes
ACCESS2040 Example Safety Projects Estimated Cost Las Vegas Blvd Pedestrian Safety Project $6.8 million
Installing Pedestrian Flashers in Henderson $200,000
Installing Pedestrian Flashers in City of Las Vegas $400,000
Clark County School District: Safe Routes to School Program $995,000 over 5 years
East Lake Mead Blvd Safety Improvements $4 million
Advanced Pedestrian Safety Signal at Lake Mead Blvd/Comstock
Drive $200,000
Craig Road Pedestrian and ADA Improvements $3 million
Eastern Ave and Civic Center Drive Pedestrian and ADA
Improvements $3 million
Risks of Pedestrian Serious Injury or Fatality Based on Vehicle Speed
Source: “Impact Speed and a Pedestrian’s Risk of Severe Injury or Death,” AAA Foundation for Traffic Safety, September 2011. (dotted lines show 95% confidence interval)

| ACCESS2040 13 |
PRIMARY STRATEGY: Manage Congestion
The ability to manage congestion will help sustain the Southern Nevada
economy – and better position us to maintain our status in the future as an
attractive place to live and visit. Successful implementation of this strategy
will ensure that residents will be able to travel and work efficiently and
reliably using whichever mode of transportation they desire. This strategy
focuses on reducing traffic congestion through traffic management and
system operations, relieving traffic bottlenecks, and completing the
transportation network.
One important element of Managing Congestion is improving system
management and operations. The RTC funds and operates the Freeway and
Arterial System of Transportation (FAST) program for Southern Nevada, which
helps monitor and control traffic on major roads and highways. System
management helps make the best use of existing facilities at lower short- and
long-term costs than adding capacity.
A major outcome of managing congestion is a reduction in vehicle delays,
usage, and emissions that are detrimental to air quality and health.
Congestion management needs are assessed through the RTC’s federally-
required Congestion Management Process (provided in Appendix G), which
identifies the most effective tools available. Managing congestion may
sometimes include adding new capacity to existing roads, but this should
usually be a last resort because of the high costs and a large body of evidence
that new capacity generates additional traffic that wipes out congestion-relief
benefits of new capacity within 4-7 years. There are instances, however,
where additional capacity or roadway redesign that relieves a particular
recurring bottleneck can make a sustainable contribution to congestion
management.
This congestion management effort will increase travel reliability by utilizing
existing infrastructure as efficiently as possible with projects such as signal
timing improvements,
dynamic traffic alerts,
smartphone transit
rider assistance apps,
and improved
communication about
pedestrian and bicycle
travel options. Other
strategies can include
increasing
opportunities for
travelers to use transit,
bicycles, or walking.
Managing congestion
can also reduce traffic
crashes by enabling the
optimal number of vehicles to travel reliably on Southern Nevada’s roads, and
communicating crash information to minimize secondary crashes and
additional delays. Less congestion and more reliable travel will limit damage
and degradation of existing infrastructure, extending its useful life.
ACCESS2040 Example Congestion Projects Estimated Cost RTC’s Freeway and Arterial System of Transportation (“FAST”) $5.75 million/year
RTC Club Ride Program $1.3 million/year
North Las Vegas North 5th
Street Signal Coordination $1.3 million
Clark County Traffic Management Installations $9.5 million
Henderson Eastern Ave Bus Turn-Out Traffic Improvements $750,000
Install 25 Bus Turnouts on West Charleston Blvd $2.8 million
Improve Right-Turn Lanes at 6 City of Las Vegas Intersections $1.5 million
Pedestrian Bridge at Pebble Rd and I-215 $2.0 million
Install new bridge over CC-215 at Peace Way $15 million
New Interchange at I-15 and Sloan (Henderson) $58 million
I-15 at Tropicana Interchange Improvements $150 million

| ACCESS2040 14 |
PRIMARY STRATEGY: Enhance Multimodal Connectivity
Providing multimodal transportation connections to basic needs and quality-
of-life amenities for Southern Nevadans enhances their health and wellness,
and makes the region more inviting and appealing for visitors and new
commerce. A connected multimodal transportation system of highways,
roads, buses, sidewalks, and bicycle facilities can increase access to jobs,
housing, schools and amenities locally and regionally, and ensures that the
transportation system allows people or goods to get where they need and
want to go, how they need or want to go.
Transit system expansion in the future will extend current bus service to new
developing areas and increase service on busy existing routes. The RTC has
done substantial planning and preparation to develop high-capacity transit on
Maryland Parkway, is assessing the feasibility of Light Rail that would link
McCarran Airport to the Strip and Downtown, and has initiated a regional
High Capacity Transit Plan that will examine regional needs and develop
standards and criteria for future implementation of regional services such as
Light Rail. Bicycle and Pedestrian needs are being examined in the RTC’s
Regional Bicycle and Pedestrian Plan, which identifies future routes and
facilities that would serve all areas of the region and provide safe and
comfortable alternatives to driving. Both the High Capacity Transit Plan and
the Regional Bicycle and Pedestrian Plan will be incorporated into ACCESS2040
when they are completed.
Enhancing multimodal connectivity can involve increasing the extent of the
network of streets and highways when the expansion improves mobility,
preferably for more than just vehicular modes. Roadway completions or
network extensions for major roads are funded at the request of RTC’s
member jurisdictions, and new neighborhood roads are provided by private
developers. A map of the expected future roadway network is provided in
Appendix P.
Efficient connections between modes also enhance the overall ability for
residents and visitors to travel within and to/from Southern Nevada. Ensuring
that transportation system users can move between modes (vehicles,
walking, bicycling, and transit) without barriers or significant delay is a crucial
element of improving multimodal connectivity.
Multimodal network expansion could reduce traffic crashes and improve
incident response by providing travel alternatives when roads and highways
are delayed. A multimodal connected transportation system improves quality
of life for Southern Nevadans and enhances the region’s attractiveness for
economic development.
ACCESS2040 Example Multimodal Projects Estimated Cost High Capacity Transit Plan ~$2 million
Regional Bicycle and Pedestrian Plan N/A (complete in 2017)
Install Pedestrian Bridge over I-215 at Pebble Rd $2 milion
Install Bicycle Lanes on Rampart Blvd $4.6 million
Expand Downtown Las Vegas Complete Streets $16 million
Widen Sidewalks and Install ADA Improvements on Rainbow $250,000
Install New Trail Connections (multiple Henderson locations) $1 million
Regional Sidewalk and Parking Inventory $250,000
Access2040 Multimodal Connectivity Programs Network Type Multimodal Connectivity Actions
Roadways
Complete currently planned roadway system and emphasize
roadway designs that accommodate all potential users and
modes, including vehicle drivers and passengers, pedestrians
and cyclists, and transit users. Avoid roadway designs and
projects that limit connectivity of other modes.
Highways Maintain current system and focus on adding connections to
the roadway network that enhance accessibility and efficiency.
Pedestrian & Bicycle Expand networks and overall connectivity in accordance with
Regional Bicycle and Pedestrian Plan (expected 2017).
Transit
Expand service to new areas and increase service frequency on
some routes; explore feasibility of high-capacity connections
throughout Southern Nevada and from McCarran Airport to the
Strip and Downtown.
Modal Connections Enhance overall connectivity by ensuring that transportation
system users can move between modes without barriers or
delays.

| ACCESS2040 15 |
PRIMARY STRATEGY: Maintain Current Infrastructure
Maintaining a safe and reliable transportation system helps ensure optimal
system performance for people and goods. With insufficient resources
available for transportation infrastructure in the growing region, Southern
Nevada must maintain an acceptable state of repair for existing
transportation infrastructure, and apply the best maintenance or
replacement strategies for aging infrastructure and facilities.
Maintaining infrastructure in a timely manner with regular minor or
preventative repairs saves substantial money compared to waiting until
extensive reconstruction is required. This frees up funds for other
transportation priorities and reduces travel delays and interruptions from
more extensive long-term projects.
Maintenance improvements are often made as part of other projects on the
same facility. The RTC works with local jurisdictions and stakeholders, such as
utility providers and property developers, to coordinate road construction
and reconstruction activities, so that the public can be informed about these
projects, travel delays are minimized, and roadway and other facilities are
maintained in a good state of repair. In addition to minimizing disruptions,
coordinating activities between different parties also reduces construction
costs and benefits Southern Nevada’s economic appeal and quality of life.
The RTC’s effort, called “Seeing Orange” is an ongoing priority of the RTC and
will be supported as ACCESS2040 is implemented.
Maintaining high quality and updated transportation facilities (roads,
highways, sidewalks, bicycle facilities, transit facilities, and transit vehicles)
ensures the basic safety needs of the traveling public. Deploying the most
current maintenance practices and technology will minimize costs and
inefficiencies. Transportation facilities in a state of good repair increase
reliability and safety by, for example, presenting fewer maintenance
irregularities that force drivers, pedestrians, or bicyclists to unexpectedly
switch lanes to avoid potholes, cross busy roads in darkened conditions, or
enter vehicle travel lanes because bike facilities are covered with gravel or
glass.
One way to measure the impact on people and economic activity of a good
state of repair for a transportation system is maintenance costs above and
beyond normal wear-and-tear. Because Southern Nevada has a relatively new
transportation system, roads and highways in the region are generally
considered to be in a good state of repair, and vehicle maintenance costs for
Southern Nevadans due to poor roads are lower than the national average.
But transportation infrastructure maintenance is inevitable and inexorable.
Addressing the region’s maintenance needs will continue to help save
residents unnecessary costs and enhance Southern Nevada’s economic
vitality.
Access2040 Maintenance Programs
Category Types of Maintenance Activities
“Seeing Orange” Coordinate road construction and repair projects to
minimize delays and costs
Roadway Network Reconstruction, rehabilitation, or repaving of roads,
highways, and access facilities
Pedestrian & Bicycle Facilities Upgrade to current design guidelines and ADA
requirements
Transit Facilities and Vehicles Improve bus stops and transit centers for continued
use; Vehicle repair, replacement or modernization,
and retirements
Future Autonomous Vehicle
Infrastructure
Maximize pavement quality, make lanes narrower, and
provide clear and obvious lane markings and
navigation aids

| ACCESS2040 16 |
SECONDARY STRATEGY: Improve Access to Essential Services
The Southern Nevada region prospers when all residents and visitors have
access to the employment, housing, education, cultural, and recreational
opportunities they need. Our region’s transportation system is critical to
enabling this movement and providing access to these basic needs and
quality-of-life amenities that allow the region’s residents to succeed and
invites visitors to return.
Providing a transportation system that meets these needs has long been a
core activity for the RTC and local governments in Southern Nevada. Even so,
parts of the region have poor accessibility to job centers or key needs such as
healthy food, schools, or medical and social services. Increasing access to
these essential needs will improve quality-of-life for those residents and the
region as a whole.
Improving access to essential services also serves to formalize that the RTC
consider the impacts of transportation projects on disadvantaged Southern
Nevadans and attempt to use transportation projects and programs to
provide benefits to them. Providing this “Environmental Justice” is a federal
requirement for planning agencies such as the RTC; in the past it has primarily
meant ensuring that no harm is done to these populations and has been
demonstrated weakly by mapping transportation project locations with
where disadvantaged populations live. The terms “access” and “accessibility”
also refer to improving conditions for people with disabilities, and this
strategy includes addressing their concerns and needs. As ACCESS2040 is
implemented, the RTC will seek to identify gaps, barriers, and needs for
disabled, low income and minority populations, so that transportation
projects and programs can specifically benefit them.
In addition, because economic and land use development and transportation
infrastructure have a symbiotic relationship, the RTC and Southern Nevada
communities will expand work to coordinate transportation decisions with
economic and community development decisions. With the RTC’s role in
leading implementation of the Southern Nevada Strong Regional Plan,
coordinating these activities helps advance that effort. Transportation
investments can alter patterns of development, attracting new construction
or encouraging efficient infill for under-utilized land areas already surrounded
by built-up areas.
SECONDARY STRATEGY: Enhance Freight Movement
Addressing freight mobility needs and enhancing Southern Nevada’s
attractiveness to a high-skill workforce will ensure that the region continues
to remain an inviting place for businesses to thrive. Because of the large
tourism industry, Southern Nevada relies on freight; the region also receives
benefits from freight-related assets and infrastructure. Most freight-related
planning will be based on the RTC’s Southern Nevada Regional Goods
Movement Master Plan (Appendix W) and results of the RTC’s Truck Arterial
Route Study (completion expected in 2017).
Safe freight movement is usually provided by design and construction
standards that ensure roads and highways can handle freight vehicles. But
accessibility for freight – the ability for freight vehicles and goods in general
to reach the places they need – is not usually an obvious factor in
transportation decision-making. Because freight plays a major role in
sustaining the Southern Nevada economy, ensuring these traditionally under-
addressed accessibility concerns are part of regional transportation and land
use planning will help provide an efficiently-operating transportation system
that benefits all users. This may become especially important to other users
of the transportation system as the on-demand economy, services and goods
delivered directly to consumers may increase delivery truck use on roads and
local streets.
In addition to freight from trucks, Southern Nevada is also served by a major
railroad that runs through the core of the region, providing freight
connections to and from key markets. As manufacturing in Southern Nevada
increases, ensuring that rail continues to provide economically beneficial
connections without overly interfering in mobility and accessibility of other
non-freight modes will be a priority.
Differences between freight and traveler needs have historically presented
challenges to planners and engineers, and could continue to make the best
investments difficult to determine. A more modern paradigm would prioritize
investments by how well they address both sets of needs. The RTC will seek
to balance freight movement and quality of life with transportation
investments that consider impacts on both types of system users.

| ACCESS2040 17 |
SECONDARY STRATEGY: Provide an Accountable and Transparent
Planning Process
Southern Nevadans need to know that the resources available for
transportation projects and programs are well-spent. A transparent planning
and project selection process will help ensure that the goals and strategies of
Access2040 are followed, so that residents are provided with a transportation
system that meets their needs.
The RTC and local planning and public works departments will coordinate
project selection and planning activities so that projects can be selected
based on what they are intended to accomplish and how that aligns with
Southern Nevada’s transportation vision, priorities, and needs. This process
provides effective stewardship and efficient allocation of public funds.
Project identification and selection follows an RTC-implemented process
designed to meet the following goals:
• Value-based: Selected projects align with Southern Nevada’s
transportation priorities, identified through the Access2040 Vision,
Goals, and Strategies;
• Transparent and Fair: Process is clearly described and unbiased, and
is applied consistently to all potential projects and all jurisdictions;
• Efficient and Equitable distribution of funds: Anticipated spending is
distributed across the region based on multiple factors like public
needs, population, tax base, etc.
The RTC will work closely with its member agencies to continue using a
transparent and fair process for selecting transportation projects:
1. Jurisdictions provide descriptions and Access2040-related
information for all potential projects;
2. RTC assesses projects on technical basis, looking at relationship to
strategies, previous planning efforts, etc.;
3. Jurisdictions provide additional prioritization information to RTC
based on specific local needs;
4. RTC merges technical and jurisdiction’s results to assign projects to
categories that determine when projects would start:
a. “High Priority” projects start in 1 to 5 years;
b. “Medium Priority” projects start in 5 to 20 years or 5 to 10
years, depending on funding source; and
c. “Unfunded” projects that need additional planning and
development before funding can be assigned.
The four Access2040 Primary Strategies closely link the regional
transportation vision to projects that are included in the “High Priority”
Program list, also called the Transportation Improvement Program. The High
Priority Program stages the region’s transportation projects in a short-term 5-
year window for construction. It is updated every two years, and the 2017
version contains about $1.5 billion in estimated expenditures. By
incorporating Access2040 strategies into this short-range programming, the
RTC achieves a strong coordination between Southern Nevadans’ vision for
the future and investments being made today.

| ACCESS2040 18 |
SECONDARY STRATEGY: Improve Public Health Related to
Transportation
A deliberate focus on the transportation system’s influence on mobility
choices, air quality, physical activity, access to healthy food, and the natural
environment supports the opportunity for Southern Nevadans to lead healthy
and active lifestyles throughout the region, both as part of how they travel,
but also through how they live.
To implement this strategy, the RTC will seek to develop and promote
transportation alternatives that encourage more active lifestyles. The RTC’s
Regional Bicycle and Pedestrian Plan (expected in 2017) and Complete Streets
Policy and Design Guidelines can help identify where active transportation
infrastructure is appropriate and how it should be designed.
In addition, the RTC will consider the public health impacts of transportation
projects and programs, and eventually include those impacts directly in the
project selection process. The RTC is also accountable for maintaining air
quality standards in Southern Nevada by assessing the air quality impacts of
transportation projects, and rejecting or adjusting projects that would result
in worsening compliance with air quality standards. Because those standards
are established in large part to maintain or improve public health, meeting
those standards helps improve public health.
RTC will also identify gaps in access to needs that relate to public health. For
example, the RTC identify food deserts, which are defined as areas with a
high concentration of low income populations, devoid of full-service grocery
stores, and having little access to transit, walking and bicycling facilities. Once
identified, plans can be developed to eliminate food deserts and indirectly
improve public health.
By achieving improved public health outcomes resulting from the RTC’s
transportation planning and projects, this strategy will improve Southern
Nevadans’ quality of life, reduce unnecessary consumption of resources, and
enhance the region’s economic competitiveness.
SECONDARY STRATEGY: Conserve and Protect Natural Resources
Significant impacts to natural resources are often a consequence of economic
growth and increasing travel demand such as those experienced in our
region. Identifying these potential impacts and supporting the conservation
and enhancement of natural resources will promote a higher quality of life
and help ensure long-term economic opportunity. Protecting natural
resources helps residents to lead healthy lifestyles, and enjoy clean air and
water by promoting opportunities for active transportation.
Natural resources in Southern Nevada include undeveloped land, which may
eventually be developed, but that also provides areas for recreation, natural
habitat for wildlife, and scenic vistas. The provision of roads is necessary to
serve newly developed or developing areas, but is also expensive and
increases maintenance needs. Undeveloped infill areas provide opportunities
to develop land that usually requires only minimal costs for new
transportation infrastructure and its maintenance. Continued development
along current urban edges can have other impacts to the transportation
system that infill development does not, including generating additional
longer distance commuters that further clog roadways and create delays
unless expensive new capacity projects are added, and usually
disproportionately paid for by the region as a whole.
As travel demand in Southern Nevada continues to grow with economic
activity, the need to conserve and protect natural resources needs to be
balanced with efforts to prepare and adapt for further economic expansion.
With the regional framework described in the ACCESS2040 Vision, the RTC will
support efforts to achieve both outcomes in balance, rather than focusing on
whether to pursue one objective over another.

| ACCESS2040 19 |
SECONDARY STRATEGY: Use Innovative Planning to Address
Emerging Technologies & Trends
Emerging technologies and their growing use will disrupt traditional
transportation planning practices. To respond proactively, the RTC will
develop innovative planning approaches that change how priorities are
identified and how decisions are made. These new planning methods – which
may take years to identify – will allow the RTC to develop effective,
predictive, and timely responses to these disruptions.
Potential impacts are numerous. Engineering research indicates that
connected and autonomous vehicles could nearly double effective road
capacity, virtually eliminating traffic congestion and challenging the need for
more capacity. At a certain threshold across the entire fleet, self-driving cars
are expected to substantially reduce overall transportation crashes and
fatalities. Transportation Network Companies and autonomous vehicles could
drive down public transit operating costs and lead to changes in how transit is
provided. RTC analysis of available data already shows that TNC ridership as a
share of passengers at McCarran International Airport has doubled over a 6-
month period. New ways of travel and vehicle ownership could change land
use patterns, transportation revenue, and public transit preferences. With
the actual impacts still unknown, the appropriate actions by the RTC (to avoid
inefficient uses of resources for projects that may become unnecessary, avoid
putting drivers, pedestrians, and bicyclists at risk, and accommodate these
new trends and technologies) are difficult to determine until these
technologies are more extensively adopted. To make smart decisions, some
emerging planning-related questions may become:
• What infrastructure changes may be needed?
• When (or if) it will be appropriate to start changing how or what
types of infrastructure or capacity are provided?
• How will these trends influence how and how much people travel,
and how freight and household goods move?
The RTC is initiating a number of ACCESS2040-related actions over the next
few years that will help identify and develop these innovative planning
methods to manage the transition to new technologies and maximize the
positive benefits for Southern Nevadans:
Technology-Related Planning Needs RTC Action Incorporate emerging technologies into goals Included in Access 2040
Establish policies & plans with consideration for the future Initiated in Access 2040
Develop scenario model with Emerging Technologies
capabilities
Model development
underway (2017)
Assess high-capacity transit impacts and requirements High Capacity Transit Plan
(2017-2018)
Evaluate road capacity needs Emerging Technologies
Planning Study (2017)
Forecast financial implications Emerging Technologies
Planning Study (2017)
Identify trigger points for longer-term actions Emerging Technologies
Planning Study (2017)
Evaluate and test use of AV paratransit vehicles 1-5 years
Update roadway policies and infrastructure to leverage the
VMT impact 1-5 years
Develop new predictive models for pavement maintenance 1-5 years
Assess impacts on low-ridership transit routes 1-5 years
Provide analysis of transportation and land use impacts to
support stakeholders 1-5 years

| ACCESS2040 20 |
Transportation System Current Indicators
ACCESS2040 Transportation System Indicators Primary Strategy Indicator Current Measure Trend Target
Improve Safety
Fatality Rate (per 100m VMT) 1.45/100M VMT
Trend data will be
developed for future
reports after multi-year
data is reviewed
Targets may be
established in future
plans in consultation
with partner agencies.
Serious Injury Rate 5.0/100M VMT
Fatality Rate (per 100K people) 9.12/100K residents
Pedestrian & Bicyclist Fatality Rate 2.94/100K residents
Manage Congestion
Reliability (Extra Trip Planning Time) 2.2 min/trip
Average One-Way Daily Commute Delay 5.5 min/day
Bus On-Time Performance (5 min standard) 87.6%
Incident Response Time (Less than 30 min) 60%
Enhance Multimodal Connectivity
Commute Mode Split Drive 78.5%/Transit 4.0%
Network Connectivity 8.2 intersections/mile2
Complete Streets Infrastructure RTC will Develop
Maintain Current Infrastructure
Regional Pavement Condition Index RTC will Develop
Vehicle Maintenance Costs $440/driver
Transit State of Good Repair (Fleet Age) 7 years
Secondary Strategy Indicator Current Measure Trend Target
Improve Access to Essential
Services
Job Accessibility (avg. 45-min Auto) 164,000 jobs
Trend data will be
developed for future
reports after multi-year
data is reviewed
Targets may be
established in future
plans in consultation
with partner agencies.
Job Accessibility (avg. 45-minute Transit) 6,000 jobs
Accessibility to Essential Services RTC will Develop
Provide Accountable &
Transparent Planning Process
Planning Process Measures RTC will Develop Project Delivery Time RTC will Develop
Performance Measures Attainment RTC will Develop
Improve Freight Movement Truck Congestion Cost RTC will Develop
Freeway Freight Delay (PM Peak Period) 8.5 miles <45 MPH
Improve Public Health Related to
Transportation
Active Transportation Commute Percent 2.1%
High-Level Bike Facility Ratio 0.25 miles/Roadway Mile
Health Incidents Related to Air Quality RTC will Develop
Conserve & Protect Natural
Resources
Air Quality Compliance Satisfied (see page 34)
Infill Development Ratio RTC will Develop
People per Lane-Mile 295 people/mile
Use Innovative Planning to Address
Emerging Technologies & Trends
Technology Impact Tracking RTC will Develop
TNC Monthly Trip Growth (@McCarran Int’l) 11.5% (6-mo. avg.)
Autonomous Vehicle Travel Share RTC will Develop
| ACCESS2040 21 |
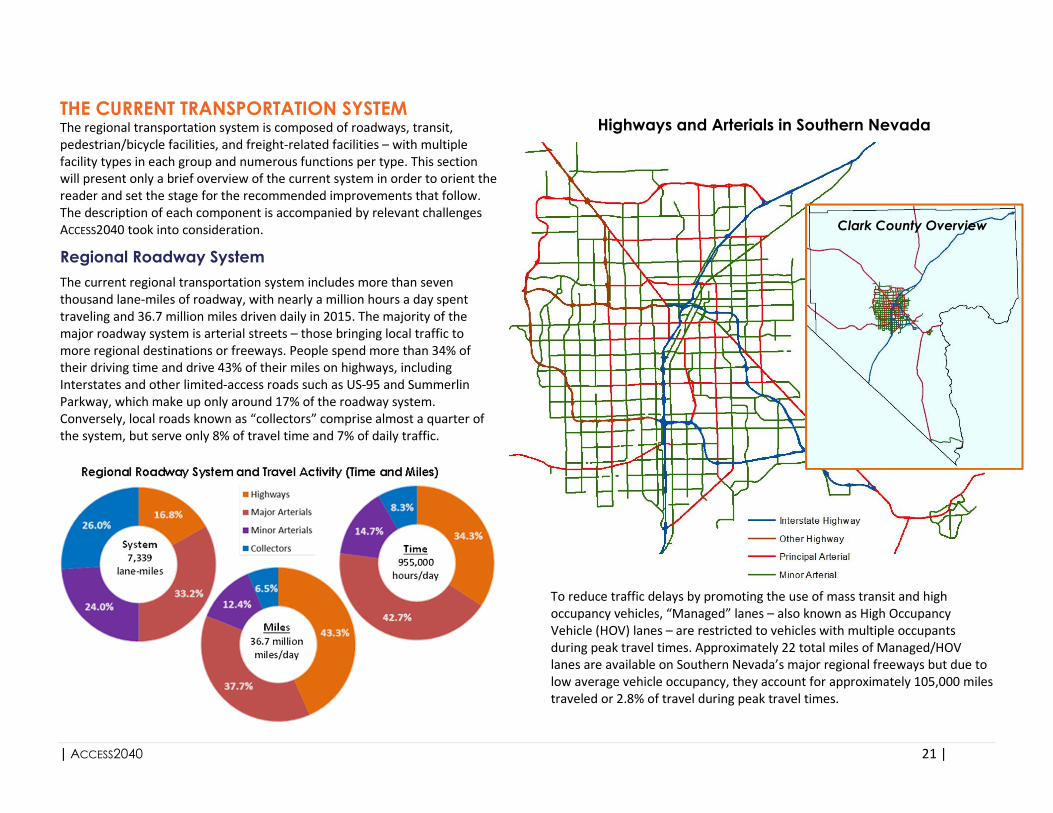
THE CURRENT TRANSPORTATION SYSTEM The regional transportation system is composed of roadways, transit,
pedestrian/bicycle facilities, and freight-related facilities – with multiple
facility types in each group and numerous functions per type. This section
will present only a brief overview of the current system in order to orient the
reader and set the stage for the recommended improvements that follow.
The description of each component is accompanied by relevant challenges
ACCESS2040 took into consideration.
Regional Roadway System
The current regional transportation system includes more than seven
thousand lane-miles of roadway, with nearly a million hours a day spent
traveling and 36.7 million miles driven daily in 2015. The majority of the
major roadway system is arterial streets – those bringing local traffic to
more regional destinations or freeways. People spend more than 34% of
their driving time and drive 43% of their miles on highways, including
Interstates and other limited-access roads such as US-95 and Summerlin
Parkway, which make up only around 17% of the roadway system.
Conversely, local roads known as “collectors” comprise almost a quarter of
the system, but serve only 8% of travel time and 7% of daily traffic.
To reduce traffic delays by promoting the use of mass transit and high
occupancy vehicles, “Managed” lanes – also known as High Occupancy
Vehicle (HOV) lanes – are restricted to vehicles with multiple occupants
during peak travel times. Approximately 22 total miles of Managed/HOV
lanes are available on Southern Nevada’s major regional freeways but due to
low average vehicle occupancy, they account for approximately 105,000 miles
traveled or 2.8% of travel during peak travel times.
Clark County Overview
Highways and Arterials in Southern Nevada

| ACCESS2040 22 |
Regional Roadway Challenges
Safety ranked as the top priority in the RTC Vision Survey, and is a grave
concern for roadway travel in the region. In 2015, the region experienced a
significant increase of 21% in transportation fatalities, including a 24%
increase in pedestrian and bicyclist fatalities, compared to 2014. Addressing
these concerns is reflected not only in ACCESS2040’s goals and strategies,
discussed earlier, but also in future projects identified in the High Priority
Project lists and future RTP projects.
Congestion-related concerns ranked as the second priority in the Vision
Survey. Since 2010, miles traveled on regional roadways have grown 18% -
substantially more than population growth of about 7% and growth of major
road lane mileage of about 12% over the same time. VMT is projected to
grow more than 48% by 2040, with major road lane mileage growing by about
18%.
Perhaps a stronger challenge for drivers than congestion is commute times
and delays, which can be compounded by development patterns. Although
effective system planning achieved a reduction in average commuter travel
delay of 6% from 2009 to 2014, average (per-capita) daily traveling times are
projected to grow over the next 25 years from 25.1 minutes/day to 28.9
minutes/day (15%). In 2015 Southern Nevada ranked 27th
in travel delay per
commuter among the nation’s large regions, and 42nd
in excess commuter
costs. High-growth suburban areas are forecast to experience significant
population, employment, and traffic increases, while the dominant form of
transportation for households continues to be the automobile. The RTC
addresses congestion by implementing a regional Congestion Management
Process (CMP) that identifies areas with recurring travel delays and tries to fix
them with a series of traffic operations and efficiency improvements before
building expensive new capacity.
Regional Transit System
The Regional Transportation Commission operates public transit for Southern
Nevada. The dominant forms of service provided are local bus routes, bus
rapid transit (BRT), park and ride/commuter services, and demand response
paratransit.
The RTC operates 30 residential bus routes and a variety of routes that
operate for special events. These routes provide roughly 78% of regional
transit ridership. Residential bus service utilizes different sizes of vehicle
depending on the route, and accesses HOV lanes and bus-priority technology
where available. The RTC has implemented Bus Rapid Transit on routes
running North-South from Downtown Las Vegas to the Las Vegas Strip, and
East-West on Sahara Avenue and Flamingo Road, and has express routes
serving Henderson, Boulder City, and the Northeast, Northwest and West
parts of the urban area. BRT and Express routes make up about 22% of
system ridership. Park and ride service uses parking lots or transit centers as
an origin and delivers workers to major employment centers. Demand
response paratransit service depends on contact initiated by the transit user,
and may run along fixed routes or implement route flexibility.
Park and ride lots provide alternative longer-distance commuting services
from 3 RTC-operated sites and 9 locations offered by RTC’s partners. A
related RTC program, Club Ride, provides employer-based incentives for
transit use, carpooling, and walking or bicycling to work. Combined, these
programs save regional congestion from an estimated 3,500 cars/day. These
commute alternatives result in 84% driving to work alone in the region.
Southern Nevada Transit System Snapshot Description Route Miles Annual Trips Annual Miles
Residential Bus Routes 23.2 miles 55.6 million 201.3 million
BRT and Express Routes 41.6 miles 4.1 million 16.9 million
Demand Response/Paratransit N/A 1.2 million 12.9 million
Total 64.8 miles 60.9 million 231.2 million
(Source: 2014 National Transit Database)
| ACCESS2040 23 |
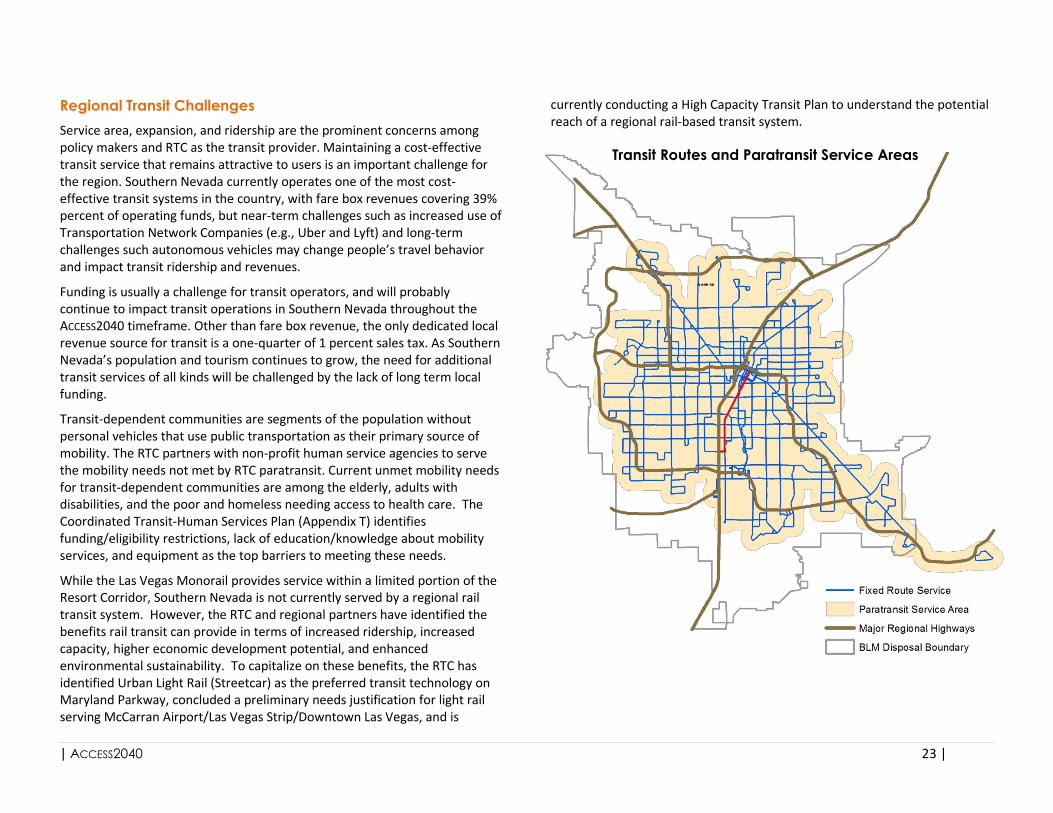
Regional Transit Challenges
Service area, expansion, and ridership are the prominent concerns among
policy makers and RTC as the transit provider. Maintaining a cost-effective
transit service that remains attractive to users is an important challenge for
the region. Southern Nevada currently operates one of the most cost-
effective transit systems in the country, with fare box revenues covering 39%
percent of operating funds, but near-term challenges such as increased use of
Transportation Network Companies (e.g., Uber and Lyft) and long-term
challenges such autonomous vehicles may change people’s travel behavior
and impact transit ridership and revenues.
Funding is usually a challenge for transit operators, and will probably
continue to impact transit operations in Southern Nevada throughout the
ACCESS2040 timeframe. Other than fare box revenue, the only dedicated local
revenue source for transit is a one-quarter of 1 percent sales tax. As Southern
Nevada’s population and tourism continues to grow, the need for additional
transit services of all kinds will be challenged by the lack of long term local
funding.
Transit-dependent communities are segments of the population without
personal vehicles that use public transportation as their primary source of
mobility. The RTC partners with non-profit human service agencies to serve
the mobility needs not met by RTC paratransit. Current unmet mobility needs
for transit-dependent communities are among the elderly, adults with
disabilities, and the poor and homeless needing access to health care. The
Coordinated Transit-Human Services Plan (Appendix T) identifies
funding/eligibility restrictions, lack of education/knowledge about mobility
services, and equipment as the top barriers to meeting these needs.
While the Las Vegas Monorail provides service within a limited portion of the
Resort Corridor, Southern Nevada is not currently served by a regional rail
transit system. However, the RTC and regional partners have identified the
benefits rail transit can provide in terms of increased ridership, increased
capacity, higher economic development potential, and enhanced
environmental sustainability. To capitalize on these benefits, the RTC has
identified Urban Light Rail (Streetcar) as the preferred transit technology on
Maryland Parkway, concluded a preliminary needs justification for light rail
serving McCarran Airport/Las Vegas Strip/Downtown Las Vegas, and is
currently conducting a High Capacity Transit Plan to understand the potential
reach of a regional rail-based transit system.
Transit Routes and Paratransit Service Areas

| ACCESS2040 24 |
Regional Bicycle and Pedestrian System
Bikeways are an integral component of the current and future regional
transportation system because they provide a multitude of benefits to the
region’s public health, quality of life, access to employment and recreational
opportunities, and safety. Southern Nevada currently has nearly 945 miles of
on-street bikeways and off-street, shared use paved and unpaved facilities.
The region is gaining momentum in creating facilities and destinations for
walking and bicycling, with improvements occurring throughout Downtown
Las Vegas, Henderson, and North Las Vegas, and major new facilities including
the River Mountains Loop Trail, the Las Vegas Wash Trail, and the CC-215
Beltway Trail. As the regional pedestrian and bicycle network expands, the
opportunity for all residents to take better advantage of these travel modes
also increases. The 2014 American Community Survey indicates that 3,500
people commute by bicycle in Southern Nevada, and 15,000 walk to work.
The Regional Bicycle and Pedestrian Plan sets out a vision and
recommendations for walking and biking to be a viable transportation and
recreation asset. Four goals identify what the plan hopes to achieve over
time, focusing on comfort and safety, access, education and encouragement,
and health and equity. (Appendix V; currently in draft form, but will be
incorporated into Access2040 when adopted in 2017).
Regional Bicycle and Pedestrian Challenges
Intermodal connectivity is vital to the success and further development of the
bicycle/pedestrian system. Where interaction takes place, it should be done
safely and effectively, both for the sake of the bicycle/pedestrian user as well
as the other mode.
Funding for bicycle/pedestrian improvements does not enjoy a dedicated
source, but exists rather as a set-aside amount or with improvements
embedded within larger projects. Increasing the transparency about what
projects will provide and what outcomes they are expected to accomplish
should help Southern Nevadans better understand how the RTC and partner
agencies are working to improve conditions for walking and bicycling
.
Southern Nevada Existing Bicycle Facilities

| ACCESS2040 25 |
Regional Freight Movement System
Another major function of the transportation system is to move goods and
services for commercial purposes. The freight industry plays an important
role in the economy of Southern Nevada, and is critical for most economic
development activities. Trucks carry most goods to, from, and within
Southern Nevada. Air cargo and rail carry fewer goods, but air cargo freight is
proportionally higher value, while rail freight is proportionally lower value.
Freight trucks move 39 million tons of import and export goods annually in
Southern Nevada, but trucks also distribute 40.5 million tons of goods within
Southern Nevada. The region’s roadway system provides facilities for this
commercial activity. Most truck activity occurs on freeways, highways and
arterials. The Interstate-15 corridor carries the most freight traffic, followed
by I-515/US-93, CC-215/I-215, and US-95. Arterial traffic primarily provides
connections to these more heavily traveled corridors. Improvements to these
most freight intensive roadways and infrastructure have potential to benefit
both commuters and trucking.
The main freight rail corridor in Southern Nevada is the Union Pacific Railroad
(UPRR) that generally parallels I-15, and connects to Los Angeles-Long Beach
and Salt Lake City. This route carries approximately 19 trains/day through the
region, with 22 grade-separated crossings, three at-grade crossings, a rail
yard, and an intermodal facility. Three branch/short lines connect to the
UPRR in Southern Nevada.
McCarran Airport continues to expand air cargo, with 210,000 square feet of
cargo and shipping facilities, serving about 100,000 tons of cargo per year.
Several hundred trucks pick up or deliver goods to the Air Cargo Center at
McCarran each day. This activity was in addition to the 42 million passengers
McCarran serves annually.
Pipelines constitute another form of transportation of goods and carry about
5.3 million tons of petroleum, valued at about $2.4 billion annually, to holding
tanks in the northwest part of the valley and at Apex Industrial Park. Tanker
trucks then distribute petroleum to fueling stations throughout the region.
Tanker trucks are on the road 24 hour/day because night shifts are more
productive for local fuel station deliveries, and because traffic impacts can be
minimized. A major natural gas pipeline is located along I-15, and is part of a
system connecting southwest Wyoming to Southern California.
The RTC completed the Southern Nevada Regional Goods Movement Master
Plan in 2015 (Appendix W). This plan provides a snapshot of Southern
Nevada’s freight transportation system, a forecast of future demand, freight-
related performance measures, and recommendations to address regional
freight deficiencies. The RTC is also conducting a study about freight
movement on arterials, and that plan will be incorporated into ACCESS2040
when it is completed. Other potential freight related projects may be
identified by the recently-adopted Nevada State Freight Plan.
Source: “Southern Nevada Regional Goods Movement Master Plan,” RTC, 2015

| ACCESS2040 26 |
Regional Freight Movement Challenges
Increasing demand on the transportation freight network will contribute to
increasing bottlenecks within the system. Sustaining access to transportation
infrastructure and manufacturing sectors within and through Southern
Nevada will be critical in ensuring economic competitiveness.
Similar to challenges confronting the roadway and transit systems, the
increase of suburban employment centers will result in the rise of suburb-to-
suburb commute patterns, compounding existing congestion, safety, and cost
of delivery issues for freight providers. Various types of obstacles may
constrain truck movements, including congestion, crash incidents, geometric
concerns, and policy issues. The Southern Nevada Regional Goods Movement
Master Plan includes a map of specific obstacle locations, recommended
infrastructure fixes, and performance measures that will allow the RTC to
assess progress related to freight movement.
A focus on addressing freight issues is a relatively new element of federal
planning requirements, and effectively incorporating freight mobility with the
other strategies of ACCESS2040 that are more concentrated on people-focused
outcomes of safety, travel efficiency, equity, and health may be a challenge,
although the RTC is committed to improving freight mobility and achieving
the benefits that will come from better freight movement.
Population and Jobs Forecast
ACCESS2040 updates regional planning assumptions regarding future
population and jobs. This supplied the planning process with a fresh
perspective on what to expect regarding future travel demand and service
area location. The population and employment growth forecast for the
Southern Nevada region is impressive. Population in households will grow
from 2.1 million in 2015 to 2.8 million by 2040, an increase of 700,000 new-
born, migrants and immigrants, or 34% population growth over the next 25
years. Employment will grow from 900,000 in 2015 to 1.3 million by 2040, an
increase of 350,000 workers, or 41% total employment growth over the next
25 years.
This level of growth will generate challenges for local and state government
planning, especially for transportation planning. One of the leading
transportation challenges will be how to deal with population and
employment decentralization (See maps on following page), as population
growth occurs on the edges of the urbanized area and job growth is
distributed across the region. Additional top anticipated transportation
challenges are how to serve an aging population and how to minimize impacts
of increasing school enrollment and associated drop-off/pick-up trips.
Merely knowing the size of the population does not adequately address the
various travel needs a region has. Technical analysis of the status and nature
of the population today and in 2040 gives a more full impression of future
travel demand and current transportation system performance. Furthermore,
federal regulations require analysis to determine the fair treatment of all
segments of the relevant population, regardless of nature or degree of
diversity. The Regional Transportation Commission’s planning area 53.5%
minority or Hispanic, making the region a “majority minority” region. Almost
16% of Southern Nevada’s population lives at or below the poverty level, and
ACCESS2040 Demographic Projections Measure 2015 2040 2015-2040 Change
Total Population 2,081,786 2,785,540 703,754 33.8%
Number of Households 759,316 996,674 237,358 31.3%
Total Jobs 900,769 1,267,966 367,197 40.8%
K-12 School Enrollment 318,620 462,202 107,582 33.8%
(Source: RTC Planning Variable Methodology Report, March 2016)

| ACCESS2040 27 |
almost 17% of adults over age 25 have less than a high school education.
Regionally, an average of 8.5% of households does not have a car, which is
overwhelmingly the primary mode of transportation to work in the region.
More than 7% of Southern Nevada’s population does not speak English
proficiently, and more than 12% of the region’s population is over 65 years
old. These statistics reveal a widely diverse population, all with distinct
transportation needs according to their life-situation. This reality has been
considered in the drafting and implementation of ACCESS2040. The plan
demonstrates compliance with regulations regarding Title VI and
Environmental Justice based on the analysis completed in Appendix C.
Population Change in Southern Nevada,
2015 to 2040
Employment Change in Southern Nevada,
2015 to 2040

| ACCESS2040 28 |
Percent Change in Travel Demand in Southern Nevada
2015 to 2040 Travel Forecast
Forecasting travel patterns in the future reveals the adequacy of planned
investments in confronting current trends and future needs. It is calculated
based on the expected changes in geographic location, size, and mobility of
population and employment. Also, it takes into account the diversity
presented in the previous section. For example, if all the region’s zero-car
households were forecasted to locate in one specific area, plans directing
relevant services should be adapted accordingly.
Most areas of Southern Nevada will experience increased travel over the next
25 years. Driven by growth of housing, jobs, shopping, and schools, driving
time will increase from 877 thousand hours on average weekdays to 1.3
million, an increase of 54 percent. Vehicular travel will increase from 36.2
million vehicle miles of travel on an average weekday to 53.6 million, an
increase of 48 percent. Travel patterns will also continue to change during the
ACCESS2040 planning period. As growth in suburban and rural areas continues,
travel to, from or within the area outside the Beltway (CC-215/I-215) will
represent about 46% of all new trips. The largest concentrated increase in
travel, however, will be additional trips occurring to, from, or within the
Resort Core area, which currently accounts for about 20% trips, but will
generate roughly 25% of new trips.
Although the Resort Core area constitutes the highest density of jobs in
Southern Nevada, growth of employment outside of the Resort Core has led
to additional commuting in traditionally non-peak directions on many of the
regions highways and arterials. This trend is forecast to continue over the
next 25 years, and will impact reverse direction peak travel volumes on most
major corridors in the region. Although the development of employment
centers in formerly suburban (or rural) areas leads to effective use of major
road capacity by balancing trip directions, it presents new challenges for
efficiently serving suburban destined commuters with competitive transit
alternatives.
ACCESS2040 Travel Forecast Summary Measure 2015 2040 2014-2040 Change
Daily Trips 8.4 million 11.1 million 2.7 million 33%
Daily Vehicle Hours Traveled 877,000 1.3 million 471,000 54%
Daily Vehicle Miles Traveled 36.2 million 53.6 million 17.4 million 48%
Daily Transit Trips 231,000 325,000 94,000 41%
Total Population 2,096,711 2,800,465 703,754 33.8%
Per-Capita Daily Travel Time 25.3 min 29.0 min 3.7 min 15%
Per-Capita Daily VMT 17.4 miles 19.2 miles 1.6 miles 10%
(Source: RTC Travel Demand Model, November 2016)

| ACCESS2040 29 |
Regional Transportation Focus Areas
One significant input for developing Access2040 was the Southern Nevada
Strong Regional Plan, which was adopted by all local governments in
Southern Nevada, and is being implemented by the RTC. The SNS Vision Map,
which identifies major activity centers for Southern Nevada, is shown below.
Access2040 translates those activity centers, along with the population and
jobs distributions presented earlier, into a set of Strategy and Accessibility
Focus Areas, which are shown in the map below. In addition to projects being
identified by their relationship to the primary Access2040 strategies, projects
that address transportation issues in each of these corridors are also
identified.
Southern Nevada Strong Vision Map
Focus Area Type
Resort Core Access
Primarily Regional Access
Primarily Local Access
Note: Descriptions and funding levels for
these focus areas are provided in the
“Summary of Investment Strategies” section,
later in this Plan.
ACCESS2040 Strategy and Accessibility Focus Areas

| ACCESS2040 30 |
Access2040 Investment Program
While the regional vision represents an ideal level of investment, ACCESS2040
applies today’s fiscal reality: federal revenues, those most susceptible to
income from the federal gasoline tax, have steadily decreased in recent years.
Meanwhile, expenditures (including bond payments) have remained steady at
approximately $220 million dollars annually. The gap in investment has been
bridged by local revenue sources primarily consisting of indexed local fuel
taxes, which provide about 46% of revenue for transportation investments in
Southern Nevada over the next 25 years.
Reasonably Available Revenue
Reasonably available revenue is estimated by the US Department of
Transportation, Nevada Department of Transportation estimations, and
annual financial reports from the RTC, as well as trends related to debt
financing and regional revenues. The total estimated revenue over the course
of the ACCESS2040 planning period is approximately $13.6 billion.
Most transportation revenue is generated based on the concept of “user
fees,” where taxes are collected from the users of the transportation system,
roughly in proportion to how much they use the system. Currently, fuel taxes
are the most feasible means for collecting a user fee-type revenue source.
Federal revenues are provided by the Highway Trust Fund, which is based
primarily on the federal fuel tax of 18.4 cents per gallon of gasoline, and has
not been adjusted since 1991. State Highway Revenues refer to taxes
assessed on the sale of gasoline at a fixed-rate of 18.455 cents on every
gallon. Local fuel tax revenues in Southern Nevada, called the “Motor Vehicle
Fuel Tax,” (MVFT) have multiple components: a base amount of 15.35 cents
per gallon, plus an amount indexed to inflation, which currently adds 10 cents
per gallon. (Note: On November 8, 2016, Southern Nevadans approved a
continuation of MVFT indexing, which will add approximately 3.5 cents per
gallon each year for the next ten years. That result is not incorporated into
ACCESS2040, but will be incorporated into a plan revision anticipated in 2017.)
These taxes are dependent on fuel consumption and – with the exception of
MVFT in Southern Nevada – have not been adjusted since 1991. Increases in
vehicle fuel efficiency and a lower rate of VMT growth will impact total
revenues generated from this source during the planning horizon. The
average fuel efficiency of the light vehicles is forecast to increase from about
21 miles per gallon (MPG) in 2012 to about 29 MPG in 2040. When compared
to the RTC’s 2013-2035 Regional Transportation Plan, revenues from federal
and state sources are down significantly, while the local fuel tax revenue
share of the regional total increases from 20 percent to about 46 percent.
This trend is consistent with the overall funding outlook nationally for
transportation – that without new revenue sources, federal and state
revenues are projected to decrease in absolute and relative terms in the
future.
Summary of Investment Strategies
Access2040 implements the four primary strategies (Improve Safety, Manage
Congestion, Enhance Multimodal Connectivity, and Maintain Current
Infrastructure) by funding transportation projects that are intended to
advance one or more of those strategies and achieve outcomes that improve
conditions for Southern Nevadans, as expressed by the indicators described
earlier and in Appendix I. In addition, investments are identified by how they

| ACCESS2040 31 |
address the overall Access2040 Strategy and Accessibility Focus Areas.
Remaining investments fit within the overall regional investment program,
which may include projects from prior plans that remain funded in
ACCESS2040.
The primary strategy investment categories are listed first, followed by
regional focus area investment programs. This presentation format allows
Southern Nevadans to understand what the Access2040 Investment Program
is intended to accomplish, providing transparency and accountability.
Because the goal of an outcome-based transportation plan, such as
Access2040, is to identify what the overall plan is intended to accomplish,
rather than focus on specific project engineering decisions, this structure
further allows project sponsors flexibility to adjust minor details of their
project without compromising the representative integrity of ACCESS2040. In
many cases, especially for projects not planned for construction for 20 years,
exact future conditions are not known, and it may be necessary to update
certain aspects of the plan. By representing related investments as programs,
and summarizing major investments by strategies and focus areas, the public
can be aware of future changes, while local agencies can adapt to the
unexpected. The summarized costs shown have been estimated based on the
ACCESS2040 fiscal model, previous history, and total cost estimates submitted
by project sponsors.
Strategy-Based Investments
Access2040’s major investment approach is to select and fund projects that
directly address one or more of the four primary strategies identified earlier.
The following chart shows how approximately $13.4 billion will be invested
during the ACCESS2040 25-year implementation period. Funding over the next
four years – the High-Priority Program – is shown separately, so that readers
can see which strategies the RTC and local agencies are targeting for the most
immediate planning period.

| ACCESS2040 32 |
Access2040 Strategy and Accessibility Focus Area
Investments
Access2040 projects that impact the Strategy and Accessibility Focus Areas
are identified in the table below. These projects address the four Access2040
Primary Strategies in these general areas, or they help provide increased
accessibility to the places people need or want to go (an ACCESS2040
Secondary Strategy) along or within those broad areas. These Focus Areas
were developed based on existing local plans and from analysis of the
Southern Nevada Strong Regional Plan. Appendix A provides project details
for every project in the ACCESS2040 Improvement Program, and identifies
strategies and focus areas addressed by each.
Label Access2040 Focus Area Total A Access to/from/within core area $1.5 billion
B Northeast valley & UT access to core area $234 million
C Southeast valley & AZ access to core area $48 million
D Southern valley & CA access to core area $187 million
E North-south access along western valley $10 million
F Northwest valley to core area $448 million
G North Las Vegas access to/from south & internal $93 million
H Northern valley east/west access $58 million
I Eastern valley access to/from core & internal $76 million
J West Henderson access to/from core & internal $61 million
K Access to/from southwest valley $97 million
L West side of valley east/west access & internal $95 million
N/A Not Allocated to a Focus Area $7.7 billion
N/A Not Allocated – Debt Service $2.9 billion
TOTAL $13.4 billion
Regional Investment Program – Uncategorized Projects
Because the transparent and accountable planning process is new for
Access2040, some projects that were previously included in an RTC plan or
funded project list (the 2013 Regional Transportation Plan, the 2015
Transportation Improvement Program, or the 2016 Capital Improvement
Program) have not yet been classified by strategy or accessibility priority.
These remaining projects of the fiscally constrained ACCESS2040 Investment
Program are therefore not identified by strategy or focus area, but are still
continued for funding. RTC will continue a process to assess these projects so
that they are accurately categorized by the anticipated Access2040 revision
ACCESS2040 Strategy and Accessibility Focus Areas

| ACCESS2040 33 |
later in 2017. Although not identified by their relationship to Access2040 and
their expected contribution to Southern Nevada, these projects still serve the
region by providing improvements to the transportation system, and include
projects that should improve safety, help manage congestion, improve
connectivity, and help maintain current infrastructure.
Most transit expenditures fall within this category as well, including: the
regional vanpool program; ADA accessibility and paratransit service;
preventative maintenance, enhancements, and replacements to the bus and
rail systems and vehicles; IT system improvements; and improvements to
passenger shelters, facility maintenance, transit centers, and Park & Rides.
Analysis of the ACCESS2040 Investment Program
Comparing the transportation impacts of implementing the ACCESS2040
Investment Program to a future without the additional infrastructure
Access2040 would provide allows an initial assessment of the impacts of
Access2040 on key travel indicators. The following table provides the critical
measures for this comparison. Overall, making the set of investments
identified in Access2040 leads to 18 fewer minutes each resident spends
driving or riding on a typical weekday, and 0.4 fewer miles driven than if the
investments weren’t made. Another way of looking at this, average time
spent driving will increase from 25 minutes per day in 2015 to 29 minutes in
2040 with Access2040 investments, but would increase to 47 minutes without
them. This time saving provides Southern Nevadans with more time available
for activities that can be more enjoyable or productive than driving or
commuting. Similarly, driving fewer miles generates additional benefits for
residents, including less money spent on fuel, vehicle operating costs, and
maintenance, as well as reduced exposure to risks of traffic crashes.
Overall, the RTC’s analysis of future travel conditions projects a 48% increase
in both cumulative travel time and vehicle miles traveled between 2015 and
2040. These increases can be mapped across different geographical regions to
provide a better picture of how Southern Nevada will change over the next 25
ACCESS2040 Build vs. No-Build Summary No-Build Build Difference PCT
Per-Capita VHT/day (2040) 47.2 min. 28.9 min. -18.3 min/day -39%
Per-Capita VMT/day (2040) 19.5 miles 19.1 miles -0.4 miles -2%
ACCESS2040 Primary Strategies and Investment Levels
Improve
Safety
Manage
Congestion
Enhance Multimodal
Connectivity
Maintain Current
Infrastructure Uncategorized Total
High Priority Projects (1-4
years; Federal Funds) $58.0 million $320.7 million $63.9 million $89.6 million $231.3 million $763.4 million
High Priority Projects (1-4
years; Locally-Collected Funds) $4.3 million $27.9 million $63.8 million $4.8 million $127.6 million $228.3 million
Medium Priority Projects (5-10
years; Fed’l Funds) $65.0 million $477.0 million $113.6 million $47.2 million $210.3 million $913.1 million
Medium Priority Projects (5-10
years; Local Funds) $4.5 million $169.1 million $199.1 million $171.8 million $683.6 million $1.4 billion
Long-Term Projects (11-20
years, Fed’l Funds) $322.0 million $1.6 billion $291.4 million $863.0 million $1.0 billion $4.1 billion
Long-Term Projects (11-20
years, Local Funds) $785.6 million $548.4 million $740.0 million $752.8 million $256.5 million $3.1 billion
TOTAL $1.4 billion $3.2 billion $1.5 billion $1.9 billion $2.5 billion
(+$2.9 Billion debt service) $10.5 billion
($13.4 Billion w/debt service)
Additional Unfunded Projects
(20+ years) ~$135 million $1.5 billion $903 million $453 million $2.7 billion $5.7 billion

| ACCESS2040 34 |
years. For this, Southern Nevada was divided into four geographic area types,
which are presented on the following map. These zones comprise most of the
region’s travel activity, and capture travel statistics in a convenient way. The
map’s legend identifies the percent change in total travel time (Vehicle Hours
Traveled) in each of these area types.
With much growth in travel activity occurring further away from the historic
regional core of the Resort Core area and downtown Las Vegas, local
stakeholders should take note of the appropriate ACCESS2040 programs and
strategies. This trend is emphasized by comparable data regarding the
location of population growth in the year 2040. Analysis suggests much of the
future regional growth will be concentrated outside the CC-215/I-215
Beltway, especially in relation to current regional population share.
The Access2040 Investment Program will add approximately 1,300 new lane
miles to the regional road system (highways, arterials, and collectors), an
increase of 18%. At the same time, VMT is projected to increase a total of
48%, meaning that roads will become more crowded, although with the
targeting of improvements on the ACCESS2040 strategies, roads should also
function more efficiently.
The expected disparity between growth in travel activity and the amount of
feasible road expansion, along with other reasonably-anticipated future
transportation developments such as expected shifts in travel behavior
resulting from increased use of Transportation Network Companies (e.g.,
Uber, Lyft, etc.) and eventual adoption of autonomous vehicles, indicate a
need for the RTC to continue evaluating the Access2040 Plan and Investment
Program on a regular basis. These challenges may lead to new solutions or
ways of addressing the 4 primary strategies of Access2040. For example, new
congestion management methods may be developed that enhance overall
mobility, accessibility, and safety. Also, because high capacity transit has a
significantly higher carrying capacity than highway lanes serving
predominantly single occupant vehicles, it could help to alleviate future
challenges. Emerging technologies over the next 25 years – such as
autonomous vehicles –may also play a role in negating the disparity between
increasing travel activity and additional capacity. Addressing this disparity,
however, is at the core of the “Manage Congestion” ACCESS2040 strategy and
the Congestion Management Process, both of which the RTC and regional
partners will work to implement over the next 25 years.
ACCESS2040 Infrastructure Summary (lane-miles) Lane-mile category 2015 2040 Change PCT
Freeways and Highways 1,275 miles 1,620 miles +345 miles +27%
Arterials 4,205 miles 5,086 miles +882 miles +21%
Collectors 1,695 miles 1,776 miles +81 miles +5%
Total 7,174 8,482 +1,308 +18%
Avg. daily VMT per lane-mile 4,581 VMT 5,777 VMT +1,196 VMT +26%
Percent Change in Total Travel Time
2015 to 2040
+50% CBD
+43% Resort Corridor
+46% Urban
+110% Suburban

| ACCESS2040 35 |
Air Quality Conformity Determination
Southern Nevada is currently designated “nonattainment” for federal Carbon
Monoxide (CO) and Particulate matter 10 microns or smaller (PM10)
standards under the Clean Air Act. As a consequence, the State must develop
a plan which demonstrates how emissions critical to the formation of ground-
level ozone will be reduced to achieve federal air quality standards. This plan
is known as the State Implementation Plan, or “SIP.” Transportation
conformity is the process that links the SIP with ACCESS2040 and the RTC’s
transportation planning and project funding.
Conformity is demonstrated when the projected regional emissions from on-
road vehicles are less than emissions budgets for on-road vehicles contained
in the State Implementation Plan. In addition, ACCESS2040 must support the
timely implementation of specific transportation control measures designed
to reduce on-road emissions. A conformity determination demonstrates that
implementation of ACCESS2040 will not cause any new violations of the air
quality standard, increase the frequency or severity of violations of the
standard, or delay timely attainment of the federal standard interim goals1.
ACCESS2040 has demonstrated conformity with the guidelines and limitations,
as shown in the table below. See Appendix E for more detail. For each year
calculation is required, the forecast measures for both Carbon Monoxide (CO)
and Particulate Matter (PM10) fall below the budgets set for the region. Both
CO and PM10 are known to be detrimental to general air quality and the
health of the environment and Southern Nevada residents and visitors.
ACCESS2040 Air Quality Conformity Results Year CO Budget CO (modeled) PM10 Budget PM10 (modeled)
2015 686 268 ���� 141.41 41.40 ����
2020 704 207 ���� 141.41 48.97 ����
2023 -- -- 141.41 51.87 ����
2030 704 134 ���� 141.41 58.65 ����
2040 704 101 ���� 141.41 60.39 ����
The Environmental Protection Agency released new standards for Ozone (O3)
in 2015. The RTC and the Clark County Department of Air Quality project that
much of Southern Nevada will initially not be in conformity with that new
standard, but there are no anticipated immediate impacts and the RTC
expects the region will be in conformity by 2022.
Fiscal Constraint Analysis
Fiscal constraint analysis is performed as part of the regional planning process
to exercise prudence in planning for the transportation future of Southern
Nevada. Revenues for future investment are not limitless, and proper
governance requires a conservative fiscal approach when considering which
improvements are necessary, and in what timeframe. Federal regulations
establish this principle into an enforceable requirement of every update of
the RTC’s Regional Transportation Plan.
Practically, the analysis to demonstrate fiscal constraint limits the total
investment by ACCESS2040 to reasonably expected revenues from a
combination of sources. The RTC estimated revenues and expenditures
through the year 2040, including federal, state, and local revenue sources.
Expenditure estimates include construction, operating, and maintenance,
divided into the four primary Access2040 strategies or unassigned into a
category.
ACCESS2040 Fiscal Constraint Summary Revenue
Source
Anticipated
Revenue
Expenditure
Category
Funding
Level Federal - Highways $1.9 billion Increase Safety $1.4 billion
Federal - Transit $1.4 billion Manage Congestion $3.2 billion
State* $3.2 billion Improve Connectivity $1.5 billion
Local Fuel Tax $4.6 billion Maintain Infrastructure $1.9 billion
Local Sales $1.6 billion Uncategorized** $2.5 billion
Private Sources $931 million Debt Service $2.9 billion
TOTAL $13.6 billion TOTAL $13.4 billion
* State funds include state-programmed
Federal funds ** Uncategorized projects include mostly RTC
Transit Investments
As shown in the table above, ACCESS2040 expenditures are less than
anticipated revenue over the life of the plan. Estimates of reasonably
available revenue for investment include Federal Highway Trust Fund
revenues, State-administered funds, locally-collected sales tax, and locally-
collected Motor Vehicle Fuel Tax (MVFT), which includes the first 3 years of
fuel tax indexing. (Access2040 does not include results of the November 2016
Question 5 ballot measure, which will add approximately $3 billion in
available revenue and expenditures. Access2040 will be revised later in 2017

| ACCESS2040 36 |
to incorporate results of that decision.) See Appendix F, “Fiscal Constraint,”
for more detail.
Future Vision and Unfunded Projects
Not all potential projects identified by stakeholders through the ACCESS2040
planning process are included in the ACCESS2040 Investment Program. Many
of the improvements with the most potential to change “transportation” as
we know it today are outside the reach of available investment dollars –
making them “unfunded” with respect to this plan.
These unfunded projects or programs come from more than 15 studies
assisted by the RTC as well as local governments and state and local
transportation agencies. It also includes projects that were removed from
previous plans due to fiscal constraint.
Examples of ACCESS2040 unfunded projects that support the long-term
transportation future for Southern Nevada include:
• $3 billion in projects that will be funded by an extension of local Fuel
Revenue Indexing that Southern Nevada voters approved on
November 8, 2016. Based on the results of this election, the RTC
anticipates a comprehensive revision of ACCESS2040 sometime in
2017 to incorporate these projects and shift other projects’ timing
and priority.
• High Capacity Transit network reflecting the most recently completed
Las Vegas Valley Transit System Development Plan from 2002. That
plan identified many investment priorities that have been
successfully implemented by the RTC and regional partners: Bus
Rapid Transit on Sahara Avenue, Flamingo Road, and Boulder
Highway, and express routes on U.S. 95 and Summerlin Parkway, and
a more detailed analysis of which transit technology is appropriate
for Maryland Parkway. The RTC has initiated a new development
process to update the High Capacity Transit Plan to understand the
potential reach, and the necessary land use changes to support, of a
regional rail-based transit system.
• Significant investment in major travel corridors serving both
residents, visitors, and freight such as the completion of the
Interstate-11 route through or around Las Vegas and connecting to
the Northwest,
• A completed network of more than 1,900 miles of local streets at the
collector and arterial levels. The Regional Plan for Streets and
Highways is currently being revised, and will be included as Appendix
P when completed in 2017; and
• A robust, interconnected pedestrian/bicycle network of more than
879 new miles of facilities, for a total of 1,719 miles.
Future updates to ACCESS2040 will need to consider how to advance the
regional system closer to this vision.
Future & Ongoing ACCESS2040 Planning Process
ACCESS2040 represents a change for how the RTC conducts and presents
planning activities. Although regional transportation plans such as ACCESS2040
are required to receive updates every four years, the RTC will treat it like a
living document so that it is regularly updated as new studies or plans are
completed. This will maximize the benefits to Southern Nevadans of the
transparent and accountable planning process established by the RTC.
The latest version of ACCESS2040 will always reflect the latest
recommendations, related plans, current project details, and planned
investments for advancing the vision and goals for Southern Nevada’s
transportation system. The Access2040 document will be updated at least
annually, with Air Quality updates whenever changes to the Investment
Program trigger new conformity analyses.
Studies or Plans currently anticipated for future adoption into ACCESS2040
updates or revisions:
• Regional Bicycle and Pedestrian Plan (expected completion in 2017)
• Boulder Highway Multimodal Transportation Investment Study
• Truck Arterial Route Study
• Northeast Valley Transportation Network Study
• UPWP studies that will help further implement ACCESS2040,
