regulatory processes in aspergillus niger - orbit.dtu.dk · i summary filamentous fungi are...
TRANSCRIPT

General rights Copyright and moral rights for the publications made accessible in the public portal are retained by the authors and/or other copyright owners and it is a condition of accessing publications that users recognise and abide by the legal requirements associated with these rights.
Users may download and print one copy of any publication from the public portal for the purpose of private study or research.
You may not further distribute the material or use it for any profit-making activity or commercial gain
You may freely distribute the URL identifying the publication in the public portal If you believe that this document breaches copyright please contact us providing details, and we will remove access to the work immediately and investigate your claim.
Downloaded from orbit.dtu.dk on: Aug 24, 2019
Regulatory processes in Aspergillus niger
Poulsen, Lars
Publication date:2012
Document VersionEarly version, also known as pre-print
Link back to DTU Orbit
Citation (APA):Poulsen, L. (2012). Regulatory processes in Aspergillus niger. Department of Systems Biology, TechnicalUniversity of Denmark.

i
Regulatory processes in Aspergillus niger
Lars Poulsen
Ph. D. Thesis
October 2012

ii

iii
Regulatory processes in Aspergillus niger
Ph. D. Thesis
Lars Poulsen
Department of Systems Biology
Technical university of university of Denmark
Supervisors
Assoc. Prof. Jette Thykær
Assoc. Prof. Anna E. Lantz

iv

v
“The first step towards getting somewhere is to decide that you are not going to stay where you are.”
- John Pierpont Morgan

i

i
Summary
Filamentous fungi are extensively used in the fermentation industry for synthesis of numerous products.
One of the most important, is the fungus Aspergillus niger, used industrially for production of organic acids,
and homologous as well as heterologous enzymes. This fungus has numerous of advantages, including
tolerance for low pH, which is important for acid production. Furthermore, it has the capability of
metabolizing a wide variety of carbon sources, possesses an exceptional efficient protein secretion
capacity, and three genome sequences are publicly available. However, A. niger have some disadvantages
as well, those are byproduct formation, secretion of proteolytic enzymes and formation of mycotoxins. The
aim of this project was to reduce these disadvantages, though investigating the regulatory processes.
The first objective was to study the regulatory events leading to A. niger’s citric acid overflow metabolism.
This was done with analysis of both transcriptome and proteome profiles, from cultivations in manganese
limitation and manganese excess conditions. Beside already described responses, that were used to verify
the experimental setup, identification of novel events was done. The most interesting was the strong down
regulation of phosphoenolpyruvate carboxykinase (PEPCK) at manganese limited conditions that could be
one of the main initiators for the citrate overflow metabolism.
To gain further insight into A. niger’s metabolism, a new metabolic engineering tool, termed transcription
factor modulation was developed. Using this approach, two novel mutants were isolated and formed the
basis for the following studies.
Through knock out studies of putative trans-acting pH responding transcription factors, a mutant exhibiting
an oxalate overproducing phenotype was identified and entitled Oxalic Acid repression Factor, OafA. This
mutant was physiological characterized in details, using continues cultivation (chemostats), followed by
transcriptional analysis. Two phosphoketolases were found to be down-regulated in the ΔoafA mutant and
it was argued, that this was the main cause, for the increase oxalate formation.
From similar knock out studies, another mutant was identified and this strain was shown to be a protease
mutant and the responsible transcription factor was entitled Protease Regulator B, PrtB. This was
compared against the already described, protease deficient strain, ΔprtT. The physiological batch
characterization showed that the ΔprtT strain had the lowest protease activity (fivefold reduced), but also
featured excessive CO2 yield, reduced growth rate and lower biomass yields. The ΔprtB strain had a close to
twofold reduced levels of secreted proteases but with additional beneficial characteristics, as a lower oxalic

ii
acid formation and wild type growth performance; it was therefore argued that this strain could be an
attractive alternative to ΔprtT.
Finally, in order to characterize the formation of the carcinogenic mycotoxin fumonisin, a reporter strain of
A. niger was constructed, where the promoter from the fumonisin synthase was fused to the green
fluorescent protein. This strain was used together with the commercial large-scale nutrient profiling
platform, Biolog Phenotype MicroArrays. Out of the 476 conditions tested, six compounds significantly
induce fumonisin production, identified. These formed the basis for the subsequent examinations, which
resulted in the identification of azelaic acid, a plant hormone and a very potent fumonisin inducer.
iii
Dansk Resumé
Skimmelsvampe anvendes i stort omfang i fermenteringindustrien, til at producere en række forskellige
produkter. En af de vigtigste er svampen Aspergillus niger, som anvendes til industriel produktion af
organiske syrer og homologe samt heterologe proteiner. Denne svamp har en række fordele, heriblandt
tolerance for lav pH, hvilket er vigtigt når den anvendes til produktion af organiske syrer. Ydermere, kan
den metabolisere en bred vifte af kulstofsklider, udskille proteiner i store mængder samt der er tre
offentlig tilgænglige genom sekvenser. Men A. niger har også ulemper, heribland dannelse af biprodukter,
udskillelse af proteolytiske enzymer og dannelse af mykotoxiner. Målet med dette projekt er at reducere
disse ulemper, via studier af de regulatoriske processer.
Det første mål var at undersøge de regulatoriske hændelser der forårsager citron syre overflow i A. niger’s
metabolisme. Dette blev udført via analyser af både transkriptom- og proteomprofiler, fra mangan
begrænsede og mangan overskuds kultiveringer. Udover identifikation af allerede beskrevne processer,
som blev anvendt til at verifice den eksperimentelle setup, blev nye og ukendte respons også identificeret.
Det mest interessante af disse var en kraftige nedregulering af phosphoenolpyruvate carboxykinase
(PEPCK) i de mangan begrænsede kulturer, som kunne være en af de primære igangsættere af citronsyre
produktionen.
For at få en udvidet forståelse af A. niger’s metabolisme, blev et nyt ”metabolic engineering” værktøj
udviklet, betegnet transkriptionsfaktor modulering. Med anvendelse af denne fremgangsmåde, blev to nye
mutanter identificeret og disse dannede grundlaget for de efterfølgende undersøgelser.
Med ”knock out” studier af formodet trans bindende pH reagerende transkriptionsfaktore, blev en
transkriptionsmutant, der udviste en oxalsyre overproducerende fænotype, identificeret og efterfølgende
navngivet Oxalic Acid repression Factor, OafA. Denne mutant blev fysiologisk karakteriseret vha.
Kontinuerte gæringer (kemostater), efterfulgt af transkriptionsanalyse. To phophoketolaser blev fundet
opreguleret i ΔoafA mutanten og derfor ansås dette respons at være den primære årsag, for den forøgede
oxalsyre produktion.
Fra lignende “knock out” studier, blev en yderligere mutant identificeret og denne viste sig at være en
protease deficient mutant. Den ansvarlige transkriptionsfaktor blev navngivet Protease Regulator B, PrtB.
Denne blev sammenlignet med en allerede beskrevet protease deficient stamme, ΔprtT. Fysiologiske batch
karakteriseringer, viste at ΔprtT stammen, havde den laveste protease aktivitet (femfold reduceret), men
udviste også en forøget CO2 produktion, reduceret vækst rate samt lavere biomasse udbytte. ΔprtB
iv
stammens protease aktivitet var reduceret tofold, i forhold til vildtypen men udtrykte ydereligere
fordelagtige karakteristika, så som lavere oxalsyre produktion samt vækst på vildtype niveau. Det blev
derfor argumenteret for at denne stamme kunne være et attraktivt alternativ til ΔprtT.
Endeligt, for at karakterisere dannelsen af det kræftfremkaldende mykotoxin fumonisin, blev en
rapportørstamme af A. niger konstrueret, hvor promotoren fra fumonisinsyntasen var fusioneret med det
grønne fluorescerende protein. Denne stamme blev anvendt sammen med den kommercielle stor skala
platform, ”Biolog Phenotype MicroArrays”. Ud af de 476 forhold undersøgt, fandtes seks stoffer der
signifikant inducerer fumonisin produktionen. Disse dannede grundlaget for de efterfølgende
undersøgelser, som resulterede i opdagelsen af azelaic syre, et plantehormer og en yderst potent fumonisin
inducer.

v
Preface
The work presented in this thesis was performed between October 2009 and October 2012 at the Center
for Microbial Biotechnology, Department of Systems Biology, Technical university of Denmark (DTU). The
PhD study was a part of CMB’s IVC (Ingeniør-Videnskabelige centre) supported by the Danish Resarch
Council for Technology and Production. The work was supervised by associate professor Jette Thykær and
associate professor Anna E. Lantz.
I wish to express my sincere gratitude to my supervisor Jette Thykær, I am thankful for the excellent
supervision, guidance and daily scientific support. I will also like to thank Anna E. Lantz, my co-supervisor,
for giving me the opportunity to carry out my Ph.D study at CMB and for her support and for the valuable
scientific discussions.
Through Jette I came in touch with Scott E. Baker of the Pacific Northwest National Laboratories in
Rihcland, WA, USA, who gave me the opportunity for a three month research stay. Here I met Ellen Panisko
and Beth Hofstad that introduced me to the sample preparation required for proteome analysis. I am very
grateful for getting to know you and despite our many differences, I will look back with smiles to our many
conversations during our lunch and dinner dates.
Furthermore, I would like to thanks all my students, for their hard work and dedication. Especially Jens
Christian Nielsen and Gerit Nymschefsky, that both showed a great personal drive and talent for making
good research.
To all my CMB colleagues, I would like to thank you for making CMB a fun and stimulating place to work. I
especially wish to thanks for following: Tina Johansen for excellent technical assistance and an incredible
ability to solve problems, Martin Nielsen for hours of electrical assistance, especially during fermentations,
Stig Rattleff for always providing peace, claim and candy, at the office, Simon Carlsen for your never ending
spree of often funny “uncle humor” jokes, Paiman Khorsand-Jamal for all many Mexibar events and happy
moments, Peter Knudsen, Tomas Strucko and Martin Schalén for improving the daily life CMB, Dorte M.
Koefoed for the construction of two A. niger mutants and for forgiving me, injuring her, at Christmas party,
Philippe Holt for his interesting views, Jakob B. Nielsen and Rasmus Frandsen for always having time, to
more or less obscure scientific discussions, Mikael R. Andersen for helping with data analysis and for his
work founding the basis to my project, Anne N. Johansen for always being helpful, Birgitte Karsbøl for our
shared tea compassion, Kristian F. Nielsen for all the LC-MS analyses, Taja Andersen for always smiling and

vi
learning my name is not Magnus, Aleksej Zelezniak for introducing me to the world of degtinė and Anna-
Lena Heins for making the days at CMB better with great conversations and procrastinations.
Big Thanks to all my family and friends, who have giving their supported all through my Ph.D study and
reminded me of the existences of the important things besides work. Especially thanks to Kasper, Christina
and Julie!
Finally, I would like to thank my wife Lexy, for the all the love, patiences and understanding she has given
me.

vii
Publications
The results presented in this thesis have formed the basis for the following articles and manuscripts:
Poulsen L, Andersen MR, Lantz AE and Thykaer J. Identification of a transcription factor controlling pH-
dependent organic acid response in Aspergillus niger. PLoS One 2012 (Accepted).
Poulsen L, Dai Z, Panisko EA, Lantz AE, Bruno KS, Daly DS, Nielsen J, Baker SE, Thykaer J. Transcriptome and
proteome analysis of the correlation between citric acid formation and manganese limitation in Aspergillus
niger. Appl Environ Microbiol (Submitted).
Poulsen L, Nielsen, JC, Lantz AE, Thykaer J. Identification and characterization of a transcription factor
regulating extracellular proteolytic activity in Aspergillus niger. (Manuscript in preparation).
Poulsen L, Thykaer J, Nielsen, KF. Nutrient profiling reveals potent inducers of fumonisin biosynthesis in
Aspergillus niger. (Manuscript in preparation).
Furthermore a minor contribution was given to the following article:
Andersen MR, Salazar MP, Schaap PJ, van de Vondervoort PJ, Culley D, Thykaer J, Frisvad JC, Nielsen KF,
Albang R, Albermann K, Berka RM, Braus GH, Braus-Stromeyer SA, Corrochano LM, Dai Z, van Dijck PW,
Hofmann G, Lasure LL, Magnuson JK, Menke H, Meijer M, Meijer SL, Nielsen JB, Nielsen ML, van Ooyen AJ,
Pel HJ, Poulsen L, Samson RA, Stam H, Tsang A, van den Brink JM, Atkins A, Aerts A, Shapiro H, Pangilinan J,
Salamov A, Lou Y, Lindquist E, Lucas S, Grimwood J, Grigoriev IV, Kubicek CP, Martinez D, van Peij NN,
Roubos JA, Nielsen J, Baker SE. Comparative genomics of citric-acid-producing Aspergillus niger ATCC 1015
versus enzyme-producing CBS 513.88. Genome Res 21(6): 885-897.
Finally two patent applications are in preparation.

viii

ix
Abbreviations
2-DE Two-dimensional polyacrylamide gel electrophoresis
Bp Base pairs
BSA Bovine serum albumine
CDS coding sequences
CM Complex medium
Da Dalton
DAD diode array detector
EC Enzyme Commission
GC-MS Gas chromatography Mass spectrometry
GRAS Generally regarded as safe
HPLC High performance liquid chromatography
Kb Kilobases
MM Minimal medium
MS Mass spectrometry
PIM Protease induction medium
PPP Pentose phosphate pathway
RMA Robust multiarray average
TCA Tri carboxylic acid
TF Transcription factor
vvm Volume of gas per volume of liquid per minute

x

xi
Nomenclature
µ Specific growth rate
YSX Specific yield of biomass on substrate
YS,Citrate Specific yield of citrate on substrate
YSCO2 Specific yield of CO2 on substrate
YS,Gluconate Specific yield of gluconate on substrate
YSO Specific oxygen consumption per substrate
YS,Oxalate Specific yield of oxalate on substrate

xii

xiii
Contents
Summary .................................................................................................................................... i
Dansk Resumé ........................................................................................................................... iii
Preface ...................................................................................................................................... v
Publications ............................................................................................................................. vii
Abbreviations ............................................................................................................................ ix
Nomenclature ........................................................................................................................... xi
Contents ................................................................................................................................. xiii
List of tables ............................................................................................................................ xix
List of Figures .......................................................................................................................... xxi
Chapter 1 Outline of the thesis ................................................................................................... 1
Chapter 2 Introduction to Aspergillus ......................................................................................... 3
2.1 Aspergillus in biotechnology ......................................................................................................... 3
2.1.1 Growth and morphology ................................................................................................................................... 5
2.1.2 Citric acid production ........................................................................................................................................ 7
2.1.3 Glucoamylase production ............................................................................................................................... 10
2.1.4 Heterologous protein production ................................................................................................................... 12
2.2 Concluding remark ...................................................................................................................... 15
2.3 References .................................................................................................................................. 16
Chapter 3 Systems Biology approaches ..................................................................................... 25
3.1 “omics” techniques ..................................................................................................................... 26
3.1.1 Genome ........................................................................................................................................................... 27
3.1.2 Transcriptome ................................................................................................................................................. 28
3.1.3 Proteome ........................................................................................................................................................ 30
3.1.4 Metabolomics and fluxomics .......................................................................................................................... 33
3.2 Biomass preparation ................................................................................................................... 35

xiv
3.3 Reference ................................................................................................................................... 37
Chapter 4 Transcriptome and proteome analysis of the correlation between citric acid formation
and manganese limitation in Aspergillus niger ......................................................................... 43
4.1 Abstract ...................................................................................................................................... 43
4.2 Introduction ............................................................................................................................... 44
4.3 Materials and Methods ............................................................................................................... 47
4.3.1 Strains and spore preparation ........................................................................................................................ 47
4.3.2 Media .............................................................................................................................................................. 47
4.3.3 Culture methods ............................................................................................................................................. 47
4.3.4 RNA isolation ................................................................................................................................................... 48
4.3.5 Transcription analysis ...................................................................................................................................... 48
4.3.6 Analysis of transcription data ......................................................................................................................... 48
4.3.7 Proteome analysis ........................................................................................................................................... 48
4.4 Results ....................................................................................................................................... 50
4.4.1 Transcriptome analysis ................................................................................................................................... 51
4.4.2 Proteome analysis ........................................................................................................................................... 53
4.5 Discussion .................................................................................................................................. 54
4.6 References .................................................................................................................................. 57
Chapter 5 Transcription factors modulation .............................................................................. 63
5.1.1 Transcription factors role in life ...................................................................................................................... 63
5.1.2 Transcription factor modulation ..................................................................................................................... 65
5.2 References .................................................................................................................................. 68
Chapter 6 Identification of a transcription factor controlling pH-dependent organic acid response
in Aspergillus niger ................................................................................................................... 71
6.1 Abstract ...................................................................................................................................... 71
6.2 Introduction ............................................................................................................................... 72
6.3 Materials and methods ............................................................................................................... 74
6.3.1 Fungal strains .................................................................................................................................................. 74
6.3.2 Media .............................................................................................................................................................. 74
6.3.3 Preparation of inoculum ................................................................................................................................. 75

xv
6.3.4 Target selection ............................................................................................................................................... 75
6.3.5 PCR amplification ............................................................................................................................................ 75
6.3.6 Gene deletion .................................................................................................................................................. 75
6.3.7 Oligonucleotide PCR primers .......................................................................................................................... 75
6.3.8 Cultivations ..................................................................................................................................................... 76
6.3.9 Cell dry weight determination ........................................................................................................................ 77
6.3.10 Quantification of extracellular metabolites .................................................................................................. 78
6.3.11 Transcription analysis .................................................................................................................................... 78
6.3.12 Gene ontology enrichment analysis .............................................................................................................. 79
6.4 Results ....................................................................................................................................... 80
6.4.1 Physiological characterization of the ΔoafA-strain ......................................................................................... 81
6.4.2 Transcriptome analysis ................................................................................................................................... 86
6.5 Discussion .................................................................................................................................. 87
6.5.1 Differences in acid production ........................................................................................................................ 87
6.5.2 Transcriptome analysis ................................................................................................................................... 88
6.5.3 The role of phosphoketolases in oxalate production...................................................................................... 89
6.5.4 Oxidative phosphorylation .............................................................................................................................. 91
6.6 Conclusion .................................................................................................................................. 93
6.7 Acknowledgements .................................................................................................................... 93
6.8 References .................................................................................................................................. 94
Chapter 7 Identification and characterization of a transcription factor regulating extracellular
proteolytic activity in Aspergillus niger ..................................................................................... 99
7.1 Abstract ...................................................................................................................................... 99
7.2 Introduction ............................................................................................................................. 100
7.3 Materials and methods ............................................................................................................. 101
7.3.1 Fungal strains ................................................................................................................................................ 101
7.3.2 Media ............................................................................................................................................................ 101
7.3.3 Preparation of inoculum ............................................................................................................................... 102
7.3.4 Target selection ............................................................................................................................................. 102
7.3.5 PCR amplification .......................................................................................................................................... 102
7.3.6 Gene deletion ................................................................................................................................................ 102
7.3.7 Oligonucleotide PCR primers ........................................................................................................................ 102

xvi
7.3.8 Southern blotting .......................................................................................................................................... 103
7.3.9 Cultivations ................................................................................................................................................... 103
7.3.10 Cell dry weight determination .................................................................................................................... 104
7.3.11 Quantification of extracellular metabolites ................................................................................................ 104
7.3.12 Protein analysis ........................................................................................................................................... 105
7.4 Results and discussion .............................................................................................................. 106
7.4.1 Strain construction ........................................................................................................................................ 106
7.4.2 Screening ....................................................................................................................................................... 106
7.4.3 Physiological characterization ....................................................................................................................... 107
7.4.4 Proteolytic Characterization ......................................................................................................................... 110
7.4.5 Protein profile ............................................................................................................................................... 111
7.5 Conclusion ................................................................................................................................ 113
7.6 References ................................................................................................................................ 114
Chapter 8 Nutrient profiling reveals potent inducers of fumonisin biosynthesis in Aspergillus
niger ...................................................................................................................................... 117
8.1 Abstract .................................................................................................................................... 117
8.2 Introduction ............................................................................................................................. 118
8.3 Material and methods............................................................................................................... 120
8.3.1 Fungal strains ................................................................................................................................................ 120
8.3.2 Oligonucleotide PCR primers ........................................................................................................................ 120
8.3.3 Vector construction ...................................................................................................................................... 120
8.3.4 Transformation ............................................................................................................................................. 121
8.3.5 Southern blotting .......................................................................................................................................... 121
8.3.6 Fluorescence microscopy and imaging ......................................................................................................... 121
8.3.7 Growth experiments ..................................................................................................................................... 121
8.3.8 Chemical analysis of A. niger cultures ........................................................................................................... 122
8.4 Results and discussion .............................................................................................................. 124
8.4.1 Strain construction ........................................................................................................................................ 124
8.4.2 Verification of the correlation between fumonisin and GFP in reporter strain ............................................ 124
8 ............................................................................................................................................................................. 125
8.4.3 Nutritionally profiling of fumonisin production ............................................................................................ 126
8.5 Conclusion and future perspectives ........................................................................................... 134

xvii
8.6 References ................................................................................................................................ 135
Chapter 9 Conclusion .............................................................................................................. 139
Appendix 1 Significantly expressed genes of Chapter 4 ........................................................... 141
Appendix 2 Significantly regulated proteins of Chapter 4 ........................................................ 218
Appendix 3 Significantly expressed genes of Chapter 6 ........................................................... 221
Appendix 4 SDS-page gel pictures of Chapter 7 ....................................................................... 230
Appendix 5 Integrated Biolog data of Chapter 8 ..................................................................... 233

xviii

xix
List of tables
Table 2.1 Examples of commercial homologous enzymes produced by Aspergillus spp. (A more
comprehensive list can be found at the Association of Manufacturers and Formulators of Enzyme Products
(AMFEP): http://www.amfep.org or the Enzyme Technical Association (ETA):
http://enzymetechnicalassoc.org/) ................................................................................................................... 4
Table 2.2 Examples of heterologous proteins produced by A. niger, the most recent and detailed list of
heterologous proteins produced by Aspergillus spp. Can be found by (Fleissner and Dersch 2010). .............. 4
Table 3.1 An overview of the completed whole genome sequence projects for A. niger. The list is compiled
from the GOLD, Genomes OnLine Database (http://www.genomesonline.org). ........................................... 27
Table 3.2 Proteomics strategies ...................................................................................................................... 32
Table 4.1 Overview of the metabolic response and the genes involved ........................................................ 51
Table 4.2 Metabolic overview of the central metabolism leading to citrate formation at Mn2+ limited
conditions. Up-regulation of hexokinase and glyceraldehyde 3-phosphate cause a high glucose uptake rate
and unrestricted flow through glycolysis. The high glycolytic flux is argued to result in a large pool of
pyruvate which enters is subjected to metabolization through the TCA cycle in the mitochondria. The
simultaneous down-regulation of gluconeogenesis makes secretion of citrate favorable as a way of
controlling/regulating the metabolic activity of the TCA cycle. The extract location of the two cation pumps,
indicated in the figure, is unknown. However, due to the high malate/citrate exchange, two acids having a
minute charge difference, it is argued that this causes a reduced need for homeostasis maintaining
reactions in the mitochondria. ........................................................................................................................ 52
Table 5.1 Overview of transcription factors characterized in A. niger. .......................................................... 66
Table 6.1 Primers used for deletion of oafA in A. niger. Lower-case letters indicate overlapping genetic
elements used for fusion PCR. ......................................................................................................................... 76
Table 6.2 Oxalate concentration in static cultures pH 6.0 .............................................................................. 81
Table 6.3 Physiological coefficients from chemostat cultivations. ................................................................. 85
Table 7.1 Primers used for deletion of prtT in A. niger. Lower-case letters indicate overlapping genetic
elements used for fusion PCR. ....................................................................................................................... 103
Table 7.2 Total protein concentration and overall protease activity form in minimal media (MM) and
complex media (CM), pH 6.0. ........................................................................................................................ 107
Table 7.3 Physiological coefficients from the batch cultivations at pH 4.5. ................................................. 109
Table 7.4 Relative maximum protease activity expressed relative to the WT protease activity of 100 %. .. 110
Table 7.5 Summary of the data obtain throughout this study ...................................................................... 112

xx
Table 8.1 Primers used for construction of the vector. Lower-case letters indicate overlapping genetic
elements used for fusion PCR and bold letters represent the restriction sites. ........................................... 120
Table 8.2 A comparison between the predicted fumonisin titer (GFP AUC) in the small scale biolog plates
and the fumonisin concentration produced on defined agar plates. ........................................................... 129
Table 8.3 Fumonisin production in minimal medium. The last column “In biolog” is the predicted fumonisin
production from the Biolog nutritional profiling experiments. .................................................................... 132
xxi
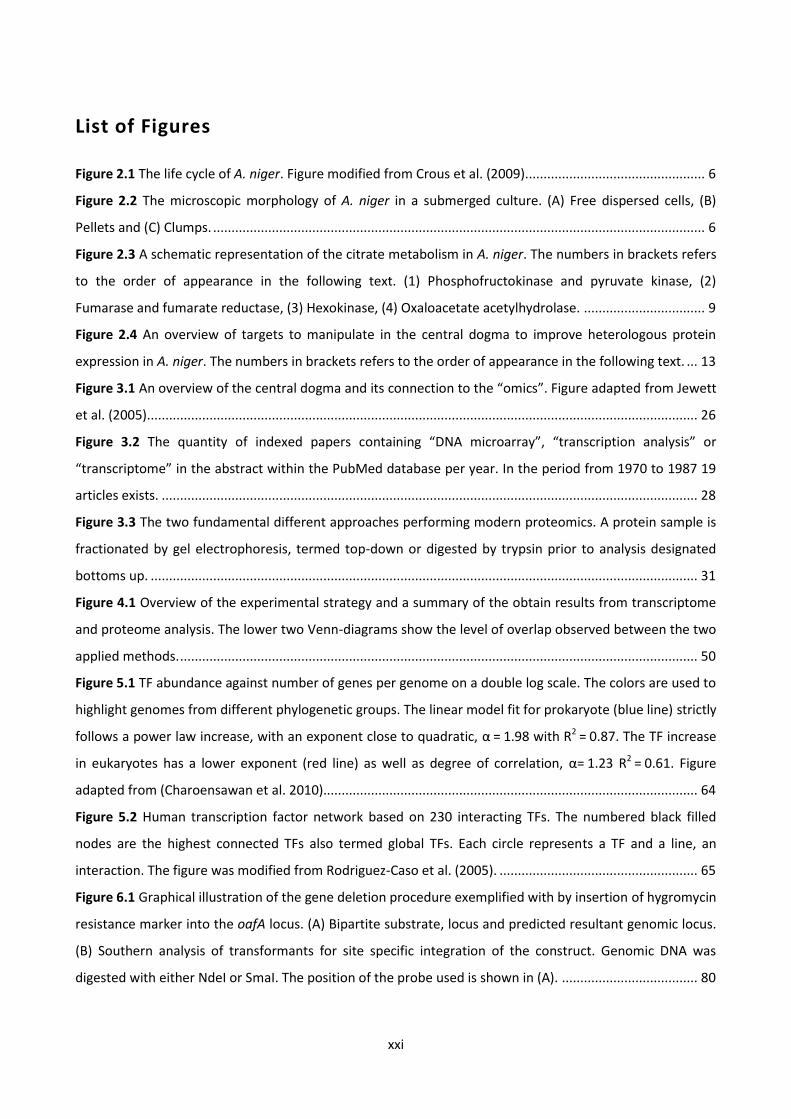
List of Figures
Figure 2.1 The life cycle of A. niger. Figure modified from Crous et al. (2009). ................................................ 6
Figure 2.2 The microscopic morphology of A. niger in a submerged culture. (A) Free dispersed cells, (B)
Pellets and (C) Clumps. ...................................................................................................................................... 6
Figure 2.3 A schematic representation of the citrate metabolism in A. niger. The numbers in brackets refers
to the order of appearance in the following text. (1) Phosphofructokinase and pyruvate kinase, (2)
Fumarase and fumarate reductase, (3) Hexokinase, (4) Oxaloacetate acetylhydrolase. ................................. 9
Figure 2.4 An overview of targets to manipulate in the central dogma to improve heterologous protein
expression in A. niger. The numbers in brackets refers to the order of appearance in the following text. ... 13
Figure 3.1 An overview of the central dogma and its connection to the “omics”. Figure adapted from Jewett
et al. (2005). ..................................................................................................................................................... 26
Figure 3.2 The quantity of indexed papers containing “DNA microarray”, “transcription analysis” or
“transcriptome” in the abstract within the PubMed database per year. In the period from 1970 to 1987 19
articles exists. .................................................................................................................................................. 28
Figure 3.3 The two fundamental different approaches performing modern proteomics. A protein sample is
fractionated by gel electrophoresis, termed top-down or digested by trypsin prior to analysis designated
bottoms up. ..................................................................................................................................................... 31
Figure 4.1 Overview of the experimental strategy and a summary of the obtain results from transcriptome
and proteome analysis. The lower two Venn-diagrams show the level of overlap observed between the two
applied methods. ............................................................................................................................................. 50
Figure 5.1 TF abundance against number of genes per genome on a double log scale. The colors are used to
highlight genomes from different phylogenetic groups. The linear model fit for prokaryote (blue line) strictly
follows a power law increase, with an exponent close to quadratic, α = 1.98 with R2 = 0.87. The TF increase
in eukaryotes has a lower exponent (red line) as well as degree of correlation, α= 1.23 R2 = 0.61. Figure
adapted from (Charoensawan et al. 2010)...................................................................................................... 64
Figure 5.2 Human transcription factor network based on 230 interacting TFs. The numbered black filled
nodes are the highest connected TFs also termed global TFs. Each circle represents a TF and a line, an
interaction. The figure was modified from Rodriguez-Caso et al. (2005). ...................................................... 65
Figure 6.1 Graphical illustration of the gene deletion procedure exemplified with by insertion of hygromycin
resistance marker into the oafA locus. (A) Bipartite substrate, locus and predicted resultant genomic locus.
(B) Southern analysis of transformants for site specific integration of the construct. Genomic DNA was
digested with either NdeI or SmaI. The position of the probe used is shown in (A). ..................................... 80

xxii
Figure 6.2 Representative profiles of the biomass concentration, sugar concentration, carbon dioxide
formation and acid formation during batch cultivations at pH 6.0 with the WT-strain (left) and and the
ΔoafA strain. The maximum specific growth rate was estimated trough a logarithmic plot of the biomass
concentration as a function of time. Yield coefficients were calculated as overall yields based on the
accumulated biomass or metabolite concentration in stationary phase related to the amount of consumed
glucose. The volumetric oxalate formation rate was estimated as the slope of a linear regression of the
oxalate titer as a function of time. .................................................................................................................. 82
Figure 6.3 Representative profiles of chemostat cultivations for Wild type(top) and ΔoafA(bottom). Two
steady states were obtained for each chemostat cultivation performed. ...................................................... 84
Figure 6.4 Metabolic map illustrating the response of central carbon metabolism caused by the oafA
deletion. A red box indicates up-regulation of a gene encoding an enzyme catalyzing this reaction. Green
box indicates down-regulation. The dotted line indicates fructose-6-phosphate phosphoketolase, a reaction
not previously described within the fungal kingdom. ..................................................................................... 91
Figure 7.1 Southern analysis of transformants for site specific integration of the construct. Genomic DNA
was digested with NdeI or SmaI in the case of ΔprtT and NdeI or ScaI, in the case of ΔprtB. ...................... 106
Figure 7.2 Representative cultivation profiles of biomass concentration, sugar concentration, carbon
dioxide formation and relative protease activity during batch cultivations at pH 4.5 for the wild type-strain
(left), ΔprtT (middle) and the ΔprtB strain (right). ........................................................................................ 108
Figure 8.1 (A) Graphical illustration of the vector insertion procedure into the fumonisin synthase locus and
predicted resultant genomic locus. (B) Southern analysis of wild type and the transformants for site specific
integration of the construct. Genomic DNA was digested with BamHI. The position of the probe used is
shown in (A). .................................................................................................................................................. 124
Figure 8.2 Dose response curve from 35 exacts. .......................................................................................... 125
Figure 8.3 Day 2 Tape slides from the reporter strain on glucose minimal media agar supplemented 5 %
(w/v) NaCl. (A) Bright field at 10X magnification. (B) GFP signal from the same position. .......................... 126
Figure 8.4 Left: The effect of Carbon (PM1-2), nitrogen (PM3), phorphor and sulfur (PM4) sources on
growth and fumonisins induction. Right: The effect of osmolyte sources (PM9) on growth and fumonisin
induction. The black line indicates the threshold of significance, 99 % confidence. Complete dataset can be
found in appendix 5. ...................................................................................................................................... 127
Figure 8.5 Raw data of fumonisin induction and growth over time. ............................................................ 128

1
Chapter 1 Outline of the thesis
The aim of this project was to investigate the regulatory aspects of filamentous fungus Aspergillus niger to
guide the improvement of this microorganism. The work covers a wide area of topics including, organic
acid production, protease secretion and mycotoxin formation yet with the focus of industrial relevance.
The thesis was written in a monographic structure and to provide context for the work presented, a short
outline will be given.
Chapter 2 provides a general introduction to Aspergillus niger and the industrial processes where this
microorganism is applied. Furthermore the advances made with A. niger, improving the performance as a
cell factory, are comprehensively reviewed.
Chapter 3 outlines the Systems Biology approaches and tools available for A. niger and highlights the
individual advantages and disadvantages. The last part of this chapter includes the important aspects of
biomass generation, to ensure quality data.
Chapter 4 presents a detailed examination of the citrate overflow metabolism. Using both transcriptomics
and proteomics, the highly complex cellular responses that initiate citrate formation was uncovered. The
study confirmed several events described in literature, together with novel finding, as down regulation of
the gluconeogenesis and more.
Chapter 5 outlines the background behind transcription factor modulation and the strategy to locate
transcription factors, applied as targets, in this metabolic engineering strategy. The thoughts and ideas
presented in this chapter form the basis for the strategies applied in following two chapters.
Chapter 6 describes the identification of the transcription factor OafA and its meticulous characterization.
Disruption of this transcriptions factor resulted in high levels of oxalic acid formation. Through
transcriptional profiling links between the phosphoketolase pathway, the oxidative phosphorylation and
oxalic acid overflow metabolism was discovered. Following the similar approach, chapter 7 focuses on
protease secretion, in two protease mutants. The ΔprtB mutant, identified in this study, was assessed and
compared to the previously descripted ΔprtT mutant. Pros and cons were identified for both strains;
consequently, thoughts of industrial relevance are discussed.

2
In chapter 8, a systematic nutritional investigation of A. niger’s fumonisin formation is presented. With the
use of a reporter construct, a fascinating interacting between plants pathogen defense response and the
fungus fumonisin formation was discovered.
Finally, chapter 9, contains conclusions and perspectives of the research presented in this thesis.
Two chapters was omitted from the thesis due to circumstances regarding patenting.

3
Chapter 2 Introduction to Aspergillus
Filamentous fungi have been extensively used as cell factories for a wide range of biotechnological products
including enzymes, chemicals and food ingredients. The genus of Aspergillus has had substantial impact
within biotechnology due to their many applications in food fermentation and biotechnological processes.
This chapter will focus on the importance of Aspergilli in the biotech industry.
2.1 Aspergillus in biotechnology
From the beginning of biotechnology, dating millennia back, mankind has used microorganisms in various
types of fermented food and beverages including beer, wine or bread without knowing of their existence
(Bennett 1998). The use of Aspergilli in production processes was initiated more than two thousand years
ago in Asia. Back then the production of the rice wine sake, by A. oryzae and the fermented soy sauces,
shoyu and tamari, produced by A. oryzae and A. tamari are the earliest recorded (Machida 2002, Rokas
2009).
Not before the year 1894, did a well-defined process emerged, that can be classified as a modern industrial
biotechnological production. The production of Takadiastase, an enzyme mixture with primarily an amylase
activity by A. oryzae. This was followed with citric acid production by A. niger in 1917 (Currie 1917, Bodie et
al. 1994). These early processes paved the way for an extensively expanding industry of biological derived
products, where Aspergilli are still the dominating production platform. Ranging from organic acids in A.
niger and A. terreus to cholesterol lowering statins in A. terreus to proteins and enzymes in a variety of
different Aspergilli. Particularly, enzymes currently have a significant commercial interest, underlined by
the increase in the market of 12 billion DKK from 1998 to 2011 (Adrio et al. 2005, Novozymes 2011).
Traditionally, Aspergillus has mainly been exploited for production of homologous enzymes (table 2.1).
However, with the advances in systems biology coupled with enhanced genetic tools available, now permits
the synthesis of industrially relevant amounts of various heterologous proteins, table 2.2.

4
Table 2.1 Examples of commercial homologous enzymes produced by Aspergillus spp. (A more comprehensive list can
be found at the Association of Manufacturers and Formulators of Enzyme Products (AMFEP): http://www.amfep.org
or the Enzyme Technical Association (ETA): http://enzymetechnicalassoc.org/)
Enzyme Classification Industry Producer Reference
Aminopeptidase Protease Cheese, baking, Soy
production
A. niger, A. oryzae, R.
Ozyzae
AMFEP, ETA
Celluase Carbohydrase Baking, Biofuel A. niger, A. aculeatus,
Trichoderma spp.
AMFEP
Glucose oxidase Oxidoreductase Baking, biosensors,
Gluconic acid
production
A. niger (Wong et al.
2008)
Lipase
triacylglycerol
Lipase Cheese, detergents,
biofuel
Various (Olempska-Beer
et al. 2006)
Phytase Phosphatase Animal feed supplement A. niger (Olempska-Beer
et al. 2006)
ß-Glucanase Carbohydrase Brewing A. niger, A. aculeatus,
Trichoderma spp.
AMFEP
Table 2.2 Examples of heterologous proteins produced by A. niger, the most recent and detailed list of heterologous
proteins produced by Aspergillus spp. Can be found by (Fleissner and Dersch 2010).
Enzyme Classification Industry Origin Reference
Laccase Oxidase Beer, Fruit juices Pycnoporus
cinnabarinus
(Record et al. 2002)
Interferon -α-2 Cytokine Biopharmaceutical Homo sapiens (MacRae et al. 1993, Punt et
al. 2002)
Lysozyme Glycoside
hydrolases
Biopharmaceutical,
preservative
Gallus gallus
(Chicken)
(Archer et al. 1990, Bohlin et
al. 2006)
Prochymosin Protease Cheese, Baking Sus scrofa
(Porcine)
(Broekhuijsen et al. 1993,
van den Brink et al. 2006)
Proteinase inhibitor Inhibitor Biopharmaceutical Homo sapiens (Mikosch et al. 1996)
Themostable Lipase Lipase Cheese,
detergents, biofuel
Thermomyces
lanuginosus
(Prathumpai et al. 2004)
Applying Aspergilli as protein cell factories carries numerous advantages compared to yeast and bacteria.
Aspergillus spp. are able to utilize a wide range of carbon sources, including xylan and hemicellulose. In
comparison to other eukaryotic expression systems, filamentous fungi possess an exceptional efficient

5
secretion capacity, enabling titers above 20 g/L of enzymes (Aunstrup 1984, Finkelstein 1987, Yoder et al.
2004). They have intron splicing and post translational machinery, allowing expression of proteins from
multicellular eukaryotes. These features all combined, render the Aspergillus genus the most important
fungi for commercial enzymes production.
A further illustration of Aspergilli being the most important producers of commercial enzymes, can be
found in the number of processes being classified as Generally Recognized As Safe (GRAS) by the US Food
and Drug Administration. Out of a total number of 53 GRAS status processes involving enzyme production
preparation, the Aspergillus genus have 18 records whereas 11 of these belongs to A. niger (Food and
Drug-Administration 2012).
As indicated above, A. niger is one of the most industrial important species within the genus of Aspergillus,
consisting of more than 260 species (Samson and Varga 2009). The two major products from A. niger is the
organic acid, citric acid and the enzyme glucoamylase.
2.1.1 Growth and morphology
Aspergillus belongs to the Phylum of fungi called Ascomycota and as most other species in this division,
grows by apical filament elongation. The filamentous threadlike structures are named hyphae and
developed from a single conidiospore (Wessels 1993). As the polarized hyphal elongation continues,
branching eventually occurs, rendering the fungus the opportunity to explore the three dimensional space.
The branching enables the fungus to search large areas in all direction for nutrients, a favorable feature, as
nutrients often are scarce in its natural habitat, the soil. The branched network of hyphae is together
termed mycelium.
Aspergillus spp. can produce specialized spore-bearing structures called conidiophores. The spores
produced in these structures, named conidiospores, are characterized as asexual and allow a rapid
propagation of the fungus (Etxebeste et al. 2010), figure 2. Reproduction can also occur sexually and
involves the development of haploid ascospores, yet A. niger have not been observed in a telomorphic
state (Crous et al. 2009).

6
Figure 2.1 The life cycle of A. niger. Figure modified from Crous et al. (2009).
In submerged cultivations of filamentous fungi, the morphology can be described on two levels;
macroscopic and microscopic (McIntyre et al. 2001). The macroscopic morphology describes the gross
morphology including compact spherical from named pellet, free dispersed mycelia named filamentous and
loose aggregates named clumps whereas the microscopic morphology describes the branch frequency,
hyphae dimensions, segregation etc. For a visual description of the macromorphology see figure 2.2.
(A) (B) (C)
Figure 2.2 The microscopic morphology of A. niger in a submerged culture. (A) Free dispersed cells, (B) Pellets and (C)
Clumps.
Determining the morphology is an interplay between many parameters including the pH value, the
concentration of trace metals, especially manganese, the agitation- and aeration rate (Grimm et al. 2005,
Papagianni 2007), but also the inoculum level (Papagianni and Mattey 2006) can influence the morphology.
HyphalGrowth
ConidiosporeFormation
Conidiospores
Spore Germination

7
Control of the morphology is vital to a production process since the morphology greatly influence
parameters as, mass transfer and productivity. Where the pellet form is mainly used for the production of
citric acid (Bodie et al. 1994), the dispersed filamentous morphology is beneficial producing extracellular
proteins (Schrickx et al. 1993, Kelly et al. 2004).
2.1.2 Citric acid production
A. niger is very proficient in producing organic acids including citric acid. Citric acid is an important chemical
due to its many applications; as acidifier, preservative and antioxidant in the food and beverage products.
Citric acid has as well a strong affinity towards divalent charged metals, making it an excellent cleaning
agent, as well as a SO2 binder for smoke cleaning (Dutta et al. 1987).
Citric acid is a bulk, low value product and even with the increasing demands and rising costs of raw
materials and energy, the price for citric acid in 2006 was in the range of $ 1.25-1.27 per kg. The annual
output of citric acid worldwide, the same year, was predicted to 1.5 million tons (Graff 2007). This makes
the industrial output of this compound greater than that of most other primary metabolites, derived by
fermentation.
Citric acid was isolated for the first time in 1784, by German-Swedish chemist Carl Wilhelm Scheele, who
crystallized it from lemon juice. The commercial production of citric acid was initiated in England 1826 and
based of Italian lemons. With the increased value of citric acid as an item of commerce, a production was
started in Italy and established a monopoly lasting to the end of the nineteenth century. To find alternative
sources of citric acid, a chemical method using glycerol were invented by (Grimoux and Adams 1880).
However, it was not economically competitive since the starting material costs exceeded the product value.
In 1893, C. Wehmer discovered that a Penicillium mold could be used to produce citric acid from sugar. But
since lemons at that time were readily available, this type of biological synthesis appeared unnecessary.
Not until the First World War disrupted the Italian citrus exports, a demand for alternative sources emerged.
This resulted in the discovery of A. niger’s ability to produce citric acid in 1917 by the American chemist J.
Currie. He discovered when A. niger was cultured in media with low pH, high sugar and mineral salts,
forming a substantial amount of citric acid. Prior to this finding, A. niger was only known to produce oxalic
acid. The conversion of glucose to citric acid was vastly efficient and it led Currie together with Chas. Pfizer
& co. inc. to start a large scale production, based on surface cultures. Advance in fermentation technology
led to a process change, into submerged cultivation in the beginning of the 1950’s. Leading to a reduced
labor requiring process and resulting in an increased production rate (Bodie et al. 1994). Today, A. niger is

8
still the main cell factory for citric acid production and the yield has reached up to 95 kg citric acid per 100
kg of supplied carbohydrate (Karaffa and Kubicek 2003).
The low value of citric acid makes even minute yield improvements of a significant economic benefit.
Traditionally, advances were achieved by mutagenesis and screening (Hjort 2005), but such improvements
are not easily protected by patents. Consequently, secrecy is an important tool for the citric acid industry.
This has made research in understanding the metabolic events coursing this intriguing and almost
stoichiometric conversion of glucose into citric acid troublesome.
The first academic studies of A. niger’s citric acid overflow metabolism emerged in the start 1950’s
(Damodaran and Rangachari 1951, Martin and Wilson 1951). Applying radiolabelled precursors led to the
discovery that citric acid biosynthesis depended on the breakdown of carbon primary though glycolysis
(Shu et al. 1954). An intriguing discovery made by Cleland and Johnson (1954), calculated that yields of
citric acid was exceeding the theoretical yield, which is Ysp=0.67 (cmole/cmole). The only way this can occur
is, if the CO2 released in the decarboxylation of 1 mole pyruvate is fixed by the pyruvate dehydrogenase
and reused to form oxaloacetate from the second mole pyruvate. The reuse of CO2 increases the
theoretical yield to Ysp= 0.80 (cmole/cmole). For a schematic representation, see figure 2.1. A further
detailed description of the changes in the metabolism leading to the citric overflow metabolism can be
found in chapter 4.

9
Figure 2.3 A schematic representation of the citrate metabolism in A. niger. The numbers in brackets refers to the
order of appearance in the following text. (1) Phosphofructokinase and pyruvate kinase, (2) Fumarase and fumarate
reductase, (3) Hexokinase, (4) Oxaloacetate acetylhydrolase.
Several academic studies to increase the rate and titer of citrate formation exist. They can be divided into
two approaches, up regulating enzymes in the pathway increasing the flux towards citric acid or increasing
citric acid production by elimination of byproducts, hence direct carbon towards citrate. An illustration of
this, is found in the study by Ruijter et al. (1997), where phosphofructokinase and pyruvate kinase (figure
2.3.1) were overexpressed, 3 and 5 fold respectively. These two enzymes are involved in sugar uptake and
were believed to be important steps in flux control (Kubicek et al. 1988, Kubicek-Pranz et al. 1990). The
outcome was however disappointing since the overexpression did not influence the activity of other
enzymes in the pathway, nor did it change intermediary metabolite levels. This outcome was supported by

10
calculations made by (Torres et al. 1996). Using biochemical system theory, it was calculated that at least
seven glycolytic enzymes must be simultaneously up-regulated, to obtain an increased rate of citrate
formation.
A more recent study was conducted by de Jongh and Nielsen (2008). Based on a metabolic flux balance
model by (Guebel and Torres 2001), the citrate export from the mitrochondria was predicted to likely be
rate limiting. The authors hypothesized that the principal mode of citrate export from the mitochondria,
involved anti-port of cytosolic malate, hence inserting heterologous genes involved in this branch of TCA
cycle, could increase citrate yield. By insertion of a fumarase and a fumarate reductase (figure 2.3.2)
resulted in a strain that was able to produce citrate in presence of trace manganese concentrations.
Manganese is a strong inhibitor of citrate overflow metabolism in A. niger. Additionally this strain had a
significant increase yield coefficient of 0.9 (g Citrate /g glucose).
An example of eliminating byproducts is the of study by Arisan-Atac et al. (1996). This might be the first
successful academic improvement of A. niger’s citrate production. By disruption of the gene encoding the
trehalose-6-phosphate synthase, the authors managed to improve the rate of citric acid accumulation. This
enzyme produces trehalose-6-phosphate, a strong inhibitor of hexokinase I and II (figure 2.3.3) (Blazquez et
al. 1993) and the lack of this enzyme caused increased citric acid accumulation, especially in the early phase
of the fermentation.
Following a similar strategy was the study by Ruijter et al. (1999). Oxalic acid produced by A. niger arises as
an unwanted by-product, mainly due to decrease of yield of citric acid and that oxalate complicates
recovery process. By disrupting of the oxaloacetate acetylhydrolase (figure 2.3.4), the enzyme that converts
oxaloacetate into oxalate, the oxaloacetate acetylhydrolase deficient mutant produced citric acid up to pH
5 and was insensitive to manganese inhibition.
2.1.3 Glucoamylase production
As previously mentioned, the market for industrial enzymes has grown significantly in the last 10 years.
Specifically, the starch degrading amylases has been one of the main triggers for the growth and this class
of enzymes is now the largest market within the industrial enzymes (Kelly et al. 2009). All amylases are
glycoside hydrolases but particularly the γ-amylase subclass also named glucoamylase (GA) is important. GA
cleaves α(1-6) glycosidic linkages, as well as α(1-4) glycosidic linkages at the nonreducing end of amylose
and amylopectin (Kumar and Satyanarayana 2009). This enzyme is used by the food industry for converting
starch into glucose syrup and applied substantially in the production of first generation bioethanol. Before
the 1960’s this conversion was made by combining starch with dilute hydrochloric acid, followed by heating

11
under pressure. This chemical conversion had certain drawbacks as byproducts formation and salts from
the neutralization. The change into the enzymatic process resulted in higher yield, higher degree of purity
and facilitated crystallization of glucose (Kearsley and Dziedzic 1995).
Today, the enzymatic process typically consists of two steps, first the starch is liquefied using α-amylase
converting the starch into lower-molecular-weight dextrins. These are then converted into monosaccharide
glucose by GA. This enzymatic conversion of starch into glucose was the first large scale enzymatic process
and still today the starch industry is the main user of enzymes (Hjort 2005).
Ironically one of reasons GA is produced in such large amount, is because it is a slow-acting enzyme, with a
specific activity of 5.6 µmol/min/mg (free enzyme on maltodextrin, (Abraham et al. 2004)). This is orders of
magnitude lower compared with α-amylase (Najafi and Deobagkar 2005). Consequently the enzyme needs
a high dosing, and even under these conditions, dextrin to glucose conversion lasts up to 92 hours (Kumar
and Satyanarayana 2009). Therefore efforts on optimizing the GA enzyme have been attempted.
The task of improving the enzyme temperature stability has been a major focus. GA from A. niger has an
optimal temperature of 55oC–60oC. This pose a challenge, since the first step catalyzed by α-amylase, is
operated at 105 oC where the enzyme operates very rapidly. To accommodate GA reduced thermostability,
the reaction mixture has to be cooled which imposes a significant cost on the overall process. Multiple
studies have been addressing the thermostability problem, by site-directed mutagenesis (Reilly et al. 1994,
Chen et al. 1996, Allen et al. 1998, Liu and Wang 2003), but only minor improvements have been achieved.
An interesting study by Wang et al. (2006) addressed the problem applying directed evolution and was able
to increase the temperature optimum to 80 oC.
An alternative strategy is minding for themostable versions of GA from thermophilic organisms. Several
studies can be found pursuing this approach (Ohnishi et al. 1992, Campos and Felix 1995, Li et al. 1998), yet
none have been found to be superior to the traditional A. niger GA. A study by Nielsen et al. (2002)
investigated a heterologous expressed thermostable glucoamylase from Talaromyces emersonii. The T.
emersonii glucoamylase had a reduced Km towards the assayed substrates (3-5 fold) compared with the A.
niger glucoamylase. Still the increased themostability resulted in the higher yield with T. emersonii GA using
3-fold lower protein concentration. It has to be noted that the two enzymes were evaluated at 65 oC, which
is above the recommended 55 oC – 60 oC for A. niger GA (Abraham et al. 2004).
Besides optimizing the enzyme itself improvement in the yield of GA, in A. niger has been addressed in
various studies. Increasing the amount of genetic copies of GA was done successfully by Wallis et al. (1999),
12
with 80 extra copies inserted into the genome. This resulted in eight fold increment of GA titer without a
noteworthy change of the glycosylation pattern.
Morphology studies of the fungal cells made by (Wösten et al. 1991, Peberdy 1994) gave strong indication
of protein secretion being localized at the hyphal tips. This discovery increased the commercial interest in
the subject and several patents were filled. Mutation in the HbrA gene inducing hyperbranching and
improving protein secretion (Turner et al. 2000). Another patent by (Akin et al. 2002) described truncation
of the gene cotA, resulting in a compact morphology leading to incensement of the branching, as well as
cessation of hyphal tip extension. More recent studies focus on morphology engineering mediated by
physio-chemical methods. (Driouch et al. 2010) applied silicate microparticles, variating in size and
concentration for a distinctive control of the morphology and achieve a fourfold higher concentration of
glucoamylase. Wucherpfennig et al. (2011) used osmolality to control the morphology; however, this
method has a strong negative effect on the germination time and growth rate.
2.1.4 Heterologous protein production
Glucoamylase and other homologous proteins are, in most cases, produced in one to two orders of
magnitude higher than heterologous proteins (Braaksma and Punt 2008). Besides the previously mentioned
advantages of using members of the Aspergillus family for protein production, disadvantages are present as
well that surface especially when expressing a heterologous protein. These include transcription and
translation control, mRNA stability, secretion, and extracellular degradation.
To circumvent the yield limiting factors, several strategies have been developed. They include classical yield
improvement methods as manipulating promoter strength but also novel strategies, as amino acid terminal
fusion. A schematic representation of targets for optimization and their correlation to central dogma can be
found in figure 2.4.

13
Figure 2.4 An overview of targets to manipulate in the central dogma to improve heterologous protein expression in
A. niger. The numbers in brackets refers to the order of appearance in the following text.
The first challenge of heterologous protein production is expression. Typically the native promoter cannot
be applied; therefore, a different promoter has to be selected (figure 2.4.1). The study by Moralejo et al.
(1999) investigated this challenge of promoter selection. Four strong fungal promoters were assayed and
more than a tenfold difference was observed of the promoters in between. The recent study by (Blumhoff
et al. 2012) addressed the problem with a limited number of promoters for heterologous expression in
fungi. Six novel constitutive promoters were characterized in A. niger, covering three orders of magnitude.
Similar to prokaryotes, synthetic promoters have also been developed for fungi (Yaver and Nham 2003) as
well as inducible promoters (Meyer et al. 2011).
The next challenge is the translation and folding of the heterologous protein. The main strategy for
enhancing the processing is called amino-terminal fusion (figure 2.4.2). This technique employs the flanking
sequences of highly expressed and secreted homologous protein e.g. glucoamylase, as a signal peptide
(Ward et al. 1990) (Gouka et al. 1997b, Ward et al. 2004). The method of action has been proposed as

14
stabilization of the recombinant mRNA and facilitating the translocation of the heterologous protein into
the secretory pathway. To release the heterologous protein from the signal peptide, a cleavage site for a
protease is included. This is typically the serine proteinase KexB, located in the Golgi apparatus. A
comprehensive review of this strategy as made by Gouka et al. (1997a).
An attractive technique for improving heterologous protein expression has shown to be the manipulation
of regulatory proteins also known as transcription factors (TFs). Currently, two TFs have been described as
particular beneficial.
High levels of protein expression require the cell to up-regulate the machinery responsible for protein
folding and transport (figure 2.4.3). This is because otherwise unfolded protein would be targeted for
degradation by the cell. This up-regulation is termed the unfolded protein response (UPR). To enhance the
UPR, attempts on up regulating individual parts of UPR e.g. foldases and chaperones gene have been
attempted. Although in some cases, this strategy has been reported successful, the outcome of this
approach seems strongly dependent on the protein of interest, as reviewed by Conesa et al. (2001). The
UPR pathway has been studied in details in S. cerevisiae and a transcription factor, HAC1, has been
identified being the main responsible for regulation of the UPR pathway (Cox and Walter 1996, Mori et al.
1996, Welihinda et al. 1999). The ortholog to HAC1, hacA has later been identified in Aspergilli and
overexpressed by (Valkonen et al. 2003). The study demonstrated that a 3 to 7-fold titer improvement
could be reached with a constitutive expression of hacA. This study illustrates the significance of
modulating TFs rather than by modulating single/few genes.
The last challenge when applying Aspergilli as protein cell factory is the secreted proteases (figure 2.4.4).
Proteases are a general problem protein production, but they are more pronounced when producing
heterologous proteins. (Braaksma and Punt 2008). A. niger have more than 150 genes encoding for
proteases where 32 of these genes contain an export signal or have strong similarity to other secreted
proteases, in other organisms. (Pel et al. 2007). Reducing the extracellular protease activity has been
addressed by classical strain improvement (Mattern et al. 1992, Katz et al. 1996) and genetic engineering,
targeting the aspergillopepsin protease family (van den Hombergh et al. 1997a, van den Hombergh et al.
1997b). Interestingly, a mutant obtained and described by Mattern et al. (1992) was later identified to be
cause by a mutation in a gene encoding a TF named prtT (Hjort et al. 2000, Punt et al. 2008). The disruption
of the prtT gene, reduced the total extracellular protease activity to 20% of the wild type.

15
2.2 Concluding remark
As illustrated in this chapter, A. niger is a versatile cell factory, that has been applied for close to a century.
Initiated by A. nigers superior ability to produce citric acid and later also glucoamylase production, has
established A. niger as one of the most significant production hosts of industrial biotechnology. Recently A.
niger has also emerged as a heterologous protein production host. However, the titers of heterologous
proteins are low compared with proteins from a homologous origin, leaving a potential for optimization.
With the release of the genome sequence of A. niger, has enabled the possibility of applying Systems
Biology approaches to pinpoint bottlenecks in the protein production machinery. Therefore, this is the main
topic in chapter 3.

16
2.3 References
Abraham, T. E., J. R. Joseph, L. B. Bindhu and K. K. Jayakumar (2004). "Crosslinked enzyme crystals of glucoamylase as a potent catalyst for biotransformations." Carbohydr Res 339(6): 1099-1104.
Adrio, J. L., A. L. Demain and J. Velasco (2005). Handbook of industrial mycology, 082475655X (hbk.) : ¹130.00082475655X (alk. paper).
Akin, A. R., E. A. Bodie, S. Burrow, N. S. Dunn-Coleman, G. Turner and M. Ward (2002). Regulatable growth of filamentous fungi. US7425450.
Allen, M. J., P. M. Coutinho and C. F. Ford (1998). "Stabilization of Aspergillus awamori glucoamylase by proline substitution and combining stabilizing mutations." Protein Engineering 11(9): 783-788.
Archer, D. B., D. J. Jeenes, D. A. MacKenzie, G. Brightwell, N. Lambert, G. Lowe, S. E. Radford and C. M. Dobson (1990). "Hen egg white lysozyme expressed in, and secreted from, Aspergillus niger is correctly processed and folded." Biotechnology (N Y) 8(8): 741-745.
Arisan-Atac, I., M. F. Wolschek and C. P. Kubicek (1996). "Trehalose-6-phosphate synthase A affects citrate accumulation by Aspergillus niger under conditions of high glycolytic flux." FEMS Microbiol Lett 140(1): 77-83.
Aunstrup, K. (1984). "Enzyme technology, problems and possibilities." European Congress on Biotechnology 3(4): 143-156.
Bennett, J. W. (1998). "Mycotechnology: the role of fungi in biotechnology." J Biotechnol 66(2-3): 101-107.
Blazquez, M. A., R. Lagunas, C. Gancedo and J. M. Gancedo (1993). "Trehalose-6-phosphate, a new regulator of yeast glycolysis that inhibits hexokinases." FEBS Lett 329(1-2): 51-54.
Blumhoff, M., M. G. Steiger, H. Marx, D. Mattanovich and M. Sauer (2012). "Six novel constitutive promoters for metabolic engineering of Aspergillus niger." Appl Microbiol Biotechnol.
Bodie, E. A., B. Bower, R. M. Berka and N. S. Dunn-Coleman (1994). "Economically important organic acid and enzyme products." Prog Ind Microbiol 29: 561-602.
Bohlin, C., L. J. Jonsson, R. Roth and W. H. van Zyl (2006). "Heterologous expression of Trametes versicolor laccase in Pichia pastoris and Aspergillus niger." Appl Biochem Biotechnol 129-132: 195-214.
Broekhuijsen, M. P., I. E. Mattern, R. Contreras, J. R. Kinghorn and C. A. van den Hondel (1993). "Secretion of heterologous proteins by Aspergillus niger: production of active human interleukin-6 in a protease-

17
deficient mutant by KEX2-like processing of a glucoamylase-hIL6 fusion protein." J Biotechnol 31(2): 135-145.
Braaksma, M. and P. J. Punt (2008). Aspergillus as a cell factory for protein production: controlling protease activity in fungal production. The Aspergilli: Genomics, Medical Aspects, Biotechnology, and Research Methods, CRC Press: 441-455.
Campos, L. and C. R. Felix (1995). "Purification and Characterization of a Glucoamylase from Humicola grisea." Appl Environ Microbiol 61(6): 2436-2438.
Chen, H.-m., Y. Li, T. Panda, F. U. Buehler, C. Ford and P. J. Reilly (1996). "Effect of replacing helical glycine residues with alanines on reversible and irreversible stability and production of Aspergillus awamori glucoamylase." Protein Engineering 9(6): 499-505.
Cleland, W. W. and M. J. Johnson (1954). "Tracer experiments on the mechanism of citric acid formation by Aspergillus niger." J Biol Chem 208(2): 679-689.
Conesa, A., P. J. Punt, N. van Luijk and C. A. van den Hondel (2001). "The secretion pathway in filamentous fungi: a biotechnological view." Fungal Genet Biol 33(3): 155-171.
Cox, J. S. and P. Walter (1996). "A novel mechanism for regulating activity of a transcription factor that controls the unfolded protein response." Cell 87(3): 391-404.
Crous, P. W., G. J. M. Verkley, J. Z. Groenewald and R. A. Samson (2009). Fungal Biodiversity, CBS-KNAW Biodiversity Centre Utrecht, 9070351773.
Currie, J. N. (1917). "The Citric acid fermentation of Aspergillus niger." J. Biol. Chem. 31: 15-37.
Damodaran, M. and P. N. Rangachari (1951). "Carbohydrate metabolism in citric acid fermentation. I. The influence of inhibitors of glycolysis and respiration on citric acid formation by Aspergillus niger." Enzymologia 15(2): 83-95.
de Jongh, W. A. and J. Nielsen (2008). "Enhanced citrate production through gene insertion in Aspergillus niger." Metab Eng 10(2): 87-96.
Driouch, H., B. Sommer and C. Wittmann (2010). "Morphology engineering of Aspergillus niger for improved enzyme production." Biotechnol Bioeng 105(6): 1058-1068.
Dutta, B. K., R. K. Basu, A. Pandit and P. Ray (1987). "Absorption of sulfur dioxide in citric acid-sodium citrate buffer solutions." Industrial & Engineering Chemistry Research 26(7): 1291-1296.

18
Etxebeste, O., A. Garzia, E. A. Espeso and U. Ugalde (2010). "Aspergillus nidulans asexual development: making the most of cellular modules." Trends Microbiol 18(12): 569-576.
Finkelstein, D. B. (1987). "Improvement of enzyme production in Aspergillus." Antonie Van Leeuwenhoek 53(5): 349-352.
Fleissner, A. and P. Dersch (2010). "Expression and export: recombinant protein production systems for Aspergillus." Appl Microbiol Biotechnol 87(4): 1255-1270.
Food and Drug-Administration (2012). GRAS Notice Inventory.
Gouka, R. J., P. J. Punt and C. A. van den Hondel (1997a). "Efficient production of secreted proteins by Aspergillus: progress, limitations and prospects." Appl Microbiol Biotechnol 47(1): 1-11.
Gouka, R. J., P. J. Punt and C. A. van den Hondel (1997b). "Glucoamylase gene fusions alleviate limitations for protein production in Aspergillus awamori at the transcriptional and (post) translational levels." Appl Environ Microbiol 63(2): 488-497.
Graff, G. (2007). "Citric acid prices to rise as increased demand tightens supply."
Grimm, L. H., S. Kelly, Volkerding, II, R. Krull and D. C. Hempel (2005). "Influence of mechanical stress and surface interaction on the aggregation of Aspergillus niger conidia." Biotechnol Bioeng 92(7): 879-888.
Grimoux, E. and P. Adams (1880). "Synthese de lácide citrique." Seances. Acad. Sci 90: 1252.
Guebel, D. V. and N. V. Torres (2001). "Optimization of the citric acid production by Aspergillus niger through a metabolic flux balance model." Electronic Journal of Biotechnology 4.
Hjort, C. (2005). Production of Food Additives using Filamentous Fungi. Genetically Engineered Food: Methods and Detection. Weinheim, Wiley-VCH Verlag GmbH & Co. KGaA: 86-99.
Hjort, C., C. van den Hondel, P. J. Punt and F. H. Schuren (2000). Fungal transcriptional activators useful in methods for producing a polypeptide.
Karaffa, L. and C. P. Kubicek (2003). "Aspergillus niger citric acid accumulation: do we understand this well working black box?" Appl Microbiol Biotechnol 61(3): 189-196.
Katz, M. E., P. K. Flynn, P. A. vanKuyk and B. F. Cheetham (1996). "Mutations affecting extracellular protease production in the filamentous fungus Aspergillus nidulans." Mol Gen Genet 250(6): 715-724.

19
Kearsley, M. W. and S. Z. Dziedzic (1995). Handbook of starch hydrolysis products and their derivatives. London, Blackie Academic & Professional, 0751402699 : ¹65.00.
Kelly, R. M., L. Dijkhuizen and H. Leemhuis (2009). "Starch and alpha-glucan acting enzymes, modulating their properties by directed evolution." J Biotechnol 140(3-4): 184-193.
Kelly, S., L. H. Grimm, J. Hengstler, E. Schultheis, R. Krull and D. C. Hempel (2004). "Agitation effects on submerged growth and product formation of Aspergillus niger." Bioprocess Biosyst Eng 26(5): 315-323.
Kubicek-Pranz, E. M., M. Mozelt, M. Rohr and C. P. Kubicek (1990). "Changes in the concentration of fructose 2,6-bisphosphate in Aspergillus niger during stimulation of acidogenesis by elevated sucrose concentration." Biochim Biophys Acta 1033(3): 250-255.
Kubicek, C. P., G. Schreferl-Kunar, W. Wohrer and M. Rohr (1988). "Evidence for a cytoplasmic pathway of oxalate biosynthesis in Aspergillus niger." Appl Environ Microbiol 54(3): 633-637.
Kumar, P. and T. Satyanarayana (2009). "Microbial glucoamylases: characteristics and applications." Crit Rev Biotechnol 29(3): 225-255.
Li, D.-C., Y.-J. Yang, Y.-L. Peng and C.-Y. Shen (1998). "Purification and characterization of extracellular glucoamylase from the thermophilic Thermomyces lanuginosus." Mycological Research 102(05): 568-572.
Liu, H.-L. and W.-C. Wang (2003). "Protein engineering to improve the thermostability of glucoamylase from Aspergillus awamori based on molecular dynamics simulations." Protein Engineering 16(1): 19-25.
Machida, M. (2002). "Progress of Aspergillus oryzae genomics." Adv Appl Microbiol 51: 81-106.
MacRae, W. D., F. P. Buxton, D. I. Gwynne and R. W. Davies (1993). "Heterologous protein secretion directed by a repressible acid phosphatase system of Aspergillus niger." Gene 132(2): 193-198.
Martin, S. M. and P. W. Wilson (1951). "Uptake of C14O2 by Aspergillus niger in the formation of citric acid." Arch Biochem Biophys 32(1): 150-157.
Mattern, I. E., J. M. van Noort, P. van den Berg, D. B. Archer, I. N. Roberts and C. A. van den Hondel (1992). "Isolation and characterization of mutants of Aspergillus niger deficient in extracellular proteases." Mol Gen Genet 234(2): 332-336.
McIntyre, M., C. Muller, J. Dynesen and J. Nielsen (2001). "Metabolic engineering of the morphology of Aspergillus." Adv Biochem Eng Biotechnol 73: 103-128.

20
Meyer, V., F. Wanka, J. van Gent, M. Arentshorst, C. A. van den Hondel and A. F. Ram (2011). "Fungal gene expression on demand: an inducible, tunable, and metabolism-independent expression system for Aspergillus niger." Appl Environ Microbiol 77(9): 2975-2983.
Mikosch, T., P. Klemm, H. G. Gassen, C. A. van den Hondel and M. Kemme (1996). "Secretion of active human mucus proteinase inhibitor by Aspergillus niger after KEX2-like processing of a glucoamylase-inhibitor fusion protein." J Biotechnol 52(2): 97-106.
Moralejo, F. J., R. E. Cardoza, S. Gutierrez and J. F. Martin (1999). "Thaumatin production in Aspergillus awamori by use of expression cassettes with strong fungal promoters and high gene dosage." Appl Environ Microbiol 65(3): 1168-1174.
Mori, K., T. Kawahara, H. Yoshida, H. Yanagi and T. Yura (1996). "Signalling from endoplasmic reticulum to nucleus: transcription factor with a basic-leucine zipper motif is required for the unfolded protein-response pathway." Genes Cells 1(9): 803-817.
Najafi, M. F. and D. Deobagkar (2005). "Purification and characterization of an extracellular alpha-amylase from Bacillus subtilis AX20." Protein Expr Purif 41(2): 349-354.
Nielsen, B. R., J. Lehmbeck and T. P. Frandsen (2002). "Cloning, heterologous expression, and enzymatic characterization of a thermostable glucoamylase from Talaromyces emersonii." Protein Expr Purif 26(1): 1-8.
Novozymes (2011). "The Novozymes Report."
Ohnishi, H., H. Kitamura, T. Minowa, H. Sakai and T. Ohta (1992). "Molecular cloning of a glucoamylase gene from a thermophilic Clostridium and kinetics of the cloned enzyme." Eur J Biochem 207(2): 413-418.
Olempska-Beer, Z. S., R. I. Merker, M. D. Ditto and M. J. DiNovi (2006). "Food-processing enzymes from recombinant microorganisms--a review." Regul Toxicol Pharmacol 45(2): 144-158.
Papagianni, M. (2007). "Advances in citric acid fermentation by Aspergillus niger: biochemical aspects, membrane transport and modeling." Biotechnol Adv 25(3): 244-263.
Papagianni, M. and M. Mattey (2006). "Morphological development of Aspergillus niger in submerged citric acid fermentation as a function of the spore inoculum level. Application of neural network and cluster analysis for characterization of mycelial morphology." Microb Cell Fact 5: 3.
Peberdy, J. F. (1994). "Protein secretion in filamentous fungi--trying to understand a highly productive black box." Trends Biotechnol 12(2): 50-57.
21
Pel, H. J., J. H. de Winde, D. B. Archer, P. S. Dyer, G. Hofmann, P. J. Schaap, G. Turner, R. P. de Vries, R. Albang, K. Albermann, M. R. Andersen, J. D. Bendtsen, J. A. Benen, M. van den Berg, S. Breestraat, M. X. Caddick, R. Contreras, M. Cornell, P. M. Coutinho, E. G. Danchin, A. J. Debets, P. Dekker, P. W. van Dijck, A. van Dijk, L. Dijkhuizen, A. J. Driessen, C. d'Enfert, S. Geysens, C. Goosen, G. S. Groot, P. W. de Groot, T. Guillemette, B. Henrissat, M. Herweijer, J. P. van den Hombergh, C. A. van den Hondel, R. T. van der Heijden, R. M. van der Kaaij, F. M. Klis, H. J. Kools, C. P. Kubicek, P. A. van Kuyk, J. Lauber, X. Lu, M. J. van der Maarel, R. Meulenberg, H. Menke, M. A. Mortimer, J. Nielsen, S. G. Oliver, M. Olsthoorn, K. Pal, N. N. van Peij, A. F. Ram, U. Rinas, J. A. Roubos, C. M. Sagt, M. Schmoll, J. Sun, D. Ussery, J. Varga, W. Vervecken, P. J. van de Vondervoort, H. Wedler, H. A. Wosten, A. P. Zeng, A. J. van Ooyen, J. Visser and H. Stam (2007). "Genome sequencing and analysis of the versatile cell factory Aspergillus niger CBS 513.88." Nat Biotechnol 25(2): 221-231.
Prathumpai, W., S. J. Flitter, M. McIntyre and J. Nielsen (2004). "Lipase production by recombinant strains of Aspergillus niger expressing a lipase-encoding gene from Thermomyces lanuginosus." Appl Microbiol Biotechnol 65(6): 714-719.
Punt, P. J., F. H. Schuren, J. Lehmbeck, T. Christensen, C. Hjort and C. A. van den Hondel (2008). "Characterization of the Aspergillus niger prtT, a unique regulator of extracellular protease encoding genes." Fungal Genet Biol 45(12): 1591-1599.
Punt, P. J., N. van Biezen, A. Conesa, A. Albers, J. Mangnus and C. van den Hondel (2002). "Filamentous fungi as cell factories for heterologous protein production." Trends Biotechnol 20(5): 200-206.
Record, E., P. J. Punt, M. Chamkha, M. Labat, C. A. van Den Hondel and M. Asther (2002). "Expression of the Pycnoporus cinnabarinus laccase gene in Aspergillus niger and characterization of the recombinant enzyme." Eur J Biochem 269(2): 602-609.
Reilly, P. J., H.-M. Chen, U. Bakir and C. Ford (1994). "Increased thermostability of Asn182 → Ala mutant Aspergillus awamori glucoamylase." Biotechnology and Bioengineering 43(1): 101-105.
Rokas, A. (2009). "The effect of domestication on the fungal proteome." Trends Genet 25(2): 60-63.
Ruijter, G. J., H. Panneman and J. Visser (1997). "Overexpression of phosphofructokinase and pyruvate kinase in citric acid-producing Aspergillus niger." Biochim Biophys Acta 1334(2-3): 317-326.
Ruijter, G. J., P. J. van de Vondervoort and J. Visser (1999). "Oxalic acid production by Aspergillus niger: an oxalate-non-producing mutant produces citric acid at pH 5 and in the presence of manganese." Microbiology 145 ( Pt 9): 2569-2576.
Samson, R. A. and J. Varga (2009). "What is a species in Aspergillus?" Medical Mycology 47(s1): S13-S20.

22
Schrickx, J. M., A. S. Krave, J. C. Verdoes, C. A. van den Hondel, A. H. Stouthamer and H. W. van Verseveld (1993). "Growth and product formation in chemostat and recycling cultures by Aspergillus niger N402 and a glucoamylase overproducing transformant, provided with multiple copies of the glaA gene." J Gen Microbiol 139(11): 2801-2810.
Shu, P., A. Funk and A. C. Neish (1954). "Mechanism of citric acid formation from glucose by Aspergillus niger." Can J Biochem Physiol 32(1): 68-80.
Torres, N. V., E. O. Voit and C. Gonzalez-Alcon (1996). "Optimization of nonlinear biotechnological processes with linear programming: Application to citric acid production by Aspergillus niger." Biotechnol Bioeng 49(3): 247-258.
Turner, G., N. S. Dunn-Coleman, S. Pollerman and S. Memmott (2000). Hyphal Growth In Fungi. WO2005080420-A2.
Valkonen, M., M. Ward, H. Wang, M. Penttila and M. Saloheimo (2003). "Improvement of foreign-protein production in Aspergillus niger var. awamori by constitutive induction of the unfolded-protein response." Appl Environ Microbiol 69(12): 6979-6986.
van den Brink, H. J., S. G. Petersen, H. Rahbek-Nielsen, K. Hellmuth and M. Harboe (2006). "Increased production of chymosin by glycosylation." J Biotechnol 125(2): 304-310.
van den Hombergh, J. P., L. Fraissinet-Tachet, P. J. van de Vondervoort and J. Visser (1997a). "Production of the homologous pectin lyase B protein in six genetically defined protease-deficient Aspergillus niger mutant strains." Curr Genet 32(1): 73-81.
van den Hombergh, J. P., M. D. Sollewijn Gelpke, P. J. van de Vondervoort, F. P. Buxton and J. Visser (1997b). "Disruption of three acid proteases in Aspergillus niger--effects on protease spectrum, intracellular proteolysis, and degradation of target proteins." Eur J Biochem 247(2): 605-613.
Wallis, G. L., R. J. Swift, F. W. Hemming, A. P. Trinci and J. F. Peberdy (1999). "Glucoamylase overexpression and secretion in Aspergillus niger: analysis of glycosylation." Biochim Biophys Acta 1472(3): 576-586.
Wang, Y., E. Fuchs, R. da Silva, A. McDaniel, J. Seibel and C. Ford (2006). "Improvement of Aspergillus niger Glucoamylase Thermostability by Directed Evolution." Starch - Stärke 58(10): 501-508.
Ward, M., C. Lin, D. C. Victoria, B. P. Fox, J. A. Fox, D. L. Wong, H. J. Meerman, J. P. Pucci, R. B. Fong, M. H. Heng, N. Tsurushita, C. Gieswein, M. Park and H. Wang (2004). "Characterization of humanized antibodies secreted by Aspergillus niger." Appl Environ Microbiol 70(5): 2567-2576.

23
Ward, M., L. J. Wilson, K. H. Kodama, M. W. Rey and R. M. Berka (1990). "Improved production of chymosin in Aspergillus by expression as a glucoamylase-chymosin fusion." Biotechnology (N Y) 8(5): 435-440.
Welihinda, A. A., W. Tirasophon and R. J. Kaufman (1999). "The cellular response to protein misfolding in the endoplasmic reticulum." Gene Expr 7(4-6): 293-300.
Wessels, J. G. (1993). "Fruiting in the higher fungi." Adv Microb Physiol 34: 147-202.
Wong, C. M., K. H. Wong and X. D. Chen (2008). "Glucose oxidase: natural occurrence, function, properties and industrial applications." Appl Microbiol Biotechnol 78(6): 927-938.
Wucherpfennig, T., T. Hestler and R. Krull (2011). "Morphology engineering--osmolality and its effect on Aspergillus niger morphology and productivity." Microb Cell Fact 10: 58.
Wösten, H. A. B., S. M. Moukha, J. H. Sietsma and J. G. H. Wessels (1991). "Localization of growth and secretion of proteins in Aspergillus niger." Journal of General Microbiology 137(8): 2017-2023.
Yaver, D. and P. Nham (2003). Promoter variants for expressing genes in a fungal cell.
Yoder, W. T., J. Lehmbeck and R. Borriss (2004). Heterologous expression and protein secretion in filamentous fungi. Advances in fungal biotechnology for industry, agriculture, and medicine, Kluver Academic: 201-219.

24

25
Chapter 3 Systems Biology approaches
Since the development of the first industrial processes, a major objective to maximize profit has sparked
the desire for continuous process optimization. The same is applicable for biotechnological processes, yet
with one major exception; the addition of the microorganism, thus challenging the optimization process
multidimensionally, by creating almost infinite degrees of freedom. This challenge has typically been
addressed by improving the microorganism through strain improvement programs, mediated by
mutagenesis and followed by fermentation optimization (e.g. temperature, media composition, feed
profile). This strategy poses several drawbacks; the changes obtained in the microorganism is unknown,
hence optimizing the fermentation conditions to unspecified alterations can be troublesome, e.g. changed
nutritional demand of the microorganism. Together with issues of strain instability, after several rounds of
mutagenesis, and difficulties reaching above a certain titter (plateauing), this type of optimization is less
desirable. The development of genetic engineering, metabolic engineering and “omic” methods, has
enabled the possibility of selecting targets and performing precise genetic changes in the microorganism.
To generate a background for those methods, which is also the basis of the research presented in this
thesis, overviews of Systems Biology topics will be provided in this chapter.
As described in the previous chapter, the first defined process utilizing A. niger was initiated with Currie
discovery in 1917. Throughout the many years, A. niger is still the main cell factory used for citrate
production. This has been achieved through continuous advances in both fermentation technology and
strain improvement, as outlined in chapter 2.
Before the 1980’s, where the DNA mediated transformation was developed for Aspergilli (Ballance et al.
1983), the only technique for strain improvement, was classical strain improvement through mutagenesis
and screening. It was a simple, empirical and in many cases, a powerful technique. However, the changes
made were difficult to identify and interpret. With the development of molecular techniques, studies
analyzing the role of individual cell components emerged, and efforts on strain improvement through
genetic engineering, later paved the way for metabolic engineering, tracing the beginnings of a new field of
research.
Metabolic engineering was first introduced by Bailey (1991) as, “the improvement of cellular activities by
manipulation of enzymatic, transport and regulatory functions of the cell with the use of DNA recombinant
technology.” This technique, also referred as the metabolic engineering cycle, consisting of four steps and
typically initiated by an analysis phase. The objective: to analyze the metabolic pathways of a

26
microorganism and determine the constraints and their effects on the production of desired compounds.
These predicted changes can then be implemented into the strain by genetic engineering, constituting a
synthesis phase. Followed by the characterization step where the results of the genetic alterations are
examined in vivo. The last phase comprises analysis and evaluation of the data from the previous step. With
the obtained knowledge the cycle can restart.
As indicated, metabolic engineering is a useful systematical method; however, due to cellular robustness,
as a result of enzyme redundancies and complex regulatory circuits, often enable the cell to counteract the
genetic modifications. For this reason application of Systems Biology approaches, have become increasingly
popular in assisting in identifying targets for genetic engineering. Especially the increasing number of
available genomes has enabled the shift, into integrating data from several “omics” techniques. Facilitating
a holistic view on the cellular functions and aiding the target selection for strain improvement.
Figure 3.1 An overview of the central dogma and its connection to the “omics”. Figure adapted from Jewett et al.
(2005).
3.1 “omics” techniques
The following sections will present the different Systems Biology strategies and technologies that can be
applied to Aspergillus.
ProteinRNAP
Genome Transcriptome
mRNA
DNA
Proteome
P4
P1
P3
P2
P5
Metabolome
F
l
u
x
o
m
e
S
M1
M2
M3
P
V1
V2P6
P7
M1
M2
M3
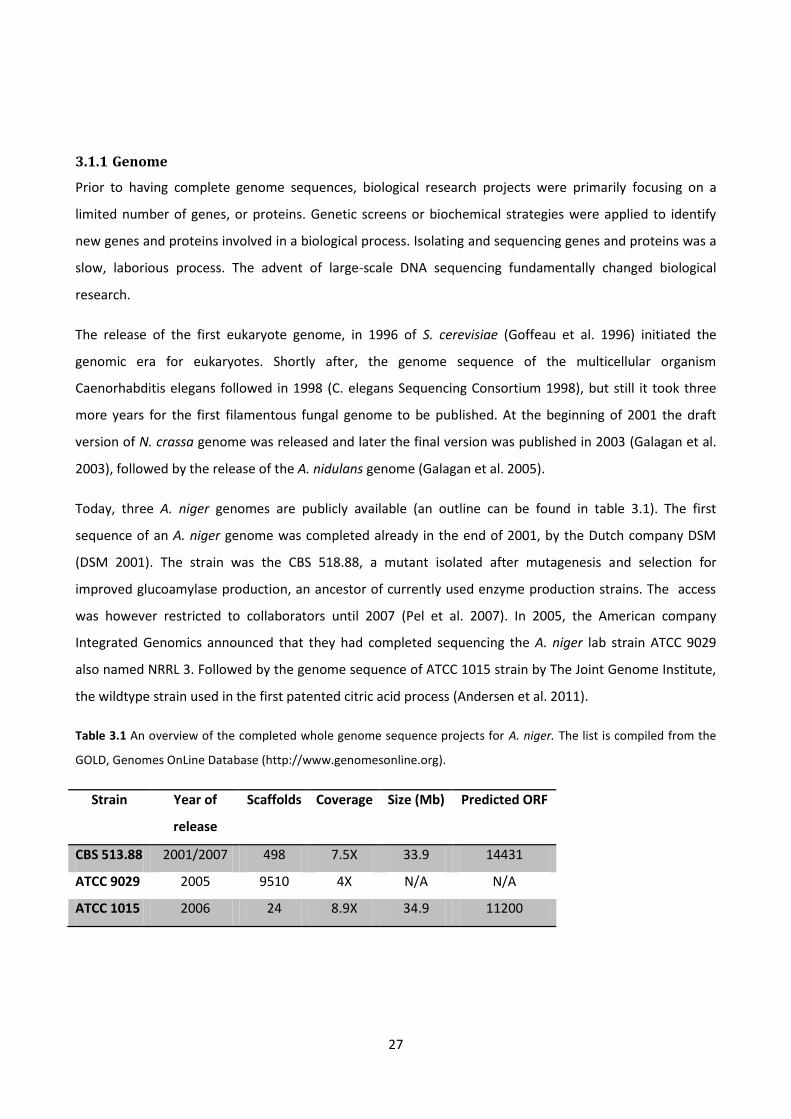
27
3.1.1 Genome
Prior to having complete genome sequences, biological research projects were primarily focusing on a
limited number of genes, or proteins. Genetic screens or biochemical strategies were applied to identify
new genes and proteins involved in a biological process. Isolating and sequencing genes and proteins was a
slow, laborious process. The advent of large-scale DNA sequencing fundamentally changed biological
research.
The release of the first eukaryote genome, in 1996 of S. cerevisiae (Goffeau et al. 1996) initiated the
genomic era for eukaryotes. Shortly after, the genome sequence of the multicellular organism
Caenorhabditis elegans followed in 1998 (C. elegans Sequencing Consortium 1998), but still it took three
more years for the first filamentous fungal genome to be published. At the beginning of 2001 the draft
version of N. crassa genome was released and later the final version was published in 2003 (Galagan et al.
2003), followed by the release of the A. nidulans genome (Galagan et al. 2005).
Today, three A. niger genomes are publicly available (an outline can be found in table 3.1). The first
sequence of an A. niger genome was completed already in the end of 2001, by the Dutch company DSM
(DSM 2001). The strain was the CBS 518.88, a mutant isolated after mutagenesis and selection for
improved glucoamylase production, an ancestor of currently used enzyme production strains. The access
was however restricted to collaborators until 2007 (Pel et al. 2007). In 2005, the American company
Integrated Genomics announced that they had completed sequencing the A. niger lab strain ATCC 9029
also named NRRL 3. Followed by the genome sequence of ATCC 1015 strain by The Joint Genome Institute,
the wildtype strain used in the first patented citric acid process (Andersen et al. 2011).
Table 3.1 An overview of the completed whole genome sequence projects for A. niger. The list is compiled from the
GOLD, Genomes OnLine Database (http://www.genomesonline.org).
Strain Year of
release
Scaffolds Coverage Size (Mb) Predicted ORF
CBS 513.88 2001/2007 498 7.5X 33.9 14431
ATCC 9029 2005 9510 4X N/A N/A
ATCC 1015 2006 24 8.9X 34.9 11200

28
Currently two A. niger sequencing projects are in progress. Those are the ATCC 1015 derived strain ATCC
11414 and a wild type strain ATCC 64973 (GOLD, 2012).
3.1.2 Transcriptome
Transcriptomics is the study of mRNA expression levels on a genome wide basis. The increased availability
of genome sequences for countless of organisms, has facilitated the application of DNA microarrays, as
routinely applied tool, to study the transcriptome. This trend is illustrated in figure 3.2.
Figure 3.2 The quantity of indexed papers containing “DNA microarray”, “transcription analysis” or “transcriptome” in
the abstract within the PubMed database per year. In the period from 1970 to 1987 19 articles exists.
It is evident from figure 3.2 that there has been an exponential development in publications within this
subject, from the mid 90’s to 2003. A major focus during this period was the challenges connected to the
technology and the statistical data handling. After many of these issues were solved, the focus has now
shifted into applying the technology as a tool for assisting in solving biological questions. Today, more than
90 articles have been published, where the microarray technology has been applied within the Aspergillus
genus, 19 of these include A. niger.
The microarray technology, the foundation of transcriptomics, evolved from Southern/Northern blotting
techniques, where oligonucleotides were attached to a substrate and probed with a known DNA sequence.
(Maskos and Southern 1992). Prior to this method, early arrays were made by spotting cDNAs onto filter
paper. The arrays required a large sample volume and only allowed simultaneously monitoring of a few
genes (Augenlicht and Kobrin 1982, Augenlicht et al. 1987). The first modern microarray analysis was
presented by (Schena et al. 1995). Employing automatic robotic spotting of DNA, microarrays were
0
500
1000
1500
2000
2500
3000
3500
Tota
l am
mo
un
t o
f e
nti
res

29
constructed and quantitative expressions of 45 Arabidopsis thaliana genes in two biological states were
examined. First transcriptome study in A. niger was by MacKenzie et al. (2005). The UPR response (outlined
in chapter 2) was examined under reductive stress induced by dithiothreitol (DTT), but it was concluded
that DTT alone does not provide for specific induction of UPR genes.
Expression arrays are a powerful tool to identify the transcriptional regulation between two or more
biological states. This was illustrated by the study of Salazar et al. (2009). Microarrays were applied to
examine the transcriptional regulation of glycerol metabolism in Aspergilli. By comparing A. niger, A.
nidulans and A. oryzae, a conserved response of 88 genes across the species was identified as being
differentially expressed when utilizing glycerol as carbon sources. Other examples are outlined in chapter 4
and 6, where microarrays were used to identify the cellular response, causing acid overproduction, either
induced by depletion of manganese or deleting of a pH responding transcription factor, respectively.
Identifying co-regulation can be a valuable technique to gain functional information of unknown genes,
since genes that participate in the same pathway, often share similar expression profiles (Eisen et al. 1998,
Chou et al. 2007). Identification of co-regulation can be done, using cluster algorithms on transcriptome
data, yet a stronger method is by combining clustering with promoter analysis. First applied by Ideker et al.
(2001), the method was used to identify the binding sites for the transcriptional activator Gal4 in S.
cerevisiae. A similar strategy was applied in A. niger by Andersen et al. (2009) to investigate the ambient
pHs effect on acid production. Applying clustering of transcription profiles, along with promoter analysis,
resulted in identification of all six putative orthologous in the pacC/palABCFHI pathway. This is a conserved
fungal signal-transduction and transcriptional-regulation system for pH sensing (MacCabe et al. 1996).
With a focus of cellular heterogeneity within an isogenic cell population de Bekker et al. (2011) developed a
protocol for single cell transcriptome analysis of A. niger hyphae. The study demonstrated that hyphae
experiencing identical environmental conditions are heterogeneous with respect to mRNA composition.
The authors speculated whether single cell transcriptome analysis could be a necessary tool to provide an
accurate understanding of the metabolic processes within a cell. The technique is still in its early phase but
represents a new study area especially with great potential for investigating interactions as
symbiotic/parasitic relationships.
The recent advances in high-throughput sequencing technology have enabled the possibility to shift from
microarray based analysis into RNA sequencing (RNA-seq). Compared with microarrays, RNA-Seq could in
theory identify all of the expressed transcripts of cells, as opposed to microarrays relying on A priori
knowledge; hence, it cannot detect novel splicing variants and novel transcripts. In addition, RNA-Seq has

30
low background noise and high sensitivity combined with becoming increasingly cost-effective with the
rapid advancements in the technology (Wang et al. 2009, Marguerat and Bahler 2010).
After genomics and transcriptomics, proteomics is considered the next step in the study of biological
systems.
3.1.3 Proteome
Proteomics is a large-scale study of proteins encoded by ORFs in an organism, with special emphasis on
physical and biochemical function. The term proteomics covers many aspects of protein analysis, including
identification, quantification, characterization, post-translational modifications and cellular localization,
recently reviewed by Kniemeyer (2011).
One of the drawbacks using transcriptomics is the lack of capturing post transcriptional regulation. This has
been exemplified in several studies where scalability between mRNA and protein abundance is poor.
Reviewed by de Hoog and Mann (2004) the authors stated, “biological function is not carried out by the
static genome but mainly by the dynamic population of proteins determined by an interplay of gene and
protein regulation with extracellular influences”. This makes proteomics an important tool to give a more
complete picture of regulatory networks.
Proteins vary greatly in size, shape, isoelectric point, hydrophobicity and biological affinity. In addition to
the diversity of physical properties, protein abundance in a proteome can range over six to twelve order of
magnitude. Transcription factors may range from one to ten copies pr cell, while structural proteins may be
present at 1,000,000 copies per cell (Ghaemmaghami et al. 2003). Compare to the transcriptome an
organism’s proteome is considerably more complicated. Alternative RNA splicing, RNA editing, proteolytic
processing and posttranslational modifications dramatically increase the complexity of a cell’s proteome
(Modrek and Lee 2002, Zavolan et al. 2002).

31
Figure 3.3 The two fundamental different approaches performing modern proteomics. A protein sample is
fractionated by gel electrophoresis, termed top-down or digested by trypsin prior to analysis designated bottoms up.
Prior to available genome sequences, proteomics consisted virtually of only two-dimensional gel
electrophoresis (2-DE), or top-down proteomics (figure 3.3). The method typically consists of isoelectric
focusing of proteins in the first dimension, followed by separation of proteins according to their molecular
mass in the second dimension. The proteins of interest could then be isolated and later sequenced using
Edman sequencing, identifying one amino acid at the time (Niall 1973). First, applied to A. nidulans by
Weatherbee (1985) to investigate the role of tubulin in fungal development. The 2D gels and Edman
sequencing are slow and laborious techniques. However, with advances in multiplexing techniques
designated as differential gel electrophoresis (DIGE), and improved protein sequencing techniques as
Matrix-assisted laser desorption/ionization-Time of Flight (MALDI-TOF), the 2D gels is still today an
important technique, as it allows studies of native proteins (top down).
The improvement in mass spectrometry (MS) and the availability of genome sequences, tandem-MS/MS for
peptide and protein identification and quantification is now possible. Combined with liquid
chromatography (LC), complex protein samples can be separated and analyzed and consequently avoiding
the laborious 2-DE. Two fundamentally different methods exist. The first technique, termed shutgun
proteomics is a bottoms up approach (figure 3.3), initially described by McCormack et al. (1997). This

32
method employs a sample preparation step, where the protein mixture is digested by a protease, typically
trypsin, reducing the native proteins into peptides of 1-3 kDa. The treatment aids both the identification
and the quantification, of the proteins. The sample is then separated using liquid chromatography, followed
by tandem MS/MS. Next follows a crucial step of protein identification. An automated process using a
database searching algorithm based on the DNA-predicted protein sequence. Lastly comes, the
quantification step, which can be done with or without labels (e.g isotopic, Isobaric tag) and have recently
been reviewed by Porteus et al. (2011). The shutgun method has become the workhorse in modern
proteomics, with high throughput and automation. Therefore, this method was selected as the method of
choice in chapter 4. Nevertheless, the bottom-up approach has distinct limitations in characterizing protein
modifications, due to only a small fraction of peptides is recovered from digestion. This ultimately results in
low percentage coverage of the protein sequence. In contrast to the shutgun approach, top-down MS
analysis of intact proteins was demonstrated by Breuker et al.(2008). This has recently become possible
with the newest generation of Fourier-transform mass spectrometer that has a unique high mass resolving
power combined with high accuracy. However, this method still faces many technical challenges, as protein
solubility compared with peptides, sensitivity, detection limits and the demand for high-end
instrumentation making top-down MS in its early developmental stage (Zhang and Ge 2011).
A summary of the different proteomic techniques can be found in table 3.2.
Table 3.2 Proteomics strategies
Technique Descriptions Advances / Disadvances
2-DE Two dimensional gel analysis
of native proteins
Analysis on native proteins / Laborious, high
variance due to gel to gel variation
DIGE Two dimensional gel analysis
with sample multiplexing of
native proteins
Analysis on native proteins, low variance
compared with 2-DE / Laborious
Shutgun-MS LC-MS/MS analysis of trypsin
digested proteins
Highly automated sample prep. and run, low to
moderate variance dependent on method and
equipment / Trypsin digestion necessary, only
abundant peptides is identified
Top-down MS LC-MS/MS analysis of native
proteins
Highly automated sample prep. and run, low
variance / Require state of the art equipment,
protein solubility, emerging technique

33
Even with the development for sample preparation specific for filamentous fungi and compatible with LC-
MS/MS (Kim et al. 2007), the majority of proteome studies in Aspergillus are based on 2-DE techniques.
The challenges within the experimental procedures reflects the number of studies on Aspergillus using
proteomics compared to transcriptomics yielding a factor of three fewer studies and for A. niger only four
studies exist.
The first full proteome study in A. niger was conducted by Sorensen et al. (2009), where the full proteome
was examined using 2-DE combined with MALDI. This was applied to uncover how fumonisin production by
A. niger was influenced by starch and lactate addition. The study was performed on agar plates containing
complex media, 59 spots were picked for identification, yet only 32 proteins (19 with putative annotation,
13 with predicted function) were identified. On this basis, the authors concluded that fumonisin production
by A. niger was regulated by the pool of acetyl-CoA, a precursor for many secondary metabolites.
Fumonisin production in A. niger is also the subject of chapter 8.
The work by Lu et al. (2010) presents a comprehensive study of A. niger’s physiology growing in defined
medium with xylose or maltose as carbon source, both in shake flasks and bioreactors. 2-D gels with
MALDI-TOF were exploited for the intracellular proteome whereas a shotgun LC MS/MS method was used
for extracellular proteome analysis. The choice of carbon source greatly affects the extracellular proteome,
but has minor influence on the intracellular proteome. Lastly, the choice of cultivation had a profound
effect on the intracellular proteome especially on the protein folding machinery.
The first LC-MS/MS whole cell lysate proteome study in A. niger is the one of Ferreira de Oliveira et al.
(2010) where the effects of the xylose induction of cellulase and hemicellulase enzyme secretion was
examined. 282 proteins were found only in the xylose induced samples. Within this subset an increase in
small GTPases, known to be associated with polarized growth, exocytosis, and endocytosis was identified
together with proteins related with the endoplasmic-reticulum-associated degradation.
3.1.4 Metabolomics and fluxomics
The metabolome refers to the complete set of small-molecule metabolites, including the primary and
secondary metabolites, metabolic intermediates, and signaling molecules. The fluxome is referred to as the
totality of all fluxes in a system.

34
Where transcriptomics and proteomics provide a measure of metabolic network capacities, metabolomics
and fluxomics, deliver a measure of thermodynamic driving forces leading to a direct measure of the
metabolic phenotype. However, the study of the full set of metabolites and fluxes is a complex task
compared to transcriptomics and proteomics.
The central metabolomics challenge is that, no single extraction procedure works for all metabolites
because conditions that stabilize one type of compound will destroy other types or interfere with their
analysis. Consequently, a combination of several extraction protocols and analytical methods are required
to separate and identify the metabolites. The complex nature of obtaining large scale quantitative
metabolome data in Aspergillus are reflected in the few published studies. Of the 15 research articles, only
one can be classified as a large scale, with more than 450 identified metabolites (Kouskoumvekaki et al.
2008). To circumvent the complexity of large scale metabolomics, metabolite profiling (Smedsgaard and
Nielsen 2005), and reporter metabolite identification (Patil and Nielsen 2005) has been developed. Both
approaches rely on identifying a subset of metabolites, to elucidate changes in parts of the metabolism
(Vongsangnak et al. 2009).
Fluxomics carries similar issues of multiple extraction necessities, but the analytical part is most often
performed solely by GC-MS. Fluxes are estimated indirectly and typically a measurement of the fate, by an
isotopic label in various metabolite pools. To successfully perform these estimations, the requirement of an
isotopic steady-state is of vital importance. Identical to metabolomics, very few research papers have been
published within fluxome analysis in fungi. The study from Pedersen et al. (2000), flux analysis was applied
to characterized an oxalic acid nonproducing strain of A. niger. The analysis revealed that, the lack of
oxalate formation resulted in, increased flux through the Pentose Phosphate Pathway. David et al. (2005)
applied fluxomics to examine creA influences of A. nidulans during growth on glucose and xylose. Deletion
of the creA gene resulted in a 20 % decrease in the flux through the oxidative part of the pentose-
phosphate pathway on glucose; contrary, addition of xylose to the growth medium of the mutant led to an
increase of about 40 % in the activity of the oxidative part of the pentose-phosphate pathway. The few
metabolomics and fluxomics studies, in fungi, underlines the high level of complexity for these two “omics”
techniques; hence, neither metabolomics nor fluxome were applied in the research presented in this thesis.
As observed from figure 3.1, all “omics” are derived from the same biomass. Except genomics, which can be
considered static, the remaining “omics” are highly dynamic and influenced by the environment the sample
originates. Illustrated by single cell transcriptomics, cellular heterogeneity within an isogenic cell population
is apparent. This signifies that the signals/data obtained is not from a single source, but rather an average

35
across the cells. Accordingly, controlling and minimizing the cellular heterogeneity is vital to ensure quality
data and can be arrived by submerged cultivations.
3.2 Biomass preparation
Several methods, for generating biomass using submerged cultures exist. The most simple and fast
technique is a shake flask cultivation, typically carried out in an Erlenmeyer flask equipped with a cotton
stopper. The aeration in shake flasks is achieved by simple gas/liquid contact aided by rotary movement
hence does not require any special equipment. However, this method has several distinct drawbacks.
Active pH control is conventionally not possible in a shake flask, making the pH non constant. This can to
some extend be counteracted by adding a buffer agent to the medium, yet in most cases not enough to
keep the pH steady, especially when working with organisms producing acids. Another major drawback is
the lack of bioprocess monitoring, as CO2 production, an essential parameter to determine the biological
state of the microorganism. This parameter cannot be measured due to the lack of active aeration of the
culture, which also leads to the last major problem; a low oxygen transfer rate. The oxygen transfer rate is
primarily dependent upon the volumetric mass transfer coefficient, kLa that in shake flaks is range of 30-60
h-1 (Gupta and Rao 2003). Compared to a bioreactor kLa values are in general a factor of 10-20 higher
(Garcia-Ochoa and Gomez 2009). Changes in oxygen availability may lead to drastic effects on the
metabolism, increasing cellular heterogeneities.
In contrast, a bioreactor offers a high level of monitoring and control of the growing culture. The reactor is
aerated, stirred pH controlled and the off gas can be monitored. Operating a bioreactor is laborious task,
but the data acquired is superior compared to those obtained from shake flasks. A bioreactor can be
operated as batch, continuous or fed-batch mode. Especially the continuous mode, also termed a
chemostat, is the gold standard within obtaining a homogenous biomass by reaching a steady state. A
steady state is defined as a stable condition that does not change overtime and it is characterized by
constant substrate and product concentrations. The steady state is obtained through a strict control of the
growth rate. Hereby, it is possible to study the influence of a single operational parameter and with all
other parameters kept constant, greatly lowers the variance between the samples.
One of the challenges in reaching a steady state is to have a homogenous cell culture, but unlike yeast and
bacteria, filamentous fungi can have several growth morphologies, as described in chapter 2. The many
parameters affecting the morphology, determine the possibility of reaching a steady state. An indication of
the difficulties in applying chemostat cultivation for studying A. niger, can be found in the literature. Less

36
than 8 % of all cultivation studies of A. niger involve a chemostat (29/373), comparing to 20 % (397/1843)
of S. cerevisiae. Further details regarding A. niger chemostat cultivations, can be found in chapter 6.
Special circumstances exist where a bioreactor cannot be applied, illustrated in chapter 4. As mentioned in
chapter 2 manganese depletion is an initiator of the citrate overflow metabolism in A. niger. Consequently,
examination of this response cannot to be conducted with contact to a metal surface due to manganese
adsorption. A silanized glass surface is however unable to adsorb ions leaving shake flaks the only option to
study this response.
The following chapter provides an in-depth analysis of the transcriptional and translational changes in A.
niger’s metabolism leading to the citrate overflow metabolism.

37
3.3 Reference
Andersen, M. R., L. Lehmann and J. Nielsen (2009). "Systemic analysis of the response of Aspergillus niger to ambient pH." Genome Biol 10(5): R47.
Andersen, M. R., M. P. Salazar, P. J. Schaap, P. J. van de Vondervoort, D. Culley, J. Thykaer, J. C. Frisvad, K. F. Nielsen, R. Albang, K. Albermann, R. M. Berka, G. H. Braus, S. A. Braus-Stromeyer, L. M. Corrochano, Z. Dai, P. W. van Dijck, G. Hofmann, L. L. Lasure, J. K. Magnuson, H. Menke, M. Meijer, S. L. Meijer, J. B. Nielsen, M. L. Nielsen, A. J. van Ooyen, H. J. Pel, L. Poulsen, R. A. Samson, H. Stam, A. Tsang, J. M. van den Brink, A. Atkins, A. Aerts, H. Shapiro, J. Pangilinan, A. Salamov, Y. Lou, E. Lindquist, S. Lucas, J. Grimwood, I. V. Grigoriev, C. P. Kubicek, D. Martinez, N. N. van Peij, J. A. Roubos, J. Nielsen and S. E. Baker (2011). "Comparative genomics of citric-acid-producing Aspergillus niger ATCC 1015 versus enzyme-producing CBS 513.88." Genome Res 21(6): 885-897.
Augenlicht, L. H. and D. Kobrin (1982). "Cloning and screening of sequences expressed in a mouse colon tumor." Cancer Res 42(3): 1088-1093.
Augenlicht, L. H., M. Z. Wahrman, H. Halsey, L. Anderson, J. Taylor and M. Lipkin (1987). "Expression of cloned sequences in biopsies of human colonic tissue and in colonic carcinoma cells induced to differentiate in vitro." Cancer Res 47(22): 6017-6021.
Bailey, J. E. (1991). "Toward a science of metabolic engineering." Science 252(5013): 1668-1675.
Ballance, D. J., F. P. Buxton and G. Turner (1983). "Transformation of Aspergillus nidulans by the orotidine-5'-phosphate decarboxylase gene of Neurospora crassa." Biochemical and biophysical research communications 112(1): 284-289.
Breuker, K., M. Jin, X. Han, H. Jiang and F. W. McLafferty (2008). "Top-Down Identification and Characterization of Biomolecules by Mass Spectrometry." Journal of the American Society for Mass Spectrometry 19(8): 1045-1053.
Chou, J. W., T. Zhou, W. K. Kaufmann, R. S. Paules and P. R. Bushel (2007). "Extracting gene expression patterns and identifying co-expressed genes from microarray data reveals biologically responsive processes." BMC Bioinformatics 8: 427.
Consortium, C. e. S. (1998). "Genome sequence of the nematode C. elegans: a platform for investigating biology." Science 282(5396): 2012-2018.
David, H., A. M. Krogh, C. Roca, M. Åkesson and J. Nielsen (2005). "CreA influences the metabolic fluxes of Aspergillus nidulans during growth on glucose and xylose." Microbiology 151(7): 2209-2221.

38
de Bekker, C., O. Bruning, M. J. Jonker, T. M. Breit and H. A. Wosten (2011). "Single cell transcriptomics of neighboring hyphae of Aspergillus niger." Genome Biol 12(8): R71.
de Hoog, C. L. and M. Mann (2004). "Proteomics." Annu Rev Genomics Hum Genet 5: 267-293.
DSM. (2001). "DSM determines DNA sequence of Aspergillus niger genome." from http://www.dsm.com/en_US/cworld/public/media/pages/press-releases/45_01_Aspergillus.jsp.
Eisen, M. B., P. T. Spellman, P. O. Brown and D. Botstein (1998). "Cluster analysis and display of genome-wide expression patterns." Proc Natl Acad Sci U S A 95(25): 14863-14868.
Ferreira de Oliveira, J. M., M. W. van Passel, P. J. Schaap and L. H. de Graaff (2010). "Shotgun proteomics of Aspergillus niger microsomes upon D-xylose induction." Appl Environ Microbiol 76(13): 4421-4429.
Galagan, J. E., S. E. Calvo, K. A. Borkovich, E. U. Selker, N. D. Read, D. Jaffe, W. FitzHugh, L. J. Ma, S. Smirnov, S. Purcell, B. Rehman, T. Elkins, R. Engels, S. Wang, C. B. Nielsen, J. Butler, M. Endrizzi, D. Qui, P. Ianakiev, D. Bell-Pedersen, M. A. Nelson, M. Werner-Washburne, C. P. Selitrennikoff, J. A. Kinsey, E. L. Braun, A. Zelter, U. Schulte, G. O. Kothe, G. Jedd, W. Mewes, C. Staben, E. Marcotte, D. Greenberg, A. Roy, K. Foley, J. Naylor, N. Stange-Thomann, R. Barrett, S. Gnerre, M. Kamal, M. Kamvysselis, E. Mauceli, C. Bielke, S. Rudd, D. Frishman, S. Krystofova, C. Rasmussen, R. L. Metzenberg, D. D. Perkins, S. Kroken, C. Cogoni, G. Macino, D. Catcheside, W. Li, R. J. Pratt, S. A. Osmani, C. P. DeSouza, L. Glass, M. J. Orbach, J. A. Berglund, R. Voelker, O. Yarden, M. Plamann, S. Seiler, J. Dunlap, A. Radford, R. Aramayo, D. O. Natvig, L. A. Alex, G. Mannhaupt, D. J. Ebbole, M. Freitag, I. Paulsen, M. S. Sachs, E. S. Lander, C. Nusbaum and B. Birren (2003). "The genome sequence of the filamentous fungus Neurospora crassa." Nature 422(6934): 859-868.
Galagan, J. E., S. E. Calvo, C. Cuomo, L. J. Ma, J. R. Wortman, S. Batzoglou, S. I. Lee, M. Basturkmen, C. C. Spevak, J. Clutterbuck, V. Kapitonov, J. Jurka, C. Scazzocchio, M. Farman, J. Butler, S. Purcell, S. Harris, G. H. Braus, O. Draht, S. Busch, C. D'Enfert, C. Bouchier, G. H. Goldman, D. Bell-Pedersen, S. Griffiths-Jones, J. H. Doonan, J. Yu, K. Vienken, A. Pain, M. Freitag, E. U. Selker, D. B. Archer, M. A. Penalva, B. R. Oakley, M. Momany, T. Tanaka, T. Kumagai, K. Asai, M. Machida, W. C. Nierman, D. W. Denning, M. Caddick, M. Hynes, M. Paoletti, R. Fischer, B. Miller, P. Dyer, M. S. Sachs, S. A. Osmani and B. W. Birren (2005). "Sequencing of Aspergillus nidulans and comparative analysis with A. fumigatus and A. oryzae." Nature 438(7071): 1105-1115.
Garcia-Ochoa, F. and E. Gomez (2009). "Bioreactor scale-up and oxygen transfer rate in microbial processes: An overview." Biotechnology Advances 27(2): 153-176.
Ghaemmaghami, S., W. K. Huh, K. Bower, R. W. Howson, A. Belle, N. Dephoure, E. K. O'Shea and J. S. Weissman (2003). "Global analysis of protein expression in yeast." Nature 425(6959): 737-741.
Goffeau, A., B. G. Barrell, H. Bussey, R. W. Davis, B. Dujon, H. Feldmann, F. Galibert, J. D. Hoheisel, C. Jacq, M. Johnston, E. J. Louis, H. W. Mewes, Y. Murakami, P. Philippsen, H. Tettelin and S. G. Oliver (1996). "Life with 6000 genes." Science 274(5287): 546, 563-547.

39
Gupta, A. and G. Rao (2003). "A study of oxygen transfer in shake flasks using a non-invasive oxygen sensor." Biotechnology and Bioengineering 84(3): 351-358.
Ideker, T., T. Galitski and L. Hood (2001). "A new approach to decoding life: systems biology." Annu Rev Genomics Hum Genet 2: 343-372.
Jewett, M., A. Oliveira, K. Patil and J. Nielsen (2005). "The role of high-throughput transcriptome analysis in metabolic engineering." Biotechnology and Bioprocess Engineering 10(5): 385-399.
Kim, Y., M. P. Nandakumar and M. R. Marten (2007). "Proteomics of filamentous fungi." Trends Biotechnol 25(9): 395-400.
Kniemeyer, O. (2011). "Proteomics of eukaryotic microorganisms: The medically and biotechnologically important fungal genus Aspergillus." Proteomics 11(15): 3232-3243.
Kouskoumvekaki, I., Z. Yang, S. O. Jonsdottir, L. Olsson and G. Panagiotou (2008). "Identification of biomarkers for genotyping Aspergilli using non-linear methods for clustering and classification." BMC Bioinformatics 9: 59.
Lu, X., J. Sun, M. Nimtz, J. Wissing, A. P. Zeng and U. Rinas (2010). "The intra- and extracellular proteome of Aspergillus niger growing on defined medium with xylose or maltose as carbon substrate." Microb Cell Fact 9: 23.
MacCabe, A. P., J. P. Van den Hombergh, J. Tilburn, H. N. Arst, Jr. and J. Visser (1996). "Identification, cloning and analysis of the Aspergillus niger gene pacC, a wide domain regulatory gene responsive to ambient pH." Mol Gen Genet 250(3): 367-374.
MacKenzie, D. A., T. Guillemette, H. Al-Sheikh, A. J. Watson, D. J. Jeenes, P. Wongwathanarat, N. S. Dunn-Coleman, N. van Peij and D. B. Archer (2005). "UPR-independent dithiothreitol stress-induced genes in Aspergillus niger." Mol Genet Genomics 274(4): 410-418.
Marguerat, S. and J. Bahler (2010). "RNA-seq: from technology to biology." Cell Mol Life Sci 67(4): 569-579.
Maskos, U. and E. M. Southern (1992). "Oligonucleotide hybridizations on glass supports: a novel linker for oligonucleotide synthesis and hybridization properties of oligonucleotides synthesised in situ." Nucleic Acids Res 20(7): 1679-1684.
McCormack, A. L., D. M. Schieltz, B. Goode, S. Yang, G. Barnes, D. Drubin and J. R. Yates, 3rd (1997). "Direct analysis and identification of proteins in mixtures by LC/MS/MS and database searching at the low-femtomole level." Anal Chem 69(4): 767-776.

40
Modrek, B. and C. Lee (2002). "A genomic view of alternative splicing." Nat Genet 30(1): 13-19.
Niall, H. D. (1973). "Automated Edman degradation: the protein sequenator." Methods Enzymol 27: 942-1010.
Patil, K. R. and J. Nielsen (2005). "Uncovering transcriptional regulation of metabolism by using metabolic network topology." Proceedings of the National Academy of Sciences of the United States of America 102(8): 2685-2689.
Pedersen, H., B. Christensen, C. Hjort and J. Nielsen (2000). "Construction and Characterization of an Oxalic Acid Nonproducing Strain of Aspergillus niger." Metabolic Engineering 2(1): 34-41.
Pel, H. J., J. H. de Winde, D. B. Archer, P. S. Dyer, G. Hofmann, P. J. Schaap, G. Turner, R. P. de Vries, R. Albang, K. Albermann, M. R. Andersen, J. D. Bendtsen, J. A. Benen, M. van den Berg, S. Breestraat, M. X. Caddick, R. Contreras, M. Cornell, P. M. Coutinho, E. G. Danchin, A. J. Debets, P. Dekker, P. W. van Dijck, A. van Dijk, L. Dijkhuizen, A. J. Driessen, C. d'Enfert, S. Geysens, C. Goosen, G. S. Groot, P. W. de Groot, T. Guillemette, B. Henrissat, M. Herweijer, J. P. van den Hombergh, C. A. van den Hondel, R. T. van der Heijden, R. M. van der Kaaij, F. M. Klis, H. J. Kools, C. P. Kubicek, P. A. van Kuyk, J. Lauber, X. Lu, M. J. van der Maarel, R. Meulenberg, H. Menke, M. A. Mortimer, J. Nielsen, S. G. Oliver, M. Olsthoorn, K. Pal, N. N. van Peij, A. F. Ram, U. Rinas, J. A. Roubos, C. M. Sagt, M. Schmoll, J. Sun, D. Ussery, J. Varga, W. Vervecken, P. J. van de Vondervoort, H. Wedler, H. A. Wosten, A. P. Zeng, A. J. van Ooyen, J. Visser and H. Stam (2007). "Genome sequencing and analysis of the versatile cell factory Aspergillus niger CBS 513.88." Nat Biotechnol 25(2): 221-231.
Porteus, B., C. Kocharunchitt, R. E. Nilsson, T. Ross and J. P. Bowman (2011). "Utility of gel-free, label-free shotgun proteomics approaches to investigate microorganisms." Appl Microbiol Biotechnol 90(2): 407-416.
Salazar, M., W. Vongsangnak, G. Panagiotou, M. R. Andersen and J. Nielsen (2009). "Uncovering transcriptional regulation of glycerol metabolism in Aspergilli through genome-wide gene expression data analysis." Mol Genet Genomics 282(6): 571-586.
Schena, M., D. Shalon, R. W. Davis and P. O. Brown (1995). "Quantitative monitoring of gene expression patterns with a complementary DNA microarray." Science 270(5235): 467-470.
Smedsgaard, J. and J. Nielsen (2005). "Metabolite profiling of fungi and yeast: from phenotype to metabolome by MS and informatics." Journal of Experimental Botany 56(410): 273-286.
Sorensen, B. S., M. R. Horsman, H. Vorum, B. Honore, J. Overgaard and J. Alsner (2009). "Proteins upregulated by mild and severe hypoxia in squamous cell carcinomas in vitro identified by proteomics." Radiother Oncol 92(3): 443-449.

41
Vongsangnak, W., M. Salazar, K. Hansen and J. Nielsen (2009). "Genome-wide analysis of maltose utilization and regulation in aspergilli." Microbiology 155(Pt 12): 3893-3902.
Wang, Z., M. Gerstein and M. Snyder (2009). "RNA-Seq: a revolutionary tool for transcriptomics." Nat Rev Genet 10(1): 57-63.
Weatherbee, J. A., G. S. May, J. Gambino and N. R. Morris (1985). "Involvement of a particular species of beta-tubulin (beta 3) in conidial development in Aspergillus nidulans." The Journal of cell biology 101(3): 706-711.
Zavolan, M., E. van Nimwegen and T. Gaasterland (2002). "Splice variation in mouse full-length cDNAs identified by mapping to the mouse genome." Genome Res 12(9): 1377-1385.
Zhang, H. and Y. Ge (2011). "Comprehensive analysis of protein modifications by top-down mass spectrometry." Circ Cardiovasc Genet 4(6): 711.

42
43
Chapter 4 Transcriptome and proteome analysis of the correlation
between citric acid formation and manganese limitation in
Aspergillus niger
Poulsen L, Dai Z, Panisko EA, Lantz AE, Bruno KS, Daly DS, Nielsen J, Baker SE, Thykaer J
4.1 Abstract
A. niger is well known for its capability to produce citrate in high amounts but despite much research on
the mechanisms underlying citrate production, the details of the metabolic response causing citrate
production has not been fully understood. Manganese is known to have an important effect on citrate
production as manganese limited condition is a requirement to obtain high-level citrate formation. To
identify the translational regulation causing citric acid overflow metabolism, we analyzed transcriptome
and proteome data from cultivations in manganese limitation and manganese excess conditions. Beside
three already described main responses, we identified two novel events. The first metabolic response was
strong down regulation of phosphoenolpyruvate carboxykinase (PEPCK) at manganese limited conditions,
which was later confirmed by in vivo experiments. Down regulation of the first step in the gluconeogenesis
while maintaining a high activity through glycolysis leaves no alternative to regulate TCA intermediates
than secreting citrate into the medium. Thus, citrate formation is the result of adjustment of the
intracellular concentrations of TCA metabolites. The other novel observation was a strong down regulation
of two cation transporters at manganese limited conditions. Based on these results, it was argued that
shutdown of these two transporters makes the cell unable to maintain homeostasis thereby making
secretion of citric acid beneficial.

44
4.2 Introduction
Citrate is the most intensively produced fungal bulk chemical, with a global production estimated to be
above 1,600,000 tons/year in 2007 (Legisa and Mattey 2007). Aspergillus niger cultivations meet the
largest part of this demand with a process that was first described and patented by Currie in 1917. Despite
decades of research, only a limited part of the changes in the metabolism that leads to citric acid overflow
metabolism is understood in detail. Three key metabolic events have been stated as being responsible for
citric overflow metabolism [review 2007]:
fast uptake of glucose
unrestricted metabolic flow through glycolysis
uncoupling NADH re-oxidation from proton pumping
Furthermore, initiation of overflow metabolism is related to limitation of certain trace metals including
Zn2+, Fe2+, Cu2+ and especially Mn2+ (Shu and Johnson 1948).
Fast uptake of glucose is mediated by A. niger having two classes of glucose transporters, an active high
affinity transporter (Km = 0.26 mmol) which is present in a wide range of carbon concentrations (Torres et
al. 1996b) and a low affinity facilitated diffusion transporter (Km = 3.67 mmol) that is only expressed at high
sugar concentration (Torres et al. 1996a). Together, these two transporters ensure a high glucose uptake
which facilitates citrate overflow metabolism.
When citrate is being formed, the majority of carbon is being metabolized through the glycolytic pathway
(Cleland and Johnson 1954) whereas the pentose phosphate pathway flux is low corresponding to a few
percentages of the channeled carbon (Legiša and Mattey 1986). Glycolysis consists of 10 reactions where
the steps catalyzed by hexokinase, phosphofructokinase and pyruvate kinase are of special interest as they
are exergonic and considered having regulatory functions. The hexokinase mediated phosphorylation of
glucose is the first committed step in glucose metabolism. The regulatory importance of hexokinase has
been demonstrated both in silico (Torres 1994) and in vitro ((Schreferl-Kunar et al. 1989) and confirmed by
biochemical characterization of the enzyme in vivo (Wolschek and Kubicek 1997, Panneman et al. 1998).
The second control point is the phosphofructokinase, responsible for phosphorylating fructose-6-
phosphate to fructose-1,6-bisphosphate. Before this point, the flux could revert and enter the pentose
phosphate pathway and this step is therefore considered the first committed step in the glycolysis. Despite
the importance of this regulatory step, it has been shown that glyceraldehyde 3-phosphate dehydrogenase
is also of regulatory importance in A. niger when grown at high glucose concentrations ((Peksel et al. 2002).
An interesting observation since the step catalyzed by glyceraldehyde 3-phosphate dehydrogenase is not

45
usually considered to have a regulatory function. Pyruvate kinase is the last enzyme of glycolysis converting
phosphoenolpyruvate to pyruvate. This was earlier considered to be an important regulatory point in
filamentous fungi based on studies in Neurospora crassa (Kapoor 1975) and Mucor rouxii (Terenzi et al.
1971). However, pyruvate kinase is not considered to have any important regulatory function in A. niger
(Meixner-Monori et al. 1986).
A. niger have two distinct pathways for NADH reoxidation, one pathway coupled to the proton pumping
NADH:ubiquinone oxidoreductase complex (complex 1) responsible for the oxidative phosphorylation and
an alternative NADH reoxidation pathway not associated with proton pumping (Wallrath et al. 1992). The
latter is found to be constitutive active, however only with 1% of the affinity to NADH compared complex 1
under normal physiological conditions. A connection between the alternative NADH reoxidation pathway
and citrate formation has been hypothesized based on data from a high citrate yielding strain, which
showed no activity of the complex 1 (Wallrath et al. 1991) and it is also supported by genome scale
metabolic modeling (Andersen et al. 2008). In addition, deletion of complex 1 resulted in accumulation of
intracellular citrate, but the mutant was not capable of secreting it into the extracellular medium (Schmidt
et al. 1992, Promper et al. 1993). The conversion of glucose to citrate generates one mole of ATP and two
moles of NADH, and in order to ensure a high citrate yield on glucose it is therefore important to ensure
efficient removal of excess ATP and NADH reducing equivalents(Andersen et al. 2008).
The role of Mn2+ is especially interesting in terms of citric acid production, since limitation of this metal has
been shown to be a key contributor for ensuring overflow metabolism towards citrate. The effect of Mn2+
has been subjected to several theories. One is that manganese limitation leads to an increase in protein
degradation hence increased protein turnover (Ma et al. 1985, Schreferl et al. 1986). Dai et al (2004)
confirmed that a number of genes involved in amino acid metabolism are differentially regulated by the
depletion of Mn2+. Protein breakdown under manganese limitation results in high intracellular NH4+
concentration and the increased intracellular concentration of NH4+ was argued to prevent citrate-
mediated feedback inhibition of glucose catabolism maintaining a high glycolytic flux (Rohr and Kubicek
1981). However, Papagianni et al. (2005) subsequently showed that the intracellular concentration of NH4+
was not affected by protein degradation, since the ammonium ions were combined with glucose forming
glucosamine (Papagianni et al. 2005). Citrate permease has also been assigned an important role in citrate
production. This permease is responsible for the transport of citrate from the cytosol to the extracellular
medium and is required to work against a strong gradient suggesting an ATP dependent process. A study
made by (Netik et al. 1997) showed that this permease has a reciprocal regulation of citrate efflux and

46
uptake controlled by Mn2+. This could imply that it is not the same permease that catalyzes both processes
or as proposed by Glusker (1992) that the permease only can transport Mn2+ chelated citrate.
As outlined above, the metabolic foundation for citric acid production is of a complex nature and especially
the role of manganese depletion is intriguing. In this study, transcriptional profiles of A. niger during growth
at both Mn2+ limited and enriched conditions were characterized, focusing on the metabolic response
associated with citric acid production. In addition, proteome analysis was carried out on the same sample
material to investigate if the observed transcriptional response could be traced on the protein level.

47
4.3 Materials and Methods
4.3.1 Strains and spore preparation
A. niger strain (ATCC 11414), obtained from the American Type Culture Collection (12301 Parklawn Drive,
Rockville, MD, 20852) was grown on potato dextrose agar plates (PDA) at 30°C for culture maintenance and
spore preparation. Cultures were incubated for five days and the spores were harvested by washing with
sterile 0.8% Tween 80 (polyoxyethylenesorbitan monooleate). Conidia were enumerated with a
hemacytometer. Aliquots of the resulting spore suspension (1 × 10⁹ spores/ml) were used to inoculate
baffled-flask liquid cultures.
4.3.2 Media
The citric acid production (CAP) medium contained 140 g/l of glucose, 3.1 g/l NH4NO3, 0.15 g/l KH2PO4, 0.15
g/l NaCl, 2.2 g/l MgSO4·7H2O, 6.6 mg/l ZnSO4·7H2O, and 0.1 mg/l FeCl3 adjusted to pH 2.0 with 4 M H2SO4.
Cations were removed from the glucose solution by ion-exchange on Dowex 50W-X8, 100-200 mesh, H
cation exchange resin (Fisher Scientific, Pittsburgh, PA) prior to adding the other nutrient components.
Manganese concentration in the media was adjusted by the addition of appropriate volumes of a stock
solution of MnCl2·4H2O (10 mM). The Mn2+ concentration in the media, before and after growth of A. niger,
was determined using a Hewlett-Packard (HP) 4500 series inductively coupled plasma-mass spectrometry
with sub-part per billion detection limit (ICP-MS, Agilent Technologies, Palo Alto, CA). The samples and
manganese standard solutions were serially diluted with ultra-pure de-ionized water to optimal mass
ranges before being injected into the ICP-MS for measurement. Three replicates of each sample and
standard were measured. Concentrations of manganese in the samples were calculated based on the signal
response of the manganese standards.
4.3.3 Culture methods
Glass baffled-flasks of 1000 ml were silanized with SigmaCote® (Sigma, St. Louis, MO) to minimize leaching
of metals. To produce sufficient biomass for RNA and protein isolations, nine one-liter baffled-flasks
containing 250 ml of CAP media with 10 ppb Mn2+ were used. Each flask was inoculated with 1 × 10⁶
spores/ml and incubated for thirty hours at 30oC and 220 rpm to obtain large-amount biomass in pelleted
morphology, then 1000 ppb Mn2+ was added to three of the flasks to induce filamentous growth and the
same amount of H2O was added into another three flasks for control. This procedure was replicated three
times with the manganese induction of filamentous growth for one hour. Prior to harvest the biomass,

48
small aliquot was taken and observed under microscopy to examine the filamentous growth. The growth of
fungal cultures was suspended by rapid cooling in an ice-water bath. The biomass was immediately
separated from the culture supernatant by centrifugation for 10 minutes at 4oC and 10,000 g. The biomass
was transferred from 500 ml centrifugation bottles to 50 ml centrifugation tubes, washed with 50 ml ice-
cold 50mM phosphate buffer, and centrifuged again at 9,000 g for 5 min. The biomass was immediately
frozen in liquid N2 for five minutes and stored at -80oC.
4.3.4 RNA isolation
Total RNA was isolated from A. niger according to the modified acid-guanidinium isothiocyanate phenol-
chloroform extraction method previously described (Chomczynski and Sacchi 1987; Dai, Hooker et al. 2000)
and the total RNA concentration was quantified spectrophotometrically. Polyadenylated RNA was isolated
from the total RNA with the Oligotex kit (QIAGEN, Valencia, Calif.).
4.3.5 Transcription analysis
Biotin-labeled cRNA was prepared from total RNA according to the Affymetrix GeneChip Expression
Analysis Technical Manual (Aff, 2007) and subsequently hybridized to the 3AspergDTU GeneChip (Andersen
et al. 2008). The cRNA was quantified spectrophotometrically and the quality was assessed using a
BioAnalyzer. A GeneChip Fluidics Station FS-400 was applied for hybridization followed by scanning using a
GeneChip Scanner 3000. The scanned probe array images (.DAT files) were converted into .CEL files using
the GeneChip Operating Software (Affymetrix).
4.3.6 Analysis of transcription data
The analysis of the affymetrix CEL-data files was carried out accordingly to (Andersen et al. 2009) Data from
the triplicates were statistically analyzed, and genes that are significantly regulated (Benjamini-Hochberg
corrected Bayesian P values < 0.05) in pair-wise comparisons between two conditions were identified.
4.3.7 Proteome analysis
Liquid Chromatography and Mass Spectral Analysis
A 1 μl portion of each sample was then injected onto a Jupiter C18 resin reverse-phase column (5 μm
particle size, 38 cm long, 150 μm inner diameter; Phenomenex, Torrance, CA). Triplicate injections were
performed for each sample. The peptides were eluted at 2 μl/min with an Agilent (Santa Clara, CA) 1100

49
high-performance liquid chromatograph with solutions of 0.1% formic acid (solvent A) and 0.1% formic acid
in 90% acetontirile (solvent B) using the following conditions:
0 to 15 min, isocratic at 100% solvent A; 15 to 20 min, linear gradient to 20% solvent B; 20 to 75 min, linear
gradient to 50% solvent B: 75 to 80 min, linear gradient to 95% solvent B; isocratic at 95% solvent B. The
column was reequilibrated in 100% solvent A for 40 min between sample injections. Eluted peptides were
introduced into a LTQ mass spectrometer (Thermo Fisher, Waltham, MA) by electrospray ionization.
Spectra were collected in a data-dependent mode, with the five most intense ions in each survey scan
selected for collisional induced dissociation in subsequent scans.
Mass Spectral Data Analysis
Raw datasets were analyzed by the Sequest (Eng et al. 1994) program using a protein database created
from the Aspergillus niger genome sequence (Andersen et al. 2011). Tryptic peptides with established
scoring criteria (Wolters et al.) are represented in this work. Relative quantiation of proteins was
determined by mixed-effects statistical modeling as previously described (Daly et al. 2008).

50
4.4 Results
Aspergillus niger cultures grown at Mn2+ limited conditions were pulsed with Mn2+ and the transcriptional
response caused by Mn2+ addition was characterized by comparing the transcription profiles of samples
taken before and after Mn2+ addition. In addition, the same biomass material was used for proteome
analysis to investigate the correlation between the transcriptional and the proteinogenic response caused
by Mn2+ addition. As described in the Materials and Methods section, the cultures were performed in
triplicates and addition of water to a set of cultures was included as negative control. The experimental
setup and an overview of the obtained results are presented in Figure 4.1
Figure 4.1 Overview of the experimental strategy and a summary of the obtain results from transcriptome and
proteome analysis. The lower two Venn-diagrams show the level of overlap observed between the two applied
methods.
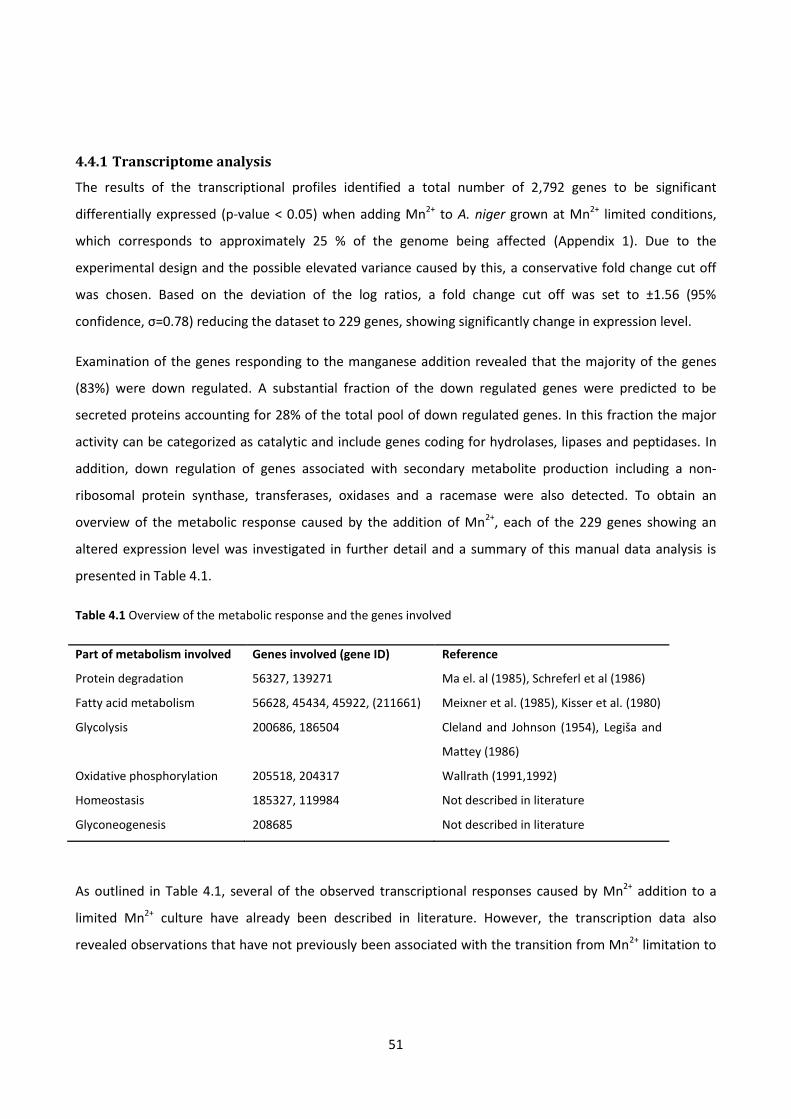
51
4.4.1 Transcriptome analysis
The results of the transcriptional profiles identified a total number of 2,792 genes to be significant
differentially expressed (p-value < 0.05) when adding Mn2+ to A. niger grown at Mn2+ limited conditions,
which corresponds to approximately 25 % of the genome being affected (Appendix 1). Due to the
experimental design and the possible elevated variance caused by this, a conservative fold change cut off
was chosen. Based on the deviation of the log ratios, a fold change cut off was set to ±1.56 (95%
confidence, σ=0.78) reducing the dataset to 229 genes, showing significantly change in expression level.
Examination of the genes responding to the manganese addition revealed that the majority of the genes
(83%) were down regulated. A substantial fraction of the down regulated genes were predicted to be
secreted proteins accounting for 28% of the total pool of down regulated genes. In this fraction the major
activity can be categorized as catalytic and include genes coding for hydrolases, lipases and peptidases. In
addition, down regulation of genes associated with secondary metabolite production including a non-
ribosomal protein synthase, transferases, oxidases and a racemase were also detected. To obtain an
overview of the metabolic response caused by the addition of Mn2+, each of the 229 genes showing an
altered expression level was investigated in further detail and a summary of this manual data analysis is
presented in Table 4.1.
Table 4.1 Overview of the metabolic response and the genes involved
Part of metabolism involved Genes involved (gene ID) Reference
Protein degradation 56327, 139271 Ma el. al (1985), Schreferl et al (1986)
Fatty acid metabolism 56628, 45434, 45922, (211661) Meixner et al. (1985), Kisser et al. (1980)
Glycolysis 200686, 186504 Cleland and Johnson (1954), Legiša and
Mattey (1986)
Oxidative phosphorylation 205518, 204317 Wallrath (1991,1992)
Homeostasis 185327, 119984 Not described in literature
Glyconeogenesis 208685 Not described in literature
As outlined in Table 4.1, several of the observed transcriptional responses caused by Mn2+ addition to a
limited Mn2+ culture have already been described in literature. However, the transcription data also
revealed observations that have not previously been associated with the transition from Mn2+ limitation to

52
Mn2+ excess. Three genes were particularly interesting, highlighting homeostasis maintaining reactions in
the mitochondria and increased gluconeogenetic activity as main metabolic responses to addition of Mn2+.
During Mn2+ limited conditions and high glucose uptake rates, citrate is being produced as a result of
overflow metabolism at the pyruvate note, Figure 2. When Mn2+ is introduced to the culture, the
phosphoenolpyruvate carboxykinase (PEPCK) gene is up-regulated. PEPCK catalyzes the first irreversible
step in the gluconeogenesis that converts oxaloacetate into phosphoenolpyruvate. Thus, the addition of
Mn2+ causes a recycling of carbon through gluconeogenesis at the expense of citric acid production,
illustrated in the metabolic chart in Figure 2.
Table 4.2 Metabolic overview of the central metabolism leading to citrate formation at Mn2+ limited conditions. Up-
regulation of hexokinase and glyceraldehyde 3-phosphate cause a high glucose uptake rate and unrestricted flow
through glycolysis. The high glycolytic flux is argued to result in a large pool of pyruvate which enters is subjected to
metabolization through the TCA cycle in the mitochondria. The simultaneous down-regulation of gluconeogenesis
makes secretion of citrate favorable as a way of controlling/regulating the metabolic activity of the TCA cycle. The
extract location of the two cation pumps, indicated in the figure, is unknown. However, due to the high malate/citrate

53
exchange, two acids having a minute charge difference, it is argued that this causes a reduced need for homeostasis
maintaining reactions in the mitochondria.
From the results described above, it is evident that the C4-metabolites oxaloacetate and malate play
important roles when switching from Mn2+ limited conditions to Mn2+ excess. It may be argued that PEPCK
and thereby gluconeogenesis is repressed when Mn2+ is limited and citric acid is being produced and up-
regulation of PEPCK associated with Mn2+ addition ensures that the C4-metabolites in the cytosol can be
recycled through gluconeogenesis. To further investigate the importance of C4-metabolites and the
influence of Mn2+ on the activity of the gluconeogenetic pathway, growth experiments using malate as the
only carbon source in a Mn2+ limited- and excess environment were conducted. Malate is a gluconeogenic
carbon source and requires PEPCK to be metabolized. A. niger was observed to germinate poorly on malate
so to facilitate germination, 0.45 mM glucose was added to the culture medium. The results of these
growth experiments with malate as the only carbon source showed growth in cultures where Mn2+ was in
excess, whereas very limited growth was observed in Mn2+ limited cultures, corresponding to the small
amount of glucose added (data not shown). Thus, these results supported the argument of a correlation
between Mn2+ limitation and lack of PEPCK activity.
4.4.2 Proteome analysis
714 proteins were identified and out of these 53 proteins were found to be significantly regulated
(Appendix 2). In this set of significant regulated proteins, 27 overlap with the original set of 2792 significant
regulated genes identified in the transcription analysis. Those include down regulation of two proteasome
components 20S and 26S, and a glycan synthase corresponding to increase protein degradation and altered
cell wall composition. In addition proteins associated with secondary metabolism including
dehydrogenases, a ligase, Acyl–CoA Synthetase and transferases were identified.
Interestingly two NADH-ubiquinone oxidoreductase, both associated with complex 1 was uniquely found in
the proteome analysis. However, both proteins were found to respond in the opposite direction compared
to the down regulation of the oxidative phosphorylation identified in the translational analysis and
observed in vivo. This could be perceived as contradictory but in multicellular eukaryotes complex 1
consists of 45 NADH dehydrogenase subunits (Lodish 2003, Carroll et al. 2006) and if parts of these are
regulated by a product feedback inhibition, a compensating response would be expected when the
pathway is having a decreased activity.

54
Another unique response was a 3.4 times down regulation of an ABC transporter (ProteinID: 209700). ABC
transporters utilize ATP to actively transport compounds. Since no other transporters are significantly
regulated it could be hypothesized that this transporter might be a citrate permease.
Two proteins associated with regulation were likewise identified in the proteome analysis alone; one a
protein phosphatase 2C (PPC2) and one a regulator with a U2AF domain responsible for pre-mRNA splicing.
PPC2 is a heterotrimeric protein phosphatase with broad substrate specificity. PPC2 contains a conserved
tripeptide Asp-Gly-His domain where the Asp residue is involved in the binding of manganese (Das et al.
1996). This binding is essential for signal transduction and lack of manganese as co-factor would diminish
signal pathway.
4.5 Discussion
Comparing the results obtained in transcriptome and proteome analysis interestingly shows that the
overlapping responses found using the two different methods is very limited. Three genes were identified
by both methods as a result of the Mn2+ addition. This phenomena is often seen when comparing results
from transcriptome and proteome profiles, as explained in details in chapter three . Furthermore the
samples corresponding to the Mn2+ excess conditions were harvested only a few hours after the Mn2+ had
been added. There was a clear shift in morphology (data not shown) and it was also obvious from the
transcriptional data that this time frame was adequate to analyze the manganese shift from a
transcriptional aspect. However, based on the results from the proteome analysis it may be argued that
more time is needed to be able to characterize this shift in metabolism in more detail from a proteinogenic
point of view.
Based on the results from the transcription analysis, the expression level of almost 25% of the genes in A.
niger were significant affected when switching from Mn2+ limited to Mn2+ excess culture conditions. Mn2+ is
an important cofactor for a broad range of enzymes classes (Campbell and Farrell 2003) and this was clearly
demonstrated by the large amount of genes being affected by Mn2+. The majority of the transcriptional
response was down regulation of genes, which was anticipated since manganese depletion is known to
cause severe stress to microbial cells (Barnett and Lilly 1966). Activity of the ABC multidrug transporter
GeneID: 194639 have been associated with multidrug resistance in Aspergilli (de Waard et al. 2006,
Morschhauser 2010). Since the function of this transporter is to ensure a proper intracellular environment
it may be argued that the observed 2.4 fold down-regulation (Table 4.1) indicates an unfavorable
intracellular environment at Mn2+ limited conditions.

55
As mentioned in the introduction three metabolic events are believed to be key contributors to the
overflow metabolism, and all three events were identified in our analysis (Table 4.1). From the data it was
observed that glyceraldehyde 3-phosphate dehydrogenase was down-regulated two fold when Mn2+ was
added to the medium, which further substantiates the importance of this enzyme when the flux through
the glycolysis is high and citrate is being formed. It should however be noted that the detected response is
at the transcript level and has not been verified at the proteome level. In addition, deregulation of the
glycolysis was observed as 1.6 fold down-regulation of the rco-3 monosaccharide transporter (GeneID:
200686) previously characterized as a high affinity transporter (Madi et al. 1997) together with a
hexokinase both catalyzing exogenic reactions. Interestingly, this response appears to be a manganese
initiated response that to our knowledge have not been reported previously. Whether this is due to
manganese limitation itself or a secondary response from the overflow metabolism initiated from
manganese limitation can only be speculative.
A two fold down-regulation of a putative ubiquitin-conjugating enzyme E2 was observed. Ubiquitination of
proteins are the major system for proteasomal degradation in eukaryotic cells (palmer et al, 1994; Retis
1997; Tanaka and Chiba, 1998). An increase in uniquitination would give rise in protein degradation, a
phenomenon observed in A. niger under Mn2+ deficiency (Ma et al. 1985, Schreferl et al. 1986). As
described, the increased protein degradation results in higher glucosamine formation seen as a twofold
down regulation of Glucosamine 6-phosphate synthetase (GeneID: 139271)
Down regulation of two genes associated with the glycolipid metabolism (GeneID: 56628, 45434) as well as
one gene (GeneID: 45922) associated with fatty acid metabolism a response that can be correlated with
shifting the saturated:unsaturated fatty acid ratio of the plasma membrane (Meixner et al. 1985), and
altering the polysaccharide concentration of the cell wall and its morphology (Kisser et al. 1980). In this
connection a two fold up regulation of the malic oxioreductase (GeneID: 211661) also referred to as malic
enzyme, the enzyme responsible for the conversion of malate and NADP+ to pyruvate and NADPH was
observed. NADPH have a vital role in anabolic reactions hence, it is an important factor controlling the
extent of lipid accumulation by the supply of reducing equivalents.
As described in the introduction, conversion of glucose to citrate generates one mole of ATP and two moles
of NADH, the two moles of NADH can subsequently be converted into two or more moles of ATP through
the oxidative phosphorylation (Yoshida et al. 2001). Excess of ATP would repress a high glycolytic flux since
ATP is a known inhibitor of both phosphofructokinase and pyruvate kinase (Campbell and Farrell 2003). It
may therefore be argued that down-regulation of the oxidative phosphorylation is essential for citrate
overflow metabolism. The down-regulation was detected as a two gene response, a NADH dehydrogenase

56
(GeneID: 205518) and H+ ATPase (GeneID: 204317), 1.9 and 1.6 fold up-regulated, correspondingly. In
addition, no significant responses were found for alternative oxidases, which support the argument for the
non-proton pumping oxidases being constitutively expressed.
Interestingly two cation transporters (GeneID: 185327, 119984) were subjected to a strong up regulation,
5.5 and 3.5 fold respectively. This could be interpreted as a lower demand of homeostasis maintaining
reactions in the mitochondria since the minute differences in the charge between citrate / malate
exchange. Contrary it could be hypothesized that the shutdown of these two transporters makes the cell
unable to maintain homeostasis thereby making secretion of citrate beneficial.
An especially noteworthy observation was the strong up-regulation of PEPCK the first irreversible step in
gluconeogenesis that converts oxaloacetate into phosphoenolpyruvate. PEPCK is especially important when
utilizing non-carbohydrate carbon substrates as fatty acids, amino acids and TCA intermediates. This make
gluconeogenesis an important regulatory step for converting TCA intermediates to hexose sugars. A high
glucose uptake results in a high pool of pyruvate that enters the TCA. Based on the results presented above
it may be argued that gluconeogenesis plays a role in regulating the concentration of TCA intermediates
especially under high glycolytic flux ensuring a reconversion of C4-metabolites to C6-metabolite. However,
the results presented here also demonstrated an essential role of Mn2+ in terms of PEPCK regulation. It is
therefore hypothesized that Mn2+ limitation represses expression of PEPCK and thus prevents
gluconeogenesis activity and combined with a high flux through glycolysis (overflow metabolism) secretion
of citrate is the only way of controlling/regulating the metabolic activity of the TCA cycle. This Mn2+
dependency of PEPCK is supported by a recent study on a Saccharomyces cerevisiae PEPCK. The authors
demonstrated that the yeast PEPCK needs Mn2+ as a co-factor to function (Sepulveda et al. 2010). Our
hypothesis was further substantiated by the demonstration of Mn2+ facilitating growth on malate.
To summarize, the results of this study have indicated that gluconeogenesis plays a key role in citrate
overflow metabolism. Furthermore, two cation pumps were found to be differentially regulated, and this
led to the hypothesis that the secretion of citrate could be beneficial in terms of maintaining homeostasis.
This response has already been described in literature but based on the results presented here, the
responsible genes were identified. To summarize, the results of this study has brought new insight to the
metabolic activity and the underlying regulation leading to citric acid formation in A. niger.
57
4.6 References
Andersen, M. R., L. Lehmann and J. Nielsen (2009). "Systemic analysis of the response of Aspergillus niger
to ambient pH." Genome Biol 10(5): R47.
Andersen, M. R., M. L. Nielsen and J. Nielsen (2008). "Metabolic model integration of the bibliome,
genome, metabolome and reactome of Aspergillus niger." Mol Syst Biol 4: 178.
Andersen, M. R., M. P. Salazar, P. J. Schaap, P. J. van de Vondervoort, D. Culley, J. Thykaer, J. C. Frisvad, K. F.
Nielsen, R. Albang, K. Albermann, R. M. Berka, G. H. Braus, S. A. Braus-Stromeyer, L. M. Corrochano, Z. Dai,
P. W. van Dijck, G. Hofmann, L. L. Lasure, J. K. Magnuson, H. Menke, M. Meijer, S. L. Meijer, J. B. Nielsen, M.
L. Nielsen, A. J. van Ooyen, H. J. Pel, L. Poulsen, R. A. Samson, H. Stam, A. Tsang, J. M. van den Brink, A.
Atkins, A. Aerts, H. Shapiro, J. Pangilinan, A. Salamov, Y. Lou, E. Lindquist, S. Lucas, J. Grimwood, I. V.
Grigoriev, C. P. Kubicek, D. Martinez, N. N. van Peij, J. A. Roubos, J. Nielsen and S. E. Baker (2011).
"Comparative genomics of citric-acid-producing Aspergillus niger ATCC 1015 versus enzyme-producing CBS
513.88." Genome Res 21(6): 885-897.
Barnett, H. L. and V. G. Lilly (1966). "Manganese requirements and deficiency symptoms of some fungi."
Mycologia 58(4): 585-591.
Campbell, M. K. and S. O. Farrell (2003). Biochemistry. United States, Thomson-Brooks/Cole, 0030348498.
Carroll, J., I. M. Fearnley, J. M. Skehel, R. J. Shannon, J. Hirst and J. E. Walker (2006). "Bovine complex I is a
complex of 45 different subunits." J Biol Chem 281(43): 32724-32727.
Cleland, W. W. and M. J. Johnson (1954). "Tracer experiments on the mechanism of citric acid formation by
Aspergillus niger." J Biol Chem 208(2): 679-689.
Dai, Z., X. Mao, J. K. Magnuson and L. L. Lasure (2004). "Identification of genes associated with morphology
in Aspergillus niger by using suppression subtractive hybridization." Appl Environ Microbiol 70(4): 2474-
2485.

58
Daly, D. S., K. K. Anderson, E. A. Panisko, S. O. Purvine, R. Fang, M. E. Monroe and S. E. Baker (2008).
"Mixed-effects statistical model for comparative LC-MS proteomics studies." J Proteome Res 7(3): 1209-
1217.
Das, A. K., N. R. Helps, P. T. Cohen and D. Barford (1996). "Crystal structure of the protein serine/threonine
phosphatase 2C at 2.0 A resolution." EMBO J 15(24): 6798-6809.
de Waard, M. A., A. C. Andrade, K. Hayashi, H. J. Schoonbeek, I. Stergiopoulos and L. H. Zwiers (2006).
"Impact of fungal drug transporters on fungicide sensitivity, multidrug resistance and virulence." Pest
Manag Sci 62(3): 195-207.
Eng, J. K., A. L. McCormack and J. R. Yates Iii (1994). "An approach to correlate tandem mass spectral data
of peptides with amino acid sequences in a protein database." Journal of the American Society for Mass
Spectrometry 5(11): 976-989.
Glusker, J. P. (1992). "Structural aspects of citrate biochemistry." Curr Top Cell Regul 33: 169-184.
Kapoor, M. (1975). "Subunit structure and some properties of pyruvate kinase of Neurospora." Can J
Biochem 53(2): 109-119.
Kisser, M., C. P. Kubicek and M. Röhr (1980). "Influence of manganese on morphology and cell wall
composition of <i>Aspergillus niger</i> during citric acid fermentation." Archives of
Microbiology 128(1): 26-33.
Legisa, M. and M. Mattey (2007). "Changes in primary metabolism leading to citric acid overflow in
Aspergillus niger." Biotechnol Lett 29(2): 181-190.

59
Legiša, M. and M. Mattey (1986). "Glycerol as an initiator of citric acid accumulation in Aspergillus niger."
Enzyme and Microbial Technology 8(5): 258-259.
Lodish, H. F. (2003). Molecular cell biology. New York, W.H. Freeman and Company, 0716743663.
Ma, H., C. P. Kubicek and M. Rohr (1985). "Metabolic effects of manganese deficiency in Aspergillus niger:
evidence for increased protein degradation." Arch Microbiol 141(3): 266-268.
Madi, L., S. A. McBride, L. A. Bailey and D. J. Ebbole (1997). "rco-3, a gene involved in glucose transport and
conidiation in Neurospora crassa." Genetics 146(2): 499-508.
Meixner-Monori, B., C. P. Kubicek, W. Harrer, G. Schreferl and M. Rohr (1986). "NADP-specific isocitrate
dehydrogenase from the citric acid-accumulating fungus Aspergillus niger." Biochem J 236(2): 549-557.
Morschhauser, J. (2010). "Regulation of multidrug resistance in pathogenic fungi." Fungal Genet Biol 47(2):
94-106.
Netik, A., N. V. Torres, J. M. Riol and C. P. Kubicek (1997). "Uptake and export of citric acid by Aspergillus
niger is reciprocally regulated by manganese ions." Biochim Biophys Acta 1326(2): 287-294.
Panneman, H., G. J. Ruijter, H. C. van den Broeck and J. Visser (1998). "Cloning and biochemical
characterisation of Aspergillus niger hexokinase--the enzyme is strongly inhibited by physiological
concentrations of trehalose 6-phosphate." Eur J Biochem 258(1): 223-232.
Papagianni, M., F. Wayman and M. Mattey (2005). "Fate and role of ammonium ions during fermentation
of citric acid by Aspergillus niger." Appl Environ Microbiol 71(11): 7178-7186.
Peksel, A., N. V. Torres, J. Liu, G. Juneau and C. P. Kubicek (2002). "13C-NMR analysis of glucose metabolism
during citric acid production by Aspergillus niger." Appl Microbiol Biotechnol 58(2): 157-163.

60
Promper, C., R. Schneider and H. Weiss (1993). "The role of the proton-pumping and alternative respiratory
chain NADH:ubiquinone oxidoreductases in overflow catabolism of Aspergillus niger." Eur J Biochem 216(1):
223-230.
Rohr, M. and C. P. Kubicek (1981). " Regulatory aspects citric acid fermentation by Aspergillus niger."
Process Biochem 16: 34-37.
Schmidt, M., J. Wallrath, A. Dörner and H. Weiss (1992). "Disturbed assemble of the respiratory chain
NADH: ubiquinone reductase (complex I) in citric-acid-accumulating Aspergillus niger strain B 60." Applied
Microbiology and Biotechnology 36(5): 667-672.
Schreferl-Kunar, G., M. Grotz, M. Röhr and C. P. Kubicek (1989). "Increased citric acid production by
mutants of Aspergillus niger with increased glycolytic capacity." FEMS Microbiology Letters 59(3): 297-300.
Schreferl, G., C. P. Kubicek and M. Rohr (1986). "Inhibition of citric acid accumulation by manganese ions in
Aspergillus niger mutants with reduced citrate control of phosphofructokinase." J Bacteriol 165(3): 1019-
1022.
Sepulveda, C., A. Poch, R. Espinoza and E. Cardemil (2010). "Electrostatic interactions play a significant role
in the affinity of Saccharomyces cerevisiae phosphoenolpyruvate carboxykinase for Mn2+." Biochimie
92(7): 814-819.
Shu, P. and M. J. Johnson (1948). "The Interdependence of Medium Constituents in Citric Acid Production
by Submerged Fermentation." J Bacteriol 56(5): 577-585.
Terenzi, H. F., E. Roselino and S. Passeron (1971). "Two types of pyruvate kinase in Mucor rouxii. Changes in
the enzymatic pattern related to aerobic development." Eur J Biochem 18(3): 342-350.

61
Torres, N. V. (1994). "Modeling approach to control of carbohydrate metabolism during citric acid
accumulation by Aspergillus niger: I. Model definition and stability of the steady state." Biotechnology and
Bioengineering 44(1): 104-111.
Torres, N. V., J. M. Riol-Cimas, M. Wolschek and C. P. Kubicek (1996a). "Glucose transport by Aspergillus
niger: the low-affinity carrier is only formed during growth on high glucose concentrations." Applied
Microbiology and Biotechnology 44(6): 790-794.
Torres, N. V., E. O. Voit and C. Gonzalez-Alcon (1996b). "Optimization of nonlinear biotechnological
processes with linear programming: Application to citric acid production by Aspergillus niger." Biotechnol
Bioeng 49(3): 247-258.
Wallrath, J., M. Schmidt and H. Weiss (1991). "Concomitant loss of respiratory chain NADH: ubiquinone
reductase (complex I) and citric acid accumulation in Aspergillus niger." Applied Microbiology and
Biotechnology 36(1): 76-81.
Wallrath, J., M. Schmidt and H. Weiss (1992). "Correlation between manganese-deficiency, loss of
respiratory chain complex I activity and citric acid production in Aspergillus niger." Archives of Microbiology
158(6): 435-438.
Wolschek, M. F. and C. P. Kubicek (1997). "The filamentous fungus Aspergillus niger contains two
"differentially regulated" trehalose-6-phosphate synthase-encoding genes, tpsA and tpsB." J Biol Chem
272(5): 2729-2735.
Yoshida, M., E. Muneyuki and T. Hisabori (2001). "ATP synthase--a marvellous rotary engine of the cell." Nat
Rev Mol Cell Biol 2(9): 669-677.

62

63
Chapter 5 Transcription factors modulation
The previous chapter demonstrated the strength of the “omics” techniques. Several decades of research
had uncovered many events leading to the citrate overflow metabolism, yet novel insights, events, and
connections were identified in the previous chapter. As presented, the citrate overflow metabolism was
mediated by a complex response. Interestingly, it was followed by close to 100 differentially regulated
transcription factors (TFs), unfortunately none of them were characterized. It could be speculated that
manipulation of one/few of those TFs could initiate a similar overflow response without the necessity of
manganese depletion. TFs have the potential of controlling multiple fluxes in an organism; hence
manipulating expression of these proteins can provide an alternative tool for overcoming metabolic
bottlenecks and/or tight regulation. Applying this strategy was the main purpose in chapters 6 and 7.
Consequently, an introduction to TFs and the concepts of TF modulation will be discussed this chapter.
5.1.1 Transcription factors role in life
Controlling gene translation is central to both, tissue specific expressions, as well to the gene activity in the
response to specific stimuli. Regulation primarily takes place at the level of transcription, yet occurring post
transcriptionally as well (reviewed by Pezer et al. (2010)). Particularly in eukaryotes, the transcriptional
regulation tends to involve combinatorial interactions between several proteins, which facilitate an
integrated response to multiple conditions in the environment. Protein–protein interactions play a
significant role in gene expression because they promote the formation of activator or inhibitory
complexes, depending on their components and possible combinations (A schematic overview can be
found in figure 3.1). TFs are a central subset of interacting proteins responsible for the control of gene
expression. This makes TFs essential for the regulation of gene expression, hence they are found in all living
organisms.
The mechanism of genetic regulation was first described by Jacob and Monod’s (1961), study of the lac
operon in E. coli. Followed by the discovery of the so called, cis-acting elements by Davidson et al. (1983).
By inspecting the upstream regions of genes that co-regulated, the presence of short DNA sequences,
sharing a high degree of similarity, was discovered. Integrating the information from 14 articles the authors
were able to identify cis-acting elements in seven eukaryote organisms, regulating diverse biological
responses covering amino acid depletion, heat shock response and glucocorticoid exposure. Nowadays it
has become clear that these short DNA sequences act by binding TFs thus regulating the transcription of
the gene either positively or negatively.

64
The abundance of TFs within an organism appears to be linked to the complexity of the organisms e.g. E.
coli has 48 TFs (Blattner et al. 1997) S. cerevisiae 169 (Goffeau et al. 1996). In contrast, multi cellular
organisms; A. niger has approximately 1000 TFs (Pel et al. 2007), Arabidopsis thaliana between 1500-1800
TFs (Arabidopsis Genome Initiative 2000) and H. sapiens approximately 2600 TFs (International Human
Genome Sequencing Consortium 2004), yet more noteworthy is that the TF expansion strictly follows a
power law, that in eukaryote is 1.23 whereas 1.98 is observed for prokaryotes, Figure 5.1. As a
consequence, for larger genomes, each gene must be regulated by a larger number of TFs and/or each TF
must be regulating a smaller set of genes (van Nimwegen 2003, Charoensawan et al. 2010).
Figure 5.1 TF abundance against number of genes per genome on a double log scale. The colors are used to highlight
genomes from different phylogenetic groups. The linear model fit for prokaryote (blue line) strictly follows a power
law increase, with an exponent close to quadratic, α = 1.98 with R2 = 0.87. The TF increase in eukaryotes has a lower
exponent (red line) as well as degree of correlation, α= 1.23 R2 = 0.61. Figure adapted from (Charoensawan et al.
2010).
Several hypotheses have been proposed to explain the existence of the power law relationship. One, is the
hypothesis of Maslov et al. (2009). The author speculated from a metabolic network point of view, “When
an organism evolve to explore a new environmental niche, a new set of TFs are required in order to
monitor the new tasks necessary to adapt to different conditions. Meanwhile, some of the metabolic
enzymes can be reused; hence, fewer new enzymes are required to regulate each new task”.
Regulatory networks typically involve a nested hierarchy structure, as exemplified in figure 5.2.

65
Figure 5.2 Human transcription factor network based on 230 interacting TFs. The numbered black filled nodes are the
highest connected TFs also termed global TFs. Each circle represents a TF and a line, an interaction. The figure was
modified from Rodriguez-Caso et al. (2005).
It is clear that most TFs are linked to only a few others, whereas a handful of the TFs have many
connections. This may explain why the number of new tasks and their regulators increase faster than
linearly with the number of genes encoding enzymes. This phenomenon ultimately facilitates exploitation
of TFs in metabolic engineering, especially within organisms with large genomes.
5.1.2 Transcription factor modulation
The biggest challenge performing TFs modulation is that TFs is the abundant protein class in multicellular
organisms, e.g. for A. niger, TFs constitutes 7-9 % of the total numbers predicted ORFs (Pel et al. 2007,
Andersen et al. 2011). TFs, especially in non-model organisms, are a highly uncharacterized class of
proteins. Out of A. niger’s approximated 1000 TFs, only twelve TFs have been functional characterized,
table 5.1.

66
Table 5.1 Overview of transcription factors characterized in A. niger.
Gene Function Reference
AcuA, AcuB Acetyl-CoA synthetase regulators (Sealy-Lewis and Fairhurst 1998)
AmyR Amylolytic activator (Tsukagoshi et al. 2001)
AraR Arabinolytic regulator (Battaglia et al. 2011)
AreA Regulator of nitrogen metabolite
repression
(MacCabe et al. 1998)
CpcA Regulator of amino acid biosynthesis (Wanke et al. 1997)
CreA Carbon catabolite repressor (Drysdale et al. 1993)
HacA Regulator of the unfolded protein
response
(Mulder et al. 2004)
InuR Regulator of inulinolytic genes (Yuan et al. 2008)
PrtT Regulator of extracellular proteases (Punt et al. 2008)
RlmA Regulator of the cell well stress
response
(Damveld et al. 2005)
XlnR Xylanolytic regulator (van Peij et al. 1998)
Many classification systems exist to describe TFs, including mechanism of action, regulatory function, or
sequence homology (Heinemeyer et al. 1999, Brivanlou and Darnell 2002, Stegmaier et al. 2004). However,
in this thesis, the simplified cis/trans grouping is applied. Cis-acting TFs are characterized by their local
response and are often found in secondary metabolite clusters. On the other hand, the trans-acting TFs can
affect genes on several chromosomes. To this category the highly connected TFs (global TFs) are found, as
represented black circles on figure 5.2 and as well in this category, the lower connected TF (the white
circles on figure 5.2). This group includes the TFs as HacA and PrtT (table 5.1), both found to be beneficial
targets, for manipulation and applied in protein production.
TFs significance in cellular regulation makes this class of proteins, an attractive target to investigate. The
challenge lies within locating the low connected trans-acting TFs. For instance, deleting a highly connected
TF could be devastating to the cell resulting in a severe weakened or unviable phenotype. On the contrary,
deleting a cis-acting TF possibly do not result in any altered phenotype. Attempting to solve this problem
the following strategy was developed:

67
1. Locate a stimulus that affects the pathway of interest.
2. Cultivate in presence and absence of the stimuli.
3. Examine the transcriptiome and/or proteome.
4. Perform cluster analysis of all differential regulated genes/proteins.
5. Remove cis-acting TFs.
6. Remove TF subset that co-regulates with household genes.
Applying this approach increases the rate of success considerably, due to the elimination of the two much
likely pitfalls, global TFs and cis-acting TFs. The following three chapters present the effectiveness of this
strategy. Three TF mutants will be described, each with a phenotype posing a big potential for improving A.
niger as a cell factory.

68
5.2 References
(2000). "Analysis of the genome sequence of the flowering plant Arabidopsis thaliana." Nature 408(6814): 796-815.
(2004). "Finishing the euchromatic sequence of the human genome." Nature 431(7011): 931-945.
Andersen, M. R., M. P. Salazar, P. J. Schaap, P. J. van de Vondervoort, D. Culley, J. Thykaer, J. C. Frisvad, K. F. Nielsen, R. Albang, K. Albermann, R. M. Berka, G. H. Braus, S. A. Braus-Stromeyer, L. M. Corrochano, Z. Dai, P. W. van Dijck, G. Hofmann, L. L. Lasure, J. K. Magnuson, H. Menke, M. Meijer, S. L. Meijer, J. B. Nielsen, M. L. Nielsen, A. J. van Ooyen, H. J. Pel, L. Poulsen, R. A. Samson, H. Stam, A. Tsang, J. M. van den Brink, A. Atkins, A. Aerts, H. Shapiro, J. Pangilinan, A. Salamov, Y. Lou, E. Lindquist, S. Lucas, J. Grimwood, I. V. Grigoriev, C. P. Kubicek, D. Martinez, N. N. van Peij, J. A. Roubos, J. Nielsen and S. E. Baker (2011). "Comparative genomics of citric-acid-producing Aspergillus niger ATCC 1015 versus enzyme-producing CBS 513.88." Genome Res 21(6): 885-897.
Battaglia, E., S. F. Hansen, A. Leendertse, S. Madrid, H. Mulder, I. Nikolaev and R. P. de Vries (2011). "Regulation of pentose utilisation by AraR, but not XlnR, differs in Aspergillus nidulans and Aspergillus niger." Appl Microbiol Biotechnol 91(2): 387-397.
Blattner, F. R., G. Plunkett, 3rd, C. A. Bloch, N. T. Perna, V. Burland, M. Riley, J. Collado-Vides, J. D. Glasner, C. K. Rode, G. F. Mayhew, J. Gregor, N. W. Davis, H. A. Kirkpatrick, M. A. Goeden, D. J. Rose, B. Mau and Y. Shao (1997). "The complete genome sequence of Escherichia coli K-12." Science 277(5331): 1453-1462.
Brivanlou, A. H. and J. E. Darnell, Jr. (2002). "Signal transduction and the control of gene expression." Science 295(5556): 813-818.
Charoensawan, V., D. Wilson and S. A. Teichmann (2010). "Genomic repertoires of DNA-binding transcription factors across the tree of life." Nucleic Acids Res 38(21): 7364-7377.
Damveld, R. A., M. Arentshorst, A. Franken, P. A. vanKuyk, F. M. Klis, C. A. van den Hondel and A. F. Ram (2005). "The Aspergillus niger MADS-box transcription factor RlmA is required for cell wall reinforcement in response to cell wall stress." Mol Microbiol 58(1): 305-319.
Davidson, E. H., H. T. Jacobs and R. J. Britten (1983). "Eukaryotic gene expression: Very short repeats and coordinate induction of genes." Nature 301(5900): 468-470.
Drysdale, M. R., S. E. Kolze and J. M. Kelly (1993). "The Aspergillus niger carbon catabolite repressor encoding gene, creA." Gene 130(2): 241-245.

69
Goffeau, A., B. G. Barrell, H. Bussey, R. W. Davis, B. Dujon, H. Feldmann, F. Galibert, J. D. Hoheisel, C. Jacq, M. Johnston, E. J. Louis, H. W. Mewes, Y. Murakami, P. Philippsen, H. Tettelin and S. G. Oliver (1996). "Life with 6000 genes." Science 274(5287): 546, 563-547.
Heinemeyer, T., X. Chen, H. Karas, A. E. Kel, O. V. Kel, I. Liebich, T. Meinhardt, I. Reuter, F. Schacherer and E. Wingender (1999). "Expanding the TRANSFAC database towards an expert system of regulatory molecular mechanisms." Nucleic Acids Res 27(1): 318-322.
Jacob, F. and J. Monod (1961). "Genetic regulatory mechanisms in the synthesis of proteins." J Mol Biol 3: 318-356.
MacCabe, A. P., S. Vanhanen, M. D. Sollewign Gelpke, P. J. van de Vondervoort, H. N. Arst, Jr. and J. Visser (1998). "Identification, cloning and sequence of the Aspergillus niger areA wide domain regulatory gene controlling nitrogen utilisation." Biochim Biophys Acta 1396(2): 163-168.
Maslov, S., S. Krishna, T. Y. Pang and K. Sneppen (2009). "Toolbox model of evolution of prokaryotic metabolic networks and their regulation." Proc Natl Acad Sci U S A 106(24): 9743-9748.
Mulder, H. J., M. Saloheimo, M. Penttila and S. M. Madrid (2004). "The transcription factor HACA mediates the unfolded protein response in Aspergillus niger, and up-regulates its own transcription." Mol Genet Genomics 271(2): 130-140.
Pel, H. J., J. H. de Winde, D. B. Archer, P. S. Dyer, G. Hofmann, P. J. Schaap, G. Turner, R. P. de Vries, R. Albang, K. Albermann, M. R. Andersen, J. D. Bendtsen, J. A. Benen, M. van den Berg, S. Breestraat, M. X. Caddick, R. Contreras, M. Cornell, P. M. Coutinho, E. G. Danchin, A. J. Debets, P. Dekker, P. W. van Dijck, A. van Dijk, L. Dijkhuizen, A. J. Driessen, C. d'Enfert, S. Geysens, C. Goosen, G. S. Groot, P. W. de Groot, T. Guillemette, B. Henrissat, M. Herweijer, J. P. van den Hombergh, C. A. van den Hondel, R. T. van der Heijden, R. M. van der Kaaij, F. M. Klis, H. J. Kools, C. P. Kubicek, P. A. van Kuyk, J. Lauber, X. Lu, M. J. van der Maarel, R. Meulenberg, H. Menke, M. A. Mortimer, J. Nielsen, S. G. Oliver, M. Olsthoorn, K. Pal, N. N. van Peij, A. F. Ram, U. Rinas, J. A. Roubos, C. M. Sagt, M. Schmoll, J. Sun, D. Ussery, J. Varga, W. Vervecken, P. J. van de Vondervoort, H. Wedler, H. A. Wosten, A. P. Zeng, A. J. van Ooyen, J. Visser and H. Stam (2007). "Genome sequencing and analysis of the versatile cell factory Aspergillus niger CBS 513.88." Nat Biotechnol 25(2): 221-231.
Pezer, Z., J. Brajkovic, I. Feliciello and D. Ugarkovc (2010). "Satellite DNA-mediated effects on genome regulation." Genome Dyn 7: 153-169.
Punt, P. J., F. H. Schuren, J. Lehmbeck, T. Christensen, C. Hjort and C. A. van den Hondel (2008). "Characterization of the Aspergillus niger prtT, a unique regulator of extracellular protease encoding genes." Fungal Genet Biol 45(12): 1591-1599.
Rodriguez-Caso, C., M. A. Medina and R. V. Solé (2005). "Topology, tinkering and evolution of the human transcription factor network." FEBS Journal 272(24): 6423-6434.

70
Sealy-Lewis, H. M. and V. Fairhurst (1998). "Isolation of mutants deficient in acetyl-CoA synthetase and a possible regulator of acetate induction in Aspergillus niger." Microbiology 144 ( Pt 7): 1895-1900.
Stegmaier, P., A. E. Kel and E. Wingender (2004). "Systematic DNA-binding domain classification of transcription factors." Genome Inform 15(2): 276-286.
Tsukagoshi, N., T. Kobayashi and M. Kato (2001). "Regulation of the amylolytic and (hemi-)cellulolytic genes in aspergilli." J Gen Appl Microbiol 47(1): 1-19.
van Nimwegen, E. (2003). "Scaling laws in the functional content of genomes." Trends in Genetics 19(9): 479-484.
van Peij, N. N., J. Visser and L. H. de Graaff (1998). "Isolation and analysis of xlnR, encoding a transcriptional activator co-ordinating xylanolytic expression in Aspergillus niger." Mol Microbiol 27(1): 131-142.
Wanke, C., S. Eckert, G. Albrecht, W. van Hartingsveldt, P. J. Punt, C. A. van den Hondel and G. H. Braus (1997). "The Aspergillus niger GCN4 homologue, cpcA, is transcriptionally regulated and encodes an unusual leucine zipper." Mol Microbiol 23(1): 23-33.
Yuan, X. L., J. A. Roubos, C. A. van den Hondel and A. F. Ram (2008). "Identification of InuR, a new Zn(II)2Cys6 transcriptional activator involved in the regulation of inulinolytic genes in Aspergillus niger." Mol Genet Genomics 279(1): 11-26.

71
Chapter 6 Identification of a transcription factor controlling pH-
dependent organic acid response in Aspergillus niger
Poulsen L, Andersen MR, Lantz AE, Thykaer J
6.1 Abstract
Acid formation in Aspergilllus niger is known to be subjected to tight regulation, and the acid production
profiles are fine-tuned to respond to the ambient pH. Based on transcriptome data, putative trans-acting
pH responding transcription factors were listed and through knock out studies a mutant exhibiting an
oxalate overproducing phenotype was identified. The yield of oxalate was increased up to 158% compared
to the wild type and the corresponding transcription factor was therefore entitled Oxalic Acid repression
Factor, OafA. Detailed physiological characterization of the oafA mutant, compared to the wild type,
showed that both strains produced substantial amounts of gluconic acid, but the mutant strain was more
efficient in the re-uptake of gluconic acid and converting it to oxalic acid, particularly at high pH (pH 5.0).
Transcriptional profiles showed that 241 genes were differentially expressed due to the deletion of oafA
and this supported the argument of OafA being a trans-acting transcription factor. Furthermore, expression
of two phosphoketolases were down-regulated in the oafA mutant, one of which has not previously been
described in fungi. It was argued that the observed oxalate overproducing phenotype was a consequence of
the efficient re-uptake of gluconic acid and thereby a higher flux through glycolysis. This results in a lower
flux through the pentose phosphate pathway, demonstrated by the down-regulation of the
phohsphoketolases. Finally, the physiological data, in terms of the specific oxygen consumption, indicated a
connection between the oxidative phosphorylation and oxalate production and this was further
substantiated through transcription analysis.
72
6.2 Introduction
Aspergillus niger is an industrially important organism, used as cell factory of a wide range of commercial
enzymes as well as productions of million tons of citric acid (Baker 2006). Due to the significance of A. niger
in the biotech industry, strain improvement is a key component in process optimization. Traditionally, it has
been approached by genetic engineering of a single or few metabolic genes; however, this strategy
struggles to overcome the superjacent regulation thus the outcome has frequently shown to be of limited
success. Another strategy entails of direct manipulation of transcription factors (TFs), since these proteins
have the potential of controlling several fluxes in an organism. Modulation of TFs as a strategy for
metabolic engineering has been demonstrated by Schuurmans et al. 2008, where the authors deleted one
TF and overexpressed another to improve ethanol production in Saccharomyces cerevisiae (Schuurmans et
al. 2008). A different approach is to use site directed mutagenesis on a TF, an approach that was applied to
improve ethanol tolerance and production in S. cerevisiae (Alper et al. 2006). Both methods have been
applied in prokaryotes as well as in unicellular eukaryotes, but to our knowledge have not been tested in
multicellular eukaryotes. One explanation may be that the genome sequence for S. cerevisiae have been
public available since 1996 (Goffeau et al. 1996), whereas the first filamentous fungal genome was released
less than ten years ago, with the genome of Neurospora crassa being the earliest to be publically available
(Galagan et al. 2003). Another challenge is the complexity of the regulatory networks caused by the large
genomes in multicellular eukaryotes, illustrated by the number of increasing TF’s with increasing genome
size e.g. E. coli has 48 (McCue et al. 2002) whereas A. niger has approximately 1000 (Pel et al. 2007) and
only a few of them have been functionally characterized.
Transcription factors can be grouped as cis- or trans-acting. Cis-acting TF’s are characterized by their local
response, inducing an entire cluster including the transcription factor itself as in the case of many
secondary metabolite clusters (Milo et al. 2002, Schumann and Hertweck 2006, Nielsen et al. 2011). The
other type of transcription factors, trans-acting, can regulate genes from a different region/chromosome of
the genome than the region it was transcribed from itself as in the case of protease production, e.g. PrtT
(Punt et al. 2008). This transcription factor, located on chromosome VI, controls proteases scattered
throughout the genome, regulating the majority of the extracellular protease response in A. niger. Deleting
prtT significantly lowers the protease activity without a noteworthy effect on the physiology of the fungus
(Punt et al. 2008). Considering the nature of organic acid production by A. niger being highly dependent on
pH of the culture medium (Heinrich and Rehm 1982, Ruijter et al. 1999), we hypothesize, that acid
production is mediated through a trans-acting transcription factor response.

73
Based on transcriptome data from a previous study where A. niger was cultivated at three different pH’s
(Andersen et al. 2009), we identified a list of putative trans-acting pH responding transcription factors
which formed the basis for sequential knockout studies. In the following screening process, particularly one
mutant exhibited an elevated acidification of the media, which corresponded to increased oxalate
production. The responsible transcription factor was therefore entitled OafA (oxalic acid repression factor).
The deletion mutant, ΔoafA, and the reference strain, were subjected to detailed physiological
characterization.

74
6.3 Materials and methods
6.3.1 Fungal strains
A. niger ATCC 1015 was used as wild type strain (obtained from the IBT collection as IBT 28639). The ΔoafA
strain was generated from the ATCC 1015 strain. All strains were maintained as frozen spore suspensions at
-80°C in 20% glycerol.
6.3.2 Media
Transformation medium: 182.2 g/L sorbitol, 10 g/L glucose monohydrate, 6 g/L NaNO3, 0.52 g/L KCl, 0.52
g/L MgSO4 · 7H2O, 1 mL/L of 1% thiamine solution, 1 mL/L trace element solution. Trace element solution:
22 g/L ZnSO4 · 7 H2O, 11 g/L H3BO3, 5 g/L MnCl2 · 4 H2O, 5 g/L FeSO4 · 7 H2O, 1.7 g/L CoCl2 · 6 H2O, 1.6 g/L
CuSO4 · 5 H2O, 1.5 g/L Na2MoO4 · 2 H2O, 50 g/L Na4EDTA.
Czapek yeast extract (CYA) media: 30 g/L Sucrose, 5 g/L Yeast extract, 3 g/L NaNO3, 1 g/L K2HPO4, 0.5 g/L
MgSO4 · 7 H2O, 0.5 g/L KCl, 0.01 g/L FeSO4 · 7H2O, 15 g/L Agar, 1 mL/L trace element solution. 0.4 g/L CuSO4
· 5 H2O, 0.04 g/L Na2B2O7 · 10 H2O, 0.8 g/L FeSO4 · 7 H2O, 0.8 g/L MnSO4 · H2O, 0.8 g/L Na2MoO4 · 2 H2O, 8.0
g/L ZnSO4 · 7 H2O. pH adjusted to 6.2 prior to autoclavation.
Minimal screenings medium: 10 g/L glucose monohydrate, 6 g/L NaNO3, 0.52 g/L KCl, 0.52 g/L MgSO4 ·
7H2O, 1 mL/L of 1% thiamine solution, 1 mL/L trace element solution. Trace element solution: 22 g/L ZnSO4
· 7 H2O, 11 g/L H3BO3, 5 g/L MnCl2 · 4 H2O, 5 g/L FeSO4 · 7 H2O, 1.7 g/L CoCl2 · 6 H2O, 1.6 g/L CuSO4 · 5 H2O,
1.5 g/L Na2MoO4 · 2 H2O, 50 g/L Na4EDTA. As buffer 19.52 g/L 2-(N-morpholino)ethanesulfonic acid (MES)
was used. pH adjusted to 6.0 prior to autoclavation.
Complex screening medium (Watman medium): 30 g/L Sucrose, 5 g/L Corn steep liquor, 2 g/L Yeast extract,
3 g/L Peptone, 2 g/L Glucose, 2 g/L NaNO3, 1 g/L K2HPO4 · 3 H2O, 0.5 g/L MgSO4 · 7 H2O, 0.05 g/L FeSO4 · 7
H2O, 0.2 g/L KCl, 1 mL/L Trace metal solution. Trace element solution: 22 g/L ZnSO4 · 7 H2O, 11 g/L H3BO3, 5
g/L MnCl2 · 4 H2O, 5 g/L FeSO4 · 7 H2O, 1.7 g/L CoCl2 · 6 H2O, 1.6 g/L CuSO4 · 5 H2O, 1.5 g/L Na2MoO4 · 2 H2O,
50 g/L Na4EDTA. As buffer 19.52 g/L 2-(N-morpholino)ethanesulfonic acid (MES) was used. pH adjusted to
6.0 prior to autoclavation.
Batch cultivation medium: 20 g/L glucose, 7.3 g/L (NH4)2SO4, 1.5 g/L KH2PO4, 1.0 g/L MgSO4 · 7 H2O, 1.0 g/L
NaCl, 0.1 g/L CaCl2, 0.1 mL Antifoam 204 (sigma), 1 mL/L trace element solution. Trace element solution:
0.4 g/L CuSO4 · 5 H2O, 0.04 g/L Na2B2O7 · 10 H2O, 0.8 g/L FeSO4 · 7 H2O, 0.8 g/L MnSO4 · H2O, 0.8 g/L
Na2MoO4 · 2 H2O, 8.0 g/L ZnSO4 · 7 H2O.

75
6.3.3 Preparation of inoculum
Conidia were propagated on CYA media plates and incubated for 5 to 7 days at 30°C before being harvested
with 2 times 10 ml 0.9 % NaCl and filtered through miracloth and washed twice with 0.9 % NaCl.
Fermentations were initiated by conidia inoculation to a final concentration of 2·109 spores/L
6.3.4 Target selection
A previous study (Andersen et al. 2009) identified 6228 genes which react significantly (p<0.05) to pH over
three different conditions (pH. 2.5, 4.5, and 6.0). From this set of data, we examined all genes that react in
a progressive manner over the values, either increasing or decreasing with pH, and extracted all predicted
transcription factors in this set.
6.3.5 PCR amplification
All PCR reactions were carried out using the high fidelity Phusion polymerase from Finnzymes at standard
conditions with HF-buffer.
6.3.6 Gene deletion
All DNA insertions into the A. niger genome were performed using protoplasts and PEG transformation. The
deletion strains were constructed using PCR-generated bipartite gene targeting substrates (Nielsen et al.
2006). Each part of the bipartite substrate consisted of a targeting fragment and a marker fragment, all of
which were amplified individually by PCR using the primer pairs presented in Table 1. Hygromycin
phosphotransferase gene (hph) marker cassette was amplified from plasmid pCB10003 (McCluskey et al.
2010) as template DNA.
6.3.7 Oligonucleotide PCR primers
The oligonucleotides used for the strain construction of ΔoafA, can be found in Table 6.1.

76
Table 6.1 Primers used for deletion of oafA in A. niger. Lower-case letters indicate overlapping genetic elements used
for fusion PCR.
Primer Sequence
Upst_OAFA_F TATGACGTGCGGGTATTCGAG
Upst_OAFA_R gatccccgggaattgccatgTAACTTCAGTAGATCGCCCAGC
Dwst_OAFA_F ggactgagtagcctgacatcTTAGCAGGGGCGAATAATGC
Dwst_OAFA_R CGAATGAACAACAGCAGGATG
Upst_Hyg_F catggcaattcccggggatcGCTGGAGCTAGTGGAGGTCA
Upst-HygR-N CTGCTGCTCCATACAAGCCAACC
Dwst-HygF-N GACATTGGGGAGTTCAGCGAGAG
Dwst-Hyg_R gatgtcaggctactcagtccCGGTCGGCATCTACTCTATT
6.3.8 Southern blotting
1.5 µg genomic DNA was isolated and digested with appropriate restriction enzymes (SmaI and NdeI).
Sequence information for restriction digest of the target loci was obtained from the A. niger ATCC 1015
genome sequence (Andersen et al. 2011) from the US Department of Energy Joint Genome Institute
(http://genome.jgipsf.org/Aspni1/). Blotting was done according to standard methods (Sambrook and
Russell 2001), using RapidHyb hybridization buffer (Amersham Pharmacia) for probing. The target locus was
detected by probing with the labeledmarker gene PCR fragment. The probes were radioactively labeled
with α-32P-dCTP by random priming using Rediprime II kit (GE Healthcare). For a graphical representation
of the gene deletion strategy, see Figure 6.1.
6.3.8 Cultivations
Static cultivations
Fresh conidia were added to 8 mL of minimal- or complex screenings medium in a 50 mL sterile falcon tube
(BD Biosciences) to a final concentration of 1·103 conidia/mL and incubated without agitation at 30 oC for 5
days. At the end of the experiment, samples for pH and HPLC-measurements were collected.

77
Batch cultivations
Batch cultivations were performed in 2 L Sartorius fermenters with a working volume of 1.5 L, equipped
with two Rushton six-blade disc turbines. The bioreactor was sparged with air, and the concentrations of
oxygen and carbon dioxide in the exhaust gas were measured in a gas analyzer (1311 Fast response Triple
gas, Innova combined with multiplexer controller for Gas Analysis MUX100, B. Braun Biotech International
(Melsungen, Germany)). The temperature was maintained at 30°C during the cultivation and pH was
controlled by automatic addition of 2 M NaOH and 1 M HCl. Initial conditions in the bioreactor were pH:
3.0; stirring rate: 100 rpm; and aeration: 0.2 volumes of air per volume of fluid per minute (vvm). After
germination, the stirring rate was gradually increased to 800 rpm and the air flow to 1 vvm. The pH was
adjusted to 2.5 or 6.0 with addition of 2 M NaOH or 1 M HCl over 2 hours.
Chemostat cultivations
The chemostat cultivations were initiated as batch cultivations and in late exponential phase, supply of
additional substrate through the feed was initiated. The feed medium was similar to the batch medium
with the exception of the glucose concentration being 8 g/L. Pumps were controlled to a rate of 150 g/h (D
= 0.1 h-1). The first steady state, pH 2.5, was obtained after five residence times (50 hours), whereas the
second steady state took place after three additional residence times (30 hours).
The pH shift to the second steady state was performed over five hours to avoid a morphological shift
towards pellet formation.
6.3.9 Cell dry weight determination
The cell mass concentration on a dry weight basis was determined by the use of nitrocellulose filters with a
pore size of 0.45 μm (Osmonics, Minnetonka, MN, USA). Initially, the filters were pre-dried in a microwave
oven at 150 W for 20 min, and then weighed. A known weight of cell culture was filtered, and the residue
was washed with distilled water. Finally, the filter was dried in the microwave at 150 W for 20 min and the
dry weight was determined.

78
6.3.10 Quantification of extracellular metabolites
HPLC
For quantification of the extracellular metabolites, a culture sample was taken and immediately filtered
through a 0.45 μm-pore-size nitrocellulose filter (Osmonics). The filtrate was frozen and kept at −20°C until
analysis. Glucose, oxalate, citrate, gluconate, glycerol and acetate concentrations were detected and
quantified by refractive index and UV using an Aminex HPX-87H cationic-exchange column (BioRad,
Hercules, CA, USA) eluted at 35°C, with 5 mM H2SO4 at a flow rate of 0.6 mL min−1.
Glucose assay
The applied HPLC method is unable to separate glucose and gluconate. Therefore, in samples where both
glucose and gluconate were present, gluconate was quantified based on the UV-spectrum from the HPLC-
analysis, whereas glucose was determined using a glucose enzymatic assay (Horiba ABX, Montpellier,
France). This assay was based on NAD+ through a coupled reaction with glucose-6-phosphate
dehydrogenase and formation of NADH was determined spectrophotometrically by measuring the increase
in absorbance at 340 nm.
6.3.11 Transcription analysis
Sampling
For gene expression analysis, mycelium was harvested at steady state by filtration through sterile Mira-
Cloth (Calbiochem, San Diego, CA, USA). Liquid was quickly removed from the mycelium by squeezing, and
it was then subsequently frozen in liquid nitrogen. Samples were stored at -80°C until RNA extraction.
Extraction of total RNA
Total RNA was extracted from 40 to 50 mg of frozen mycelium as described in (Andersen et al. 2009) and
the quantity was determined using a Qubit 2.0 Fluorometer (Invitrogen). The total RNA was stored at -80°C
until further processing.
cRNA and microarray
150 ng of total RNA in 1.5 μl was labeled according to the One Color Labeling for Expression Analysis, Quick
Amp Low Input (QALI) version 6.5 May 2010 from Agilent Technologies. Yield and specific activity was
determined on a NanoDrop ND-1000 and verified on Qubit 2.0. 1.65 μg labeled cRNA was fragmented at
60°C on a heating block and the cRNA was prepared for hybridization according to the QALI protocol.

79
100 μl sample was loaded on a 4 x 44 Agilent Gasket Slide situated in an Agilent Technologies hybridization
chamber. The 4 x 44 Array was placed on top of the Gasket Slide. The Array was hybridized at 65°C for 17
hours in an Agilent Technologies Hybridization oven. The array was washed following the QALI protocol and
scanned in a G2505C Agilent Technologies Micro Array Scanner.
Analysis of transcriptome data
The raw array signal was processed by first removing the background noise using the normexp method, and
signal between arrays made comparable using the quantiles normalization method, as implemented in the
Limma package (Smyth 2004) Multiple probe signals per gene were summarized into a gene-level
expression index using Tukey's medianpolish (Irizarry et al. 2003).
Statistical analysis was applied to determine genes subject to differential transcriptional regulation. The
limma package (Smyth 2004) was used to perform moderated t tests between sets of biological replicates
from each pH level. Empiric Bayesian statistics were used to moderate the standard errors within each
gene, and Benjamini-Hochberg's method (Benjamini and Hochberg 1995), to adjust for multitesting. A cut-
off value of adjusted P < 0.05 was set to assess statistical significance.
6.3.12 Gene ontology enrichment analysis
Significantly regulated subsets of genes were examined for GO-term enrichment by using Cytoscape with
BiNGO plugin (Maere et al. 2005). GO-term assignments were based on automatic annotation of the A.
niger ATCC 1015 v3.0 gene models. The significance level was selected to P < 0.05 and calculated using
hypergeometric testing with Benjamini & Hochberg correction.

80
6.4 Results
A. niger is known for its acid formation and recent studies have shown that a up to 6228 genes are
influenced by ambient pH and the physiological response results in an acid production profile that ensures
optimal acidification of the surrounding medium (Andersen et al. 2009). Based on these results, it was
hypothesized that the acid formation response is mediated by trans-acting TFs , since the affected genes
were scattered across the entire genome of A. niger. Further analysis of the data from (Andersen et al.
2009) resulted in a set of predicted transcription factors. The data was sorted into 17 clusters. In the largest
cluster, which consisted of 2814 genes, a large number of housekeeping genes were identified. The main
function of the genes in this cluster was considered to be growth or stress related and therefore not
directly regulated by pH. Based on this, the cluster was excluded. In the resulting subset, now containing
3414 genes, the putative cis-acting transcription factors were predicted and removed. The predictions were
performed using an in-house method based on their co-regulation with closely positioned biosynthetic
clusters (data not shown). Finally, the trans acting transcription factors were ranked based on p-values.
(A) (B)
Figure 6.1 Graphical illustration of the gene deletion procedure exemplified with by insertion of hygromycin resistance
marker into the oafA locus. (A) Bipartite substrate, locus and predicted resultant genomic locus. (B) Southern analysis
of transformants for site specific integration of the construct. Genomic DNA was digested with either NdeI or SmaI.
The position of the probe used is shown in (A).
OAFA
HYG
HYG
Nd
eI(
27
94)
Nd
eI(
45
68)
Nd
eI(
11
983
)
SmaI
(98
35)
SmaI
(37
91
)
1774 bp
7415 bp6044 bp
Probe
Nd
eI
SmaI
12225 bp
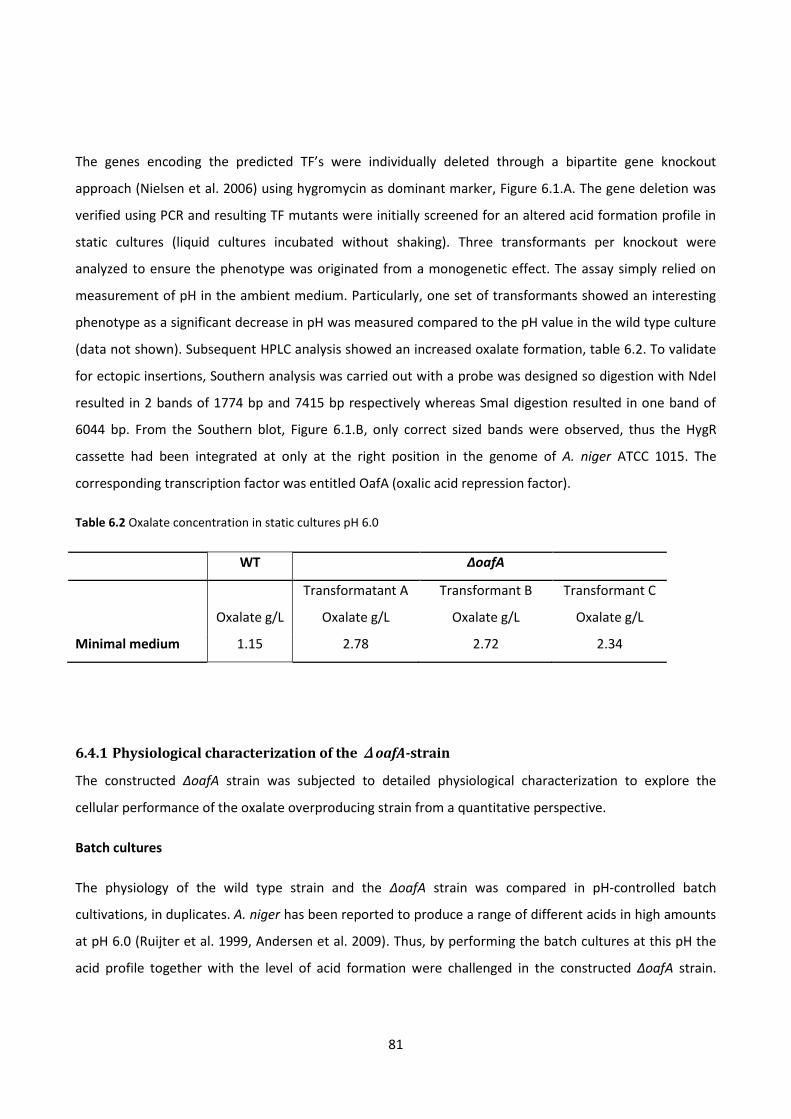
81
The genes encoding the predicted TF’s were individually deleted through a bipartite gene knockout
approach (Nielsen et al. 2006) using hygromycin as dominant marker, Figure 6.1.A. The gene deletion was
verified using PCR and resulting TF mutants were initially screened for an altered acid formation profile in
static cultures (liquid cultures incubated without shaking). Three transformants per knockout were
analyzed to ensure the phenotype was originated from a monogenetic effect. The assay simply relied on
measurement of pH in the ambient medium. Particularly, one set of transformants showed an interesting
phenotype as a significant decrease in pH was measured compared to the pH value in the wild type culture
(data not shown). Subsequent HPLC analysis showed an increased oxalate formation, table 6.2. To validate
for ectopic insertions, Southern analysis was carried out with a probe was designed so digestion with NdeI
resulted in 2 bands of 1774 bp and 7415 bp respectively whereas SmaI digestion resulted in one band of
6044 bp. From the Southern blot, Figure 6.1.B, only correct sized bands were observed, thus the HygR
cassette had been integrated at only at the right position in the genome of A. niger ATCC 1015. The
corresponding transcription factor was entitled OafA (oxalic acid repression factor).
Table 6.2 Oxalate concentration in static cultures pH 6.0
WT ΔoafA
Transformatant A Transformant B Transformant C
Oxalate g/L Oxalate g/L Oxalate g/L Oxalate g/L
Minimal medium 1.15 2.78 2.72 2.34
6.4.1 Physiological characterization of the ΔoafA-strain
The constructed ΔoafA strain was subjected to detailed physiological characterization to explore the
cellular performance of the oxalate overproducing strain from a quantitative perspective.
Batch cultures
The physiology of the wild type strain and the ΔoafA strain was compared in pH-controlled batch
cultivations, in duplicates. A. niger has been reported to produce a range of different acids in high amounts
at pH 6.0 (Ruijter et al. 1999, Andersen et al. 2009). Thus, by performing the batch cultures at this pH the
acid profile together with the level of acid formation were challenged in the constructed ΔoafA strain.

82
Representative profiles of the biomass concentration, sugar concentration, carbon dioxide formation and
acid formation during these batch cultivations are shown in Figure 6.2.
Figure 6.2 Representative profiles of the biomass concentration, sugar concentration, carbon dioxide formation and
acid formation during batch cultivations at pH 6.0 with the WT-strain (left) and and the ΔoafA strain. The maximum
specific growth rate was estimated trough a logarithmic plot of the biomass concentration as a function of time. Yield
coefficients were calculated as overall yields based on the accumulated biomass or metabolite concentration in
stationary phase related to the amount of consumed glucose. The volumetric oxalate formation rate was estimated as
the slope of a linear regression of the oxalate titer as a function of time.
Characteristic for both the wild type and the oafA strain was that the majority of glucose in the
exponential growth phase was converted into gluconate and biomass, where gluconate formation
accounted for approximately 90% of the carbon conversion. After complete utilization of glucose, gluconate
was metabolized resulting in mainly oxalate formation, but citrate was also detected in both set of cultures,
Figure 6.2. The maximum specific growth rates of the two strains were 0.23±0.02 h-1 and 0.25±0.02 h-1 for
the WT and the oafA strain respectively, so deleting oafA showed no effect on the growth rate. However,
a notable difference was observed in the formation of oxalate as the yield of oxalate on glucose was
increased by 87 % from 0.13 Cmol Cmol-1 to 0.25 Cmol Cmol-1 and the volumetric oxalate formation rate
was doubled from 0.11±0.02 gOx (L h)-1 in the WT to 0.22±0.00 gOx (L h)-1 in the oafA strain.
An interesting observation from the results of the batch cultivations was that acid production, except for
gluconate formation, was mainly measured in stationary phase after glucose completion. From Figure 6.2 it

83
appears that during stationary phase the cells are converting gluconate to oxalate and oxalate formation is
therefore decoupled from growth.
Characterization of ΔoafA in chemostat cultivations
To compare the acid production profiles of oafA and the wild type during growth at both high and low pH,
carbon limited chemostat cultivations were carried out. An important feature in the presented
characterization was the application of chemostat cultures, as it can be difficult to obtain and maintain
steady states working with filamentous fungi, because of the complex morphology of the cells (McIntyre
and McNeil 1997). However, in this study steady states were obtained for both strains as well as for the two
selected pH levels, Figure 6.3. The experimental setup was designed in a way that two steady states were
obtained for each chemostat performed. An advantage of such a design is the possibility of attaining data
from two distinct pH values using a single chemostat setup. Moreover, morphological issues such as pellet
formation have been observed in transition from batch to chemostat at high pH (data not shown). To avoid
pellet formation, the batch phase and the first steady state were at pH 2.5, whereas pH 5.0 was chosen for
the second steady state, illustrated in Figure 6.3.

84
Figure 6.3 Representative profiles of chemostat cultivations for Wild type(top) and ΔoafA(bottom). Two steady states
were obtained for each chemostat cultivation performed.
Figure 6.3 shows that for both strains, the main products in the exponential phase were biomass and CO2 at
comparable yields. However, low citrate production was observed in the wild type, a product not detected
in ΔoafA. During the first steady state at pH 2.5, achieved at 73 h (5 retention times), the mutant had an
unchanged product profile with identical quantities in comparison with the wild type. The second steady at
state occurred at 126 hours, 3 retention times after pH change to pH 5.0. As it was evident in the high pH
batch cultivation, ΔoafA had a highly increased oxalate formation (158 %) compared to WT, whereas both
citrate and gluconate formation were reduced. A summary of growth and yield coefficients can be found in
Table 6.3.

85
Table 6.3 Physiological coefficients from chemostat cultivations.
Wild-type ΔoafA Difference
(Cmol/Cmol) (Cmol/Cmol)
Bat
ch p
has
e ,p
H 2
.5
Ysx 0.820 ± 0.026 0.803 ± 0.026 -2%
Ys,gluconate 0 0 0%
Ys,oxalate 0 0 0%
Ys,citrate 0.063 ± 0.027 0 -100%
Ys,CO2 0.225 ± 0.005 0.232 ± 0.007 3%
Yso 0.283 ± 0.05 0.282 ± 0.0 10 0%
Ch
emo
stat
, pH
2.5
Ysx 0.666 ± 0.019 0.685 ± 0.014 3%
Ys,gluconate 0 0 0%
Ys,oxalate 0 0 0%
Ys,citrate 0 0 0%
Ys,CO2 0.330 ± 0.002 0.313 ± 0.019 -5%
Yso 0.043 ± 0.004 0.036 ± 0.005 -16%
Ch
emo
stat
, pH
5.0
Ysx 0.679 ± 0.024 0.593 ± 0.005 -13%
Ys,gluconate 0.034 ± 0.003 0 -100%
Ys,oxalate 0.034 ± 0.004 0.088 ± 0.003 158%
Ys,citrate 0.017 ± 0.005 0.006 ± 0.011 -62%
Ys,CO2 0.335 ± 0.021 0.273 ± 0.032 -19%
Yso 0.046 ± 0.004 0.030 ± 0.004 -35%
From Table 6.3 it is apparent that the main different between the ΔoafA mutant and the wild type strain is
increased oxalate formation in the ΔoafA mutant at the expense of gluconate, particularly in the second
steady state at pH 5.0. The validity of the observed oxalate overproducing phenotype in the ΔoafA mutant
is substantiated by the carbon balances, which closes for each distinctive phase.
The ΔoafA thus exhibits an oxalate overproducer phenotype at high pH in both the reported batch and
chemostat culture, as well as in the initial screening. To investigate the transcriptional aspects of this
phenotype and to obtain further insight to OafA’s function as a transcription factor, biomass samples were
86
taken from all biological triplicates at steady state conditions (12 samples in total) and subjected to
transcriptome analysis.
6.4.2 Transcriptome analysis
Data from the biological triplicates of the two strains at pH 2.5 and 5.0 were statistically analyzed, and
genes that were significantly regulated (Benjamini-Hochberg corrected Bayesian P values < 0.05) in pair-
wise comparisons between two strains were identified across pH. The raw data of the expression levels of
all the A. niger gene analyzed are presented in the appendix 3 together with complete lists of the genes
differentially expressed in the two strains at different pH’s.
Comparing the wild type with the oafA mutant at the first steady state (pH 2.5), a notably low number of
significantly regulated genes were identified. Seven genes with a significant change in expression level,
where four have been annotated, were identified. They included: down-regulation of a putative
lysophospholipase, a polyketide syntease and intriguingly oxaloacetate acetylhydrolase (oahA), the enzyme
converting oxaloacetate to oxalate.
At pH 5.0, 241 genes were significant changed in expression levels, 121 genes being up-regulated and 120
being down-regulated. A Gene Ontology overrepresentation analysis on the subset of up-regulated genes
revealed an enrichment of 19 genes (p-value 3.43·10-4, cluster freq 19/64, genome freq. 818/6268)
associated with transport processes and within this subset three of these putative transporters were
annotated as hexose transporters.
Among the up-regulated genes, five TFs were found, where four were located next to putative secondary
metabolite clusters. However, each TF showed a limited degree of co regulation with their nearby
secondary metabolite cluster, predicted by an in-house method (data not shown). Additionally, two genes
encoding for epigenic regulation, a RNA-dependent RNA polymerase (GeneID: 176277) and a histone
acetyltransferase (GeneID: 53882) were also found to be up-regulated.
The phenotypic trait of the ΔoafA strain was shown to be a significant increase in oxalate formation. It was
therefore surprising that the gene encoding oahA (oxalate dehydrogenase) was not up-regulated. Yet a
slight up-regulation of a cytosolic malate dehydrogenase (MDH), the enzyme responsible for converting
malate to oxaloacetate, was measured.
An ontology overrepresentation analysis on the subset of down-regulated genes showed an enrichment of
28 genes associated with oxidoreductase activity (p-value 1.58·10-5, cluster freq 28/52, total freq

87
1300/6268). Two of these genes, a NADH-dehydrogenase and monooxygenase were associated with the
oxidative phosphorylation. A catalase and a chloroperoxidase were additionally found down-regulated, a
further indication of reduced oxidative phosphorylation.
In addition, down-regulation of two phosphoketolases were detected. GeneID 54814 contained zero
introns, suggesting this gene might be of bacterial origin. GeneID 197387 contained six introns indicating
that it has evolved within the eukaryote kingdom. An alignment of the two protein sequences showed 88 %
query coverage and a max identity of 44 % suggesting that they are not homologs. Down-regulation of
acetate kinase (206885) and an Acyl-CoA syntase (129581), both enzymes responsible for converting
acetate-phosphate into acetyl-CoA, was observed as well.
6.5 Discussion
Deletion of a putative trans-acting transcription factor entitled oxalic acid repression factor, OafA, resulted
in an oxalate overproducing strain. The physiology of the constructed strain was characterized in detail, in
both batch and chemostat cultivations, and compared to wild type physiology. In addition, transcriptome
analysis at steady state conditions at both high and low pH highlighted the transcriptional response caused
by the deletion of oafA.
6.5.1 Differences in acid production
The physiological characterization of the ΔoafA mutant showed an altered organic acid production profile
at high pH compared to the wild type strain. All of the acid yields were affected, but in particular the
oxalate yield increased (Figure 6.2, Figure 6.3 and Table 6.3). In the batch cultures, glucose was converted
to gluconate with a similar specific yield of approximately 90% in the exponential phase, but the ΔoafA
strain showed an improved reuptake and conversion of gluconate to oxalate. In the chemostat cultivation
at pH 5.0, no gluconate was detected for the mutant and the oxalate yield on glucose was increased. Based
on these results it may be argued that gluconate was produced with a similar rate in the mutant and the
wild type, but the increased reuptake of gluconate and conversion to oxalate, argued from the batch
results, leads to a complete re-consumption of gluconate and therefore no detectable level of this acid. The
citrate formation was in both cultivation types found to be reduced by approximately 60 %, however this
was the least reproducible coefficient, hence it should be cautiously interpreted. An intriguing observation
from the chemostat cultivations at pH 5.0 was the total acid yield, summarizing the yields of gluconate,
citrate and oxalate on glucose, being similar for the two strains corresponding to 0.099 cmol cmol-1 for the
wild type strain and 0.094 cmol cmol-1 for the ΔoafA mutant. This indicates that the capacity for acid

88
production is the same for the two strains under the defined conditions, but deletion of the oxalic acid
repression factor ensures a more efficient conversion of gluconate to oxalate. The acid response of A. niger
has been argued to be an evolutionary selection for efficient acidification of the environment and
gluconate does not contribute to a noteworthy acidification compared to oxalate and citrate (Andersen et
al. 2009). The conversion of glucose to gluconate is therefore considered an efficient way of rapidly make
glucose unavailable for competing organisms (Ruijter et al. 1999, Andersen et al. 2009) thus, the
constructed ΔoafA appears to be better at acidifying the ambient medium through efficient metabolization
of gluconate.
6.5.2 Transcriptome analysis
The physiological characterization provided insight to the profile and quantitative aspects of acid
production in the constructed ΔoafA mutant compared to the wild type strain. However, details on how the
deletion of ΔoafA affected the central carbon metabolism were limited, which is of high relevance since the
main metabolic response appears to be more efficient utilization of gluconate in the constructed strain.
Therefore, transcriptional profiling across both strains and pH were performed. Transcriptome analysis was
carried out on biological material from the chemostat cultures. Using this type of setup, pH and the strains
were the only variables and running the experiments in triplicates ensured high reproducibility, Table 6.3.
Furthermore, at steady state conditions in a carbon limited culture it is possible to mimic the conditions at
glucose depletion and simultaneously obtain both acid formation and growth. This enables discrimination
of even low-fold differences in expression and has been successfully applied earlier in Aspergillus oryzae
(Muller et al. 2002).
The number of differentially expressed genes identified in the transcription analysis at pH 5.0 was 241.
Considering that this response is caused by deletion of a single gene, oafA, it appears remarkable that one
putative trans-acting TF is regulating this amount of genes. An explanation of the high number of affected
genes could be the up-regulation of two genes connected to epigenetic regulation, especially a putative
histone acetyltransferase. Epigenetic regulation has attracted attention in connection with secondary
metabolite production (Reyes-Dominguez et al. 2010, Nutzmann et al. 2011), as it has been seen that
certain secondary metabolism clusters are silent, but can be activated by deletion of the histone
deacetylase HdaA, or inhibition of other fungal HDACs by trichostatin A (Shwab et al. 2007).
Oxaloacetate hydrolase encoded by oahA is an important enzyme in oxalate production, as it catalyzes the
conversion of oxaloacetate to oxalate and acetate. It was therefore a surprising discovery that no change in
expression level of oahA was measured at high pH in the ΔoafA mutant, since this strain was found to be an

89
oxalate overproducer. This indicates that oahA is either regulated after translation or oahA is not a rate-
limiting step for oxalate formation. The latter appears to be more likely since the Km value for OahA is 0.004
mM (Pedersen et al. 2000b) and Km for malate dehydrogenase is 0.09 mM (Ma et al. 1981) and an up-
regulation of a cytosolic malate dehydrogenase was observed at high pH. This enzyme has previously been
shown to play a key role in acid production (de Jongh and Nielsen 2008), as over expression of malate
dehydrogenase lead to increased citrate production as well as oxalate production. At low pH a significant
down-regulation of oahA was measured, which was unexpected as the oafA mutant had an oxalic acid
overproducing phenotype. However, as shown in Table 3 and supported by Ruijter et al. (1999), oxalate
was not detected at low pH and that makes the observation less important with respect to the oafA
phenotype at low pH.
Another interesting observation was the up-regulation of transporters in the ΔoafA mutant at high pH,
particularly sugar permeases. This could explain the lack of gluconate in these chemostats, since the
increased reuptake of gluconate could be mediated by the higher permease activity. Despite this higher
permease activity, no genes coding for glycolytic enzymes were to be found differentially regulated. This is
however a consequence of the chemostats being glucose limited and the glucose uptake cannot be
affected by the higher permease activity.
6.5.3 The role of phosphoketolases in oxalate production
Deletion of oafA resulted in a metabolic shift in the central metabolism demonstrated by the down-
regulation of both phosphoketolases (GeneID 54814 and 197387) in the oafA mutant. Two types of
phosphoketolases have been described in the literature. Type 1 (EC 4.1.2.9) catalyzes, in the presence of
inorganic phosphate, an irreversible cleavage of D-xylulose-5-phosphate into acetyl phosphate and
glyceraldehyde-3-phosphate. Type 2 (EC 4.1.2.22) also termed fructose-6-phosphate phosphoketolase
catalyzes as well in presence of phosphate, an irreversible cleavage of D-fructose 6-phosphate into acetyl
phosphate and D-erythrose 4-phosphate. The activity of type 1 phosphoketolases is well characterized in a
wide range of bacterial species and recently indications of this activity were found in Penicillium
chrysogenum (Thykaer and Nielsen 2007). Type 2 activity has only been described within a relative low
number of bacteria with bifidobacterium being most predominant (Roopashri and Varadaraj 2009).
An interesting finding in relation to geneID 197387 was that the open reading frame (ORF) of this gene was
located next to the ORF of an acetate kinase. The close linkage of the ORFs of phosphoketolase and acetate
kinase is found in many bacteria (Ingram-Smith et al. 2006), and this argues for geneID 197387 being a D-

90
xylulose 5-phosphate phosphoketolase. Which type geneID 54814 is encoding, can only be speculative since
the only annotated gene in the vicinity is a hypothetical dehydrogenase with an interpro id suggesting a
glucose/ribitol dehydrogenase activity.
The product in common for the two phosphoketolase enzymes is acetyl-phosphate that can be converted
to acetyl-CoA through two enzymatic steps catalyzed by acetate-kinase and acetyl-CoA synthase,
respectively. Together with the two genes encoding the phosphoketolases, the genes encoding acetate-
kinase and acetyl-CoA synthase were also down-regulated in the oafA mutant. The metabolic response
caused by the deletion of oafA is presented in Figure 6.4. As a consequence of the down regulation of the
phosphoketolases, the acetate-kinase and the acetyl-CoA synthase, the cytosolic pool of acetyl-phosphate
and the mitochondrial acetate pool must be reduced. To compensate for this, a larger fraction
mitochondrial AcCoA must originate from pyruvate, which requires a higher flux through glycolysis. This
argument is supported by the reported correlation between the glycolytic flux and the pool size of acetyl-
CoA (Sorensen et al. 2009). It was observed that addition of lactate, led to an increased pool of AcCoA,
which caused an up-regulation of the rate-limiting enzyme of the pentose phosphate pathway (PP
pathway), Glucose-6-phosphate dehydrogenase (Sorensen et al. 2009). In addition, increased flux through
glycolysis has earlier been associated with increased organic acid production. In citrate overflow
metabolism, the majority of the citrate produced originates from the glycolytic pathway (Cleland and
Johnson 1954, Legiša and Mattey 1986). However, based on the transcriptional profiling of the oafA
mutant, none of the genes encoding glycolytic enzymes were up-regulated. As described earlier, an up-
regulation of sugar permeases were argued to mediate an increased reuptake of gluconate in the oafA
mutant compared to the wild type strain. Furthermore, since the cultures were carried out as glucose
limited chemostats, the glucose uptake rate was fixed but the reuptake of gluconate by the mutant strain
could result in a higher amount of carbon metabolized through the glycolysis without a significant up-
regulation of the glycolytic genes, subsequently leading to the observed overproduction of oxalate.
In continuation of the proposed higher flux through glycolysis, the measured down-regulation of the two
phosphoketolase genes indicate a lower flux through the pentose phosphate pathway in the oafA mutant
compared to the wild type strain. The primary outcome of the PP-pathway is generation of reducing
equivalents in the form of NADPH, used mainly in reductive biosynthesis reactions e.g. amino acid
biosynthesis. A reduced flux through the PP-pathway would therefore result in a lower biomass yield and
this further substantiates the argument of a lower PP-pathway in the oafA mutant, as the biomass yield,
YSX; in the oafA strain was reduced compared to YSX of the wild type. Finally, in the reverse study where
oahA was deleted in A. niger eliminating oxalic acid production, an increase in the PP-pathway flux of 10%

91
was detected (Pedersen et al. 2000a, Pedersen et al. 2000b). Whether this was due to an up-regulation of
the phosphoketolases can only be speculative since neither transcription profiles nor enzyme activities of
these two enzymes were measured. Based on the results of the transcriptional profiles and the
physiological characterizations of the oafA mutant and the wild type strain, it is argued that the increased
oxalate formation in the oafA mutant is a consequence of an effective re-uptake of gluconate and thereby a
higher flux through glycolysis resulting in a lower flux through the PP-pathway, demonstrated by down-
regulation of the two phosphoketolases.
Figure 6.4 Metabolic map illustrating the response of central carbon metabolism caused by the oafA deletion. A red
box indicates up-regulation of a gene encoding an enzyme catalyzing this reaction. Green box indicates down-
regulation. The dotted line indicates fructose-6-phosphate phosphoketolase, a reaction not previously described
within the fungal kingdom.
6.5.4 Oxidative phosphorylation
The oxidative phosphorylation is responsible for the major ATP generation during aerobic metabolism by
coupling reoxidation of NADH to ATP synthesis. In the ΔoafA strain, down-regulation of the oxidative

92
phosphorylation was observed both physiologically by a 35 % decrease in oxygen consumption pr cmol
glucose (YSO) and transcriptionally as down-regulation of a NADH dehydrogenase and monooxygenase both
with ubiquinone binding. The decreased activity of the oxidative phosphoylation is further supported by the
down-regulation of genes encoding a catalase and a chloroperoxidase. These enzymes are highly conserved
in organisms exposed to oxygen and aid removal of reactive oxygen species that is an inevitable byproduct
of the cytochrome c oxidase complex. To our knowledge a connection between oxidative phosphorylation
and oxalate production has not been described, however the mutant response presented here provides
indications of such a connection.

93
6.6 Conclusion
From the results described above it is concluded that OafA is a trans-acting transcription factor since
deletion of the responsible gene resulted in 241 genes being differently expressed compared to the wild
type strain. In addition, OafA’s function as a transcription factor was further underlined by the altered acid
production profile in the oafA mutant strain, with focus on the mutant being an oxalate overproducing
strain.
Through transcription analysis, reduced phosphoketolase activity together with increased reuptake of
gluconate were identified as being the main players in the metabolic response, resulting in the observed
oxalate overproducing phenotype of the oafA strain. Furthermore, the oxidative phosphorylation was
down-regulated in the oafA mutant and this indicates an interesting correlation between the oxidative
phosphorylation and organic acid formation.
6.7 Acknowledgements
The students Julie Philip and Katherina Garcia Vanegas are acknowledged for their part in the experimental
work.

94
6.8 References
Alper, H., J. Moxley, E. Nevoigt, G. R. Fink and G. Stephanopoulos (2006). "Engineering yeast transcription machinery for improved ethanol tolerance and production." Science 314(5805): 1565-1568.
Andersen, M. R., L. Lehmann and J. Nielsen (2009). "Systemic analysis of the response of Aspergillus niger to ambient pH." Genome Biol 10(5): R47.
Andersen, M. R., M. P. Salazar, P. J. Schaap, P. J. van de Vondervoort, D. Culley, J. Thykaer, J. C. Frisvad, K. F. Nielsen, R. Albang, K. Albermann, R. M. Berka, G. H. Braus, S. A. Braus-Stromeyer, L. M. Corrochano, Z. Dai, P. W. van Dijck, G. Hofmann, L. L. Lasure, J. K. Magnuson, H. Menke, M. Meijer, S. L. Meijer, J. B. Nielsen, M. L. Nielsen, A. J. van Ooyen, H. J. Pel, L. Poulsen, R. A. Samson, H. Stam, A. Tsang, J. M. van den Brink, A. Atkins, A. Aerts, H. Shapiro, J. Pangilinan, A. Salamov, Y. Lou, E. Lindquist, S. Lucas, J. Grimwood, I. V. Grigoriev, C. P. Kubicek, D. Martinez, N. N. van Peij, J. A. Roubos, J. Nielsen and S. E. Baker (2011). "Comparative genomics of citric-acid-producing Aspergillus niger ATCC 1015 versus enzyme-producing CBS 513.88." Genome Res 21(6): 885-897.
Baker, S. E. (2006). "Aspergillus niger genomics: past, present and into the future." Med Mycol 44 Suppl 1: S17-21.
Benjamini, Y. and Y. Hochberg (1995). "Controlling the False Discovery Rate: A Practical and Powerful Approach to Multiple Testing." Journal of the Royal Statistical Society. Series B (Methodological) 57(1): 289-300.
Cleland, W. W. and M. J. Johnson (1954). "Tracer experiments on the mechanism of citric acid formation by Aspergillus niger." J Biol Chem 208(2): 679-689.
de Jongh, W. A. and J. Nielsen (2008). "Enhanced citrate production through gene insertion in Aspergillus niger." Metab Eng 10(2): 87-96.
Galagan, J. E., S. E. Calvo, K. A. Borkovich, E. U. Selker, N. D. Read, D. Jaffe, W. FitzHugh, L. J. Ma, S. Smirnov, S. Purcell, B. Rehman, T. Elkins, R. Engels, S. Wang, C. B. Nielsen, J. Butler, M. Endrizzi, D. Qui, P. Ianakiev, D. Bell-Pedersen, M. A. Nelson, M. Werner-Washburne, C. P. Selitrennikoff, J. A. Kinsey, E. L. Braun, A. Zelter, U. Schulte, G. O. Kothe, G. Jedd, W. Mewes, C. Staben, E. Marcotte, D. Greenberg, A. Roy, K. Foley, J. Naylor, N. Stange-Thomann, R. Barrett, S. Gnerre, M. Kamal, M. Kamvysselis, E. Mauceli, C. Bielke, S. Rudd, D. Frishman, S. Krystofova, C. Rasmussen, R. L. Metzenberg, D. D. Perkins, S. Kroken, C. Cogoni, G. Macino, D. Catcheside, W. Li, R. J. Pratt, S. A. Osmani, C. P. DeSouza, L. Glass, M. J. Orbach, J. A. Berglund, R. Voelker, O. Yarden, M. Plamann, S. Seiler, J. Dunlap, A. Radford, R. Aramayo, D. O. Natvig, L. A. Alex, G. Mannhaupt, D. J. Ebbole, M. Freitag, I. Paulsen, M. S. Sachs, E. S. Lander, C. Nusbaum and B. Birren (2003). "The genome sequence of the filamentous fungus Neurospora crassa." Nature 422(6934): 859-868.
Goffeau, A., B. G. Barrell, H. Bussey, R. W. Davis, B. Dujon, H. Feldmann, F. Galibert, J. D. Hoheisel, C. Jacq, M. Johnston, E. J. Louis, H. W. Mewes, Y. Murakami, P. Philippsen, H. Tettelin and S. G. Oliver (1996). "Life with 6000 genes." Science 274(5287): 546, 563-547.

95
Heinrich, M. and H. J. Rehm (1982). "Formation of gluconic acid at low pH-values by free and immobilized Aspergillus niger cells during citric acid fermentation." Applied Microbiology and Biotechnology 15(2): 88-92.
Ingram-Smith, C., S. R. Martin and K. S. Smith (2006). "Acetate kinase: not just a bacterial enzyme." Trends Microbiol 14(6): 249-253.
Irizarry, R. A., B. M. Bolstad, F. Collin, L. M. Cope, B. Hobbs and T. P. Speed (2003). "Summaries of Affymetrix GeneChip probe level data." Nucleic Acids Res 31(4): e15.
Legiša, M. and M. Mattey (1986). "Glycerol as an initiator of citric acid accumulation in Aspergillus niger." Enzyme and Microbial Technology 8(5): 258-259.
Ma, H., C. P. Kubicek and M. Röhr (1981). "Malate dehydrogenase isoenzymes in Aspergillus niger." FEMS Microbiology Letters 12(2): 147-151.
Maere, S., K. Heymans and M. Kuiper (2005). "BiNGO: a Cytoscape plugin to assess overrepresentation of gene ontology categories in biological networks." Bioinformatics 21(16): 3448-3449.
McCluskey, K., A. Wiest and M. Plamann (2010). "The Fungal Genetics Stock Center: a repository for 50 years of fungal genetics research." J Biosci 35(1): 119-126.
McCue, L. A., W. Thompson, C. S. Carmack and C. E. Lawrence (2002). "Factors influencing the identification of transcription factor binding sites by cross-species comparison." Genome Res 12(10): 1523-1532.
McIntyre, M. and B. McNeil (1997). "Effect of carbon dioxide on morphology and product synthesis in chemostat cultures of Aspergillus niger A60." Enzyme and Microbial Technology 21(7): 479-483.
Milo, R., S. Shen-Orr, S. Itzkovitz, N. Kashtan, D. Chklovskii and U. Alon (2002). "Network motifs: simple building blocks of complex networks." Science 298(5594): 824-827.
Muller, C., M. McIntyre, K. Hansen and J. Nielsen (2002). "Metabolic engineering of the morphology of Aspergillus oryzae by altering chitin synthesis." Appl Environ Microbiol 68(4): 1827-1836.
Nielsen, M. L., L. Albertsen, G. Lettier, J. B. Nielsen and U. H. Mortensen (2006). "Efficient PCR-based gene targeting with a recyclable marker for Aspergillus nidulans." Fungal Genet Biol 43(1): 54-64.
Nielsen, M. L., J. B. Nielsen, C. Rank, M. L. Klejnstrup, D. K. Holm, K. H. Brogaard, B. G. Hansen, J. C. Frisvad, T. O. Larsen and U. H. Mortensen (2011). "A genome-wide polyketide synthase deletion library uncovers

96
novel genetic links to polyketides and meroterpenoids in Aspergillus nidulans." FEMS Microbiol Lett 321(2): 157-166.
Nutzmann, H. W., Y. Reyes-Dominguez, K. Scherlach, V. Schroeckh, F. Horn, A. Gacek, J. Schumann, C. Hertweck, J. Strauss and A. A. Brakhage (2011). "Bacteria-induced natural product formation in the fungus Aspergillus nidulans requires Saga/Ada-mediated histone acetylation." Proc Natl Acad Sci U S A 108(34): 14282-14287.
Pedersen, H., B. Christensen, C. Hjort and J. Nielsen (2000a). "Construction and Characterization of an Oxalic Acid Nonproducing Strain of Aspergillus niger." Metabolic Engineering 2(1): 34-41.
Pedersen, H., C. Hjort and J. Nielsen (2000b). "Cloning and characterization of oah, the gene encoding oxaloacetate hydrolase in Aspergillus niger." Mol Gen Genet 263(2): 281-286.
Pel, H. J., J. H. de Winde, D. B. Archer, P. S. Dyer, G. Hofmann, P. J. Schaap, G. Turner, R. P. de Vries, R. Albang, K. Albermann, M. R. Andersen, J. D. Bendtsen, J. A. Benen, M. van den Berg, S. Breestraat, M. X. Caddick, R. Contreras, M. Cornell, P. M. Coutinho, E. G. Danchin, A. J. Debets, P. Dekker, P. W. van Dijck, A. van Dijk, L. Dijkhuizen, A. J. Driessen, C. d'Enfert, S. Geysens, C. Goosen, G. S. Groot, P. W. de Groot, T. Guillemette, B. Henrissat, M. Herweijer, J. P. van den Hombergh, C. A. van den Hondel, R. T. van der Heijden, R. M. van der Kaaij, F. M. Klis, H. J. Kools, C. P. Kubicek, P. A. van Kuyk, J. Lauber, X. Lu, M. J. van der Maarel, R. Meulenberg, H. Menke, M. A. Mortimer, J. Nielsen, S. G. Oliver, M. Olsthoorn, K. Pal, N. N. van Peij, A. F. Ram, U. Rinas, J. A. Roubos, C. M. Sagt, M. Schmoll, J. Sun, D. Ussery, J. Varga, W. Vervecken, P. J. van de Vondervoort, H. Wedler, H. A. Wosten, A. P. Zeng, A. J. van Ooyen, J. Visser and H. Stam (2007). "Genome sequencing and analysis of the versatile cell factory Aspergillus niger CBS 513.88." Nat Biotechnol 25(2): 221-231.
Punt, P. J., F. H. Schuren, J. Lehmbeck, T. Christensen, C. Hjort and C. A. van den Hondel (2008). "Characterization of the Aspergillus niger prtT, a unique regulator of extracellular protease encoding genes." Fungal Genet Biol 45(12): 1591-1599.
Reyes-Dominguez, Y., J. W. Bok, H. Berger, E. K. Shwab, A. Basheer, A. Gallmetzer, C. Scazzocchio, N. Keller and J. Strauss (2010). "Heterochromatic marks are associated with the repression of secondary metabolism clusters in Aspergillus nidulans." Mol Microbiol 76(6): 1376-1386.
Roopashri, A. N. and M. C. Varadaraj (2009). "Molecular characterization of native isolates of lactic acid bacteria, bifidobacteria and yeasts for beneficial attributes." Appl Microbiol Biotechnol 83(6): 1115-1126.
Ruijter, G. J., P. J. van de Vondervoort and J. Visser (1999). "Oxalic acid production by Aspergillus niger: an oxalate-non-producing mutant produces citric acid at pH 5 and in the presence of manganese." Microbiology 145 ( Pt 9): 2569-2576.
Sambrook, J. and D. W. Russell (2001). Molecular cloning : a laboratory manual. Cold Spring Harbor, N.Y., Cold Spring Harbor Laboratory Press, 0879695773 (paper)

97
Schumann, J. and C. Hertweck (2006). "Advances in cloning, functional analysis and heterologous expression of fungal polyketide synthase genes." J Biotechnol 124(4): 690-703.
Schuurmans, J. M., S. L. Rossell, A. van Tuijl, B. M. Bakker, K. J. Hellingwerf and M. J. Teixeira de Mattos (2008). "Effect of hxk2 deletion and HAP4 overexpression on fermentative capacity in Saccharomyces cerevisiae." FEMS Yeast Res 8(2): 195-203.
Shwab, E. K., J. W. Bok, M. Tribus, J. Galehr, S. Graessle and N. P. Keller (2007). "Histone deacetylase activity regulates chemical diversity in Aspergillus." Eukaryot Cell 6(9): 1656-1664.
Smyth, G. K. (2004). "Linear models and empirical bayes methods for assessing differential expression in microarray experiments." Stat Appl Genet Mol Biol 3: Article3.
Sorensen, L. M., R. Lametsch, M. R. Andersen, P. V. Nielsen and J. C. Frisvad (2009). "Proteome analysis of Aspergillus niger: lactate added in starch-containing medium can increase production of the mycotoxin fumonisin B2 by modifying acetyl-CoA metabolism." BMC Microbiol 9: 255.
Thykaer, J. and J. Nielsen (2007). "Evidence, through C13-labelling analysis, of phosphoketolase activity in fungi." Process Biochemistry 42(7): 1050-1055.

98

99
Chapter 7 Identification and characterization of a transcription factor
regulating extracellular proteolytic activity in Aspergillus niger
Poulsen L, Nielsen, JC., Lantz AE. and Thykaer J
7.1 Abstract
Aspergillus niger is widely used in the biotechnological industry, as it possess the ability to secrete proteins
in high titters. The yield of protein can be significantly reduced by proteolytic degradation, as a result of
secreted fungal proteases during cultivation. Based on transcriptome data, putative trans-acting, pH
responding transcription factors were identified and through knock out studies, a mutant exhibiting a
reduced extracellular protease activity was identified. The gene of the responsible transcription factor was
entitled protease regulator B (prtB). The prtB mutant strain (ΔprtB) was benchmarked against the well
described protease deficient strain, ΔprtT. The extracellular proteolytic activity was examined in three
different media, featuring different levels of protease induction.
The ΔprtT strain showed superior to ΔprtB in respect to reduced protease activity. Compared to the wild
type, the ΔprtB strain’s secreted protease activity was nearly twofold reduced whereas the ΔprtT strain’s
extracellular proteolytic activity was fivefold reduced. However, the ΔprtT strain had a higher CO2 yield on
substrate (44 % increased) and a lower biomass yield coefficient compared to the wild type and ΔprtB.
Additionally, the ΔprtB strain had a threefold reduction of oxalate formation compared to wild type and
ΔprtT. The results from the study showed that the ΔprtB strain holds potential as a future protein
production host in the biotechnological industry.

100
7.2 Introduction
The Aspergillus family, in particular A. niger, is widely applied as host for protein production. One of the
challenges using e.g. A. niger as production organism, is the formation and secretion of proteolytic
enzymes, that are produced simultaneously with the protein of interest. The proteases are a general
problem because they degrade the product and the problem is even more pronounced in production of
heterologous proteins due to the foreign origin of the produced protein. Consequently, homologous
proteins are in most cases produced in one to two orders of magnitude higher than heterologous proteins
(Braaksma and Punt 2008). The challenge with protease formation in A. niger is underlined by more than
150 genes encoding for proteases being identified in this fungus (Edens et al. 2005), where 32 of these
genes contain an export signal or have strong similarity to other secreted proteases in other organisms (Pel
et al. 2007). This indicates a complex regulation of the proteolytic system, which renders the fungus with
the ability to adapt to a wide range of environmental conditions, including pH and temperature variations.
The protease problem has been addressed by construction of protease deficient strains, which resulted in
reduced protease secretion (van den Hombergh et al. 1997a, van den Hombergh et al. 1997b). Another
strategy could be to target the regulation of the proteases by alteration of transcription factors (TF), as
described in chapter 5.
Only one TF regulating extracellular protease activity have so far been identified in A. niger, designated
prtT. Initially Mattern et al. (1992) identified a protease mutant, AB1.13, obtained by applying UV
mutagenesis. The location of the mutation was later identified by Braaksma & Punt (2008), to be within the
prtT gene. The regulatory protein PrtT is a member of the Zn(II)2Cys6 TF family and orthologs have been
identified in several Aspergilli as well in P. chrysogenum (Punt et al. 2008, Sharon et al. 2009) ; however, no
similar protein has been found in A. nidulans. PrtT has been identified to positively regulate multiple
extracellular proteases at the post-translational level. Expression of four out of seven investigated protease
genes was shown to be regulated by ΔprtT and activity studies have shown ΔprtT to have 20 % of the
activity of the wild type at pH 4.5 (Connelly & Brody 2004).
Based on the TF modulation strategy described in chapter 6, we identified a novel TF, designated prtB
(protease regulator B), found to positively regulate extracellular protease activity. In order to benchmark
the ΔprtB mutant, a ΔprtT mutant strain was also constructed and applied as a protease deficient reference
strain, in the present study.

101
7.3 Materials and methods
7.3.1 Fungal strains
A. niger ATCC 1015 was selected as reference strain in the present study (obtained from the IBT collection
as IBT 28639). The ΔprtT and ΔprtB strains were generated from the ATCC 1015 strain. All strains were
maintained as frozen spore suspensions at -80°C in 20% glycerol.
7.3.2 Media
Transformation medium: 182.2 g/L sorbitol, 10 g/L glucose monohydrate, 6 g/L NaNO3, 0.52 g/L KCl, 0.52
g/L MgSO4 · 7H2O, 1 mL/L of 1% thiamine solution, 1 mL/L trace element solution. Trace element solution:
22 g/L ZnSO4 · 7 H2O, 11 g/L H3BO3, 5 g/L MnCl2 · 4 H2O, 5 g/L FeSO4 · 7 H2O, 1.7 g/L CoCl2 · 6 H2O, 1.6 g/L
CuSO4 · 5 H2O, 1.5 g/L Na2MoO4 · 2 H2O, 50 g/L Na4EDTA.
Czapek yeast extract (CYA) media: 30 g/L Sucrose, 5 g/L Yeast extract, 3 g/L NaNO3, 1 g/L K2HPO4, 0.5 g/L
MgSO4 · 7 H2O, 0.5 g/L KCl, 0.01 g/L FeSO4 · 7H2O, 15 g/L Agar, 1 mL/L trace element solution. 0.4 g/L CuSO4
· 5 H2O, 0.04 g/L Na2B2O7 · 10 H2O, 0.8 g/L FeSO4 · 7 H2O, 0.8 g/L MnSO4 · H2O, 0.8 g/L Na2MoO4 · 2 H2O, 8.0
g/L ZnSO4 · 7 H2O. pH adjusted to 6.2 prior to autoclavation.
Minimal medium: 20 g/L glucose, 7.3 g/L (NH4)2SO4, 1.5 g/L KH2PO4, 1.0 g/L MgSO4 · 7 H2O, 1.0 g/L NaCl, 0.1
g/L CaCl2, 0.1 mL Antifoam 204 (sigma), 1 mL/L trace element solution. Trace element solution: 0.4 g/L
CuSO4 · 5 H2O, 0.04 g/L Na2B2O7 · 10 H2O, 0.8 g/L FeSO4 · 7 H2O, 0.8 g/L MnSO4 · H2O, 0.8 g/L Na2MoO4 · 2
H2O, 8.0 g/L ZnSO4 · 7 H2O. For screening, 19.52 g/L 2-(N-morpholino)ethanesulfonic acid (MES) was added.
pH adjusted to 6.0 prior to autoclavation.
Complex medium (Watman medium): 30 g/L Sucrose, 5 g/L Corn steep liquor, 2 g/L Yeast extract, 3 g/L
Peptone, 2 g/L Glucose, 2 g/L NaNO3, 1 g/L K2HPO4 · 3 H2O, 0.5 g/L MgSO4 · 7 H2O, 0.05 g/L FeSO4 · 7 H2O,
0.2 g/L KCl, 1 mL/L Trace metal solution. Trace element solution: 22 g/L ZnSO4 · 7 H2O, 11 g/L H3BO3, 5 g/L
MnCl2 · 4 H2O, 5 g/L FeSO4 · 7 H2O, 1.7 g/L CoCl2 · 6 H2O, 1.6 g/L CuSO4 · 5 H2O, 1.5 g/L Na2MoO4 · 2 H2O, 50
g/L Na4EDTA. As buffer 19.52 g/L 2-(N-morpholino)ethanesulfonic acid (MES) was used. pH adjusted to 6.0
prior to autoclavation.
Protease induction medium (PIM), was prepared as described by van den Hombergh et al. (1995).

102
7.3.3 Preparation of inoculum
Conidia were propagated on CYA media plates and incubated for 5 to 7 days at 30°C before being harvested
with 2 times 10 ml 0.9 % NaCl and filtered through miracloth and washed twice with 0.9 % NaCl.
Fermentations were initiated by conidia inoculation to a final concentration of 2 × 10⁹ spores/L
7.3.4 Target selection
The target selection was performed analogue to chapter 6.
7.3.5 PCR amplification
All PCR reactions were carried out using the high fidelity Phusion polymerase from Finnzymes at standard
conditions with HF-buffer.
7.3.6 Gene deletion
All DNA insertions into the A. niger genome were performed using protoplasts and PEG transformation. The
deletion strains were constructed using PCR-generated bipartite gene targeting substrates (Nielsen et al.
2006). Each part of the bipartite substrate consisted of a targeting fragment and a marker fragment, all of
which were amplified individually by PCR using the primer pairs presented in Table 7.1. Hygromycin
phosphotransferase gene (hph) marker cassette amplified from plasmid pCB10003 (McCluskey et al. 2010)
as template DNA.
7.3.7 Oligonucleotide PCR primers
The oligonucleotides used for the strain construction of ΔprtT and ΔprtB can be found in table 7.1.
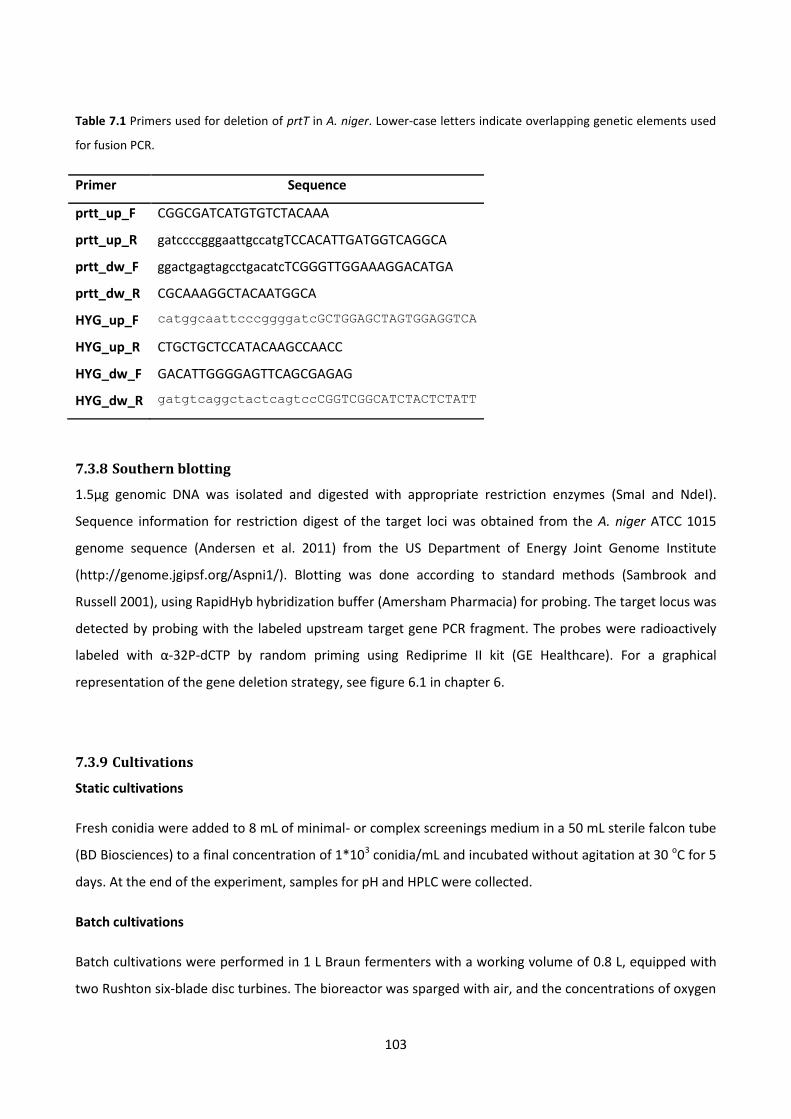
103
Table 7.1 Primers used for deletion of prtT in A. niger. Lower-case letters indicate overlapping genetic elements used
for fusion PCR.
Primer Sequence
prtt_up_F CGGCGATCATGTGTCTACAAA
prtt_up_R gatccccgggaattgccatgTCCACATTGATGGTCAGGCA
prtt_dw_F ggactgagtagcctgacatcTCGGGTTGGAAAGGACATGA
prtt_dw_R CGCAAAGGCTACAATGGCA
HYG_up_F catggcaattcccggggatcGCTGGAGCTAGTGGAGGTCA
HYG_up_R CTGCTGCTCCATACAAGCCAACC
HYG_dw_F GACATTGGGGAGTTCAGCGAGAG
HYG_dw_R gatgtcaggctactcagtccCGGTCGGCATCTACTCTATT
7.3.8 Southern blotting
1.5µg genomic DNA was isolated and digested with appropriate restriction enzymes (SmaI and NdeI).
Sequence information for restriction digest of the target loci was obtained from the A. niger ATCC 1015
genome sequence (Andersen et al. 2011) from the US Department of Energy Joint Genome Institute
(http://genome.jgipsf.org/Aspni1/). Blotting was done according to standard methods (Sambrook and
Russell 2001), using RapidHyb hybridization buffer (Amersham Pharmacia) for probing. The target locus was
detected by probing with the labeled upstream target gene PCR fragment. The probes were radioactively
labeled with α-32P-dCTP by random priming using Rediprime II kit (GE Healthcare). For a graphical
representation of the gene deletion strategy, see figure 6.1 in chapter 6.
7.3.9 Cultivations
Static cultivations
Fresh conidia were added to 8 mL of minimal- or complex screenings medium in a 50 mL sterile falcon tube
(BD Biosciences) to a final concentration of 1*103 conidia/mL and incubated without agitation at 30 oC for 5
days. At the end of the experiment, samples for pH and HPLC were collected.
Batch cultivations
Batch cultivations were performed in 1 L Braun fermenters with a working volume of 0.8 L, equipped with
two Rushton six-blade disc turbines. The bioreactor was sparged with air, and the concentrations of oxygen

104
and carbon dioxide in the exhaust gas were measured in a gas analyzer (1311 Fast response Triple gas,
Innova combined with multiplexer controller for Gas Analysis MUX100, B. Braun Biotech International
(Melsungen, Germany)). The temperature was maintained at 30°C during the cultivation and pH was
controlled by automatic addition of 2 M NaOH and 1 M HCl. For inoculation of the bioreactor, the pH was
adjusted to 3.0; stirring rate: 100 rpm; and aeration: 0.2 volumes of air per volume of fluid per minute
(vvm). After germination, the stirring rate was increased to 800 rpm and the air flow to 1 vvm. The pH was
adjusted to 2.5 or 6.0 with addition of 2 M NaOH or 1 M HCl over 2 hours.
7.3.10 Cell dry weight determination
The cell mass concentration on a dry weight basis was determined by the use of nitrocellulose filters with a
pore size of 0.45 μm (Osmonics, Minnetonka, MN, USA). Initially, the filters were pre-dried in a microwave
oven at 150 W for 20 min, and then weighed. A known weight of cell culture was filtered, and the residue
was washed with distilled water. Finally, the filter was dried in the microwave at 150 W for 20 min and the
dry weight was determined.
7.3.11 Quantification of extracellular metabolites
HPLC
For quantification of the extracellular metabolites, a culture sample was taken and immediately filtered
through a 0.45 μm-pore-size nitrocellulose filter (Osmonics). The filtrate was frozen and kept at −20°C until
analysis. Glucose, oxalate, citrate, gluconate, glycerol and acetate concentrations were detected and
quantified by refractive index and UV using an Aminex HPX-87H cationic-exchange column (BioRad,
Hercules, CA, USA) eluted at 35°C, with 5 mM H2SO4 at a flow rate of 0.6 mL min−1.
Glucose assay
Enzymatic glucose assay was performed using an enzymatic glucose kit (ABX Pentra, Glucose HK CP) to
determine the glucose concentration in the PIM media where HPLC quantification was not possible.
Samples were processed as described by the manufacturer and absorbance was kinetically measured for 10
minutes at 360 nm, using a Biotek Synergy 2 plate reader. The assay was based on NAD+ through a coupled
reaction with glucose-6-phosphate dehydrogenase and formation of NADH was determined
spectrophotometrically by measuring the increase in absorbance at 340 nm.

105
7.3.12 Protein analysis
Protein quantification
Protein content was quantified using Bradford assay. Pierce Bradord assay kit was applied and performed as
described by the manufacturer. Absorbance was measured at 600 nm, using a Biotek Synergy 2 plate
reader.
Protease assay
Protease activity was determined by a modified procedure of Megazyme azocasein assay. Samples and 2.5
% azocasein diluted in 100 mM sodium acetate, pH 4.5, were preheated to reaction temperature (30oC). 50
μL of preheated 2.5 % azocasein was added to same volume of sample. The reaction mixture was vortexed,
incubated for 2 hours, and terminated by the addition of 1 mL 5 % trichloroaceticacid (w/v). Samples were
kept on ice for 20 minutes and precipitated by centrifugation at 13,000 g at 4oC for 8 minutes. After
centrifugation 200 μL of the supernatant were mixed with 50 μL 1.6 M NaOH to a final concentration of 0.1
M NaOH, and absorbance were measured at 420 nm using a Biotek Synergy 2 plate reader.
Acetone Precipitation
Prior to SDS-page, the samples were concentrated by acetone precipitation. A sample volume were mixed
with -20oC acetone, in the proportion 1:4. The reaction mixture were kept at -20oC for 1 hour, followed by
centrifugation at 20,000 g in 10 minutes at 4oC. The supernatant were discarded, and the remaining
acetone evaporated for 30 minutes at room temperature. The precipitate was resuspended in 20 mM Tris
buffer, pH 7.5.
SDS-page
The samples were separated on SDS-PAGE, using a commercial pre-cast gel, NuPAGE Novex®, 4-12% Bis-
Tris, 1.0-mm thick. The gel was placed in a Xcell Surelock Mini-Cell and performed as described by the
manufacturer.

106
7.4 Results and discussion
7.4.1 Strain construction
Several deletion mutants where constructed through a bipartite gene knockout approach, using
hygromycin as dominant marker. The deletion where verified by PCR and checked for ectopic insertions by
Southern analysis.
Figure 7.1 Southern analysis of transformants for site specific integration of the construct. Genomic DNA was digested
with NdeI or SmaI in the case of ΔprtT and NdeI or ScaI, in the case of ΔprtB.
The Southern analysis was carried out with a similar strategy, as described in chapter 6. A correct insertion
for the ΔprtT strain was designed so; digestion with NdeI resulted in one band of 1.4 kb, whereas SmaI
digestion results in one band of 5.8 kb. Similarly for a the ΔprtB strain, digestion with NdeI resulted in two
bands of 1.4 kb and 5.8 kb respectively, whereas ScaI digestion resulted in one band of 5.6 kb. Figure 7.1,
only correct sized bands were observed, thus the HygR cassette had been integrated at only at the right
position, in the genome of A. niger ATCC 1015.
7.4.2 Screening
Secretion of proteases are affected by many environmental parameters including, the source, the type and
concentrations of carbon and nitrogen (Jarai and Buxton 1994, Gordon et al. 2000, Braaksma and Punt
2008). To characterize the strains protease secretion, in a profound manner, three liquid growth media
were selected, comprised of diverse media compositions. A minimal medium (MM), a complete rich
medium (CM) and a protease induction media (PIM), a minimal medium supplemented 3 % (w/v) wheat
bran. The initial screening phase only included the MM and CM. All protease activities were based on the
azocasein assay and given as a normalized value based on the wild type protease activity in the referred
media.
1.4 kb
5.8 kb 5.6 kb
3.6 kb
9.4 kb
ΔprtT
NdeI SmaI
ΔprtB
NdeI ScaI
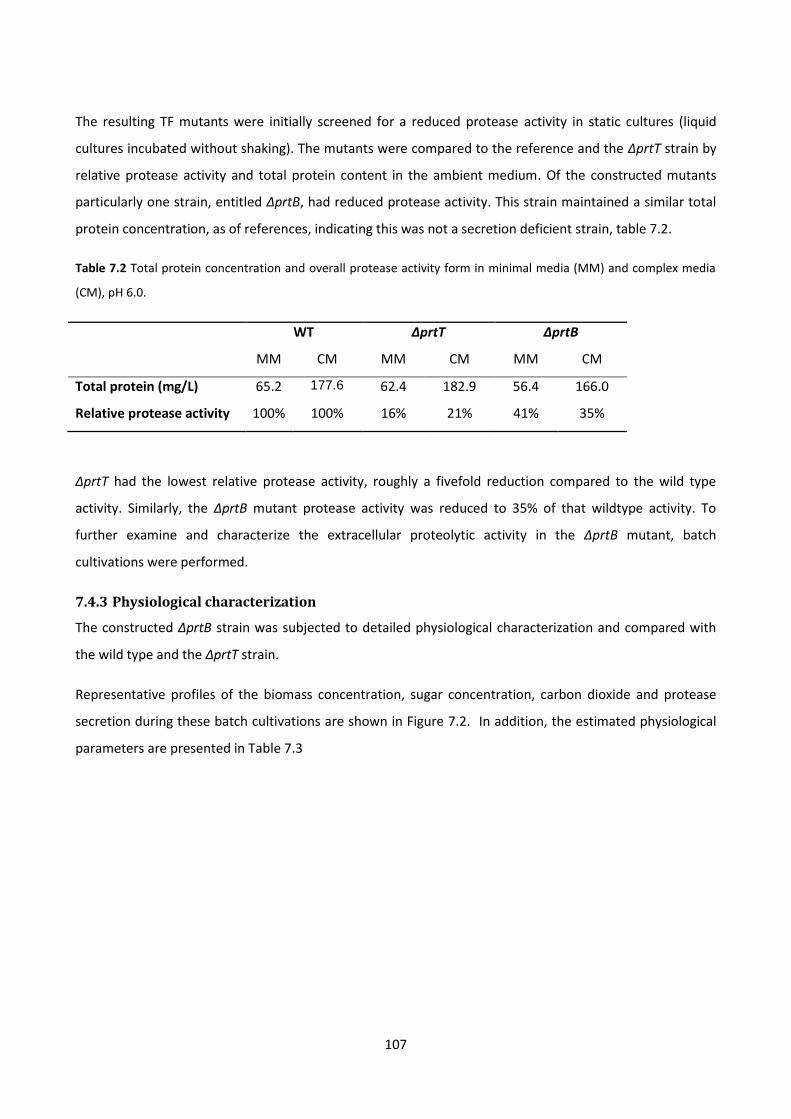
107
The resulting TF mutants were initially screened for a reduced protease activity in static cultures (liquid
cultures incubated without shaking). The mutants were compared to the reference and the ΔprtT strain by
relative protease activity and total protein content in the ambient medium. Of the constructed mutants
particularly one strain, entitled ΔprtB, had reduced protease activity. This strain maintained a similar total
protein concentration, as of references, indicating this was not a secretion deficient strain, table 7.2.
Table 7.2 Total protein concentration and overall protease activity form in minimal media (MM) and complex media
(CM), pH 6.0.
WT ΔprtT ΔprtB
MM CM MM CM MM CM
Total protein (mg/L) 65.2 177.6 62.4 182.9 56.4 166.0
Relative protease activity 100% 100% 16% 21% 41% 35%
ΔprtT had the lowest relative protease activity, roughly a fivefold reduction compared to the wild type
activity. Similarly, the ΔprtB mutant protease activity was reduced to 35% of that wildtype activity. To
further examine and characterize the extracellular proteolytic activity in the ΔprtB mutant, batch
cultivations were performed.
7.4.3 Physiological characterization
The constructed ΔprtB strain was subjected to detailed physiological characterization and compared with
the wild type and the ΔprtT strain.
Representative profiles of the biomass concentration, sugar concentration, carbon dioxide and protease
secretion during these batch cultivations are shown in Figure 7.2. In addition, the estimated physiological
parameters are presented in Table 7.3

108
Figure 7.2 Representative cultivation profiles of biomass concentration, sugar concentration, carbon dioxide
formation and relative protease activity during batch cultivations at pH 4.5 for the wild type-strain (left), ΔprtT
(middle) and the ΔprtB strain (right).
As presented in figure 7.2, both deletion strains were able to grow similarly to the wild type in all three
mediums. The induction of the extracellular proteases followed as well a comparable pattern, of glucose
depletion initiating the activity. The correlation between protease secretion and carbon catabolite
repression (CCR) has been investigated in A. nidulans, where disruption in the CCR regulatory gene creA,
resulted in increased levels of extracellular protease activity (Katz et al. 2008). Orthologs of this gene are
present in other Aspergilli, including A. niger (Drysdale et al. 1993).

109
Table 7.3 Physiological coefficients from the batch cultivations at pH 4.5.
WT ΔprtT ΔprtB
PIM
µmax (h-1)* 0.18 ± 0.00 0.18 ± 0.02 0.20 ± 0.00
YSX (cmole/cmole) N/A N/A N/A
YSCO2(cmole/cmole) N/A N/A N/A
YSX,overall(cmole/cmole) N/A N/A N/A
CM
µmax (h-1) 0.22 ± 0.01 0.23 ± 0.01 0.25 ± 0.02
YSX (cmole/cmole) N/A N/A N/A
YSCO2(cmole/cmole) N/A N/A N/A
YSX,overall(cmole/cmole) N/A N/A N/A
MM
µmax (h-1) 0.22 ± 0.02 0.20 ± 0.00 0.23 ± 0.01
YSX (cmole/cmole) 0.84 ± 0.12 0.82 ± 0.10 0.85 ± 0.10
YSCO2(cmole/cmole) 0.24 ± 0.01 0.34 ±0.06 0.22 ± 0.03
YSX,overall(cmole/cmole) 0.71 ± 0.08 0.64 ± 0.09 0.74 ± 0.12
Values are shown as average ± standard deviation of two biological replicates. Yield coefficients are based on
measured values at mid-exponential phase and the overall coefficients are based on values measured at the end of
the cultivation. * Due to wheat bran particles precluded dry weight measurement, the growth rate in the PIM media
was estimated applying the rate of CO2 generation. Using the rCO2 measurement and assuming a similar central carbon
metabolism, rCO2 can give an estimate for the growth rate.
From table 7.3, no considerable changes between the strains growth rates (<12 % difference) were
observed in PIM and CM. For the MM cultivations, the wild type and ΔprtB grew with similar rates, while
the growth rate of ΔprtT was 10-13 % reduced. Notable was the 42 % increased CO2 generation of ΔprtT in
MM. A similar trend, for ΔprtT, was also observed in the CM for the ΔprtT strain. A consequence of the The
increased CO2 generation was a reduction of 10% in, reduced the overall biomass yield in MM with 10 %.
Differences were also seen in oxalic acid formation. For ΔprtB the highest concentration observed of this
acid was 0.5 g/L and compared to the wild type and the ΔprtT stains, this was a more than threefold
reduction (data no shown).
From the physiological characterization, it was apparent that the ΔprtB strain had beneficial features for
being a host for protein production. The performance in the bioreactors was close to the wild type, with a
couple of exceptions. Oxalic acid can cause problems in the downstream processing due to formation of
precipitates with metal ions, hence lower yields of this acid is a particular beneficial feature for ΔprtB.
Interestingly, the ΔprtT-mutant showed a higher yield of CO2 on substrate compared to both the wild type
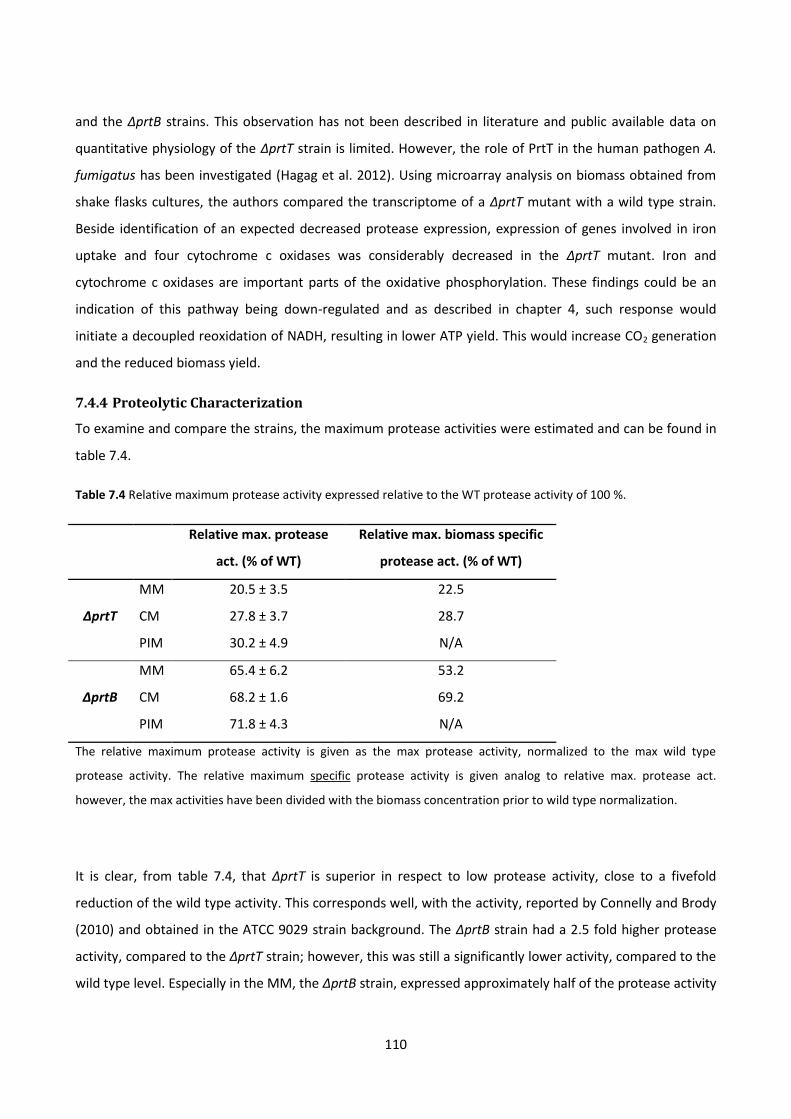
110
and the ΔprtB strains. This observation has not been described in literature and public available data on
quantitative physiology of the ΔprtT strain is limited. However, the role of PrtT in the human pathogen A.
fumigatus has been investigated (Hagag et al. 2012). Using microarray analysis on biomass obtained from
shake flasks cultures, the authors compared the transcriptome of a ΔprtT mutant with a wild type strain.
Beside identification of an expected decreased protease expression, expression of genes involved in iron
uptake and four cytochrome c oxidases was considerably decreased in the ΔprtT mutant. Iron and
cytochrome c oxidases are important parts of the oxidative phosphorylation. These findings could be an
indication of this pathway being down-regulated and as described in chapter 4, such response would
initiate a decoupled reoxidation of NADH, resulting in lower ATP yield. This would increase CO2 generation
and the reduced biomass yield.
7.4.4 Proteolytic Characterization
To examine and compare the strains, the maximum protease activities were estimated and can be found in
table 7.4.
Table 7.4 Relative maximum protease activity expressed relative to the WT protease activity of 100 %.
Relative max. protease
act. (% of WT)
Relative max. biomass specific
protease act. (% of WT)
ΔprtT
MM 20.5 ± 3.5 22.5
CM 27.8 ± 3.7 28.7
PIM 30.2 ± 4.9 N/A
ΔprtB
MM 65.4 ± 6.2 53.2
CM 68.2 ± 1.6 69.2
PIM 71.8 ± 4.3 N/A
The relative maximum protease activity is given as the max protease activity, normalized to the max wild type
protease activity. The relative maximum specific protease activity is given analog to relative max. protease act.
however, the max activities have been divided with the biomass concentration prior to wild type normalization.
It is clear, from table 7.4, that ΔprtT is superior in respect to low protease activity, close to a fivefold
reduction of the wild type activity. This corresponds well, with the activity, reported by Connelly and Brody
(2010) and obtained in the ATCC 9029 strain background. The ΔprtB strain had a 2.5 fold higher protease
activity, compared to the ΔprtT strain; however, this was still a significantly lower activity, compared to the
wild type level. Especially in the MM, the ΔprtB strain, expressed approximately half of the protease activity

111
compared to the wild type. It should however be noted, that in the end of some of the cultivations, the
protease activity suddenly raised e.g. ΔprtT in minimal media, Figure 7.2. These values were neglected from
the calculated values of table 7.4, as it was assumed to be caused by autolysis of mycelia, hence release of
intracellular proteases into the medium.
7.4.5 Protein profile
To investigate changes in the extracellular protein composition of the three strains, the protein profile was
examined by SDS-PAGE analysis of the fermentation broth. All samples were from the mid stationary phase
(40-45 hours).
(A) (B)
Figure 7.3: (A) SDS-PAGE of mid stationary phase samples. The figure is compiled from the full SDS-PAGE gels. ‘L’ is the
ladder and the weight of the protein fragments are marked to the left, given in kDa. (B) Magnification of the 33-48
kDa area. Only qualitative comparing can be performed, as the sample loads were not normalized. Full pictures can be
found in appendix 4.
As presented in figure 7.3.A, the protein content varies greatly, dependent on the composition of medium
the strains were cultured in. The protein content of the MM samples was considerably lower, compared to
the CM and PIM samples. Yet, by close examinations of figure 7.3.B, differences can still be observed. From
the MM samples, the wild-type contains three bands whereas the extracellular samples from ΔprtT and
ΔprtB cultures contain one and two bands respectively. In the samples of remaining media, only ΔprtT
195
142
96
71
48
33
28
22
12
WT
Δp
rtT
Δp
rtB
L WT
Δp
rtT
Δp
rtB
L WT
Δp
rtT
Δp
rtB
L
MM CM PIM
MM
CM
PIM
WT
Δp
rtT
Δp
rtB
L
48
33
48
33
48
33
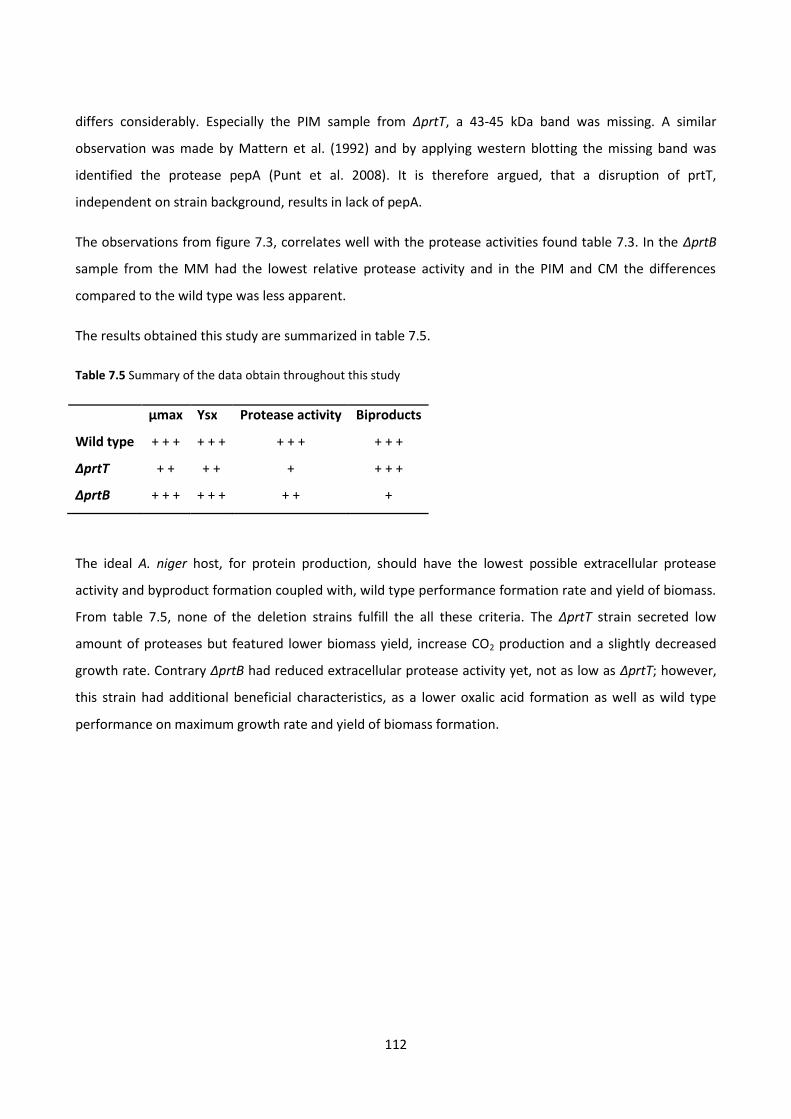
112
differs considerably. Especially the PIM sample from ΔprtT, a 43-45 kDa band was missing. A similar
observation was made by Mattern et al. (1992) and by applying western blotting the missing band was
identified the protease pepA (Punt et al. 2008). It is therefore argued, that a disruption of prtT,
independent on strain background, results in lack of pepA.
The observations from figure 7.3, correlates well with the protease activities found table 7.3. In the ΔprtB
sample from the MM had the lowest relative protease activity and in the PIM and CM the differences
compared to the wild type was less apparent.
The results obtained this study are summarized in table 7.5.
Table 7.5 Summary of the data obtain throughout this study
µmax Ysx Protease activity Biproducts
Wild type + + + + + + + + + + + +
ΔprtT + + + + + + + +
ΔprtB + + + + + + + + +
The ideal A. niger host, for protein production, should have the lowest possible extracellular protease
activity and byproduct formation coupled with, wild type performance formation rate and yield of biomass.
From table 7.5, none of the deletion strains fulfill the all these criteria. The ΔprtT strain secreted low
amount of proteases but featured lower biomass yield, increase CO2 production and a slightly decreased
growth rate. Contrary ΔprtB had reduced extracellular protease activity yet, not as low as ΔprtT; however,
this strain had additional beneficial characteristics, as a lower oxalic acid formation as well as wild type
performance on maximum growth rate and yield of biomass formation.

113
7.5 Conclusion
In perspective as potential protein cell factories, different characteristics were proved by both strains,
favorable and unfavorable features. It is therefore impossible, with the data from this study, to favor one
strain over the other. Especially with regard to industrial relevance, a product specific evaluation is needed.
Finally, these results were obtained in the ATCC 1015 strain background. The similar reported protease
activity obtained by ΔprtT in ATCC 9029 strain background indicates, that the obtained result from ΔprtB
could possibly be directly transferred to other A. niger strain backgrounds.

114
7.6 References
Andersen, M. R., M. P. Salazar, P. J. Schaap, P. J. van de Vondervoort, D. Culley, J. Thykaer, J. C. Frisvad, K. F. Nielsen, R. Albang, K. Albermann, R. M. Berka, G. H. Braus, S. A. Braus-Stromeyer, L. M. Corrochano, Z. Dai, P. W. van Dijck, G. Hofmann, L. L. Lasure, J. K. Magnuson, H. Menke, M. Meijer, S. L. Meijer, J. B. Nielsen, M. L. Nielsen, A. J. van Ooyen, H. J. Pel, L. Poulsen, R. A. Samson, H. Stam, A. Tsang, J. M. van den Brink, A. Atkins, A. Aerts, H. Shapiro, J. Pangilinan, A. Salamov, Y. Lou, E. Lindquist, S. Lucas, J. Grimwood, I. V. Grigoriev, C. P. Kubicek, D. Martinez, N. N. van Peij, J. A. Roubos, J. Nielsen and S. E. Baker (2011). "Comparative genomics of citric-acid-producing Aspergillus niger ATCC 1015 versus enzyme-producing CBS 513.88." Genome Res 21(6): 885-897.
Braaksma, M. and P. J. Punt (2008). Aspergillus as a cell factory for protein production: controlling protease activity in fungal production. The Aspergilli: Genomics, Medical Aspects, Biotechnology, and Research Methods, CRC Press: 441-455.
Drysdale, M. R., S. E. Kolze and J. M. Kelly (1993). "The Aspergillus niger carbon catabolite repressor encoding gene, creA." Gene 130(2): 241-245.
Edens, L., A. Van Dijk, P. Krubasik, K. Albermann, A. Stock, E. Kimpel, S. Klugbauer, C. Wagner, A. Fritz, W. Von Gustedt, O. Heinrich, D. Maier, F. Spreafico, U. Folkers, S. Hopper, W. Kemmner, P. Tan, J. Stiebler and R. Albang (2005). Novel genes encoding proteolytic enzymes: US7323327.
Gordon, C. L., V. Khalaj, A. F. Ram, D. B. Archer, J. L. Brookman, A. P. Trinci, D. J. Jeenes, J. H. Doonan, B. Wells, P. J. Punt, C. A. van den Hondel and G. D. Robson (2000). "Glucoamylase::green fluorescent protein fusions to monitor protein secretion in Aspergillus niger." Microbiology 146 ( Pt 2): 415-426.
Hagag, S., P. Kubitschek-Barreira, G. W. Neves, D. Amar, W. Nierman, I. Shalit, R. Shamir, L. Lopes-Bezerra and N. Osherov (2012). "Transcriptional and proteomic analysis of the Aspergillus fumigatus DeltaprtT protease-deficient mutant." PLoS One 7(4): e33604.
Jarai, G. and F. Buxton (1994). "Nitrogen, carbon, and pH regulation of extracellular acidic proteases of Aspergillus niger." Curr Genet 26(3): 238-244.
Katz, M. E., S. M. Bernardo and B. F. Cheetham (2008). "The interaction of induction, repression and starvation in the regulation of extracellular proteases in Aspergillus nidulans: evidence for a role for CreA in the response to carbon starvation." Curr Genet 54(1): 47-55.
Mattern, I. E., J. M. van Noort, P. van den Berg, D. B. Archer, I. N. Roberts and C. A. van den Hondel (1992). "Isolation and characterization of mutants of Aspergillus niger deficient in extracellular proteases." Mol Gen Genet 234(2): 332-336.
McCluskey, K., A. Wiest and M. Plamann (2010). "The Fungal Genetics Stock Center: a repository for 50 years of fungal genetics research." J Biosci 35(1): 119-126.

115
Nielsen, M. L., L. Albertsen, G. Lettier, J. B. Nielsen and U. H. Mortensen (2006). "Efficient PCR-based gene targeting with a recyclable marker for Aspergillus nidulans." Fungal Genet Biol 43(1): 54-64.
Pel, H. J., J. H. de Winde, D. B. Archer, P. S. Dyer, G. Hofmann, P. J. Schaap, G. Turner, R. P. de Vries, R. Albang, K. Albermann, M. R. Andersen, J. D. Bendtsen, J. A. Benen, M. van den Berg, S. Breestraat, M. X. Caddick, R. Contreras, M. Cornell, P. M. Coutinho, E. G. Danchin, A. J. Debets, P. Dekker, P. W. van Dijck, A. van Dijk, L. Dijkhuizen, A. J. Driessen, C. d'Enfert, S. Geysens, C. Goosen, G. S. Groot, P. W. de Groot, T. Guillemette, B. Henrissat, M. Herweijer, J. P. van den Hombergh, C. A. van den Hondel, R. T. van der Heijden, R. M. van der Kaaij, F. M. Klis, H. J. Kools, C. P. Kubicek, P. A. van Kuyk, J. Lauber, X. Lu, M. J. van der Maarel, R. Meulenberg, H. Menke, M. A. Mortimer, J. Nielsen, S. G. Oliver, M. Olsthoorn, K. Pal, N. N. van Peij, A. F. Ram, U. Rinas, J. A. Roubos, C. M. Sagt, M. Schmoll, J. Sun, D. Ussery, J. Varga, W. Vervecken, P. J. van de Vondervoort, H. Wedler, H. A. Wosten, A. P. Zeng, A. J. van Ooyen, J. Visser and H. Stam (2007). "Genome sequencing and analysis of the versatile cell factory Aspergillus niger CBS 513.88." Nat Biotechnol 25(2): 221-231.
Punt, P. J., F. H. Schuren, J. Lehmbeck, T. Christensen, C. Hjort and C. A. van den Hondel (2008). "Characterization of the Aspergillus niger prtT, a unique regulator of extracellular protease encoding genes." Fungal Genet Biol 45(12): 1591-1599.
Sambrook, J. and D. W. Russell (2001). Molecular cloning : a laboratory manual. Cold Spring Harbor, N.Y., Cold Spring Harbor Laboratory Press, 0879695773 (paper)
0879695765 (cloth).
Sharon, H., S. Hagag and N. Osherov (2009). "Transcription factor PrtT controls expression of multiple secreted proteases in the human pathogenic mold Aspergillus fumigatus." Infect Immun 77(9): 4051-4060.
van den Hombergh, J. P., L. Fraissinet-Tachet, P. J. van de Vondervoort and J. Visser (1997a). "Production of the homologous pectin lyase B protein in six genetically defined protease-deficient Aspergillus niger mutant strains." Curr Genet 32(1): 73-81.
van den Hombergh, J. P., M. D. Sollewijn Gelpke, P. J. van de Vondervoort, F. P. Buxton and J. Visser (1997b). "Disruption of three acid proteases in Aspergillus niger--effects on protease spectrum, intracellular proteolysis, and degradation of target proteins." Eur J Biochem 247(2): 605-613.
van den Hombergh, J. P., P. J. van de Vondervoort, N. C. van der Heijden and J. Visser (1995). "New protease mutants in Aspergillus niger result in strongly reduced in vitro degradation of target proteins; genetical and biochemical characterization of seven complementation groups." Curr Genet 28(4): 299-308.

116

117
Chapter 8 Nutrient profiling reveals potent inducers of fumonisin
biosynthesis in Aspergillus niger
Poulsen L., Thykaer J. and Nielsen, KF.
8.1 Abstract
Aspergillus niger is one of the most important and widely applied cell factories. The recent discovery of the
fumonisin gene cluster, in A. nigers genome, was for many surprising, since fumonsins had not previously
been detected in the species. To investigate this conundrum, a reporter strain of A. niger was constructed,
where the promoter from the fumonisin synthase was fused to the green fluorescent protein. This strain
was screened using 476 Biolog nutrient profiling conditions showing that six compounds significantly induce
fumonisin production. These compounds formed the basis for an expanded investigation, targeting the
central metabolism and melanin synthesis. It was discovered that the fumonisin synthesis takes place in the
vesicle of the conidiophore and requires activation of compounds that enter the metabolism through the
glycolysis. Inhibitors (4 of 5 tested) of the enzyme tyrosinase, an important enzymatic step for melanin
synthesis, also induced fumonisin. The strongest fumonisin inducer was the tyrosinase inhibitor and plant
hormone, azelaic acid that increased fumonisin production 64 fold. Finally, based on fluorescence
microscopy, we propose that fumonisin production only take place within the conidiophore (thus requiring
sporulation)

118
8.2 Introduction
Aspergillus niger is one of the most important industrial organisms as it has a high growth rate, can tolerate
very low pH, and performs well in fermenters. Currently A. niger is used extensively for industrial
production of organic acids (Kubicek et al. 1985, Karaffa and Kubicek 2003, Goldberg et al. 2006) and
extracellular enzymes (Olempska-Beer et al. 2006, Fleissner and Dersch 2010), where many processes has
gained GRAS status, as described in chapter 2. Since it has intron splicing and post translational machinery
it is widely applied for heterologous production of proteins (chapter 2), as well as being considered a good
candidate for production of secondary metabolites (Hofmann et al. 2009, Nielsen et al. 2009). Three A.
niger full genomes are publically available, and analysis of these genomes revealed presence of the gene
cluster of the carcinogenic fumonisins later shown to be responsible for formation of fumonisins B2, B4, and
B6 but not B1 (Mansson et al. 2010, Frisvad et al. 2011). Interestingly only one of the three, CBS 513.88,
harbours an entire functional ochratoxin A gene cluster (Frisvad et al. 2011).
Despite the historical use of A. niger in industry, it appears intriguing that formation of fumonisins in this
species was not reported before the release of the genome sequences, as a large fraction of the strains are
capable of producing the toxins (Frisvad et al. 2011). Most likely fumonisins are not produced under
submerged conditions, and it has not been detected it in industrial A. niger products nor samples from
fermenters (Nielsen, KF. unpublished results). However, recently fumonsins production was observed
under special submerged conditions, called retentostate (Jørgensen et al. 2011). Contrary to traditional
batch and chemostat cultures, in this retentostate setup, conidia formation was observed. We therefore
speculate that fumonisin production is linked to the conidiophore formation. Furthermore fumonisin
production also seem to be collated with slightly osmolytic stress (Mogensen et al. 2009).
The role of fumonisin is still obscure. Fusaria strains producing high amounts of the toxins are found more
frequently in infected tissue (Sánchez-Rangel and Plasencia 2010) and fumonisins induces leaf lesions and
disease in maize seedlings and that severity of symptom is clearly correlated to the quantity of produced
fumonisins (Glenn et al. 2008, Sánchez-Rangel and Plasencia 2010). Even though fumonisin production is
not absolute required for strains to infect plants, the fumonisins seem to promote the infection rate
(Desjardins et al. 2007).
To systematically investigate chemical inducers of fumonisin production, a GFP-fumonisin reporter strain
was constructed. This was inspired by to the study of (Gardiner et al. 2009), conducted in Fusarium
graminearum identifying inducers of trichothecenes production. In the reporter strain, the GFP production

119
was controlled by the FUM promoter. With this strain, fumonisin production was mapped at 476 different
conditions using the Biolog nutritional profiling system, and investigated the inducing compounds and
conditions on solid media.

120
8.3 Material and methods
8.3.1 Fungal strains
A. niger ATCC 1015 was used as wild type reference strain (obtained from the IBT collection as IBT 28639).
The fumonisin reporter strain was generated from the ATCC 1015 strain. Both strains were maintained as
frozen spore suspensions at -80°C in 20% glycerol.
8.3.2 Oligonucleotide PCR primers
The oligonucleotides used for the strain construction of fumonisin reporter strain, can be found in Table 1.
Table 8.1 Primers used for construction of the vector. Lower-case letters indicate overlapping genetic elements used
for fusion PCR and bold letters represent the restriction sites.
Primer Sequence
pFum1-F_kasI ATAGTTAGGGGCGCCAGCTGGGTGACGATGGACAC
pFum1-R gtacactgcggtctatccacGGTGAGCGGGCGAGCGATA
eGFP-F gtggatagaccgcagtgtacATGGTGAGCAAGGGCGAGGA
GFP-R_hindIII CATTAACGAAGCTTTTACTTGTACAGCTCGTCCA
CHK-pFUM-F CGCCAGCCGATAGTGTCGAT
CHK-pFUM-R TTGATGCCGTTCTTCTGCTTG
S-probe_F CGACGCAGAGGATGATGATG
S-probe_R TATATCCTTAGTGGTGCCGCT
8.3.3 Vector construction
The fumonisin promoter-GFP fusion vector was constructed by PCR using primers to the FUM promoter,
pFUM1-F and pFUM1-R and to eGFP using the primers eGFP-F and eGFP-R. The PCR construct consisted of
2.0 kb of FUM promoter amplified from A. niger ATCC 1015 and eGFP from (Toews et al. 2004). Fragments
were amplified with Phusion DNA polymerase from Finnzymes (Espoo, Finland) at standard conditions with
HF-buffer. Fragments were gel purified and fused using the external primers. The PCR product was digested
with KasI and HindII, and ligated into the pAN7-1 vector, digested with the same restriction enzymes. The
vector contained the hygromycin phosphotransferase gene under the Aspergillus nidulans TrpC promoter
and terminator (Punt et al. 1987). A schematic overview of the vector construction is presented in Figure
8.1.

121
8.3.4 Transformation
DNA insertion into the A. niger genome was performed using protoplasts and standard PEG transformation.
The wild type strain was transformed with an integrative vector and the transformations were initially
verified by PCR using the primers, CHK-pFUM-F and CHK-pFUM-R.
8.3.5 Southern blotting
To examine for ectopic insertions, southern analysis was carried out. Genomic DNA, 1.5 µg, was isolated
and digested with BamHI. Sequence information for restriction digest of the target loci was obtained from
the A. niger ATCC 1015 genome sequence (Andersen et al. 2011) from the US Department of Energy Joint
Genome Institute (http://genome.jgipsf.org/Aspni1/). Blotting was done according to standard methods
(Sambrook and Russell 2001). The target locus was detected by probing with the labeled upstream target
PCR fragment, generated using the primers, s-probe-F and s-probe-R. The probes were labeled with Biotin
using the Biotin DecaLabel DNA Labeling Kit (Thermo Fisher Scientific (formerly Fermentas), Slangerup
Denmark) and visualized using the Biotin Chromogenic Detection Kit (Thermo Fisher Scientific (formerly
Fermentas), Slangerup Denmark). For a graphical representation of the gene deletion strategy, see Figure
8.1.
8.3.6 Fluorescence microscopy and imaging
Tape slides for microscopy were prepared as described by (Samson 2002). Images were captured with a
cooled Orca-ER CCD camera (Hamamatsu, Japan) mounted on a Zeiss Axioplan II microscope (Carl Zeiss,
Thornwood, NY. All images were captured at a 10-fold magnification.
8.3.7 Growth experiments
Biolog plate screening and measurements
Five sets of Phenotype Microarrays (PM) were purchased from Biolog (Hayward, CA); Two carbon arrays
(PM1 and PM2A), one nitrogen array (PM3), one combined phosphorus and sulfur array (PM4A) and an
osmolyte array (PM9). The array designs can be found at the manufacturer homepage:
http://www.biolog.com/pdf/PM1-PM10.pdf.
100 uL of FF-IF Biolog media was added to the arrays. Growth media was added supplements accordingly to
Biolog protocol “PM Procedures for Filamentous Fungi”. The inoculum was prepared from 4 day old Czapek
yeast autolysate (CYA) plates. Conidia were harvested with 0.9 %NaCl, washed twice and the concentration
was estimated using a hemocytometer. Media was inoculated to obtain a final concentration of 1000
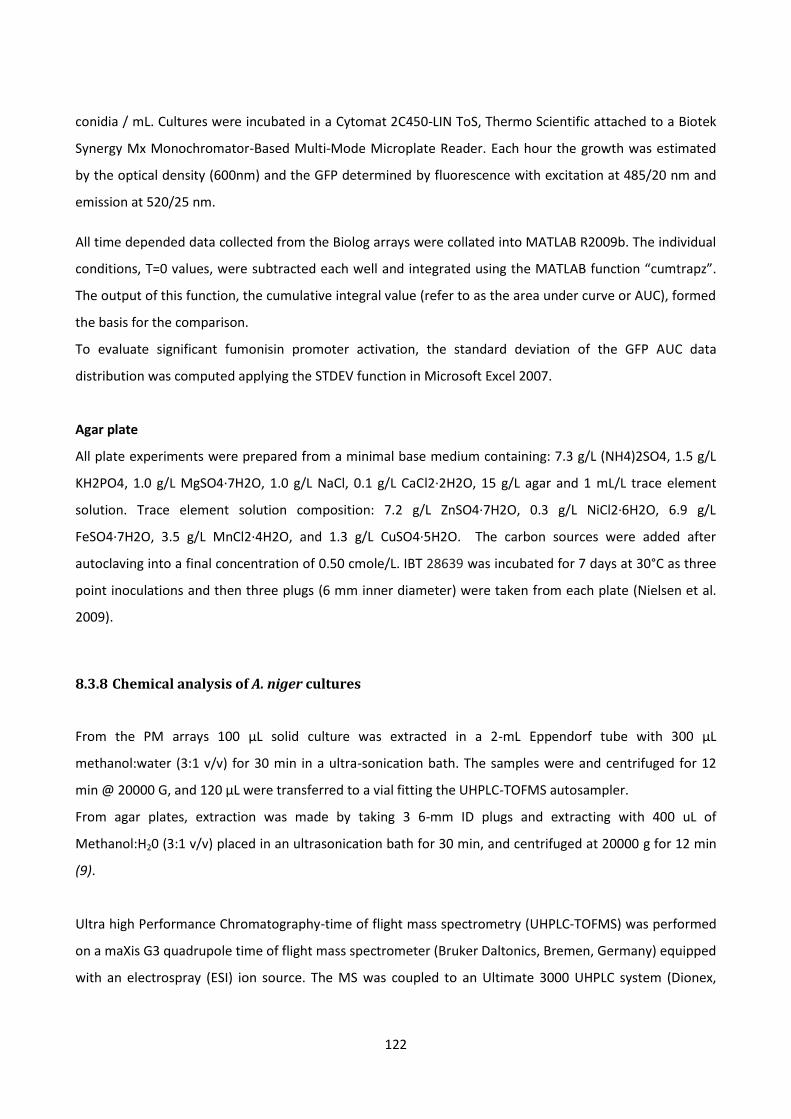
122
conidia / mL. Cultures were incubated in a Cytomat 2C450-LIN ToS, Thermo Scientific attached to a Biotek
Synergy Mx Monochromator-Based Multi-Mode Microplate Reader. Each hour the growth was estimated
by the optical density (600nm) and the GFP determined by fluorescence with excitation at 485/20 nm and
emission at 520/25 nm.
All time depended data collected from the Biolog arrays were collated into MATLAB R2009b. The individual
conditions, T=0 values, were subtracted each well and integrated using the MATLAB function “cumtrapz”.
The output of this function, the cumulative integral value (refer to as the area under curve or AUC), formed
the basis for the comparison.
To evaluate significant fumonisin promoter activation, the standard deviation of the GFP AUC data
distribution was computed applying the STDEV function in Microsoft Excel 2007.
Agar plate
All plate experiments were prepared from a minimal base medium containing: 7.3 g/L (NH4)2SO4, 1.5 g/L
KH2PO4, 1.0 g/L MgSO4·7H2O, 1.0 g/L NaCl, 0.1 g/L CaCl2·2H2O, 15 g/L agar and 1 mL/L trace element
solution. Trace element solution composition: 7.2 g/L ZnSO4·7H2O, 0.3 g/L NiCl2·6H2O, 6.9 g/L
FeSO4·7H2O, 3.5 g/L MnCl2·4H2O, and 1.3 g/L CuSO4·5H2O. The carbon sources were added after
autoclaving into a final concentration of 0.50 cmole/L. IBT 28639 was incubated for 7 days at 30°C as three
point inoculations and then three plugs (6 mm inner diameter) were taken from each plate (Nielsen et al.
2009).
8.3.8 Chemical analysis of A. niger cultures
From the PM arrays 100 µL solid culture was extracted in a 2-mL Eppendorf tube with 300 µL
methanol:water (3:1 v/v) for 30 min in a ultra-sonication bath. The samples were and centrifuged for 12
min @ 20000 G, and 120 µL were transferred to a vial fitting the UHPLC-TOFMS autosampler.
From agar plates, extraction was made by taking 3 6-mm ID plugs and extracting with 400 uL of
Methanol:H20 (3:1 v/v) placed in an ultrasonication bath for 30 min, and centrifuged at 20000 g for 12 min
(9).
Ultra high Performance Chromatography-time of flight mass spectrometry (UHPLC-TOFMS) was performed
on a maXis G3 quadrupole time of flight mass spectrometer (Bruker Daltonics, Bremen, Germany) equipped
with an electrospray (ESI) ion source. The MS was coupled to an Ultimate 3000 UHPLC system (Dionex,

123
Sunnyvale, CA). Separation of extracts (0.1 µL from PM plates and 1 µL from agar plates) was performed at
40 ºC on a 100 mm × 2.1 mm ID, 2.6 µm Kinetex C18 column (Phenomenex, Torrance, CA) using a linear
water-acetonitrile gradient (both buffered with 20 mM formic acid) at a flow of 0.4 mL/min starting from
10% acetonitrile and increased to 100% in 10 minutes, keeping this for 3 minutes. MS analyses were
performed in ESI+ using a data acquisition range of m/z 100-1000, a resolution of 40 000 FMWH and
calibrated using sodium formate automatically infused prior to each analytical run, providing a mass
accuracy of less than 1.2 ppm. Extracted ion chromatograms of the [M+H]+ ions (± m/z 0.001) for the target
compounds were constructed using the TargetAnalysis 1.2 software (Bruker Daltonics) which also was used
to verify the identity of the targets via: i) retention time ± 0.1 min, ii) isotope pattern (SigmaFit <30), and iii)
mass accuracy better than 1.2 ppm.
Fumonisins B1, B2 and B3 standards, were obtained from RomerLabs (Tulln, Austria) as certified solutions,
while fumonisins B4 and B6 were available from previous studies (Mansson et al. 2010). The limit of
detection for fumonisin B2 and B4 was <2 ng/cm2 (s/n 5).

124
8.4 Results and discussion
8.4.1 Strain construction
Ten transformants were examined for the correct insertion into the fumonisin locus using PCR. Two
confirmed transformants were selected, single conidia were isolated and Southern analysis revealed that
no etopic inserts were present, figure 8.1.
(A) (B)
Figure 8.1 (A) Graphical illustration of the vector insertion procedure into the fumonisin synthase locus and predicted
resultant genomic locus. (B) Southern analysis of wild type and the transformants for site specific integration of the
construct. Genomic DNA was digested with BamHI. The position of the probe used is shown in (A).
8.4.2 Verification of the correlation between fumonisin and GFP in reporter strain
To examining the validity of GFP based prediction obtained from the fumonisin reporter strain, 60 cultures
were selected across the plates; PM1, PM2 and PM9, and the produced fumonisins quantified using UHPLC-
TOFMS. Unfortunately the concentration of fumonisin in all samples from PM1 and PM2 were under the
UHPLC-TOFMS detection limit, due to high interference caused by polymers (presumable the gelefying
agent) from the commercial Biolog FF media thus could only 0.1 µL sample could be injected. This lead to
35 samples where fumonisin and GFP production could be compared (Figure 8.2).
FUM1
GFP
Bam
HI
(2399)
8.2 Kbp9.1 kb
Probe
WT
Tra
ns 1
22000 bp
pFUMVector
backbone
Bam
HI
(11534)
Bam
HI
(17917)
HYG
pFUM
pFUM
Bam
HI
(8617)
Bam
HI
(440)
FUM1pFUMTra
ns 2
9997 bp

125
Figure 8.2 Dose response curve from 35 exacts.
From figure 2 it could deduced that the reporter strain provide a correct estimation of the fumonisin yield,
a GFP AUC signal of 10.000 corresponding to 364.5 ng/mL.
8.4.3 Localization of fumonisin production
Tape slides investigated under fluorescence microscope showed a substantial fluorescent signal, which was
strictly centred within the vesicle of the conidiophore (Figure 8.3). The GFP signal, on tape slides from 1, 2
and 3 day old cultures revealed that the expression was initiated in the near proximity to the vesicle of the
conidiophore, for then to proceed into the vesicle. The signal centred and persisted throughout the
majority of the experiment. At third day, the GFP expression finalized, fainted from the conidiophore and
diffused into the hyphae. All three stages can be observed on figure 8.3.B
0
500
1000
1500
2000
2500
0 5000 10000 15000 20000 25000 30000 35000 40000 45000
sum
FB
2 a
nd
FB
6(n
g/m
L)
GFP AUC

126
(A) (B)
Figure 8.3 Day 2 Tape slides from the reporter strain on glucose minimal media agar supplemented 5 % (w/v) NaCl.
(A) Bright field at 10X magnification. (B) GFP signal from the same position.
8.4.3 Nutritionally profiling of fumonisin production
The results of the Biolog PM plates were used to evaluate induction of the fumonisin promoter. As cut-off
value, a three time the standard deviation of σ=716 (PM1-4) and σ=9710 (PM9) was chosen. The osmolyte
array (PM9) was evaluated individually, since the fluorescent signal as well as the optical density signal was
order of magnitudes larger, compared to the PM1-PM4 plates.
Ten carbon based compounds were found to significantly activate the fumonisin promoter. Those were,
lyxose, glucose, ribose, trehalose, threonine and alanine from the PM1 plate and arbutin,
dihydroxyacetone, 2-deoxy-D-ribose and glucosamine from the PM2 array. Surprisingly, none of the
nitrogen, phosphor or sulphur source induced the fumonisin promoter, as presented in figure 4.
Based on the data collected from the PM9 plate, a total of eleven osmolyte conditions were found to
significantly induced fumonisin. All of these were sodium lactate from a concentration of 2-12 %.
Interestingly even high concentrations of sodium lactate, did not appear to affect the growth considerably
(<11% reduction), observed by the measured optical densities all being in the range of 225-275, Figure 8.4
right.

127
Figure 8.4 Left: The effect of Carbon (PM1-2), nitrogen (PM3), phorphor and sulfur (PM4) sources on growth and
fumonisins induction. Right: The effect of osmolyte sources (PM9) on growth and fumonisin induction. The black line
indicates the threshold of significance, 99 % confidence. Complete dataset can be found in appendix 5.
Interesting, only few of the surveyed osmolytes, inhibited A. niger biomass yield (OD AUC). Those were
known fungal growth inhibitors, sodium benzoate > 20 mM and sodium nitrite > 10 mM (Clausen and Yang
2004).
From figure 8.4, most of the compounds that supports growth, fails to induce fumonisin production. This
verifies that fumonisin production is not directly coupled to growth but rather needs an initiation by
sporulation and subsequent an inductive carbon source. This proposition was further supported by
observing the fumonisin promoter activation together with growth over time (figure 8.5). The promoter
activation initiates when growth have reached end of the exponential phase.
128
Figure 8.5 Raw data of fumonisin induction and growth over time.
From figure 8.5, it is evident that fumonisin induction, for both conditions, was induced in the late
exponential phase, starting at around 42 hours. Since lacate can be metabolized by A. niger, a diauxic shift,
in the growth curve, was apparent from the condition.
Based on the screening results derived from the Biolog plates, ten conditions were selected for further
evaluation. Defined minimal media plates were produced of the conditions, from the carbon plates,
forecasted to induce fumonisin production.

129
Table 8.2 A comparison between the predicted fumonisin titer (GFP AUC) in the small scale biolog plates and the
fumonisin concentration produced on defined agar plates.
GFP AUC
(PM plates)
ng/mL
(Agar plates)
sporulation
Arbutin 6278 ± 2453 1106±203 +++
Dihydroxyacetone 4603 ± 245 345±225 +++
Lyxose 3109 0±0 -
Glucose 2750 200±18.7 +++
Ribose 2518 0±0 -
2-deoxy-D-ribose 2490 ± 1520 0±0 -
Trehalose 2465 1119±318 +++
Threonine 2455 0±0 -
Glucosamine 2432 ± 1204 10±0 ++
Alanine 2219 550±215 (+)
+++ High degree of sporulation
+ Low degree of sporulation, only few conidia present
- No sporulation visible
From table 8.2, no clear correlation was found, between the predicted fumonisin productions from the PM
plates, compared with the titers obtained in minimal media. Out of the ten assayed conditions, six of these
induced fumonisin production in A. niger. Notable was, that the remaining false positives, failed to
sporulate. This can be explained by variations in medium compositions, as trace elements and vitamins,
between the commercial PM plates and defined solid media plates. Moreover the carbon plates’ (PM1 and
PM2) nitrogen source is unknown, as well as the exact amount of compound, added into the PM plates.
Biolog only disclose the concentration range. The carbon sources in PM1 and PM2 are in the 5–50 mM
range and the nitrogen sources in PM3 are in the 2–20 mM range (Bochner et al. 2001). The results
underline the power of the Biolog nutritionally profiling system, as an efficient screenings tool; therefore,
the interpretation of the data should only be seen an indicative.
Still six conditions (Table 8.2) still gave fumonisin production, with the glycosylated hydroquinone arbutin
and the disaccharide trehalose being the strongest inducers.
130
8.4.5 Investigating fumonisin inducers
To examine the events leading to fumonisin induction in A. niger and to understand the molecular
subjacent mechanisms, further experimentation were performed on numerous defined minimal media
plates. Based on the hypothesis, that fumonisin production is initiated upon formation of conidiophores
and subsequently regulated by: i) The entry point into the central metabolism: ii) the anomeric position of
glycosidic bond in carbohydrates; iii) Biological inducers; and finally iv) Melanin inhibitors.
The first category focused on glucose and the glycolysis. Glucose and fructose formed similar quantities of
biomass (Appendix 5) yet glucose had a GFP AUC signal of 2750 where fructose had 190. Similarly lyxose
and ribose, both compounds that enter the metabolism through the pentose phosphate pathway did not
give rise to fumonisin induction. This led to the hypothesis, that glucose is a key metabolite in fumonisin
production.
The results from table 8.3 clearly support this hypothesis of glucose being a key metabolite in fumonisin
synthesis. Utilizing fructose yielded in 5 fold less fumonisin compared with utilization of glucose.
To investigate how compounds metabolised through the PP-pathway, the experiment was expanded with
plates containing ribose, xylose and lyxose, Tabel 8.3. Based on these results it appears that compounds
entering the central metabolism through the Pentose Phosphate pathway repress fumonisin production.
The second experimental series was centred on the glycosidic bonds and their stereochemistry of the
anomeric position in disaccharide. Trehalose, maltose and cellobiose are all disaccharides composed of
glucose residues but a great difference in AUC fluorescence was observed. The only chemical difference is
the glycosidic linkage. Trehalose is α(1→1), maltose is linked with an α(1→4) and cellobiose is a β(1→4).
The origin of these compounds in nature varies. Maltose originates from starch typically found in living
plants and used as an energy storage, cellobiose originates from cellulose, a structural component of the
cell wall in plants and trehalose is accumulated by a wide variety of organisms including fungal spores
where it is believed mainly to act as a carbon storage utilized doing germination (Thevelein 1984). Hence
understanding which type of glycosidic linkages induces fumonisins formation could give hints to niches
where A. niger naturally produce fumonisin.
It was evident that the orientation of the glycosidic linkage had some influence on fumonisin titers.
Particularly, trehalose resulted in a 5.5 fold increase in fumonisin titer. Trehalose titers are typically high in
fungal spores, it could therefore be speculated that a connection between induction of fumonisin, conidia
formation and trehalose metabolism exists. Fumonisin production was not affected by cellulosic

131
breakdown since growth on maltose and cellobiose generated similar amounts of fumonisin. However,
interestingly both maltose and cellobiose caused a twofold higher fumonisin titer, compared with pure
glucose.
The third category of experiments, attempted to comprehend biological inducers. From table 8.2, the
compounds confirmed to significantly induce fumonisin formation included dihydroxyacetone and alanine.
These are C3 compounds that are both able to enter the glycolysis by one enzymatic step
(dihydroxyacetone kinase and alanine aminotransferase). This supported the hypothesis suggested by
Sorensen et al. (2009), that an increased pyruvate pool increases the fumonisin production. Being a
biological inducer, lactate was also included since it can be converted into pyruvate by lactate
dehydrogenase. The biological inducers were examined in both glucose and xylose background to elucidate
induction under both repressing (xylose) and non-repressing (glucose) conditions.
The results in the third set of experiments confirmed the hypothesis that compounds entering into the
glycolysis through a single or a few number of steps induces fumonisin production. The number of
enzymatic steps required to synthesise pyruvate appears to determine the effect of induction. Comparing
glycerol that requires eight enzymatic steps with dihydroxyacetone requiring seven, it is evident that
dihydroxyacetone is a stronger inducer of fumonisin production. Likewise by observing fumonisin formation
with addition of alanine or lactate that only entail one enzymatic step, they are superior to
dihydroxyacetone.
Arbutin is a glycoside that inhibits the enzyme tyrosinase, an oxidase and the rate limiting step in
production of melanin. This makes arbutin and other tyrosinase inhibiting compounds especially interesting
since the fumonisin synthesis is localized in the same compartment as melanin production. To assess the
connection between melanin production and fumonisin, kojic acid, azelaic acid and hydroquirone all
belonging to a class of tyrosinase inhibitors (Parvez et al. 2007, Bandyopadhyay 2009) were examined.
Glucosamine have also been shown to inhibit melanin by inhibiting the activation of tyrosinase (Bissett
2006), thus also included.
The last and final set assayed compounds, all supposed to target melanin production showed great
potential. Arbutin had a great inducer potential, yielding a 10.5 fold increase in fumonisin titre but azelaic
acid was the strongest overall inducer found in this study, with fumonisin titres of 0.8-1.2 g/L yielding a
more than 64 fold increase.
Azelaic acid besides being a tyrosinase inhibitor, is also a plant hormone, part of plants systemic acquired
resistance (SAR) response (Shah 2009). SAR is an inducible defence mechanism, activated as response to a

132
Numbers of replicates are indicated with stars
local infection with a pathogen (Vlot et al. 2008). SAR results in enhanced resistance against subsequent
patogen attack. Azelaic acid primes SAR therefore we found it fascinating that this compound, applied as a
defence mechanism appears to be exploited by A. nigers fumonisin response. The results from all plate
experiments were summarized in table 8.3.
Table 8.3 Fumonisin production in minimal medium. The last column “In biolog” is the predicted fumonisin production
from the Biolog nutritional profiling experiments.
Compound Fumonisin Std In Biolog
Experiment 1 ng/mL
Glucose (****) 200 18,7 2750
Fructose (**) 36 9,9 190
Xylose (****) ND 0,0 0
Sorbitol (**) 15 1,1 0
Experiment 2
Sucrose (**) 40 15,5 82
Maltose (**) 443 185,0 710
Cellobiose (****) 269 167,3 1765
Experiment 3
Glycerol + glucose (**) 1551 157,9 N/A
Dyhydoxyacetone + glucose (***) 2004 937,4 N/A
Alanine + glucose (***) 4541 327,0 N/A
Lactate + glucose (**) 2859 966 N/A
Glycerol + xylose (**) 123 24,8 N/A
Dyhydoxyacetone + xylose (**) 783 78,9 N/A
Alanine + xylose (**) 1202 343.2 N/A
Lactate + xylose (**) 801 144,3 N/A
Experiment 4
Arbutin + glucose (****) 2104 592,0 N/A
Hydroquirone + glucose (**) 0 0,0 N/A
Kojic acid + glucose (***) 458 37,9 N/A
Glucosamine + glucose (**) 465 95,4 N/A
Azelaic acid + glucose (****) 12818 1015,4 N/A
Azelaic acid + xylose (**) 7871 424,9 N/A

133
A. niger is generally viewed as post-harvest pathogen, causing decay of fresh and dried fruits and certain
vegetables, nuts, coffee, and cereals (Varga et al. 2004, Perrone et al. 2007). Fumonisin occurrences have
been detected in most of these food items (Mogensen et al. 2010, Palencia et al. 2010, Knudsen et al.
2011). Interestingly, arbutin are found in wheat, coffee, tea, onion, corn cereal and red wine (Deisinger et
al. 1996), where azelaic acid have been found in wheat, oat and grape stones (Sun and Sun 2001, Kim et al.
2006, Verardo et al. 2011). A. niger can attack grapes even when they are still attached on the vine itself,
the presence of azelaic acid in grape stone could be an explaining for an evolved inducer response towards
degradation of grapes.
In contrary, it could be that this response was not evolved in A. niger but in Fusarium verticillioides, a plant
pathogen, and believed to be the ancestral origin of A. nigers fumonisin gene cluster (Khaldi and Wolfe
2011). F. verticillioides can initiate a SAR response during an attack (Savitch et al. 2007, Endah et al. 2008);
hence, exposure to azelaic acid would occur. It could be speculated that azelaic acid are a fumonisin
inducer in F. verticillioides, but further investigation is required to document this statement.
134
8.5 Conclusion and future perspectives
In conclusion, using a constructed reporter strain, fumonisin production was found to take place in the
conidiophores. This implies, that applying A. niger as cell factory in submerged cultivations, should not give
rise for concerns toward fumonisin formation.
Additionally we discovered a link between fumonisin production and melanin synthesis. The exact
motivation for this connection can only remain speculative; however, both compounds are polyketides
hence rely on similar intermediates.
A fascinating relationship between plants SAR response and fumonisin induction was also discovered. Since
A. niger is not generally regarded as a plant pathogen this could support the hypothesis of the fumonisin
cluster was transferred from an ancestral F. verticillioides. A diverse group of compounds have been
implicated as SAR signals and speculations of redundancies have been proposed (Dempsey and Klessig
2012). Consequently, it might be speculated that disruption of the azelaic acid pathway in plants, could
lower fumonisin production in a fungal attack.
Lastly, the fumonisin promoter’s strict conidiophore activation might be applied in metabolic engineering.
This promoter could be particular beneficial to apply for characterization of secondary metabolite clusters
since the application of this promoter would assure expression and localization in the same compartment.
Additionally the promoter is repressed by xylose and activated by glucose and fine-tuning can be
performed by addition of e.g. salts.

135
8.6 References
Andersen, M. R., M. P. Salazar, P. J. Schaap, P. J. van de Vondervoort, D. Culley, J. Thykaer, J. C. Frisvad, K. F. Nielsen, R. Albang, K. Albermann, R. M. Berka, G. H. Braus, S. A. Braus-Stromeyer, L. M. Corrochano, Z. Dai, P. W. van Dijck, G. Hofmann, L. L. Lasure, J. K. Magnuson, H. Menke, M. Meijer, S. L. Meijer, J. B. Nielsen, M. L. Nielsen, A. J. van Ooyen, H. J. Pel, L. Poulsen, R. A. Samson, H. Stam, A. Tsang, J. M. van den Brink, A. Atkins, A. Aerts, H. Shapiro, J. Pangilinan, A. Salamov, Y. Lou, E. Lindquist, S. Lucas, J. Grimwood, I. V. Grigoriev, C. P. Kubicek, D. Martinez, N. N. van Peij, J. A. Roubos, J. Nielsen and S. E. Baker (2011). "Comparative genomics of citric-acid-producing Aspergillus niger ATCC 1015 versus enzyme-producing CBS 513.88." Genome Res 21(6): 885-897.
Bandyopadhyay, D. (2009). "Topical treatment of melasma." Indian J Dermatol 54(4): 303-309.
Bissett, D. L. (2006). "Glucosamine: an ingredient with skin and other benefits." J Cosmet Dermatol 5(4): 309-315.
Clausen, C. A. and V. W. Yang (2004). "Curbing indoor mold growth with mold inhibitors." Proceedings from the Woodframe Housing Durability and Disaster Issues Conference: 303-306.
Deisinger, P. J., T. S. Hill and J. C. English (1996). "Human exposure to naturally occurring hydroquinone." J Toxicol Environ Health 47(1): 31-46.
Dempsey, D. A. and D. F. Klessig (2012). "SOS - too many signals for systemic acquired resistance?" Trends Plant Sci 17(9): 538-545.
Desjardins, A. E., M. Busman, M. Muhitch and R. H. Proctor (2007). "Complementary host–pathogen genetic analyses of the role of fumonisins in the Zea mays–Gibberella moniliformis interaction." Physiological and Molecular Plant Pathology 70(4–6): 149-160.
Endah, R., G. Beyene, A. Kiggundu, N. van den Berg, U. Schluter, K. Kunert and R. Chikwamba (2008). "Elicitor and Fusarium-induced expression of NPR1-like genes in banana." Plant Physiol Biochem 46(11): 1007-1014.
Fleissner, A. and P. Dersch (2010). "Expression and export: recombinant protein production systems for Aspergillus." Appl Microbiol Biotechnol 87(4): 1255-1270.
Frisvad, J. C., T. O. Larsen, U. Thrane, M. Meijer, J. Varga, R. A. Samson and K. F. Nielsen (2011). "Fumonisin and ochratoxin production in industrial Aspergillus niger strains." PLoS One 6(8): e23496.
Gardiner, D. M., K. Kazan and J. M. Manners (2009). "Nutrient profiling reveals potent inducers of trichothecene biosynthesis in Fusarium graminearum." Fungal Genet Biol 46(8): 604-613.

136
Glenn, A. E., N. C. Zitomer, A. M. Zimeri, L. D. Williams, R. T. Riley and R. H. Proctor (2008). "Transformation-mediated complementation of a FUM gene cluster deletion in Fusarium verticillioides restores both fumonisin production and pathogenicity on maize seedlings." Mol Plant Microbe Interact 21(1): 87-97.
Goldberg, I., J. S. Rokem and O. Pines (2006). "Organic acids: old metabolites, new themes." Journal of Chemical Technology & Biotechnology 81(10): 1601-1611.
Hofmann, G., A. Diano and J. Nielsen (2009). "Recombinant bacterial hemoglobin alters metabolism of Aspergillus niger." Metab Eng 11(1): 8-12.
Jørgensen, T. R., K. F. Nielsen, M. Arentshorst, J. Park, C. A. van den Hondel, J. C. Frisvad and A. F. Ram (2011). "Submerged conidiation and product formation of Aspergillus niger at low specific growth rates is affected in aerial developmental mutants." Applied and Environmental Microbiology.
Karaffa, L. and C. P. Kubicek (2003). "Aspergillus niger citric acid accumulation: do we understand this well working black box?" Appl Microbiol Biotechnol 61(3): 189-196.
Khaldi, N. and K. H. Wolfe (2011). "Evolutionary Origins of the Fumonisin Secondary Metabolite Gene Cluster in Fusarium verticillioides and Aspergillus niger." Int J Evol Biol 2011: 423821.
Kim, S.-Y., S.-M. Jeong, W.-P. Park, K. C. Nam, D. U. Ahn and S.-C. Lee (2006). "Effect of heating conditions of grape seeds on the antioxidant activity of grape seed extracts." Food Chemistry 97(3): 472-479.
Knudsen, P. B., J. M. Mogensen, T. O. Larsen and K. F. Nielsen (2011). "Occurrence of fumonisins B(2) and B(4) in retail raisins." J Agric Food Chem 59(2): 772-776.
Kubicek, C. P., M. Röhr and H. J. Rehm (1985). "Citric Acid Fermentation." Critical Reviews in Biotechnology 3(4): 331-373.
Mansson, M., M. L. Klejnstrup, R. K. Phipps, K. F. Nielsen, J. C. Frisvad, C. H. Gotfredsen and T. O. Larsen (2010). "Isolation and NMR characterization of fumonisin B2 and a new fumonisin B6 from Aspergillus niger." J Agric Food Chem 58(2): 949-953.
Mogensen, J. M., T. O. Larsen and K. F. Nielsen (2010). "Widespread occurrence of the mycotoxin fumonisin b(2) in wine." J Agric Food Chem 58(8): 4853-4857.
Mogensen, J. M., K. F. Nielsen, R. A. Samson, J. C. Frisvad and U. Thrane (2009). "Effect of temperature and water activity on the production of fumonisins by Aspergillus niger and different Fusarium species." BMC Microbiol 9: 281.

137
Nielsen, K. F., J. M. Mogensen, M. Johansen, T. O. Larsen and J. C. Frisvad (2009). "Review of secondary metabolites and mycotoxins from the Aspergillus niger group." Anal Bioanal Chem 395(5): 1225-1242.
Olempska-Beer, Z. S., R. I. Merker, M. D. Ditto and M. J. DiNovi (2006). "Food-processing enzymes from recombinant microorganisms--a review." Regul Toxicol Pharmacol 45(2): 144-158.
Palencia, E. R., D. M. Hinton and C. W. Bacon (2010). "The black Aspergillus species of maize and peanuts and their potential for mycotoxin production." Toxins (Basel) 2(4): 399-416.
Parvez, S., M. Kang, H. S. Chung and H. Bae (2007). "Naturally occurring tyrosinase inhibitors: mechanism and applications in skin health, cosmetics and agriculture industries." Phytother Res 21(9): 805-816.
Perrone, G., A. Susca, G. Cozzi, K. Ehrlich, J. Varga, J. C. Frisvad, M. Meijer, P. Noonim, W. Mahakarnchanakul and R. A. Samson (2007). "Biodiversity of Aspergillus species in some important agricultural products." Stud Mycol 59: 53-66.
Punt, P. J., R. P. Oliver, M. A. Dingemanse, P. H. Pouwels and C. A. van den Hondel (1987). "Transformation of Aspergillus based on the hygromycin B resistance marker from Escherichia coli." Gene 56(1): 117-124.
Sambrook, J. and D. W. Russell (2001). Molecular cloning : a laboratory manual. Cold Spring Harbor, N.Y., Cold Spring Harbor Laboratory Press, 0879695773 (paper)
0879695765 (cloth).
Samson, R. A. (2002). Introduction to food- and airborne fungi. Utrecht, Centraalbureau voor Schimmelcultures, 9070351420.
Sánchez-Rangel, D. and J. Plasencia (2010). "The role of sphinganine analog mycotoxins on the virulence of plant pathogenic fungi." Toxin Reviews 29(3-4): 73-86.
Savitch, L. V., R. Subramaniam, G. C. Allard and J. Singh (2007). "The GLK1 'regulon' encodes disease defense related proteins and confers resistance to Fusarium graminearum in Arabidopsis." Biochemical and biophysical research communications 359(2): 234-238.
Shah, J. (2009). "Plants under attack: systemic signals in defence." Curr Opin Plant Biol 12(4): 459-464.
Sorensen, L. M., R. Lametsch, M. R. Andersen, P. V. Nielsen and J. C. Frisvad (2009). "Proteome analysis of Aspergillus niger: lactate added in starch-containing medium can increase production of the mycotoxin fumonisin B2 by modifying acetyl-CoA metabolism." BMC Microbiol 9: 255.

138
Sun, R. C. and X. F. Sun (2001). "Identification and quantitation of lipophilic extractives from wheat straw." Industrial Crops and Products 14(1): 51-64.
Thevelein, J. M. (1984). "Regulation of trehalose mobilization in fungi." Microbiol Rev 48(1): 42-59.
Toews, M. W., J. Warmbold, S. Konzack, P. Rischitor, D. Veith, K. Vienken, C. Vinuesa, H. Wei and R. Fischer (2004). "Establishment of mRFP1 as a fluorescent marker in Aspergillus nidulans and construction of expression vectors for high-throughput protein tagging using recombination in vitro (GATEWAY)." Curr Genet 45(6): 383-389.
Varga, J., Á. Juhász, F. Kevei and Z. Kozakiewicz (2004). "Molecular Diversity of Agriculturally Important <i>Aspergillus</i> Species." European Journal of Plant Pathology 110(5): 627-640.
Verardo, V., C. Serea, R. Segal and M. F. Caboni (2011). "Free and bound minor polar compounds in oats: Different extraction methods and analytical determinations." Journal of Cereal Science 54(2): 211-217.
Vlot, A. C., D. F. Klessig and S. W. Park (2008). "Systemic acquired resistance: the elusive signal(s)." Curr Opin Plant Biol 11(4): 436-442.

139
Chapter 9 Conclusion
”All things are difficult before they are easy.”
- Dr. Thomas Fuller
The focus of this thesis has been to study A. niger in the different industrial aspects of where this fungus is
applied. From in depth examinations of citrate and oxalate overflow metabolisms, to characterization of
protease secretion mutants and nutritional investigation of the fumonisin biosynthesis, a wide range of
topics have been covered. Some of the main contributions in this thesis include; the tool of transcription
factor modulation, how to select the targets and the novel mutants obtained using this method. The idea of
TF modulation were developed and tested only in A. niger; yet, the scope of this metabolic engineering
method, is not limited to this species but may aid improving other eukaryote cell factories.
All the individual studies present interesting findings. The examination of the citrate overflow metabolism
using a systems biology approach revealed, among other novel findings that the gluconeogenesis was
significantly down regulated, during citrate overflow metabolism. Similarly, the study of oxalic acid
overproducer mutant, ΔoafA, exposed that down regulation of the phosphoketolase pathway in A. niger
caused evaluated oxalate formation.
A new protease deficient strain, ΔprtB, a candidate for heterologous protein production, was also
presented. The strain was compared to the previously described ΔprtT protease mutant. The study
demonstrated some of the difficulties in altering regulatory networks. Indeed the ΔprtT strain had the
lowest protease activity (fivefold reduced) but at the expense of excessive CO2 yield, reduced growth rate
and lower biomass yields. Contrary, the ΔprtB had a close to twofold reduced levels of secreted proteases
but combined with additional beneficial characteristics, as a lower oxalic acid formation and wild type
growth performance; this strain could be an attractive alternative to ΔprtT.
The relatively new awareness concerning fumonisins from A. niger, was studied using a constructed
reporter strain combined with large-scale nutrient profiling. The obtained data formed basis for the
subsequent examinations, which resulted in the identification of azelaic acid, a plant hormone and a very
potent fumonisin inducer. Plants use this compound as a signal for pathogen attacks (SAR) and that A. niger
may have evolved such response, is remarkable. However, the perspective is far greater than just the

140
knowledge of this inducer. Redundancies have been proposed in the plants SAR response; hence, the
possibility of disrupting the azelaic acid the biosynthesis pathway in the plants, perhaps reduces the
fumonisin formation in infected plants.
The work in this thesis has generated new tools, strains, knowledge and fresh hypothesis, than can be
applied to improve A. niger as a cell factory, presently and in the future.
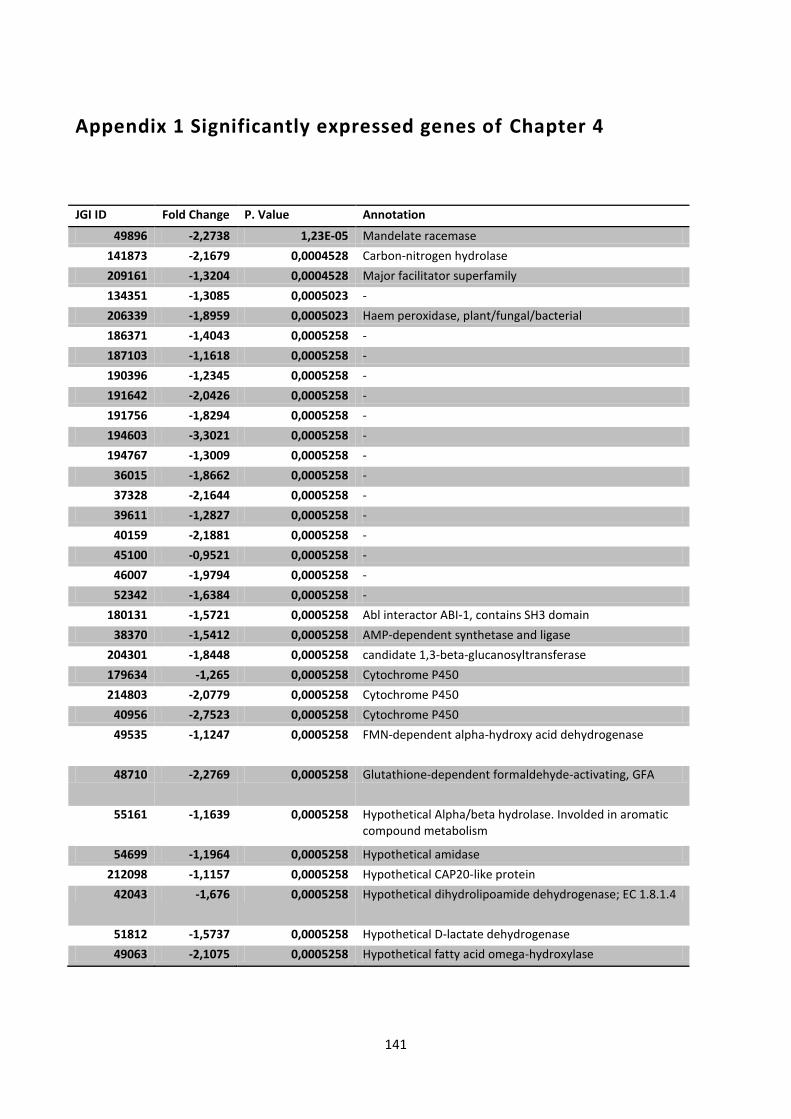
141
Appendix 1 Significantly expressed genes of Chapter 4
JGI ID Fold Change P. Value Annotation
49896 -2,2738 1,23E-05 Mandelate racemase
141873 -2,1679 0,0004528 Carbon-nitrogen hydrolase
209161 -1,3204 0,0004528 Major facilitator superfamily
134351 -1,3085 0,0005023 -
206339 -1,8959 0,0005023 Haem peroxidase, plant/fungal/bacterial
186371 -1,4043 0,0005258 -
187103 -1,1618 0,0005258 -
190396 -1,2345 0,0005258 -
191642 -2,0426 0,0005258 -
191756 -1,8294 0,0005258 -
194603 -3,3021 0,0005258 -
194767 -1,3009 0,0005258 -
36015 -1,8662 0,0005258 -
37328 -2,1644 0,0005258 -
39611 -1,2827 0,0005258 -
40159 -2,1881 0,0005258 -
45100 -0,9521 0,0005258 -
46007 -1,9794 0,0005258 -
52342 -1,6384 0,0005258 -
180131 -1,5721 0,0005258 Abl interactor ABI-1, contains SH3 domain
38370 -1,5412 0,0005258 AMP-dependent synthetase and ligase
204301 -1,8448 0,0005258 candidate 1,3-beta-glucanosyltransferase
179634 -1,265 0,0005258 Cytochrome P450
214803 -2,0779 0,0005258 Cytochrome P450
40956 -2,7523 0,0005258 Cytochrome P450
49535 -1,1247 0,0005258 FMN-dependent alpha-hydroxy acid dehydrogenase
48710 -2,2769 0,0005258 Glutathione-dependent formaldehyde-activating, GFA
55161 -1,1639 0,0005258 Hypothetical Alpha/beta hydrolase. Involded in aromatic compound metabolism
54699 -1,1964 0,0005258 Hypothetical amidase
212098 -1,1157 0,0005258 Hypothetical CAP20-like protein
42043 -1,676 0,0005258 Hypothetical dihydrolipoamide dehydrogenase; EC 1.8.1.4
51812 -1,5737 0,0005258 Hypothetical D-lactate dehydrogenase
49063 -2,1075 0,0005258 Hypothetical fatty acid omega-hydroxylase

142
50817 -1,5947 0,0005258 Hypothetical hexokinase; EC 2.7.1.1; phosphorylation of glucose and fructose
41753 -2,4577 0,0005258 Hypothetical protein. Contains 6 predicted transmembrane domains
212718 -1,5918 0,0005258 Hypothetical protein. PFam suggests Oligopeptide transporter activity. 12 transmembrane domains are predicted
214017 -1,6325 0,0005258 MEKK and related serine/threonine protein kinases
35714 -1,328 0,0005258 N-acetyltransferase activity
52038 -1,3149 0,0005258 related to D-amino acid oxidase of Fusarium solani
55835 -1,3368 0,0005258 related to voltage-gated calcium channel
211983 -1,5472 0,0005258 Serine/threonine protein kinase
121906 -0,9025 0,0005258 Vacuolar sorting protein VPS36
122060 -1,3104 0,0005258 #N/A
126829 -2,1122 0,0005258 #N/A
40951 -1,2123 0,0005258 #N/A
45304 -1,7834 0,0005459 related to alpha-amylase; glycoside hydrolase, family 13
54445 -1,6839 0,0005459 #N/A
184284 -1,2597 0,0005478 Serine/threonine protein kinase
120939 -1,5389 0,0005538 -
174977 -0,9377 0,0005538 -
201412 -1,6615 0,0005538 -
43220 -1,1217 0,0005538 -
53243 -1,7266 0,0005538 -
53909 -1,5427 0,0005538 -
191914 -1,0781 0,0005538 Acyl-CoA dehydrogenase,
209231 -1,1709 0,0005538 Aldo/keto reductase
201415 -1,0926 0,0005538 beta-1,6-N-acetylglucosaminyltransferase, contains WSC domain
47739 -0,9718 0,0005538 Cell cycle-associated protein Mob1-1
185495 -1,3727 0,0005538 endoribonuclease
185082 -1,3925 0,0005538 Fungal transcriptional regulatory protein
200314 -1,4248 0,0005538 Glutathione S-transferase
135787 -1,2168 0,0005538 hypothetical lipolytic enzyme
174348 -1,3166 0,0005538 Hypothetical protein with an ubiquitin-activating enzyme repeat
54451 -1,3395 0,0005538 Hypothetical. Interpro: UTP-glucose-1-phosphate uridylyltransferase
183237 -2,1252 0,0005538 Hypothetical. Major facilitator superfamily, Monocarboxylate transporter
188030 -1,3059 0,0005538 Major facilitator superfamily
206955 -1,1139 0,0005538 Transthyretin and related proteins
45622 -1,1408 0,0005598 -

143
45623 -1,6772 0,0005598 -
173936 -1,4331 0,0005613 -
36674 -2,9398 0,0005613 -
207936 -1,0336 0,0005613 D-isomer specific 2-hydroxyacid dehydrogenase
40935 -0,7948 0,0005613 hypothetical prolyl aminopeptidase
43044 -1,4679 0,0005613 Hypothetical protein. Is very likely associated with degradation of aromatic compounds based on Pfam and protein similarity
174831 -1,0402 0,0005613 Ribonuclease T2
44755 -1,5914 0,0005743 -
183926 -1,6416 0,0005743 hypothetical class II aldolase/adducin domain protein
210508 -1,0572 0,0005743 Hypothetical L-kynurenine hydrolase
51134 -2,1155 0,0005743 putative transmembrane GH family 47 mannosyl-oligosaccharide 1,2-alpha-mannosidase
204464 -1,7988 0,0005841 Hypothetical protein. Contains a putative BAR domain.
38352 -1,8385 0,0005863 -
46081 -2,372 0,0005863 -
176911 -1,0412 0,0005898 -
37965 -0,9469 0,0005898 -
40551 -1,2142 0,0005898 -
52903 -1,2628 0,0005898 -
56923 -1,9051 0,0005898 -
133702 -1,267 0,0005898 Esterase/lipase/thioesterase
42613 -1,757 0,0005898 Esterase/lipase/thioesterase
57197 -1,502 0,0005898 Glutathione-dependent formaldehyde-activating, GFA
194170 -1,4533 0,0005898 Hypothetical flavoprotein monooxygenase. HMMPfam indicates acitivity towards hydroxylation of aromatic rings.
43537 -1,5168 0,0005898 hypothetical protein; Interpro desc: Peptidase M24 & Histone H4
35566 -1,847 0,0005898 Short-chain dehydrogenase/reductase
42211 -1,3018 0,0005898 #N/A
174284 -1,8772 0,0006091 -
196241 -1,1602 0,0006091 -
44921 -2,1521 0,0006091 -
54952 -0,7546 0,0006091 -
188462 -1,0104 0,0006091 Acyltransferase
195962 -1,1283 0,0006091 Amino acid transporters
193010 -2,2165 0,0006091 Ferric reductase-like transmembrane component
45434 -1,6506 0,0006091 Glycerol kinase (glcA).
40917 -2,3718 0,0006091 Predicted mechanosensitive ion channel

144
205706 -1,2941 0,0006091 Protein kinase
46465 -1,1933 0,0006091 Taurine catabolism dioxygenase
48103 -1,2175 0,0006091 WD40 repeat-containing protein
207853 -1,6681 0,0006146 Predicted dehydrogenase
56498 -1,0454 0,0006239 Isoflavone reductase
54141 -1,2079 0,0006296 Ankyrin
54896 -1,5023 0,0006392 -
52941 -1,0946 0,0006546 -
170261 -1,8713 0,0006546 Permease of the major facilitator superfamily
55640 -0,9085 0,0006613 #N/A
170355 -0,9255 0,0006677 -
174765 -0,8971 0,0006677 -
189793 -2,279 0,0006677 -
193892 -1,3985 0,0006677 -
208209 -1,1453 0,0006677 -
208583 -1,7478 0,0006677 -
212116 -1,2989 0,0006677 -
212997 -1,6972 0,0006677 -
49515 -1,3363 0,0006677 -
54373 -1,1354 0,0006677 -
55190 -1,7319 0,0006677 -
57315 -2,2728 0,0006677 -
46065 -2,2902 0,0006677 (xghA) endo-xylogalacturonase A
205909 -1,0286 0,0006677 ABC transporter associated with fumonisin-like biosyntehetic gene cluster
38000 -1,3481 0,0006677 Acetoacetyl-CoA synthase
41388 -1,1411 0,0006677 Actin regulatory proteins
187366 -1,6851 0,0006677 AMP-binding enzyme
55052 -1,0004 0,0006677 Fungal specific transcription factor
134540 -1,4823 0,0006677 Fungal transcriptional regulatory protein, N-terminal
210306 -2,0791 0,0006677 Hypothetical aspartic protease
214353 -1,8502 0,0006677 Nucleolar GTPase/ATPase p130
55671 -2,1914 0,0006677 Oxoprolinase
120873 -0,8724 0,0006677 Sec1-like protein
214360 -1,4719 0,0006677 Xanthine dehydrogenase
177954 -2,3293 0,0006677 #N/A
120104 -1,5027 0,0006723 candidate beta-N-acetylglucosaminidase
134658 -0,9025 0,0006723 Hypothetical 3-methyladenine DNA glycosidase
40218 -2,8797 0,0006723 hypothetical aspartic protease
187510 -1,3224 0,0006723 hypothetical O-methylsterigmatocystin oxidoreductase (OMST oxidoreductase) (Cytochrome P450 64) [Aspergillus flavus]
51857 -0,8321 0,0006921 -

145
52306 -1,5947 0,0006949 -
210988 -2,4544 0,0006949 candidate cell wall protein
35964 -1,7483 0,0006949 Chitin synthase
121560 -0,9943 0,0006991 Hypothetical ribonuclease CAF1
202949 -2,7102 0,0007127 Hypothetical. Has similarity to beta-1,6-N-acetylglucosaminyltransferase (KOG), contains WSC domain
209195 -0,8623 0,0007127 Peptidase
211015 -0,9873 0,0007324 #N/A
45408 -1,268 0,000737 -
214825 -2,3878 0,000737 Glycosyl transferase, group 1
210522 -1,0094 0,0007381 -
205471 -1,5067 0,0007413 putative Xaa-Pro dipeptidase
57436 -1,8213 0,0007416 xynA, xylanase A. extracellular GH family 11 endo-1,4-beta-xylanase
134561 -0,8354 0,0007458 -
203625 -1,4444 0,0007458 -
142717 -1,3179 0,0007458 Carbohydrate kinase
181179 -2,0516 0,0007458 Catechol dioxygenase, N-terminal
183355 -1,9061 0,0007458 Histidine acid phosphatase
120372 -0,9729 0,0007458 Phosphoinositide-specific phospholipase C (PLC)
52590 -1,156 0,0007458 putative alpha-1,3-glucanase, family 71
127307 -1,6725 0,0007458 #N/A
214611 -1,512 0,0007576 candidate multidrug resistance ABC transporter
197631 -1,0749 0,0007605 -
45270 -0,7174 0,0007605 -
55763 -1,0291 0,0007605 (manA) Mannose-6-phosphate isomerase (EC 5.3.1.8)
53523 -1,1693 0,0007605 Dihydroxy-acid and 6-phosphogluconate dehydratase
54585 -1,3733 0,0007605 DSBA oxidoreductase
211163 -1,8673 0,0007605 endo-rhamnogalacturonase
48268 -0,9551 0,0007605 Hypothetical aminotransferase. FPrintScan queries indicates aromatic amino acid activity
43594 -2,1947 0,0007605 Hypothetical. SignalP suggests secreted
44637 -1,0398 0,0007677 Hypothetical translation initiation factor
40101 -1,6912 0,0007678 -
54298 -1,2192 0,0007678 hypothetical. Heterogeneous nuclear ribonucleoproteins A2/B1
204737 -1,0663 0,0007696 -
37057 -1,5294 0,0007844 Arginase/agmatinase/formiminoglutamase
55598 -0,9759 0,0007957 -
203198 -1,5666 0,0007957 (xdhA) D-xylulose reductase
207411 -1,3331 0,0007957 Peptidase

146
55432 -1,3381 0,0008125 -
57089 -1,3511 0,0008125 DNA-binding SAP
55324 -1,324 0,0008125 putative extracellular tyrosinase
199857 -1,1331 0,0008228 -
171269 -2,6832 0,0008368 candidate xylanase
56327 -2,0744 0,0008466 Ubiquitin-conjugating enzyme
51412 -0,9438 0,000863 -
35944 -0,8503 0,0008637 hypothetical nitrilase-like protein
200640 -1,6864 0,0008667 -
38703 -1,2963 0,0008745 hypothetical carboxylesterase
54140 -0,9911 0,0008745 Hypothetical myosin assembly protein/sexual cycle protein in A. niger
180923 -1,2107 0,0008745 Major facilitator superfamily
48684 -1,5909 0,0008755 (mscA) 2-methylcitrate synthase (citrate synthase family)
198321 -0,8564 0,0008755 Aldehyde dehydrogenase
211779 -0,9867 0,0008755 Fungal specific transcription factor
175896 -1,6995 0,0008755 Glucose-6-phosphate/phosphate and phosphoenolpyruvate/phosphate antiporter
37760 -2,8048 0,000881 -
175987 -1,6368 0,000881 Carbon-nitrogen hydrolase
185000 -1,9208 0,000881 Cytochrome P450
55136 -2,2117 0,000881 Glycosyl hydrolase family 62
49553 -1,2804 0,000881 Hypothetical acetyltransferase
48646 -0,9266 0,000881 Hypothetical enoyl-CoA hydratase (EC 4.2.1.17)
126535 -2,6674 0,000881 hypothetical protein
46787 -1,0833 0,000881 Short-chain dehydrogenase/reductase
204476 -1,34 0,000881 Zinc-containing alcohol dehydrogenase
214624 -0,7742 0,0008843 Glycosyl transferase, family 8
49420 -2,0071 0,0008908 -
37856 -0,9365 0,0008908 Alkyl hydroperoxide reductase/peroxiredoxin
126891 -0,7979 0,0008908 Molybdopterin cofactor biosynthesis protein
185262 -1,1505 0,0008908 Zinc-containing alcohol dehydrogenase superfamily
188214 -1,1119 0,000903 -
197593 -1,4306 0,0009033 -
126405 -0,9571 0,0009042 Transcription factor
51633 -1,8089 0,0009058 (bioA) Biotin synthase
41385 -1,182 0,0009058 Major facilitator superfamily
42164 -0,9674 0,0009058 Oxidoreductase, N-terminal
184541 -0,9227 0,0009338 -
50757 -1,7114 0,0009341 -
52938 -0,8728 0,0009365 Esterase/lipase/thioesterase
37923 -0,7586 0,0009439 -

147
214517 -1,0499 0,0009439 Hypothetical COP9 signalosome subunit
52525 -0,7269 0,0009528 Aminotransferase, class-II
139271 -2,1402 0,000963 -
39731 -0,8148 0,000963 -
121695 -1,5902 0,000963 AMP-dependent synthetase and ligase
210238 -1,6798 0,000963 #N/A
196874 -2,8261 0,0009638 Aldehyde dehydrogenase
52415 -1,7034 0,0009638 Glycoside hydrolase, family 38
213572 -1,1929 0,0009638 Hypothetical. Related to cell surface antigen spherulin
208272 -0,9055 0,0009638 Ubiquitin-like protein
53099 -1,3077 0,0009648 -
210547 -1,0541 0,0009648 Haloacid dehalogenase-like hydrolase
127436 -0,9538 0,0009692 Carbohydrate kinase
44666 -1,3382 0,0009707 -
186422 -1,4165 0,0009707 Sterol O-acyltransferase/Diacylglycerol O-acyltransferase
205986 -1,1794 0,0009796 -
214549 -1,2265 0,0009852 -
38275 -0,8727 0,0009927 related to 3-ketoacyl-CoA thiolase
212771 -1,3432 0,0009927 Zinc-binding oxidoreductase
134132 -0,9123 0,0009929 Peptidase M20
36861 -1,3906 0,0009995 hypothetical extracellular protein
189206 -1,1963 0,001012 -
36816 -0,9671 0,0010278 AMP-dependent synthetase and ligase
40862 -1,9291 0,0010278 hypothetical protein
180846 -0,9225 0,0010303 beta-1,6-N-acetylglucosaminyltransferase, contains WSC domain
179532 -1,5779 0,0010303 Hypothetical GCN5-related N-acetyltransferase
175292 -2,0387 0,0010312 -
212087 -0,9912 0,0010312 -
52472 -0,8548 0,0010312 -
55759 -1,1393 0,0010312 -
40634 -1,2894 0,0010312 BTB/POZ domain
56950 1,5086 0,0010312 Candidate Lysophospholipase precursor (Phospholipase B)
35778 -1,0005 0,0010312 Hypothetical long chain fatty alcohol oxidase
46311 -0,7374 0,0010317 Members of tubulin/FtsZ family
51056 -0,7424 0,0010362 Hypothetical N-(5'-phospho-D-ribosylformimino)-5-amino-1-(5''-phosphoribosyl)-4- imidazole carboxamide isomerase. (EC 5.3.1.16)
200638 -0,9129 0,0010362 #N/A
208611 -1,3384 0,0010425 -
128861 -1,231 0,0010425 Acyl-CoA dehydrogenase

148
56628 -2,1847 0,0010425 Dak kinase
214526 -2,0323 0,0010425 hypothetical protein containing Zn-finger, C2H2 type domain
183088 -1,9869 0,0010425 hypothetical xylanase
193695 -0,8286 0,0010425 O-methyltransferase
55964 -1,6517 0,0010425 Related to alcohol dehydrogenase
177406 -0,9579 0,0010425 #N/A
54806 -0,7198 0,0010445 -
123304 -0,8494 0,0010445 Amino acid/polyamine transporter
55680 -1,9432 0,0010445 Coenzyme A transferase
38912 -1,4411 0,0010445 Hypothetical amidase (EC 3.5.1.4)
214837 -0,8004 0,0010445 Hypothetical GABA permease/amino acid permease
52743 -1,1006 0,0010445 hypothetical GPI anchor protein
190043 -0,7676 0,0010445 hypothetical protein with esterase/lipase/thioesterase and membrane anchor motifs
210783 -1,5813 0,0010445 Hypothetical. Probable peroxisomal membrane. Interpro suggests alkylhydroperoxide reductase
46889 -0,9512 0,0010445 Inositol monophosphatase
135360 -0,8698 0,0010445 Lipid phosphate phosphatase and related enzymes of the PAP2 family
55790 -0,8447 0,0010445 putative allergen produced in response to stress or pathogen infection
193197 -1,0691 0,0010445 Splicing coactivator SRm160/300, subunit SRm300
52501 -0,8349 0,0010445 Zinc-containing alcohol dehydrogenase
121852 -2,3369 0,0010445 #N/A
134644 -0,8137 0,0010445 #N/A
38152 -3,1678 0,0010474 -
182373 -1,1145 0,0010517 Thioesterase superfamily
190884 -1,1579 0,0010523 Cys/Met metabolism pyridoxal-phosphate-dependent enzymes
54579 -1,0838 0,0010523 Hypothetical myristoyl-CoA:protein N-myristoyltransferase
170718 -1,0656 0,0010523 Hypothetical protein with calcium-binding EF-hand domain
55526 -0,8537 0,0010523 #N/A
38830 -0,6616 0,0010602 -
127247 -0,9511 0,0010602 COP9 signalosome, subunit
210944 -1,0082 0,0010602 Cytochrome P450
122511 -1,109 0,0010602 Major facilitator superfamily
213261 -1,0595 0,0010675 Hypothetical aspartic protease
46947 -0,8161 0,0010762 Hypothetical acetyl-CoA acetyltransferase
199512 -1,135 0,0010762 Hypothetical proteasome component

149
213377 -0,8088 0,0010784 -
38203 -0,7713 0,0010784 -
38023 -2,2271 0,0010784 hypothetical Sulfite oxidase, molybdopterin-binding component
118704 -1,1689 0,0010813 Predicted GYF domain protein
212379 -1,4192 0,0010813 putative transmembrane GH family 18 endo-chitinase
185582 -2,0677 0,0010887 putative carboxylesterase, type B
54812 -1,9688 0,0010887 putative extracellular protein
183653 -1,1953 0,0011043 -
48257 -1,3418 0,0011048 #N/A
171196 -1,0228 0,0011079 -
212884 -0,75 0,0011154 -
205927 -0,9492 0,0011181 -
55204 -1,7561 0,0011181 agsA, one of five alpha-1,3-glucan synthases
53103 -0,9029 0,0011181 hypothetical protein containing Zn-finger, C2H2 type domain
128447 -0,8983 0,001119 -
40429 -0,8115 0,001119 Mpv17 / PMP22 family
46416 -1,1938 0,001119 Predicted heme/steroid binding protein
52603 -0,809 0,001119 related to carboxypeptidase Y
126473 -1,6879 0,0011214 -
209587 -1,8901 0,0011214 GMC oxidoreductase
174539 -1,0132 0,001133 -
54649 -1,0051 0,001133 Hypothetical dehydroquinase
213492 -1,0634 0,0011334 Glycosyltransferase, family 2
186833 -0,7479 0,0011334 UBA/THIF-type NAD/FAD binding fold
41014 -0,8976 0,0011392 Oxidoreductase family
209628 -1,4219 0,0011421 Hypothetical methyltransferase
52239 -1,1838 0,0011421 #N/A
50787 -0,7294 0,001147 -
55651 -0,7253 0,001147 #N/A
52071 -3,0449 0,001149 Endo-1,4-beta-xylanase II precursor (Xylanase II) (1,4-beta-D-xylan xylanohydrolase II)
37199 -2,2503 0,00115 -
207773 -0,9747 0,0011524 -
185751 -0,8061 0,0011524 hypothetical lysophospholipase
44329 -0,7443 0,0011617 Amino acid/polyamine transporter I
187222 -0,9971 0,0011617 PpiC-type peptidyl-prolyl cis-trans isomerase
51019 -0,7423 0,0011617 putative GTP binding protein
185306 -0,8447 0,0011617 Short-chain dehydrogenase/reductase
39658 -1,2677 0,0011637 AMP-dependent synthetase and ligase
125883 -1,7205 0,0011673 -
43031 -1,0257 0,0011673 -

150
143657 -1,0804 0,0011679 Hypothetical Zn-finger protein
49344 -1,1792 0,0011733 putative GH family 76 endo-1,6-alpha-mannanase
211089 -0,8655 0,0011733 #N/A
122658 -0,7748 0,0011872 -
184665 -1,1404 0,0011872 -
55091 -0,8396 0,0011872 -
198750 -0,6828 0,0011872 Ammonium transporter
190765 -0,7479 0,0011872 Fungal transcriptional regulatory protein
188160 -1,3688 0,0011888 -
54742 -0,9543 0,0011888 -
210419 -1,2685 0,0011914 -
45030 -2,4798 0,0011914 -
213321 -1,1534 0,0011914 Hypothetical ras1 guanine nucleotide exchange factor
184789 -1,527 0,0011914 Iron/ascorbate family oxidoreductases
54041 -1,1709 0,0011914 Tubulin binding cofactor A
205702 -1,0261 0,0011914 voltage-gated potassium channel activity
132771 -0,8147 0,0012115 Seems to be two joined proteins, a heat shock protein-like N-terminal and a phosphomannomutase
204445 -0,8786 0,0012127 Protein kinase
41667 -0,6667 0,001213 -
46666 -1,1101 0,001213 Pyridoxal/pyridoxine/pyridoxamine kinase
53191 -0,8121 0,0012165 -
207694 -0,7483 0,0012233 -
127124 -1,0449 0,001226 -
51913 -0,681 0,0012306 Putative IreA
41890 -0,9643 0,0012306 Ras-related small GTPase
206238 -0,6475 0,00124 Na+/dicarboxylate
124352 -0,7416 0,0012431 -
45070 -0,7184 0,0012431 -
45993 -1,1871 0,0012431 -
175174 -0,7703 0,0012431 Ctr copper transporter family
47116 -1,2802 0,0012431 Peptidase M14
185392 -1,0889 0,0012431 #N/A
207710 -1,1336 0,0012576 MAP kinase
185961 -1,0582 0,0012589 Hypothetical maltose acetyltransferase. Homology to Bacillus sp. maltose transacetylase
49836 -0,7133 0,0012601 TAP42-like protein
213067 -1,1526 0,0012837 SMP30-like protein
188878 -0,7291 0,0012858 Flavin-containing monooxygenase
56643 -1,3435 0,0012858 Major facilitator superfamily, putative lactose permease
130008 -0,9053 0,0012874 (apsB) aminopeptidase B

151
54651 -1,4119 0,0012874 hypothetical 3-ketoacyl-CoA-thiolase
53233 -1,7966 0,0012874 hypothetical short chain dehydrogenase
188125 -0,6143 0,001292 -
200086 -0,8374 0,001292 -
38188 -0,9042 0,001292 N-methyltransferase
54436 -0,7246 0,001292 Splicing coactivator SRm160
48145 -1,0007 0,0012985 #N/A
55143 -1,8783 0,0013172 Hypothetical protein.
212837 -0,8501 0,0013172 UTP--glucose-1-phosphate uridylyltransferase
40505 -0,809 0,0013196 -
181551 -1,0847 0,0013196 GPCR, family 2, secretin-like
46990 -1,6266 0,0013471 -
50851 -0,738 0,0013497 Putative prenyltransferase/squalene oxidase
55582 -0,7395 0,0013598 Arginase family
210481 -1,6074 0,0013598 Predicted dehydrogenase
42171 -1,256 0,0013634 Hypothetical isocitrate lyase and phosphorylmutase
212451 -1,1009 0,0013634 Hypothetical NADH pyrophosphatase I of the Nudix family of hydrolases
44097 -2,0441 0,0013634 #N/A
213815 -1,3882 0,0013659 Cytoskeletal protein A
36666 -0,8369 0,0013659 Fungal specific transcription factor
37636 -0,7722 0,0013659 Uracil-DNA glycosylase
36119 -0,6979 0,0013716 -
46133 -0,687 0,0013731 -
43857 -0,8869 0,0013737 Amino acid permease
53150 -3,1593 0,0013846 -
56536 -0,836 0,0013846 -
41983 -1,431 0,0013889 Amidohydrolase 2
189390 -1,1549 0,0013889 Candidate Alanyl-tRNA synthetase
56788 -1,2026 0,0013889 hypothetical protease that contains peptidase M28 domain
50236 -1,0378 0,0013947 Hypothetical Esterase/lipase/thioesterase
177847 -1,114 0,0014009 ABC transporter
52023 -0,9515 0,0014087 Adenylosuccinate lyase
54083 -0,9171 0,0014131 Hypothetical. Related to GCN5-related N-acetyltransferase
52371 -0,7799 0,0014256 hypothetical. Glycolipid transfer protein ?
56846 0,9928 0,0014267 -
190311 -1,4121 0,0014273 2-nitropropane dioxygenase
122069 -0,6589 0,0014273 hypothetical alpha-amylase
209410 -1,1555 0,0014345 -
130550 -1,1176 0,0014364 Serine/threonine protein kinase

152
181655 -0,6401 0,0014445 Shares amino acid sequence identity with S. cerevisiae DOM34 gene product, a probable RNA-binding protein that functions in protein translation to promote G1 progression and differentiation, required for meiotic cell division.
130814 1,6387 0,0014508 -
53175 -0,8617 0,0014508 beta-1,6-N-acetylglucosaminyltransferase, contains WSC domain
182309 -1,2846 0,0014508 Glycoside hydrolase, family 3
176411 -0,9718 0,0014508 Haloacid dehalogenase-like hydrolase
210182 -1,0294 0,0014685 -
187023 -0,7264 0,0014685 Fungal specific transcription factor
127698 -2,3084 0,0015022 -
191925 -0,784 0,0015022 #N/A
171648 -0,8914 0,0015025 -
137631 -0,9224 0,0015064 -
57037 -2,6246 0,0015064 -
136397 -0,7782 0,001524 -
207626 -1,3955 0,0015395 -
43941 -0,6203 0,00154 Haloacid dehalogenase/epoxide hydrolase
45131 -0,7959 0,00154 Hypothetical aldehyde dehydrogenase (EC 1.2.1.3).
52238 -1,1206 0,00154 Hypothetical Aromatic aminotransferase, expression is regulated by general control of amino acid biosynthesis, EC 2.6.1.57
54671 -1,0711 0,0015437 Choline phosphate cytidylyltransferase/Predicted CDP-ethanolamine synthase
48067 -1,2344 0,0015437 Hydroxyindole-O-methyltransferase and related SAM-dependent methyltransferases
39194 -0,8269 0,001547 Hypothetical protein kinase
53357 -1,2222 0,001547 Related to aldehyde dehydrogenase (EC 1.2.1.3). Sequence similarity to ALD2 of C. albicans
46346 -1,1274 0,001547 #N/A
185667 -0,8399 0,0015534 -
197060 -0,9524 0,0015547 Chitin synthase/hyaluronan synthase
129924 -1,4226 0,0015595 -
184622 -0,903 0,0015595 -
53140 -1,4456 0,0015595 FMN-dependent dehydrogenase
43347 -1,1982 0,0015595 Hypothetical Cytochrome P450 monooxygenase
179933 -1,2893 0,0015719 #N/A
135973 -1,005 0,001574 #N/A
35594 -0,8095 0,001574 #N/A
184233 1,6902 0,0015946 Amino acid/polyamine transporter
56583 -0,8071 0,0015952 candidate UDP-glucose 4-epimerase
170910 -1,196 0,0015952 Glucose/ribitol dehydrogenase

153
44305 -0,9545 0,0016087 -
55027 -0,7703 0,0016129 -
199208 -0,8673 0,0016212 Hypothetical cysteine peptidase, calpain like
214206 -0,708 0,0016361 Nucleoside transporter
47549 -1,3926 0,0016388 #N/A
208912 -1,2417 0,0016564 Hypothetical bisphosphate nucleotidase
46489 -0,744 0,0016588 -
171067 -1,2342 0,0016588 Zn-finger, GATA type
52442 -0,6797 0,0016588 AAA ATPase
40493 -0,6387 0,001661 -
194055 -0,8272 0,0016646 -
41754 -1,335 0,0016818 -
45282 -1,0054 0,001684 -
181252 1,1182 0,001684 #N/A
181362 -0,7298 0,0016855 #N/A
213350 -1,13 0,0016903 -
214348 -0,9232 0,0016973 Acyl-CoA synthetase
55742 -1,2444 0,0016973 aldA Aldehyde dehydrogenase (aldA) (EC 1.2.1.3)
189001 -1,2494 0,0017046 -
206445 -2,8383 0,0017178 hypothetical mixed-linked beta-glucanase
54207 -1,261 0,0017209 MaoC-like dehydratase
213237 -1,1767 0,0017404 -
42844 -0,6886 0,0017404 -
55818 -1,2337 0,0017404 Predicted inosine-uridine preferring nucleoside hydrolase
191446 -0,841 0,0017424 -
208123 -1,0248 0,0017424 Eukaryotic translation initiation factor
189170 -0,9945 0,0017424 Related to alpha keto acid dehydrogenase complex of Aspergillus fumigatus; EC 2.3.1.12
210233 -1,5912 0,0017424 #N/A
207011 -0,6284 0,0017496 Oxysterol-binding protein
214527 -1,5307 0,0017656 Dihydrodipicolinate synthetase family
141194 -0,8874 0,0017855 hypothetical protein; KOG Class: Chromatin structure and dynamics; KOG Id: 2510; KOG Description: SWI-SNF chromatin-remodeling complex protein
138062 -0,6758 0,0017855 hypothetical. Interpro suggests actin-binding, cofilin/tropomyosin type
214453 -0,8591 0,0017855 #N/A
197132 -0,901 0,0017907 -
54964 -1,0778 0,0017934 -
52011 -3,5103 0,0017934 candidate xyloglucanase
127809 -0,8834 0,0017934 hypothetical extracellular thaumatin domain protein

154
188346 -0,9828 0,0017934 Major facilitator superfamily
209490 -1,0021 0,001797 GH family 76
130000 -2,6934 0,0018163 Vacuolar sorting protein VPS1, dynamin, and related proteins
207088 -0,9874 0,0018163 AAA ATPase
206509 -1,0786 0,0018212 -
211780 -0,7157 0,0018212 -
118832 -0,9125 0,0018212 ABC transporter
214608 -0,8422 0,0018212 candidate endo-1,4-beta-glucanase; glucan 1,4-beta-glucosidase; glycoside hydrolase, family 5; cellulose-binding region, fungal
43768 -0,9819 0,0018212 Hypothetical peptidase M20 (based on PFAM information)
209881 -1,0017 0,0018212 hypothetical protein containing Zn-finger, C2H2 type domain
56776 -1,418 0,0018212 Predicted NAD-dependent oxidoreductase
211797 1,5115 0,0018265 Hypothetical aspartic protease
120053 -1,0723 0,0018324 Fungal specific transcription factor
177071 -1,0443 0,0018511 Permease of the major facilitator superfamily
126298 -1,227 0,0018547 Mitochondrial carrier protein
40855 -0,7844 0,0018564 Ribokinase
205842 -0,9336 0,0018886 contains WD40 repeats
211749 -0,7297 0,0018908 Mitochondrial solute carrier protein
57028 -1,1087 0,0018935 Aldehyde dehydrogenase
174927 -0,5899 0,0018988 -
54557 -0,8674 0,0018988 -
55445 -0,6496 0,0018988 -
39258 -1,2187 0,0018988 Phenazine biosynthesis PhzC/PhzF protein
206769 -0,5389 0,0018988 Predicted E3 ubiquitin ligase
55950 -0,7648 0,0018988 Related to mannose-1-phosphate guanyltransferase. [EC:2.7.7.13]
54934 -0,8298 0,0018995 -
194208 -0,7271 0,0019067 Molybdenum cofactor biosynthesis pathway protein
211951 -0,619 0,0019106 Phenylalanyl-tRNA synthetase, beta subunit archae/euk cytosolic
56576 -0,9515 0,0019134 Hypothetical glutamine synthase
54633 -1,1043 0,0019181 hypothetical protein containing Zn-finger, C2H2 type domain
197766 -1,0318 0,0019193 -
42403 -0,9296 0,0019193 #N/A
133377 -0,6239 0,0019272 -
36655 -0,7572 0,0019272 Hypothetical peptidase (EC 3.5.1.32)
187727 -1,1472 0,0019272 Hypothetical peptidase aspartic

155
55214 -0,5999 0,0019272 Hypothetical, related to kinesin
126639 -3,3637 0,0019272 Peptidase A4, scytalidopepsin B
50981 -1,314 0,0019272 putative AMP-dependent synthetase and ligase, Acyl-CoA synthetase
174644 -1,0014 0,0019272 Ubiquitin-conjugating enzymes
39108 -0,8855 0,001933 Predicted NUDIX hydrolase FGF-2 and related proteins
207862 -0,6346 0,0019401 This domain is found in a number of fungal transcription factors. The N-terminal region of a number of fungal transcriptional regulatory proteins contains a Cys-rich motif that is involved in zinc-dependent binding of DNA.
173627 -0,9817 0,0019437 HypB/UreG, nucleotide-binding
180295 -0,7698 0,0019557 FAD-dependent oxidoreductase
179916 -0,8028 0,0019699 -
45652 -0,8843 0,0019935 Hypothetical Short-chain dehydrogenase/reductase SDR
56247 -1,219 0,0020021 Phospholipase D. Active site motif
190025 -1,0352 0,0020122 Major facilitator superfamily
42914 -0,8494 0,0020291 #N/A
173536 -1,5014 0,0020332 Glutathione S-transferase
128537 -0,6726 0,0020425 putative allergen
55693 -1,0133 0,0020469 -
45989 -1,6627 0,0020473 hypothetical UDP-glucose 4-epimerase
56475 -1,4988 0,0020564 Aldo/keto reductase
176347 -0,8948 0,0020564 #N/A
178166 -0,9126 0,0020584 -
213288 -0,9302 0,0020584 -
213970 -1,5485 0,0020584 #N/A
125764 -1,1619 0,0020655 -
210048 -0,9068 0,0020787 -
37736 -0,7384 0,0020787 (aglA) alpha-galactosidase; extracellular
42642 -0,6821 0,0020862 Ketopantoate reductase
39069 -0,5675 0,0021045 -
127683 -0,7429 0,0021045 Flavoprotein
125584 -1,1147 0,0021045 hypothetical chitinosanase
137541 -1,3914 0,0021045 Hypothetical mitochondrial polypeptide chain release factor
205979 -1,3701 0,0021045 Serine/threonine protein kinase
175387 -0,7973 0,0021084 -
205376 -1,0187 0,0021084 -
47870 -1,0368 0,0021084 -
183042 -0,8947 0,0021093 -
46275 -0,8386 0,0021093 -

156
36773 -0,9714 0,0021093 Hypothetical enoyl-CoA hydratase. (EC 4.2.1.17) HMM predicts secretion.
199609 -1,2739 0,0021093 hypothetical protein containing fungal specific transcription factor and fungal transcriptional regulatory protein domains.
47417 -1,2732 0,0021093 Short-chain dehydrogenase/reductase
46527 -0,8888 0,0021152 -
207831 -1,0246 0,0021152 Glucose-methanol-choline oxidoreductase
208663 -0,7177 0,0021229 -
186253 -1,2439 0,002137 Predicted transporter (major facilitator superfamily)
131188 -0,8572 0,0021418 Glucose dehydrogenase/choline dehydrogenase/mandelonitrile lyase (GMC oxidoreductase family)
207187 -0,8909 0,0021686 hypothetical protein with predicted Appr-1-p domain; KOG Class: Chromatin structure and dynamics; KOG Id: 2633; KOG Description: Hismacro and SEC14 domain-containing proteins
207954 -0,6501 0,0021731 Spermidine synthase
186207 -0,6387 0,0021788 Fungal specific transcription factor
211346 -0,9911 0,0021863 -
48485 -0,7569 0,0021863 Hypothetical protein
42759 -0,9889 0,0021968 -
193155 -1,3224 0,0021976 Amino acid/polyamine transporter I
53896 -0,6113 0,0022017 ATP-NAD/AcoX kinase
200686 -1,594 0,0022017 Predicted transporter (major facilitator superfamily)
52517 -0,8369 0,0022152 Peptidase S10, serine carboxypeptidase
201388 0,6244 0,0022187 #N/A
52270 -0,699 0,0022218 #N/A
206457 -0,7628 0,0022244 -
52585 -1,4113 0,0022364 Ferric reductase, NADH/NADPH oxidase and related proteins
52452 -1,0203 0,0022364 hypothetical alpha-amylase; EC 3.2.1.1
212073 -0,9408 0,0022364 RHO protein GDP dissociation inhibitor
170152 -1,0659 0,0022364 Zinc-containing alcohol dehydrogenase superfamily
44373 -1,0309 0,0022494 Mitochondrial carnitine-acylcarnitine carrier protein
198730 -0,9097 0,0022522 Cell membrane glycoprotein
37942 -0,9858 0,0022527 Hypothetical Cytochrome P450 monooxygenase
37792 -0,9933 0,0022669 Haloacid dehalogenase-like hydrolase
51890 -0,6875 0,0023016 Candidate CotA
186329 -0,8616 0,0023016 Hypothetical P-type ATPase
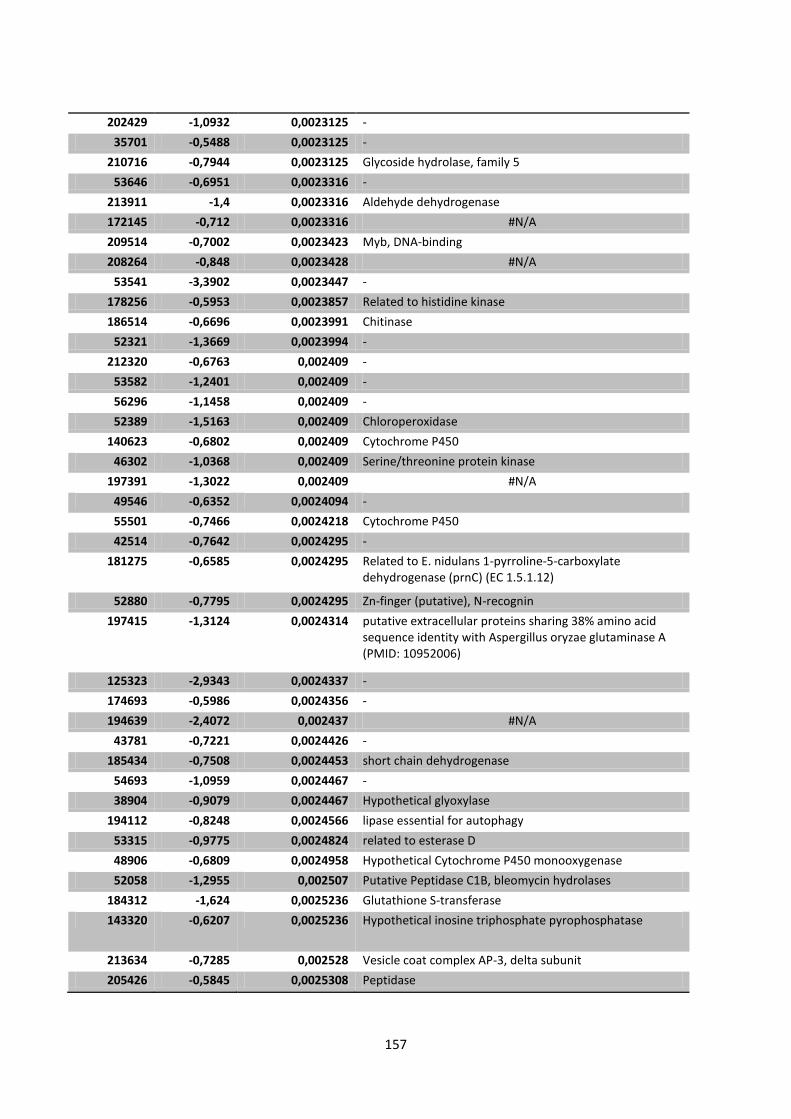
157
202429 -1,0932 0,0023125 -
35701 -0,5488 0,0023125 -
210716 -0,7944 0,0023125 Glycoside hydrolase, family 5
53646 -0,6951 0,0023316 -
213911 -1,4 0,0023316 Aldehyde dehydrogenase
172145 -0,712 0,0023316 #N/A
209514 -0,7002 0,0023423 Myb, DNA-binding
208264 -0,848 0,0023428 #N/A
53541 -3,3902 0,0023447 -
178256 -0,5953 0,0023857 Related to histidine kinase
186514 -0,6696 0,0023991 Chitinase
52321 -1,3669 0,0023994 -
212320 -0,6763 0,002409 -
53582 -1,2401 0,002409 -
56296 -1,1458 0,002409 -
52389 -1,5163 0,002409 Chloroperoxidase
140623 -0,6802 0,002409 Cytochrome P450
46302 -1,0368 0,002409 Serine/threonine protein kinase
197391 -1,3022 0,002409 #N/A
49546 -0,6352 0,0024094 -
55501 -0,7466 0,0024218 Cytochrome P450
42514 -0,7642 0,0024295 -
181275 -0,6585 0,0024295 Related to E. nidulans 1-pyrroline-5-carboxylate dehydrogenase (prnC) (EC 1.5.1.12)
52880 -0,7795 0,0024295 Zn-finger (putative), N-recognin
197415 -1,3124 0,0024314 putative extracellular proteins sharing 38% amino acid sequence identity with Aspergillus oryzae glutaminase A (PMID: 10952006)
125323 -2,9343 0,0024337 -
174693 -0,5986 0,0024356 -
194639 -2,4072 0,002437 #N/A
43781 -0,7221 0,0024426 -
185434 -0,7508 0,0024453 short chain dehydrogenase
54693 -1,0959 0,0024467 -
38904 -0,9079 0,0024467 Hypothetical glyoxylase
194112 -0,8248 0,0024566 lipase essential for autophagy
53315 -0,9775 0,0024824 related to esterase D
48906 -0,6809 0,0024958 Hypothetical Cytochrome P450 monooxygenase
52058 -1,2955 0,002507 Putative Peptidase C1B, bleomycin hydrolases
184312 -1,624 0,0025236 Glutathione S-transferase
143320 -0,6207 0,0025236 Hypothetical inosine triphosphate pyrophosphatase
213634 -0,7285 0,002528 Vesicle coat complex AP-3, delta subunit
205426 -0,5845 0,0025308 Peptidase

158
201380 -0,817 0,0025308 peptidyl-prolyl cis-trans isomerase
36604 1,3139 0,0025308 There are no hits to identified proteins for this transcript. However, the PFAM indicase and signal peptide predictor indicates an extracellular amidase.
48950 -0,8181 0,0025308 AAA ATPase
209889 -0,6227 0,0025592 -
211909 -0,7073 0,002566 Hypothetical porphobilinogen deaminase
53784 -0,9214 0,0025667 Ras small GTPase, Rab type
201398 -1,186 0,0025764 -
43953 -1,1461 0,0025919 -
214840 -0,6614 0,0026326 -
127828 -0,9885 0,0026507 Microtubule-associated protein
214683 -0,8156 0,0026715 -
56468 -0,6216 0,0026715 -
194780 -0,8542 0,0026843 -
41013 -0,8992 0,0026843 -
55344 -0,6644 0,0026843 (kexB) proprotein convertase kexB
207169 -0,5779 0,0026843 Receptor-activated Ca2+-permeable cation channels
205848 -0,7962 0,0026843 Sulfate/bicarbonate/oxalate exchanger SAT-1 and related transporters (SLC26 family)
56084 -0,9882 0,0026843 #N/A
209754 -1,1382 0,0026905 2-nitropropane dioxygenase
205368 -1,0269 0,0026905 Peptidase
38920 -1,0485 0,0027069 -
175089 -0,62 0,0027146 NAD dependent epimerase
54959 -0,7568 0,0027268 Ubiquitin C-terminal hydrolase
42198 1,3293 0,0027351 -
40691 -0,8491 0,0027365 hypothetical Aflatoxin biosynthesis regulatory protein
44761 -0,7249 0,0027494 -
207660 -0,6097 0,0027494 Glycosyl transferase, family 48
50504 -1,4373 0,0027494 Hypothetical alcohol dehydrogenase NADP+ dependent; EC 1.1.1.2
173622 0,8164 0,0027494 #N/A
189708 -0,8104 0,0027494 #N/A
53361 0,8935 0,0027494 #N/A
181700 -0,6327 0,0027616 Hypothetical 26S proteasome, regulatory subunit
38529 -1,2927 0,002762 -
46227 -0,755 0,002762 -
55462 -0,8901 0,002762 -
210891 -0,564 0,002762 Amidase
171353 -1,0057 0,002762 bifunctional deaminase-reductase

159
39849 -0,6445 0,002762 Hypothetical Cytochrome P450 monooxygenase
52767 -0,6754 0,002762 Hypothetical transcription factor containing C2HC type Zn finger
213042 -0,8182 0,002762 MOSC N-terminal beta barrel domain
189358 -0,6991 0,002762 Putative hydrolase
137517 -3,135 0,002762 #N/A
44752 -0,7445 0,0027678 20S proteasome, regulatory subunit beta type PSMB6/PSMB9/PRE3
50161 -2,1098 0,0027678 endo-polygalacturonase D [Aspergillus niger, Glycoside hydrolase, family 28
37539 -0,6658 0,0027713 Related to norsolorinic acid reductase from Aspergillus fumigatus and Aspergillus flavus where it is part of the aflatoxin cluster
38926 -0,9248 0,0027713 Transcription coactivator
181306 -0,6928 0,0027756 Basic-leucine zipper (bZIP) transcription factor
197851 -0,7417 0,0027756 #N/A
193748 -0,8322 0,0027758 -
212529 -0,6202 0,0027758 -
120926 -1,1317 0,0027758 Acyltransferase ChoActase/COT/CPT
193657 -0,9516 0,0027758 Monocarboxylate transporter
42809 -1,9307 0,0027758 Thioredoxin
37857 -0,8288 0,0027951 Heat shock transcription factor
171156 -0,6734 0,0028086 -
40243 -0,9721 0,0028086 beta-1,6-N-acetylglucosaminyltransferase, contains WSC domain
128147 -3,2321 0,0028418 -
44729 -1,328 0,0028418 Zinc-containing alcohol dehydrogenase superfamily
37730 -1,1783 0,0028509 -
210724 -1,2926 0,0028509 GABA/amino acid permease
185118 -0,8274 0,0028509 Hypothetical N-acetyl transferase, specificity unknown
56336 -0,7863 0,0028509 Hypothetical peptidase, eukaryotic cysteine peptidase active site
54016 -0,6458 0,0028633 Hypothetical high-affinity nickel transport protein
199928 -0,8953 0,0028703 Predicted hydrolase
208525 -1,1777 0,002873 -
209558 -0,8234 0,0028758 Phosphoglucomutase/phosphomannomutase
188159 -2,1548 0,0028841 -
44778 -0,9395 0,0028841 -
201918 -0,8299 0,0028841 Synaptic vesicle protein Synapsin
209561 -1,0804 0,0029106 Fatty acid desaturase
53986 -0,9223 0,0029303 -
177731 -0,7445 0,0029356 Major facilitator superfamily

160
202592 -0,8902 0,0029634 Predicted gamma-butyrobetaine,2-oxoglutarate dioxygenase
48803 -0,7258 0,0029688 -
174013 -4,0419 0,0029688 #N/A
57332 -0,6808 0,0029833 Galactosyltransferases
124388 -1,8082 0,0030053 -
36035 -1,413 0,0030058 -
57320 -0,6248 0,0030058 Fungal specific transcription factor
207705 -0,7653 0,0030058 Hypothetical 26S proteasome, regulatory subunit
51199 -1,1465 0,0030058 UMUC-like DNA-repair protein
205254 2,3822 0,0030137 -
194806 -0,8941 0,0030351 Fungal specific transcription factor
47044 -1,5983 0,0030692 Dihydrodipicolinate synthetase family
214665 -0,6528 0,0030692 Hypothetical protease
190724 -0,84 0,0030692 Major facilitator superfamily
213466 -0,7691 0,0030692 Peptidase
214220 -1,1573 0,0030927 -
44916 -0,9618 0,0030927 candidate extracellular phospholipase C
51181 -1,0721 0,0030927 Cytochrome P450
40260 -0,8159 0,0031008 Major facilitator superfamily
126433 -1,525 0,0031068 -
214072 -0,7597 0,0031068 SCF ubiquitin ligase, Skp1 component
188504 -0,7566 0,0031333 Cytochrome P450
201083 -0,5381 0,0031335 Phosphatidylinositol transfer protein SEC14
42606 -1,713 0,0031451 Generic methyltransferase
120161 -0,846 0,0031451 May be involved in signal transduction
119885 -0,7287 0,0031485 Zn-finger, GATA type
42881 -0,5716 0,0031627 -
213485 -0,5909 0,0031662 Cytochrome c heme-binding site
205484 -1,1514 0,0031735 Acyl-CoA dehydrogenase
181136 -0,6352 0,0031735 Flavoprotein monooxygenase
212567 -1,0646 0,0031735 Hypothetical aldo/keto reductase
52981 -0,8391 0,0031735 Metacaspase involved in regulation of apoptosis
208631 -1,2354 0,0031735 Predicted pyroglutamyl peptidase
174876 -0,8492 0,0031735 #N/A
213266 -0,54 0,0031769 -
136694 -0,6625 0,0031784 Translin family protein
41997 -0,9282 0,0031837 -
53980 -1,1507 0,0031837 Amidohydrolase
50744 1,411 0,0031837 hypothetical glycosyl transferase family 2
46339 -0,5987 0,0031843 Predicted protein shares amino acid sequence identity to the Saccharomyces cerevisiae THG1 gene product
212624 -0,6157 0,0031936 -

161
188691 -0,986 0,0031936 Hypothetical protein of the glyoxalase family
55287 -0,6739 0,0031936 Metallophosphoesterase
55113 -1,0588 0,0031936 #N/A
56736 -1,4467 0,0032042 Haloacid dehalogenase-like hydrolase
209058 -0,6306 0,0032063 ATP sulfurylase
214710 -0,7017 0,0032063 Flavonol reductase/cinnamoyl-CoA reductase
53445 -0,6122 0,0032075 -
54556 -0,9232 0,0032075 -
206738 -0,6142 0,003213 Esterase/lipase/thioesterase
133728 -1,0149 0,0032165 -
199618 -0,7128 0,0032165 -
43656 -0,7534 0,0032165 -
128077 -1,102 0,0032165 Putative GH family 43
38818 -0,8449 0,0032165 Ras GTPase
56146 -1,0891 0,0032397 -
52857 -0,8037 0,0032397 NEDD8-activating complex, APP-BP1/UBA5 component
56049 -0,5838 0,0032402 Hypothetical proteasome
210265 -0,974 0,0032602 Molybdenum cofactor biosynthesis protein
45814 1,1259 0,0032751 -
53801 -1,6003 0,0032753 Hypothetical protein. HMMPfam indicates Glucose-methanol-choline oxidoreductase activity
179912 0,9984 0,0032753 putative extracellular carboxylesterase, type B
207418 0,8049 0,0032753 #N/A
53661 2,7912 0,0033073 -
52560 1,8148 0,0033108 -
47796 -0,7082 0,0033108 Haloacid dehalogenase-like hydrolase
182516 -0,74 0,0033108 #N/A
171254 -0,6282 0,0033147 -
211551 -0,7902 0,0033147 -
46405 -1,2241 0,0033147 -
55188 -1,1487 0,0033147 DP87 protein (prespore protein in Dichostelium)
42722 -0,9201 0,0033147 Major facilitator superfamily
206534 -1,1549 0,0033147 Zinc-binding oxidoreductase
44850 -1,8917 0,0033147 #N/A
38577 -1,1573 0,003316 Protein kinase
200187 -0,8713 0,00332 #N/A
55270 -1,0374 0,0033225 -
180930 -0,7068 0,0033292 -
46625 -1,0511 0,0033292 -
56711 -1,8697 0,0033292 -
53400 -0,6903 0,0033292 Peptidase
41151 -0,6001 0,0033421 Hypothetical prefoldin subunit
178388 -0,6389 0,0033555 Proteasome alpha-subunit

162
180928 -1,995 0,0033649 -
49276 -0,5812 0,0033649 -
52127 -0,6563 0,0033649 NSF attachment protein
42981 -1,031 0,0033803 Lanthionine synthetase C-like protein
38532 -0,8654 0,0033973 -
172390 -0,5765 0,0034078 Manganese and iron superoxide dismutase
53471 -0,7219 0,0034137 Fungal transcriptional regulatory protein
207027 -1,1002 0,0034137 Oxidoreductase, N-terminal
200914 -0,5602 0,0034137 Predicted GTPase-activating protein
143917 -0,6848 0,0034137 Upstream transcription factor
43447 -1,2662 0,0034137 Zinc-containing alcohol dehydrogenase superfamily
35560 -0,5622 0,0034175 Aromatic amino acid aminotransferase and related proteins
48814 -1,378 0,0034243 -
47045 -0,8674 0,0034263 -
36368 -0,9527 0,0034279 -
173896 -0,9643 0,0034425 -
197679 -1,5007 0,0034425 Amino acid/polyamine transporter
190580 -0,6001 0,0034425 Hypothetical protein prenyltransferase, alpha subunit
134398 -0,5269 0,0034425 putative GH family 43 protein with 47% sequence identity to an Aspergillus nidulans endo-arabinanase (PMID: 16844780)
37300 -0,7405 0,0034694 -
189922 1,906 0,0034723 Cytochrome P450
214598 -1,7345 0,0034765 extracellular GH family 28 endo-polygalacturonase A
139986 -0,5596 0,0034765 #N/A
214295 -0,9544 0,0034836 -
41505 -0,6902 0,0034852 Permease of the major facilitator superfamily
191956 2,7101 0,0034862 related to extracellular aspartic protease
186804 -0,965 0,0034871 -
211544 -3,6936 0,0034871 (aceA) acetylxylan esterase aceA
209506 -0,6639 0,0035043 hypothetical alkaline phosphatase
47819 -1,023 0,0035167 -
55656 -0,7618 0,0035185 -
44492 -0,7684 0,0035328 ABC transporter
51782 -0,8388 0,0035591 Hypothetical protein kinase
212996 -0,9579 0,003561 -
45662 -0,5707 0,003561 -
56395 -1,062 0,003561 2-nitropropane dioxygenase
212091 -0,791 0,0035829 -
213779 -1,0934 0,0035829 -

163
136079 -0,5157 0,0035829 Hypothetical mitochondrial substrate carrier
214619 -0,5518 0,0035829 Metallophosphoesterase
205168 -1,0063 0,0036016 Sulfatase
172413 -0,7214 0,0036051 -
206611 -0,7979 0,0036115 hypothetical Acyl-CoA-binding protein
52449 -1,2098 0,0036241 Candidate pH-response regulator protein palI
54114 -0,6685 0,0036254 RhoGEF domain
38742 -0,7104 0,0036272 TPR repeat-containing protein
187256 -1,2444 0,0036466 Hypothetical phosducin
135741 -0,5825 0,0036878 -
52079 -1,3368 0,0036878 -
195023 -0,5559 0,0037001 -
208879 -1,0816 0,0037001 Delta-1-pyrroline-5-carboxylate dehydrogenase
42031 -1,3173 0,0037085 -
207131 -1,4187 0,0037085 Nucleolar GTPase/ATPase p130
54797 -0,5715 0,0037211 Predicted proline-serine-threonine phosphatase-interacting protein
54922 1,0351 0,0037464 Putative alpha 1,2 mannosyltransferase
211010 -0,6319 0,0037498 Protein kinase
170954 -0,7451 0,0037498 Transcription factor, MADS-box
172075 -0,9426 0,0037564 Hypothetical enoyl-CoA hydratase (EC 4.2.1.17)
214715 -1,0157 0,0037606 Hypothetical protein. KOG suggests chitinase. SignalP suggests secretion
54860 1,5191 0,0037615 purine nucleoside permease
211472 -0,8618 0,0037708 Protein kinase
55007 -1,0531 0,0037827 related to 3-ketoacyl-CoA thiolase
44464 -0,8338 0,0037866 -
36645 -3,9883 0,0037866 NRPS
213663 -0,7219 0,0037866 Putative ubiquitin fusion degradation protein
45354 -0,8338 0,0037899 Rab6 GTPase activator
213941 -0,7598 0,0038006 -
43933 -2,2337 0,0038006 beta-1,6-N-acetylglucosaminyltransferase, contains WSC domain
44193 -0,735 0,0038006 hypothetical carboxylesterase
194765 -3,0436 0,0038006 putative GH family 61 endo-1,4-beta-glucanase
199253 -1,0899 0,0038137 -
41167 -1,8736 0,0038197 #N/A
136740 -0,9427 0,0038339 -
142689 -1,8958 0,0039011 -
37522 -0,5478 0,003919 Fungal specific transcription factor
57188 -0,6424 0,0039242 RNA polymerase
208344 -1,3008 0,0039355 Glycoside hydrolase, family 5
178171 -0,8027 0,0039355 Serine/threonine protein kinase
132708 -0,5354 0,0039371 -
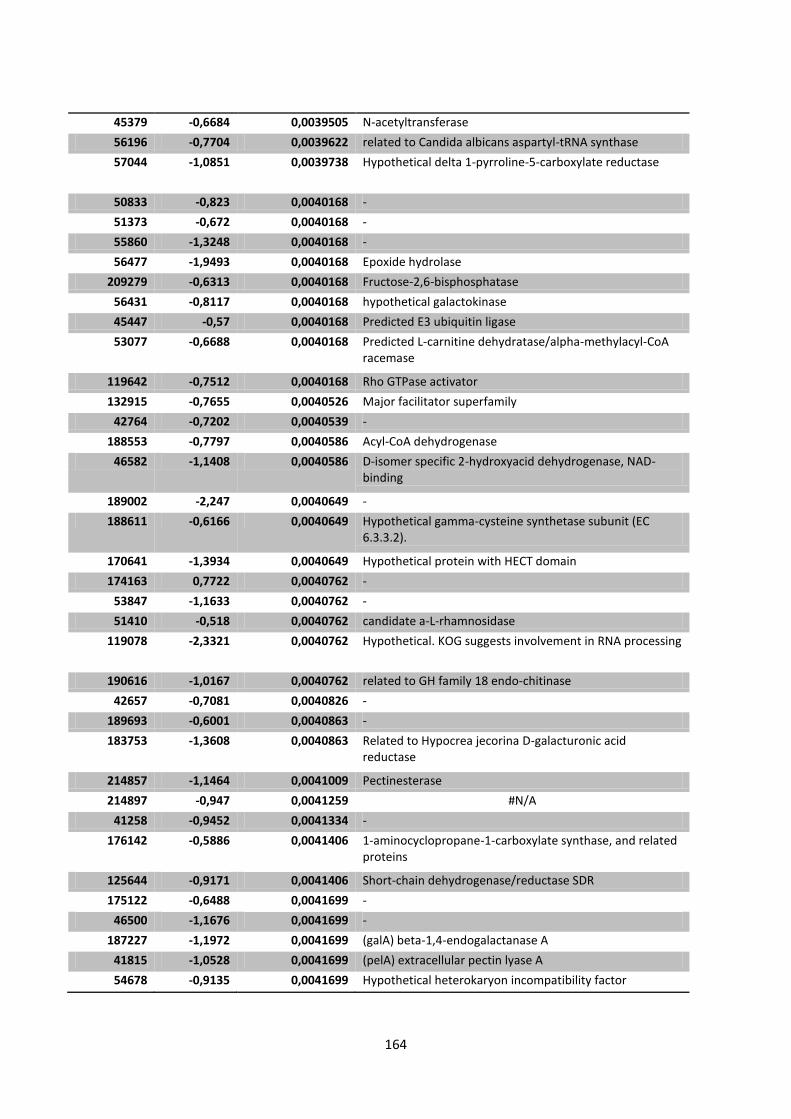
164
45379 -0,6684 0,0039505 N-acetyltransferase
56196 -0,7704 0,0039622 related to Candida albicans aspartyl-tRNA synthase
57044 -1,0851 0,0039738 Hypothetical delta 1-pyrroline-5-carboxylate reductase
50833 -0,823 0,0040168 -
51373 -0,672 0,0040168 -
55860 -1,3248 0,0040168 -
56477 -1,9493 0,0040168 Epoxide hydrolase
209279 -0,6313 0,0040168 Fructose-2,6-bisphosphatase
56431 -0,8117 0,0040168 hypothetical galactokinase
45447 -0,57 0,0040168 Predicted E3 ubiquitin ligase
53077 -0,6688 0,0040168 Predicted L-carnitine dehydratase/alpha-methylacyl-CoA racemase
119642 -0,7512 0,0040168 Rho GTPase activator
132915 -0,7655 0,0040526 Major facilitator superfamily
42764 -0,7202 0,0040539 -
188553 -0,7797 0,0040586 Acyl-CoA dehydrogenase
46582 -1,1408 0,0040586 D-isomer specific 2-hydroxyacid dehydrogenase, NAD-binding
189002 -2,247 0,0040649 -
188611 -0,6166 0,0040649 Hypothetical gamma-cysteine synthetase subunit (EC 6.3.3.2).
170641 -1,3934 0,0040649 Hypothetical protein with HECT domain
174163 0,7722 0,0040762 -
53847 -1,1633 0,0040762 -
51410 -0,518 0,0040762 candidate a-L-rhamnosidase
119078 -2,3321 0,0040762 Hypothetical. KOG suggests involvement in RNA processing
190616 -1,0167 0,0040762 related to GH family 18 endo-chitinase
42657 -0,7081 0,0040826 -
189693 -0,6001 0,0040863 -
183753 -1,3608 0,0040863 Related to Hypocrea jecorina D-galacturonic acid reductase
214857 -1,1464 0,0041009 Pectinesterase
214897 -0,947 0,0041259 #N/A
41258 -0,9452 0,0041334 -
176142 -0,5886 0,0041406 1-aminocyclopropane-1-carboxylate synthase, and related proteins
125644 -0,9171 0,0041406 Short-chain dehydrogenase/reductase SDR
175122 -0,6488 0,0041699 -
46500 -1,1676 0,0041699 -
187227 -1,1972 0,0041699 (galA) beta-1,4-endogalactanase A
41815 -1,0528 0,0041699 (pelA) extracellular pectin lyase A
54678 -0,9135 0,0041699 Hypothetical heterokaryon incompatibility factor

165
57294 -0,7085 0,0041704 glycyl-tRNA synthase
41430 2,8247 0,004185 -
200255 -0,657 0,0042071 Hypothetical cation efflux protein
45037 -0,6267 0,0042071 Major facilitator superfamily
49866 -0,5966 0,0042386 -
38851 -1,1697 0,0042386 homogentisate 1,2-dioxygenase
184740 -0,948 0,0042386 Transcription elongation factor
204035 -1,2105 0,0042396 Hypothetical monooxygenase. Possible steroid monooxygenase or involved in K+ transport
49232 -0,9541 0,0042405 -
136394 -0,5019 0,0042405 #N/A
213766 -0,749 0,0042573 -
55928 -1,3539 0,0042573 #N/A
53826 -0,5485 0,0042634 Glycosyl transferase, family 15
174948 -1,0425 0,0042659 hypothetical fumarylacetoacetate hydrolase
53301 -0,8501 0,0042741 -
45320 -0,7278 0,0042826 -
52154 1,4057 0,004285 -
41270 0,9158 0,0043099 hypothetical aspartic protease
54386 -0,8952 0,0043117 6-phosphogluconate dehydrogenase
40713 -0,491 0,0043151 Protein kinase
40127 -0,6177 0,004341 Siroheme synthase
46361 -3,3564 0,0043498 -
56954 -0,5602 0,0043552 -
54756 -0,6014 0,0043552 Sortilin and related receptors
52373 -0,4853 0,0043552 #N/A
45562 -0,7962 0,0043558 -
48160 -1,1985 0,0043742 Hypothetical protein. HMMPfam indicates Acyl-CoA dehydrogenase activity.
171346 -0,974 0,0043811 -
211565 -0,7415 0,0043811 extracellular serine protease
141709 -0,9646 0,0043835 -
179322 -0,6297 0,004388 Hypothetical protein
208713 -0,7265 0,0043999 -
52158 -0,8142 0,0043999 -
55331 -0,674 0,0043999 Hypothetical. Some relation to Zn-dependent hydrolase/beta-lactamase
204317 1,6343 0,0043999 Vacuolar H+-ATPase V0 sector, subunits
174315 -1,3737 0,0044212 -
175036 -0,7362 0,0044212 -
184563 -0,8599 0,0044212 -
186792 -0,9048 0,0044212 -
189463 -0,8196 0,0044212 -
208069 -1,2435 0,0044212 -

166
53410 -0,5532 0,0044212 -
53658 -0,797 0,0044212 -
202668 -1,7024 0,0044212 Glucose/ribitol dehydrogenase
191577 -1,008 0,0044212 Hypothetical metal dependent terpene synthase
175881 -0,9593 0,0044212 Hypothetical peptidase
55116 -0,8236 0,0044212 hypothetical short chain dehydrogenase
205594 -1,1058 0,0044212 hypothetical. Methionyl aminopeptidase
208685 2,9733 0,0044212 Phosphoenolpyruvate carboxykinase, N-terminal,
46333 -0,5152 0,0044212 RNA polymerase II transcription initiation factor TFIIA
205870 -0,7886 0,0044232 Ubiquitin-conjugating enzyme
40065 -1,1921 0,0044399 -
181376 -0,7272 0,0044456 Ferric reductase-like transmembrane component
205518 1,8694 0,0044601 NADH-dehydrogenase (ubiquinone)
55563 -0,7056 0,0044749 Uricase (urate oxidase)
129126 -0,6409 0,0044919 Notchless-like WD40 repeat-containing protein
119984 3,5353 0,0045105 Hypothetical Potassium transport protein, high-affinity
128744 -1,1045 0,0045126 -
170134 -0,7218 0,0045126 -
205095 -0,9479 0,0045178 Short-chain dehydrogenase/reductase
128404 -0,5809 0,0045187 -
55683 -0,7 0,0045187 Glycoside hydrolase, family 47
45912 -0,7821 0,0045282 FMN-dependent alpha-hydroxy acid dehydrogenase
53797 -1,6031 0,0045282 related to endoglucanase of Trichoderma reesei; glucan 1,4-beta-glucosidase; cellulose-binding region; glycoside hydrolase, family 61
52211 -1,1417 0,00455 Hypothetical hydrolase related to dienelactone hydrolase
174873 -0,7493 0,00455 Hypothetical N-acetyltransferase according to PFam. No supporting sequence information
56053 1,7904 0,00455 #N/A
137221 -0,7766 0,0045572 Cytosine deaminase FCY1 and related enzymes
39560 -0,7485 0,0045641 -
50997 -0,9654 0,0045641 putative extracellular GH family 3 beta-glucosidase
56252 -0,7186 0,0045942 Proteasome alpha-subunit
191077 -0,7243 0,0045966 -
176076 0,6476 0,0046206 Major facilitator superfamily
129525 -0,8156 0,0046206 Predicted DHHC-type Zn-finger protein
53173 1,2808 0,004621 #N/A
194179 -0,6582 0,0046566 Flavoprotein monooxygenase
48631 -1,1645 0,0046673 -
51325 1,0218 0,0046739 Aldehyde dehydrogenase

167
40514 -0,4936 0,0046777 Major facilitator superfamily
56457 -1,0833 0,0046856 (cmkB) calcium/calmodulin dependent protein kinase B - high homology to cmkB in A. nidulans
46255 -0,9603 0,0046878 Glycoside hydrolase, family 28 (Polygalacturonase )
56409 -1,1337 0,0046878 Predicted H+-transporting two-sector ATPase, alpha/beta subunit, central region
181057 -1,2239 0,0046959 -
46629 -0,6927 0,0047214 -
40623 -0,6282 0,0047214 #N/A
52460 -0,5301 0,004725 -
39638 -0,5773 0,004725 Autophagy protein Apg5
42464 -1,075 0,004725 candidate Peptidyl-prolyl cis-trans isomerase
180885 -0,8774 0,004725 Fungal transcriptional regulatory protein
209924 -0,8188 0,004725 Purine phosphorylase, family 2
187263 -0,6781 0,0047423 -
55720 -0,6213 0,0047423 Nonaspanin
48688 -0,7998 0,0047586 adenosylmethionine-8-amino-7-oxononanoate transaminase
51819 -0,648 0,0047586 Hypothetical threonyl-tRNA synthetase kinase. HMMPfam indicates Threonyl-tRNA synthetase kinase activity
44861 -1,7735 0,0047586 #N/A
55956 -0,7148 0,0047635 Hypothetical subunit of the 26S proteasome regulatory complex
53311 -0,5859 0,0047881 Longin-like
198787 -0,5174 0,0048044 -
134257 -0,5474 0,0048087 -
185810 -1,3334 0,0048087 -
53655 -0,5067 0,0048087 -
142899 1,8789 0,0048087 Protein kinase
56179 -0,7441 0,0048087 Tyrosine specific protein phosphatase and dual specificity protein phosphatase
38832 -1,5111 0,0048205 Cytochrome P450
214748 -1,1161 0,0048375 Acyl-CoA synthetase
55055 -0,6173 0,0048375 hypothetical protein containing Zn-finger, C2H2 type domain
54843 -0,6153 0,0048375 Iron/ascorbate family oxidoreductases
53788 -0,8636 0,0048375 Nucleoside phosphatase
183549 -0,5135 0,0048375 prolyl-4-hydroxylase
176378 -0,9492 0,0048375 Short-chain dehydrogenase/reductase
39817 -1,0966 0,0048429 Hypothetical glutathione-dependent formaldehyde-activating protein
54297 -1,0741 0,0048626 Predicted L-carnitine dehydratase/alpha-methylacyl-CoA racemase

168
46707 -0,6541 0,0048626 TPR Domain
205639 -0,7161 0,0048644 candidate dihydroorotase/amidohydrolase
209032 -1,0611 0,0048803 -
142669 0,5447 0,0048845 #N/A
205050 -0,5611 0,0049154 Hypothetical thioredoxin-related
55179 -1,6838 0,0049253 -
188319 -0,5604 0,0049295 -
214667 -0,9772 0,0049295 Hypothetical Xanthine dehydrogenase
50148 4,1793 0,0049426 -
54208 -0,6099 0,0049439 AAA ATPase
49455 -0,5558 0,0049759 -
124618 -1,3751 0,0049787 hypothetical. KOG suggests PHD finger protein AF10
40158 -0,6075 0,0049794 Cytochrome P450
50197 -0,8643 0,0049794 Hypothetical protein. PFam suggests a Enoyl-CoA hydratase/isomerase function
182870 -0,745 0,0049794 Related to A. fumigatus N,N-dimethylglycine oxidase (EC 1.5.99.2)
171548 -0,7896 0,0049794 #N/A
39105 2,2532 0,0050074 -
210445 -1,0235 0,0050315 Cytochrome P450
51764 -0,604 0,0050347 Glycosyl hydrolases family 35
183029 -0,6516 0,0050556 Candidate Two-component system protein A
55419 -0,8242 0,0050561 Hypothetical glycosyl hydrolase (GH family 31)
210364 1,1015 0,0050608 -
124897 -0,5373 0,0050608 Golgi reassembly stacking protein GRASP65, contains PDZ domain
53364 -0,7368 0,0050608 related to aspartic protease
191241 -0,6033 0,0050723 #N/A
49311 -1,4533 0,0050786 Hypothetical, similarities to sialidase superfamily
175603 -0,6945 0,0050807 von Willebrand factor and related coagulation proteins
51997 -0,8806 0,005142 (xyrA) D-xylose reductase xyrA whose expression requires the xylanolytic transcriptional activator XlnR; involved in pentose and glucuronate interconversions
54362 -0,6415 0,005142 Cytoplasmic tryptophanyl-tRNA synthetase
40460 -0,8691 0,0051516 FAD-dependent oxidoreductase
194595 -0,9153 0,0051516 Flavonol reductase/cinnamoyl-CoA reductase
41165 -0,8733 0,0051779 putative GH family 16 GPI_glucanosyltransferase
133565 -0,6954 0,0051782 -
210777 -0,8562 0,0051782 -
196476 -0,7734 0,0051782 Phospho-2-dehydro-3-deoxyheptonate aldolase

169
214740 -0,9036 0,0051782 Predicted transporter (major facilitator superfamily)
213358 -0,9938 0,0052053 Fungal specific transcription factor
207331 -0,6038 0,0052053 Inorganic pyrophosphatase
177723 -0,5664 0,0052067 -
57073 -0,6952 0,0052173 proteasome beta-subunit
190247 -0,8323 0,0052205 SWAP mRNA splicing regulator
55566 1,3414 0,0052311 Hydroxymethylglutaryl-coenzyme A synthase
171186 2,6632 0,0052429 -
174230 -0,5671 0,0052512 -
192625 -0,5521 0,0052512 -
203267 -0,9882 0,0052512 -
199777 -0,7915 0,0052512 Hypothetical ERG4/ERG24 ergosterol biosynthesis protein
212363 -0,6677 0,0052512 Protein kinase
182955 -1,0191 0,0052536 -
52947 -0,6107 0,0052564 Peptidase C19
171092 -0,7353 0,0052616 Monooxygenase involved in coenzyme Q (ubiquinone) biosynthesis
189022 -2,293 0,0052659 -
54972 -0,6167 0,0052659 FAD binding domain
188323 -0,5797 0,0052659 Fungal specific transcription factor
170119 -1,0277 0,0052659 Pyridoxal-dependent decarboxylase
37789 -0,7232 0,0052659 Shares amino acid sequence identity with Saccharomyces cerevisiae GCD1 gene product comprising the gamma subunit of the translation initiation factor eIF2B; the guanine-nucleotide exchange factor for eIF2; activity subsequently regulated by phosphorylated eIF2.
171717 -0,5711 0,0052689 -
38591 -0,5547 0,0053054 GCN5-related N-acetyltransferase
180348 -1,0879 0,0053054 Peptidase S26
46653 -0,7384 0,0053066 -
52393 -0,585 0,0053222 Nucleolar GTPase/ATPase p130
135002 -0,6677 0,0053924 #N/A
182617 1,6954 0,0054272 Hypothetical secreted iron permease
206645 -0,5415 0,0054272 related to phosphatidylinositol/phosphatidylglycerol transfer protein
177953 -0,6721 0,0054388 Hypothetical Zn finger protein with RING domain
55590 -0,9353 0,0054567 Phosphoglucomutase (Glucose phosphomutase) (PGM)
56312 -0,744 0,005502 -
43345 -0,6204 0,005506 Amino acid transporter

170
201345 -0,9639 0,005506 #N/A
187292 -1,1081 0,0055576 Alcohol dehydrogenase
208484 -0,6557 0,0055715 Signal transduction
56295 -0,5378 0,0055753 Nuclear export receptor CSE1/CAS (importin beta superfamily)
122575 -0,5685 0,0055923 -
210814 -0,4939 0,0055923 Ras-related small GTPase
38924 -0,5278 0,0055923 #N/A
185464 -0,5832 0,0055941 DnaJ domain protein
41379 -0,8464 0,0055941 Fungal transcriptional regulatory protein, N-terminal
205670 -0,5415 0,0055941 Glycoside hydrolase, family 3
47481 -0,7029 0,0055941 Protein phosphatase 2C-like
53002 -0,5219 0,005595 -
214216 -0,5036 0,0056325 Calmodulin
185606 -0,7597 0,0056384 -
187028 -0,5634 0,0056384 -
181153 -0,5616 0,0056409 -
55604 -0,5281 0,0056409 -
52783 -0,7582 0,0056409 Alternative splicing factor SRp55/B52/SRp75 (RRM superfamily)
197480 -1,2537 0,0056409 Enoyl-CoA hydratase/isomerase
47372 -1,0828 0,0056409 Peroxidase
37330 -0,6046 0,005646 -
210842 -1,399 0,0056691 Cytochrome c heme-binding site
206441 -3,5891 0,0056859 -
213559 -0,8479 0,0056859 Arginase/agmatinase/formiminoglutamase
211423 -0,5021 0,0057061 Actin-related protein
52219 -1,0389 0,005708 Glycoside hydrolase, family 28
53423 -1,0196 0,005708 Related to 2-methylcitrate dehydratase of E. coli
55451 -0,7605 0,0057215 -
207206 -0,5047 0,0057404 Glycosyl transferase, family 15
51725 -0,6975 0,0057412 -
45820 -0,6469 0,0057445 -
51788 -0,8028 0,0057445 hypothetical protein containing basic-leucine zipper transcription factor domain
180458 -0,9144 0,0057546 Acetamidase/Formamidase
123165 -0,6458 0,0057546 Predicted GTP-binding protein
128584 -1,2566 0,0057548 Non-ribosomal peptide synthetase
53643 -0,6854 0,0057712 -
182079 -0,6444 0,0057712 Hypothetical exocyst complex subunit
190033 -0,9961 0,0057712 putative proline racemase
185579 -0,6526 0,0057874 -

171
41345 -0,8853 0,005815 Peptidase C19, ubiquitin carboxyl-terminal hydrolase 2
197381 -0,6426 0,0058252 GTPase Rab5/YPT51 and related small G protein superfamily GTPases
179341 -0,5479 0,0058402 Myb, DNA-binding
37006 -0,4889 0,0058402 Transferrin receptor and related proteins containing the protease-associated (PA) domain
50998 -0,712 0,0058421 -
130480 -0,4708 0,0058421 Predicted RNA binding protein, contains G-patch domain
40780 -0,6297 0,0058621 -
122901 -0,6463 0,0058669 #N/A
211517 1,3517 0,0058953 -
55261 -0,9446 0,0058953 -
54616 0,6509 0,0058953 Acetolactate synthase, small subunit
181472 -0,8846 0,0058953 ER lumen protein retaining receptor
190726 -0,5129 0,0059192 -
181105 -0,5317 0,0059234 #N/A
194346 -0,7141 0,0059252 Esterase/lipase/thioesterase
172633 -1,1176 0,0059295 -
192901 -0,6422 0,0059398 -
51753 -2,4705 0,0059398 -
55813 -0,5627 0,0059543 hypothetical protein with predicted SH3 domain
214467 -0,4911 0,0059671 Major facilitator superfamily
193941 -0,5713 0,0059671 #N/A
54609 -0,6527 0,0059752 20S proteasome subunits
213343 0,8235 0,0059752 Predicted 3-hydroxy-3-methylglutaryl-CoA (HMG-CoA) reductase
55163 -0,665 0,0059752 Zn-finger-like, PHD finger
176418 -0,9324 0,0059794 -
207067 0,8965 0,0059794 HAD-superfamily hydrolase,
55077 -1,034 0,0059889 DNA-binding protein of the nucleobindin family
204025 -0,608 0,0059889 hypothetical methyl transferase
38054 -1,2634 0,0059889 Hypothetical Short-chain dehydrogenase/reductase SDR
47390 -0,7867 0,0060096 -
208716 -0,7557 0,0060096 Fungal specific transcription factor
203770 -0,7529 0,0060096 Protein kinase
52816 -0,7299 0,006013 -
182803 -0,8504 0,006013 #N/A
206228 -0,5719 0,0060524 Hypothetical Molecular chaperone (DnaJ superfamily
184329 -4,4142 0,0060524 putative alkaline lipase
53037 -0,4966 0,0061136 HEAT repeat-containing protein

172
48541 -0,6794 0,0061136 Peptidase S15
128173 -0,4647 0,0061138 Longin-like
192821 -0,6614 0,0061279 Helicase-like transcription factor HLTF/DNA helicase RAD5, DEAD-box superfamily
53563 -0,9755 0,0061279 Mandelate racemase/muconate lactonizing enzyme
188620 1,284 0,006135 Cation transporting ATPase
194086 -0,7495 0,0061658 Major facilitator superfamily
209864 -0,6458 0,0061865 Amidohydrolase 2
40370 -0,5733 0,0061866 Candidate Calcineurin subint B
180990 -1,1492 0,0061906 Zinc-binding oxidoreductase
54001 0,8948 0,0062102 putative Hsp60
47182 -0,5076 0,0062135 -
47464 -0,5461 0,0062643 Protein of unknown function DUF6
188492 -0,6948 0,0062655 Hypothetical RTA1 like protein, mb bound
131431 -0,4952 0,0062655 Hypothetical. Flavoprotein monooxygenase domain
182968 -0,503 0,0062655 Possibly related to mitotic and DNA damage checkpoint protein hus
55487 -0,572 0,0063081 -
57159 -0,5134 0,0063081 -
185327 5,4786 0,0063081 Cation transporting ATPase
125768 -0,5093 0,0063081 Heat shock protein DnaJ
176795 -0,9376 0,0063081 hypothetical phenylalanine ammonia-lyase
206384 -1,655 0,0063081 related to aspartic protease
56891 -0,6041 0,0063081 Shares amino acid sequence identity to Saccharomyces cerevisiae GUS1 gene product comprising a glutamyl-tRNA synthetase (GluRS); forms a complex with methionyl-tRNA synthetase (Mes1p) and Arc1p; complex formation increases the catalytic efficiency of both tRNA synthetases and ensures their correct localization to the cytoplasm.
52040 -0,815 0,0063636 #N/A
205005 -1,2836 0,0063787 putative soluble Fumarate reductase/succinate dehydrogenase flavoprotein, N-terminal
37178 -0,6474 0,0063801 Serine/threonine protein kinase
40948 -0,6777 0,006389 #N/A
43980 -0,804 0,0064053 -
38344 -0,466 0,0064053 hypothetical protein; KOG Class: Chromatin structure and dynamics
54157 -0,4502 0,0064053 Hypothetical. CREBB binding
52303 -0,6893 0,0065252 -
56726 -0,5721 0,0065252 (pyrG) Orotidine 5'-phosphate decarboxylase

173
37029 -0,6018 0,0065252 Ferric reductase like transmembrane component
210303 -0,426 0,0065252 Hypothetical amino acyl-tRNA synthetase complex component.
175181 -0,7784 0,0065252 Phox-like
120043 -0,604 0,0065252 RNA-binding protein RBM5 and related proteins, contain G-patch and RRM domains
170627 -1,0705 0,0065503 -
205396 -0,5778 0,0065503 -
205517 -1,0471 0,0065503 msdS, alpha-1,2-mannosidase S
55133 2,7742 0,0065503 related to extracellular serine protease
45118 -0,7935 0,0065503 #N/A
119977 -0,8186 0,0065745 Fungal specific transcription factor
56172 2,6481 0,0065745 putative GH family 16 GPI-glucanosyltransferase
209331 -0,5921 0,0065954 -
42277 -0,5781 0,0066072 -
51602 -0,5005 0,0066072 -
201939 -0,9328 0,0066072 Phospholipase/carboxyhydrolase
171965 -1,8348 0,0066072 #N/A
52126 -0,5487 0,0066359 Hypothetical endoglucanase
206983 -0,6927 0,0066643 -
48679 -0,5315 0,0066721 Glutamine synthetase
211162 -1,4347 0,0067278 Hypothetical 1,4-alpha-glucan branching enzyme
36285 -1,0143 0,0067369 -
46681 -0,5174 0,0067369 #N/A
50676 -0,5402 0,0067706 putative Inositol polyphosphate related phosphatase
181005 -0,4442 0,0068398 -
53717 -0,5125 0,0068398 AAA ATPase
53770 -0,6135 0,0068404 hypothetical GPI anchor protein
192370 -0,7121 0,0068451 -
212750 -0,5665 0,0068748 FAD binding domain
54874 -0,7326 0,0068776 Predicted oxidoreductase
124587 -0,5196 0,0068776 #N/A
57344 -0,5361 0,0068977 Protein prenyltransferase, alpha subunit
207326 -0,7774 0,0069256 -
209711 -0,6138 0,0069256 -
47560 -0,6119 0,0069256 hypothetical protein containing helix-turn-helix, AraC type domain
53811 -0,6679 0,0069256 Related to profilin an actin bindin protein involved in cytoskeleton dynamics
50166 -0,7771 0,0069334 Hypothetical glutathione synthase (EC 6.3.2.3). Shows some similarities with S. pombe glutathione synthase
204569 -0,4637 0,0069584 -

174
40157 -0,6081 0,0069627 -
47085 -0,5502 0,0069627 Hypothetical H+-transporting two-sector ATPase
212664 1,2164 0,0069627 hypothetical lipase
54513 -0,5598 0,0069627 hypothetical protein; KOG Class: Chromatin structure and dynamics; KOG Id: 1973; KOG description: Chromatin remodeling protein, contains PHD Zn-finger
185272 -0,7765 0,0069807 -
51955 0,4201 0,0069807 -
200205 -0,5063 0,0069902 -
52144 -0,5938 0,0069923 Vacuolar H+-ATPase V1 sector
35601 -0,5423 0,0069935 -
41811 -0,6364 0,0069935 Molybdopterin synthase sulfurylase
185165 -0,6488 0,0069935 #N/A
36404 1,1043 0,0069949 FAD linked oxidase, N-terminal
119946 -0,7891 0,0069949 AAA ATPase
43321 0,4527 0,0070168 -
54419 -0,6704 0,0070168 -
53033 -1,8503 0,0070233 related to beta-1,3-glucanosyltransferase
57185 -0,6019 0,0070434 Inositol polyphosphate related phosphatase
54605 -0,5501 0,0071153 Predicted Zn2+-dependent endopeptidase, insulinase superfamily
195172 -0,5873 0,007133 hypothetical. N-acetyltransferase activity
40332 -0,5209 0,007133 MED6 mediator
120082 -0,6091 0,0071455 Predicted hydrolase involved in interstrand cross-link repair
186700 -0,6776 0,0071535 -
174666 -0,7733 0,0071566 -
48560 -0,8394 0,0071566 Glutathione S-transferase
194526 -1,3145 0,0071566 putative extracellular HpcH/HpaI aldolase
189790 1,3168 0,0071871 -
125418 -0,6785 0,0071891 Short-chain dehydrogenase/reductase SDR
129181 -0,5822 0,0072055 -
45922 -2,9747 0,0072055 #N/A
56436 -0,4712 0,0072071 -
52600 -0,475 0,0072071 Glutamate decarboxylase
56841 -0,7218 0,0072071 putative transmembrane GH family 47 mannosyl-oligosaccharide 1,2-alpha-mannosidase
39893 -0,561 0,0072123 Synaptic vesicle transporter SVOP
212581 1,0109 0,0072426 Acetohydroxy acid isomeroreductase
209267 -0,4727 0,0072426 Cytochrome P450
50131 -0,9279 0,0072839 hypothetical Pyridoxal-5'-phosphate-dependent enzyme, beta subunit

175
137287 -0,7841 0,007287 hypothetical. KOG: beta-1,6-N-acetylglucosaminyltransferase
190335 -0,6766 0,0073017 Protein kinase
52888 -0,9312 0,0073287 -
48610 -0,6223 0,0073288 -
50097 -0,6866 0,0073459 -
51886 -0,6473 0,0073504 Anthranilate phosphoribosyltransferease, trp biosynthesis, EC 2.4.2.18
37620 -0,7892 0,0073504 gdhB, NAD dependent glutamate dehydrogenase
121995 -0,5555 0,0073669 -
121337 -1,0172 0,0073747 #N/A
42065 -0,47 0,0073764 -
56242 -0,6553 0,0074052 -
180608 -0,8151 0,0074186 -
198250 -1,0171 0,0074186 2-enoyl-CoA hydratase/3-hydroxyacyl-CoA dehydrogenase/Peroxisomal 3-ketoacyl-CoA-thiolase, sterol-binding domain and related enzymes
46134 -0,5068 0,0074186 FAD-linked oxidase
194896 -0,4742 0,0074186 hypothetical amine oxidase
207264 -1,71 0,0074253 Glycoside hydrolase, family 27
38247 -0,5221 0,0074253 #N/A
41296 -0,46 0,0074263 #N/A
124139 -0,5027 0,0074476 -
57046 -1,1478 0,0074476 Aldehyde dehydrogenase
213618 -0,6878 0,0074476 Exocyst subunit - Sec10p
194124 -0,685 0,0074515 #N/A
179980 -0,8632 0,0074693 Hypothetical methyltransferase
192380 -0,6772 0,0074854 -
55148 -0,5393 0,0074854 -
43726 0,7066 0,0075049 -
172191 -0,3992 0,0075163 -
208486 -0,5523 0,0075241 Peptidase S10
193498 -0,463 0,0075446 Hypothetical SNARE protein TLG2/Syntaxin 16
40901 -0,535 0,0075446 Zinc finger protein
189722 -0,6908 0,0075831 (rghA) extracellular GH family 28 endo-rhamnogalacturonase A
37921 -0,5934 0,007615 -
53297 -0,5283 0,0076171 -
134276 -1,2218 0,0076171 FOG: RRM domain
51860 -0,478 0,0076171 #N/A
188673 -0,6714 0,0076331 AMP-dependent synthetase and ligase
192610 -0,5259 0,0076351 putative cellobiose dehydrogenase (cd00241)
143487 -0,7649 0,0076351 Serine/threonine protein kinase

176
198031 -0,5511 0,0076482 #N/A
206787 -0,4969 0,007655 Sec1-like protein
47124 -0,9317 0,0076681 -
210433 -0,8496 0,0076681 #N/A
56775 -0,6142 0,0076747 (arp3) implicated in control of actin polymerization
130502 -1,1303 0,0077032 #N/A
51831 -0,5477 0,007767 -
54468 -1,3474 0,0077748 Amidases
176070 1,0956 0,0077748 ATP-dependent DNA ligase
179405 -0,5592 0,0077748 Conserved hypothetical ATP binding protein
182977 -0,5353 0,0077748 related to short-chain alcohol dehydrogenases)
190360 0,8804 0,0077868 -
41518 -1,0758 0,0077868 -
55237 -0,7721 0,0077868 -
125597 -0,5388 0,0077882 -
57366 0,7418 0,0077882 -
213937 -0,5417 0,0077882 26S proteasome subunit
181325 -0,894 0,0077882 Candidate Peroxisomal phytanoyl-CoA hydroxylase
197735 -2,3297 0,0077882 Glycoside hydrolase, family 43
207470 -0,4893 0,0077882 Hypothetical cytosolic asparaginyl-tRNA synthetase
209963 -0,5019 0,0077882 Hypothetical fructose-2,6-bisphosphatase
207002 1,2246 0,0077882 Hypothetical. InterPro suggests role in chromosome condensation
53716 -0,5315 0,0077882 Ribulose kinase and related carbohydrate kinases
171497 -0,6144 0,0077882 Short-chain dehydrogenase/reductase
188168 -0,7017 0,0078172 -
129891 -0,4537 0,0078279 Glycoside hydrolase, family 3
201762 -0,4282 0,0078281 Predicted ubiquitin-protein ligase/hyperplastic discs protein, HECT superfamily
175678 -0,843 0,0078825 -
44318 -0,5709 0,0078863 -
206141 -0,6898 0,0078863 Predicted RNA-binding protein involved in translational regulation
125526 -0,8251 0,0078952 -
57012 -0,6624 0,0078952 Zinc-containing alcohol dehydrogenase
212105 -0,5843 0,0079197 -
39515 -0,518 0,0079197 Ras small GTPase, Rab type
38420 -0,6268 0,0079477 #N/A
211639 -0,5397 0,0079537 -
39623 -0,6104 0,0079706 -
50918 -0,7667 0,0079891 Putative Major facilitator superfamily, Synaptic vesicle transporter SVOP and related transporters
197549 -0,65 0,0079891 Sugar (ANd other) transporter
206266 0,7908 0,0080025 Cytochrome P450

177
52540 -0,4651 0,0080031 related to UV-endonuclease Uve1p/UVDE
54168 -0,6257 0,0080399 -
208805 -0,6066 0,0080399 20S proteasome subunit
40660 -0,6589 0,0080399 Heterokaryon incompatibility factor
36428 0,8745 0,0080526 -
182156 -2,1027 0,0080546 endopolygalacturonase
56770 -0,8861 0,0080569 Peptidase S16
209757 -0,5108 0,0080943 -
55881 -0,4788 0,0080943 -
52528 -0,492 0,0080992 Fungal transcriptional regulatory protein,
214383 -0,493 0,0080992 saccharopine dehydrogenase/Lysine-ketoglutarate reductase
54759 -0,4563 0,0081252 Regulator of Rac1, required for phagocytosis and cell migration
179884 -0,4554 0,0081266 Protein kinase
212928 -0,7208 0,0081447 Multidrug/pheromone exporter,
36048 -1,6906 0,0081614 -
173077 -0,7185 0,0081614 Dephospho-CoA kinase
212230 -0,6563 0,0081715 AAA ATPase
175156 -0,6583 0,0081715 #N/A
214151 -0,3948 0,0081901 Protein kinase
202206 -0,5182 0,0081929 Gamma-glutamyl phosphate reductase
137276 -1,0763 0,0082415 Hypothetical 26S proteasome regulatory complex,
131354 -0,8097 0,0082415 #N/A
51304 -0,5081 0,0082437 Might be involved in signal transduction
132816 1,4498 0,0082437 #N/A
55386 -0,7056 0,0082787 Sulfatase
183268 -0,5185 0,0083091 Hypothetical peroxisomal membrane anchor protein
174945 -1,0837 0,0083091 Major facilitator superfamily
53388 -0,596 0,0083091 #N/A
49658 -0,5298 0,0083483 Adenosine/AMP deaminase
56504 -0,4478 0,0083507 Hypothetical protein with RCC1 domain
207003 -0,5273 0,0083691 Lysine-ketoglutarate reductase/saccharopine dehydrogenase
205904 0,5634 0,0083871 Haloacid dehalogenase-like hydrolase
37516 -0,4506 0,0084023 Hypothetical Cytochrome P450 monooxygenase
206311 0,5449 0,0084024 -
37580 -0,5312 0,0084024 -
52883 -0,6025 0,0084024 Hypothetical subunit of the 20S proteasome
40740 -0,662 0,008419 Hypothetical Short-chain dehydrogenase
143268 -0,4912 0,008427 -
54541 -0,8995 0,008427 Candidate oxidoreductase, Short-chain dehydrogenase/reductase

178
47288 -0,4679 0,0084301 putative Translation initiation factor 2B, epsilon subunit (eIF-2Bepsilon/GCD6) Translation, ribosomal structure and biogenesis
173677 -1,3046 0,0084301 #N/A
57395 -0,6145 0,0084351 Glycosyl transferase, family 39
52243 -0,605 0,0084351 Uncharacterized conserved protein
206569 -0,6175 0,0084847 Hypothetical DNA polymerase alpha, catalytic subunit
36961 -0,6881 0,0084996 #N/A
42169 -1,0039 0,008529 -
54665 -0,556 0,0085346 Splicing coactivator SRm160/300
186504 -2,081 0,0085349 Hypothetical glyceraldehyde 3-phosphate dehydrogenase; EC 1.2.1.12
52684 -0,8651 0,0085349 Predicted carbohydrate kinase
175936 0,4074 0,0085451 Naringenin-chalcone synthase
213924 -0,4644 0,0085534 -
43391 -0,4815 0,0085534 Dehydrogenase E1 component
177220 -1,054 0,0085534 hypothetical protein containing Zn-finger, C2H2 type domain
193097 -0,571 0,0085534 Major facilitator superfamily
39613 -1,1182 0,0085534 putative extracellular GH afmily 3 beta-glucosidase
187714 -0,4415 0,0085627 -
207338 -0,4749 0,0085653 -
42387 -0,655 0,0085653 -
44000 -0,9089 0,0085653 hypothetical Isochorismatase hydrolase
49801 -0,8008 0,0085653 hypothetical oxidoreductase (qutH A. nidulans)
175768 -0,9791 0,0085677 HORMA domain
57265 -1,3576 0,0085836 gatA, 4-aminobutyrate aminotransferase
172548 -0,5687 0,0086135 -
170122 0,5536 0,0086261 Predicted BRCT domain protein
54584 0,7503 0,0086734 Candidate ornithine decarboxylase (EC 4.1.1.17)
35611 -2,3318 0,0086773 -
37775 -0,5861 0,008691 hypothetical protein containing Zn-finger, C2H2 type domain
53941 -0,4662 0,0086983 -
50378 -1,5044 0,0086983 candidate beta-mannanase, GH family 5 mannan endo-1,4-beta-mannosidase
177314 -0,5436 0,0086983 Initiation factor 3
48790 -0,608 0,0086983 Major facilitator superfamily
174810 -0,5198 0,0086983 putative extracellular protein with glycoside transferase motif
57243 -0,9047 0,0087011 Hypothetical aldehyde dehydrogenase (EC 1.2.1.3).
44232 -0,4531 0,0087011 #N/A

179
172988 -0,8882 0,0087416 Hypothetical allantoicase. These proteins allow the use of purines as secondary nitrogen sources in nitrogen-limiting conditions through the reaction: allantoate + H(2)0 = (-)-ureidoglycolate + urea.
55991 -0,5121 0,0087513 papA, Prolyl aminopeptidase papA (EC 3.4.11.5)
43602 -0,6625 0,0088503 hypothetical endoribonuclease
121960 -0,4101 0,0088619 Predicted E3 ubiquitin ligase
200706 -0,6369 0,0088674 -
175143 0,5451 0,0088796 Transcription factor with Homeobox domains
43932 -1,6682 0,0088805 -
197291 -0,5198 0,0088896 SNAP-25 (synaptosome-associated protein) component of SNARE complex
205921 -0,6154 0,0088926 FKBP-type peptidyl-prolyl cis-trans isomerase
171062 -0,6144 0,0089139 -
206713 -0,4832 0,0089269 -
123758 -0,649 0,0089489 -
127170 0,8154 0,0089489 -
49473 -0,4695 0,0089489 -
130344 -0,4508 0,0089489 Fungal specific transcription factor
134428 -0,5045 0,0089489 MT3/SUMO-activating complex, AOS1/RAD31 component
51952 -0,9238 0,0090411 -
170709 -1,1604 0,0090609 Aldehyde dehydrogenase
208150 1,1423 0,0090609 FAD-dependent pyridine nucleotide-disulphide oxidoreductase
196499 -0,8318 0,0090609 Major facilitator superfamily
194059 -0,5299 0,0090609 related to acetamidase C (EC 3.5.1.4). Looks like it is actually two genes with different activities.
207426 0,7339 0,0090609 #N/A
53540 -3,269 0,0090854 putative thioredoxin with signal peptide domain
125165 0,6386 0,0091176 Hypothetical protein with GAT domain
174132 -0,9324 0,0091283 #N/A
191974 -1,2458 0,009156 #N/A
36465 -0,5559 0,0091719 hypothetical protein with predicted histone-fold; KOG Class: Transcription; KOG Id: 0871; KOG description: Class 2 transcription repressor NC2, beta subunit (Dr1)
210734 -0,489 0,009178 hypothetical protein with predicted histone deacetylase domain, which catalyses the removal of acetyl group of acetylated lysine residues in histones; KOG Class: Chromatin structure and dynamics; KOG Id: 1343; KOG Description: Histone deacetylase complex, catalytic component HDA1
38906 -0,6519 0,0091804 -

180
211661 2,184 0,0091931 Candidate malic oxidoreductase (EC 1.1.1.40)
49499 -1,1211 0,0091931 #N/A
53870 -0,4884 0,0091952 -
209685 -1,0517 0,0092108 Acyl-CoA dehydrogenase
199877 -0,5451 0,0092108 hypothetical WD-40 repeat protein and G-protein beta, normally coordinating multi-protein complex assemblies; KOG Class: Chromatin structure and dynamics; KOG Id: 1009; KOG Description: Chromatin assembly complex 1 subunit B/CAC2 (contains WD40 repeats)
118601 -0,682 0,0092108 Non-ribosomal peptide synthetase
35902 -0,5433 0,0092181 Fungal specific transcription factor
206802 -0,5899 0,0092181 Serine/threonine protein kinase
143961 -0,4405 0,0092332 -
180963 -0,6911 0,0092404 #N/A
188497 1,3049 0,0092417 Fungal specific transcription factor
206723 -0,7247 0,0092643 -
38226 -0,8083 0,0092643 Related to Geranylgeranyl pyrophosphate synthase
176123 -0,5478 0,0092795 -
174968 -0,6503 0,0092812 -
52722 -0,6453 0,0094015 Predicted membrane protein
202692 -0,4412 0,0094051 enolase, phosphopyruvate hydratase activity
208481 -0,4926 0,0094093 Methionyl-tRNA synthetase
51711 -0,4203 0,0094379 adB. Almost identical to E. nidulans adenylosuccinate synthase (adB) (EC 6.3.4.4)
208323 -0,4486 0,009471 -
52849 -0,62 0,009471 -
36513 -0,5658 0,009471 Peptidase S26B, eukaryotic signal peptidase
187248 -0,4063 0,0094751 -
190481 -0,5734 0,0094928 AMP-dependent synthetase and ligase
55412 -0,6513 0,0095368 F-actin capping protein, beta subunit
123450 0,7574 0,0095368 hypothetical neutral amino acid permease
208283 0,689 0,0095406 Candidate S-adenosylmethionine synthetase (metK)
43993 -0,4326 0,0095771 Fungal specific transcription factor
42106 -0,7464 0,0095942 Cytochrome P450
142667 -1,0826 0,0096531 Hypothetical heterokaryon incompatability factor
44808 -1,2736 0,0097099 Acetyl-CoA acetyltransferase
54610 -0,912 0,0097452 Histidine kinase
55633 -0,5102 0,0097499 (gsdA) Glucose 6-phosphate 1-dehydrogenase (EC 1.1.1.49)
36158 -0,5478 0,0097635 Predicted mitochondrial carrier protein
192623 -0,6922 0,0097687 Hypothetical DNA helicase
205450 -0,6408 0,0097746 -

181
40314 -0,476 0,0097746 -
213355 -0,5893 0,0097746 hypothetical protein with cupin region; KOG Class: Chromatin structure and dynamics; KOG Id: 2132; KOG description: Uncharacterized conserved protein, contains JmjC domain
53688 -0,7044 0,0097746 Zinc-binding oxidoreductase
190111 -0,6421 0,0097751 -
51685 0,6101 0,0097908 Related to Schizosaccharomyces pombe asparaginase (EC 3.5.1.1)
54383 -0,6327 0,0097908 Splicing coactivator SRm160/300, subunit SRm300
53188 -0,483 0,0098037 #N/A
46769 -0,5786 0,009828 -
47322 -0,4688 0,0098534 Clathrin adaptor complex small chain
211276 -0,6468 0,0098534 Major facilitator superfamily
56137 -0,3994 0,0098534 #N/A
179474 -0,3638 0,0099051 Hypothetical RNA lariat debranching enzyme
56389 -0,9262 0,0099636 alpha/beta hydrolase fold
207689 -0,5666 0,0099636 Peptidase M20
50103 -0,8887 0,0099701 Hypothetical, Nucleolar GTPase/ATPase
52545 -0,4683 0,0099701 RNA recognition motif. (a.k.a. RRM, RBD, or RNP domain)
214261 0,5719 0,0099848 two-component signal transduction system
35670 -0,3706 0,0099912 GCN5-related N-acetyltransferase
54817 0,6842 0,0100025 Hypothetical oligopeptide transporter
40903 -0,9892 0,0100025 SAM (and some other nucleotide) binding motif
54174 -1,2612 0,0100491 Dihydroxy-acid dehydratase
207962 -0,5391 0,0100491 Splicing coactivator SRm160
129033 -0,5685 0,0100491 Transcription factor MEIS1 and related HOX domain proteins
57100 -0,443 0,0101129 Mitochondrial carrier protein
185646 -0,9495 0,0101574 6-phosphogluconate dehydrogenase, NAD-binding
43791 2,7969 0,0101623 Generic methyltransferase
190965 -0,6688 0,0101753 -
55306 -1,053 0,0101753 Aminotransferase class-III
172476 -0,5712 0,0101921 hypothetical protein containing fungal specific transcription factor domain.
209771 -0,7669 0,0102033 -
36822 -0,6444 0,0102227 Hypothetical regulatory subunit of the 20S preoteasome
182862 -0,8246 0,010235 Zinc-containing alcohol dehydrogenase
180549 3,8847 0,0102356 -
134215 -0,484 0,0102547 -
174018 -0,5009 0,0102547 -
38927 -0,7197 0,0102547 -

182
119238 -0,7684 0,0102547 Fungal Zn(2)-Cys(6) binuclear cluster domain
55665 1,6107 0,0102547 related to tripeptidyl peptidase
42852 0,7463 0,0102547 Survival protein SurE
133203 -1,119 0,0102865 -
47886 -0,4361 0,0103167 Predicted GTPase-activating protein
201858 -0,5334 0,0103312 H+-transporting two-sector ATPase
54341 -1,7371 0,0103449 hypothetical short chain dehydrogenase
38332 -0,6212 0,0103466 -
52406 -0,8487 0,0103466 Beta-ketoacyl synthase
49039 -0,489 0,0103518 Hypothetical protein containing Sec23/Sec24 domains involved in vesicle coating
130463 -0,6916 0,010361 Histone H3 (Lys9) methyltransferase SUV39H1/Clr4, required for transcriptional silencing
210285 -0,7883 0,010361 #N/A
55401 -0,5057 0,0103798 #N/A
52459 -0,4986 0,0104009 Hypothetical peptidase
204050 -1,4524 0,0104021 FAD binding domain
210951 1,8115 0,0104228 Glycine cleavage system P-protein
186686 -0,5658 0,0104228 hypothetical dihydrofolate reductase
212435 -0,4088 0,0104228 Nucleoside diphosphate kinase
120955 -0,6183 0,0104318 -
181202 -0,5998 0,0104671 -
211236 -0,404 0,0104792 Cysteinyl-tRNA synthetase
209244 -0,798 0,0105201 Oxidoreductase
182312 -0,5867 0,0105631 UreD urease accessory protein
38012 -0,8713 0,0105821 #N/A
142108 3,4986 0,0105832 -
46685 -0,7801 0,0106194 -
202289 -0,5803 0,0106207 -
53152 -1,8861 0,0106799 RNA polymerase II, large subunit
45923 -1,5781 0,0106799 #N/A
36078 -0,492 0,0106822 #N/A
176272 -0,9466 0,0106886 Flavin-containing monooxygenase
208837 -0,4953 0,010689 Aromatic-ring hydroxylase
196058 -0,4873 0,010689 Transcription factor/CCAAT displacement protein
42949 1,0194 0,0107052 -
42728 -0,6316 0,0107052 related to vacuolar ATP synthase subunit D
187949 -0,6619 0,0108122 Esterase/lipase/thioesterase
212936 -0,6623 0,0108132 short chain dehydrogenase
207667 -0,5708 0,0108291 Hypothetical RING finger protein with Zn-finger domain
180387 -0,5069 0,0108339 -
39667 1,3407 0,0108339 -
47229 1,6408 0,0108339 (phyB) phytase B

183
120468 -0,584 0,0108339 Fungal specific transcription factor
184932 -0,7517 0,0108339 hypothetical protein containing ferric reductase-like transmembrane component and helix-turn-helix, Fis-type domain components.
52427 -0,5306 0,0108339 Mitochondrial carrier proteins
210454 0,8834 0,0108339 Molecular chaperones mortalin/PBP74/GRP75, HSP70 superfamily
192184 -0,7663 0,0108339 oxidoreductase, Short-chain dehydrogenase/reductase
182597 -0,4831 0,0108339 Zn-finger transcription factor
36284 -0,5871 0,0109161 hypothetical protein containing cytochrome c heme-binding site and Zn-finger, C2H2 type domains
50675 -0,4874 0,0109431 hypothetical Decapping enzyme complex component
53159 -2,56 0,0109681 (cbhA) cellobiohydrolase A
37302 -0,5019 0,0109903 -
209239 -0,5587 0,0109927 -
38678 -0,6345 0,0110179 -
51875 1,1376 0,0110482 #N/A
56871 0,7644 0,0110904 Mitochondrial carrier proteins
211200 -0,4429 0,0110929 Snf7 family protein
54712 -0,5461 0,0111142 Nucleoside diphosphate-sugar hydrolase of the MutT (NUDIX) family
193012 -0,7867 0,0111308 Ubiquitin-protein ligase
177282 -0,9401 0,0111787 -
188806 -0,522 0,0112557 Acyl-CoA synthetase
191206 -0,7833 0,0112557 Aminoacyl-tRNA synthetase
214441 -0,4427 0,0112557 hypothetical. KOG: acetyl-CoA acetyltransferase
50680 -0,4768 0,0112617 hypothetical protein containing Zn-finger, C2H2 type domain
41703 -0,5637 0,0112711 GH family 88
127635 -0,5945 0,0112912 -
212507 0,5614 0,0112912 #N/A
53259 -0,5111 0,0113029 Hypothetical chitin synthase
40206 -0,9405 0,0113238 Hypothetical glutathione S-transferase
54380 -0,8783 0,0113764 -
119138 -0,8097 0,0114389 -
37044 -0,4399 0,0114397 Related to anti-silencing protein ASF1
37866 -0,4291 0,0114563 Predicted membrane protein
38375 -0,7243 0,0114645 Major facilitator superfamily
201896 -0,6075 0,0114706 Hypothetical Ubiquitin-specific protease
176012 -0,7738 0,0114721 -
187815 -0,7452 0,0114721 Major facilitator superfamily

184
36647 -0,7318 0,0114938 Lipocalin-related protein
50029 -0,5739 0,0115131 -
52629 -0,7018 0,0115131 -
175257 -0,9208 0,0115171 hypothetical protein with predicted MT-A70 and N-6 Adenine-specific DNA methylase; KOG Class: Transcription; KOG Id: 2356; KOG description: Transcriptional activator, adenine-specific DNA methyltransferase
194534 -0,4798 0,0115311 -
212637 -1,0898 0,0115311 hypothetical protein containing fungal specific transcription factor and fungal transcriptional regulatory protein domains.
36075 -0,8815 0,0115311 LeaA homologue, regulator of terrequinone A secondary metabolism
214786 -0,6095 0,0115347 -
35726 0,7348 0,0115347 -
136869 -0,4561 0,0115347 hypothetical lysin. Extracellular. Peptidoglycan-binding domain and peptidase-like domain
42779 -0,4397 0,011539 26S proteasome regulatory complex
210577 -0,6227 0,011539 #N/A
54258 -0,5484 0,0115466 -
213757 -0,6399 0,0115466 Gamma-glutamyltranspeptidase
212893 -0,979 0,0115466 Glycoside hydrolase
180624 -0,8703 0,011549 -
170909 -0,7199 0,0115507 Eukaryotic protein of unknown function DUF846
193056 -0,4512 0,0115659 -
183145 -0,5227 0,0115659 Lactate/malate dehydrogenase, NAD dependent
184264 -2,0293 0,0115855 #N/A
121537 -0,5399 0,0116437 -
46219 0,4839 0,0116437 Monooxygenase
52354 -0,7295 0,0116494 Nucleolar GTPase/ATPase
197907 -0,4683 0,011679 SNARE protein
173769 -0,4678 0,011698 -
185285 -0,897 0,0117105 #N/A
50094 0,6243 0,0117217 NmrA-like, regulation of nitrogen utilization
211485 0,9443 0,0117641 Acetylglutamate kinase
56699 -0,4938 0,0117822 -
179141 -1,0406 0,0118634 Fungal specific transcription factor
123805 -0,8413 0,0119029 Predicted seven transmembrane receptor - rhodopsin family
197786 -0,5892 0,0119062 (dapB) dipeptidylpeptidase
185351 -0,7158 0,0119077 Flavonol reductase/cinnamoyl-CoA reductase
192461 -0,6171 0,0119203 #N/A
122612 -0,5324 0,0120081 Major facilitator superfamily

185
123645 -0,579 0,0120095 Hypothetical GCN5-related N-acetyltransferase
209660 -0,7145 0,0120313 SWI-SNF chromatin-remodeling complex protein
56675 -0,5686 0,0120451 Ubiquitin-conjugating enzyme
128333 -0,5853 0,0120803 -
56552 -0,4335 0,0120928 Protein required for meiotic chromosome segregation
36722 -0,5431 0,0121006 -
48908 -0,5713 0,0121006 Fatty acid desaturase
185117 -0,4757 0,0121006 Hypothetical protein. Electronic annotation suggests pyridine nucleotide-disulphide oxidoreductase
209872 -0,8519 0,0121006 Peptidase M3A and M3B
54957 -0,483 0,0121006 Putative GroEL-like chaperone, ATPase
213011 -0,4489 0,0121105 -
42808 -1,246 0,0121105 -
184121 -0,9506 0,0121186 -
183780 -0,5283 0,0121218 -
193777 -0,8477 0,0121218 DEAD/DEAH box helicase
55417 -0,9542 0,0121246 Serine/threonine protein kinase, active site
203669 0,478 0,0121319 hypothetical 5-methyltetrahydropteroyltriglutamate--homocysteine S-methyltransferase
204514 -0,5687 0,0121319 Nucleotide excision repair factor NEF2, RAD23 component
184617 -0,5369 0,0121668 RTA1 like protein
42477 -0,5971 0,0121724 Peptidase
48719 -1,0054 0,0121724 Short-chain dehydrogenase/reductase
193822 -0,4585 0,0121956 -
181867 -0,5121 0,0122407 Cell division control protein/predicted DNA repair exonuclease
56311 -1,326 0,0122407 hypothetical Glucose-methanol-choline oxidoreductase
55364 -0,3909 0,0122407 Molecular chaperone Prefoldin
57291 0,5999 0,0122407 Serine/threonine protein kinase
173711 -0,4329 0,0122407 Short-chain dehydrogenase/reductase
187240 -0,5789 0,0122442 Iron/ascorbate family oxidoreductases
52377 2,2416 0,0122612 #N/A
47745 -0,5212 0,0122723 -
56446 -0,6395 0,0123165 #N/A
43911 -2,1269 0,0123415 -
46358 -0,7322 0,0123415 Hypothetical protein. May have catechol dioxygenase activity
202139 -0,9416 0,0123556 Ubiquitin-like protein
180084 -0,6187 0,0123704 -

186
51891 -0,4933 0,0123792 -
50979 -0,6122 0,0123792 related to alpha-L-arabinofuranosidase
38952 -0,6155 0,0123939 -
40181 -0,4731 0,0123959 -
39908 0,3603 0,0123959 #N/A
170612 -0,9362 0,0124776 -
171843 -0,4588 0,012497 -
48335 -0,4764 0,0125299 #N/A
49134 -0,38 0,0125369 Hypothetical hexokinase
47983 -0,5055 0,0125653 FAD-dependent oxidoreductase
184367 -0,8645 0,012578 -
212021 -1,0242 0,012578 Aldehyde dehydrogenase
42654 -0,6286 0,012578 hypothetical protein containing Zn-finger and Homeobox domains
46606 -0,4509 0,0125987 hypothetical protein containing glycoside hydrolase, family 76 and helix-turn-helix, AraC type domains
208428 -0,5336 0,0125987 Metallophosphoesterase
55469 -0,6269 0,0126103 FAD dependent oxidoreductase
202059 -0,8448 0,0126193 Isochorismatase hydrolase
202248 0,6493 0,0126299 -
125804 -0,5087 0,0126599 -
208898 1,2031 0,0126614 NADP/FAD dependent oxidoreductase
206461 -0,7716 0,0126614 Protein kinase
205576 -0,43 0,0126778 hypothetical. Interpro suggests RNA-binding
121829 -0,651 0,0127091 -
171442 -0,8991 0,0127091 -
39391 -0,4315 0,0127091 -
177726 -0,5543 0,0127164 -
212502 1,1854 0,0127185 Hypothetical nucleosome assembly protein
209012 -1,2025 0,0127185 Proteins containing the FAD binding domain
191298 -0,4722 0,0127442 Predicted aromatic-ring hydroxylase
189589 -0,4036 0,0127878 -
211065 -0,5836 0,0127878 #N/A
181089 -0,4603 0,0127893 Hypothetical peroxisomal NUDIX hydrolase
45086 -0,4374 0,0128194 ADP-ribosylation factor GTPase activator
214636 -0,5029 0,0128256 Metallophosphoesterase
44470 -0,5957 0,0128656 Fungal specific transcription factor
37157 1,515 0,0128829 #N/A
51355 -0,5983 0,0128998 -
135687 -0,6997 0,012988 -
207539 -0,6869 0,0129892 UBA/THIF-type NAD/FAD binding fold
212603 -0,6038 0,0130199 -
130523 -0,4619 0,0130383 FOG: Zn-finger

187
43045 -0,4454 0,013054 related to proteasome subunite beta-like protein
127476 -0,6674 0,0131298 Serine/threonine protein kinase
133870 1,1636 0,0131318 hypothetical alpha-1,6-mannanase. GH family 76
55704 -0,596 0,0131412 (tpsA) trehalose-6-phosphate synthase A
55193 -0,5471 0,0131807 -
41067 -0,5313 0,0131818 Predicted tubulin-tyrosine ligase
172596 -0,4325 0,0132269 -
119631 -0,5002 0,0132269 hypothetical translation repression protein
204381 -1,174 0,0132269 Voltage-gated shaker-like K+ channel, subunit beta/KCNAB
52445 -0,5432 0,0132435 -
52587 1,2585 0,0132918 related to extracellular acid phosphatase
42307 1,2319 0,0133163 Inorganic phosphate transporter
37491 -0,635 0,0133406 Hypothetical heterokaryon incompatibility factor
55560 1,1092 0,0133406 mannitol-1-phosphate 5-dehydrogenase
36360 -0,4712 0,0133416 CorA-like Mg2+ transporter protein
53539 -0,4723 0,0133423 -
213429 -0,5047 0,0133865 #N/A
56228 -0,573 0,0134116 -
42726 -0,415 0,0134636 -
180862 -1,4063 0,0134636 putative transmembrane GH family 47
141168 -0,4061 0,0134685 hypothetical protein
197881 -0,5229 0,0134685 #N/A
38583 -0,531 0,0135384 -
57253 -0,829 0,0135384 Ubiquitin-conjugating enzyme
41998 -0,7619 0,0135384 #N/A
205975 -0,4074 0,0135969 GTPase Rab11/YPT3, small G protein superfamily
54854 0,8 0,0136037 Inositol-3-phosphate synthase
194446 -0,462 0,0136075 GCN5-related N-acetyltransferase
212783 -0,4392 0,0137237 putative GH family 47 mannosyl-oligosaccharide 1,2-alpha-mannosidase
192050 -0,602 0,0137358 Hypothetical Na+:Ca2+ antiporter
124948 -0,62 0,0137358 #N/A
208474 -0,4491 0,0137864 Phospholipid methyltransferase
49153 -1,1814 0,0138252 Cytochrome P450
51718 -0,4814 0,0138365 hypothetical protein with Zn-finger domain
205031 -0,3773 0,0138557 -
48569 -0,4035 0,0138881 -
43342 -0,9091 0,0139038 putative transmembrane GH family 31
135359 -0,606 0,0139052 -
184568 0,4679 0,0139492 -
211509 -0,5706 0,0139492 Fungal specific transcription factor
192658 -0,6104 0,0139492 #N/A

188
39581 -0,8368 0,0139715 Peptidase C19, ubiquitin carboxyl-terminal hydrolase 2
174932 -0,6089 0,0139808 -
47271 1,5524 0,0139808 Malonyl-CoA:ACP transacylase
53035 -0,4575 0,0139808 Phosphoribulokinase/uridine kinase
209919 -0,4477 0,0139808 Tryptophanyl-tRNA synthetase
51478 -0,5352 0,0140231 (faeB) feruloyl esterase
129504 -0,6675 0,0140231 AAA+-type ATPase
214391 -0,4862 0,0140588 Permease of the major facilitator superfamily
41387 -0,6792 0,014077 -
52120 -0,5058 0,0141023 -
194528 -0,5055 0,0141103 -
207758 -0,4459 0,0141103 26S proteasome regulatory complex, subunit PSMD9
51189 -0,6616 0,014161 -
122135 -0,4442 0,0141918 -
39523 -0,4802 0,0141974 -
52852 -1,6378 0,0141974 Flavin-containing monooxygenase
202700 -0,3894 0,0141974 Multifunctional chaperone (14-3-3 family)
188863 -0,5888 0,0141974 Related to S. cerevisiae phenylacrylic acid decarboxylase (EC 4.1.1.-)
178744 -0,8466 0,0142075 Hypothetical Metal-dependent phosphohydrolase, HD region
191589 -0,6367 0,0142155 -
205944 -0,3709 0,0142155 -
198713 -0,5405 0,0142155 Ribonuclease II
213441 0,8864 0,0142155 Squalene monooxygenase
54682 -0,5485 0,0142806 -
213502 5,0109 0,014297 Dihydroxy-acid dehydratase
206308 -0,6303 0,0143251 Hypothetical molybdenum cofactor biosynthesis protein
37795 -0,5107 0,014341 -
214849 -0,9991 0,0143508 FAD-dependent pyridine nucleotide-disulphide oxidoreductase
50815 -0,4059 0,0143669 Hypothetical UMP-CMP kinase,phosphotransferase activity, phosphate group as acceptor
188780 -1,2618 0,0143924 Amino acid/polyamine transporter
47261 -0,421 0,0144166 related to Beta-1,4-mannosyltransferase
185545 -0,6236 0,0144204 -
52474 0,9465 0,0144441 FOG: RRM domain
128406 -0,4357 0,0144441 #N/A
129554 -0,5048 0,0144543 Translation elongation factor 2
181743 -0,8426 0,0144797 hypothetical short chain dehydrogenase
172938 -0,4344 0,0144915 -
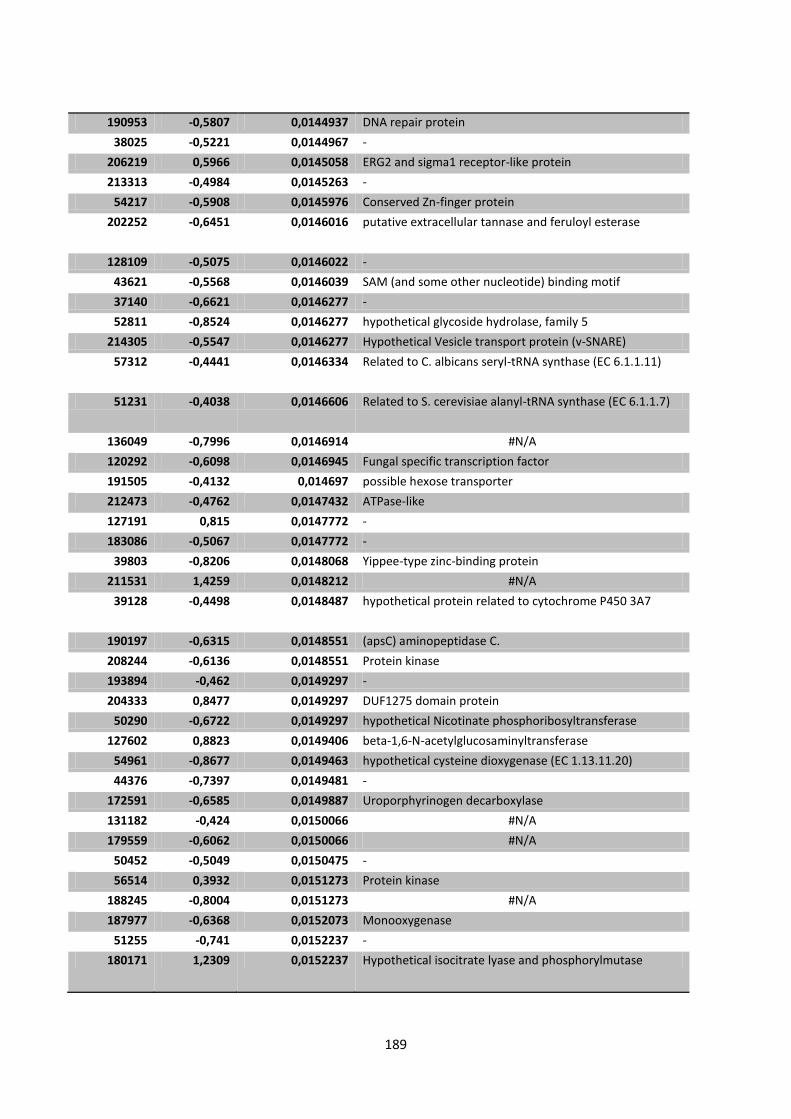
189
190953 -0,5807 0,0144937 DNA repair protein
38025 -0,5221 0,0144967 -
206219 0,5966 0,0145058 ERG2 and sigma1 receptor-like protein
213313 -0,4984 0,0145263 -
54217 -0,5908 0,0145976 Conserved Zn-finger protein
202252 -0,6451 0,0146016 putative extracellular tannase and feruloyl esterase
128109 -0,5075 0,0146022 -
43621 -0,5568 0,0146039 SAM (and some other nucleotide) binding motif
37140 -0,6621 0,0146277 -
52811 -0,8524 0,0146277 hypothetical glycoside hydrolase, family 5
214305 -0,5547 0,0146277 Hypothetical Vesicle transport protein (v-SNARE)
57312 -0,4441 0,0146334 Related to C. albicans seryl-tRNA synthase (EC 6.1.1.11)
51231 -0,4038 0,0146606 Related to S. cerevisiae alanyl-tRNA synthase (EC 6.1.1.7)
136049 -0,7996 0,0146914 #N/A
120292 -0,6098 0,0146945 Fungal specific transcription factor
191505 -0,4132 0,014697 possible hexose transporter
212473 -0,4762 0,0147432 ATPase-like
127191 0,815 0,0147772 -
183086 -0,5067 0,0147772 -
39803 -0,8206 0,0148068 Yippee-type zinc-binding protein
211531 1,4259 0,0148212 #N/A
39128 -0,4498 0,0148487 hypothetical protein related to cytochrome P450 3A7
190197 -0,6315 0,0148551 (apsC) aminopeptidase C.
208244 -0,6136 0,0148551 Protein kinase
193894 -0,462 0,0149297 -
204333 0,8477 0,0149297 DUF1275 domain protein
50290 -0,6722 0,0149297 hypothetical Nicotinate phosphoribosyltransferase
127602 0,8823 0,0149406 beta-1,6-N-acetylglucosaminyltransferase
54961 -0,8677 0,0149463 hypothetical cysteine dioxygenase (EC 1.13.11.20)
44376 -0,7397 0,0149481 -
172591 -0,6585 0,0149887 Uroporphyrinogen decarboxylase
131182 -0,424 0,0150066 #N/A
179559 -0,6062 0,0150066 #N/A
50452 -0,5049 0,0150475 -
56514 0,3932 0,0151273 Protein kinase
188245 -0,8004 0,0151273 #N/A
187977 -0,6368 0,0152073 Monooxygenase
51255 -0,741 0,0152237 -
180171 1,2309 0,0152237 Hypothetical isocitrate lyase and phosphorylmutase
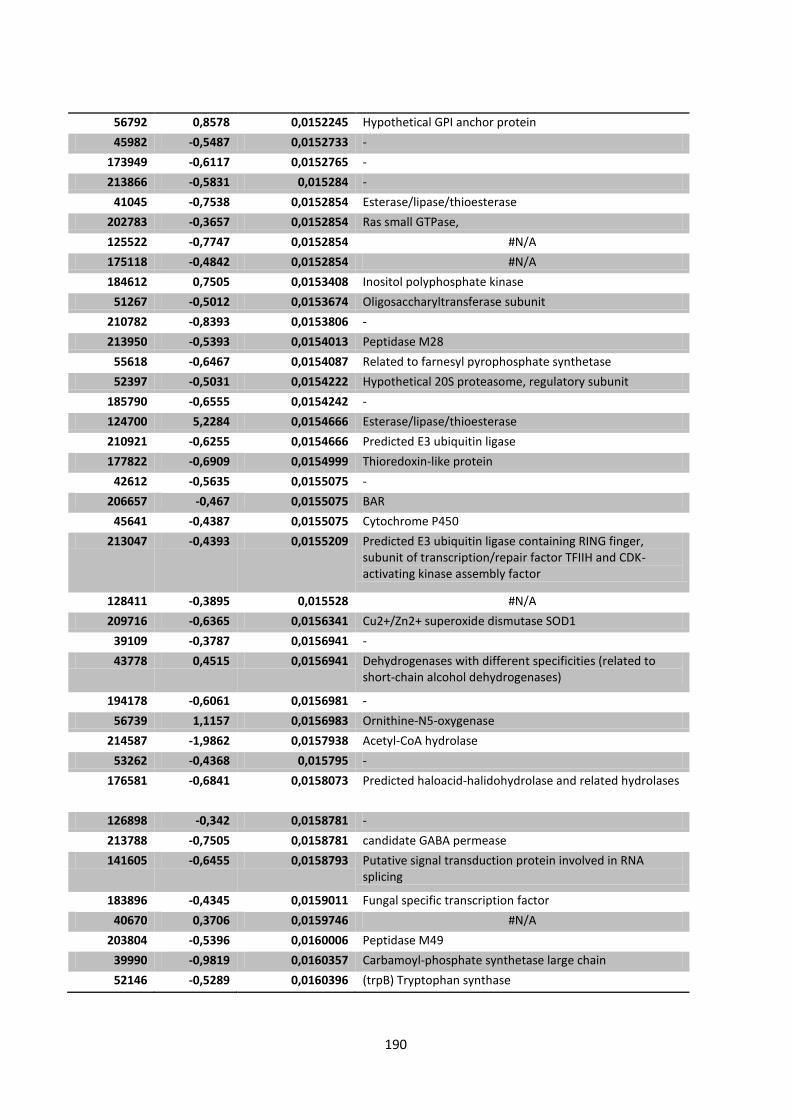
190
56792 0,8578 0,0152245 Hypothetical GPI anchor protein
45982 -0,5487 0,0152733 -
173949 -0,6117 0,0152765 -
213866 -0,5831 0,015284 -
41045 -0,7538 0,0152854 Esterase/lipase/thioesterase
202783 -0,3657 0,0152854 Ras small GTPase,
125522 -0,7747 0,0152854 #N/A
175118 -0,4842 0,0152854 #N/A
184612 0,7505 0,0153408 Inositol polyphosphate kinase
51267 -0,5012 0,0153674 Oligosaccharyltransferase subunit
210782 -0,8393 0,0153806 -
213950 -0,5393 0,0154013 Peptidase M28
55618 -0,6467 0,0154087 Related to farnesyl pyrophosphate synthetase
52397 -0,5031 0,0154222 Hypothetical 20S proteasome, regulatory subunit
185790 -0,6555 0,0154242 -
124700 5,2284 0,0154666 Esterase/lipase/thioesterase
210921 -0,6255 0,0154666 Predicted E3 ubiquitin ligase
177822 -0,6909 0,0154999 Thioredoxin-like protein
42612 -0,5635 0,0155075 -
206657 -0,467 0,0155075 BAR
45641 -0,4387 0,0155075 Cytochrome P450
213047 -0,4393 0,0155209 Predicted E3 ubiquitin ligase containing RING finger, subunit of transcription/repair factor TFIIH and CDK-activating kinase assembly factor
128411 -0,3895 0,015528 #N/A
209716 -0,6365 0,0156341 Cu2+/Zn2+ superoxide dismutase SOD1
39109 -0,3787 0,0156941 -
43778 0,4515 0,0156941 Dehydrogenases with different specificities (related to short-chain alcohol dehydrogenases)
194178 -0,6061 0,0156981 -
56739 1,1157 0,0156983 Ornithine-N5-oxygenase
214587 -1,9862 0,0157938 Acetyl-CoA hydrolase
53262 -0,4368 0,015795 -
176581 -0,6841 0,0158073 Predicted haloacid-halidohydrolase and related hydrolases
126898 -0,342 0,0158781 -
213788 -0,7505 0,0158781 candidate GABA permease
141605 -0,6455 0,0158793 Putative signal transduction protein involved in RNA splicing
183896 -0,4345 0,0159011 Fungal specific transcription factor
40670 0,3706 0,0159746 #N/A
203804 -0,5396 0,0160006 Peptidase M49
39990 -0,9819 0,0160357 Carbamoyl-phosphate synthetase large chain
52146 -0,5289 0,0160396 (trpB) Tryptophan synthase

191
191511 0,9221 0,0160726 related to GH family 12 xyloglucan-specific endo-beta-1,4-glucanase
35899 -0,4498 0,0160981 hypothetical protein; KOG Class: Chromatin structure and dynamics;
50490 -0,5143 0,0161068 hypothetical DNA mismatch repair protein
55543 -0,4473 0,0161075 Metal-dependent phosphohydrolase, HD region
184571 -0,3674 0,0161275 Pre-mRNA spilicing factor
204276 -0,5285 0,0161392 Zinc-containing alcohol dehydrogenase
49321 -0,5105 0,0161643 -
38982 -0,5225 0,0162245 AAA ATPase
197446 -0,829 0,0163077 candidate GH family 18 endo-chitinase
178461 -0,5175 0,0163562 Editing needed. This protein is an artificial hybrid of a purine-nucleoside phosphorylase activity and a 6-phosphogluconate dehydrogenase. In the CBS 513.88 annotation, these are annotated as An11g06110 and An11g06120 respectively.
185698 -0,8011 0,0163651 -
192720 -0,5912 0,0163651 -
53082 0,5989 0,0163651 Related to histone 1 protein, H1, with a predicted H1/H5 domain, histone linker N- terminal, and winged helix DNA binding. The protein is essential for chromatin stucture and links nucleosomes in higher order structures; KOG Class: Chromatin structure and dynamics; KOG Id: 4012; KOG Description: Histone H1
178219 -0,4059 0,0163842 Hypothetical Metal-dependent phosphohydrolase, HD region
214460 -0,6372 0,0164006 Serine carboxypeptidase
54525 -0,6396 0,0164829 Ornithine aminotransferase otaA (EC 2.6.1.13)
53737 -0,5879 0,016488 Phox-like
206602 -0,4663 0,016615 Triosephosphate isomerase
184509 -2,5597 0,0166591 Hypothetical methyltransferase. No sequence similarity is found to identified proteins
209439 0,7237 0,0166747 candidate HMG-CoA reductase
135107 -0,5474 0,016689 Hypothetical Actin-binding protein
56298 -0,8598 0,0167382 Putative mannosyl-oligosaccharide glucosidase, GH family 63
214568 -0,4849 0,0167741 Extracellular protein SEL-1 and related proteins
43508 -0,3848 0,0167762 -
126465 -0,6908 0,0167855 -
211367 -0,6254 0,0167855 hypothetical protein containing Zn-finger, C2H2 type domain
123018 -0,5359 0,0167922 -
54489 1,1435 0,0168308 Hypothetical. Contains aspartic peptidase domain

192
170972 -0,6533 0,0168367 -
54558 -0,5916 0,0168481 Conserved WD40 repeat-containing protein AN11
55916 -1,3022 0,016912 Hypothetical Acyl-CoA dehydrogenase
170688 -0,5702 0,0169342 -
170933 -0,519 0,0169342 FAD binding domain
180300 -0,5261 0,0169498 Uncharacterized conserved protein, contains WD40 repeats
54717 0,706 0,0169583 -
213045 -0,4194 0,0169589 Lipid phosphate phosphatase and related enzymes of the PAP2 family
55218 -0,8626 0,017003 -
178675 -0,8719 0,0170369 Autophagy protein Apg4, cystein proteinas
120801 -0,8532 0,0170713 Fungal specific transcription factor
43221 1,7789 0,0171693 Amino acid transporters
129315 -0,725 0,0171693 Protein kinase
57027 -0,829 0,0171881 (phyA) Multiple inositol polyphosphate phosphatase phyA
208780 -0,6384 0,0172219 Protein kinase
127358 -0,492 0,0172248 -
55132 0,5868 0,0172769 -
183278 -0,8664 0,0172855 Related to tryptophan synthase. Shows similarity to N. crassa tryptophan synthase of N. crassa
186889 -0,6038 0,0172999 -
212265 -1,3601 0,0173265 Hypothetical WW domain protein. Probable involved in signalling cascade
187460 -0,4392 0,0173909 -
44254 0,7609 0,0174995 Acyl-CoA thioesterase
38272 -0,8608 0,0174995 #N/A
126043 -0,4095 0,0175197 -
175980 -0,6322 0,0175197 Predicted NUDIX hydrolase FGF-2 and related proteins
209366 -0,5279 0,0175903 -
41882 -0,482 0,0176167 -
204610 0,6762 0,0176453 Ribosomal protein L7/L12
52503 -0,5996 0,0176794 Peptidase C19
214632 -1,4904 0,0177023 candidate acetyltransferase
44332 0,337 0,0177156 -
56903 -0,4526 0,0177619 Eukaryotic translation initiation factor
210529 -0,5014 0,0177975 -
52657 -0,4244 0,0177993 Actin/actin-like
48146 -0,3855 0,0177993 endonuclease
39592 -0,3833 0,0177993 Polyadenylate-binding protein (RRM superfamily)
172732 -0,3433 0,0178049 -

193
119127 -0,4264 0,0178347 Putatively involved in growth development in niger
52588 -1,1627 0,0179003 -
42186 1,2517 0,0179059 -
49730 -0,3137 0,0179059 -
205206 -0,7164 0,0179059 Hypothetical mitochondrial carrier protein
44913 1,31 0,0180295 hypothetical extracellular mon- and diacylglycerol lipase
196101 -0,5318 0,0180305 Formyl transferase
183937 -0,6676 0,0180305 Hypothetical biphenyl-2,3-diol 1,2-dioxygenase III-related protein. Glyoxalase/Bleomycin resistance protein
176433 -0,7253 0,0180594 Fungal transcriptional regulatory protein
210871 -0,7246 0,0180729 3-hydroxyacyl-CoA dehydrogenase
48970 -0,5449 0,0180855 -
187283 -0,4933 0,0180981 SNF2-related
44497 0,9995 0,0181402 Hypothetical mitochondrial carrier protein
184331 -0,5341 0,018141 -
119367 -0,8086 0,018141 Endoplasmic reticulum protein EP58
208382 -0,3643 0,018141 Predicted GTP-binding protein (ODN superfamily)
191710 0,8223 0,0181681 Candidate siderophore iron transporter mirB
193981 -0,5956 0,0181681 Putative pyruvate decarboxylase joined with TPR repeat containing protein
40489 -0,3888 0,018192 Related to C. albicans argininosuccinate synthase (EC 6.3.4.5)
174185 -0,5395 0,0182022 -
48743 -0,5679 0,0182078 Hypothetical enoyl-CoA hydratase
206200 -0,4073 0,0182083 -
55395 0,7414 0,0182165 -
51930 -0,9942 0,0182165 Gen A8; hypothetical Cyanovirin-N protein
127896 -0,5679 0,0182354 -
187304 0,5724 0,0183371 Ergosterol biosynthesis ERG4/ERG24 family
56159 -0,4881 0,018352 Related to phenylalanine-tRNA ligase of Candida albicans
40161 -1,463 0,0184896 -
54664 -0,4923 0,0184896 G-like protein containing WD-40 repeat
44379 -0,5974 0,0184896 #N/A
45801 -0,4153 0,0185166 endo-1,6-beta-D-glucanase
203335 -0,8797 0,0185966 -
193171 -0,4634 0,0186106 AAA ATPase
185892 -0,5632 0,0186179 -
52532 0,8774 0,0186179 -
36527 -0,3227 0,0186946 Predicted membrane proteins, contain hemolysin III domain

194
128909 -0,5092 0,0186946 #N/A
172198 -0,4235 0,0187825 putative cytochrome P450 monooxygenase
44289 -0,5742 0,0187986 -
54635 -0,327 0,0188333 -
54785 -0,8495 0,0188461 -
56673 0,3962 0,0188461 Hypothetical fumarate hydratase
121237 -0,4333 0,0188462 deaminase-reductase
206019 -0,5403 0,0188548 -
51724 -0,4152 0,0188885 Hypothetical Molecular chaperone Prefoldin
211094 1,5383 0,0188885 #N/A
56167 -0,3566 0,018916 TRIHA 14-3-3 protein homologue, putative kinase regulator
188174 -0,652 0,018916 #N/A
56880 -0,5003 0,0189391 srpA, Signal recognition particle, subunit Srp54
42184 -0,4505 0,018984 pgaX Exopolygalacturonase precursor (ExoPG) (Galacturan 1,4-alpha-galacturonidase)
51703 -0,3356 0,018986 Serine/threonine protein phosphatase
198703 -0,5056 0,0190072 Putative cargo transport protein
136823 1,3165 0,0190084 -
41300 -0,546 0,0190084 AAA ATPase
126948 -0,6182 0,0190108 -
40553 -0,525 0,0190108 -
209252 -0,5831 0,0190108 Autophagy related protein, involved in membrane trafficking
50444 -0,9466 0,0190108 Serine/threonine protein kinase Atg1
193909 -0,6238 0,0190971 Ureidoglycolate hydrolase
49922 -0,6834 0,0191011 -
37998 -0,611 0,0191109 Hypothetical protein. Is very likely associated with degradation of aromatic compounds based on Pfam and protein similarity
178353 -0,5093 0,0191167 Hypothetical N-methyltransferase
211840 -0,3632 0,0192739 #N/A
129843 -0,4292 0,0193478 -
189639 -0,4057 0,0193478 -
53084 -0,3939 0,0193521 Ubiquitin-conjugating enzymes, 16 kDa
211053 -1,7665 0,0193783 (eglA) extracellular GH family 12 endo-beta-1,4-glucanase
50499 -0,3917 0,0193783 related to 2-deoxy-D-gluconate 3-dehydrogenase
170706 -0,4411 0,0194412 Fungal transcriptional regulatory protein
136701 -1,4672 0,0194819 SAM-dependent methyltransferases
210722 -0,3614 0,0194953 Zn-finger, C2H2 type
37368 -0,5519 0,0195868 #N/A
211085 0,5882 0,0195887 Got1-like protein
207249 0,6131 0,0196025 Cysteine synthase

195
175695 -0,562 0,0196154 -
174310 -0,3709 0,0196154 hypothetical protein contains SH3 adaptor domains
127054 -0,3237 0,0196199 -
206038 -0,7778 0,0196199 -
52257 -0,4041 0,0196199 Ankyrin repeat
206503 -0,4417 0,0196199 Arginyl-tRNA-protein transferase
133108 -0,5355 0,0196199 Hypothetical phospholipid scramblase
46473 -0,5608 0,0196199 hypothetical short chain dehydrogenase
214048 -0,4736 0,0196199 Ribosomal protein S2
187609 -0,3765 0,0196199 This protein does not have homology with proteins with confirmed asparginase activity
129928 -0,4027 0,0196199 WD40 repeat-containing protein
182820 -0,8444 0,0196199 #N/A
40734 -0,9227 0,0196849 Hypothetical aldehyde dehydrogenase. Specificity towards NAD or NADP is not deducible from sequence data
186933 -0,3974 0,019713 Inositol polyphosphate kinase
207532 -0,5739 0,019743 -
208463 -0,4381 0,019743 -
53949 -0,4178 0,019743 Major facilitator superfamily
51662 -0,8535 0,019743 #N/A
56215 1,5987 0,0197749 Hypothetical Hydroxymethylglutaryl-coenzyme A synthase
197516 -0,5641 0,0198083 Predicted translation product shares amino acid sequence similarity to the Saccharomyces cerevisiae REX2 gene product; an RNA exonuclease, required for U4 snRNA maturation; functions redundantly with Rnh70p in 5.8S rRNA maturation, and with Rnh70p and Rex3p in processing of U5 snRNA and RNase P RNA (yeast); member of RNase D family of exonucleases.
214458 -0,533 0,019837 -
213793 -0,7981 0,019837 candidate succinate-semialdehyde dehydrogenase
207899 -0,5802 0,0198528 Major facilitator superfamily
186766 -0,593 0,0198579 -
53856 -0,671 0,0198579 Protein phosphatase
137748 -0,7479 0,0198666 -
54260 -0,449 0,0199165 Hypothetical 20S proteasome, regulatory subunit
44770 -0,5904 0,019925 -
55578 -0,4769 0,019925 20S proteasome, A and B subunits
49967 -0,4819 0,019925 #N/A
181451 -0,9046 0,01993 Hypothetical 3-methylcrotonyl-CoA carboxylase, subunit beta

196
212768 -0,9261 0,0199552 Related to malic oxidoreductase from S. cerevisiae (EC 1.1.1.40). May be the mitochondrial isoenzyme of protein 211661.
48905 -0,4838 0,019972 Hypothetical biotin holocarboxylase synthetase/biotin-protein ligase
195992 -0,4654 0,0199798 Hypothetical cyclic-AMP phosphodiesterase
184507 -0,5847 0,0199817 -
172404 -0,4279 0,0200125 Predicted fumarylacetoacetate hydralase
40178 1,2935 0,0200367 #N/A
54960 -0,463 0,020059 Hypothetical Cyclin D-interacting protein GCIP
43853 0,4036 0,0200718 Zn-finger, C2H2 type
46716 -0,6187 0,0200852 -
53510 -1,1107 0,0201071 Predicted ATPase, nucleotide-binding
49747 -0,9178 0,0201233 SWI-SNF chromatin-remodeling complex protein
203471 -0,71 0,0201378 Thioredoxin-like protein
179558 -0,8629 0,0201524 -
47151 0,7494 0,0201551 NADP-dependent isocitrate dehydrogenase precursor [Aspergillus niger]
46109 0,3725 0,0201821 -
47998 -0,4775 0,0201961 hypothetical phosphotyrosyl phosphatase activator
207429 -0,3875 0,0201962 -
39998 -0,5556 0,0201962 Hypothetical subunit of oligosaccharyltransferase
137452 0,4186 0,0203054 #N/A
211114 -0,697 0,0203358 -
200589 -0,8738 0,0203424 8-amino-7-oxononanoate synthase (biotin synthesis)
126001 -1,0057 0,0203748 -
56715 0,901 0,0203748 Acetyl-CoA carboxylase
38745 0,648 0,0203748 Glycosyl transferase, family 28
38373 0,3847 0,0203748 hypothetical protein; KOG Class: Chromatin structure and dynamics
120610 -1,2591 0,0203748 #N/A
37444 -0,5873 0,0204995 Predicted cation transporter
52688 -1,6459 0,0205261 candidate endoglucanase
39172 -0,6179 0,0205521 Zinc-containing alcohol dehydrogenase
190278 -0,4672 0,020566 -
43224 -0,5227 0,0205966 Fungal transcriptional regulatory protein
210117 -1,1525 0,0206823 -
120073 -0,5319 0,0207189 Serine/threonine protein kinase
170638 -0,6354 0,0207556 -
208544 -0,6139 0,0207706 Candidate ribose 5-phosphate isomerase
44098 -0,5136 0,0207706 hypothetical mannose-6-phosphate isomerase
124393 -0,6861 0,0208178 Peroxisomal NUDIX hydrolase
128213 -0,4894 0,0208569 -

197
45715 -0,6541 0,0208569 #N/A
181698 -0,4655 0,0209694 Importin-beta
206270 -0,413 0,0209839 Hypothetical Signal recognition particle, subunit Srp68
184532 -1,6668 0,0210316 Hypothetical hydroxyacylglutathione hydrolase
50555 -0,416 0,0210316 Hypothetical Polyadenylate-binding protein (RRM superfamily
36289 -0,5153 0,0210771 -
57079 -0,4217 0,0210771 Hypothetical DnaJ domain protein
140813 -0,3593 0,0210771 Hypothetical. Mannosyltransferase ?
198766 -0,4708 0,0210771 Putative prefoldin chaperone
39867 0,7298 0,0211713 -
50689 0,8918 0,0211713 Arginine biosynthesis protein ArgJ
38587 1,9312 0,0211759 -
122978 -1,5876 0,0212087 hypothetical extracellular GH family 43 beta-gaclatosidase, exo-beta-1,3-galactanase
54662 0,457 0,0212087 hypothetical SNF5/SMARCB1/INI1 protein - a key component of SWI/SNF-class complexes; KOG Class: Chromatin structure and dynamics; KOG Id: 1649; KOG Description: SWI-SNF chromatin remodeling complex, Snf5 subunit
181144 0,3767 0,0212252 phytoene desaturase
181371 0,5947 0,0212562 Molecular chaperones HSP70
184712 -0,3385 0,0212873 -
38433 0,3292 0,0212873 #N/A
42345 -0,5953 0,0213081 Fungal transcriptional regulatory protein
47550 -0,3653 0,0213382 -
174157 -0,9925 0,0213382 Hypothetical alcohol dehydrogenase; EC 1.1.1.1
50466 1,0779 0,0213382 putative Prolyl 4-hydroxylase, alpha subunit
40469 -0,4695 0,0213644 Fungal specific transcription factor
51738 -0,5057 0,0213709 -
53542 -0,3726 0,021389 Isopenicillin N synthase
36569 0,436 0,0214562 -
207656 0,4442 0,021468 Hypothetical serine palmitoyltransferase
48523 -0,4544 0,0214969 -
199078 -1,1955 0,0215079 Atrazine chlorohydrolase/guanine deaminase
214066 -0,977 0,0215449 ABC transporter
174055 -0,3888 0,0215523 putative tRNA acetyltransferase,
41055 -0,3365 0,021603 Ras small GTPase, Ras type
55019 -0,7163 0,021608 -
201613 0,5528 0,0216117 pentatricopeptide repeat protein. FOG: PPR repeat
51046 -0,6437 0,0216213 -
40596 -1,1438 0,0216408 Aldehyde dehydrogenase

198
190566 0,3858 0,0216637 Predicted endoplasmic reticulum membrane protein Lec35
54270 -0,3997 0,0216637 Predicted translation initiation factor related to eIF-2B alpha/beta/delta subunits (CIG2/IDI2)
190990 0,6582 0,0217121 Branched-chain amino acid aminotransferase
212036 0,5145 0,0217155 Tyrosine specific protein phosphatase and dual specificity protein phosphatase
55758 -0,3904 0,0217542 Zn-finger, AN1-like
57211 -0,7593 0,0218091 putative cyclin possibly similar to Pcl6 or Pcl7
39106 0,4601 0,0218623 -
36749 -0,4294 0,0218623 Collagens (type IV and type XIII), and related proteins
177912 -0,5443 0,0218623 Protein kinase
35952 -0,6753 0,0218988 -
44220 -0,46 0,0218988 Mitochondrial inheritance and actin cytoskeleton organization protein
37719 -0,6134 0,0220667 Hypothetical aldehyde dehydrogenase (EC 1.2.1.3).
199982 -0,3994 0,0220846 -
136718 -0,3386 0,0220846 Protein kinase
174131 -0,5833 0,0221115 Protein kinase
44033 -0,3706 0,0221857 (apsA) Peptidase M1
143833 1,1139 0,022201 #N/A
120986 -0,436 0,0222849 Fungal specific transcription factor
211800 -0,733 0,0223062 -
53473 -0,5852 0,0223062 -
55586 -0,3466 0,0223296 Hypothetical Ketose/fructose-bisphosphate aldolase. Zn binding ?
51124 -0,4124 0,0223412 -
171996 -0,5493 0,0223412 beta-1,6-N-acetylglucosaminyltransferase, contains WSC domain
57101 0,4291 0,0223569 #N/A
201503 0,9615 0,0223572 NAD-cytochrome b5 reductase
133134 -0,6678 0,0223593 #N/A
56528 -0,6973 0,0223702 Hypothetical histidinol phosphatase. HMMPfam indicates this activity. No homology to confirmed histidinol phosphatases was found
208365 -0,518 0,0224078 #N/A
56422 -0,4113 0,0225081 -
179747 1,2982 0,022515 3-methyl-2-oxobutanoate hydroxymethyltransferase (Ketopantoate hydroxymethyltransferase).
182627 -0,5469 0,0225308 -

199
43297 -1,283 0,022567 Glyoxylate/hydroxypyruvate reductase (D-isomer-specific 2-hydroxy acid dehydrogenase superfamily)
37533 1,1633 0,0225986 Unknown. SignalP predicts Anchor
38538 -0,4169 0,0226799 -
207841 0,7393 0,0227867 -
55738 0,8672 0,0227867 Multifunctional pyrimidine synthesis protein CAD (pyrABCN)
55058 0,8709 0,0227867 Putative beta-1,6-N-acetylglucosaminyltransferase, contains WSC domain
189637 1,0922 0,0228226 -
47279 -0,6958 0,0228226 Autophagy protein Apg9
184767 -0,7859 0,0228226 Cystathionine beta-synthase and related enzymes
214413 -0,5594 0,0228303 Vacuolar protein sorting-associated protein
139245 0,945 0,0228811 PEP-utilising enzyme
127337 -0,4401 0,0229905 -
213051 -0,8411 0,0229905 Hypothetical Aldose 1-epimerase
57172 -1,2181 0,0230294 -
172234 -0,3603 0,0230707 #N/A
41359 0,5048 0,0230732 hypothetical protein; KOG Class: Chromatin structure and dynamics
213512 -0,7356 0,0230958 Aldo/keto reductase family proteins
132154 0,8485 0,0230958 Cytochrome P450
56896 -0,5452 0,0230958 Polyketide synthase
42051 -0,8331 0,0230971 -
208521 -1,7243 0,0230971 hypothetical FAD/FMN-containing dehydrogenase (COG0277)with transmembrane motif
138876 -0,8233 0,0231101 beta-mannosidase A
202801 0,3676 0,0231101 citA citrate synthase
142878 0,3424 0,0231101 Esterase/lipase/thioesterase
180383 -0,4444 0,0231101 Thiamine pyrophosphokinase
35859 -0,3652 0,0231421 Candidate Porphobilinogen deaminase
38568 -0,5584 0,0231421 Fungal transcriptional regulatory protei
214644 -0,5391 0,0231421 Putative phosphoinositide phosphatase
43609 -0,4171 0,0231653 -
54613 -0,3754 0,0231835 -
54093 -0,4693 0,0231835 Phosphofructokinase
39887 0,4483 0,0232083 -
55847 -0,5675 0,0232175 hypothetical V-ATP synthase
175113 -0,412 0,0232376 Predicted Yippee-type zinc-binding protein
175821 -0,5125 0,0232595 #N/A
181915 0,3498 0,0233587 NB-ARC / TPR repeat
47753 -1,0595 0,0233661 Hypothetical Metal dependent protein hydrolase

200
46369 -0,5931 0,0234282 hypothetical protein with predicted SET domain & TPR repeat; KOG Class: Chromatin structure and dynamics; KOG Id: 2084; KOG Description: Predicted histone tail methylase containing SET domain
38457 -0,5049 0,0234293 V-ATPase subunit C
170443 1,1843 0,0234962 Predicted transporter
181901 -0,4567 0,0236648 -
203304 -0,3159 0,0236648 -
188502 -0,4153 0,0236648 Polyketide synthase
40033 -0,3335 0,0236648 #N/A
199043 0,6751 0,0238171 ATP Citrate lyase
53574 0,5316 0,023881 Candidate carbamoyl-phosphate synthase
211968 -0,4676 0,0239158 Fungal specific transcription factor
41759 -0,4618 0,0239343 -
192051 -0,4661 0,0239392 Putative GTPase activating proteins
38327 1,1603 0,0239742 -
197079 0,672 0,0240274 #N/A
205486 -0,4609 0,0240592 Metallophosphoesterase
208393 -0,3703 0,0240864 Helix loop helix transcription factor EB
187242 -0,4401 0,0240938 Phosphoesterases
137793 -0,7037 0,0240938 Transcription factor, Myb superfamily
170172 -0,5554 0,0241036 similar to alpha-L-rhamnosidase rhaA of Aspergillus aculeatus
38769 -0,3359 0,0241759 -
52421 -0,406 0,0242129 Peptidase M18, aminopeptidase I
53049 -0,3832 0,0242129 Ras-related small GTPase, Rho type
210321 -0,4175 0,0242131 #N/A
172796 -0,8355 0,0242547 Hypothetical urea amidolyase
179878 -0,6713 0,0242914 Predicted glutamine synthetase
35444 -0,3922 0,0243016 Hypothetical part of the anaphase-promoting complex
178864 0,364 0,024312 Protein involved in ubiquinone biosynthesis
194884 -0,4662 0,0244089 -
41708 -0,9637 0,0244092 Sensory transduction histidine kinase
56177 -0,6317 0,0244963 Hypothetical alcohol dehydrogenase
180396 -0,794 0,0246265 -
209029 -0,7713 0,0246815 -
39594 -0,4261 0,0246977 SPRT-like metalloprotease
125004 0,59 0,0246977 #N/A
42088 -1,2163 0,0247029 -
173430 -0,3741 0,0247587 Major facilitator superfamily
198099 -2,3799 0,0248232 Chloroperoxidase
38774 -0,7765 0,0248922 Amidohydrolase-like
39196 -0,5913 0,0248924 Sugar isomerase (SIS)

201
52818 -0,561 0,0249022 #N/A
210558 0,5192 0,0249418 Thiamine pyrophosphate-requiring enzyme
181735 -0,6312 0,0250192 Fungal specific transcription factor
183511 -0,4834 0,0250192 Fungal transcriptional regulatory protein
46759 -0,4833 0,0250192 Hypothetical protein.
50038 -0,762 0,0250192 Hypothetical, Identity with cerev. Nob 1, nuclear protein involved in proteasome maturation and synthesis of 40S ribosomal subunits
188103 -0,4888 0,0250439 -
208493 -0,434 0,0251657 -
37742 0,9977 0,0251657 Rhodopsin-like GPCR superfamily
40419 -0,4605 0,0251719 Dolichyl pyrophosphate phosphatase and related acid phosphatases
173432 -0,4657 0,0251829 -
208263 0,3592 0,0251829 Tubulin beta-1 chain
42344 -0,6073 0,025184 Hypothetical esterase/lipase
55954 -0,3778 0,025184 Peroxisomal biogenesis protein
211385 -0,4832 0,0252604 -
43035 -0,5651 0,0252695 -
196729 -0,5005 0,0252695 Hypothetical Cyclin-like protein
37126 -0,451 0,0252853 -
119438 -0,7632 0,0252853 Phosphoprotein involved in cytosol to vacuolar targeting and autophagocytosis
190584 -0,4334 0,0252979 -
135762 -0,312 0,0252979 Hypothetical Molecular chaperone (small heat-shock protein Hsp26/Hsp42
207543 -0,4399 0,0252979 Hypothetical Nuclear division RFT1 protein
209315 0,4659 0,0253231 #N/A
196275 0,4369 0,0253679 #N/A
183860 0,4513 0,0253911 Related to peptidyl-prolyl cis-trans isomerase
37291 -0,6471 0,0254484 #N/A
196583 0,3951 0,0255614 Candidate rpl12 gene, component of the large (60S) ribosomal subunit
37344 -0,544 0,0255614 Inositol polyphosphate 5-phosphatase and related proteins
48002 -0,4434 0,0256004 Amidohydrolase
174884 -1,0807 0,0257112 Hypothetical Cytochrome P450 monooxygenase
54046 -0,6603 0,0257316 Hypothetical beta-1,6-N-acetylglucosaminyltransferase, contains WSC domain
44084 0,5277 0,0257316 hypothetical. KOG suggests alkyl hydroperoxide reductase/thiol specific antioxidant
130872 -0,3847 0,0257316 Protein kinase
211948 -0,3836 0,0257406 Protein kinase

202
39844 1,1708 0,0258236 -
40108 0,3518 0,0258855 FOG: Ankyrin repeat
175034 -0,4067 0,0258921 #N/A
183269 -0,3297 0,0258975 -
213733 -0,5361 0,0259326 Predicted ubiquitin regulatory protein, contains UAS and UBX domains
208006 0,5353 0,025945 Fungal G-protein, alpha subunit
57437 -0,8435 0,0260352 Hypothetical protein. PFam suggests oxidoreductase activity.
135788 -0,4862 0,0260817 #N/A
41410 0,3833 0,0261012 Hypothetical. GO suggests hydrolase activity, acting on carbon-nitrogen (but not peptide) bonds. Nitrilase/cyanide hydratase and apolipoprotein N-acyltransferase
179677 -0,7848 0,0261144 Ribosomal protein S2
193642 -0,7675 0,0261596 -
45023 -0,4602 0,026161 -
49123 0,7004 0,0263302 (H2AV/H2A.Z) - histone 2A variant, involved in chromosome stability, and could through chromatin remodeling steps be involved in transcriptional regulation of selected genes and is preventing the propagation of epigenetic silencing into neighboring euchromatin; H2AV also plays a role in efficient DNA repair; H2AV shows a high degree of conservation withing the fungal kingdom; KOG Class: Chromatin structure and dynamics; KOG Id: 1757; KOG Description: Histone 2A
212570 -0,6313 0,0263424 hypothetical protein; KOG Class: Chromatin structure and dynamics; KOG Id: 1020; KOG Description: Sister chromatid cohesion protein SCC2/Nipped-B
44347 0,5507 0,0263766 Ribosomal protein L3
138230 -0,3938 0,0264016 Hypothetical subunit of vacuolar ATPase (EC 3.6.3.6)
52907 -0,464 0,0264112 Short-chain dehydrogenase/reductase
181098 -0,326 0,0264737 Peptidyl-prolyl cis-trans isomerase, cyclophilin type
200642 -0,4942 0,026479 26S proteasome regulatory complex
189770 -0,8315 0,026479 Short-chain dehydrogenase
38113 -0,5014 0,0265157 -
50075 -0,5605 0,0265157 DeoxyUTP pyrophosphatase
170479 -0,4806 0,0265543 -
130681 -0,5115 0,0265901 Fungal specific transcription factor domain

203
57355 -0,3708 0,0266157 -
42934 -0,7404 0,0266236 -
52334 -0,5329 0,0266544 -
45928 1,9911 0,0267021 -
41947 -0,8785 0,0267021 hypothetical protein with basic-leucine zipper domain
50766 1,1871 0,0267738 Hypothetical protein. HMMPfam indicates Zinc-containing alcohol dehydrogenase activity
51797 -0,6232 0,0267738 Predicted transcription factor
171480 -0,374 0,0267757 Cys/Met metabolism pyridoxal-phosphate-dependent enzymes
206638 1,255 0,0267797 Aconitate hydratase
53521 -0,5195 0,0268017 Hypothetical COP9 signalosome, subunit CSN5
50560 -0,6899 0,0268401 Predicted ubiquitin regulatory protein
40014 -0,4077 0,0269377 hypothetical amidase
121949 -0,5054 0,0269741 -
212427 -0,3945 0,0269807 #N/A
39673 0,5191 0,0270508 Nucleolar GTPase/ATPase p130
200242 -0,4461 0,0270596 Gtr1/RagA G protein
189424 0,3078 0,027135 putative glycosyl transferase
192093 -0,7798 0,0271819 Major facilitator superfamily
36609 -0,5711 0,0271898 #N/A
214844 0,6355 0,0272164 -
175251 -0,5467 0,0272164 Hypothetical 3-hydroxyacyl-CoA dehydrogenase
205468 -0,4524 0,0272487 Hypothetical Sec63, DnaJ like
38013 -0,3538 0,0272758 #N/A
53338 0,4413 0,0273268 Related to dihydrolipoamide acetyltransferase, EC 2.3.1.12
198063 -0,6446 0,02734 (suc1) extracellular GH family 32 beta-fructofuranosidase (invertase)
53518 -0,449 0,02734 Phosphoribosyltransferase
48817 -0,4326 0,0273481 Transcription initiation factor IIA, gamma subunit
42044 -0,7156 0,0273933 -
45754 -0,3501 0,0274393 hypothetical glutamine tRNA synthetase
55614 0,8778 0,027508 GNS1/SUR4 membrane protein
52233 -0,4822 0,0275238 #N/A
210730 -1,3991 0,027539 related to Thermomyces lanuginosus triacylglycerol lipase
41820 -0,3314 0,0275611 -
212500 -0,668 0,0275773 Aromatic amino acid aminotransferase and related proteins
35897 -0,3574 0,0275773 COP9 signalosome, subunit CSN7

204
36871 0,9723 0,0275773 putative midasin, the largest ORF found in yeast that is believed to play a role in nuclear protein folding
143899 -0,4619 0,0275864 -
173825 0,5456 0,0275864 Candidate Alpha-1,2 glucosyltransferase alg10
50044 -0,534 0,02761 related to ubiquitin conjugating enzyme
40762 -0,3652 0,02761 #N/A
49586 -0,8563 0,0276128 -
130415 -0,442 0,0276128 Hypothetical FAD dependent oxidoreductase
36386 -0,5575 0,0276537 Flavonol reductase/cinnamoyl-CoA reductase
52315 -0,7026 0,0277782 -
40959 -0,4736 0,0278384 -
175167 -0,4654 0,0278449 hypothetical Silent Information regulator protein Sir2p; KOG Class: Chromatin structure and dynamics; KOG Id: 2682; KOG Description:NAD-dependent histone deacetylases and class I sirtuins (SIR2 family)
35589 -0,4589 0,027886 Flavonol reductase/cinnamoyl-CoA reductase
55668 -0,3046 0,027913 Sugar transporter
211789 0,4121 0,0280037 #N/A
51717 0,3129 0,0280299 hypothetical Mitochondrial phosphate carrier protein
171507 -0,5194 0,0280969 Related to S. pombe Histidinol-phosphate aminotransferase (EC 2.6.1.9)
191378 -0,482 0,0281089 -
35485 -1,0707 0,0281089 Related to saccharopine dehydrogenase (EC 1.5.1.10) from Magnaporthe grisea
194814 -0,6773 0,0281226 -
46621 -1,0155 0,0281419 hypothetical amylo-alpha-1,6-glucosidase. Glycogen debranching
39299 -0,754 0,0281792 Hypothetical. Putative protein kinase domain
179991 -0,4175 0,0282198 -
197370 -0,3899 0,0282198 -
210156 -0,3766 0,0282198 -
36830 0,633 0,0282421 -
38819 0,3426 0,0282421 -
55026 -0,3222 0,0282782 Di-trans-poly-cis-decaprenylcistransferase
51351 -0,583 0,0282782 Hypothetical phthalate dioxygenase reductase
42698 -0,4078 0,0282878 -
194162 0,7726 0,0282952 Amino acid transporters
208547 0,7437 0,0282952 ATP-citrate lyase
189620 -1,0901 0,0282952 hypothetical glycoside hydrolase family 2 protein
210597 -0,5303 0,0282952 #N/A

205
176339 -0,4284 0,0283058 hypothetical protein with predicted histone-fold; KOG Class: Transcription; KOG Id: 3902; KOG description: Histone acetyltransferase PCAF/SAGA, subunit SUPT3H/SPT3
212412 0,6345 0,0283314 #N/A
200704 -0,7669 0,0283344 Notchless-like WD40 repeat-containing protein
173759 0,693 0,0283344 #N/A
210108 -0,6701 0,0284065 AMP-dependent synthetase and ligase
140888 -0,6359 0,0284065 Glutathione S-transferase
203777 -0,4854 0,0284546 Hypothetical mitochondrial substrate carrie
185679 -0,4864 0,0284546 Tyrosine specific protein phosphatase
47102 -0,3956 0,0285008 Protein phosphatase 2A, regulatory B subunit
139507 0,4126 0,0285008 Transcription initiation factor TFIID, subunit BDF1 and related bromodomain proteins
171671 -0,3563 0,0285008 Ubiquitin-conjugating enzymes
42916 -0,4061 0,0285162 related to alpha-L-rhamnosidase
42079 -1,0097 0,0285177 -
205259 -0,97 0,0285221 Short-chain dehydrogenase/reductase SDR
196625 -0,5774 0,0286973 Hypothetical. KOG: putative COPII vesicle protein
182008 -0,2914 0,0286973 #N/A
56530 -0,6154 0,0287054 Fungal specific transcription factor
213612 -0,913 0,0287054 Nucleolar GTPase
122951 0,9027 0,0287222 Glycine cleavage system T protein
173212 -0,8589 0,0287618 Hypothetical 6-phosphogluconate dehydrogenase, NAD-binding
189430 -0,7523 0,0289352 Hypothetical 2-nitropropane dioxygenase. (EC 1.13.11.32)
56485 -0,347 0,0289605 GPDA Glyceraldehyde 3-phosphate dehydrogenase
56560 -0,4481 0,028973 -
54027 -0,5037 0,028973 Hypothetical pyridoxin synthesis protein/ Imidazoleglycerol-phosphate synthase subunit H-like
35956 -0,4135 0,0292328 -
40692 0,6741 0,0292374 Glycosyl hydrolases family 16
137643 -0,584 0,0292374 Hypothetical copper transporter
47410 1,4845 0,0292374 hypothetical protein with predicted fungal transcriptional regulatory domain
170270 -0,5427 0,0292374 Nitrilase/cyanide hydratase and apolipoprotein N-acyltransferase
134131 0,6389 0,0292455 -
193991 -0,462 0,0293004 -
51962 -0,7684 0,0293535 Transcription factor, Myb superfamily
174236 0,9217 0,0295231 -
135361 -0,6462 0,0295725 -

206
55278 -0,5118 0,0295725 Hypothetical protein containing helix-turn-helix, Fis-type domain
212395 -0,3952 0,0296161 #N/A
50589 -0,363 0,029649 Putative Ubiquitin-conjugating enzymes, SUMO
38689 -0,4624 0,0296865 -
36895 -0,4615 0,0296967 SAM-dependent methyltransferases
46698 -0,514 0,0296998 #N/A
211011 -0,2873 0,0297081 -
214562 -0,4066 0,0297339 -
52568 -1,1964 0,0297339 Aconitase/homoaconitase (aconitase superfamily)
192202 -0,8641 0,0297343 Transketolase, C-terminal domain
133913 -0,3147 0,0297474 -
201277 0,6582 0,0297704 Major intrinsic protein
54095 0,3206 0,0298606 Sugar (ANd other) transporter
48775 -0,6328 0,0299215 #N/A
51646 -1,1972 0,0300837 epoxide hydrolase
43191 -0,4274 0,0301201 Peptidase C48, SUMO/Sentrin/Ubl1
184552 -0,5094 0,0301775 ABC transporter
130791 -0,4178 0,0301775 Fungal specific transcription factor
179368 0,2881 0,0301877 Major facilitator superfamily
37999 0,3474 0,0302296 -
50333 -0,4128 0,0302296 putative extracellular phytase
137941 -0,6216 0,0302464 -
43230 -0,3657 0,0303244 Hypothetical SNARE protein
203246 0,3274 0,0304833 40S ribosomal protein S24
53274 -0,8515 0,0305481 -
39502 0,3846 0,0305564 #N/A
56641 0,6788 0,0305633 Glucose/ribitol dehydrogenase
54937 -0,3831 0,0306623 Hypothetical prephenate hydratase
55707 -0,3202 0,030676 Nucleotide-sugar transporter
41163 -0,5138 0,030676 unknown (decarboxylase ?)
180211 -0,5199 0,0307516 Alpha/beta hydrolase
213414 0,3557 0,0307676 Predicted transporter (ABC superfamily)
183617 -0,6785 0,0307954 -
43466 -0,3391 0,0308748 -
52291 -0,4273 0,0308748 Anion-transporting ATPase
120585 -0,3408 0,030906 Tyrosine protein kinase
170230 -0,6979 0,0309189 -
54758 -0,3655 0,0309189 Predicted undecaprenyl diphosphate synthase
126448 -0,4299 0,030929 #N/A
36134 -0,4304 0,0309497 Myosin regulatory light chain
119101 0,4636 0,0310555 Nucleolar GTPase/ATPase p130
193846 -0,4738 0,031208 Hypothetical peptidyl-prolyl cis-trans isomerase, cyclophilin type

207
203834 -0,425 0,0312188 Alkyl hydroperoxide reductase, thiol specific antioxidant and related enzymes
54233 -0,4364 0,0312188 Glycosyl transferases group 1
189097 -0,7562 0,0312188 Related to pyruvate decarboxylase; EC 4.1.1.1
181931 -0,4031 0,0312188 Transcription factor with Helix-loop-helix DNA-binding domain
43055 0,7837 0,0312578 -
171101 -0,6006 0,0312578 Actin-binding, cofilin/tropomyosin type
48902 -0,2963 0,0313037 -
133280 -0,3661 0,031383 #N/A
188804 -0,3768 0,0314612 -
210760 1,03 0,0314907 -
48846 0,5888 0,03165 -
209775 -0,5895 0,0316542 -
39382 0,4035 0,0316871 Ca2+/H+ antiporter VCX1 and related proteins
37529 -0,3958 0,0316889 #N/A
41597 0,4784 0,0317658 -
47696 -0,6228 0,0317664 -
170223 -0,6306 0,0317866 putative GH family 81 endo-1,3-beta-glucanase
52969 0,9513 0,0318069 Importin-beta, N-terminal
140217 2,0523 0,0318089 Major facilitator superfamily
172849 1,1569 0,0319005 -
52839 -0,381 0,031933 -
39104 0,5153 0,031933 Metacaspase involved in regulation of apoptosis
171583 -0,4569 0,0319857 -
57451 -0,3077 0,0319857 Hypothetical ATP (CTP):tRNA-specific tRNA nucleotidyltransferase.
122948 -0,4136 0,0320188 -
214434 -0,3922 0,0320188 Fungal transcriptional regulatory protein
182143 -0,4008 0,0320497 Cytochrome P450
181888 -0,5632 0,0321869 Carboxyl transferase
40477 -1,1629 0,0321869 Hypothetical. Some similarity to alkylhydroperoxidase
41311 -0,3849 0,032191 Insulinase-like
189528 -1,1791 0,0322381 -
37193 -0,4779 0,0323455 #N/A
134514 0,3357 0,0323761 -
54966 0,4823 0,0324191 -
213255 1,1465 0,032512 Zn-finger, C2H2 type
46259 -0,9682 0,0325223 FMN-dependent alpha-hydroxy acid dehydrogenase, active site
143591 -0,727 0,03264 #N/A
52387 -0,4301 0,0328567 Hypothetical H+-transporting two-sector ATPase
42378 0,4428 0,0329652 Esterase/lipase/thioesterase

208
202003 -0,3989 0,0329913 Hypothetical PEP-utilizing enzyme
172245 -0,2775 0,0330027 Unknown protein product
178324 -0,4159 0,0330027 #N/A
186407 -0,4555 0,0330283 Thioesterase superfamily
212968 -0,6733 0,0330283 Zinc-containing alcohol dehydrogenase
127783 -0,5436 0,0331974 -
52885 -0,406 0,0332958 Cullin
54483 0,3771 0,0333375 Related to squalene synthetase (EC 2.5.1.21). Involved in lipid biosynthesis.
52698 -0,3872 0,0334722 -
178797 -0,3606 0,0334763 Peptidase C12, ubiquitin carboxyl-terminal hydrolase 1
175816 -0,3409 0,0334846 -
35666 0,4092 0,0335411 FAD linked oxidase
37994 0,3013 0,033559 Major facilitator superfamily
52326 -0,4166 0,0337193 Glutathione peroxidase
43477 0,3743 0,0337339 -
194898 -0,5426 0,0338305 -
172485 -0,5763 0,0338862 Predicted membrane protein
183678 0,3138 0,03393 Major facilitator superfamily
39923 -0,4443 0,0339604 Arylacetamide deacetylase
173689 -0,5453 0,0339912 Protein kinase
205291 -0,682 0,0340042 Isocitrate and isopropylmalate dehydrogenases
36954 -0,382 0,0340799 -
210525 -0,4113 0,034088 -
173997 1,4055 0,0340884 Deduced translation product shares amino acid sequence identity with the Saccharomyces cerevisiae NSR1 gene product; a nucleolar protein that binds nuclear localization sequences, required for pre-rRNA processing and ribosome biogenesis.
52706 -0,3903 0,0341081 Nucleoside phosphatase
41616 -0,3616 0,0343321 Proteinase inhibitor I25, cystatin
39869 -0,6719 0,0343361 RRM domain
127561 0,5647 0,0345911 -
170758 -0,8952 0,0345944 -
52997 -0,5295 0,0345944 E3 ubiquitin protein ligase
179998 -0,4306 0,0345944 #N/A
209086 -0,4816 0,0346213 (racA) Ras-related small GTPase, Rho type
53116 -0,4465 0,0346227 -
204783 -0,3519 0,0346455 Hypothetical ADAM ("a disintegrin and metalloprotease")family gene
36031 -0,3401 0,0346703 Putative GroEL-like chaperone, ATPase
54532 0,975 0,0347042 Amino acid/polyamine transporter I

209
185870 -0,3315 0,0347277 No homology to confirmed arginine N-methyltransferases (EC 2.1.1.2)
119741 -0,3606 0,0347666 Hypothetical Cl- channel, voltage gated
57202 -0,343 0,0347939 -
137474 -0,4503 0,0348841 #N/A
47908 -0,7316 0,0349744 Short-chain dehydrogenase/reductase SDR
183349 -0,5993 0,0350982 Cytochrome P450
137095 -0,2855 0,0351084 #N/A
38103 -0,619 0,0351105 Hypothetical Damage-specific DNA binding protein
41756 -0,461 0,0351471 Amidohydrolase
40946 0,925 0,035217 #N/A
175389 -0,3373 0,0352725 -
46378 -0,6974 0,0352973 -
56494 -0,3406 0,0352973 -
35383 -0,4072 0,035446 -
212533 -0,3954 0,0354569 #N/A
42282 0,644 0,0354908 -
136905 -0,4385 0,035536 Candidate Vps32 homologue
208357 -0,3701 0,0355445 -
128421 -0,7126 0,035577 #N/A
195357 -0,4381 0,035577 #N/A
48811 -0,6305 0,0355801 (xlnR) Transcriptional activator xlnR
57297 -0,4276 0,0355801 Hypothetical Mg2+ transporter protein, CorA-like
172690 -0,3171 0,0355801 Hypothetical protein with Cytochrome c heme-binding site
42644 -0,4384 0,0355801 Poly(ADP-ribose) polymerase, regulatory region
208699 0,433 0,0355801 Predicted translation product shares amino acid sequence identity with the Saccharomyces cerevisiae RSC9 gene product; one of 15 subunits of the 'Remodel the Structure of Chromatin' (RSC) complex; DNA-binding protein involved in the synthesis of rRNA and in transcriptional repression and activation of genes regulated by the Target of Rapamycin (TOR) pathway.
209062 -0,7109 0,0355801 WASP-interacting protein VRP1/WIP
178173 -0,6258 0,0356137 -
47399 -0,3696 0,0356191 Aminoacyl-tRNA synthetase, class I
50921 0,3898 0,0356191 hypothetical Short-chain dehydrogenase/reductase SDR
189889 0,2725 0,0356228 hypothetical aminotransferase
176315 -0,56 0,0358018 Carboxymethyl transferase
56063 -0,4024 0,035825 Rac GTPase-activating protein BCR/ABR
130919 -0,3746 0,0358564 RING finger protein
175824 0,3285 0,0358881 #N/A

210
185842 -1,1377 0,0359584 cytochrome b5
208917 -0,4917 0,0359875 Ubiquitin-conjugating enzyme
208535 -0,6161 0,0360031 -
41915 -0,4376 0,0360031 -
40329 -0,442 0,0360889 Hypothetical sec1-like protein
40966 -0,6354 0,03613 Cu/Zn Superoixide dismutase
37122 0,3448 0,0361862 Dynactin, subunit p25
137591 -0,4963 0,0362518 -
53484 -0,5962 0,0362707 -
194194 -0,3875 0,0362707 #N/A
39346 -0,6725 0,0363207 hypothetical protein containing Ada, metal-binding and helix-turn-helix, AraC type domains.
209050 0,3593 0,0367092 Radical SAM superfamily
47785 -0,5528 0,036937 hypothetical protein with esterase/lipase/thioesterase motif
130834 -0,7561 0,0369408 Fungal specific transcription factor
210387 -0,4478 0,0370105 (pelF) Pectine lyase F. Involved in pectine degradation (EC 4.2.2.10)
179788 0,6898 0,0370105 Hypothetical DNA-directed DNA polymerase B
41282 -0,4624 0,037036 -
192778 -0,5027 0,037036 #N/A
127000 -0,3235 0,0370602 -
53115 -0,3255 0,0371559 -
53694 -0,5109 0,0371774 #N/A
41723 -0,5632 0,0371825 Hypothetical Cytochrome P450 monooxygenase
131283 -0,3697 0,0371825 hypothetical lipase
52085 -0,5441 0,0371825 #N/A
211957 -0,3434 0,0372954 protein phosphatase
55264 -0,3302 0,0374311 Putative transcriptional repressor
50257 -0,377 0,0374506 -
54393 -0,3165 0,0374506 -
124912 -0,9294 0,0374506 Choline kinase
50105 -0,3934 0,0374986 hypothetical glucose transporter
206304 0,4902 0,0374986 Hypothetical RAS GTPase
45504 -0,4019 0,0375142 -
119698 -0,4268 0,0375679 hypothetical protein, related to yeast zds family proteins; KOG Class: Chromatin structure and dynamics; KOG Id: 1472; KOG Description:Histone acetyltransferase SAGA/ADA, catalytic subunit PCAF/GCN5 and related proteins
49598 -1,1679 0,0376503 Pyridine nucleotide-disulphide oxidoreductase, class-II
133594 -0,3798 0,0376503 SAM-dependent methyltransferases
182167 -0,4296 0,0377524 Hypothetical DNA mismatch repair protein

211
56523 -0,5325 0,0377552 related to leucine aminopeptidase
38174 -0,5655 0,0377626 -
199345 -0,5426 0,0377626 Hypothetical F-actin capping protein, alpha subunit
54077 -0,9734 0,0377626 Major intrinsic protein
206009 0,356 0,0378572 Hypothetical Alpha tubulin
212470 -0,3719 0,0380161 Peptidase C19
178578 -0,4227 0,0380161 Phospholipase/carboxyhydrolase
208820 -0,341 0,0380753 Predicted Acyltransferase
54109 -0,4812 0,0380753 Ras-related GTPase
205776 -0,3156 0,0381211 Predicted membrane protein
42214 -0,3452 0,038148 Fungal transcriptional regulatory protein
120396 -0,3434 0,038148 Splicing coactivator SRm160/300, subunit SRm300
135497 -0,4177 0,0381701 Alanine racemase
39268 -0,4868 0,0381701 Fungal specific transcription factor
186516 0,3326 0,038373 -
45402 -0,4234 0,0384504 #N/A
208179 -0,4482 0,0384903 Surf 4 protein . ER to Golgi transport
52215 -0,4585 0,0385006 -
178895 -0,4819 0,0385006 #N/A
175854 0,4436 0,0386108 -
43533 1,0279 0,0386362 -
177966 -0,4169 0,0386456 Fungal specific transcription factor
173459 0,7443 0,0386568 -
38626 -0,4638 0,0386717 hypothetical DEAH-box helicase; KOG Class: RNA processing and modification; KOG Id: 0922; KOG description: DEAH-box RNA helicase
42073 0,4027 0,0386968 -
57403 -0,4055 0,0386968 -
52553 -0,41 0,0387677 #N/A
56149 -0,4984 0,038838 Metallophosphoesterase
38958 -0,3137 0,0389349 Hypothetical Cytochrome P450 monooxygenase
54102 0,302 0,0390236 #N/A
57417 -0,3739 0,0390236 #N/A
202763 -0,4206 0,0391261 Small nuclear ribonucleoprotein
40476 -0,9734 0,0391452 -
192595 -0,5008 0,0392157 -
41548 -0,5373 0,0392157 -
37741 0,4688 0,0392638 -
183137 -0,4719 0,0393727 #N/A
57271 0,6662 0,0394936 #N/A
190324 -0,442 0,0395018 -
57283 -0,4494 0,0395885 This protein is involved in sexual reproduction;
50645 -0,3645 0,0396597 -
183410 -0,4465 0,0396695 -

212
214718 -0,4346 0,0398722 Hypothetical transport protein. Belongs to the major facilitator superfamily and has 11 putative transmembrane domains
52318 -0,6887 0,0398786 Hypothetical glycosyl transferase. Related to N. crassa clock-controlled gene-9 protein
170145 1,018 0,040052 -
196617 -0,385 0,0402723 GCN5-related N-acetyltransferase
56472 -0,3803 0,0403209 -
42086 0,4248 0,0405716 -
192770 0,5084 0,0405716 hypothetical protein with predicted NAP and Poly(A) polymerase domains; KOG Class: Chromatin structure and dynamics; KOG Id: 1507; KOG Description: Nucleosome assembly protein NAP-1
197463 0,4229 0,0405771 Mitochondrial large ribosomal subunit
55430 0,3351 0,0406452 #N/A
52539 -0,5664 0,0406467 -
56378 -0,6059 0,0406467 -
176865 -0,3774 0,0406467 Hypothetical GPI anchor protein
212876 0,2934 0,0406646 Ribosomal protein S5
57352 0,3315 0,0408113 Ribosomal protein S6e
54389 0,4783 0,0408433 -
203398 -1,0573 0,041031 Acyltransferase 3
43416 0,4572 0,0411178 -
191145 -0,3185 0,0411178 Esterase/lipase/thioesterase
207276 -1,2259 0,0411755 UDP-glucose 4-epimerase
211774 -0,6141 0,0412506 Amino acid/polyamine transporter I
53113 0,2964 0,0412506 Histone 2A
54765 -0,3421 0,0412584 -
176254 0,6722 0,0413472 -
39573 -0,4147 0,0413472 -
173033 -0,6882 0,0414228 Translation initiation factor 4F
55897 0,626 0,0414603 Haem peroxidase, plant/fungal/bacterial
55072 -0,3654 0,0414726 Fungal transcriptional regulatory protein
131964 -0,3718 0,0414726 GTP1/OBG subdomain
44367 -0,2958 0,0414771 -
125380 -0,5418 0,0414771 Esterase/lipase/thioesterase
186946 -0,4146 0,0414771 Hypothetical protein. Putative Adenosine deaminase/editase
131319 0,4482 0,0414771 Major facilitator superfamily
51421 -0,7198 0,0414771 Major facilitator superfamily
203913 -0,3339 0,0414771 #N/A
52870 -0,8222 0,0416319 Sugar (ANd other) transporter
186415 -0,5261 0,0417489 Short-chain dehydrogenase/reductase
170269 -0,4424 0,0418578 -

213
45631 1,229 0,0419134 Ankyrin
47586 -0,4107 0,0419721 Fungal specific transcription factor
139052 -0,3683 0,0419721 hypothetical adaptin gamma subunit
206654 -0,4169 0,0420054 Fungal transcriptional regulatory protein
44408 -0,4356 0,0420104 #N/A
119850 -0,2956 0,042045 -
192427 -0,3759 0,0422399 -
181231 -0,3547 0,0423021 #N/A
207006 -0,3995 0,0423562 -
47885 -0,5243 0,0423562 -
35358 0,5591 0,0424823 CCAAT-binding transcription factor,
173111 -0,4175 0,0425819 Ras small GTPase
55539 0,5235 0,0428745 Methylenetetrahydrofolate reductase
53849 -0,3451 0,0430017 -
54071 0,7774 0,0430575 -
190631 -0,4218 0,0430575 O-methyltransferase
206764 0,672 0,0430575 #N/A
44298 -0,3484 0,0430575 #N/A
171532 -0,4588 0,0433283 -
52536 -0,444 0,0433744 Ubiquitin-conjugating enzyme
45134 0,3388 0,0435148 -
45764 0,8422 0,0435461 hypothetical aspartate transaminase (EC 2.6.1.1)
48389 0,6937 0,0435461 Predicted transporter (major facilitator superfamily
45789 -0,7776 0,0436007 hypothetical copper amine oxidase
54156 0,6303 0,0436427 putative Heat shock protein DnaJ
202653 0,2765 0,0436482 putative Ribosomal protein 60S
187232 0,7088 0,0436514 -
38570 -0,3747 0,0436689 Fibronectin type III domain
120291 0,3931 0,0437536 ABC transporter
42805 -0,4658 0,0437858 -
51721 -0,3054 0,0437874 -
44378 -0,5436 0,0437989 -
140013 -0,9744 0,0438088 Major facilitator superfamily
200072 0,6188 0,0439341 Hypothetical protein with cytochrome c heme-binding site
43711 0,5981 0,0439511 beta-1,6-N-acetylglucosaminyltransferase
182707 0,3811 0,0439511 hypothetical chitin-binding protein
126931 0,3455 0,0439511 Hypothetical glutathione S-transferase
47218 -0,4548 0,043969 -
179711 -0,4074 0,043969 #N/A
56339 1,9421 0,0439698 Related to sulphate permease. Has 11 transmembrane domains and several sulphate transporter domains.
195459 -0,4384 0,0439746 #N/A

214
213660 -0,4475 0,0440082 Leucine rich repeat protein
52163 -0,3488 0,0440881 Actin/actin-like
47331 -0,4292 0,0441243 Eukaryotic protein kinase domain. Related to cell cycle checkpoints
56808 -0,331 0,0441243 putative translation initiation factor related to the eIF-2B alpha subunit
35727 -0,5239 0,0441333 -
196638 0,5394 0,0441906 60S acidic ribosomal protein P0
56013 -0,4857 0,0443746 Serine/threonine kinase
178649 -0,4909 0,0444781 Nucleolar GTPase/ATPase p130
36287 -0,2719 0,0444992 Candidate anbA gene
205494 0,465 0,0446419 B-cell receptor-associated protein and related proteins
214476 -0,499 0,0446419 hypothetical protein containing Zn-finger, C2H2 type domain
170319 -0,412 0,0446419 Major facilitator superfamily
211722 -0,3485 0,0447023 Ras GTPase
54886 -0,4152 0,0447023 #N/A
199148 -0,3995 0,0448221 Candidate Fumarylacetoacetase
182157 -0,3827 0,044889 -
43260 0,5596 0,0449788 -
39100 -0,4363 0,0449862 hypothetical Aflatoxin biosynthesis regulatory protein
192500 -0,3385 0,0449899 Fungal transcriptional regulatory protein
134242 -0,418 0,0450755 -
184104 -0,4628 0,0450755 -
46090 -0,6373 0,0450755 #N/A
38280 -0,5651 0,0450965 Oxidosqualene-lanosterol cyclase and related proteins
136363 -0,3116 0,0451594 #N/A
127827 -0,4044 0,0451725 Translation initiation factor 1A
138144 0,5886 0,0453278 Ribosomal L32p protein
41958 -0,2841 0,0453652 Transport protein particle (TRAPP) complex subunit
52017 -0,4236 0,0454063 -
42362 -0,3689 0,045441 Major facilitator superfamily
197123 -0,3899 0,0455715 Rab GDI protein
47458 -0,5902 0,0455991 -
52269 0,7946 0,0455991 -
52755 0,3997 0,0456259 Hypothetical diacylglycerol kinase
51852 -0,426 0,0456559 Phox-like
119224 -0,4686 0,0456793 Transcription coactivator
41900 -1,8779 0,0456813 -
128800 -0,6144 0,0456813 ABC superfamily
181530 -0,4139 0,0458866 #N/A

215
132538 -0,8411 0,0459361 Sorbin and SH3 domain-containing protein (signal transduction)
55205 -0,7097 0,0459814 hypothetical short chain dehydrogenase
135398 0,2891 0,0460661 -
191172 -0,525 0,0460835 #N/A
45972 0,439 0,046103 Hypothetical protein. Induced at pH 2.5.
204315 -0,5109 0,0461465 Hypothetical. Interpro suggests Cupin domain. Sugar isomerase activity ?
53121 -0,4029 0,0462336 Choline transporter-like protein
189666 -0,8837 0,0462593 Aminoacyl-tRNA synthetase
178492 0,6094 0,0464757 -
53994 0,447 0,0464757 -
52673 -0,4059 0,0464757 hogA, osmotic sensitivity mitogen-activated protein (MAP) kinase
213652 -0,3615 0,0464757 Protein kinase
41401 -0,3415 0,0465505 #N/A
127816 -0,3056 0,0465731 SNARE protein
120809 -0,5989 0,0467263 Flavoprotein monooxygenase
38759 -0,4213 0,0469931 -
54150 -0,5073 0,0470614 -
140694 -0,4958 0,047127 #N/A
181664 0,4653 0,0471281 Large RNA-binding protein (RRM superfamily)
55911 -0,43 0,0473075 #N/A
136883 -0,3977 0,0474188 -
124391 -0,3376 0,0475912 Glutamate 5-kinase
57068 -0,296 0,0475949 AICAR transformylase/IMP cyclohydrolase/methylglyoxal synthase
43065 -0,5122 0,0476433 Ribonuclease III
40412 -0,4385 0,0476433 Synaptobrevin/VAMP-like protein
55208 0,978 0,0476533 -
54938 -0,3473 0,0476885 Polypeptide release factor involved in translation termination.
44465 -0,4761 0,0477122 #N/A
175546 -0,5533 0,0479056 Major facilitator superfamily
47529 -0,4191 0,0479307 -
192619 -0,3997 0,0479734 Serine carboxypeptidase
41719 -0,5284 0,0480177 hypothetical FAD/FMN-containing dehydrogenase
195017 -0,4105 0,0480374 #N/A
186699 -0,4879 0,0480433 -
207032 -0,6583 0,048052 -
193151 -0,5595 0,0480525 -
40867 -0,2915 0,0480525 -
54593 -0,3642 0,0480525 Amino acid/polyamine transporter
47812 0,3315 0,0480525 OPT oligopeptide transporter protein

216
187673 -0,4516 0,0481734 Caspase
123330 -0,4714 0,0482092 #N/A
56901 -0,2912 0,0482538 -
211829 -0,3779 0,0483527 #N/A
37080 -0,4951 0,0485079 pepE, extracellular aspartic protease
40379 -0,4605 0,0485394 -
55020 -0,3456 0,0485581 #N/A
55080 -0,4014 0,0486061 #N/A
56667 -0,2948 0,0486213 Ankyrin repeat protein
170567 -0,4657 0,0486213 #N/A
209255 0,4845 0,0486329 Mitochondrial substrate carrier
213698 -0,4657 0,0486329 Predicted oxidoreductase
175401 -0,6317 0,0487247 -
209750 -0,3864 0,0487458 -
184267 0,6121 0,0487458 Hypothetical low affinity iron permease
212557 -0,3376 0,0487603 Sec1-like protein
182540 -0,4058 0,0487639 -
47636 -0,3136 0,048765 Hypothetical transcription factor TMF, TATA element modulatory factor
56936 0,4456 0,048765 #N/A
206626 -0,6508 0,0487799 Major facilitator superfamily
51112 -0,4861 0,0487923 Peptidase family M48
186194 -0,3284 0,0488326 COP9 signalosome, subunit CSN3
44557 -0,4224 0,0488545 #N/A
44877 0,471 0,0489124 -
54968 -0,551 0,0489124 -
212055 0,4313 0,0489124 40S ribosomal protein S12
56462 0,4024 0,0489124 Candidate serine hydroxymethyltransferase (EC 2.1.2.1)
45491 -0,4971 0,0489124 Protein kinase
42733 1,7466 0,0490157 Dihydroxy-acid dehydratase
125961 0,3211 0,0490157 Esterase/lipase/thioesterase
132428 -0,3099 0,0490157 Major facilitator superfamily
129576 0,7314 0,0490295 -
185022 -0,3034 0,0490856 FAD linked oxidase
134668 -0,6153 0,049155 -
47000 -0,3941 0,049155 -
124595 -0,8161 0,049155 Possible oxidoreductase
137527 0,4674 0,049155 #N/A
212180 -0,3586 0,0491802 Putative GroEL-like chaperone, ATPase
52362 0,4361 0,0493394 Candidate 40S ribosomal protein S0.
52301 -0,5233 0,0493489 -
35422 -0,248 0,0493489 Fungal transcriptional regulatory protein, N-terminal

217
206767 0,3732 0,0493937 -
127030 -0,5034 0,049498 -
208969 -0,4702 0,0495161 -
205459 0,495 0,0495161 Alpha-isopropylmalate synthase/homocitrate synthase
40039 -0,6619 0,0496527 Peptidase, eukaryotic cysteine peptidase active site
56582 -0,35 0,0496575 -
40885 -0,5722 0,0497276 beta-1,6-N-acetylglucosaminyltransferase, contains WSC domain

218
Appendix 2

219
Significantly regulated proteins of Chapter 4
JGI ID Fold change z score P. Value Annotation
209700 -3.385835042 -7.91422 1.24402E-15 ABC transporter
119500 -0.478545405 -4.12004 1.89406E-05 -
196714 -1.585177003 -3.88669 5.08111E-05 Ribosomal protein L15e
207954 -1.612678712 -3.70948 0.000103841 Spermidine synthase
40339 -0.377776332 -3.61496 0.000150197 Armadillo/beta-catenin-like repeat-containing protein
172591 -1.022338571 -3.56123 0.000184564 Uroporphyrinogen decarboxylase
172313 -0.784497614 -3.4562 0.000273919 dUTPase
214348 -0.715486321 -3.24401 0.000589297 Acyl-CoA synthetase
55496 -1.802428541 -3.22739 0.00062462 Hypothetical protein with Zn-finger. C-x8-C-x5-C-x3-H type
213572 -1.135045546 -3.18941 0.000712811 Hypothetical. Related to cell surface antigen spherulin
210854 -0.548847973 -3.04577 0.001160415 #N/A
210854 -0.548847973 -3.04577 0.001160415 #N/A
205484 -1.269481135 -2.96573 0.00150983 Acyl-CoA dehydrogenase
207105 -1.189914083 -2.93505 0.001667444 -
207105 -1.189914083 -2.93505 0.001667444 -
55885 -1.151475213 -2.72464 0.003218589 Hypothetical protein with RNA-binding region
53254 -0.403569693 -2.70408 0.003424696 Putative Peptidyl-prolyl cis-trans isomerase. cyclophilin type
50504 -0.451852835 -2.58294 0.004898059 Hypothetical alcohol dehydrogenase NADP+ dependent; EC
1.1.1.2
56152 -0.526802223 -2.48835 0.006416847 related to Asp f4 allergen of Aspergillus fumigatus
47150 -0.95283337 -2.44073 0.007328752 C1-tetrahydrofolate synthase
56395 -1.092896996 -2.35115 0.009357792 2-nitropropane dioxygenase
55680 -0.403718876 -2.3218 0.01012196 Coenzyme A transferase
124867 -0.78133445 -2.24364 0.012427795 putative extracellular protein
207929 -0.451964892 -2.2357 0.012685802 Pentafunctional AROM protein. KOG: Aminoacid transport
metabolism
135107 -0.281503719 -2.18535 0.014431472 Hypothetical Actin-binding protein
214549 -0.32526794 -2.13687 0.016304255 -
49515 -0.616704668 -2.12412 0.016830085 -
52865 -0.726275603 -2.11949 0.017024355 Hypothetical. possible DNA binding
47011 -0.373753061 -2.11776 0.017097719 -

220
56414 -0.707334822 -2.08809 0.018394972 -
205050 -1.150325936 -2.07905 0.018806335 Hypothetical thioredoxin-related
52397 -0.490319722 -2.07641 0.018927809 Hypothetical 20S proteasome. regulatory subunit
209528 -0.572576853 -2.0363 0.020860146 -
171101 -0.350754961 -2.02421 0.021474391 Actin-binding. cofilin/tropomyosin type
55204 -0.538205414 -2.02012 0.02168551 agsA. one of five alpha-1.3-glucan synthases
55011 -0.282104872 -2.01952 0.021716503 51kDa subunit of NADH:ubiquinone reductase (complex I);
NADH dehydrogenase [Aspergillus niger]
137182 -0.283093571 -2.00791 0.022326571 60S ribosomal protein L14
51886 -0.634595269 -2.00208 0.022638222 Anthranilate phosphoribosyltransferease. trp biosynthesis. EC
2.4.2.18
190481 -1.29775914 -1.98676 0.023474735 AMP-dependent synthetase and ligase
55741 -0.663036943 -1.96277 0.024836254 Protein import receptor MAS20
213531 -0.859991044 -1.95064 0.025549956 Mitochondrial import translocase. subunit Tom70
187475 -0.995784443 -1.94047 0.026161078 -
37834 -0.273315543 -1.90883 0.028142307 Mitochondrial import inner membrane translocase.
49311 -0.361556237 -1.86774 0.030899098 Hypothetical. similarities to sialidase superfamily
211094 0.793543577 1.988725 0.023366 #N/A
123950 0.540058013 1.990491 0.023268 Protein phosphatase 2C-like
47288 0.786294568 2.033202 0.021016 putative Translation initiation factor 2B. epsilon subunit (eIF-
2Bepsilon/GCD6) Translation. ribosomal structure and
biogenesis
200642 0.360452963 2.14112 0.016132 26S proteasome regulatory complex
178461 0.781870132 2.287353 0.011088 Editing needed. This protein is an artificial hybrid of a purine-
nucleoside phosphorylase activity and a 6-phosphogluconate
dehydrogenase. In the CBS 513.88 annotation. these are
annotated as An11g06110 and An11g06120 respectively.
54579 1.699416026 3.0448 0.001164 Hypothetical myristoyl-CoA:protein N-myristoyltransferase
201398 1.603192184 3.467571 0.000263 -
211951 1.434754237 3.584087
0.000169
Phenylalanyl-tRNA synthetase. beta subunit archae/euk
cytosolic
204505 0.978022956 3.658699 0.000127 Ribosomal protein L39e

221
Appendix 3 Significantly expressed genes of Chapter 6
pH 2.5
JGI ID Fold Change P. Value Annotation
57241 -1,64705 0,00120173 oahA, Oxaloacetate acetylhydrolase oahA (EC 3.7.1.1)
139485 -1,52419 0,00767367 putative lysophospholipase with signal peptide motif
41618 -1,77389 0,00767367 Hypothetical polyketide synthase
181795 1,20559 0,02352445 -
184509 1,67369 0,0372688 Hypothetical methyltransferase. No sequence similarity is found to identified proteins
41394 -2,05872 0,0372688 -
52588 -2,5011 0,0372688 -
pH 5.0
JGI ID Fold change P. Value Annotation
206885 -1,03015 0,0050151 Acetate kinase
184509 2,29783 0,00836649
Hypothetical methyltransferase. No sequence similarity is
found to identified proteins
126194 -1,52085 0,00836649 #N/A
48286 -2,2922 0,00836649 hypothetical NADH:flavin oxidoreductase/NADH oxidase
46001 -2,91785 0,00836649 ConX, conidiation specific protein
55019 2,20279 0,00879326 -
43792 1,6298 0,0091206 -
41404 -2,77815 0,0091206 #N/A
37491 1,55839 0,0091206 Hypothetical heterokaryon incompatibility factor
37001 1,58179 0,0091206 #N/A
132624 1,56452 0,00927663 Fungal specific transcription factor
35697 -3,73619 0,00927663 #N/A
175986 1,37566 0,00957684 -
37555 1,22302 0,00957684 Fungal transcriptional regulatory protein

222
137491 1,94443 0,00964705 -
41393 1,53928 0,00964705 -
45767 -2,00563 0,01069102 -
173247 1,68685 0,01086467 Candidate phosphate transporter
182323 -1,41588 0,01245016 #N/A
188780 1,02472 0,01500038 Amino acid/polyamine transporter
209625 2,34947 0,01552267 Generic methyltransferase
54077 1,30948 0,01552267 Major intrinsic protein
42602 -1,35272 0,01552267 Cytochrome P450
205518 -1,3834 0,01700634 NADH-dehydrogenase (ubiquinone)
203979 -1,75905 0,01700634 -
189162 -2,49213 0,01700634 RTA1 like protein
189113 -1,28721 0,01700634 -
184012 -1,09135 0,01700634 Amino acid transporters
176378 1,20395 0,01700634 Short-chain dehydrogenase/reductase
141870 1,09587 0,01700634 #N/A
126826 -1,84422 0,01700634 #N/A
43431 1,23656 0,01700634 -
36639 -1,54513 0,01700634 FAD binding domain
36360 1,5905 0,01700634 CorA-like Mg2+ transporter protein
198697 1,12422 0,01740326 Predicted transporter (major facilitator superfamily)
36928 -1,01876 0,01740326 -
53882 1,4175 0,01756332 Gene activiation by acetylation of histones
189610 1,18826 0,0184042 #N/A
48081 -1,20605 0,0184042 Candidate ornithine aminotransferase (EC 2.6.1.13)
46134 1,31753 0,0184042 FAD-linked oxidase
189852 -1,95383 0,0187999 #N/A
57437 -1,45589 0,0187999 Hypothetical protein. PFam suggests oxidoreductase activity.
53757 1,04225 0,0187999 -
52588 -2,16769 0,0187999 -
44917 -1,25896 0,0187999 Major facilitator superfamily
177916 1,68692 0,01914087 -
136764 -1,24869 0,01914087 Chloroperoxidase
42274 -1,54755 0,01914087 -

223
36635 -0,84795 0,01914087 -
172477 1,78019 0,019723 Short-chain dehydrogenase/reductase
142689 -1,06022 0,019723 -
52023 1,24719 0,0199321 Adenylosuccinate lyase
36472 1,05181 0,02014927 -
37260 -1,09248 0,02016633 #N/A
212262 0,85243 0,02054418 -
176483 -2,00621 0,02054418 #N/A
54305 -2,65655 0,02054418 Zinc-containing alcohol dehydrogenase
53879 -2,22291 0,02054418 Zinc-binding oxidoreductase
49768 0,84686 0,02054418 #N/A
36389 -1,13891 0,02054418 -
181773 0,7885 0,02096318 #N/A
197549 1,2724 0,02127836 Sugar (ANd other) transporter
191511 -1,48226 0,02127836
related to GH family 12 xyloglucan-specific endo-beta-1,4-
glucanase
180844 -1,46971 0,02127836 Short-chain dehydrogenase/reductase SDR
179042 1,35939 0,02127836 Zinc-containing alcohol dehydrogenase
126082 1,89657 0,02127836 Generic methyltransferase
214715 -1,80392 0,02141765
Hypothetical protein. KOG suggests chitinase. SignalP suggests
secretion
123072 -1,11482 0,02159443 #N/A
40225 -1,06051 0,02247859 NADH:flavin oxidoreductase/NADH oxidase
42609 -1,25742 0,02284297 -
43179 0,78042 0,02300214 -
40273 -1,31379 0,02300214 #N/A
38052 -1,39698 0,02300214 #N/A
195091 -1,85382 0,02371474 Zinc-containing alcohol dehydrogenase
176272 0,93493 0,02388339 Flavin-containing monooxygenase
185434 1,00791 0,02404571 short chain dehydrogenase
185386 -0,99953 0,02404571 #N/A
194896 1,37699 0,02451608 hypothetical amine oxidase

224
172934 1,49915 0,02451608 ABC transporter
131892 -1,0236 0,02499962 Major facilitator superfamily
45985 -1,06891 0,02530021 #N/A
129581 -1,7755 0,02669397 Acyl-CoA synthetase
121842 -1,67528 0,02669397 Peptidase S28
42689 -0,83937 0,02669397 -
204317 1,0105 0,0268056 Vacuolar H+-ATPase V0 sector, subunits
189853 -2,10166 0,0279955 -
180652 1,07132 0,0279955 -
54814 -2,67201 0,0279955
D-xylulose 5-phosphate/D-fructose 6-phosphate
phosphoketolase
54811 -0,99196 0,0279955 Hypothetical cytochrome P450 monooxygenase
42058 -1,14734 0,0279955 -
41505 0,85277 0,0279955 Permease of the major facilitator superfamily
38315 0,9098 0,0279955 #N/A
131747 0,86511 0,02813412 candidate b-glycosidase related to b-glucosidases
52528 0,93509 0,02813412 Fungal transcriptional regulatory protein,
52111 1,09087 0,02813412 hypothetical beta-galactosidase. extracellular GH family 2
36926 -1,10463 0,02813412 #N/A
36584 1,69192 0,02813412 Zinc-containing alcohol dehydrogenase superfamily
47677 0,9167 0,02847683 hypothetical xylosidase/arabinanase. GH family 43
142574 -1,27533 0,02859599 #N/A
36048 -0,77714 0,02859599 -
53054 0,76158 0,0286515 Putative Acyl-CoA synthetase
54838 1,77718 0,02905942 Major facilitator superfamily
36428 1,36102 0,02959766 -
208521 -1,97576 0,03147039
hypothetical FAD/FMN-containing dehydrogenase
(COG0277)with transmembrane motif
55139 2,01189 0,03180937 -
124156 2,05216 0,0319541 candidate NAD dependent formate dehydrogenase
209012 1,13324 0,0324385 Proteins containing the FAD binding domain
208129 -0,82775 0,0324385 Glycine cleavage H-protein
193449 -1,46896 0,0324385 -

225
192575 -2,03986 0,0324385 -
189460 0,79228 0,0324385 ABC transporter
183137 1,1747 0,0324385 #N/A
180608 0,8014 0,0324385 -
179079 -1,22533 0,0324385 Putative polyketide synthase
176277 1,01872 0,0324385
RNA-directed RNA polymerase QDE-1 required for
posttranscriptional gene silencing and RNA interference
126639 -2,14383 0,0324385 Peptidase A4, scytalidopepsin B
124657 -1,26063 0,0324385 FAD-dependent pyridine nucleotide-disulphide oxidoreductase
54375 -1,25409 0,0324385 catalase
43258 -0,96493 0,0324385 -
39139 -1,16013 0,0324385 FAD linked oxidase, N-terminal
36404 1,01113 0,0324385 FAD linked oxidase, N-terminal
38587 1,10868 0,03306425 -
209775 1,01241 0,03561154 -
57037 1,09256 0,03561154 -
43746 -1,93172 0,03561154 hypothetical ribonuclease T1
42209 -1,33526 0,03561154 #N/A
52126 -0,85005 0,03627401 Hypothetical endoglucanase
39220 -0,785 0,0367867 #N/A
47922 -1,77529 0,03812475 -
41351 0,92007 0,03812475 -
40016 -1,90396 0,03812475 -
37556 -0,80632 0,03812475
predicted beta-1,6-N-acetylglucosaminyltransferase, contains
WSC domain
194367 -0,69861 0,03832453 #N/A
35461 -0,85465 0,03832453 #N/A
38582 1,18013 0,0393887 FAD-dependent oxidoreductase
171092 -1,0416 0,04008112
Monooxygenase involved in coenzyme Q (ubiquinone)
biosynthesis
44878 -1,82427 0,04008112 hypothetical cytochrome P450 alkane hydroxylase

226
41809 0,81479 0,04008112 Major facilitator superfamily
190025 1,11801 0,04084878 Major facilitator superfamily
195002 0,96907 0,04124574 Synaptic vesicle transporter SVOP and related transporters
42235 -1,24032 0,04124574 -
200723 -1,16641 0,04268402 Glycosyl transferase, family 28
189708 1,62514 0,04268402 #N/A
53801 -0,84711 0,04268402
Hypothetical protein. HMMPfam indicates Glucose-methanol-
choline oxidoreductase activity
43969 -0,89339 0,04268402 hypothetical urea amidolyase (EC 6.3.4.6)
37758 -0,82256 0,04268402
hypothetical beta-1,6-N-acetylglucosaminyltransferase,
contains WSC domain
129269 0,88389 0,04288155 -
127445 1,04344 0,04308731 Predicted haloacid-halidohydrolase and related hydrolases
131668 0,79578 0,04320854 -
35385 1,11829 0,04320854 -
40159 -1,16302 0,04376242 -
181283 0,83558 0,044117 #N/A
135400 0,6801 0,0443291 -
185855 -0,95497 0,04478906 -
189424 0,8642 0,04506741 putative glycosyl transferase
172647 1,43641 0,04506741 Major facilitator superfamily
44895 -1,33134 0,04506741 -
205909 0,92175 0,04517196
ABC transporter associated with fumonisin-like biosyntehetic
gene cluster
185038 -1,13717 0,04539719 #N/A
49482 -0,95109 0,04552901 Amino acid/polyamine transporter II
38747 -1,5204 0,04628072 -
172537 -1,80798 0,04656386 Domain of Unknown function
53901 -0,89926 0,04656386 -
53539 0,57514 0,04656386 -
197387 -1,58982 0,04660097 PHK
199424 0,64249 0,0466086 -

227
191395 0,93314 0,0466086 -
41656 -0,90789 0,0466086 -
37959 1,00772 0,0466086 -
185351 1,00995 0,0470042 Flavonol reductase/cinnamoyl-CoA reductase
177781 1,08451 0,0470042 GCN5-related N-acetyltransferase
57243 1,31046 0,0470042 Hypothetical aldehyde dehydrogenase (EC 1.2.1.3).
42523 0,74635 0,0470042 Hypothetical Inositol monophosphatase
37028 -0,93162 0,0470042 #N/A
48061 1,4729 0,04712327 Hypothetical ABC transporter
182447 0,78813 0,04712847 #N/A
42232 1,02541 0,04712847 -
39016 -0,78318 0,04712847 -
118617 -1,32607 0,04728498 Putative polyketide synthase
45964 -1,27962 0,04728498 -
207586 -1,40055 0,04739164 -
171293 1,48968 0,04739164 Cell adhesin
135939 0,77037 0,04739164 Hypothetical. Contains Esterase/lipase/thioesterase domain
56930 0,78601 0,04739164 Hypothetical sexual differentiation process protein ISP4
50375 0,97126 0,04739164 -
45889 -0,98913 0,04739164 #N/A
40862 -1,20591 0,04739164 hypothetical protein
37734 0,70831 0,04739164 -
36932 1,05438 0,04739164 -
193672 0,5613 0,04750758 #N/A
180570 0,77648 0,04750758 Short-chain dehydrogenase/reductase SDR
173096 1,22542 0,04750758 -
123557 -0,9112 0,04750758 Multicopper oxidase, type 1
52995 1,73775 0,04750758 -
38991 -1,50058 0,04750758 -
125297 1,81776 0,04760674 -
50755 0,87077 0,04760674 putative RTA1 like protein
195023 -0,66933 0,0478762 -
189676 0,63474 0,04789652 Malate/L-lactate dehydrogenase
50239 -2,66889 0,04832042 -
204569 0,78117 0,04839092 -

228
181136 0,84434 0,04839092 Flavoprotein monooxygenase
170237 1,30069 0,04839092 Arylacetamide deacetylase
144091 -1,951 0,04839092 #N/A
54095 1,95798 0,04839092 Sugar (ANd other) transporter
51892 1,39279 0,04839092 Fungal specific transcription factor
198441 -2,71564 0,04869865 -
178352 -0,94167 0,04869865 #N/A
45784 2,17047 0,04869865 -
41210 0,91927 0,04869865 Thioesterase superfamily
125829 -0,83553 0,04877012 Major intrinsic protein
42238 -1,00296 0,04877012 Guanine-specific ribonuclease N1 and T1
41760 -1,50325 0,04877012 #N/A
210951 -1,52228 0,04894317 Glycine cleavage system P-protein
185262 0,80627 0,04894317 Zinc-containing alcohol dehydrogenase superfamily
181429 1,20083 0,04894317 -
181275 0,9252 0,04894317
Related to E. nidulans 1-pyrroline-5-carboxylate
dehydrogenase (prnC) (EC 1.5.1.12)
180773 0,8012 0,04894317 Fungal transcriptional regulatory protein, N-terminal
180730 0,78696 0,04894317 -
126898 -0,80603 0,04894317 -
118581 -1,31038 0,04894317 Putative polyketide synthase
52994 1,67496 0,04894317 -
44117 -0,74947 0,04894317 ankyrin-repeat protein
43835 -0,69884 0,04894317 #N/A
37775 0,71099 0,04894317 hypothetical protein containing Zn-finger, C2H2 type domain
207689 0,78657 0,04944183 Peptidase M20
189642 -0,93506 0,04944183 -
186770 -0,94032 0,04944183 #N/A
181473 -1,68096 0,04944183 FMN-dependent alpha-hydroxy acid dehydrogenase
132291 -2,68041 0,04944183 Sugar (ANd other) transporter
52848 -1,76481 0,04944183 -

229
40747 -1,14461 0,04944183 -
39988 0,70264 0,04944183 -
39278 -2,12847 0,04944183 Inorganic ion transport and metabolism
38134 1,71656 0,04944183 #N/A
212059 0,81707 0,0496284 -
41769 1,00626 0,0496284 -
181881 0,6802 0,04993862 #N/A
126848 0,70492 0,04993862
Hypothetical Glucose-6-phosphate/phosphate and
phosphoenolpyruvate/phosphate antiporter
121874 -0,9241 0,04996624 putative extracellular carboxylesterase, type B
47967 -2,82492 0,04996624 Alternative oxidase, mitochondrial precursor

230
Appendix 4

231
SDS-page gel pictures of Chapter 7
PIM195
96
48
33
28
22
12
142
71
Δp
rtT
_1
Δp
rtT
_2
Δtf
10
WT
_1
WT
_2
Δp
rtT
_1
Δp
rtT
_2
Δtf
10
WT
_1
WT
_2
SSMM
T=65 hMM
T=40 h
195142
9671
48
33
2822
12
WT_
2
Δp
rtT
_2
Δtf
10
_2
Δtf
10
_1
Δp
rtT
_1
WT_
1
WT_
1
WT_
2
Δp
rtT_
1
Δp
rtT
_2
Δtf
10
_1
Δtf
10
_2
PIM T=42 h
PIM T=66 h
S S S
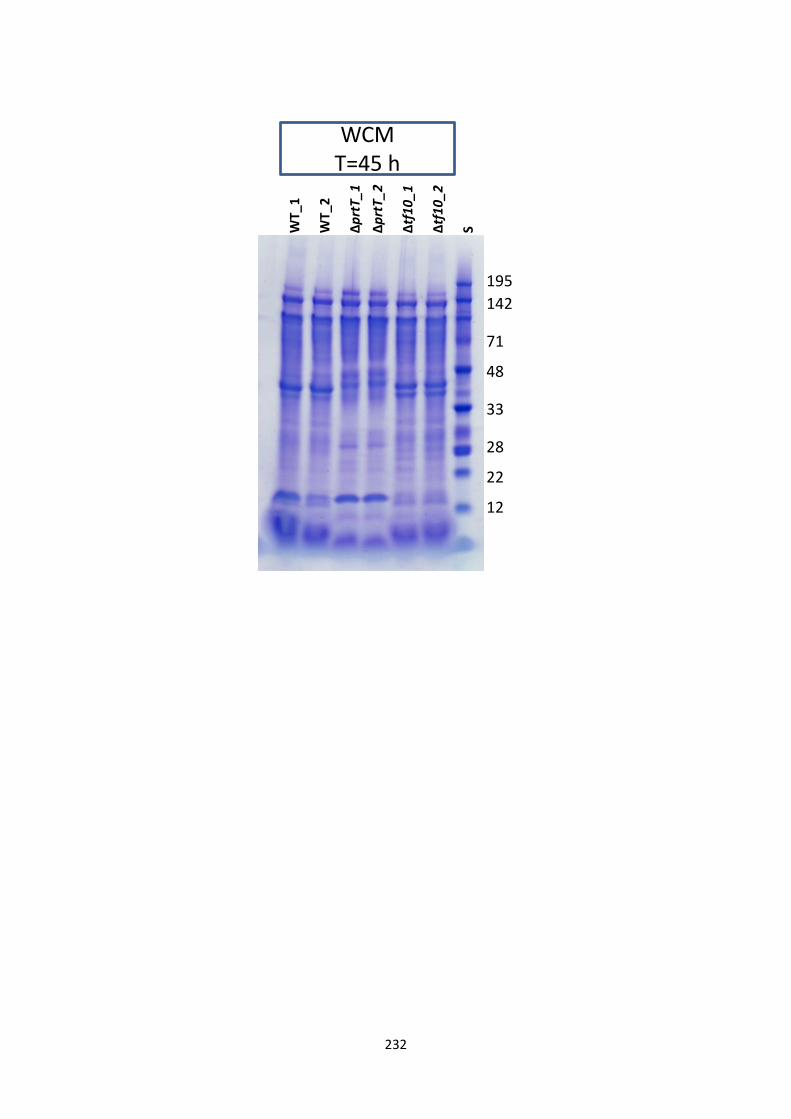
232
195
48
33
28
22
12
142
71
SWT_
1
Δtf
10
_2
Δp
rtT
_2
Δp
rtT
_1
Δtf
10
_1
WT_
2
WCM T=45 h

233
Appendix 5 Integrated Biolog data of Chapter 8
Compound Plate ID Source OD AUC STD GFP AUC STD
Negative Control PM1 C-Source 0,0 N/A 0,0 N/A
L-Arabinose PM1 C-Source 33,1 N/A 365,7 N/A
N-Acetyl-D-Glucosamine PM1 C-Source 65,9 N/A 1466,0 N/A
D-Saccharic Acid PM1 C-Source 0,1 N/A 0,0 N/A
Succinic Acid PM1 C-Source 5,1 N/A 759,2 N/A
D-Galactose PM1 C-Source 10,9 N/A 0,0 N/A
L-Aspartic Acid PM1 C-Source 0,6 N/A 961,1 N/A
L-Proline PM1 C-Source 31,0 N/A 2049,6 N/A
D-Alanine PM1 C-Source 1,1 N/A 2218,8 N/A
D-Trehalose PM1 C-Source 38,8 N/A 2464,7 N/A
D-Mannose PM1 C-Source 32,1 N/A 930,8 N/A
Dulcitol PM1 C-Source 27,2 N/A 32,3 N/A
D-Serine PM1 C-Source 1,7 N/A 1352,2 N/A
D-Sorbitol PM1 C-Source 39,5 N/A 0,0 N/A
Glycerol PM1 C-Source 17,2 N/A 969,6 N/A
L-Fucose PM1 C-Source 1,8 N/A 148,3 N/A
D-Glucuronic Acid PM1 C-Source 0,0 N/A 0,0 N/A
D-Gluconic Acid PM1 C-Source 7,7 N/A 0,0 N/A
D,L-a-Glycerol Phosphate PM1 C-Source 0,2 N/A 0,0 N/A
D-Xylose PM1 C-Source 36,3 N/A 0,0 N/A
D,L-Lactic acid PM1 C-Source 0,0 N/A 0,0 N/A
Formic Acid PM1 C-Source 0,0 N/A 20,0 N/A
D-Mannitol PM1 C-Source 1,0 N/A 0,0 N/A
L-Glutamic Acid PM1 C-Source 0,0 N/A 623,2 N/A
D-Glucose-6-Phosphate PM1 C-Source 0,5 N/A 0,0 N/A
D-Galactonic Acid-g-Lactone PM1 C-Source 1,6 N/A 509,5 N/A
D,L-Malic Acid PM1 C-Source 6,3 N/A 451,9 N/A
D-Ribose PM1 C-Source 10,0 N/A 2517,6 N/A
Tween 20 PM1 C-Source 5,6 N/A 302,9 N/A
L-Rhamnose PM1 C-Source 32,8 N/A 1187,7 N/A
D-Fructose PM1 C-Source 52,2 N/A 189,7 N/A
Acetic Acid PM1 C-Source 6,0 N/A 0,0 N/A
a-D-Glucose PM1 C-Source 57,5 N/A 2750,3 N/A
Maltose PM1 C-Source 26,3 N/A 710,4 N/A
D-Melibiose PM1 C-Source 26,0 N/A 0,0 N/A
Thymidine PM1 C-Source 0,0 N/A 912,6 N/A
L-Asparagine PM1 C-Source 10,7 N/A 432,3 N/A
D-Aspartic Acid PM1 C-Source 0,6 N/A 0,0 N/A
D-Glucosaminic Acid PM1 C-Source 0,0 N/A 0,0 N/A
1,2-Propanediol PM1 C-Source 0,2 N/A 1035,5 N/A
Tween 40 PM1 C-Source 4,7 N/A 1122,3 N/A
a-Ketoglutaric Acid PM1 C-Source 3,4 N/A 0,0 N/A
a-Ketobutyric Acid PM1 C-Source 2,0 N/A 487,4 N/A
a-Methyl-D-Galactoside PM1 C-Source 3,2 N/A 0,0 N/A
a-D-Lactose PM1 C-Source 0,0 N/A 0,0 N/A
Lactulose PM1 C-Source 0,0 N/A 1402,5 N/A
Sucrose PM1 C-Source 38,0 N/A 82,0 N/A
Uridine PM1 C-Source 0,0 N/A 123,9 N/A

234
L-Glutamine PM1 C-Source 11,5 N/A 0,0 N/A
m-Tartaric Acid PM1 C-Source 0,0 N/A 0,0 N/A
D-Glucose-1-Phosphate PM1 C-Source 0,0 N/A 0,0 N/A
D-Fructose-6-Phosphate PM1 C-Source 0,0 N/A 0,0 N/A
Tween 80 PM1 C-Source 7,6 N/A 0,0 N/A
a-Hydroxyglutaric Acid-g-Lactone PM1 C-Source 3,6 N/A 1026,8 N/A
a-Hydroxybutyric Acid PM1 C-Source 3,5 N/A 967,2 N/A
b-Methyl-D-Glucoside PM1 C-Source 43,0 N/A 0,0 N/A
Adonitol PM1 C-Source 6,6 N/A 0,0 N/A
Maltotriose PM1 C-Source 51,7 N/A 0,0 N/A
2'-Deoxyadenosine PM1 C-Source 0,0 N/A 0,0 N/A
Adenosine PM1 C-Source 0,0 N/A 355,2 N/A
Gly-Asp PM1 C-Source 4,8 N/A 0,0 N/A
Citric Acid PM1 C-Source 7,1 N/A 0,0 N/A
m-Inositol PM1 C-Source 19,9 N/A 635,4 N/A
D-Threonine PM1 C-Source 1,4 N/A 2454,6 N/A
Fumaric Acid PM1 C-Source 2,3 N/A 0,0 N/A
Bromosuccinic Acid PM1 C-Source 2,3 N/A 391,1 N/A
Propionic Acid PM1 C-Source 6,1 N/A 0,0 N/A
Mucic Acid PM1 C-Source 0,3 N/A 0,0 N/A
Glycolic Acid PM1 C-Source 0,9 N/A 0,0 N/A
Glyoxylic Acid PM1 C-Source 7,2 N/A 1764,7 N/A
D-Cellobiose PM1 C-Source 42,2 N/A 0,0 N/A
Inosine PM1 C-Source 0,0 N/A 0,0 N/A
Gly-Glu PM1 C-Source 3,3 N/A 539,9 N/A
Tricarballylic Acid PM1 C-Source 0,0 N/A 0,0 N/A
L-Serine PM1 C-Source 3,7 N/A 0,0 N/A
L-Threonine PM1 C-Source 4,0 N/A 0,0 N/A
L-Alanine PM1 C-Source 16,9 N/A 0,0 N/A
Ala-Gly PM1 C-Source 4,2 N/A 0,0 N/A
Acetoacetic Acid PM1 C-Source 0,0 N/A 0,0 N/A
N-Acetyl-D-Mannosamine PM1 C-Source 0,0 N/A 306,0 N/A
Mono-Methylsuccinate PM1 C-Source 3,2 N/A 805,3 N/A
Methylpyruvate PM1 C-Source 1,3 N/A 0,0 N/A
D-Malic Acid PM1 C-Source 4,4 N/A 254,5 N/A
L-Malic Acid PM1 C-Source 0,0 N/A 227,3 N/A
Gly-Pro PM1 C-Source 11,1 N/A 177,3 N/A
p-Hydroxyphenyl Acetic Acid PM1 C-Source 8,5 N/A 309,5 N/A
m-Hydroxyphenyl Acetic Acid PM1 C-Source 3,5 N/A 0,0 N/A
Tyramine PM1 C-Source 15,3 N/A 919,6 N/A
D-Psicose PM1 C-Source 7,2 N/A 0,0 N/A
L-Lyxose PM1 C-Source 10,1 N/A 3109,0 N/A
Glucuronamide PM1 C-Source 0,0 N/A 826,3 N/A
Pyruvic Acid PM1 C-Source 0,0 N/A 0,0 N/A
L-Galactonic Acid-g-Lactone PM1 C-Source 5,8 N/A 785,8 N/A
D-Galacturonic Acid PM1 C-Source 7,0 N/A 1643,4 N/A
b-Phenylethylamine PM1 C-Source 0,0 N/A 0,0 N/A
2-Aminoethanol PM1 C-Source 0,7 N/A 257,2 N/A
Negative Control PM2A C-Source 0,0 0,0 0,0 0,0
Chondroitin Sulfate C PM2A C-Source 0,7 0,0 43,5 61,6
a-Cyclodextrin PM2A C-Source 1,7 1,8 904,6 1279,3
b-Cyclodextrin PM2A C-Source 1,5 2,1 0,0 0,0

235
g-Cyclodextrin PM2A C-Source 13,4 15,1 79,5 112,4
Dextrin PM2A C-Source 17,1 0,9 0,5 0,7
Gelatin PM2A C-Source 2,1 2,7 732,9 84,0
Glycogen PM2A C-Source 13,6 6,9 1071,8 1515,7
Inulin PM2A C-Source 9,5 3,0 28,4 40,1
Laminarin PM2A C-Source 18,9 2,7 569,7 805,7
Mannan PM2A C-Source 3,0 4,2 65,2 92,2
Pectin PM2A C-Source 1,2 1,7 593,6 839,4
N-Acetyl-D-Galactosamine PM2A C-Source 0,0 0,0 41,8 59,1
N-Acetyl-Neuraminic Acid PM2A C-Source 0,0 0,0 146,1 206,5
b-D-Allose PM2A C-Source 0,8 1,2 678,5 792,8
Amygdalin PM2A C-Source 23,0 2,0 863,7 725,5
D-Arabinose PM2A C-Source 3,9 0,5 1723,8 2437,8
D-Arabitol PM2A C-Source 9,4 0,8 91,7 129,7
L-Arabitol PM2A C-Source 9,7 3,6 374,0 528,8
Arbutin PM2A C-Source 19,5 0,8 6278,0 2453,0
2-Deoxy-D-Ribose PM2A C-Source 6,8 2,0 2489,6 1520,8
i-Erythritol PM2A C-Source 16,0 6,8 679,0 960,2
D-Fucose PM2A C-Source 7,9 4,2 1012,0 167,1
3-0-?-D-Galactopyranosyl-D-Arabinose
PM2A C-Source 10,9 13,8 1609,3 2275,9
Gentiobiose PM2A C-Source 31,1 0,9 681,0 317,7
L-Glucose PM2A C-Source 0,0 0,0 164,8 57,4
D-Lactitol PM2A C-Source 0,0 0,0 1507,6 2132,0
D-Melezitose PM2A C-Source 15,3 8,8 986,5 1395,1
Maltitol PM2A C-Source 1,8 1,3 29,7 41,9
a-Methyl-D-Glucoside PM2A C-Source 0,7 1,0 120,2 169,9
b-Methyl-D-Galactoside PM2A C-Source 3,1 4,4 846,8 151,0
3-Methylglucose PM2A C-Source 3,5 3,1 259,5 367,0
b-Methyl-D-Glucuronic Acid PM2A C-Source 0,0 0,0 544,7 168,0
a-Methyl-D-Mannoside PM2A C-Source 3,3 4,6 114,5 162,0
b-Methyl-D-Xyloside PM2A C-Source 0,2 0,2 418,5 301,5
Palatinose PM2A C-Source 28,5 9,7 563,3 355,7
D-Raffinose PM2A C-Source 41,8 4,0 441,1 623,8
Salicin PM2A C-Source 14,4 0,6 1491,8 14,8
Sedoheptulosan PM2A C-Source 2,7 3,9 733,8 305,2
L-Sorbose PM2A C-Source 9,7 1,7 328,0 70,4
Stachyose PM2A C-Source 44,5 4,1 121,7 172,1
D-Tagatose PM2A C-Source 2,1 2,9 242,6 47,7
Turanose PM2A C-Source 14,5 0,8 220,5 154,0
Xylitol PM2A C-Source 8,3 2,6 217,2 307,1
N-Acetyl-D-glucosaminitol PM2A C-Source 0,0 0,0 1052,6 604,2
g-Amino-N-Butyric Acid PM2A C-Source 11,8 1,7 967,2 87,6
d-Amino Valeric Acid PM2A C-Source 1,9 0,4 700,2 151,1
Sodium butyrate PM2A C-Source 1,1 1,5 93,9 132,8
Capric Acid PM2A C-Source 0,0 0,0 1257,7 156,9
Caproic Acid PM2A C-Source 7,7 1,7 1,4 2,0
Citraconic Acid PM2A C-Source 2,6 3,7 445,0 629,3
D,L-Citramalic Acid PM2A C-Source 1,0 1,3 251,2 84,8
D-Glucosamine PM2A C-Source 19,1 9,1 2432,1 1204,5
2-Hydroxybenzoic acid PM2A C-Source 19,3 3,2 102,0 144,3
4-Hydroxybenzoic Acid PM2A C-Source 10,3 0,3 7,1 10,1

236
b-Hydroxybutyric Acid PM2A C-Source 0,0 0,0 144,6 204,5
g-Hydroxybutyric Acid PM2A C-Source 2,8 2,2 242,7 110,8
2-Oxovaleric acid PM2A C-Source 0,0 0,0 38,5 54,4
Itaconic Acid PM2A C-Source 0,6 0,8 352,1 498,0
5-Keto-D-Gluconic Acid PM2A C-Source 0,0 0,0 701,9 992,7
D-Lactic Acid Methyl Ester PM2A C-Source 0,6 0,7 185,4 262,2
Malonic Acid PM2A C-Source 0,0 0,0 560,5 163,8
Melibionic Acid PM2A C-Source 0,5 0,7 318,3 450,1
Oxalic Acid PM2A C-Source 0,1 0,1 93,2 131,7
Oxalomalic Acid PM2A C-Source 0,4 0,6 983,8 169,0
Quinic Acid PM2A C-Source 9,7 0,7 1219,6 1724,8
D-Ribono-1,4-Lactone PM2A C-Source 0,0 0,0 6,1 8,6
Sebacic Acid PM2A C-Source 7,7 2,8 368,1 520,6
Sorbic Acid PM2A C-Source 5,0 7,0 1370,2 1382,8
Succinamic Acid PM2A C-Source 1,3 1,8 99,7 141,0
D-Tartaric Acid PM2A C-Source 0,1 0,2 545,4 771,3
L-Tartaric Acid PM2A C-Source 1,6 2,3 689,6 246,0
Acetamide PM2A C-Source 0,0 0,0 94,2 133,1
L-Alaninamide PM2A C-Source 0,0 0,0 72,2 102,0
N-Acetyl-L-Glutamic Acid PM2A C-Source 0,0 0,0 0,0 0,0
L-Arginine PM2A C-Source 7,1 1,2 1721,5 68,7
Glycine PM2A C-Source 1,5 1,8 0,0 0,0
L-Histidine PM2A C-Source 1,8 0,4 1018,9 95,5
L-Homoserine PM2A C-Source 0,4 0,5 853,6 1207,1
Hydroxy-L-Proline PM2A C-Source 0,0 0,0 784,2 304,2
L-Isoleucine PM2A C-Source 0,0 0,0 543,6 768,8
L-Leucine PM2A C-Source 0,0 0,0 179,5 201,2
L-Lysine PM2A C-Source 0,0 0,0 176,9 250,2
L-Methionine PM2A C-Source 0,0 0,0 155,2 219,4
L-Ornithine PM2A C-Source 5,5 0,9 0,5 0,7
L-Phenylalanine PM2A C-Source 3,2 0,3 148,0 209,3
L-Pyroglutamic Acid PM2A C-Source 5,2 2,1 1442,0 370,7
L-Valine PM2A C-Source 0,0 0,0 256,2 362,3
D,L-Carnitine PM2A C-Source 0,0 0,0 97,4 137,7
Sec-Butylamine PM2A C-Source 0,2 0,3 287,3 406,2
D,L-Octopamine PM2A C-Source 0,0 0,0 567,4 802,4
Putrescine PM2A C-Source 2,9 2,0 116,5 164,8
Dihydroxyacetone PM2A C-Source 5,3 1,5 4602,8 245,0
2,3-Butanediol PM2A C-Source 0,0 0,0 520,2 735,6
2,3-Butanone PM2A C-Source 0,3 0,5 299,6 423,7
3-Hydroxy 2-Butanone PM2A C-Source 0,0 0,0 805,7 903,4
Negative Control PM3B N-Source 0,0 N/A 0 N/A
Ammonia PM3B N-Source 21,5 N/A 0 N/A
Nitrite PM3B N-Source 33,7 N/A 0 N/A
Nitrate PM3B N-Source 42,2 N/A 0 N/A
Urea PM3B N-Source 61,6 N/A 362,3 N/A
Biuret PM3B N-Source 0,0 N/A 0 N/A
L-Alanine PM3B N-Source 58,7 N/A 0 N/A
L-Arginine PM3B N-Source 60,3 N/A 643,1 N/A
L-Asparagine PM3B N-Source 58,7 N/A 1008,05 N/A
L-Aspartic Acid PM3B N-Source 45,5 N/A 0 N/A
L-Cysteine PM3B N-Source 17,3 N/A 165,4 N/A

237
L-Glutamic Acid PM3B N-Source 48,1 N/A 567,95 N/A
L-Glutamine PM3B N-Source 56,9 N/A 0 N/A
Glycine PM3B N-Source 71,3 N/A 0 N/A
L-Histidine PM3B N-Source 33,2 N/A 427,35 N/A
L-Isoleucine PM3B N-Source 18,5 N/A 0 N/A
L-Leucine PM3B N-Source 22,8 N/A 0 N/A
L-Lysine PM3B N-Source 5,9 N/A 0 N/A
L-Methionine PM3B N-Source 61,9 N/A 0 N/A
L-Phenylalanine PM3B N-Source 22,9 N/A 322,55 N/A
L-Proline PM3B N-Source 37,3 N/A 0 N/A
L-Serine PM3B N-Source 43,4 N/A 218 N/A
L-Threonine PM3B N-Source 55,8 N/A 420,25 N/A
L-Tryptophan PM3B N-Source 39,2 N/A 1882,05 N/A
L-Tyrosine PM3B N-Source 0,0 N/A 544,85 N/A
L-Valine PM3B N-Source 38,1 N/A 0 N/A
D-Alanine PM3B N-Source 17,3 N/A 0 N/A
D-Asparagine PM3B N-Source 27,8 N/A 21,3 N/A
D-Aspartic Acid PM3B N-Source 2,8 N/A 137,2 N/A
D-Glutamic Acid PM3B N-Source 0,0 N/A 606,25 N/A
D-Lysine PM3B N-Source 9,3 N/A 0 N/A
D-Serine PM3B N-Source 0,0 N/A 0 N/A
D-Valine PM3B N-Source 0,1 N/A 0 N/A
L-Citrulline PM3B N-Source 45,5 N/A 365,15 N/A
L-Homoserine PM3B N-Source 23,3 N/A 0 N/A
L-Ornithine PM3B N-Source 83,4 N/A 0 N/A
N-Acetyl-L-Glutamic Acid PM3B N-Source 7,4 N/A 0 N/A
N-Phthaloyl-L-Glutamic Acid PM3B N-Source 7,4 N/A 0 N/A
L-Pyroglutamic Acid PM3B N-Source 58,0 N/A 0 N/A
Hydroxylamine PM3B N-Source 0,0 N/A 292,2 N/A
Methylamine PM3B N-Source 73,7 N/A 0 N/A
N-Amylamine PM3B N-Source 12,9 N/A 0 N/A
N-Butylamine PM3B N-Source 20,3 N/A 0 N/A
Ethylamine PM3B N-Source 15,1 N/A 0 N/A
Ethanolamine PM3B N-Source 40,9 N/A 0 N/A
Ethylenediamine PM3B N-Source 6,7 N/A 0 N/A
Putrescine PM3B N-Source 32,0 N/A 0 N/A
Agmatine PM3B N-Source 45,0 N/A 538,8 N/A
Histamine PM3B N-Source 12,5 N/A 0 N/A
b-Phenylethylamine PM3B N-Source 41,0 N/A 68,35 N/A
Tyramine PM3B N-Source 36,0 N/A 1272,9 N/A
Acetamide PM3B N-Source 8,6 N/A 0 N/A
Formamide PM3B N-Source 0,0 N/A 0 N/A
Glucuronamide PM3B N-Source 6,7 N/A 0 N/A
D,L-Lactamide PM3B N-Source 9,8 N/A 98,85 N/A
D-Glucosamine PM3B N-Source 23,3 N/A 0 N/A
D-Galactosamine PM3B N-Source 1,9 N/A 0 N/A
D-Mannosamine PM3B N-Source 8,0 N/A 5,75 N/A
N-Acetyl-D-Glucosamine PM3B N-Source 68,1 N/A 835,2 N/A
N-Acetyl-D-Galactosamine PM3B N-Source 0,0 N/A 0 N/A
N-Acetyl-D-Mannosamine PM3B N-Source 0,0 N/A 0 N/A
Adenine PM3B N-Source 33,4 N/A 0 N/A
Adenosine PM3B N-Source 76,8 N/A 0 N/A
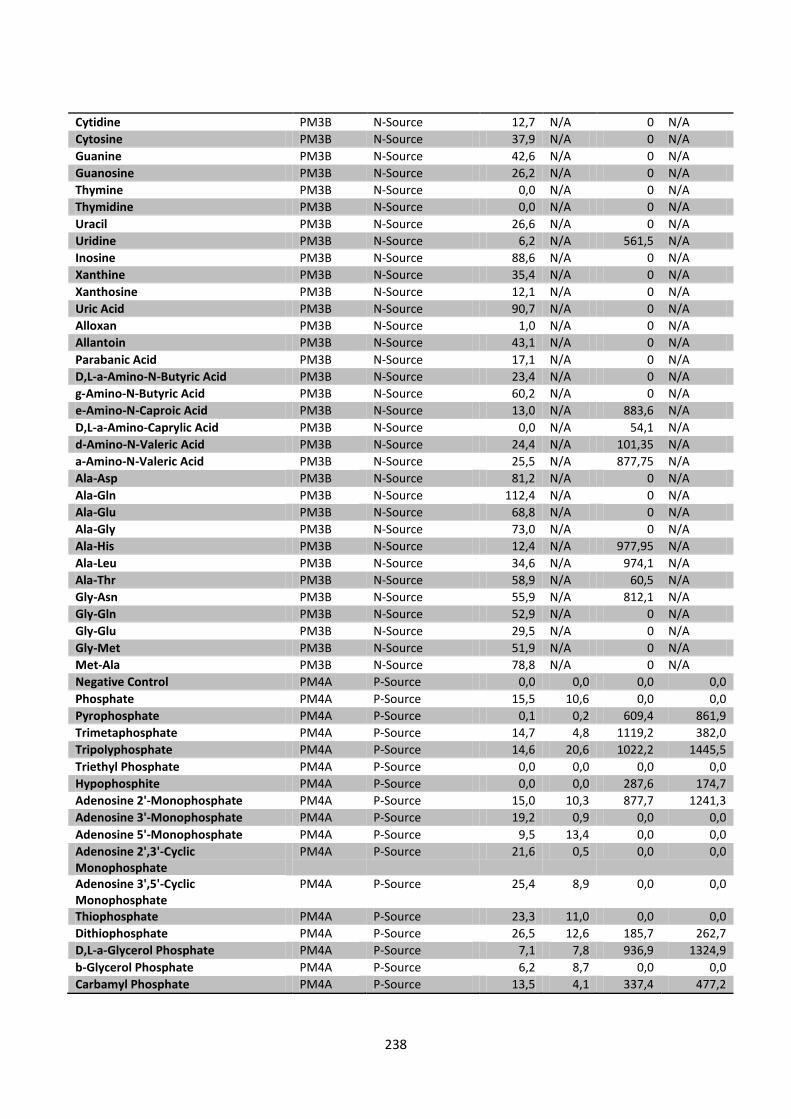
238
Cytidine PM3B N-Source 12,7 N/A 0 N/A
Cytosine PM3B N-Source 37,9 N/A 0 N/A
Guanine PM3B N-Source 42,6 N/A 0 N/A
Guanosine PM3B N-Source 26,2 N/A 0 N/A
Thymine PM3B N-Source 0,0 N/A 0 N/A
Thymidine PM3B N-Source 0,0 N/A 0 N/A
Uracil PM3B N-Source 26,6 N/A 0 N/A
Uridine PM3B N-Source 6,2 N/A 561,5 N/A
Inosine PM3B N-Source 88,6 N/A 0 N/A
Xanthine PM3B N-Source 35,4 N/A 0 N/A
Xanthosine PM3B N-Source 12,1 N/A 0 N/A
Uric Acid PM3B N-Source 90,7 N/A 0 N/A
Alloxan PM3B N-Source 1,0 N/A 0 N/A
Allantoin PM3B N-Source 43,1 N/A 0 N/A
Parabanic Acid PM3B N-Source 17,1 N/A 0 N/A
D,L-a-Amino-N-Butyric Acid PM3B N-Source 23,4 N/A 0 N/A
g-Amino-N-Butyric Acid PM3B N-Source 60,2 N/A 0 N/A
e-Amino-N-Caproic Acid PM3B N-Source 13,0 N/A 883,6 N/A
D,L-a-Amino-Caprylic Acid PM3B N-Source 0,0 N/A 54,1 N/A
d-Amino-N-Valeric Acid PM3B N-Source 24,4 N/A 101,35 N/A
a-Amino-N-Valeric Acid PM3B N-Source 25,5 N/A 877,75 N/A
Ala-Asp PM3B N-Source 81,2 N/A 0 N/A
Ala-Gln PM3B N-Source 112,4 N/A 0 N/A
Ala-Glu PM3B N-Source 68,8 N/A 0 N/A
Ala-Gly PM3B N-Source 73,0 N/A 0 N/A
Ala-His PM3B N-Source 12,4 N/A 977,95 N/A
Ala-Leu PM3B N-Source 34,6 N/A 974,1 N/A
Ala-Thr PM3B N-Source 58,9 N/A 60,5 N/A
Gly-Asn PM3B N-Source 55,9 N/A 812,1 N/A
Gly-Gln PM3B N-Source 52,9 N/A 0 N/A
Gly-Glu PM3B N-Source 29,5 N/A 0 N/A
Gly-Met PM3B N-Source 51,9 N/A 0 N/A
Met-Ala PM3B N-Source 78,8 N/A 0 N/A
Negative Control PM4A P-Source 0,0 0,0 0,0 0,0
Phosphate PM4A P-Source 15,5 10,6 0,0 0,0
Pyrophosphate PM4A P-Source 0,1 0,2 609,4 861,9
Trimetaphosphate PM4A P-Source 14,7 4,8 1119,2 382,0
Tripolyphosphate PM4A P-Source 14,6 20,6 1022,2 1445,5
Triethyl Phosphate PM4A P-Source 0,0 0,0 0,0 0,0
Hypophosphite PM4A P-Source 0,0 0,0 287,6 174,7
Adenosine 2'-Monophosphate PM4A P-Source 15,0 10,3 877,7 1241,3
Adenosine 3'-Monophosphate PM4A P-Source 19,2 0,9 0,0 0,0
Adenosine 5'-Monophosphate PM4A P-Source 9,5 13,4 0,0 0,0
Adenosine 2',3'-Cyclic Monophosphate
PM4A P-Source 21,6 0,5 0,0 0,0
Adenosine 3',5'-Cyclic Monophosphate
PM4A P-Source 25,4 8,9 0,0 0,0
Thiophosphate PM4A P-Source 23,3 11,0 0,0 0,0
Dithiophosphate PM4A P-Source 26,5 12,6 185,7 262,7
D,L-a-Glycerol Phosphate PM4A P-Source 7,1 7,8 936,9 1324,9
b-Glycerol Phosphate PM4A P-Source 6,2 8,7 0,0 0,0
Carbamyl Phosphate PM4A P-Source 13,5 4,1 337,4 477,2

239
D-2-Phospho-Glyceric Acid PM4A P-Source 16,1 7,4 92,2 130,4
D-3-Phospho-Glyceric Acid PM4A P-Source 45,6 4,8 0,0 0,0
Guanosine 2'-Monophosphate PM4A P-Source 12,1 4,0 0,0 0,0
Guanosine 3'-Monophosphate PM4A P-Source 22,2 5,6 0,0 0,0
Guanosine 5'-Monophosphate PM4A P-Source 11,4 1,1 660,4 495,0
Guanosine 2',3'-Cyclic Monophosphate
PM4A P-Source 20,2 1,6 464,0 1,7
Guanosine 3',5'-Cyclic Monophosphate
PM4A P-Source 23,4 3,4 901,6 558,9
Phosphoenol Pyruvate PM4A P-Source 16,0 18,7 92,9 131,3
Phospho-Glycolic Acid PM4A P-Source 11,0 2,2 0,0 0,0
D-Glucose-1-Phosphate PM4A P-Source 14,6 10,6 647,0 915,0
D-Glucose-6-Phosphate PM4A P-Source 0,0 0,0 0,0 0,0
2-Deoxy-D-Glucose 6-Phosphate PM4A P-Source 0,0 0,0 239,9 339,3
D-Glucosamine-6-Phosphate PM4A P-Source 45,0 2,9 166,9 236,0
6-Phospho-Gluconic Acid PM4A P-Source 20,3 12,8 0,0 0,0
Cytidine 2'-Monophosphate PM4A P-Source 13,2 5,0 675,7 955,5
Cytidine 3'-Monophosphate PM4A P-Source 11,6 12,0 333,3 471,4
Cytidine 5'-Monophosphate PM4A P-Source 13,0 7,3 0,0 0,0
Cytidine 2',3'-Cyclic Monophosphate PM4A P-Source 12,3 17,4 475,6 672,6
Cytidine 3',5'-Cyclic Monophosphate PM4A P-Source 20,8 9,0 111,3 157,4
D-Mannose-1-Phosphate PM4A P-Source 4,4 6,2 462,0 144,7
D-Mannose-6-Phosphate PM4A P-Source 9,6 13,5 741,6 1048,8
Cysteamine-S-Phosphate PM4A P-Source 21,2 17,3 323,5 457,4
Phospho-L-Arginine PM4A P-Source 21,1 9,7 524,0 110,6
O-Phospho-D-Serine PM4A P-Source 0,7 1,0 806,6 1140,7
O-Phospho-L-Serine PM4A P-Source 40,9 25,0 287,0 405,9
O-Phospho-L-Threonine PM4A P-Source 31,3 2,4 176,9 250,1
Uridine 2'-Monophosphate PM4A P-Source 19,6 27,8 196,6 278,0
Uridine 3'-Monophosphate PM4A P-Source 17,7 1,5 412,8 583,8
Uridine 5'-Monophosphate PM4A P-Source 5,0 7,1 519,6 95,0
Uridine 2',3'-Cyclic Monophosphate PM4A P-Source 11,8 0,3 610,5 863,4
Uridine 3',5'-Cyclic Monophosphate PM4A P-Source 10,9 10,2 1146,7 671,2
O-Phospho-D-Tyrosine PM4A P-Source 12,3 3,3 163,7 54,4
O-Phospho-L-Tyrosine PM4A P-Source 5,1 7,3 0,0 0,0
Phosphocreatine PM4A P-Source 10,5 11,3 779,9 1102,9
Phosphoryl Choline PM4A P-Source 22,2 7,5 449,1 306,7
O-Phosphoryl-Ethanolamine PM4A P-Source 14,1 9,1 0,0 0,0
Phosphono Acetic Acid PM4A P-Source 3,4 4,9 362,6 512,7
2-Aminoethyl Phosphonic Acid PM4A P-Source 6,2 7,0 93,9 132,7
Methylene Diphosphonic Acid PM4A P-Source 1,9 2,7 0,0 0,0
Thymidine 3'-Monophosphate PM4A P-Source 17,7 8,7 251,8 356,1
Thymidine 5'-Monophosphate PM4A P-Source 41,2 5,5 0,0 0,0
Inositol Hexaphosphate PM4A P-Source 3,6 3,7 327,0 266,9
Thymidine 3',5'-Cyclic Monophosphate
PM4A P-Source 20,0 4,7 26,1 36,9
Negative Control PM4A S-Source 21,8 1,4 511,6 472,7
Sulfate PM4A S-Source 13,2 8,3 0,0 0,0
Thiosulfate PM4A S-Source 25,7 15,6 378,0 534,5
Tetrathionate PM4A S-Source 15,9 11,9 361,6 511,4
Thiophosphate PM4A S-Source 27,6 24,4 547,2 96,5
Dithiophosphate PM4A S-Source 13,1 6,0 295,8 418,3
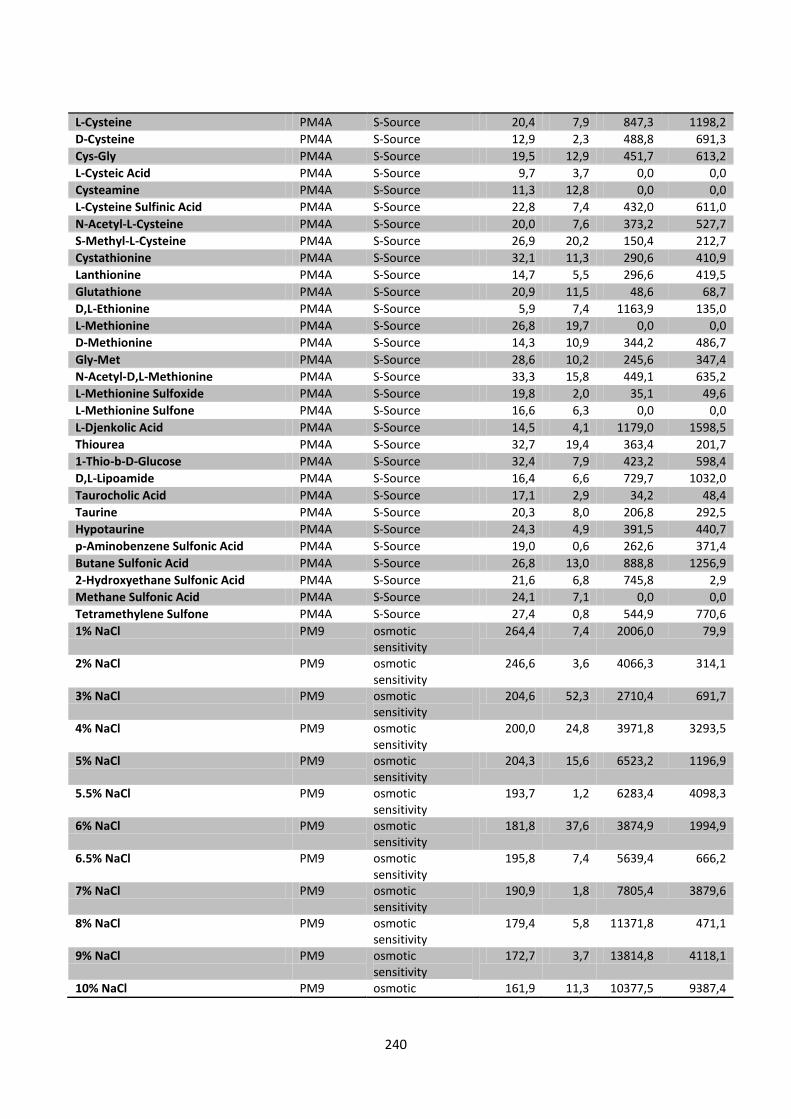
240
L-Cysteine PM4A S-Source 20,4 7,9 847,3 1198,2
D-Cysteine PM4A S-Source 12,9 2,3 488,8 691,3
Cys-Gly PM4A S-Source 19,5 12,9 451,7 613,2
L-Cysteic Acid PM4A S-Source 9,7 3,7 0,0 0,0
Cysteamine PM4A S-Source 11,3 12,8 0,0 0,0
L-Cysteine Sulfinic Acid PM4A S-Source 22,8 7,4 432,0 611,0
N-Acetyl-L-Cysteine PM4A S-Source 20,0 7,6 373,2 527,7
S-Methyl-L-Cysteine PM4A S-Source 26,9 20,2 150,4 212,7
Cystathionine PM4A S-Source 32,1 11,3 290,6 410,9
Lanthionine PM4A S-Source 14,7 5,5 296,6 419,5
Glutathione PM4A S-Source 20,9 11,5 48,6 68,7
D,L-Ethionine PM4A S-Source 5,9 7,4 1163,9 135,0
L-Methionine PM4A S-Source 26,8 19,7 0,0 0,0
D-Methionine PM4A S-Source 14,3 10,9 344,2 486,7
Gly-Met PM4A S-Source 28,6 10,2 245,6 347,4
N-Acetyl-D,L-Methionine PM4A S-Source 33,3 15,8 449,1 635,2
L-Methionine Sulfoxide PM4A S-Source 19,8 2,0 35,1 49,6
L-Methionine Sulfone PM4A S-Source 16,6 6,3 0,0 0,0
L-Djenkolic Acid PM4A S-Source 14,5 4,1 1179,0 1598,5
Thiourea PM4A S-Source 32,7 19,4 363,4 201,7
1-Thio-b-D-Glucose PM4A S-Source 32,4 7,9 423,2 598,4
D,L-Lipoamide PM4A S-Source 16,4 6,6 729,7 1032,0
Taurocholic Acid PM4A S-Source 17,1 2,9 34,2 48,4
Taurine PM4A S-Source 20,3 8,0 206,8 292,5
Hypotaurine PM4A S-Source 24,3 4,9 391,5 440,7
p-Aminobenzene Sulfonic Acid PM4A S-Source 19,0 0,6 262,6 371,4
Butane Sulfonic Acid PM4A S-Source 26,8 13,0 888,8 1256,9
2-Hydroxyethane Sulfonic Acid PM4A S-Source 21,6 6,8 745,8 2,9
Methane Sulfonic Acid PM4A S-Source 24,1 7,1 0,0 0,0
Tetramethylene Sulfone PM4A S-Source 27,4 0,8 544,9 770,6
1% NaCl PM9 osmotic sensitivity
264,4 7,4 2006,0 79,9
2% NaCl PM9 osmotic sensitivity
246,6 3,6 4066,3 314,1
3% NaCl PM9 osmotic sensitivity
204,6 52,3 2710,4 691,7
4% NaCl PM9 osmotic sensitivity
200,0 24,8 3971,8 3293,5
5% NaCl PM9 osmotic sensitivity
204,3 15,6 6523,2 1196,9
5.5% NaCl PM9 osmotic sensitivity
193,7 1,2 6283,4 4098,3
6% NaCl PM9 osmotic sensitivity
181,8 37,6 3874,9 1994,9
6.5% NaCl PM9 osmotic sensitivity
195,8 7,4 5639,4 666,2
7% NaCl PM9 osmotic sensitivity
190,9 1,8 7805,4 3879,6
8% NaCl PM9 osmotic sensitivity
179,4 5,8 11371,8 471,1
9% NaCl PM9 osmotic sensitivity
172,7 3,7 13814,8 4118,1
10% NaCl PM9 osmotic 161,9 11,3 10377,5 9387,4

241
sensitivity
6% NaCl PM9 osmotic sensitivity
181,4 32,8 4025,8 1000,6
6% NaCl + Betaine PM9 osmolyte 202,5 9,2 5548,0 171,1
6% NaCl + N-N Dimethyl glycine PM9 osmolyte 200,0 2,8 5997,2 1603,4
6% NaCl + Sarcosine PM9 osmolyte 179,8 5,4 9502,2 5327,2
6% NaCl + Dimethyl sulphonyl propionate
PM9 osmolyte 202,4 3,3 9281,6 181,3
6% NaCl + MOPS PM9 osmolyte 188,7 28,8 3084,2 1671,1
6% NaCl + Ectoine PM9 osmolyte 205,3 5,8 5210,3 595,5
6% NaCl + Choline PM9 osmolyte 201,5 0,6 5511,6 1184,4
6% NaCl + Phosphorylcholine PM9 osmolyte 202,9 7,2 6167,1 307,3
6% NaCl + Creatine PM9 osmolyte 196,1 4,4 3374,9 2876,8
6% NaCl + Creatinine PM9 osmolyte 206,8 1,5 5072,6 1167,1
6% NaCl + L-Carnitine PM9 osmolyte 217,4 4,7 2082,0 1318,8
6% NaCl + KCl PM9 osmolyte 210,4 5,4 5228,9 2114,6
6% NaCl + L-Proline PM9 osmolyte 211,1 8,5 4969,7 2509,7
6% NaCl + N-Acetyl-L-glutamine PM9 osmolyte 200,9 4,1 3583,6 3167,7
6% NaCl + ?-Glutamic acid PM9 osmolyte 162,3 68,9 5699,8 636,4
6% NaCl + ?–Amino-N-butyric acid PM9 osmolyte 176,2 47,4 3713,0 3956,7
6% NaCl + Glutathione PM9 osmolyte 216,2 10,1 6295,5 2836,7
6% NaCl + Glycerol PM9 osmolyte 183,6 42,6 2987,8 2582,8
6% NaCl + Trehalose PM9 osmolyte 208,2 7,2 4725,3 1463,9
6% NaCl + Trimethylamine-N-oxide PM9 osmolyte 211,4 1,7 5301,9 1291,3
6% NaCl + Trimethylamine PM9 osmolyte 164,9 48,2 3630,4 4409,2
6% NaCl + Octopine PM9 osmolyte 200,8 5,9 6433,5 1729,9
6% NaCl + Trigonelline PM9 osmolyte 217,1 6,4 4570,1 4354,4
3% Potassium Chloride PM9 osmotic sensitivity
240,5 6,7 5631,8 739,0
4% Potassium Chloride PM9 osmotic sensitivity
234,5 4,3 4727,3 719,3
5% Potassium Chloride PM9 osmotic sensitivity
222,1 9,4 5625,0 1191,8
6% Potassium Chloride PM9 osmotic sensitivity
206,8 0,1 4771,9 400,3
2% Sodium Sulfate PM9 osmotic sensitivity
266,7 5,9 2967,5 574,1
3% Sodium Sulfate PM9 osmotic sensitivity
253,4 11,3 2055,4 850,9
4% Sodium Sulfate PM9 osmotic sensitivity
243,5 2,4 3121,7 532,4
5% Sodium Sulfate PM9 osmotic sensitivity
223,6 3,0 4624,2 1643,3
5% Ethylene Glycol PM9 osmotic sensitivity
266,6 5,5 2239,6 1555,4
10% Ethylene Glycol PM9 osmotic sensitivity
267,9 6,0 2278,5 1684,5
15% Ethylene Glycol PM9 osmotic sensitivity
253,4 32,4 898,1 1228,5
20% Ethylene Glycol PM9 osmotic sensitivity
243,9 18,7 513,2 725,7
1% Sodium Formate PM9 osmotic sensitivity
285,9 0,4 12346,6 2060,2
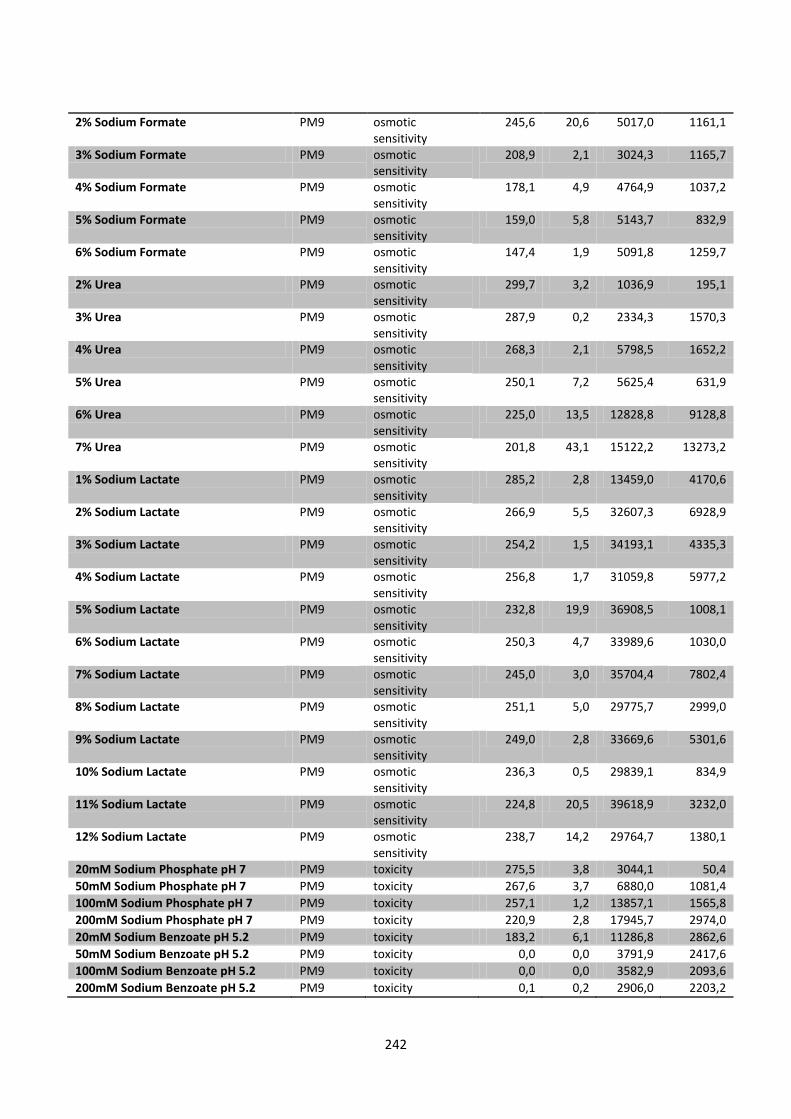
242
2% Sodium Formate PM9 osmotic sensitivity
245,6 20,6 5017,0 1161,1
3% Sodium Formate PM9 osmotic sensitivity
208,9 2,1 3024,3 1165,7
4% Sodium Formate PM9 osmotic sensitivity
178,1 4,9 4764,9 1037,2
5% Sodium Formate PM9 osmotic sensitivity
159,0 5,8 5143,7 832,9
6% Sodium Formate PM9 osmotic sensitivity
147,4 1,9 5091,8 1259,7
2% Urea PM9 osmotic sensitivity
299,7 3,2 1036,9 195,1
3% Urea PM9 osmotic sensitivity
287,9 0,2 2334,3 1570,3
4% Urea PM9 osmotic sensitivity
268,3 2,1 5798,5 1652,2
5% Urea PM9 osmotic sensitivity
250,1 7,2 5625,4 631,9
6% Urea PM9 osmotic sensitivity
225,0 13,5 12828,8 9128,8
7% Urea PM9 osmotic sensitivity
201,8 43,1 15122,2 13273,2
1% Sodium Lactate PM9 osmotic sensitivity
285,2 2,8 13459,0 4170,6
2% Sodium Lactate PM9 osmotic sensitivity
266,9 5,5 32607,3 6928,9
3% Sodium Lactate PM9 osmotic sensitivity
254,2 1,5 34193,1 4335,3
4% Sodium Lactate PM9 osmotic sensitivity
256,8 1,7 31059,8 5977,2
5% Sodium Lactate PM9 osmotic sensitivity
232,8 19,9 36908,5 1008,1
6% Sodium Lactate PM9 osmotic sensitivity
250,3 4,7 33989,6 1030,0
7% Sodium Lactate PM9 osmotic sensitivity
245,0 3,0 35704,4 7802,4
8% Sodium Lactate PM9 osmotic sensitivity
251,1 5,0 29775,7 2999,0
9% Sodium Lactate PM9 osmotic sensitivity
249,0 2,8 33669,6 5301,6
10% Sodium Lactate PM9 osmotic sensitivity
236,3 0,5 29839,1 834,9
11% Sodium Lactate PM9 osmotic sensitivity
224,8 20,5 39618,9 3232,0
12% Sodium Lactate PM9 osmotic sensitivity
238,7 14,2 29764,7 1380,1
20mM Sodium Phosphate pH 7 PM9 toxicity 275,5 3,8 3044,1 50,4
50mM Sodium Phosphate pH 7 PM9 toxicity 267,6 3,7 6880,0 1081,4
100mM Sodium Phosphate pH 7 PM9 toxicity 257,1 1,2 13857,1 1565,8
200mM Sodium Phosphate pH 7 PM9 toxicity 220,9 2,8 17945,7 2974,0
20mM Sodium Benzoate pH 5.2 PM9 toxicity 183,2 6,1 11286,8 2862,6
50mM Sodium Benzoate pH 5.2 PM9 toxicity 0,0 0,0 3791,9 2417,6
100mM Sodium Benzoate pH 5.2 PM9 toxicity 0,0 0,0 3582,9 2093,6
200mM Sodium Benzoate pH 5.2 PM9 toxicity 0,1 0,2 2906,0 2203,2

243
10mM Ammonium Sulfate pH 8 PM9 toxicity 257,3 5,6 619,0 401,8
20mM Ammonium Sulfate pH 8 PM9 toxicity 259,6 7,4 228,5 243,4
50mM Ammonium Sulfate pH 8 PM9 toxicity 265,5 2,3 1194,4 272,8
100mM Ammonium Sulfate pH 8 PM9 toxicity 262,8 3,5 782,4 280,8
10mM Sodium Nitrate PM9 toxicity 278,4 12,2 950,6 143,1
20mM Sodium Nitrate PM9 toxicity 278,9 3,6 3269,2 992,9
40mM Sodium Nitrate PM9 toxicity 274,3 1,0 3871,3 99,1
60mM Sodium Nitrate PM9 toxicity 270,7 6,9 3243,9 133,5
80mM Sodium Nitrate PM9 toxicity 274,0 1,2 4994,1 1148,4
100mM Sodium Nitrate PM9 toxicity 265,3 5,3 3472,5 2146,8
10mM Sodium Nitrite PM9 toxicity 209,0 0,2 3025,2 125,1
20mM Sodium Nitrite PM9 toxicity 103,6 10,4 8829,8 208,3
40mM Sodium Nitrite PM9 toxicity 12,6 2,6 5641,9 640,1
60mM Sodium Nitrite PM9 toxicity 28,8 16,8 1393,1 1610,5
80mM Sodium Nitrite PM9 toxicity 22,5 0,0 1239,4 222,5
100mM Sodium Nitrite PM9 toxicity 34,2 12,3 435,1 36,6