remarks on the use of mark-recapture methodology …
TRANSCRIPT

Studies in Avian Biology No. 6:121-136, 1981.
REMARKS ON THE USE OF MARK-RECAPTURE METHODOLOGY IN ESTIMATING AVIAN POPULATION SIZE
JAMES D. NICHOLS,~ BARRY R. NOON,’ S. LYNNE STOKES,’ AND
JAMES E. HINES’
ABSTRACT.-Mark-recapture models are classified according to requisite assumptions about population clo- sure. The resulting classes of models are briefly discussed and the experimental situations to which they apply are described. Model assumptions are presented, with emphasis being placed on those which are most likely to be violated in avian population studies. Comments are provided on experimental design, and previous ornithological studies in which the various models have been used are briefly reviewed. Special attention is devoted to the Jolly-Seber model which was developed for open populations and which perhaps has the greatest potential applicability to detailed, long-term population studies. A number of examples of the use of the Jolly- Seber model with avian mark-recapture data are presented in summary fashion.
The literature of field ornithology is much more extensive than that dealing with field stud- ies of other terrestrial vertebrates. However, mark-recapture methods of estimating popula- tion size have seen only limited use in the or- nithological literature, but are frequently em- ployed in published studies of mammals, reptiles and amphibians. For example, reviews of small mammal population estimation are dominated by mark-recapture methodologies (e.g., see Smith et al. 1975), while such methods are bare- ly mentioned in methodological reviews of avian population estimation (Kendeigh 1944, Berthold 1976, Shields 1979). We believe that the neglect of mark-recapture methods in avian studies re- sults from the generally high visibility and au- dibility of birds and the relative ease with which they can be directly enumerated. This ease of enumeration has naturally and justifiably result- ed in an emphasis by ornithologists on estima- tion methods that involve actual counts of birds (or nests), which are then expanded in various ways to estimate total population size or den- sity. However, no single population estimation method is universally appropriate for avian stud- ies, and there is still much debate about census methodology (see J. T. Emlen 1971, Berthold 1976, Shields 1979, this symposium).
We do not suggest that mark-recapture meth- ods will generally provide a preferable alterna- tive to direct observational methods of estimat- ing avian population size. However, we do believe that mark-recapture studies can provide estimates that are useful in assessing the appro- priateness of other estimation methods, and that they may provide the most reasonable means of estimating population size in some situations. In this paper we attempt to introduce the subject of mark-recapture methods and to briefly review their use in previous avian studies. We will be
1 U.S. Fish and Wildlife Service, Migratory Bird and Habitat Re-
warch Laboratory, Laurel, Maryland 2081 I.
concerned only with the estimation of popula- tion size, and will thus omit discussion of models for estimating survival rate from band recoveries of dead birds (e.g., see North 1978 and reviews in Taylor 1966, Seber 1973, Brownie et al. 1978). Our discussion will be introductory and brief, and we urge the interested reader to consult the excellent general reviews of mark-recapture models and their associated literature provided by Cormack (1968, 1979) and Seber (1973).
Mark-recapture models can be usefully clas- sified according to their requisite assumptions about population closure. We define a closed population as one which remains unchanged over the period of investigation and which is thus not influenced by mortality, recruitment, or migration (both emigration and immigration) during this time. An open population is one that does change over the period of investigation as a result of either mortality and emigration, re- cruitment and immigration, or both sets of fac- tors.
CLOSED POPULATIONS
TWO-SAMPLE EXPERIMENT
The first attempt to estimate the size of a bird population using mark-recapture methods is generally attributed to Lincoln (1930; also see Winkler 1930), and the “Lincoln index” or “Petersen estimate” has been the most widely- used mark-recapture method for estimating an- imal population size. Although the assumption of population closure can be relaxed, the Lin- coln index or estimate is generally modeled and discussed assuming a closed population. The Lincoln estimate is obtained from a two-sample experiment. A sample of n, birds is taken from a population of size N. Individuals in the sample are marked, returned to the population, and al- lowed time to mix freely with the unmarked birds. A second sample of size n2 is then taken, and the proportion marked in this sample (m,l IQ, where m2 denotes the number of marked
121
122 STUDIES IN AVIAN BIOLOGY NO. 6
birds in the second sample) is assumed to esti- mate the proportion of marked birds in the pop- ulation. The total population, N, is then esti- mated based on this assumption:
(m,lnz = (n,/N), so& = (n,n,lmJ.
The above estimator is generally said to re- quire the following assumptions (e.g., see Seber 1973:59): (1) the population is closed, (2) all an- imals have equal capture probabilities in the first sample, (3) marking does not affect subsequent catchability, (4) the second sample is a simple random sample, (5) animals do not lose their marks, and (6) all marked animals occurring in the second sample are reported. If n, and n2 are fixed and if these six “ball-and-urn model” sam- pling assumptions hold, then the number of re- captures, m2 (given n, , n2, and N), can be mod- eled with the hypergeometric distribution or (with either replacement sampling or large N) the binomial distribution. In both cases the max- imum likelihood estimator of N is the same as the intuitive estimator (however this estimate is biased and can be modified as suggested by Chapman 1951 or Bailey 1951). If sample sizes are not fixed, then it seems reasonable to regard capture probabilities as fixed (either because of characteristics of the sampled animals or expen- diture of fixed effort by the experimenter) and to model the numbers of individuals with each of the four possible capture histories (caught in period 1, caught in period 2, caught in both pe- riods 1 and 2, not caught) as a multinomial ran- dom vector. The maximum likelihood estimator of N based on the multinomial model is again the same as the intuitive estimator, and its asymptotic variance is essentially the same as that obtained for the hypergeometric model (Cormack 1979). These two general types of models (fixed sample size hypergeometric and random sample size multinomial) also represent the most common approaches to modeling other mark-recapture experiments. Cormack (1979:220) briefly compares these two approaches and notes that “strict adherence to either sampling rule is seldom possible.” Although the biologist should be aware of these two common ap- proaches (other approaches are also possible, such as the loglinear models of Fienberg 1972, Cormack 1979), the important practical result is that they have yielded essentially the same es- timates for experiments to which they have both been applied.
The practical value of any estimate based on mark-recapture models will depend on how closely the field experiment and resulting data correspond to the assumptions of the chosen model and how precise (and accurate) the esti- mate is (e.g., as indicated by its estimated sam-
pling variance), given that model assumptions are met. Both of these considerations, precision and assumption validity, are important when designing mark-recapture experiments and when interpreting their results. The problem of de- signing a two-sample experiment to estimate population size with specified levels of precision and accuracy is addressed thoroughly by Rob- son and Regier (1964; also see Seber 1973:64- 70), and we recommend these references to or- nithologists interested in planning such a study.
Assumptions generally stated for the Lincoln estimate were listed above, and a complete dis- cussion of these assumptions and tests of their validity is presented by Seber (1973:70-104). Certain specific deviations from the assumption of population closure are permissible when using the Lincoln estimate. Of particular interest to ornithologists is the fact that members of a pop- ulation may be subjected to mortality during the intersample period and, as long as the average mortality rates of marked and unmarked birds are the same, the Lincoln estimate, fi, is still a reasonable estimate of initial (at the time of the first sample) population size (see Seber 1970b). The presence of both recruitment and mortality results in overestimation of both initial and final population size. Probably the best practical means of insuring that violations of closure are negligible involve using a short time period be- tween samples and choosing an appropriate time of the year for sampling. Naturally, short inter- vals between samples provide less opportunity for mortality, recruitment, and migration than longer intervals. Similarly, experiments should be conducted at a time of the year when migra- tion and recruitment of young birds to the pop- ulation are not occurring.
Assumptions 2, 3 and 4 involve catchability, which is an important consideration in any mark-recapture study. Assumptions 2 (all ani- mals having equal capture probabilities in the first sample) and 4 (the second sample is a simple random sample) provide good examples of the difficulties involved in applying ball-and-urn sta- tistical models to biological populations. Among avian studies, there are numerous examples in which all individuals in a population are not equally catchable. Differences in catchability or the probability of being sampled are sometimes associated with classes or subgroups of birds. For example, evidence of sex-specific differ- ences in trappability has been provided for nu- merous waterfowl species by Petrides (1944) and Bellrose et al. (1961). Sex-specific differences in the probabilities of both capturing and resighting Northern Fulmars (Fulmarus glacialis) have been noted by Dunnett and Ollason (1978). Band recoveries by hunters are sometimes used in

MARK-RECAPTURE METHODS--Nichols et al. 123
two-sample mark-recapture experiments (e.g., Lincoln 1930, Bergerud and Mercer 1966, Geis 1972) and recovery rates of many species of wa- terfowl are known to differ sex-specifically (e.g., see Bellrose et al. 1961). Many bird species ex- hibit age-specific differences in the probability of being taken in both trap and hunting samples (e.g., see Farner 1949, Bellrose et al. 1961, Kautz 1977, Sulzbach and Cooke 1978). Catch- ability can also be associated with breeding sta- tus in some species (e.g., see Orians 1958, Robe1 1969, Sulzbach and Cooke 1978). In any case, when capture probabilities differ among identi- fiable subgroups of animals, then it is appropri- ate to treat each subgroup separately when es- timating population size.
Catchability assumptions can also be violated by individual variation in capture probability that is not associated with identifiable subgroups (see assumptions 2 and 4). It is very difficult, if not impossible, to draw inferences about indi- vidual variation in capture probability using data from two-sample experiments, but recapture data on individuals from experiments involving a number of sample periods (K-sample experi- ments) have been used to examine catchability in avian studies. Evidence of individual varia- tion in capture and/or resighting probabilities has been provided for several bird species (e.g., Bon-or 1948; Orians 1958; Young 1958, 1961; Taylor 1966; Carothers 1979). When inherent variation in capture probability exists, then the first sample will consist of a high proportion of the more trappable animals. Therefore, the av- erage catchability of the marked animals will be higher than that of the unmarked animals, and marked animals will tend to be overrepresented in the second sample, resulting in biased esti- mates, N. However, it is conceivable that an inherent high probability of being sampled by one method would not necessarily insure a high sampling probability for another method. As Se- ber (1973) has pointed out, two selective sam- ples can provide an unbiased estimate, fi, if the methods of selection are independent. In prac- tice, this argument suggests that the use of com- pletely different capture techniques for the first and second samples can provide some protec- tion against bias resulting from variation in catchability. With birds, it is sometimes possible to use traps to obtain the first sample and to apply highly visible markings (e.g., colored leg or neck bands, patagial tags, body dyes, back- tags; see Cottam 1956, Taber and Cowan 1969, Marion and Shamis 1977, for reviews of avian marking techniques). The second sample is then taken by observing birds and tallying resightings of marked individuals as well as sightings of un- marked birds. This approach has been used suc-
cessfully with Mallards (Anus plutyrhynchos), Blue-winged Teal (Anus discors) and Wood Ducks (Aix sponsa) (Cowardin and Higgins 1967) and with Willow Ptarmigan (Lagopus la- gopus) (Bergerud and Mercer 1966). When deal- ing with hunted species it is possible to obtain the first sample via trapping and to then use band recoveries returned by hunters as the second sample (e.g., see Lincoln 1930, Bergerud and Mercer 1966, Moisan et al. 1967, Goudy et al. 1970, Geis et al. 1971, Robe1 et al. 1972, Whit- comb 1974).
Effects of trapping and handling on future capture probability can also result in model as- sumption violations (assumptions 3 and 4), and such effects have been noted in birds. Some- times such effects result from a behavioral re- sponse to trapping. Evidence of “trap-happy” birds that tend to return frequently to baited traps (presumably to take advantage of easily obtained food) has been provided by Borror (1948), Taylor (1966), and Murton et al. (1972). Trap and net aversion or “shyness” have been noted in a number of species (see Bon-or 1948, Young 1958, Stamm et al. 1960, Taylor 1966). Presumably, this involves an adverse reaction to being trapped and handled that results in un- usual wariness of the bird or that causes the bird to avoid the immediate vicinity of the traps (e.g., see Owen and Morgan 1975). In addition it is possible that birds could be injured during the capture and handling processes, and that this might result in lower survival probabilities for marked birds. Aversive behavioral responses and injuries can be minimized through the use of proper capture and handling techniques (see reviews in Taber and Cowan 1969, U.S. Fish and Wildlife Service and Canadian Wildlife Ser- vice 1977). Apparent cases of trap-happy and trap-shy birds can also be produced by certain methods of trap placement. For example, Swinebroad (1964) mist-netted a Wood Thrush (Hylocichla mustelina) population and obtained evidence of unequal capture probabilities which he attributed to net placement. Apparently, some birds in the study area were exposed to nets within their “maximum activity areas” while other birds were only exposed to nets on the fringes of their ranges.
The marks or tags that are applied to birds can also affect survival and the probability of future recapture. For example, the accumulation of ice on neckbands and nasal saddles of geese during severe winter weather is a potential problem, but is not believed to affect survival to a great extent (e.g., see Greenwood and Bair 1974, Cra- ven 1979). Neckbands have been reported to contribute to starvation in Snow Geese (Anser caerulescens) (Ankney 1975). Nasal discs and
124 STUDIES IN AVIAN BIOLOGY NO. 6
saddles have been suspected of increasing mor- tality of diving ducks (see discussion in Barto- nek and Dane 1964), and patagial tags have been suspected of increasing susceptibility of birds to predation and altering behavior patterns of tagged birds (Anderson 1963). In addition to causing mortality differences between marked and unmarked birds, some marking methods can produce unequal catchabilities of the two groups at the time of the second sample. For example, higher resighting probabilities have been sus- pected for patagial-tagged (Cowardin and Hig- gins 1967) and backtagged and dyed birds (Ber- gerud and Mercer 1966), than for unmarked birds.
Assumption 5 is that animals do not lose their marks. In most two-sample experiments the pe- riod between samples will be sufficiently short that loss of marks commonly applied to birds should not be a problem. Retention times for several types of short-term avian markers (e.g., dyes, backtags) are presented by Taber and Cowan (1969) and Marion and Shamis (1977). Avian leg bands are generally considered to be good long-term markers but can be lost because of excessive wear or removal by the banded bird. The problem of band loss is thought to be important in long-lived birds and has been re- viewed by Farner (1955), Ludwig (1967), and Marion and Shamis (1977). Leg band “survivor- ship curves” were developed by Ludwig (1967) for gulls and terns based on wear and weight loss data on known age bands from recaptured birds. A method for estimating the probability of tag loss from double-tagged animals (i.e., an- imals to which two tags are applied) is provided by Seber (1973:94-96). A practical means of re- ducing band loss problems is to replace worn bands on captured birds.
Assumption 6 is that all marked animals oc- curring in the second sample are reported, and this assumption is generally relevant only to ex- periments in which the second sample is based on band recoveries made by the general public (e.g., hunting recoveries). In cases where all re- covered bands are not reported, some workers have estimated the total number of recovered bands for use in Lincoln index estimates (e.g., see Moisan et al. 1967, Goudy et al. 1970, Geis et al. 1971). This procedure requires an estimate of the “reporting rate” or the proportion of re- covered bands that is reported. Reporting rate has been estimated using either additional infor- mation on the number of recovered bands ob- tained from hunter questionnaire surveys (Geis and Atwood 1961, Martinson 1966, Martinson and McCann 1966), or “reward band” studies in which some bands are marked with a message
that a reward is offered for their return and are assumed to have a reporting rate of 1 .O (Bellrose 1955, Tomlinson 1968, Henny and Burnham 1976).
There are a number of reports in the avian literature of the use of the Lincoln index to es- timate population size, and here we will only list some representative examples. Borror (1948), Boyd (1956), Stamm et al. (1960), Nunneley (1964), Taylor (1966) and Robe1 et al. (1972) have computed Lincoln index estimates from trapping and netting samples. All of these authors exhib- ited appropriate concern for at least some of the assumptions of the method, and none of them rejected the method as being completely inap- propriate for their experimental situations. In an interesting comparison of methodologies Stamm et al. (1960) obtained general agreement between Lincoln index estimates and spot-mapping (Wil- liams 1936) estimates for a number of eastern deciduous forest bird species. As noted earlier, Lincoln index estimates have also been com- puted from resightings of dyed or tagged birds (e.g. Bergerud and Mercer 1966, Cowardin and Higgins 1967, Readshaw 1968). Bergerud and Mercer (1966) compared estimates from several methods with “direct counts” believed to be accurate within 5% of the true population. The Lincoln index based on resightings provided es- timates that agreed well with the direct counts for three of four years, while other population estimation methods proved less reliable. Co- wardin and Higgins (1967) thoroughly examined Lincoln index assumptions and concluded that emigration of marked birds and increased visi- bility of marked birds may have resulted in biased estimates. Nevertheless, they concluded that Lincoln index estimates of population size were more realistic than total counts of birds. Hewitt (1963, 1967) suggested an interesting technique for obtaining Lincoln index estimates for Red-winged Blackbirds (Agelaius phoeni- ceus) which does not require the actual capture of birds. Territorial males seen along roads are “marked” using tape-recorded descriptions of their exact sighting locations. The road is trav- eled again, and the presence of a territorial male in a location which was occupied at the time of the first sample is considered as a resighting. Consideration of requisite assumptions and comparison of estimates with estimates obtained using other methods led Francis (1973) and Al- bers (1976) to conclude that Hewitt’s method- ology will generally underestimate population size. Lincoln index estimates based on hunting recoveries of banded birds have been used fre- quently (e.g., Lincoln 1930, Crissey 1963, Ber- gerud and Mercer 1966, Moisan et al. 1967, Gou-
MARK-RECAPTURE METHODS-Nichols et al.
dy et al. 1970, Geis et al. 1971, Robe1 et al. 1972, Whitcomb 1974). Crissey (1963) and Bergerud and Mercer (1966) have reported that such es- timates for Mallards and Willow Ptarmigan, re- spectively, agreed well with other estimates of population size. However, additional compari- sons of Lincoln index estimates with aerial sur- vey estimates for the Mallard population in North America have resulted in large discrep- ancies in recent years (Munro and Kimball, pers. comm.).
K-SAMPLE EXPERIMENT
Here we discuss experiments involving two or more trapping or sampling periods. The two- sample Lincoln index experiment is simply a special case of this type of experiment, and we treated it separately only because of its frequent use relative to other mark-recapture experi- ments. Otis et al. (1978) have presented a unified treatment of population estimation from K-sam- ple experiments with closed populations. We highly recommend this monograph to readers interested in such experiments, and our brief re- view of models here will follow their approach and terminology (see also Seber 1973:130-195, Pollock 1974).
The sampling scheme is very similar to that of the two-sample experiment. Animals are cap- tured during an initial sampling period, marked, and returned to the population. A second sample is then taken (e.g., on the following day) and recaptures of marked animals are noted. New captures are also given marks and all animals are returned to the population. The procedure is repeated for K sampling periods. Perhaps the greatest operational difference between the K- sample and the two-sample experiments is that animals generally must be given individual marks (e.g., serially numbered leg bands) in the K-sample experiment. The models used to de- scribe recapture data from K-sample experi- ments generally require complete capture his- tories of individual animals for estimating population size. The probability distribution for the set of possible capture histories is then ex- pressed using a multinomial model (hypergeo- metric approaches have also been used in some cases) treating population size and capture prob- abilities as parameters.
Assumptions required by the models reviewed here are that (1) the population is closed, (2) animals do not lose their marks during the ex- periment, and (3) all marks are correctly noted and recorded at each trapping occasion. In ad- dition to these three assumptions, each of the models discussed by Otis et al. (1978) embodies a different set of assumptions about sources of
variation in catchability or probability of cap- ture. As indicated for the two-sample experi- ment, proper choice of the time (season of the year) and duration of the experiment are two of the most important practical means of approach- ing closure (assumption 1). Regardless of the precautions taken in designing the experiment, however, it is desirable to test this assumption after the experiment is completed in order to insure that closed population models are appro- priate. Closure tests based on specific closed population models are provided by Pollock et al. (1974) and Otis et al. (1978:66-67). Care should be used in interpretation of the results of the Otis et al. (1978) closure test, however, because it is sensitive to various sorts of variability (e.g., over time) in capture probabilities as well as to non-closure. It is thus prone to false rejection of the closure assumption. The assumption (2) that animals retain marks should be easily met in most closed population experiments because of their short duration relative to retention times of most types of marks. The correct recording of marks (assumption 3) will be a natural con- sequence of careful field work and can be in- sured by the use of well-designed field data sheets and appropriate editing procedures for keypunched or summarized data.
The simplest and least realistic model de- scribed by Otis et al. (1978) is M,. In addition to the three assumptions listed previously, M, assumes that all individuals in the population have identical capture probabilities for each of the K sampling periods. M, thus includes only two parameters; population size, N, and capture probability, p. The general maximum likelihood estimator for N under M, cannot be written in closed form, but must be computed numerically. As noted earlier, there is a great deal of evidence of variation in capture probability among subgroups and individuals of various bird species. In addition, it is reasonable to expect capture probabilities to vary from one sampling period to another as a result of such factors as weather conditions, changes in sampling effort, etc.
Model Mt of Otis et al. (1978; also see Schna- be1 1938, Darroch 19) has historically been the most commonly used model for K-sample closed population mark-recapture experiments (see reviews in Cormack 1968, Seber 1973). Mt permits capture probabilities to vary from one sampling period to another, but assumes that within a sampling period, all individuals have the same capture probability. The general max- imum likelihood estimate of N is again not avail- able in closed form. While Mi is somewhat more realistic than M,, , its assumption of equal cap-
126 STUDIES IN AVIAN BIOLOGY NO. 6
ture probability within a sampling period will still be inappropriate for the many bird species that exhibit individual variation in catchability and variation associated with nonidentifiable subgroups.
Model Mb (Otis et al. 1978) corresponds to the situation in which the initial capture of an indi- vidual affects its probability of capture on sub- sequent sampling periods. As noted earlier, trap and net responses have been well-documented in birds, and this model may thus be realistic for some bird species. The model contains three parameters: population size, capture probability for initial captures (i.e., for unmarked animals), and capture probability for subsequent captures (i.e., for marked animals). The capture proba- bilities for marked and unmarked animals are assumed constant for all time periods. A nu- merical procedure is again needed to compute the estimate, fi.
Model Mh (Burnham and Overton 1978, Otis et al. 1978) corresponds to the situation in which each member of a population is characterized by a distinct capture probability. These individual capture probabilities are assumed to remain the same over all sampling periods. In the devel- opment of the estimation procedure, Burnham and Overton (1978) recommend treating the set of individual capture probabilities as a random sample of size N from some probability distri- bution. They then develop an estimator, fi, us- ing an extension of the jackknife method of bias reduction.
Models Mi, Mb, and Mh of Otis et al. (1978) represent efforts to model specific sources of variation in capture probability. However, we might reasonably expect more than one of these sources of variation to be important in a given experiment. For this reason, Otis et al. (1978) developed a set of models corresponding to the various combinations of these sources of varia- tion in capture probability. An estimator for N can be obtained for one of these models, Mb,, , which assumes that each member of a popula- tion has a specific probability of capture prior to its initial capture and another specific probabil- ity of capture after it has been marked. No es- timators for N are currently available for the other combination models (Mtb, Mth , Mtbh).
Assumptions l-3 for all of the models have been briefly discussed. In addition, the assump- tions distinguishing between the models concern the type of variability present in the capture probabilities. Otis et al. (1978) suggest seven tests for evaluating these assumptions. Some tests compare two competing models or hypoth- eses (one of which is more general than the oth- er), while the others assess the goodness-of-fit of a particular model to the data. Otis et al.
(1978) have also developed a discriminant clas- sification function based on data simulated from each of the eight models. This classification function can be used to provide an objective se- lection of the appropriate model (and thus the appropriate catchability assumptions) for a giv- en data set. We note that other tests dealing with variation in catchability are available (e.g., see Young 1958, 1961, as well as later discussion of open population models). Suggestions about the practical aspects of designing K-sample experi- ments for closed populations are provided by Otis et al. (1978:74-80).
We are aware of only one published mark-re- capture experiment with birds in which one of the K-sample closed population models de- scribed above has been used (see Hewitt 1967). Most of these models are relatively new and would not be expected to have received much use, but others (e.g., M,) have been available for some time. Otis et al. (1978) have developed a comprehensive computer program (see White et al. 1978) which computes estimates for their models, computes test statistics, and uses the classification function to select the appropriate model. We suspect that the availability of this program will result in use of the Otis et al. (1978) models in future mark-recapture studies of birds. T. J. Dwyer (pers. comm.) is currently using the program in conjunction with his mark- recapture study of Woodcock (Philohela minor) at the Moosehorn National Wildlife Refuge, Maine. Preliminary results suggest that model Mt may be appropriate for some of Dwyer’s within-season data sets.
Under certain assumptions, models for K-re- capture experiments on closed populations can be based on the observed frequencies of capture (i.e., on the numbers of animals captured 1, 2, . . K times). For example, if probability of capture remains constant over time (the as- sumption of M,), then the probability that an animal is captured x times is given by the bi- nomial distribution (e.g., see Eberhardt 1969, Seber 1973:169-170). Since the number of ani- mals in the population that are never caught (x = 0) is unknown, the observed frequency of recaptures follows the zero-truncated binomial distribution. Under this assumption the number of unobserved animals can be estimated (Seber 1973: 169-170) and the fit of the data to the model can be evaluated using a x2 goodness-of-fit test. If capture probability is constant and small, then the zero-truncated Poisson distribution provides a reasonable approximation to the binomial model for capture frequencies. Using the Pois- son model, the zero class can again be estimated (see Eberhardt 1969, Seber 1973:170) and the fit of the model tested. If probability of capture is
MARK-RECAPTURE METHODS-Nichols et al. 127
not the same for each individual, then certain assumptions can lead to different truncated models of recapture frequency. For example, different hypotheses about the distribution of catchability can lead to geometric and negative binomial models (see reviews in Eberhardt 1969, Seber 1973).
Although, as Seber (1980) has suggested, model Mh of Burnham and Overton (1978) will probably replace other capture frequency ap- proaches, these methods have seen limited use in avian studies. Bergerud and Mercer (1966) used a truncated Poisson model to estimate ptar- migan population size. Eberhardt (1969) exam- ined the fit of the truncated Poisson and geo- metric distributions to published trapping and sighting data of several bird species. Condor (Gymnogyps calijornianus) sighting data and Bobwhite Quail (Colinus virginianus) capture data fit both Poisson and geometric models (Eberhardt 1969). North (1978) examined the fit of Manx Shearwater (P@inus pujj’inus) recap- ture data within years to Poisson, geometric and negative binomial models. North (1978) also used a “double Poisson” model to deal with trap response and a “heterogeneous model” to han- dle two classes of birds that differ in their re- sponse to initial capture. The geometric and het- erogeneous models both produced reasonable estimates. Both Eberhardt (1969) and North (1978) suggested that in cases where two models appear to fit the data well, selection of the model to use must be based on a detailed consideration of the biological assumptions involved. How- ever, there is not always a biological basis for choosing among competing models. Cormack (1979:228) points out that several possible models may fit capture frequency data well but yield vastly different estimates of population size. For example, Dwyer (pers. comm.) found that both geometric and Poisson models fit his Woodcock capture frequencies well in many cases, but that the two models produced very different estimates of population size. Because of this problem and because the variety of models in Otis et al. (1978) correspond to most of the different biological situations that have been used to derive other capture frequency models, we suspect that the Otis et al. models will generally be preferred in future K-sample closed population experiments.
OPEN POPULATIONS
COMPLETELY OPEN POPULATIONS In this section we examine K-sample experi-
ments that are conducted in the same general manner as those already discussed, but where population gains and/or losses are allowed to
occur between sampling periods through birth/ immigration and death/emigration. Early models for these open populations incorporated the view that population changes were determinis- tic, and that randomness was associated only with the sampling process (see review of these models in Cormack 1968). However, it was rec- ognized that the change in population size and composition from one time period to another could be more realistically viewed as a stochas- tic process itself (e.g., see Robson 1969). This problem was partially solved by Darroch (1959)) when he developed models for partially open populations; i.e., ones in which either gains or losses in population size, but not both, are al- lowed to occur. The solution for the completely open population stochastic model was presented simultaneously by Jolly (1965) and Seber (1965) (denoted the Jolly-Seber model), and their mod- el has now virtually replaced the deterministic models in experiments on open populations.
Assumptions that are generally listed for the completely open model are: (1) every animal in the population has the same probability, pi, of being caught in sample i, given that it is alive and in the population during sampling period i, (2) every marked animal in the population has the same probability, $$, of surviving from sam- pling periods i to i + 1, given that it is alive and in the population immediately after the time of release in sample i, (3) every animal caught in sample i has the same probability, y, of being returned to the population, (4) marked animals do not lose their marks, (5) all marks are re- ported and correctly recorded on recovery, (6) all samples are instantaneous (i.e., sampling time is negligible), and (7) losses to the popula- tion from emigration and death are permanent. Assumptions 1-6 are listed in Seber (1973: 196) and assumption 7 is noted by Robson (1969: 126) and Seber (1973:199).
Both Jolly (1965) and Seber (1965) used mul- tinomial approaches to modeling. In Jolly’s (1965) general formulation, pi, c$$, and ui are considered as unknown parameters, and Ni , Mi (the number of marked individuals in the popu- lation at sampling period i), B (the number of new individuals entering the population between sampling periods i and i + 1) and p,(MJN,, or the proportion of individuals in the population at time i which is marked) are treated as un- known random variables.
The estimate for population size under the Jol- ly-Seber model is:
I$ = M,nJnq (i = 2, 3, . . . , K - 1)
where ni is the number of animals caught at time i and mi is the number of marked animals caught at time i. This is an intuitive Lincoln-type esti-

128 STUDIES IN AVIAN BIOLOGY NO. 6
mator in which the proportion of marked ani- mals in the entire population (M,IN,) is simply equated with the proportion of marked animals in the sample (mi/ni). However, while fli and mj are observable random variables; Mi must be estimated. As pointed out by Jolly (1965; also see Cormack 1968, 1972) the estimator for Mi is also intuitively appealing:
A_ = Rizi + m. (i = 2,3, . . . ) K - 1) ri
where Ri is the number of marked animals re- leased into the population after sampling period i, ri is the number of marked animals released after sampling period i and caught subsequently, and zi is the number of animals caught before sample i, but not in sample i, and caught again after sample i. The marked individuals in the population just after sampling period i consist of two groups: the animals captured during pe- riod i (R,), and the number not captured during period i (Mi - mJ. Of the former group, ri are subsequently recaptured, and z, from the latter group are subsequently recaptured. The two ra- tios, rilRi and zi/(M< - mi), should be approxi- mately equal and the solution of the equality for Mi yields &.
We are aware of no published guidelines for planning a mark-recapture experiment to be ana- lyzed with the Jolly-Seber model. However, the form of the asymptotic variances, as well as the simulation studies of Manly (1970, 1971a), Gil- bert (1973), Bishop and Sheppard (1973) and Kreger (1973), demonstrate the importance of high capture probabilities, pi, to obtaining ac- curate estimates (having low or negligible bias) of population size with low estimated variances. Gilbert’s (1973) simulations also demonstrate that substantial reductions in bias of fit can re- sult from increasing the length of the experiment (i.e., the number of sampling periods). The asymptotic variance estimators of Jolly (1965) are known to produce confidence intervals with poor coverage in some cases (Manly 1971a). Specifically, in small sample size situations there is a high positive correlation between N and its estimated variance, causing underestimates of population size to appear to be more precise than they really are (Manly 1971a). This problem has led to a search for alternate methods of es- timating variances for this model (Manly 1977a). Nevertheless, estimated coefficients of variation (standard error of estimate/estimate) of popula- tion size do provide some indication of how pre- cise and reliable the estimates are (Kreger 1973). Carothers (1973) points out that an estimate with large “small-sample” bias can normally be rec- ognized as unreliable by its large estimated vari- ance.
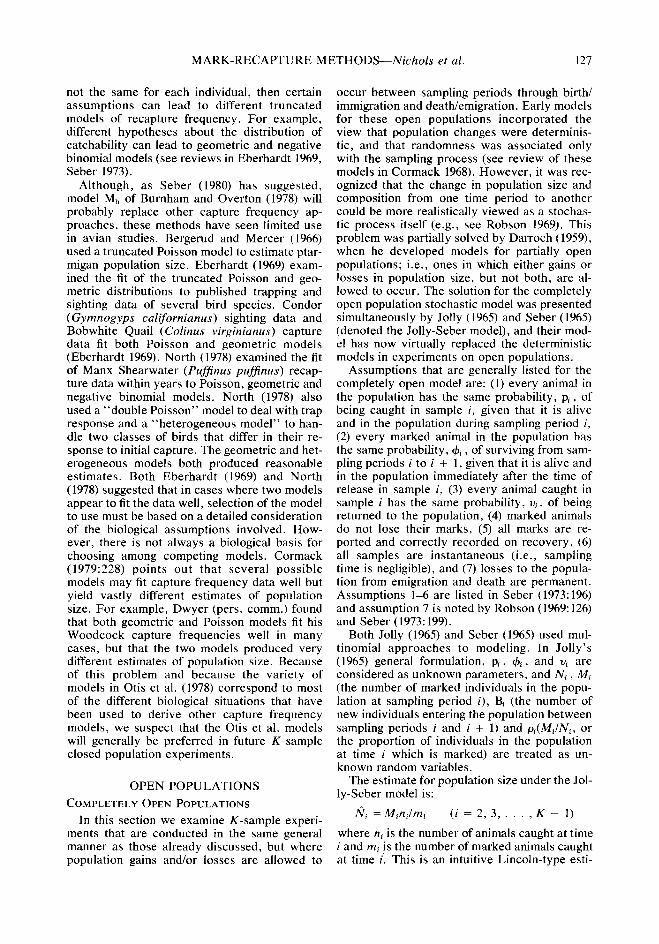
We prepared Figures 1 and 2 in an effort to provide some indication of the sampling effort required to achieve various levels of precision of Ni. Figure 1 assumes a constant intersample survival rate of $+ = 0.50 while Figure 2 as- sumes & = 0.75. It was assumed that there were no accidental deaths during banding and han- dling. In both Figures, the Ni were assumed con- stant at values of 100, 200, 500 and 1000, and Bi = (I - $I~)N~ in order to insure a stable pop- ulation. All experiments were assumed to in- clude six sampling periods. The solid lines in the Figures represent approximations to the expect- ed value o&he estimated coefficient of variation of fiZ, E[CV(Ns)]. These were obtained by ap- proximating the e%pec*d yalues of N3 and the standard error of Nsr SE(N,). This was done by using the expected values, E(R,), E(Q), E(mi), E(zJ, and E(rJ, given the Ni, &, Bi, and pi, in conjunction with the equation for Ni pre- sented earlier and the equation for Oar ( Nj) pre- senrd by Jolly (1965). The approxima$n for E[CV(NZ)] was then obtained as EISE(NZ)]I E[NZj]. The plotted points in Figures 1 and 2 each represent the mean value of m(N& computed from 500 simulated data sets. Simulated data sets were constructed by treating capture and survival of each individual for each sampling period as independent Bernoulli trials using pseudorandom numbers. If the selected values of 4 and N are thought to be reasonable guesses for certain populations, then Figures 1 and 2 may be of use in planning experiments.
Figures 1 and 2 illustrate the importance of high capture probabilities (and corresponding large sample sizes) to obtaining precise esti- mates of population size. Cormack (1979) has noted that the generality of the Jolly-Seber mod- el, with its separate parameters for each survival and capture probability, may sometimes limit its practical utility. However, Jolly (1979, in prep.) has recently developed models (and appropriate model testing procedures) in which survival probability or capture probability or both are constant over time (i.e., 4i = $, pi = p). We suspect that these reduced-parameter models will be of considerable practical value.
Assumption 1 of equal catchability has been discussed with respect to closed population models, and we listed a number of examples of unequal catchability in bird populations. When identifiable subgroups of animals exhibit differ- ent probabilities of capture, then the groups can be treated separately. However, when variation in capture probability is present within a subgroup, problems can arise. Carothers (1973) examined the relative bias of the Jolly-Seber Ni resulting from variation in catchability among individuals. When capture probability varied

1 .ooo
.800
2
z5 I- .600 IT
E b k w .400 ;; I t zi u
.200
O_ U
?# - SIHULATION WITH N = 100 A - SItdJLATION WITH N = 200 0 - SIHULATION WITH N = 500 Cl - SIMULATION WITH N q 1000
MARK-RECAPTURE METHODS-Nichols et al. 129
.lOO .200 -300 .400 .500 .600 .700 .SOO .soo 1 .ooo CAPTURE PROBRBILITY (PI
FIGURE 1. Relationship between capture probability, P, and the estimated coefficient of variation of fi,, fi(fiJ. assuming a six-period experiment with 4z = 0.50.
moderately among individuals, the resulting rel- ative bias of fit was fairly small for the situations examined. but when capture probability varied widely, large negative biases of fii resulted (Car- others 1973). Gilbert (1973) also used analytic approximations and computer simulation to ex- amine the bias of & associated with unequal catchability. Gilbert’s work emphasized the im- portance of the average capture probability. If this average is above 0.50, then bias resulting from variation among individuals will be small (Gilbert 1973). Gilbert (1973:524) concluded that “an experimenter need not attempt to design an experiment so that all animals have the same probability of capture, but only that the distri- bution be shifted nearer one so that nearly all animals have probabilities of capture say 2 0.50.” A test of the equal catchability assump- tion in a K-sample experiment was provided by Leslie (1958) and extended by Carothers (1971) (also see the test of Cormack 1966). Practical recommendations for trying to avoid unequal catchability have been discussed relative to the two-sample experiment, although some of these suggestions (e.g., different capture techniques) may not be as applicable to the K-sample situ- ation.
Assumptions 2 and 3 require a homogeneous population with regard to probability of surviv- ing the intersample and sampling periods, re- spectively. Homogeneous sampling period sur- vival probability can be assured by use of proper capture and handling techniques. However, the population can always be stratified if accidental deaths are thought to be higher among some groups of animals than others. Heterogeneity in intersample survival, &, may be more difficult to account for or control. Age- and sex-specific variation in survival rates is thought to be com- mon among birds (see Ricklefs 1973 and refer- ences therein). High predation rates on nesting females (e.g., see Johnson and Sargeant 1977) may also result in different survival probabilities of breeding and non-breeding adults. In any case, when survival probabilities differ among identifiable subgroups within a population, strat- ification is again appropriate. Certain handling and marking techniques are thought to influence survival probabilities of various bird species (see examples provided in the discussion of two-sam- ple model assumptions). Tests of the hypothesis that survival is independent of capture proba- bility and mark status were developed by Rob- son (1969), Manly (1971b), and Seber (1973:230-
130 STUDIES IN AVIAN BIOLOGY NO. 6
Z# - SIMULRTION WITH N = 100 A - SIflULRTION NITH N = 200 0 - SItlULRTION NITH N = 500 cl - SIIIULRTION WITH N q 1000
u .lOO .200 .300 .400 .500 .600 -700 .600 .900 1 .ooo CRPTURE PRO6R6ILITY (PI
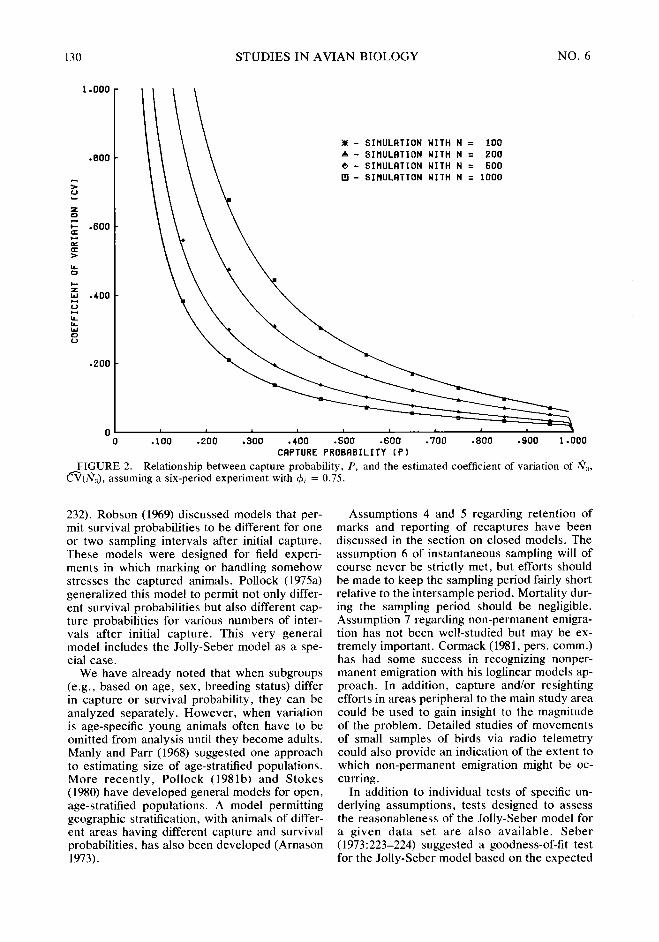
FIGURE 2. Relationship between capture probability, P, and the estimated coefficient of variation of fi3, @(fi:J, assuming a six-period experiment with +i = 0.75.
232). Robson (1969) discussed models that per- mit survival probabilities to be different for one or two sampling intervals after initial capture. These models were designed for field experi- ments in which marking or handling somehow stresses the captured animals. Pollock (1975a) generalized this model to permit not only differ- ent survival probabilities but also different cap- ture probabilities for various numbers of inter- vals after initial capture. This very general model includes the Jolly-Seber model as a spe- cial case.
We have already noted that when subgroups (e.g., based on age, sex, breeding status) differ in capture or survival probability, they can be analyzed separately. However, when variation is age-specific young animals often have to be omitted from analysis until they become adults. Manly and Parr (1968) suggested one approach to estimating size of age-stratified populations. More recently, Pollock (198lb) and Stokes (1980) have developed general models for open, age-stratified populations. A model permitting geographic stratification, with animals of differ- ent areas having different capture and survival probabilities, has also been developed (Arnason 1973).
Assumptions 4 and 5 regarding retention of marks and reporting of recaptures have been discussed in the section on closed models. The assumption 6 of instantaneous sampling will of course never be strictly met, but efforts should be made to keep the sampling period fairly short relative to the intersample period. Mortality dur- ing the sampling period should be negligible. Assumption 7 regarding non-permanent emigra- tion has not been well-studied but may be ex- tremely important. Cormack (1981, pers. comm.) has had some success in recognizing nonper- manent emigration with his loglinear models ap- proach. In addition, capture and/or resighting efforts in areas peripheral to the main study area could be used to gain insight to the magnitude of the problem. Detailed studies of movements of small samples of birds via radio telemetry could also provide an indication of the extent to which non-permanent emigration might be oc- curring.
In addition to individual tests of specific un- derlying assumptions, tests designed to assess the reasonableness of the Jolly-Seber model for a given data set are also available. Seber (1973:223-224) suggested a goodness-of-fit test for the Jolly-Seber model based on the expected

MARK-RECAPTURE METHODS-Nichols et al. 131
numbers of individuals having each possible capture history. We have found this test to be somewhat impractical because considerable cell pooling is generally required for the data sets we have examined and because large experiments require computation of a large number of ex- pected cell values. Jolly (in prep.) has recently suggested a goodness-of-fit test based on the ex- pected number of individuals released at time i and next caught at times i + 1, i + 2, . . . K. This test also requires some cell pooling, but we have found it useful with actual data sets (see later examples). Another approach to assessing the reasonableness of the underlying model was suggested by Leslie et al. (1953; also see Seber 1973:224-226). The method basically involves using data from second and subsequent captures of individuals to estimate the number of “first captures”. The variance of this estimate can also be computed, and the actual number of first captures can be compared with the 95% confi- dence interval around the estimated number. In addition, survival rates, 4 , and population size, Ni, can be estimated using only second and sub- sequent captures, and these estimates can then be compared with & and Mi (the estimate of the marked population size) based on the full data set.
There has been very little use by ornitholo- gists of open population mark-recapture models to estimate population size. Orians (1958) and Readshaw (1968) used the deterministic model of Leslie (1952) to estimate population sizes of Manx Shearwaters and Pied Currawongs (Stre- pen.4 graculina), respectively. Orians (1958) es- timated numbers of adult Shearwaters using Leslie’s (1952) approach and obtained estimates that agreed with independent estimates obtained by expanding counts of Shearwater burrows. However, Orians (1958) used tests developed by Leslie et al. (1953) and Leslie (1958) to infer that Shearwaters were not being randomly sampled. Orians (1958) concluded that his estimates were not “trustworthy” and cautioned against using mark-recapture models without carefully ex- amining assumptions. Readshaw (1968) estimat- ed size of a wintering Currawong population but found the standard errors of the estimates too large to permit detection of variation with time. Hammersley (1953) used a stochastic mark-re- capture model to estimate population size of two Alpine Swift (Apus melba) colonies. Hammer- sley concluded that the birds had not been sam- pled randomly because of the concentration of the bander on different groups of birds in differ- ent years. Darroch (1959) criticized Hammer- sley’s (1953) model.
The Jolly-Seber model was used by Anderson and Sterling (1974) to estimate the number of
drake Pintails (Anus acutu) on two molting marshes in Saskatchewan. Despite large banded sample sizes, estimated capture probabilities were very small, ranging from 0.009 to 0.024, and the resulting population estimates were not very precise (Anderson and Sterling 1974). Sulz- bath and Cooke (1979) used the Jolly-Seber model to estimate the number of adult Snow Geese in a nesting colony in Manitoba and ob- tained fairly precise estimates of population size for some years. They carefully considered un- derlying assumptions and used the method of Leslie et al. (1953) to estimate numbers of first captures and thus indirectly assess model fit. Estimated numbers of first captures agreed fairly well with actual values in most years, and it was concluded that the model provided a reasonable description of the data set. Agreement of Jolly- Seber estimates with “visual estimates” was poor, and the authors cautioned against the sole use of either method (Sulzbach and Cooke 1979). Kautz (1977) pointed out problems asso- ciated with the use of the Jolly-Seber model on Band-tailed Pigeon (Columbu fusciatu) data combined from a number of different trap sites. He recommended that parameter estimation should be restricted to data from a specific trap- ping site (or from sites in close proximity to each other). Kautz (1977) then used data from a Col- orado banding site to estimate population size, and suggested that variation in these estimates might be indicative of variation in the area from which birds were drawn to the baited trapping station.
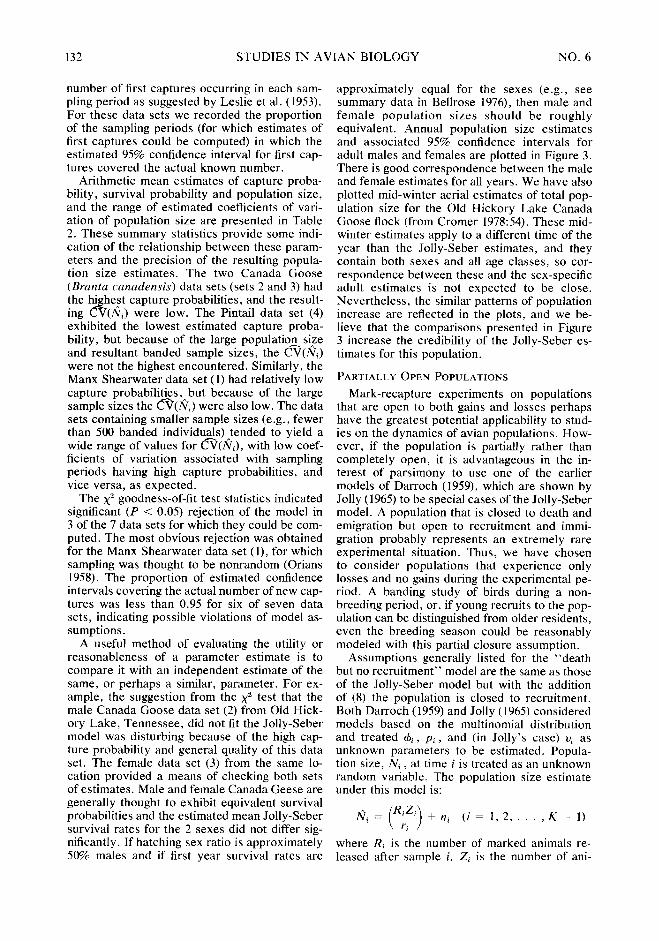
We are interested in the potential applicability of the Jolly-Seber model to avian mark-recap- ture studies, but this has been difficult to eval- uate because of the paucity of published avian studies in which it has been used. Here we will attempt to provide some information on the po- tential utility of the method by presenting se- lected parameter estimates from Jolly-Seber analyses of a number of mark-recapture data sets for birds. The data sets were obtained from both published and unpublished sources and represent a variety of species, capture methods, sampling intervals, etc. Information on study lo- cations and methodologies is presented in Table 1. Jolly’s (1965) estimates were computed for parameters of interest with all data sets. x2 goodness-of-fit test statistics as suggested by Jolly (in prep.) were computed for all data sets in which adequate degrees of freedom remained after cell pooling. Some data sets were available only in Leslie Method B Table summary form (Leslie and Chitty 1951), and these sets were only subjected to the x2 goodness-of-fit test. Data sets for which individual capture history data were available permitted estimation of the
132 STUDIES IN AVIAN BIOLOGY NO. 6
number of first captures occurring in each sam- pling period as suggested by Leslie et al. (1953). For these data sets we recorded the proportion of the sampling periods (for which estimates of first captures could be computed) in which the estimated 95% confidence interval for first cap- tures covered the actual known number.
Arithmetic mean estimates of capture proba- bility, survival probability and population size, and the range of estimated coefficients of vari- ation of population size are presented in Table 2. These summary statistics provide some indi- cation of the relationship between these param- eters and the precision of the resulting popula- tion size estimates. The two Canada Goose (Brunta canadensis) data sets (sets 2 and 3) had the hi ing 8
he;t capture probabilities, and the result- V(N,) were low. The Pintail data set (4)
exhibited the lowest estimated capture proba- bility, but because of the large population_ si?e and resultant banded sample sizes, the CV(N,) were not the highest encountered. Similarly, the Manx Shearwater data set (1) had relatively low capture probabilities, but because of the large sample sizes the @(fii) were also low. The data sets containing smaller sample sizes (e.g., fewer than 500 banded individuals) tended to yield a wide range of values for <53(ki), with low coef- ficients of variation associated with sampling periods having high capture probabilities, and vice versa, as expected.
The x2 goodness-of-fit test statistics indicated significant (P < 0.05) rejection of the model in 3 of the 7 data sets for which they could be com- puted. The most obvious rejection was obtained for the Manx Shearwater data set (l), for which sampling was thought to be nonrandom (Orians 1958). The proportion of estimated confidence intervals covering the actual number of new cap- tures was less than 0.95 for six of seven data sets, indicating possible violations of model as- sumptions.
A useful method of evaluating the utility or reasonableness of a parameter estimate is to compare it with an independent estimate of the same, or perhaps a similar, parameter. For ex- ample, the suggestion from the x2 test that the male Canada Goose data set (2) from Old Hick- ory Lake, Tennessee, did not fit the Jolly-Seber model was disturbing because of the high cap- ture probability and general quality of this data set. The female data set (3) from the same lo- cation provided a means of checking both sets of estimates. Male and female Canada Geese are generally thought to exhibit equivalent survival probabilities and the estimated mean Jolly-Seber survival rates for the 2 sexes did not differ sig- nificantly. If hatching sex ratio is approximately 50% males and if first year survival rates are
approximately equal for the sexes (e.g., see summary data in Bellrose 1976), then male and female population sizes should be roughly equivalent. Annual population size estimates and associated 95% confidence intervals for adult males and females are plotted in Figure 3. There is good correspondence between the male and female estimates for all years. We have also plotted mid-winter aerial estimates of total pop- ulation size for the Old Hickory Lake Canada Goose flock (from Cromer 1978:54). These mid- winter estimates apply to a different time of the year than the Jolly-Seber estimates, and they contain both sexes and all age classes, so cor- respondence between these and the sex-specific adult estimates is not expected to be close. Nevertheless, the similar patterns of population increase are reflected in the plots, and we be- lieve that the comparisons presented in Figure 3 increase the credibility of the Jolly-Seber es- timates for this population.
PARTIALLY OPEN POPULATIONS
Mark-recapture experiments on populations that are open to both gains and losses perhaps have the greatest potential applicability to stud- ies on the dynamics of avian populations. How- ever, if the population is partially rather than completely open, it is advantageous in the in- terest of parsimony to use one of the earlier models of Darroch (1959), which are shown by Jolly (1965) to be special cases of the Jolly-Seber model. A population that is closed to death and emigration but open to recruitment and immi- gration probably represents an extremely rare experimental situation. Thus, we have chosen to consider populations that experience only losses and no gains during the experimental pe- riod. A banding study of birds during a non- breeding period, or, if young recruits to the pop- ulation can be distinguished from older residents, even the breeding season could be reasonably modeled with this partial closure assumption.
Assumptions generally listed for the “death but no recruitment” model are the same as those of the Jolly-Seber model but with the addition of (8) the population is closed to recruitment. Both Darroch (1959) and Jolly (1965) considered models based on the multinomial distribution and treated I#+, pi, and (in Jolly’s case) y as unknown parameters to be estimated. Popula- tion size, Ni , at time i is treated as an unknown random variable. The population size estimate under this model is:
iiii = RA + n, (i = 1, 2,. . . , K - 1) ( ) ri
where Ri is the number of marked animals re- leased after sample i, Zi is the number of ani-


MARK-RECAPTURE METHODS-Nichols et al. 135
mals not caught in sample i but caught subse- quently, ri denotes the number of marked animals released after sample i and subsequent- ly recaptured, and Q is the number of animals caught in sample i. This fit can be shown to be an intuitively reasonable estimator using logic analogous to that used previously for the Jolly- Seber estimator, Mi.
This model has not been widely used by ecol- ogists. Robson (1979) has discussed the planning of experiments designed to estimate survival rates using this model, but we are aware of no similar work emphasizing estimation of Ni. We do note that examination of the estimator for the variance of & (see Jolly 1965:242) shows the importance of a large number of recaptures, ri , to the precision of &. For this reason, the sug- gestion of Jolly (1965:239) for his completely open model that release and recapture opera- tions can be operated independently is relevant to this model also. While estimates of Ni can only be obtained for sampling periods in which animals are released, recaptures could be ob- tained continuously (e.g., via resightings) by bi- ologists or even yolunteers in order to improve the precision of Ni
The discussion of assumptions l-7 for com- pletely open models is relevant to the “death but no immigration” model also. Pollock et al. (1974) provide a series of tests which can be used to examine assumption 8 of partial closure. Proper choice of time of the year and duration of the experiment can serve to improve the chance that this assumption is met. Finally, we note that a x2 goodness-of-fit test for the model can be computed in a manner analogous to that suggested by Jolly (in prep.) for the general Jol- ly-Seber model.
To our knowledge, the only use of this model in ornithological work has been that of Dwyer (pers. comm.). He has used the model to esti- mate population size of Woodcock based on summer mark-recapture experiments. The mod- el was thought to produce reasonable estimates, and goodness-of-fit test statistics indicated that most of the data sets did fit the model.
DISCUSSION As indicated in this review, ornithologists
have not made much use of mark-recapture methodologies for estimating population size. A modest number of reviewed studies employed the two-sample Lincoln index experiment which unfortunately does not permit much of the test- ing of assumptions which is possible with K- sample experiments. Ornithologists have made virtually no use of the models developed for K- sample experiments on closed populations. A small number of examples of the use of K-sam-
soot
1000
500
aI
‘0 E ._ :,
UJ
: .-
2 100
2 00
50
10
JollySeber Estimate (Adult cf Adult ?)
Year
FIGURE 3. Estimates of population size of Can- ada Geese on Old Hickory Lake, Tennessee (data from Cromer 1978).
ple open population models with bird popula- tions was found. However, only three papers were seen in which the stochastic Jolly-Seber model had been used to estimate size of a bird population. We found no published study in which the stochastic “death but no immigra- tion” model had been used with an avian pop- ulation.
As previously noted, we suspect that the high visibility and audibility of birds and the resulting potential for use of other estimation methods has been at last partly responsible for the neglect of mark-recapture methods by ornithologists. However, we also suspect that the level of sta- tistical training required to understand these models and the complexity of the numerical computations required to obtain some estimates may contribute to the neglect of mark-recapture models by biologists. This suspicion is rein- forced by the dramatic increase in the use of the band recovery model developed by Seber (1970a) and Robson and Youngs (1971) following the publication of Brownie et al. (1978), which was written for biologists and which contains

136 STUDIES IN AVIAN BIOLOGY NO. 6
instructions, output explanation, and examples of the use of two user-oriented FORTRAN pro- grams for carrying out necessary computations.
A number of recent efforts have been directed at making mark-recapture methods both under- standable and accessible to biologists. Seber’s (1973) book (a new edition is due in 1980) pro- vides an excellent review of methodology. Methods are illustrated with numerous field ex- amples and much of the book should be under- standable to biologists. More recently, Begon (1979) has written a monograph on capture-re- capture methods aimed specifically for biolo- gists. Two papers by Cormack (1972, 1973) are directed at the logic of mark-recapture methods and the intuitive nature of the associated esti- mators. The monograph of Otis et al. (1978) on closed population models is also written with the biologist in mind. A more elementary treatment of the material presented in Otis et al. (1978) is provided by White et al. (1981).
With respect to computational algorithms, computer programs providing Jolly-Seber esti- mates have been available for nearly a decade (Davies 197 1, White 197 1, Arnason and Kreeger 1973). The new version (see Arnason and Ban- iuk 1980) of one of these programs has extensive data management capabilities and also computes estimates based on the two partially open pop- ulation models of Jolly (1965) and the closed population model of Darroch (1958). A compre- hensive computer program was developed by Otis et al. (1978) to provide estimates and con- duct tests leading to selection of appropriate closed population models (see White et al. 1978). Crosbie (1979) has developed a computer pro- gram which computes estimates based on a number of open population models (e.g., the standard Jolly-Seber model and similar reduced- parameter models) and computes test statistics to aid in the selection of an appropriate model. We have developed a program for the age-strat- ified open population model of Stokes (1980) which is available to interested researchers now and which should be sufficiently user-oriented for general distribution in the near future (Hines, Stokes and Nichols, unpubl.).
It is difficult to make general statements about the potential applicability of mark-recapture
methods to avian population estimation because of the small number of relevant studies which have been conducted. In particular, there has been a complete lack of K-sample closed pop- ulation experiments. We hope that the models and program of Otis et al. (1978) will be used by ornithologists for short-term experiments (or in conjunction with long-term investigations com- prised of a number of relatively short sampling periods), and we will be interested to learn how well the various models seem to fit bird recap- ture data. With respect to open populations, the analyses presented in Table 2 provide some in- dication of the applicability of the Jolly-Seber model to avian studies. Results from some of the data sets (e.g., the Canada Geese) were very encouraging. However, assessments of model fit provided indications of problems with underly- ing assumptions in a number of the data sets. In addition, precision of population size estimates varied widely within a number of the data sets. We suspect that the age-stratified open popula- tion models of Pollock (1981 b) and Stokes (1980) will be useful in avian studies, and it will be interesting to learn whether the general models of Robson (1969) and Pollock (1975a) are useful with bird recapture data. The large variance es- timates associated with many of our Jolly-Seber analyses emphasize the need to consider the parsimonious, reduced-parameter models of Jol- ly (1979, in prep.) and Crosbie (1979). We hope that ornithologists interested in long-term pop- ulation studies will examine these various open population models and make use of them as they become available.
ACKNOWLEDGMENTS
We thank T. J. Dwyer, R. T. Holmes, C. S. Rob- bins, C. B. Worth, J. R. Cromer and the Tennessee Wildlife Resources Agency for use of unpublished data. R. M. Cormack, G. M. Jolly and K. H. Pollock kindly provided copies of unpublished manuscripts and manuscripts in press. D. R. Anderson, T. J. Dwyer, H. F. Percival, and B. K. Williams reviewed the manuscript and provided useful suggestions. We thank C. Samuel, R. Wilcox and P. Bowley for typing the manuscript.