renewable generation and electricity prices: taking stock and new
TRANSCRIPT

This working paper has been developed within the Alcoa Advancing Sustainability Initiative to Research and Leverage
Actionable Solutions on Energy and Environmental Economics
WP FA03/2013
Renewable Generation and Electricity Prices: Taking Stock and New Evidence for Germany and Austria
Klaas Würzburg, Xavier Labandeira, Pedro Linares
2172 / 8437
1
Renewable Generation and Electricity Prices: Taking Stock
and New Evidence for Germany and Austria
Klaas Würzburg a,b, Xavier Labandeira a,b, Pedro Linares a,c,*
a Economics for Energy, Doutor Cadaval 2, 3-E, 36202 Vigo, Spain
b Rede, Universidade de Vigo, Facultade de CC.EE., Campus As Lagoas s/n, 36310 Vigo, Spain.
c Universidad Pontificia de Comillas, Alberto Aguilera 23, 28015 Madrid, Spain
Abstract
Economic theory predicts that high renewable electricity production reduces
the price of electricity, also referred to as the „merit-order effect‟. Although the
merit-order effect is only one of several consequences of renewable
production on the electricity system, it is crucial to determine its size for the
economic evaluation of renewable energies. In this paper we present a
comprehensive overview of relevant past research results on the price effect of
renewables. Additionally, we conduct a new empirical analysis of the price
effect of renewable production for the Austrian-German region, a market that
clearly qualifies for a merit-order effect analysis given its characteristics. Based
on the review and our own analysis, we show that the merit-order effect varies
depending on the region and the assessment method chosen. We also find
that the size of this effect is less dispersed throughout different markets than
previously suggested by the literature.
Keywords: Wind, solar, merit-order, supply
JEL classification : Q41, Q42, Q48
* Corresponding author. Phone: +34 915406257
E-mails: [email protected] (Würzburg), [email protected] (Labandeira), [email protected] (Linares)

2
1. Introduction
Renewable energy sources are a key element in strategies and scenarios to tackle climate
change (see e.g. IPCC, 2011; IEA, 2012), and they have also been vindicated as a way to reduce
energy dependence or to promote new economic sectors and activities in specific countries. Yet it
is usually more expensive to generate electricity with renewables than it is with conventional
(mostly fossil-fuel) technologies. Indeed, countries that have succeeded in increasing their
renewable capacities significantly have done so by implementing intense support policies, mostly
feed-in-tariffs (FIT) or renewable allowance systems1, which incur in significant costs. In many
cases the very success of the renewable promotion schemes has led to increasing costs, such as
with FIT, thus raising doubts on their future economic viability. This has been recently the case in
the two most ambitious European experiences in the field so far, with a moratorium on the whole
Spanish renewable support system and severe amendments to counter cost increases in the
German FIT system2.
Identifying and quantifying the costs and benefits of increased renewable capacity is therefore a
key element of economic research on renewable energy. Indeed, the impacts of additional
renewable electricity production in energy markets must be fully understood to evaluate the
efficiency (i.e. desirability) of renewable support policies. One very important question in this
regard is whether renewable production affects the electricity price and, if so, how it does so.
Theoretical considerations first stated by Jensen and Skytte (2002) suggested that renewable
electricity production results in lower electricity prices, as subsequently elaborated by, among
others, Sensfuss et al. (2008) or Nicolosi and Fürsch (2009). The phenomenon is commonly
known as the „merit-order effect‟, where price decreases occur because (additional) renewable
electricity bids into the market at lower marginal costs.
From a political point of view these price reductions often seem appealing and they frequently
serve as a justification for renewable support schemes. However, as already stated by Gelabert
et al. (2011), the merit-order effect is mainly a transfer of wealth from producers to consumers, at
1 Several European countries have managed to create a sizeable renewable capacity. See Schmalensee (2012) for a critical assessment of renewable support schemes in the EU and the US. 2 At the beginning of 2012 Spain introduced a moratorium of all renewable support after experiencing an unexpected increase in solar capacity, which imposed strong financial pressure on its FIT system. That spring, Germany also implemented unprecedented cuts in its support to photovoltaic technologies and, given the persistence of the problem, recently issued further restrictive proposals. For an updated description of the Spanish and German renewable support experiences see, respectively, Linares and Labandeira (2013) and Diekmann et al. (2012).

3
least if market equilibrium is formed at prices equal to marginal costs3, with gains and losses
potentially shared unevenly among different types of generators (depending on their cost
structures). Furthermore, a more intensive use of renewables requires an increase of
conventional back-up capacity to cope with the volatility of renewable generation. This process
may, in turn, affect long-run electricity prices in the opposite direction (Nicolosi and Fürsch, 2009;
Jonsson et al., 2010), thus offsetting the initial (short-term) merit-order effect (see e.g. Green and
Vasilakos, 2011). These factors, along with the potential conflict of interest between suppliers and
consumers of electricity, may introduce controversy in the calculation of the benefits and costs of
renewable energy.
Any program that aims to assess past regulation and ensure cost-effectiveness of future policies
should therefore carry out a comprehensive and rigorous analysis of the price effects of
renewables. There is a considerable literature on this issue now, so it is possible to take stock
and draw some general conclusions. However, this is not an easy endeavor because the
measurement of price effects depends on several diverging factors contemplated in the different
studies (technological mix in the electricity system, market conditions etc.)4, as well as on the
different methodologies employed to do so. Indeed, comparability constraints range from the use
of different datasets or different systematic approaches (such as the use of simulations or
empirical analysis of market data) to other small but possibly influential factors (e.g. the inclusion
of additional explanatory factors such as the working load or the definition of the renewable
variable: wind speed, wind generation, or a sum of wind and solar generation). Therefore, results
must be interpreted conjointly and should reflect the particular differences among the studies
whilst attempting to draw useful conclusions from existing research for a global analysis. We
follow this approach in the first part of the paper, designed to both provide a detailed overview of
the literature and reveal previously undisclosed patterns in prior research.
The paper also presents the results of an own, novel empirical investigation on the price effect of
renewable production for the German-Austrian electricity market. We carried out this empirical
exercise for several reasons, but we did so mostly as a way to complete and interpret the
surveyed literature for a key European energy and economic area with limited empirical evidence
3 If firms have market power and can set prices above marginal costs, however, renewable-related price reductions may enhance total welfare. But even then, rents are shifted from producers to consumers in significant quantities. 4 Transmission capacity limits within the network of an electricity market may cause price discrepancies, such as those seen, for instance, in Texas (Zarnikau, 2011).

4
on this matter (particularly in empirical approaches). Moreover, the German-Austrian market
features an important renewable capacity that is obviously related to the strong renewable
support scheme that has been in place for many years. The fact that a market of this size, located
in the core of Europe, may strongly influence other closely integrated energy areas adds interest
to the results of our exercise.
The article is organized as follows. We next describe and summarize the existing empirical
research on the effects of renewables on electricity prices, providing some general conclusions
from this comprehensive overview. Section 3 deals with the price effects in the German-Austrian
electricity market, with a description of the data, methods and results. Finally, Section 4
concludes and presents the main findings and implications.
2. Existing studies on renewable production and electricity prices
This section presents an overview of previous studies about the effect of renewables on electricity
prices. As indicated above, any survey that attempts to draw general conclusions on this matter
from disparate individual applications should be done with special care and should highlight both
the differences and the global utility of each study. Therefore, we first describe the existing
literature, grouping it in three categories: simulation-based approaches (Section 2.1), that is,
studies based on simulation models that may use both real (past) or hypothetical data; empirical
analyses (Section 2.2), based on real, past data, generally performed with econometric models;
and finally other applications that provide some, but less concrete, information on the electricity
price effects of renewables (Section 2.3). This is subsequently used to provide an overall picture
and to draw some general messages from current knowledge in the field.
2.1. Simulation-based studies
There is now a rather sizeable literature that uses, for a number of countries and regions,
simulation-based modeling approaches to deal with the effect of renewable production on
electricity prices. We next enumerate and describe the most relevant pieces of research, which
are grouped by country. Table 2 in Section 2.4 presents a summary of the main characteristics
and findings of the papers mentioned in this section.

5
Starting with Germany, Sensfuss et al. (2008) use a model of the electricity market to run several
simulations for situations with and without renewable production. They find that the average
electricity price for Germany was reduced by 1.7 to 7.8 €/MWh due to the electricity production of
renewables for the years 2001 and 2004 to 2006. In a subsequent application Sensfuss (2011)
uses the same technique for the 2007-2010 period, showing that the 2010 effect is found to be at
least (i.e. in a conservative calculation) between 5 and 6 €/MWh.
In another application, Bode and Groscurth (2006) construct a model of a synthetic electricity
market by estimating demand and supply functions based on past experience and estimations of
marginal costs of different production technologies (with basic assumptions and figures matching
the 2005 actual situation). They quantify the effect at 0.5 to 0.6 €/MWh per GWh of additional
renewable production (depending on assumptions about the demand function). Weber and Woll
(2007) model the German electricity system for the following year, incorporating 34 technologies
for electricity generation and prices of other energy goods and of CO2 permits. Their calculations
show that the hourly electricity prices are 4.04 €/MWh higher in a no-wind scenario with respect
to the scenario with normal wind production. In a subsequent exercise, Weigt (2009) models the
German electricity market to investigate the potential of wind generation to replace traditional
fossil capacities. While doing so, he calculates electricity prices for the scenarios with and without
wind generation, and finds lower prices for the former between January 2006 and June 2008. The
price effect of wind generation also grows over time5. The study reports an average price effect of
approximately -10 €/MWh for the studied period.
With a somewhat different approximation, Fürsch et al. (2012) calculate merit-order effects for
Germany based on the DIME Model (Dispatch and Investment Model for Electricity Markets in
Europe). This model is capable of reflecting international cross border flows and also allows for a
changing electricity mix as a response to growing renewable participation in the mix. The results
are forecasts for 2015, 2020, 2025 and 2030 that compare a scenario of the German energy
market with a counterfactual of frozen renewable capacity at 2010 levels. As depicted in table 2,
5 Off peak price effects: -2.4 €/MWh in 2006; -4.1 €/MWh in 2007; and -6.9 €/MWh in the first half of 2008. The price decreasing effect was found to be higher during peak hours: -10.1 €/MWh in 2006; -16.8 €/MWh in 2007; and -19.4 €/MWh in the first half of 2008.

6
the price differences between these two scenarios are found to be -2 €/MWh for 2015, -4 €/MWh
for 2020, -5 €/MWh for 2025, and -10 €/MWh for 20306.
Finally, Traber and Kemfert (2009) develop an energy sector model based on an earlier work of
Lise et al. (2006) where the European electricity sector incorporates the existing degree of
competition and is modeled as a single market subject to the EU emissions trading scheme
(ETS). In this setting they find that the German FIT system lowers electricity prices of German
producers but also marginally increases consumer prices. This model is expanded in Traber and
Kemfert (2011) to explicitly account for the consequences of the fluctuations in wind production.
The paper finds that German market prices are roughly 3.7 €/MWh (or 5%) lower in their wind
scenario than in the no-wind scenario. In another piece of research Traber et al. (2011) calculate
the 2020 German wholesale electricity prices for a scenario with growing renewable shares and
another one with frozen 2010 renewable capacity and expanded fossil capacity. Now the 2020
electricity wholesale price is expected to be 3.2 €/MWh lower for the scenario with growing
renewables than it is for the frozen renewable scenario.
There are also some simulation studies on this question for Spain, another leading European
supporter for renewables. Linares et al. (2008) use a simulation model of the electricity market to
obtain results, up to 2020, for different scenarios: with and without a European carbon emission
scheme and with or without additional national renewable support (or both). Given the actual
existence of the EU ETS, that scenario may be used as counterfactual for the alternative situation
where additional renewable support results in an expanded renewable capacity of 21.81 TWh in
2020. As a consequence, electricity prices would decrease by 1.74 €/MWh. In another simulation
analysis, Sáenz de Miera et al. (2008) show that wind energy input significantly reduced Spanish
electricity prices between 2005 and 2007 (amounts vary from -7.08 €/MWh to -12.44 €/MWh
between the periods).
Lastly, Holttinen et al. (2001) carry out a simulation study for Nordpol (the Nordic electricity
market that comprises Denmark, Finland, Norway and Sweden) to estimate the impact of wind
generation on market prices. Using wind data from 1961 to 1990 to calibrate the model, in a 2010
6 The growth of the price effect, over time, is in line with the simultaneous growing difference in renewable generation between the considered scenarios.

7
forecast scenario the model yields spot price reductions of 2 €/MWh for each 10 TWh of
additional wind production in the space of one week.
2.2. Empirical studies
In contrast to the preceding studies, several papers have taken advantage of the growing
availability of ex-post data on electricity prices and renewable capacity in several countries to use
different econometric approaches and techniques to compute the actual price effect of expanding
renewables.
Starting again with Germany, although with very limited empirical evidence (that justifies carrying
out our ad-hoc exercise later in the paper), Neubarth et al. (2006) set up a univariate regression
model to investigate the effect of wind power production on day-ahead spot prices in Germany
from September 2004 to August 2005. They find that the day-ahead electricity price falls by 1.89
€/MWh for each additional GW of wind production.
Using an empirical approach that will be largely replicated in our application with German data,
Gelabert et al. (2011) use daily production quantities of different electricity generation types for
Spain to investigate how they affect electricity prices during the 2005-2009 period. They find that
each GW of additional renewable electricity production reduced Spanish electricity prices by
roughly 2 €/MWh. A similar result was obtained by Sáenz de Miera et al. (2008), after picking
three arbitrary days of February 2006 to perform an exhaustive comparison of electricity prices
and wind energy production. They actually follow this approach to produce a ceteris paribus
situation for all other influences except wind input, such as electricity demand, fuel prices, hydro
production, etc. Finally, Gil et al. (2012) use a conditional probability approach to calculate how
much the market penetration of wind generation influenced day-ahead electricity prices in Spain
from 2007 to 2010. They indicate that electricity price reductions become increasingly likely when
market penetrations of wind are higher. On average, they find that the electricity price without
wind production is 9.7 €/MWh or 18% higher than it is with wind production.
Data availability and the interest to know the effects of an early rush to renewables, explain the
various empirical applications to the Danish case. Ostergaard et al. (2006) analyze data of
December 2005 on Danish electricity prices and wind generation. They distinguish between those

8
hours with wind and those hours without it. They find that Danish electricity prices would have
been higher without any wind electricity generation (1 €/MWh in 2004; 4 €/MWh in 2005; and 2.5
€/MWh in 2006)7. A later application of Jonsson et al. (2010) uses data on day-ahead electricity
prices and load and wind production forecasts for the Western Denmark market from January
2006 to October 2007. They find that wind production influenced prices heavily, detecting the
strongest price-reducing effects during times of high wind production. Although they indicate that
a quantification of the price effect is complicated, at some stage they assess the price differences
between low wind (55-50 €/MWh during the day, 30 €/MWh at night) and high wind (30 €/MWh
during the day, 18 €/MWh at night) situations. Such an approximate 40% electricity price variation
between low-wind and high-wind circumstances is one of the highest in the literature. This is
probably due to the unusually high renewable penetration and also the small size of the Danish
system8.
Nieuwenhout and Brand (2011) use wind and weather data from the Netherlands to reconstruct
day-ahead wind generation figures for 2006-2009, and divide the data to create groups that
correspond to low or no-wind production intervals. They find that average day-ahead prices at the
Dutch electricity exchange were roughly 5% higher during the no-wind intervals with respect to
the average of the entire sample for the analyzed period.
In another European case study, O‟Mahoney and Denny (2011) employ 2009 hourly data for
Ireland. They use a wide set of variables, including demand, wind generation and fossil fuel
prices, to explain movements in the shadow price of electricity. As in other empirical applications
they find that, during 2009, the price of electricity fell by 9.9 €/MWh per GW of wind.
As in some European countries, the effect of wind production on electricity prices has been
heavily investigated in Texas due to the increasing relevance of renewables there. Two of the first
exercises use high-frequency data (hourly and 15 min intervals, respectively), which in Nicholson
et al. (2010) are used to analyze the 2007-2009 period with explanatory variables that include
wind generation, production from gas plants, temperature, and past values of the electricity price.
They find a range of decreasing effects of wind generation on balancing electricity prices of 0.67
7 Ostergaard et al. (2006) is only available in Danish, but a summary of their findings can be obtained in Munksgaard and Morthorst (2008). 8 Jonsson et al. (2010) state that the Western Danish market has one of the highest wind penetrations in the world (occasionally exceeding 40%).

9
to 16.4 US$/MWh per additional GW of wind production (depending on the year, time of the day,
and the area in the Texas network). Woo et al. (2011) study the 2007-2010 with a similar
approximation, that includes nuclear generation, system load, price of gas, and a set of time
dummies as additional explanatory variables, and finds that a 1 GWh increase in wind generation
(during 15 minutes) decreased Texas balancing electricity prices between 13 and 44 US$/MWh9.
Actually, Zarnikau (2011) highlights that lacking transmission capacity within Texas has led to a
situation where the intermittent wind production caused electricity prices to plunge in some
regions while they peaked in others. Finally, Baldick (2011) argues that the high volatility of
electricity prices in Texas also originates from the negative correlation between wind production
and peak demand.
2.3. Studies with limited information on price effects
There are several other studies that, despite their interest in the electricity price effects
associated to renewable production, do not yield a precise quantification. This usually happens
because these papers typically focus on other questions and deal only marginally with the merit-
order related effects of renewables on electricity prices. That is why we do not provide a detailed
description of the papers, as in the previous sub-sections, but rather only a table that summarizes
their main conclusions regarding this issue.
Table 1 thus presents the main conclusions of 17 papers that also differ from the previous
literature in a much wider geographical coverage (including other US states, Australia or Israel).
The table distinguishes, as before, between simulation-based and empirical approximations and
shows the general price effect. Although it is now even harder to draw general conclusions from
papers that are quite heterogeneous in methods, data and objectives, it seems quite obvious that
electricity prices generally tend to fall due to increased renewable production. However, the
magnitude of this effect varies greatly across studies, and there is disagreement about the
duration and persistence of the effect.
9 There is variability across the four existing zones in the Texas network, ranging from 1.3 to 4.4 €/MWh.

10
Table 1. Studies with limited information on the price effects of renewables
Paper
Methodology
Country
Price effect
Additional Information
Bach (2009) E Germany; Denmark P↓
CEEP (2004) S New Jersey P↓
Cutler et al. (2011) E Australia P↓
Gomez-Quiles and Gil (2011) S Spain P↓
Green and Vasilakos (2010) S UK P↓
Hindsberger et al. (2003) S Nordpool P↕ Depending on the RE requirement
Hirth (2012) S NW Europe P↓ Deals with wind/solar value factors
Hu et al. (2010) E Denmark P↓
MacCormack et al. (2010) S General P↓
MacGill (2010) E Australia P↓
Milstein and Tishler (2011) S Israel P↑*
Nicolosi and Fürsch (2009) E Germany P↓
Obersteiner and Redl (2007) E Germany and Austria P↓
Palmer and Burtraw (2005) S USA P↕ Depending on RE penetration and energy prices
Rathmann (2005) E Germany and Austria P↓ Effect through the EU-ETS
Traber and Kemfert (2009) S Germany P↕ Depending on the type of consumer
Unger and Ahlgren (2005) S Nordpool P↓
Notes: S, Simulation approaches; E, empirical approximations; * long run. Source: The authors
2.4. Comparability of existing studies
Sections 2.1 to 2.3, showed that higher renewable production was generally and consistently
associated to reduced electricity prices, at least in the short term10. Yet the question is how much
do electricity prices fall, that is, whether there is a common pattern in this phenomenon across the
existing literature too. Table 2 provides a comprehensive summary of the different simulations
and empirical approaches that have actually quantified the effects of renewable production on
electricity prices, previously described in Sections 2.1 and 2.2.
10 Long-term effects may be different since the new generation mix and short-term lower prices influence investment decisions and thus future prices (Green and Vasilakos, 2010 and 2011; Milstein and Tishler, 2011; Gelabert et al., 2011).

11
Table 2. Literature on price effects of renewable generation
(1) Paper
(2) Meth.
(3) Country
(4) Type
(5) Period
(6)
Reported price change (€/MWh)
(7) As per
(8) During
(9)
Common measure*
(10) Difference+
Bode and Groscurth (2006) S Germany All Roughly 2005 (-0.5, -0.6) 1 GWh A G 1h (-0.5, -0.6)
Fürsch et al. (2012) S Germany All 2015-2030
(F)
2015: -2.0 A vs 2010 P
-0.40 5.02
2020: -4.0 A vs 2010 P
-0.35 11.42
2025: -5.0 A vs 2010 P
-0.37 13.70
2030: -10.0 A vs 2010 P
-0.61 16.32
Neubarth et al. (2006) E Germany Wind 2004- 2005 -1.89 1 GWh A G 1h -1.89
Sensfuss (2011) S Germany All 2007-2010
2007: 5.82 N vs N
-0.77 7.58
2008: -5.83 N vs N
-0.71 8.22
2009: -6.09 N vs N
-0.71 8.57
2010: -5.27 N vs N
-0.55 9.58
Sensfuss et al. (2008) S Germany All 2001,
2004-2006
2001: -1.7 N vs N
-0.94 1.80
2004: -2.5 N vs N
-0.60 4.18
2005: -4.25 N vs N
-0.86 4.97
2006: -7.83 N vs N
-1.34 5.59
Traber and Kemfert (2011) S Germany Wind 2007-2008 0% N vs N
-0.80 4.65
Traber et al. (2011) S Germany All 2020 (F) vs
2010 -320% A vs 2010 P
-0.24 13.07
Weber and Woll (2007) S Germany Wind 2006 -4,04 N vs N
1.15 3.51
Weigt (2009) S Germany Wind 2006-2008
2006: -6,26 N vs N
-1.78 3.51
2007: -10,47 N vs N
-2.30 4.54
2008: -13,13 N vs N
-2.83 4.65
Gelabert et al. (2011) E Spain All 2005-2010
2005: -3.8 1 GWh A G 1h -3.80
2006: -3.4 1 GWh A G 1h -3.40
2007: -1.7 1 GWh A G 1h -1.70
2008: -1.5 1 GWh A G 1h -1.50
2009: -1.1 1 GWh A G 1h -1.10
2010: -1.7 1 GWh A G 1h -1.70
Gil et al. (2012) E Spain Wind 2007-2010 -9.72 N vs N
-2.15 4.51
Linares et al. (2008) S Spain All 2020 (F) 2020: -1.74 A vs A
-0.70 2.49
Sáenz de Miera et al. (2008) S Spain Wind Jan 2005- May 2007
2005: -7.08 N vs N
-2.99 2.37
2006: -4.75 N vs N
-1.83 2.60
2007: -12.44 N vs N
-3.99 3.12
Holttinen et al. (2001) S Nordpool Wind 2010 (F) -2.0 10 TWh A G 1 year -1.7
Jonsson et al. (2010) E Denmark Wind 2006-2007 roughly -40% L vs H
-9.87 0.63
Ostergaard et al. (2006) E Denmark Wind 2004-2006
2004: -1.0 N vs N
-1.33 0.75
2005: -4.0 N vs N
-5.28 0.76
2006: -2,5 N vs N
-3.58 0.70
Nieuwenhout and Brand (2011) E Holland Wind 2006-2009 -5% N vs N
-6.17 0.43
O‟Mahoney and Denny (2011) E Ireland Wind 2009 -1% 1 MWh A G 1h -9.90
Nicholson et al. (2010) E Texas Wind 2007-2009 (-0.067, -1.64) (c$/MWh) 1 MWh A G 1h (-0.47, -11.6)
Woo et al. (2011) E Texas Wind 2007-2010 (-1.3, -4.4) ($/MWh) 100 MWh A G 15 min (-2.34, -7.91)
Notes: S, simulation; E, empirical approximation; F, forecast; A G, additional generation; A vs 2010 P, additional vs. 2010 production; N vs N, none vs. normal production; A vs A, additional vs. alternative production; L vs H, low vs. high production; * €/MWh for each additional GWh produced within 1 h; + difference in average hourly generation. Various sources have been used for the conversions: US Energy Information Administration, Red Eléctrica Española, Nordpoolspot, the German and Austrian electricity market and the reported papers. Source: The authors
12
Columns 6 to 8 in Table 2 report the price effects as provided by the particular studies of the
surveyed literature. Some of the price changes refer to a certain increase in renewable or wind
generation; others (mainly in the simulation studies) indicate the price difference between
situations with normal wind and without wind. Obviously, the reported units are different and
cannot be directly compared11. We deal with this problem by recalculating the reported units so
that all price changes are accounted in €/MWh and related to the increase in one GWh of
renewable production (column 9 in Table 2). Finally, column 10 in Table 2 contains the average
difference in generation per hour between scenarios so that the conversion process for studies
that report price differences with respect to scenarios (not per amount of additional renewable
generation) is transparent. Through this procedure, Table 2 yields comparable information that
can be used for the conjoint evaluation of the different studies that will be developed in the
following section. Yet, even with this additional effort, a comparative analysis and assessment of
different studies should be carried out carefully and bear in mind the several remaining
limitations.
Indeed, one factor that may render comparability difficult is precisely the homogenization effort
because sometimes the additional data used to convert the results in comparable units may not
coincide with the assumptions of the original studies. This is a likely outcome in simulation
studies, where the overall generation and prices in the models might not coincide with actual
values. Moreover, the analytical differences arise not only in terms of the use of real market data
by empirical (vs. simulation) studies, but also within each of the general and apparently
homogeneous approximations. For example, only some of the simulation studies use past
weather data to estimate renewable output (e.g. Holttinen et al., 2001; Nieuwenhout and Brand,
2011), or consider the existence of an emission trading system (e.g. Sensfuss et al., 2008; Traber
and Kemfert, 2011). Some of the simulation studies use a counterfactual with an amended power
plant structure to represent possible long-run capacity mix adaptations (e.g. Traber et al., 2011;
Sensfuss, 2011; Fürsch et al., 2012), while others leave the non-renewable capacity and
generation values unchanged in their counterfactuals.
Significant heterogeneity also exists within empirical studies. For instance, a few papers use a
high-frequency approach with an autoregressive element (e.g. Nicholson et al., 2010; Woo et al.,
11 The literature survey by Pöyry (2010) does such comparisons and can thus be misleading when evaluating merit-order and price effects.

13
2011). Univariate approximations, that include only the renewable generation variable in the
empirical analysis, are also common (e.g. Neubarth et al., 2006; Gil et al., 2012), and coexist with
empirical exercises that include many other explanatory variables such as load, gas prices etc.
(e.g. Nicholson et al. 2010; Woo et al, 2011; Gelabert et al., 2011). Given that additional variables
may contain relevant explanatory power, it follows that univariate approaches are more likely to
produce biased coefficients for the price effect of renewable generation and may prevent a
meaningful comparative evaluation.
2.5. A comparative assessment of the literature
Even though the comparability of largely heterogeneous studies may be constrained by the
reasons just mentioned, we believe that Table 2 provides as much comparable information as
can be achieved in this area. In this section we use that information to gather some insights and
general messages from existing studies on the effects of renewable production on electricity
prices. In this sense, Figure 1 depicts column 9 of Table 2 in a graphical manner, grouping the
results by countries or regions. The vertical axis on the right informs about the range of price
effects, in €/MWh per additional GWh of renewable or wind energy produced, as reported for
different countries by the specialized literature. The grey blocks indicate the number of studies
per country or region.
Starting, as usual, with the evidence for Germany, existing studies seem to yield quite similar
results albeit using different approaches and methods. Taken together, the nine studies on
Germany report rather consistent results, quantifying the merit-order effect in a band between
roughly -0.5 and -2 €/MWh, with most studies reporting reactions below -1 €/MWh. Only the
studies by Neubarth et al. (2006) and Weigt (2009) are an exception that, at least for the former,
may be explained by the use of a univariate approach that may produce biased estimates (see
Section 2.4). The first results reported for Germany are for 2001 (Sensfuss et al., 2008), with
forecasts available until 2030 (Fürsch et al. 2012), and do not indicate a growing price effect
when measured in €/MWh for each GWh of additional renewable production12.
12 When reported as a price difference between full and no renewable generation, however, the price difference grows over time. This is logical, due to the increased capacity and participation of renewables in the energy system.

14
Figure 1. Range of price effects of renewable production
Notes: The black dot refers to the average price effect, in €/MWh per each additional GWh of renewable (or wind) energy produced, as reported by the literature. The grey blocks indicate the number of studies performed for each country. Source: The authors
The four Spanish studies yield a price effect of approximately -2 €/MWh, without significant
variation even though the methodologies of Sáenz de Miera et al. (2008), Gelabert et al. (2011)
and Gil et al. (2012) differ substantially. However, the trends over the years reported by Sáenz de
Miera et al. (2008) and Gelabert et al. (2011) are rather different: whereas the former detect a
strong increase in the merit-order effect between 2006 and 2007, the latter show a significant
decrease during the same period. In this sense, at least compared to the literature on Germany,
the studies on Spain seem to give somewhat less coherent results.
The highest price effects were actually detected in small electricity markets like Denmark, the
Netherlands, and Ireland. This is explained by the accounting unit for price effects, €/MWh for
each additional GWh of renewable energy produced, as one GWh of production is a much
smaller part of large electricity markets. For example, the Danish and Dutch hourly wind
production in 2006 (a year analyzed by Nieuwenhout and Brand (2011), Ostergaard et al. (2006)
and Jonsson et al. (2010)) was far below 1 GW on average; for Ireland it was even less. On the
contrary, Spanish and German hourly wind 2006 production was 2.6 GW and 3.5 GW

15
respectively, about three to five times bigger than it was in their smaller counterparts. This means
that, accounting for market sizes, price effects are not that different in Europe13.
Results for the Scandinavian Nordpool market (Holttinen et al., 2001) are similar in size as the
results for Germany and Spain (the price effect of 1,7 €/MWh is in between the average Spanish
and German effect). Total size of the Nordpool market is also in between these two markets.
When relating the results of Holttinen et al. (2001) for the Nordpool market to those of other
markets one must consider the methodological differences of this particular study.14 One might
have expected lower price effects of wind power in this particular Nordpool market because of the
availability of reservoir hydro capacity that can adjust to the volatility of renewables without raising
the costs of the marginal power plant in the system. However, due to the unique methodology in
Holttinenen et al. (2001) and the availability of only one study for the joint Nordpool market, we
are reluctant to speculate on possible reasons of the outcome on the Nordpool market.
Finally, the Texas studies are the least comparable because of acute methodological differences
(high-frequency autoregressive models by Nicholson et al. (2010) and Woo et al. (2011)), and the
strong asymmetries between ERCOT, Texas electricity system, and its European counterparts.
The variation of the price effect in the Texas studies is high among different zones within ERCOT,
which in some cases lack interconnection capacity (Zarnikau, 2011). Baldick (2011) also states
that the typical wind patterns in Texas are particularly unfavorable and this makes even more
complicated to compare the Texas results with other international applications.
Summarizing then, the comparison of results per country/region shows that the particular
estimates of merit-order effects do not show as many differences among countries as the
individual results suggest at first sight (columns 6-8, Table 2). When converted into homogeneous
units, at least the European merit-order effects are quite comparable in size.
Given the joint analysis of previous results, it is particularly interesting to see how these results
relate to the biggest European electricity market, which also features an important scheme for
renewable support. Therefore, we next present new results for Germany and Austria, an
integrated electricity market in the core of Europe that also strongly influences neighboring areas.
13 This is also illustrated in columns 6 and 7 of Table 2 for the cases where the quantification of the price effect is expressed as a difference between normal and zero renewable generation (which is not available for all studies). 14 Holttinen et al. (2001) is the only study that uses a weekly frequency of data, calibrates wind output in the model in a unique way, and allows for capacity changes between scenarios in areas outside Nordpool which are interconnected.

16
Our new empirical analysis also closes a research gap since, as observed in previous sub-
sections, the effect of renewable production on electricity prices in Germany and Austria were
mainly analyzed through simulation approaches in the past. The following section presents novel
results in an extensive data framework with various model variations that provide new insights for
a number of relevant merit-order effect questions, including for instance those related to the
German nuclear abandonment program.
3. An empirical analysis for Austria and Germany
This section presents a new empirical exercise on the effects of renewable production on the
price of electricity based on real data for Germany and Austria, both of which are analyzed
together given the high degree of integration between their electricity markets. We first show
some basic facts regarding the German and Austrian electricity market (Section 3.1), followed by
a description of the data and empirical methodology used in the study (Section 2.2). The final
sub-section deals with the results from the estimation of a multivariate regression model, which
are later compared to the outcomes of existing applications.
In the preceding parts of the paper we observed that existing empirical literature on Germany
regarding this matter is limited, so any contribution in this area may prove useful to complete and
understand that literature. Moreover, we feel that this paper closes a significant research gap for
several reasons. First, the German and Austrian market possesses many of the characteristics
that make merit-order effect analyses especially interesting, that is, it has a large share of
renewables and a strong renewable support scheme. Second, the economic importance of this
area coupled with its central location in Europe (with 13 bordering countries) make the contagion
of the price effects associated to renewable production on neighboring countries likely. Third, its
high integration with adjacent economies and electricity markets, add further relevance to the
exercise. Finally, the results can be extrapolated to other big economies that might opt for a
similar path with high renewable shares as predicted by future energy scenarios (see e.g. IPCC,
2011; IEA, 2012).

17
3.1. The German and Austrian electricity market
The German part of the market is much greater in size (roughly eight to one) and defines the
combined market as the largest in Europe. Taken together, Germany and Austria feature a
significant renewable production capacity, although most solar and wind capacity is installed in
Germany (in early 2012 29,700 wind MW in Germany vs. 1,150 MW in Austria and 24,500 solar
MW in Germany vs. 107 MW in Austria). This difference is related to a much higher carbonization
rate in the German electricity generation system (mostly coal and lignite) while Austria is
endowed with significant hydro capacities. In this setting, climate change and other environmental
concerns explain the early introduction (1991) of a FIT system for renewable sources, with the
exception of hydro, in Germany. The support system gave grid access to all renewable producers
but its success in triggering significant investments in renewable capacities was limited. This led
to the 2000 reform through the Renewable Energy Act (Erneuerbare Energien Gesetz, EEG),
which guaranteed fixed tariffs to different renewable technologies and plant sizes (that now
includes small hydro). The Act has continuously been amended ever since, with a prominent and
controversial reduction in solar remuneration since early 2012, although changes have not
affected the basic mechanics of the 2000 EEG. Table A.1 in the Appendix reproduces the
financial efforts related to the German FIT and the EEG that, in plain contrast with Austria15,
converted Germany into a world leader in photovoltaic and wind installed capacity (Bode and
Groscurth, 2006).
Figures 2 (Germany) and 3 (Austria) summarize the recent evolution of the electricity mix in both
countries, with the right-hand side illustrating the evolution of renewables. Carbon-intensive
technologies clearly prevail in Germany, even though the system participation of renewables has
grown significantly in the last few years (renewable production tripled from 40 TWh per year in
2001 to 120 TWh in 2011). The diagrams clearly illustrate the importance of renewables in the
German-Austrian electricity system, where they provide a much higher contribution to electricity
generation than in other global markets.
15 In 2003 the Austrian government launched its “ecological electricity regulation” which has frequently been amended ever since. Yet this legislation only sets goals for the installed capacity of hydro, wind, biomass, and waste for 2020, and it does not include extensive market interventions such as those introduced by Germany‟s EEG.

18
Figure 2. German electricity production by source (TWh)
Total Renewable
Notes: The EEG-financed gas generation from waste, mining, and sewage (see Table A.1 in the Appendix) is included in the category “Other” in the left graph. 2011 values are preliminary. Source: Statistisches Bundesamt; Bundesministerium für Wirtschaft und Technologie; BDEW Bundesverband der Energie- und Wasserwirtschaft e.V.; Statistik der Kohlenwirtschaft e.V.; AG Energiebilanzen e.V.
Figure 3. Austrian electricity production by source (TWh)
Total Renewable (excluding hydro)
Note: No renewable data available before 2005. Source: Statistics Austria
3.2. Data and methods
We construct a multivariate regression model similar to Gelabert et al. (2011). The electricity price
(Pelec) is the dependent variable, and the explanatory variables are the demand of electricity
(Load), the renewable electricity production from solar and wind (RE), the gas price (Pgas), and
the exports and imports of electricity (ExIm), i.e.,
∆Pelec, t = β0 + β1 ∆Load t + β2 ∆RE t + β3 ∆Pgas, t+ β4 ∆ExIm t + β5…x dummies + єt (1)

19
where ∆ represents the first difference operator, subscript t stands for time (daily sequence), and
є is the standard error term. Additionally, the model includes several dummies to control for
typical time patterns in electricity markets: daily dummies capture the usual fluctuations during the
week (e.g. the differences between a working day and a weekend); monthly dummies capture
seasonal patterns and a third dummy variable is one in supra-regional bank holidays and zero
otherwise.
We use the day-ahead price for electricity (Phelix) at the Electricity Exchange in Leipzig (EEX),
where electricity for Germany and Austria is traded. The day-ahead price was chosen over the
intra-day price because it represents a larger share of trading volume. Obviously, explanatory
variables must be assembled to match the characteristics of the day-ahead electricity price.
Ideally, they are also day-ahead forecasts because the foreseen values of load and production
data are the basis for purchasing and selling decisions on the day-ahead market16. Consequently,
the data on renewable production forecasts consist of solar and wind production forecasts as
reported by several sources: EEX and the five grid operators (Tennet, EnBW Transnet, 50Hertz
and Amprion for Germany; and APG for Austria). Hence, the renewable production aggregate
includes German solar production (given the negligible Austrian solar capacity), and German and
Austrian wind production.
Several studies found system load/ demand variation to be highly relevant for price formation17,
which is included as a second explanatory variable in this analysis. We use the forecasted load in
the German-Austrian power system, that is, the sum of all deliveries from the transmission
system through directly connected transformers and lines to distribution networks and end
consumers. This load variable would typically include non-renewable large-scale production,
while significant parts of wind and solar production would never enter the transmission grid in the
first place. This variable therefore combines nicely with the renewable production variable (see
above) and minimizes any possible double-counting biases between the load and the solar-wind
variables. Data was assembled via the European Network of Transmission System Operators for
Electricity (ENTSOE) and APG.
16 Gomez-Quiles and Gil (2011) also follow this procedure with a similar line of reasoning. 17 Ostergaard et al. (2006); Sensfuss et al. (2008); Weigt et al. (2009); Jonsson et al. (2010); Gelabert et al. (2011); Woo et al. (2011).

20
Typically, the price of other energy goods is another valuable price indicator for electricity. Austria
and Germany have highly developed economies where energy markets are linked either through
substitution possibilities for consumers or through input factor influences (such as gas-fired power
plants). Thus, the price of natural gas was included as an explanatory variable to represent such
cross-influences18. The day-ahead gas price data originates from the two German gas transport
companies: Gaspool and NetConnect Germany.
Moreover, Germany and Austria both have several international electricity transmission nodes
with 10 of their 13 neighbors19 (without considering the nodes that directly connect Germany and
Austria). As international electricity trade can mitigate national demand and supply fluctuations,
transmission capacity must be taken into account when estimating price effects20. Therefore, all
electricity flows from/to the German-Austrian area to/from the ten neighboring countries with
transmission capacity were considered and a transmission aggregate data series was composed.
This electricity export and import data originates from the European Market Coupling Company
GmbH and the five electricity grid German and Austrian operators. Unfortunately, the international
electricity flow data was not available as forecasts21.
Due to data availability the period of investigation is from 1 July 2010 to 30 June 201222. Figure
A.1 in the Appendix plots the data used in the empirical analysis. The augmented Dickey-Fuller
(ADF) test was applied to test for unit roots and stationarity. Most of the series are I(1) so first
differences of the data series are taken for computing the model. The ADF test results are
represented in the Appendix, along with a correlation matrix. This indicates a negligible probability
of problems related to multicollinearity in the estimations23. Daily averages were taken in all cases
18 Alternatively the price of coal or lignite could also be included, but past research on Germany and Austria indicates that gas prices are more relevant for electricity prices (see Redl and Haas, 2007; Obersteiner and Redl, 2007; Sensfuss et al., 2008). 19 Denmark, Sweden, Poland, Czech Republic, Hungary, Slovenia, Italy, Switzerland, France, and the Netherlands. 20 Fürsch et al. (2012) argue that international transmission is relevant for merit-order effects, whereas Traber and Kemfert (2009) find that the German EEG did influence electricity prices in EU neighboring countries. 21 Forecasts regarding international electricity trade are only available for the capacity of transmission nodes. However, the variable of interest is not the available capacity of transmission nodes but the real flow. Therefore, the electricity flow data was used here even though it consists of realized values instead of day-ahead forecasts. 22 German law requires data on production of wind and solar plants to be published since July 2010. Prior reliable data is not available, thus limiting the data period to two years. 23 See for example Verbeek (2008, p. 43) who gives the rule of thumb that multicollinearity is very unlikely to be a problem if the correlations between the explanatory variables do not exceed 0.8 (or -0.8 respectively). The only value close to this boundary is between load and the electricity price, the latter being the dependent variable. Therefore, this value does not reflect possible multicollinearity issues among explanatory variables.

21
to eliminate unwanted ad-hoc anomalies and short-term noise24. This means that prices (gas and
electricity) are the daily averages of the day in question, whereas quantity data (renewable
production, load, and exports-imports) are the hourly average of the 24 hours for each day.
3.3. Results
The final model of Equation 1 is constructed in various steps. First we estimate a model with the
dummies as the only explanatory variables (Model 1), showing how much seasonal and weekday
patterns matter for electricity prices. The electricity quantity variable Load is added for the
estimation of Model 2. Model 3 is the complete regression with all the variables of Equation 1,
although results are presented for several variations (Models 3A to 3F) in a procedure that
provides further details on specific issues and also serves as a robustness test. The first variation
(Model 3A and 3B) is a distinction between the first year of the data period (1 July 2010 to 30
June 2011) and the second year (1 July 2011 to 30 June 2012) to observe possible differences
due to varying penetrations of renewable sources (Figures 1 and 2 indicate strong growth in
renewable production since 2010) and to possible long-run adjustment of the electricity sector to
earlier merit-order effects (see Sections 1 and 2). Moreover, the separation of the first and last
year roughly coincides with the German nuclear exit, where half of the German nuclear capacity
was switched off immediately and the so-called energy transition (Energiewende) was
announced. Therefore, this model also provides information on whether such changes in capacity
mix affected the price effects of renewable production.
A second model variation (Models 3C and 3D) implements a reduction of the dataset to the upper
quarter of high-load days and the lower quarter of low-load days. This is done to verify the
hypothesis that renewable production has a much higher impact on electricity prices when the
electricity system is closer to full capacity as observed by other papers (e.g. Ostergaard et al.,
2006; Jonsson et al., 2010; Gelabert et al., 2011). The third variation involves a separation of
solar and wind electricity sources through the use of separate coefficients that intend to identify
the different production patterns of these technologies. The last variation (Model 3F) estimates
24 Also, Neubarth et al. (2006) found that, when daily values are taken instead of 15 or 60-minute intervals, forecasts of renewable production (wind) are more relevant for the definition of day-ahead prices at EEX.

22
Equation 1 using weekly average instead of daily averages. The results for all model variations
are reported in Table 3.
Table 3. OLS estimation of daily changes in electricity prices
Model 1 Model 2 Model 3 Model 3A Model 3B Model 3C Model 3D Model 3E Model 3F
1st year 2nd year High load Low load RE split up Weekly
∆Pelec, t ∆Pelec, t ∆Pelec, t ∆Pelec, t ∆Pelec, t ∆Pelec, t ∆Pelec, t ∆Pelec, t ∆Pelec, t
∆Loadt
0.000727 0.000243 0.000514 0.000154 0.000345 0.000538 0.000242 0.00059
(0.000117) (0.0000836) (0.000164) (0.000084) (0.000148) (0.000193) (0.000084) (0.000172)
∆REt
-0.00103 -0.000963 -0.001036 -0.00109 -0.00093
-0.000853
(0.000081) (0.000133) (0.000112) (0.000127) (0.000227)
(0.00012)
∆Windt
-0.00103
(0.000082)
∆Solt
-0.00126
(0.000243)
∆ExImt
-0.00006 0.000514 0.000289 0.000198 -0.000126 -0.000543 0.00046
(0.000318) (0.00052) (0.000445) (0.000763) (0.00062) (0.000318) (0.00025)
∆Pgas, t
0.953 0.434 1.03 1.549 -0.26 0.954 1.748
(0.372) (0.453) (0.42) (0.62) (0.0006) (0.376) (0.189)
Daily dummies yes yes yes yes yes yes yes yes no
Monthly dummies yes yes yes yes yes yes yes yes yes
Holiday dummy yes yes yes yes yes yes yes yes no
Observations 731 731 731 365 366 183 183 731 104
Adjusted R² 0.51 0.591 0.72 0.726 0.737 0.746 0.54 0.72 0.721
D-W
2.429
2.582
2.557 2.557 2.586 2.082 2.444 2.564 2.483
Notes: All models include an intercept. Bold print indicates a coefficient significantly different from zero (p<0.05). The adjusted R-squared assumes acceptable values throughout Model 3. D-W critical values for all versions of Models 3 (except 3F) are respectively: DL 1.51 to 1.72; DU 2.28 to 2.49. As a consequence, standard errors (in parenthesis below the coefficients) are robust to heteroskedasticity and serial correlation (Newey and West, 1987). Source: The authors
In line with the theory of the merit-order effect and previous research (see Sections 1 and 2), the
coefficient of the renewable production variable is always negative and significant25. Ceteris
paribus, day-ahead electricity prices for Germany and Austria decrease by roughly 1 €/MWh for
each additional expected GW produced by renewable sources (solar and wind). The price effect
of renewable production is stable at around -1 €/MWh throughout all versions of model 3: for high
or low load days, for the first year or the last year of the analyzed period, and for individual or
25 Actually, the p-value of the RE variable in model 3 is lowest of all four explanatory variables at 0.000.

23
conjoint representation of solar and wind technologies. This price decreasing effect of renewables
is also within the range of earlier (mostly simulation) studies of Germany, which range
approximately in between -0.5 and -2.5 €/MWh. The merit-order effect found in our analysis
roughly corresponds to an electricity price decrease of 2%, since the average price was about 48
€/MWh for the period under study.
The different variations of Model 3 reveal other valuable information. When comparing the first
and last years in 3A and 3B, the extent of the influence of the renewable production variable is
quite similar in both periods, with a very low statistical probability of the renewable coefficients
being different in the two periods which contrasts with the findings of other applications (see
Table 2). This result is also interesting in light of the nuclear exit in mid 2011, when seven
German nuclear plants were switched off after the Fukushima event, as the data reveal no
immediate effect of that change in the electricity mix on the size of the merit-order effect. Other
variables provide further information on this matter: while the load appears to be decisive for
prices (as expected with a positive coefficient) during the first year, in the last year the gas price
assumes more informative value for electricity prices with a shift in the significance of coefficients.
Hence, the fact that fossil capacities had to substitute the deactivated nuclear capacity is
reflected in the significance of gas prices, even though it did not translate into a change in the
size of the merit-order effect. Yet another parallel development does not show in the results of
Model 3A and 3B: German electricity imports also rose as a consequence of the nuclear exit, but
the coefficient of the export/import variable remains insignificant26. Future research in this area
may find different results for the changes over time when new data becomes available.
More interesting results arise from the comparison of high and low-load days (Model 3C and 3D).
The effect of renewable production on the electricity price appears to be more pronounced for
high-load days. This result is in line with previous evidence (e.g. Ostergaard et al., 2009; Senfuss
et al., 2008, Weigt et al., 2009; Woo et al., 2011), although it is not very robust in our case
because standard deviations do not allow for the conclusion that the coefficient of renewable
production of high and low-load days is different. One possible explanation for this phenomenon
could be a relatively constant slope in the German electricity supply curve in the high-quantity
26 The increased electricity imports (particularly from the Czech Republic, France and Nordpool) are depicted in Figure A.1 in the Appendix, with the export/import aggregate falling in April 2011 and slowly recovering until the end of 2011. The coefficient of this aggregate comes closest to significance for model 3B (also in the expected way, with a negative sign).

24
area. Another reason for this divergence may be found in the other explanatory variables: the gas
price is only significant for high-load days because of additional requirements for fossil fuels so
that peak-load plants can cope with the unusually high demand. At the same time, this shift in
significances of the gas price variable already captures differences between high and low-load
days, which then do not materialize in the coefficients of renewable production anymore. As a
matter of fact, the coefficients of the renewable production variable for low and high-load days
show bigger differences when the gas price variable is omitted in Model 3C and 3D27.
Model 3E yields no significant differences between the coefficients for solar and wind production
and therefore the price effects associated to the wind or solar source of renewable production
seem to be very similar28. It is also worthwhile to note that the other coefficients of the remaining
explanatory variables in model 3E are almost identical to those in the base model, which did not
distinguish between solar and wind production. Finally, the results of Model 3F indicate that the
importance and magnitude of renewable production remain unchanged when the frequency of the
data is altered. The renewable coefficient is somewhat smaller, which is no big surprise because
valuable information may be lost when expanding the intervals to weekly observations.
In sum, the estimation results are quite robust across models. Significant coefficients always have
the same sign and the effects of renewable production on prices are also consistent: the day-
ahead electricity price for the German-Austrian market falls by around 1 €/MWh for each
additional GWh of expected renewable electricity production. Our findings are quite compatible
with earlier research on merit-order effects for Germany, which reported results in the 0.5-2.3
€/MWh interval (see Section 2). Given that the only existing empirical study for Germany, by
Neubarth et al. (2006), is somewhat outdated and applies a univariate approach that does not
contemplate the effects of capacity use, exports and imports or gas prices, we feel that this paper
contributes to and complements the existing literature on the matter29.
27 The coefficients are -0.001018 (high load) and -0.000834 (low load) and show the largest discrepancy throughout all model variations. Apparently the gas price and load variables overlap to some extent, although they do so without causing problematic multicollinearity (see the Appendix). 28 Note that the effects could be quite different with a higher data frequency (i.e., distinguishing between different times of the day). In this case, the effect of solar production is potentially higher because its production pattern coincides with demand peaks. Yet, such intra-day specialties cannot be captured or represented in a study based on daily averages. 29 See e.g. Green and Vasilakos (2010) and Twomey and Neuhoff (2010).

25
Yet we would like to emphasize, once again, that the results of this and other studies on the
electricity price effects of renewables should be interpreted carefully. Some factors, such as the
market structure of the power sector, were not considered in this exercise and may be potentially
relevant30. Adding more detailed data about the remaining (non-renewable) mix in electricity
generation may also affect the reported estimations. Finally, data availability is problematic
(especially for renewable production data prior to July 2010) and thus severely constrains the
period of analysis. Future research using data beyond 2012 could overcome this problem and
provide valuable information on the temporal evolution of the effect of renewable production on
German and Austrian electricity prices.
4. Conclusions
Supporting renewables to achieve a less polluting and (foreign) dependent energy sector has
many consequences. Among them, an increased renewable production of electricity crowds out
other high(er) marginal-cost technologies and results in lower electricity prices. Quantifying this
theoretical merit-order effect is not simple, however, and multiple analytical techniques have been
used for this purpose. Applied research in this area has mainly been carried out through
simulation and empirical approximations that have generally reported seemingly large
discrepancies regarding the size of this effect.
This paper starts by providing a comprehensive review of the increasing literature in this area, so
that common patterns and trends can be identified. In this sense, when results are converted into
homogeneous units (€/MWh per each additional GWh of renewable production), the smallest
merit-order effects are found in large European markets (Nordpool -0.03; Germany -0.24 to -2.83;
Spain -1.1 to -3.99), in contrast to much higher price effects in small markets (Netherlands -6.17;
Denmark -1.33 to -9.87; Ireland -9.9). This is not surprising, as 1 GWh of additional production is
a larger share of small electricity markets. When accounting for differences in market size, our
comparison of existing European studies shows an interesting and novel pattern as merit-order
effects are now quite similar. This is the case for those electricity systems with sizeable fossil
capacities (Germany, Spain, Holland, Ireland, and Denmark), where fossil plants are still the
30 Moreover, our study for Germany considers the virtually complete integration with Austria, including Austrian data for all explanatory variables. Given that the electricity exchange in Leipzig treats Germany and Austria as one market with one electricity price, Austrian production data should not be ignored.

26
price-setting marginal plant, at least during demand peaks. Even the Nordpool market with its
high reservoir hydro capacities shows price effects similar to markets of comparable sizes as
Germany or Spain. The differences and/or similarities of merit order effects through different
countries leave room for future more detailed research, for example about the pattern of peak
hours in markets, or fuel import costs.
The second part of the paper presents new results on the price effects of renewable production in
the German-Austrian market. A major reason for this exercise is the limited empirical research on
this matter, which is clearly anomalous for an area with the biggest electricity market in Europe
and with high renewable shares and intense renewable support schemes. One of the major
findings of this research is that the day-ahead electricity price fell by roughly 1 €/MWh (around
2% of the electricity price) for each GWh of average hourly predicted renewable electricity
generation between July 2010 and June 2012. The effect was found to be stable throughout
different model variations, and the reported figure is in line with previous research results with
simulation approximations.
Other interesting conclusions arise from our German-Austrian empirical exercise. First, the
changed electricity mix brought about by the German nuclear exit did not affect the size of the
merit-order effect, which remained stable at 1 €/MWh before and after the deactivation of seven
nuclear plants by mid-2011. Second, the price effect of wind and solar was more or less equal,
which is rather counterintuitive because solar is expected to have a higher impact for its
coinciding production with demand peaks. This may be due to the chosen frequency of the
analysis, which does not reflect alternating production patterns within a day. Another relevant
result refers to the weak evidence on stronger merit-order effects at times of high electricity
demand. This may, however, be due to the fact that fossil fuel use in peak-load plants (which is
another indicator of the relevance of demand peaks) does affect electricity prices.
27
Acknowledgements
We are grateful to comments and suggestions by Liliana Gelabert, Gunnar Eskeland, Andreas
Löschel, Alicia Pérez, Stefan Thoenes and participants in the Fifth Atlantic Workshop in Energy
and Environmental Economics. Research support by Lúa Fernández and Pablo Pintos is also
appreciated. The authors acknowledge support from Alcoa Foundation Advancing Sustainability
Research Initiative. Xavier Labandeira and Pedro Linares are also thankful to the Spanish
Ministry of Economy and Competitiveness research project ECO2009-14586-C2-01. Any
remaining errors or omissions are the responsibility of the authoring team alone.

28
References
Bach, P.F., 2009. Wind power and spot prices: German and Danish Experience 2006-2008.
Renewable Energy Foundation, London.
Baldick, R., 2011. Wind energy markets: a case study of Texas, USAEE Dialogue, 18 (2).
Bode, S., Groscurth, H.M., 2006. Zur wirkung des EEG auf 'den strompreis'. HWWA Discussion
Paper, 348.
CEEEP, 2004. Economic impact analysis of a 20% New Jersey renewable portfolio standard.
Center for Energy, Economic and Environmental Policy. State University of New Jersey.
Cutler, N.J., Boerema, N.D., MacGill, I.F., Outhred, H.G., 2011. High penetration wind generation
impacts on spot prices in the Australian national electricity market. Energy Policy, 39, 5939-5949.
Diekmann, J., Kemfert, C., Neuhoff, K., 2012. The proposed adjustment of Germany‟s renewable
law. A critical assessment. German Institute for Economic Research (DIW). Economic Bulletin, 6.
Dickey, D.A., Fuller, W.A., 1979. Distributions of the estimators for autoregressive time series
with a unit root. Journal of the American Statistical Association, 74, 427-431.
Fürsch, M., Malischek, R., Lindenberger, D., 2012. Der merit-order-effekt der erneuerbaren
Energien. Analyse der kurzen und langen frist. Working paper, 12/14. Institute of Energy
Economics, University of Cologne.
Gelabert, L., Labandeira, X., Linares, P., 2011. An ex-post analysis of the effect of renewables
and cogeneration on Spanish electricity prices. Energy Economics, 33, S59-S65.
Gil, H.A., Gomez-Quiles, C., Riquelme, J., 2012. Large-scale wind power integration and
wholesale electricity trading benefits: estimation via an ex post approach. Energy Policy, 41, 849-
859.
Gomez-Quiles, C., Gil, H.A., 2011. Inference of electricity price depletion by wind power in Spain.
Proceedings of the IEEE Power & Energy General Meeting. Detroit, USA.
Green, R., Vasilakos, N., 2010. Market behaviour with large amounts of intermittent generation.
Energy Policy, 38, 3211-3220.
Green, R., Vasilakos, N., 2011. The long-term impact of wind power on electricity prices and
generating capacity. Department of Economics Discussion Paper 11-09. University of
Birmingham.
Hindsberger, M., Hein Nybroe, M., Ravn, H.F., Schmidt, R., 2003. Co-existence of electricity,
TEP, and TGC markets in the Baltic Sea Region. Energy Policy, 31, 85-96.
Hirth, L., 2012. The market value of variable renewables. Working paper, 15-2012. Fondazione
Eni Enrico Mattei

29
Holttinen, H., Vogstad, K.O., Botterud, A., Hirvonen, R., 2001. Effects of large scale wind
production on the Nordic electricity market. Proceedings of the European Wind Energy
Conference. Copenhagen, Denmark.
Hu, W., Chen, Z., Bak-Jensen, B., 2010. The relationship between electricity price and wind
power generation in Danish electricity markets. Proceedings of the Asia–Pacific Power and
Energy Engineering Conference. Chengdu, China.
IEA, 2012. World Energy Outlook. International Energy Agency, Paris.
IPCC, 2011. Renewable Energy Sources and Climate Change Mitigation. Special Report of the
Intergovernmental Panel on Climate Change, Geneva.
Jensen, S.G., Skytte, K., 2002. Interactions between the power and green certificates markets.
Energy Policy, 30, 425-435.
Jonsson, T., Pinson, P., Madsen, H., 2010. On the market impacts of wind energy forecasts.
Energy Economics, 32, 313-320.
Linares, P., Labandeira, X., 2013. Renewable electricity support in Spain: A natural policy
experiment. Working paper, 4/2013. Economics for Energy.
Linares, P., Santos, F. J., Ventosa, M., 2008. Coordination of carbon reduction and renewable
support policies. Climate Policy, 8, 377-394.
Lise, W., Linderhof, V., Kuik, O., Kemfert, C., Oestling, R., Heinzow, T., 2006. A game theoretic
model of the Northwestern European electricity market power and the environment. Energy
Policy, 34, 2123-2136.
MacCormack, J., Hollis, A., Zareipour, H., Rosehart, W., 2010. The large-scale integration of wind
generation: impacts on price, reliability and dispatchable conventional suppliers. Energy Policy
38, 3837-3846.
MacGill, I., 2010. Electricity market design for facilitating the integration of wind energy:
Experience and prospects with the Australian National Electricity Market. Energy Policy, 38,
3180-3191.
Milstein, I., Tishler, A., 2011. Intermittently renewable energy, optimal capacity mix and prices in a
deregulated electricity market. Energy Policy, 39, 3922-3927.
Munksgaard, J., Morthorst, P.E., 2008. Wind power in the Danish liberalized power market: Policy
measures, price impacts and investor incentives. Energy Policy, 36, 3940-3947.
Neubarth, J., Woll, O., Weber, C., Gerecht, M., 2006. Beeinflussung der spotmarktpreise durch
windstromerzeugung. Energiewirtschaftliche Tagesfragen 56, 42-45.
Newey, W.K., West, K.D., 1987. A simple, positive semi-definite heteroskedasticity and
autocorrelation consistent covariance matrix. Econometrica, 55, 703-708.

30
Nicholson, E., Rogers, J., Porter, K., 2010. The relationship between wind generation and
balancing-energy market prices in ERCOT: 2007-2009. National Renewable Energy Laboratory,
Golden, U.S.
Nieuwenhout, F., Brand, A., 2011. The impact of wind power on day-ahead electricity prices in
the Netherlands. Presented at the 8th International Conference on the European Energy Market.
Zagreb, Croatia.
Nicolosi, M., Fürsch, M., 2009. The impact of an increasing share of RES-E on the conventional
power market. The example of Germany. Zeitschrift für Energiewirtschaft, 33, 246-254.
Obersteiner, C., Redl, C., 2007. Electricity spot markets and renewables: A feedback analysis.
2nd Conference on Energy Economics and Technology. Dresden, Germany.
O‟Mahoney, A., Denny, E., 2011. The merit order effect of wind generation in the Irish electricity
market. Proceedings of the 30th USAEE/IAEEE North American Conference. Washington D.C.,
U.S.
Ostergaard, P., Morthorst, P.E., Moesgaard, R., Enevoldsen, S., 2006. Vindkraftensbetydning for
elprisen i Danmark. IBT Wind. Herning, Denmark.
Palmer, K., Burtraw, D., 2005. Cost-effectiveness of renewable electricity policies. Energy
Economics, 27, 873-894.
Pöyry, 2010. Wind energy and electricity prices: Exploring the „merit order effect‟. Pöyry
Consulting, Helsinki.
Rathmann, M., 2005. Do support systems for RES-E reduce EU-ETS-driven electricity prices?
Energy Policy, 35, 342-349.
Redl, C., Haas, R., 2007. Preisbildung auf stromterminmärkten: Eine ökonomische analyse.
Internationale Energiewirtschaftstagung an der TU Wien. Vienna, Austria.
Sáenz de Miera, G., del Río, P., Vizcaíno, I., 2008. Analyzing the impact of renewable electricity
support schemes on power prices: The case of wind electricity in Spain. Energy Policy, 36, 3345-
3359.
Schmalensee, 2012. Evaluating policies to increase the generation of electricity from renewable
energy. Review of Environmental Economics and Policy, 6, 45-64.
Sensfuss, F., Ragwitz, M., Genoese, M., 2008. The merit-order effect: A detailed analysis of the
price effect of renewable electricity generation on spot market prices in Germany. Energy Policy
36, 3086-3094.
Sensfuss, F., 2011. Analysen zum merit-order effekt erneuerbarer energien: Update für das jahr
2010, Frauenhofer ISI. Karlsruhe, Germany.
Traber, T., Kemfert, C., 2009. Impacts of the German support for renewable energy on electricity
prices, emissions, and firms. Energy Journal, 30, 155-178.

31
Traber, T., Kemfert, C., 2011. Gone with the wind? Electricity market prices and incentives to
invest in thermal power plants under increasing wind energy supply. Energy Economics, 33, 249-
256.
Traber, T., Kemfert, C., Diekmann, J., 2011. German electricity prices: Only modest increase due
to renewable energy expected. Weekly Report No. 6/2011. German Institute for Economic
Research (DIW). Berlin, Germany.
Twomey, P., Neuhoff, K., 2010. Wind power and market power in competitive markets. Energy
Policy, 38, 3198-3210.
Unger, T., Ahlgren, E.O., 2005. Impacts of a common green certificate market on electricity and
CO2 emission markets in the Nordic countries. Energy Policy, 33, 2152-2163.
Verbeek, M., 2008. A Guide to Modern Econometrics. Wiley. Chichester, England.
Weigt, H., 2009. Germany‟s wind energy: The potential for fossil capacity replacement and cost
saving. Applied Energy, 86, 1857-1863.
Weber, C., Woll, O., 2007. Merit-order-effekte von erneuerbaren energien: Zu schön um wahr zu
sein? EWL Working paper, 01/07. University of Duisburg-Essen.
Woo C.K., Horowitz, I., Moore, J., Pacheco, A., 2011. The impact of wind generation on the
electricity spot-market price level and variance: The Texas experience. Energy Policy, 39, 3939-
3944.
Zarnikau, J., 2011. Successful renewable energy development in a competitive electricity market:
A Texas case study. Energy Policy, 39, 3906-3913.

32
APPENDIX
Table A.1. Costs of the German EEG renewable support
2004
2005
2006
2007
2008
2009
2010
Total EEG generation (GWh) 24,969 28,417 38,511 43,967 51,545 67,010 73,348
Total cost of EEG (€ Mio) 3,611 4,498 5,810 7,879 9,016 10,774 13,181
By generation type
% of EEG Generation 12 11.3 9.6 8.3 7 6.5 6.26
Hydro Costs (€ Mio) 337.67 364.10 366.56 417.70 378.81 382.38 421.05
Costs (c€/kWh) 7.307 7.329 7.408 7.510 7.378 7.838 8.335
Gas (Waste, % of EEG Generation 6.7 7.1 5.4 4.1 3.1 2.7 1.44
Mining, Sewage) Costs (€ Mio) 182.17 219.24 195.62 192.88 155.87 142.64 83.26
Costs (c€/kWh) 7.060 7.023 7.028 7.020 6.855 7.039 7.165
% of EEG Generation 13.6 16.8 21.1 23.8 26.6 30.6 31.16
Biomass Costs (€ Mio) 508.46 795.19 1,337.37 2,162.13 2,698.74 3,699.99 4,240.43
Costs (c€/kWh) 9.708 10.766 12.297 13.557 13.832 16.110 16.863
% of EEG Generation 0 0 0 0 0 0 0,03
Geothermal Costs (€ Mio) 0.03 0.03 0.05 0.06 2.64 3.73 5.60
Costs (c€/kWh) n.a. n.a. n.a. n.a. n.a. n.a. n.a.
% of EEG Generation 66.3 61.9 59.6 59.3 57 51.4 46.42
Wind Onshore Costs (€ Mio) 2,300.48 2,440.68 2,733.77 3,508.44 3,561.04 3,388.90 3,315.12
Costs (c€/kWh) 9.010 8.968 8.899 8.829 8.518 8.785 8.850
% of EEG Generation n.a. n.a. n.a. n.a. n.a. n.a. 0.22
Wind Offshore Costs (€ Mio) n.a. n.a. n.a. n.a. n.a. n.a. 26.06
Costs (c€/kWh) n.a. n.a. n.a. n.a. n.a. n.a. 14.679
% of EEG Generation 1.4 2.9 4.3 4.6 6.2 8.8 14.48
Solar Costs (€ Mio) 282.65 679.11 1,176.8 1,597.48 2,218.62 3,156.52 5,089.94
Costs (c€/kWh)
52.424
53.262
53.094
51.825
48.787
47.792
43.559
Notes: The German EEG sets tariffs through a complex system depending on energy type and specific plant characteristics (size, year of construction etc), which are also adjusted frequently. Rates of c€/kWh are the averages within each category. Geothermal tariffs have been between 14.5 and 24 c/kWh since 2009. Source: German Grid Operators (Informations plattform der Deutschen Übertragungsnetzbetreiber, EEG KWK-G).
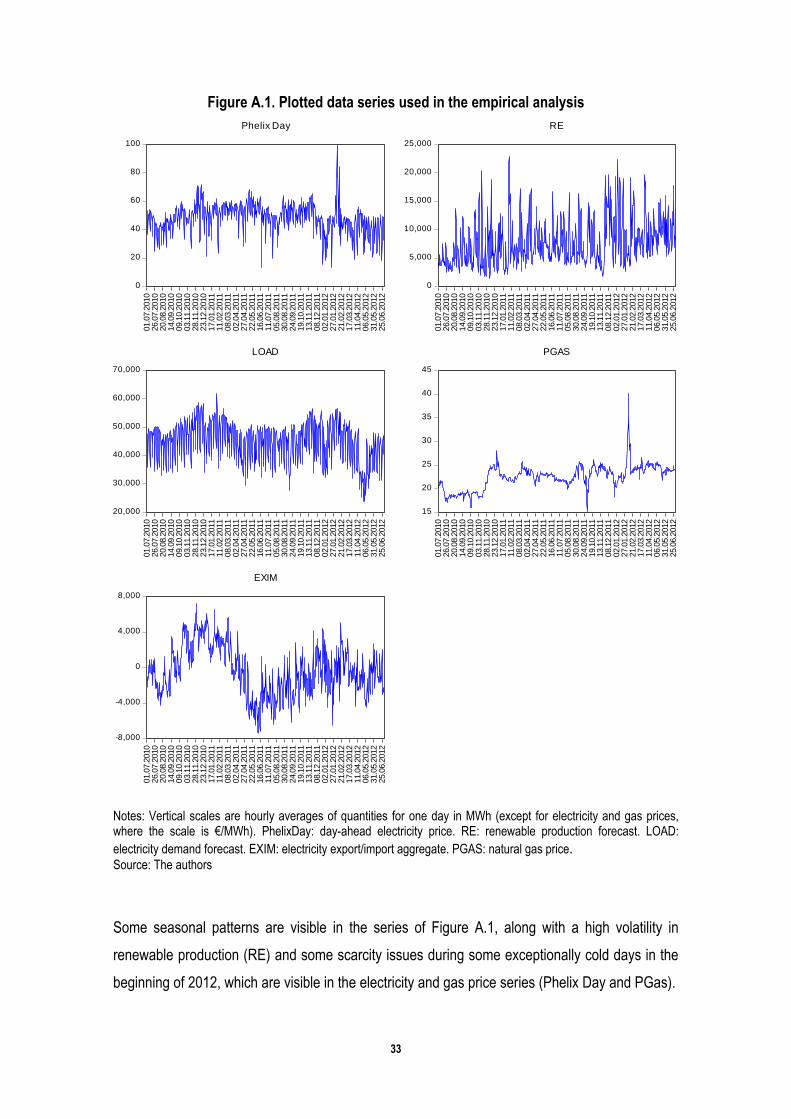
33
Figure A.1. Plotted data series used in the empirical analysis
0
20
40
60
80
10001.0
7.2
010
26.0
7.2
010
20.0
8.2
010
14.0
9.2
010
09.1
0.2
010
03.1
1.2
010
28.1
1.2
010
23.1
2.2
010
17.0
1.2
011
11.0
2.2
011
08.0
3.2
011
02.0
4.2
011
27.0
4.2
011
22.0
5.2
011
16.0
6.2
011
11.0
7.2
011
05.0
8.2
011
30.0
8.2
011
24.0
9.2
011
19.1
0.2
011
13.1
1.2
011
08.1
2.2
011
02.0
1.2
012
27.0
1.2
012
21.0
2.2
012
17.0
3.2
012
11.0
4.2
012
06.0
5.2
012
31.0
5.2
012
25.0
6.2
012
Phelix Day
0
5,000
10,000
15,000
20,000
25,000
01.0
7.2
010
26.0
7.2
010
20.0
8.2
010
14.0
9.2
010
09.1
0.2
010
03.1
1.2
010
28.1
1.2
010
23.1
2.2
010
17.0
1.2
011
11.0
2.2
011
08.0
3.2
011
02.0
4.2
011
27.0
4.2
011
22.0
5.2
011
16.0
6.2
011
11.0
7.2
011
05.0
8.2
011
30.0
8.2
011
24.0
9.2
011
19.1
0.2
011
13.1
1.2
011
08.1
2.2
011
02.0
1.2
012
27.0
1.2
012
21.0
2.2
012
17.0
3.2
012
11.0
4.2
012
06.0
5.2
012
31.0
5.2
012
25.0
6.2
012
RE
20,000
30,000
40,000
50,000
60,000
70,000
01.0
7.2
010
26.0
7.2
010
20.0
8.2
010
14.0
9.2
010
09.1
0.2
010
03.1
1.2
010
28.1
1.2
010
23.1
2.2
010
17.0
1.2
011
11.0
2.2
011
08.0
3.2
011
02.0
4.2
011
27.0
4.2
011
22.0
5.2
011
16.0
6.2
011
11.0
7.2
011
05.0
8.2
011
30.0
8.2
011
24.0
9.2
011
19.1
0.2
011
13.1
1.2
011
08.1
2.2
011
02.0
1.2
012
27.0
1.2
012
21.0
2.2
012
17.0
3.2
012
11.0
4.2
012
06.0
5.2
012
31.0
5.2
012
25.0
6.2
012
LOAD
15
20
25
30
35
40
45
01.0
7.2
010
26.0
7.2
010
20.0
8.2
010
14.0
9.2
010
09.1
0.2
010
03.1
1.2
010
28.1
1.2
010
23.1
2.2
010
17.0
1.2
011
11.0
2.2
011
08.0
3.2
011
02.0
4.2
011
27.0
4.2
011
22.0
5.2
011
16.0
6.2
011
11.0
7.2
011
05.0
8.2
011
30.0
8.2
011
24.0
9.2
011
19.1
0.2
011
13.1
1.2
011
08.1
2.2
011
02.0
1.2
012
27.0
1.2
012
21.0
2.2
012
17.0
3.2
012
11.0
4.2
012
06.0
5.2
012
31.0
5.2
012
25.0
6.2
012
PGAS
-8,000
-4,000
0
4,000
8,000
01.0
7.2
010
26.0
7.2
010
20.0
8.2
010
14.0
9.2
010
09.1
0.2
010
03.1
1.2
010
28.1
1.2
010
23.1
2.2
010
17.0
1.2
011
11.0
2.2
011
08.0
3.2
011
02.0
4.2
011
27.0
4.2
011
22.0
5.2
011
16.0
6.2
011
11.0
7.2
011
05.0
8.2
011
30.0
8.2
011
24.0
9.2
011
19.1
0.2
011
13.1
1.2
011
08.1
2.2
011
02.0
1.2
012
27.0
1.2
012
21.0
2.2
012
17.0
3.2
012
11.0
4.2
012
06.0
5.2
012
31.0
5.2
012
25.0
6.2
012
EXIM
Notes: Vertical scales are hourly averages of quantities for one day in MWh (except for electricity and gas prices, where the scale is €/MWh). PhelixDay: day-ahead electricity price. RE: renewable production forecast. LOAD:
electricity demand forecast. EXIM: electricity export/import aggregate. PGAS: natural gas price. Source: The authors
Some seasonal patterns are visible in the series of Figure A.1, along with a high volatility in
renewable production (RE) and some scarcity issues during some exceptionally cold days in the
beginning of 2012, which are visible in the electricity and gas price series (Phelix Day and PGas).

34
As typical for time series data, there are non-stationary patterns in the datasets. We tested for
unit roots in the data by use of the augmented Dickey-Fuller test (Dickey and Fuller, 1979).
Several versions of the test have been run with altering conditions for included lags and the
inclusion of a trend. They indicate that some series are I(1).Hence, first differences of the data
series are taken for the model calculus. The ADF test results are depicted in Table A.2.
Table A.2. Augmented Dickey Fuller test statistics (probabilities)
Levels 1st differences
Phelix Day-ahead Electricity Price (Pelec) 0.0982 0.000
Renewable Production Forecast (RE) 0.0000 0.000
Load forecast (Load) 0.1057 0.000
Export Import Aggregate (ExIm) 0.3298 0.000
Natural Gas Price (Pgas) 0.0001 0.000
Note: ADF test results (p-values), where lag length is determined by the Akaike Info Criterion and a trend variable is included. Source: The authors
Table A.3 reports the correlation matrix for the daily changes (first differences) of the data series.
The matrix shows no perfect (or excessive) collinearities, indicating that the risk of
multicollinearity in the estimations is low31.
Table A.3. Correlations of daily changes
EXIM LOAD PGAS PHELIX_DAY RE
EXIM 1
LOAD -0.3760 1
PGAS -0.0230 0.1812 1
PHELIX_DAY -0.4720 0.7481 0.2175 1
RE 0.6020 -0.2669 -0.0093 -0.4450 1 Note: The correlations reported correspond to the variables in first differences.
Source: The authors
31 See for example Verbeek (2008, p. 43) who gives the rule of thumb that multicollinearity is very unlikely to be a problem if the correlations between the explanatory variables do not exceed 0.8 (or -0.8 respectively). The only value close to this boundary is between load and the electricity price, the latter being the dependent variable.