replication immunoglobulin heavy-chain evidence part a single replicon
TRANSCRIPT

MOLECULAR AND CELLULAR BIOLOGY, Jan. 1987, p. 450-457 Vol. 7, No. 10270-7306/87/010450-08$02.00/0Copyright © 1987, American Society for Microbiology
Rate of Replication of the Murine Immunoglobulin Heavy-ChainLocus: Evidence that the Region Is Part of a Single Replicon
E. H. BROWN,' M. A. IQBAL,' S. STUART,' K. S. HATTON,' J. VALINSKY,2 AND C. L. SCHILDKRAUTl*Department of Cell Biology, Albert Einstein College of Medicine, Bronx, New York 10461,1 and New York Blood Center,
New York, New York 100212
Received 20 June 1986/Accepted 7 October 1986
We measured the temporal order of replication of EcoRI segments from the murine immunoglobulinheavy-chain constant region (IgCH) gene cluster, including the joining (J) and diversity (D) loci andencompassing approximately 300 kilobases. The relative concentrations of EcoRI segments in bromouracil-labeled DNA that replicated during selected intervals of the S phase in Friend virus-transformed murineerthroleukemia (MEL) cells were measured. From these results, we calculated the nuclear DNA content (Cvalue; the haploid DNA content of a cell in the Gl phase of the cell cycle) at the time each segment replicatedduring the S phase. We observed that IgCH genes replicate in the following order: a, £, y2a, 2b, yl, y3, B,and ,u, followed by the J and D segments. The C value at which each segment replicates increased as a linearfunction of its distance from Ca. The average rate ofDNA replication in the IgCH gene cluster was determinedfrom these data to be 1.7 to 1.9 kilobases/min, similar to the rate measured for mammalian replicons byautoradiography and electron microscopy (for a review, see H. J. Edenberg and J. A. Huberman, Annu. Rev.Genet. 9:245-284, 1975, and R. G. Martin, Adv. Cancer Res. 34:1-55, 1981). Similar results were obtainedwith other murine non-B cell lines, including a fibroblast cell line (L60T) and a hepatoma cell line (Hepa 1.6).In contrast, we observed that IgCH segments in a B-cell plasmacytoma (MPC11) and two Abelson murineleukemia virus-transformed pre-B cell lines (22D6 and 300-19P) replicated as early as (300-19P) or earlier than(MPC11 and 22D6) Ca in MEL cells. Unlike MEL cells, however, all of the IgCH segments in a given B cell linereplicated at very similar times during the S phase, so that a temporal directionality in the replication of theIgCH gene cluster was not apparent from these data. These results provide evidence that in murine non-B cellsthe IgCH, J, and D loci are part of a single replicon.
Because of the complexity of the mammalian genome,advances in our knowledge of the mechanisms involved inthe initiation and organization of DNA replication haveproceeded slowly. Electron microscopic and autoradio-graphic results have indicated that chromosomal DNA isorganized into numerous replication units (replicons) thatrange in size from 50 to 330 kilobases (kb) and appear toinitiate in synchronous clusters. Replication usually pro-ceeds bidirectionally from origins spaced 45 to 180 kb apart.The rate of replication fork movement has been estimatedfrom many studies to be within the range of 1.5 to 3 kb/min(for a review, see references 8 and 20). However, the aboveobservations provide little information concerning the repli-cation of specific loci. It is not clear whether the techniquesused select for replicons of a certain size class or to whatextent they select for single-copy or repeated sequences.
Considerable uncertainty also exists about the nature ofmammalian origins of replication. DNA segments have beenisolated from human and mouse genomes which can functionin a manner similar to that of presumptive yeast origins(autonomously replicating sequences) in supporting theextrachromosomal replication of plasmids in yeast cells (21,28). However, it has yet to be established that these auton-omously replicating sequences function as replication originsin the context of the mammalian chromosome. In synchro-nized African green monkey cells, Kaufmann et al. (14)isolated and cloned nascent DNA synthesized at the veryonset of the S phase to obtain origin-enriched sequences.Many of the clones carrying origin-enriched sequences con-tained middle or highly repetitive DNAs (42), and one clone
* Corresponding author.
contained mitochondrial origin sequences. Two indepen-dently isolated clones contained the same middle repetitivesequences. Thus, as expected of replication origins, theseclones represent specific sets of sequences rather than arandom sampling of genomic DNA.
Studies by Heintz et al. (12) on methotrexate-resistantChinese hamster ovary cells suggested that a 135-kb ampli-fied region (amplicon) containing the dihydrofolate reductasegene may in fact be a replicon. Furthermore, the initiation ofDNA synthesis in each amplicon was shown to be confinedto a small subset of restriction segments during the first 40min of the S phase. These studies suggested that the earlyreplicating fragments contain or flank origins of replication.While specific origins appear to exist in the genome, the
available evidence suggests that only a fraction of them areactive in a single cell type (36). For example, more originsare active in early Drosophila melanogaster embryonic cellsthan at later stages in development (3). The arrest of cells inthe S phase with fluorodeoxyuridine results in the initiationofDNA synthesis from additional sites after release from theblock, suggesting the existence of potential origins that arenot normally active (37). These authors (37) found that suchpotential origins are spaced about 12 kb apart. In a particularcell type, only a fraction of these origins may be used.The transcriptional activity of DNA also appears to influ-
ence the activation of origins. For example, some genesreplicate early in the S phase in cell types in which they areexpressed and at later times in cell types in which they arenot expressed (6, 9, 10; Hatton et al., manuscript in prepa-ration). It has also been suggested that the initiation ofreplication from an upstream origin is required for transcrip-tional activation of a gene (31, 34). A recent study (13)
450
Dow
nloa
ded
from
http
s://j
ourn
als.
asm
.org
/jour
nal/m
cb o
n 19
Oct
ober
202
1 by
118
.37.
7.19
7.

RATE OF REPLICATION OF IgCH 451
suggested, however, that replication from an origin locatedupstream of a gene may be a necessary but not sufficientcondition for its expression. The mechanisms by whichspecific origins are activated are unclear and may relate tosuch factors as the physical state of chromatin.
In an effort to characterize a replicon and to identifypotential replication origins, we measured the temporalorder of replication of the murine immunoglobin heavy-chainconstant region (IgCH) genes in a number of cell lines. Thisregion has been completely mapped (16, 32, 39), and sincethe IgCH, joining (J), and diversity (D) segments encompass
approximately 300 kb (see Fig. 1), it is large enough toinclude several average-sized replicons (8, 20). In an earlierstudy of three IgCH genes in Friend virus-transformedmurine erythroleukemia (MEL) cells fractionated by centrif-ugal elutriation, we observed that the temporal order ofreplication of Ca, -y2b, and ,i corresponded to their linearorder on the chromosome (4). Ca sequences replicatedearliest in the S phase, followed in order by -y2b and ,u. Weexpanded that study to examine the replication times ofadditional EcoRI segments in the IgCH gene cluster. Thesesegments include sequences in the vicinity of the IgCH genes
a, r, y2a, -y2b, yl, -y3, 8, and ,u, as well as the J and D loci.The resolution of the study with MEL cells was also in-creased by dividing the S phase into eight intervals ratherthan four as in the previous study and decreasing the lengthof incubation in the presence of bromodeoxyuridine (BUdR)from 2.5 to 1.5 h. We also examined the temporal order ofreplication of the IgCH segments in several other murinenon-B cell and B cell lines. The IgCH, J, and D segmentsreplicated progressively later as a linear function of theirdistance from Ca in MEL cells. Similar results were ob-tained in fibroblast (L60T) and hepatoma (Hepa 1.6) celllines. In contrast, in plasmacytoma (MPC11) and pre-B(22D6 and 300-19P) cell lines, all IgCH segments examinedreplicated within a narrow interval of the S phase, at least as
early as Ca in MEL cells.
MATERIALS AND METHODS
Cell cultures. The MEL DS19, plasmacytoma (MPC11),and L60T cell lines were maintained as described previously(6). The Abelson murine leukemia virus-transformed (1)pre-B cell lines, 22D6 and 300-19P (kindly provided by F.Alt), and a T-cell lymphoma, RL c 11 (kindly provided by A.Silverstone [33]), were grown in suspension cultures (Falconflasks) in RPMI medium in the presence of 10% heat-inactivated fetal calf serum and 5 x 10⁻⁵ M P-mercaptoeth-anol. BALB/c 3T3 cells and a hepatoma cell line, Hepa 1.6,were grown in monolayers in Dulbecco modified Eaglemedium containing 10% fetal calf serum.
Growth in the presence of BUdR and centrifugal elutriation.Growth in the presence of BUdR, centrifugal elutriation, andflow microfluorimetric (FMF) analysis of propidium iodide-stained MEL and MPC11 cells were as described previously(4-6,9). BUdR labeling and centrifugal elutnation conditionsfor Hepa 1.6, 22D6, 300-19P, and RL 11 were as describedelsewhere (Hatton et al., in preparation; S. Stuart, F. W.Alt, and C. L. Schildkraut, manuscript in preparation). Witheach cell line, the S-phase population was divided into fourpooled fractions having modal cellular DNA contents in theapproximate range of 2.0 to 2.3 C (classI), 2.3 to 3.0 C (classII), 3.3 to 3.6 C (classIII), and 3.6 to 4.0 C (class IV), whereC is the haploid DNA content of a cell in the Gl phase (6). Inanother experiment with MEL cells, bromouracil-labeledDNA (BU-DNA) was obtained from narrower intervals of
the S phase by incubating the cells with BUdR for a shortertime (1.5 instead of 2.5 h) and dividing the S-phase popula-tion into eight size classes instead of four. In these experi-ments, a Beckman JElOX rotor with a larger capacity thanthe one used previously (4) was utilized. With the largerrotor, approximately 4 x 10⁹ cells were elutriated.
Isolation of BU-DNA. The preparation of high-molecular-weight DNA, digestion with EcoRI, and the separation ofBU-DNA from non-BU-DNA by their buoyant density dif-ferences in Cs2SO4 gradients were as described previously(4, 6). The concentration of BU-DNA was determined bymeasuring both the A260 and fluorescence (15). The EcoRIsegments of BU-DNA were separated by agarose gel elec-trophoresis and transferred to diazobenzyloxymethyl paper(38). The filter-bound DNA was then hybridized to thenick-translated 32P-labeled probes for various mouse immu-noglobulin genes.
Calculation of relative concentrations of EcoRI segments inBU-DNA. Hybridization, washing of filters, and autoradiog-raphy were as described previously (4). The relative concen-trations of EcoRI segments were determined from the nor-malized band intensities on X-ray film measured from areasof densitometric scans by using a Numonics ElectronicGraphics calculator or a Cambridge Instruments Quantimet920 (4, 9). All exposures were within the linear responserange of the X-ray film. The error due to the unevenlydistributed background on the X-ray film was estimated to beless than 10%.DNA probes. The map of the IgCH gene cluster in MEL
cells shown in Fig. 1 (derived from references 16, 32, and 39)illustrates the probes used in this study and the EcoRIsegments to which they hybridize. Other EcoRI segments inthis region are not shown. p3'a (cloned in pSP65; providedby J. Stavnezer) consists of a 1.3-kb BamHI-BglII segmentlocated between 2.8 and 4.2 kb downstream from the Camembrane exon in I/St strain mice. This probe hybridizes toa 20-kb segment in MEL cells and a 10-kb segment in theother cell types we examined. To our knowledge, the seg-ments hybridizing to p3'a have not been previously mapped.M67-19 (17) and pa(J558)13 (19) were provided by K. Marcu.pySa-3 (provided by L. Eckhart) is a 4.5-kb EcoRI segmentsubcloned into pBR325 from the CHMlg-y2a-9 phage cloneoriginally isolated by Shimizu et al. (32). -y2b(11)7 (30)contains cDNA (about 1 kb) cloned into the EcoRI site byAT tailing and was provided by K. Marcu. pBR1.4 (providedby K. Marcu) contains a genomic insert from a 6.6-kb EcoRIsegment adjacent (5') to the EcoRI segment containing the-y2b gene (17). MEP10 was isolated from a partially EcoRI-digested BALB/c mouse embryo DNA library and hybrid-izes to a 6.8-kb EcoRI segment containing the -yl gene and anadjacent (5') 16-kb segment (27). pS-y3 (17) andp,u(3741)9(30) containing cDNA (about 1 kb) inserted into the EcoRIsite of pMB9 by AT tailing were kindly provided by K.Marcu. JH800 (provided by F. Alt) contains an insert of 800base pairs located 3' OfJ4. pJ11 (19) contains a genomic insertfrom the JH region includingJ3 and J4. The D-region probes(cloned into pBR322) were kindly provided by F. Alt;DSP2.3 contains a rearrangement of DSP and J, and p6-1(see Table 3) contains a rearrangement of DFL and J (1).
RESULTS
Isolation of newly replicated BU-DNA from different inter-vals of the S phase in elutriated MEL cells. To obtain DNAthat replicated during selected intervals of the S phase, weincubated exponentially growing MEL cells in the presence
VOL. 7, 1987
Dow
nloa
ded
from
http
s://j
ourn
als.
asm
.org
/jour
nal/m
cb o
n 19
Oct
ober
202
1 by
118
.37.
7.19
7.

452 BROWN ET AL.
5'l1 411DIO D40D54D67
+38
JH800pJ Cjp C(3741)9
hI1JH Cu CS
IlI I -I I I
300 280 260 240 220 200 180 160
Y2b(1)7 pa(J558)13pS73 MEPIO pBRIA4pSr2o 3 jM67-
I A I I 1 A1P3I.11 ~1.1 11.1ff.
Cy3 Cyl Cr2b Cr20 CE CaI A.Ie*j LjLL*JI t
ri-i YI-2 r2b-I r2b-2 a-l/a-3 aa-2 1
140 120 100 80 60 40 20
X-4
0 kb
FIG. 1. Map positions ofEcoRI segments from IgCH, J, and D loci in MEL cells whose replication times were examined. The probes usedto identify each of the EcoRI segments are indicated above the map. When these probes hybridized to more than one segment in the vicinityof a gene, we indicated these segments by number (in brackets below the map). The map distances are based on those determined for BALB/cmice (16, 32, 39). The sizes of the EcoRI segments in MEL cells were the same as those reported for BALB/c mice with one exception. A4.5-kb Ca segment which hybridized to M67-19 and pa(J558)'3 in several mouse strains was not present in MEL cells. In this cell line, theseprobes hybridized to 2.8- and 1.7-kb bands, respectively (4). Not included in the published maps of the BALB/c IgCH gene cluster is a 20-kbsegment in MEL cells which hybridized to p3'a, a 1.3-kb BamHI-BgIII segment cloned in pSP65 and located 2.8 to 4.2 kb 3' of the Camembrane exon in I/St strain mice (G. Stavnezer, manuscript in preparation). In other murine cell lines examined in this study, p3'ahybridized to a 10- to 14-kb segment. In addition, the position of the 10-kb (D1o) segment (F. Alt, personal communication) and the relativepositions of 4.0- and 3.8-kb D segments (D4.0 and D3.8) were not known at the time a map of the D region was published.
ofBUdR (20 ,ug/ml). Cell populations in various stages of theS phase were then separated on the basis of cell size, whichis proportional to DNA content, by centrifugal elutriation as
described previously (4, 9). Fractions of elutriated cells withsimilar DNA contents (determined by FMF analysis) were
pooled such that the S phase was divided into four or eightsize classes in different experiments. The length of theBUdR pulse was 2.5 h for the four-interval experiment and1.5 h for the eight-interval experiment. Cells from each sizeclass contained BU-DNA which had replicated during the1.5- or 2.5-h BUdR pulse prior to elutriation and henceduring different intervals of the S phase. DNA from thesecells was digested with EcoRI, and BU-DNA was separatedfrom non-BU-DNA by preparative Cs2SO4 density gradientcentrifugation (4). Equal amounts (4 ,ug) of EcoRI-digestedBU-DNA from different intervals of the S phase was frac-tionated by agarose gel electrophoresis and transferred todiazobenzyloxymethyl paper (38). The filter-bound DNAwas sequentially hybridized to 32P-labeled cloned segmentscorresponding to different IgCH segments (Fig. 1). Autora-
1 2 3 4 5 6 7 8
kb
6.8- - _
FIG. 2. Relative concentrations of sequences flanking the y2bgene (-y2b-1; Fig. 1) in BU-DNA from eight intervals of the S phase.Exponentially growing MEL cells were pulsed with BUdR (20,ug/ml) for 1.5 h. The cells were then fractionated according to sizeby centrifugal elutriation. Samples were pooled into eight sizeclasses representing cells from different intervals of the S phase.EcoRI digests of BU-DNA (4 ,ug) from each size class (lanes 1 to 8)were fractionated on a 0.8% agarose gel and transferred to diazoben-zyloxymethyl paper. A 32P-labeled probe (pBR1.4) detected the6.8-kb EcoRI segment flanking y2b (3').
diograms obtained from exposure of X-ray film to diazoben-zyloxymethyl paper revealed bands of differing intensities inthe lanes containing DNA that replicated during selectedintervals of the S phase. The EcoRI segments flanking they2b gene are shown in Fig. 2. The intensities of these bandswere proportional to the relative concentrations of theEcoRI segments that replicated in the presence of BUdR.The concentration of a particular segment was greatest inBU-DNA from the interval of the S phase during which itreplicated. With these methods, we have been able to use theDNA samples described here to detect genes that replicateduring the early as well as the late S phase (6; Hatton et al.,in preparation). In the present study, this approach was usedto determine the temporal sequence of replication of dif-ferent IgCH segments.
Determination of the nuclear DNA contents (C values) atwhich various IgCH segments replicated in MEL cells. As acell progresses through the S phase, the nuclear DNAcontent (C value) increases from 2 to 4 C. Thus, the C value
35
Z 3.0-
25
-0-C
n 2 5
2 3 4 5 6 7 8 9 10 11 12Time (hrs.)
FIG. 3. Linear increase in DNA content and cell size as MELcells progress through the S phase. MEL cells in the Gl phase were
collected by centrifugal elutriation and incubated at 37°C. At 30-minintervals, samples were removed for analysis of cellular DNAcontent (C value) by FMF analysis or of cell size (determined witha Coulter Electronics Channelyzer). Similar results were obtained inan independent elutriation experiment.
19)a
- 3'
MOL. CELL. BIOL.
Dow
nloa
ded
from
http
s://j
ourn
als.
asm
.org
/jour
nal/m
cb o
n 19
Oct
ober
202
1 by
118
.37.
7.19
7.

RATE OF REPLICATION OF IgCH 453
!12
C-
E:z
2C 4C
In
z
2C 4C
CellClass
FIG. 4. Relative abundance of cells that had a given DNAcontent during the 1.5-h BUdR pulse in each of eight elutriated cellpopulations. The FMF profiles are histograms showing numbers ofcells (ordinate), with the DNA content (measured by fluorescence).indicated on the abscissa. The first FMF profile represents expo-nentially growing cells before elutriation. The numbers to the rightof each profile indicate the flow rate (milliliters per minute) of themedium used for elutriation of those fractions. The fractions were
pooled to produce eight classes of cells. BU-DNA synthesizedduring a different interval of the S phase was isolated from each ofthese cell classes. The shaded areas indicate the proportions of cellsin each elutriated population that had a given nuclear DNA content(2.2 C) at some time during the BUdR pulse.
is a convenient measure of how far a cell has advancedthrough the S phase. We verified that the DNA contents inMEL cells increased throughout the S phase at a constantrate by the following experiment. A population of MEL cellsin the Gl phase was collected by centrifugal elutriation andmaintained at 37°C in medium containing 10% fetal calfserum. At 30-min intervals, samples were removed; theirDNA contents were determined by FMF analysis, and theircell sizes were determined with a Coulter Electronics Chan-nelyzer. The average cell size increased linearly throughoutthe Gl and S phase (Fig. 3). The average DNA contentremained at 2 C for a 2-h interval, corresponding to the
length of the Gl phase in MEL cells (E. Brown, unpublishedresults). After 2 h, the cells entered the S phase synchro-nously. Upon entry into the S phase, the average DNAcontent per cell increased linearly to a value of 4 C over a
period of 8.5 h. These results show that the C value in MELcells increased at a constant rate throughout the S phase.Thus, all S-phase cells will have increased their DNAcontents by 0.35 C during a 1.5-h BUdR pulse (17.6% of an8.5-h S phase during which the DNA content increases by 2C). This constant rate of increase in the DNA contentallowed us to determine the specific C values at which IgCHsegments replicated by using the strategy described below.
First, the relative concentrations ofEcoRI segments in theBU-DNA from different pooled elutriated populations weredetermined from their band intensities on autoradiograms.The relative concentration of a segment that replicated at agiven C value in the BU-DNA of a particular elutriatedpopulation was proportional to the relative percentage ofcells in that population which had a nuclear DNA contentequal to this C value at some time during the BUdR pulse.To determine the percentage of cells in each elutriated
population which replicated at a given C value during theBUdR pulse, we used the FMF profiles. In the FMF profilesshown in Fig. 4, the shaded area (which encompasses 0.35 C)illustrates a population of cells in each interval which repli-cated at a given C value during the BUdR pulse. Wedetermined the percentages of total cells in each intervalwhich were included in the shaded area [(shaded area/totalarea in profile) x 1001. The total number of cells in eachpooled interval was then normalized, and the relative per-centage of cells which replicated at a given C value (i.e., inthe shaded area) during the BUdR pulse was determined.Using this analysis (with the aid of a computer), we prepareda table (not shown) of the normalized percentage of cells ineach cell population (representing each selected interval ofthe S phase) which replicated when their nuclear DNAcontents were at a particular C value. This was done for 100selected C values.To determine the C value at which a segment replicated,
we matched its relative concentration in BU-DNA from eachpooled interval with the normalized percentage of cellswhich replicated at 100 selected C values. For example, inTable 1 we list the relative concentrations of three IgCHsegments in BU-DNA from each of eight intervals and the Cvalues for which the normalized percentage of cells in eachinterval agreed most closely with these data. From thesedata, we determined that y2a, lyl, and J1_ replicated at 2.43,2.57, and 2.71 C, respectively. Using this analysis, wedetermined the C values at which the IgCH, J, and Dsegments detected by the probes in Fig. 1 replicated.To determine whether the FMF profiles are a true reflec-
TABLE 1. Determination of the C values at which IgCH segments replicated during the S phaseaRelative concn, as a normalized %, of segment in BU-DNA determined from hybridization or calculated from
EcoRI segment Probe FMF profiles (shown in parentheses) for the following selected intervals of the S phase1 2 3 4 5 6 7 8
5.0-kb flanking -y2a (5') pSy2a-3 17.1 (16.8) 22.0 (23.6) 22.8 (24.6) 19.3 (18.9) 10.0 (9.9) 6.2 (4.1) 1.9 (1.6) 0.6 (0.5)16-kb flanking -yl (5') MEP10 9.9 (10.0) 17.4 (19.8) 26.0 (24.1) 20.5 (22.4) 10.7 (14.3) 11.5 (6.0) 3.6 (2.6) 0.3 (0.6)6.6-kb J1l^ pJ11 5.9 (5.6) 11.8 (15.5) 22.2 (21.5) 17.0 (24.3) 14.7 (19.2) 6.5 (8.6) 8.3 (4.6) 2.7 (0.8)
a Eight classes of cells (see Materials and Methods) that had synthesized BU-DNA during eight different intervals of the S phase were chosen. The relativeconcentrations (expressed as a percentage of the total concentration in all eight intervals) of the EcoRI segments indicates their temporal order of replication. Thenumber of cells in each class was normalized to 100, and a subpopulation containing a given C value during the BUdR pulse was expressed as a percentage of allsuch cells. To determine the C value at which an EcoRI segment replicated, we compared its distribution in the BU-DNA from each size class (measured byhybridization) with the relative distribution of cells (measured by FMF analysis) which had a given C value in each size class. We chose as the C value at which anEcoRI segment replicated a nuclear DNA content at which the sum of the differences between the two sets of data (determined by a computer) was the smallest.The C values at which the three segments replicated were determined to be 2.43C (-y2a), 2.57C (yl), and 2.71C (J-4).
VOL. 7, 1987
Dow
nloa
ded
from
http
s://j
ourn
als.
asm
.org
/jour
nal/m
cb o
n 19
Oct
ober
202
1 by
118
.37.
7.19
7.
454 BROWN ET AL.
3.1
3.0
2.91
w
c 2.8
' 2.7-
O 2.6
:z 2.5-)
0
2.4z
2.31
A
D4.0,5.40 0
Y340~~J2g.
3342-_r T- 2b-Ies-V,..Y-I
/TI-2
/^a-42.2
21)0
B Dl'o
D4.01,5.4-D6 7./
I
ri-I.q
- yi-2,o Y3
.a-3
I I
100 200 300 0 100 200Distonce From a-4 (kb)
300
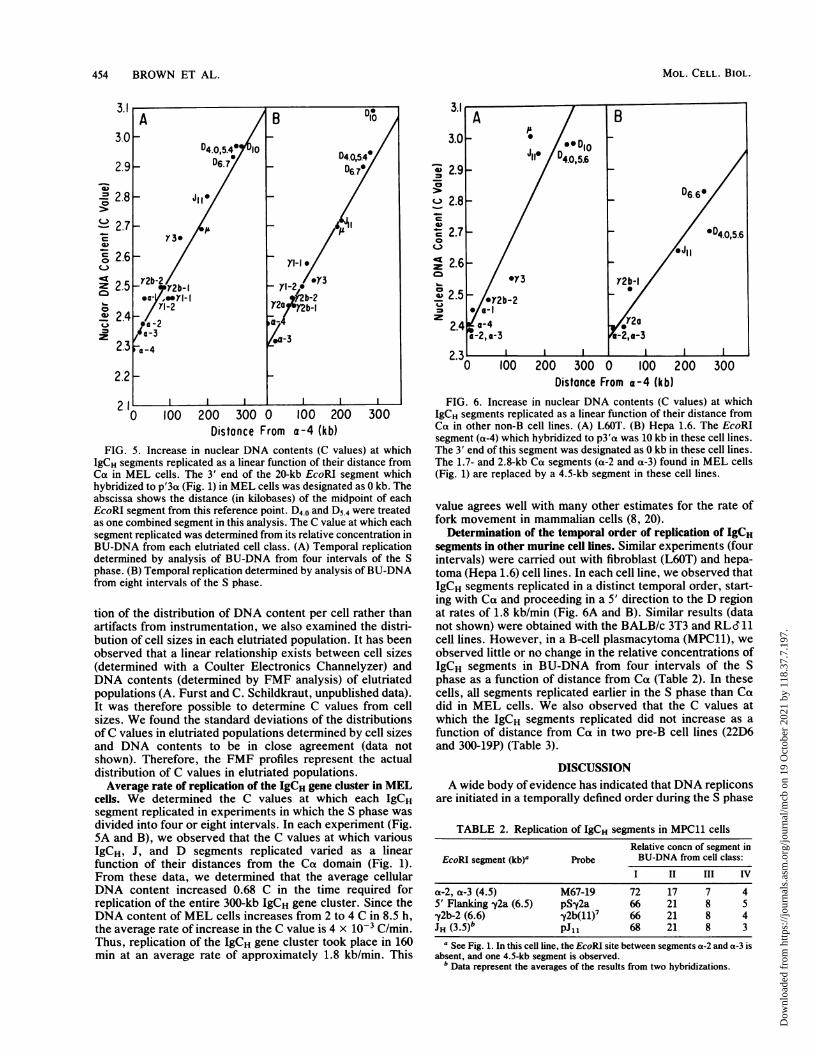
FIG. 5. Increase in nuclear DNA contents (C values) at whichIgCH segments replicated as a linear function of their distance fromCa in MEL cells. The 3' end of the 20-kb EcoRI segment whichhybridized to p'3a (Fig. 1) in MEL cells was designated as 0 kb. Theabscissa shows the distance (in kilobases) of the midpoint of eachEcoRI segment from this reference point. D4.0 and D5.4 were treatedas one combined segment in this analysis. The C value at which eachsegment replicated was determined from its relative concentration inBU-DNA from each elutriated cell class. (A) Temporal replicationdetermined by analysis of BU-DNA from four intervals of the Sphase. (B) Temporal replication determined by analysis of BU-DNAfrom eight intervals of the S phase.
tion of the distribution of DNA content per cell rather thanartifacts from instrumentation, we also examined the distri-bution of cell sizes in each elutriated population. It has beenobserved that a linear relationship exists between cell sizes(determined with a Coulter Electronics Channelyzer) andDNA contents (determined by FMF analysis) of elutriatedpopulations (A. Furst and C. Schildkraut, unpublished data).It was therefore possible to determine C values from cellsizes. We found the standard deviations of the distributionsof C values in elutriated populations determined by cell sizesand DNA contents to be in close agreement (data notshown). Therefore, the FMF profiles represent the actualdistribution of C values in elutriated populations.Average rate of replication of the IgCH gene cluster in MEL
cells. We determined the C values at which each IgCHsegment replicated in experiments in which the S phase was
divided into four or eight intervals. In each experiment (Fig.5A and B), we observed that the C values at which variousIgCH, J, and D segments replicated varied as a linearfunction of their distances from the Ca domain (Fig. 1).From these data, we determined that the average cellularDNA content increased 0.68 C in the time required forreplication of the entire 300-kb IgCH gene cluster. Since theDNA content of MEL cells increases from 2 to 4 C in 8.5 h,the average rate of increase in the C value is 4 x 10⁻³ C/min.Thus, replication of the IgCH gene cluster took place in 160min at an average rate of approximately 1.8 kb/min. This
0 2.9 -
0)
>0
c- 2.8 -
a 2.7 -
z 2.6 -
m
l 2.52
2.3 E 1
0 100 200 300 0 100 200 300Distance From a-4 (kb)
FIG. 6. Increase in nuclear DNA contents (C values) at whichIgCH segments replicated as a linear function of their distance fromCot in other non-B cell lines. (A) L60T. (B) Hepa 1.6. The EcoRIsegment (a-4) which hybridized to p3'a was 10 kb in these cell lines.The 3' end of this segment was designated as 0 kb in these cell lines.The 1.7- and 2.8-kb Ca segments (a-2 and a-3) found in MEL cells(Fig. 1) are replaced by a 4.5-kb segment in these cell lines.
value agrees well with many other estimates for the rate offork movement in mammalian cells (8, 20).
Determination of the temporal order of replication of IgCHsegments in other murine cell lines. Similar experiments (fourintervals) were carried out with fibroblast (L60T) and hepa-toma (Hepa 1.6) cell lines. In each cell line, we observed thatIgCH segments replicated in a distinct temporal order, start-ing with Ca and proceeding in a 5' direction to the D regionat rates of 1.8 kb/min (Fig. 6A and B). Similar results (datanot shown) were obtained with the BALB/c 3T3 and RL 11
cell lines. However, in a B-cell plasmacytoma (MPC11), we
observed little or no change in the relative concentrations ofIgCH segments in BU-DNA from four intervals of the Sphase as a function of distance from Ca (Table 2). In thesecells, all segments replicated earlier in the S phase than Cadid in MEL cells. We also observed that the C values atwhich the IgCH segments replicated did not increase as a
function of distance from Ca in two pre-B cell lines (22D6and 300-19P) (Table 3).
DISCUSSIONA wide body of evidence has indicated that DNA replicons
are initiated in a temporally defined order during the S phase
TABLE 2. Replication of IgCH segments in MPC11 cellsRelative concn of segment in
EcoRI segment (kb)' Probe BU-DNA from cell class:I II III IV
a-2, a-3 (4.5) M67-19 72 17 7 45' Flanking -y2a (6.5) pS-y2a 66 21 8 5-y2b-2 (6.6) y2b(11)' 66 21 8 4JH (3.5)b pJ11 68 21 8 3
a See Fig. 1. In this cell line, the EcoRI site between segments a-2 and a-3 isabsent, and one 4.5-kb segment is observed.
b Data represent the averages of the results from two hybridizations.
MOL. CELL. BIOL.
Dow
nloa
ded
from
http
s://j
ourn
als.
asm
.org
/jour
nal/m
cb o
n 19
Oct
ober
202
1 by
118
.37.
7.19
7.

RATE OF REPLICATION OF IgCH 455
TABLE 3. Replication of IgCH segments in pre-B cells
Cell line )EcoRsegment Relative concn of segment in BU-DNA from cell class:Cellline(kb)aPr III IV
22D6a-4 (14) p3'a 64.9 30.6 3.7 0.9a-2, a-3 (4.5) M67-19 65.9 26.6 9.5 2.15' Flanking pS-y2a-3 64.5 25.1 9.6 0.9
y2a (5.0) 70.5 25.9 2.9 0.9y2b-2 (6.8) y2b(11)7 60.1 33.7 5.3 0.8y2b-1 (6.8) pBR1.4 61.0 31.7 6.4 0.9-y3 (23) pS-y3 70.3 28.3 1.3 0p. (19.0) pp.(3741)9 53.0 33.0 12.0 2.5JH (3.0) pJ11 69.3 25.5 5.0 0.1JH (4.5) pJ11 59.3 34.9 5.5 0.3DFL (4.4) p6-1 56.0 37.0 6.9 0.4
300-19Pa-2, a-3 (4.5) M67-19 53.5 40.0 6.2 0.2-y2b-2 (6.8) -y2b(11)7 46.3 46.7 7.0 0-y2b-1 (6.8) pBR1.4 53.4 46.6 0 0y3 (23) pSy3 47.2 35.0 11.7 5.9p. (19.0) ptL(3741)9 57.0 27.2 11.8 3.9JH (5.0) JH800 57.2 36.0 6.7 0.2JH (5.0) pJ1l 54.8 39.3 5.9 0DSP (4.0, 5.5) DSP2.3 45.3 40.7 5.7 8.1
a The sizes of the EcoRI segments in these pre-B cell lines are the same as those in germ line DNA (Fig. 1), except for the rearranged J segnents and the a-2 anda-3 segments.
b Two sets of data represent the results from two independent hybridizations.
(2, 4, 6, 9, 10, 20, 36). In addition, the time at which specificgenes replicate appears to be invariant from one S phase tothe next, except possibly in cases in which the transcrip-tional state of a gene has changed. The available evidencesuggests a correlation between the time some genes replicateduring the S phase and their transcriptional activity (6, 9, 10;Hatton et al., in preparation). Thus, expressed genes usuallyreplicate earlier than nonexpressed genes. The mechanismsgoverning this temporally programmed initiation of DNAreplication are poorly understood and are the subject ofmuch investigation.
Earlier studies with synchronized Chinese hamcter cellsreported that the S phase is divided into distinct early andlate replicating components which are separated by a pausein DNA replication (reviewed in reference 10). In contrast,we observed that the DNA content of the MEL cell lineincreases linearly as the cells progress through the S phase.Thus, in MEL cells we do not find evidence for a cleardelineation between the early and late halves of the S phase,as has been previously suggested for other cell lines.We have used centrifugal elutriation to examine the tem-
poral order of replication of EcoRI segments in the IgCHgene cluster of several murine cell lines. The results indicatethat in nonlymphoid cell lines, IgCH gene segments (Fig. 1)replicate in the following order: a, e, -y2a, -y2b, yl, -y3, 8, andp., followed by the J and D segments (Fig. 5 and 6). In twoseparate elutriation experiments with MEL cells, differingdegrees of resolution were obtained by dividing the S-phasepopulation into four (2.5-h BUdR pulse) or eight (1.5-hBUdR pulse) intervals. The results obtained in each exper-iment were essentially the same. The C value at which anIgCH segment replicated varied as a linear function of itsdistance in the 5' direction from an EcoRl site located 3' ofthe Ca domain in MEL cells. From these data, the rate ofreplication of the IgCH gene cluster was determined to be 1.7to 1.9 kb/min. This value is within the range of earliermeasurements of the rate of mammalian DNA replication
fork movement in a variety of cell types (8). These resultsare consistent with the segments of the IgCH locus in MELcells being part of a single replicon. However, the possibilitythat this region may contain numerous small replicons (lessthan 20 kb) which initiate sequentially cannot be ruled out.This latter possibility would conflict with autoradiographicstudies suggesting that neighboring replicons are activatedsynchronously rather than sequentially (8, 20, 29). Ourresults are not consistent with the sequential activation ofbidirectional replicons that are similar in size to the averagereplicon (60 kb) observed by autoradiography. We have alsoconsidered the possibility that replication of all of these IgCHsegments initiates at the same time at several differentorigins but that it takes longer to complete the synthesis ofthe replicons located further from Ca. This implies thatsomewhere in the vicinity of the D segments there is asegment that replicates at the same time as Ca or earlier. Wehave examined the replication ofmany segments flanking theD5.4 segment, and they do not replicate at the same time asCa or earlier. We have also determined that the heavy-chainvariable region segment that is closest to the D segmentsreplicates later than the D segments (Stuart et al., in prepa-ration).
If the IgCH gene cluster and flanking sequences in MELcells are part of a single replicon, the origin should be locatedwithin the earliest replicating segment(s). However, theregion on the 3' side of Ca has not been extensively mapped,and probes for such a study are not presently available.Therefore, we cannot determine, at present, whether thereare segments in this region that replicate earlier than Ca.However, the earliest an origin can be activated is thebeginning of the S phase (at 2 C). If the linear relationshipshown in Fig. 5 is extrapolated back to 2 C, we find that theorigin can be no further than 120 kb upstream from the 3' asegment, assuming that replication proceeds linearly fromthe point of initiation. A single origin for the 300-kb genecluster of IgCH, J, and D localized near Ca would imply the
VOL. 7, 1987
Dow
nloa
ded
from
http
s://j
ourn
als.
asm
.org
/jour
nal/m
cb o
n 19
Oct
ober
202
1 by
118
.37.
7.19
7.

456 BROWN ET AL.
existence of a replicon as large as 600 kb (if replication isbidirectional and termination sites are equidistant from theorigin) or 300 kb (if replication is unidirectional). Such abidirectional replicon would be considerably larger than themean of 50 to 330 kb observed by electron microscopy orautoradiography (for a review, see references 8 and 20).However, replicons as large as 600 kb have been reported bysome investigators (41). While autoradiography suggests that85 to 90% of replication bubbles observed are bidirectional,patterns consistent with unidirectional replication have alsobeen observed (8). Thus, the possibility of a unidirectionalreplicon cannot be excluded.While the results of this study indicate that initiation
occurs 3' of the IgCH gene cluster, they do not imply that thereplication of this region is always initiated at the same site.Instead, replication might be initiated from a number ofpossible sites within a specific region. In simian virus 40DNA, multiple initiation sites for DNA synthesis have beenidentified within a 200-base-pair region of the genome con-taining the origin of replication (11). In Epstein-Barr virus,whose genome is approximately 40 times larger than that ofsimian virus 40, the origin region (ori P) encompasses 1,700base pairs (23, 40). The ori P region of Epstein-Barr virusmay resemble mammalian origins of replication more closelythan do the origins of replication of simian virus 40 orpolyomavirus, since in a lytic infection these viruses un-dergo exponential DNA replication during the cell cycle,leading to cell death. In contrast, plasmids containing Ep-stein-Barr virus ori P undergo a controlled replication that ismore characteristic of mammalian replicons that initiateonce in the cell cycle. The size and complexity of an originof replication may increase with the size of the genome,reflecting the need to interact with a variety of controllingfactors.While we have assigned specific C values for the replica-
tion of IgCH segments in murine cell lines, we cannot statethat the replication of this region initiates at the same time inevery cell or in every homolog of chromosome 12 on whichthe IgCH genes are located. The C values which we havecalculated may reflect an average time of replication for all ofthe IgCH segments in the culture. However, the fact that wewere able to discern a temporal directionality in the replica-tion of this region suggests that replication proceeds throughthe IgCH gene cluster in the same direction in the largemajority of cells.A directionality in the replication of IgCH segments similar
to that in MEL cells was also observed in other non-B celllines, including L60T (fibroblast) and Hepa 1.6 (hepatoma).We obtained similar results (data not shown) for BALB/c3T3 cells and RLd11. In contrast, we found that all IgCHsegments in a plasmacytoma (MPC11) cell line replicatedearlier in the S phase than did Ca in MEL cells, with noresolvable temporal order. In MPC11, there has been a DNArearrangement that deletes the constant region genes up-stream of y2b, so that J and Ca are separated by a muchshorter distance (55 kb) than in non-B cells. As shown in Fig.5, differences in the replication times of fragments separatedby less than 50 kb were detected in MEL cells. Similarresults were obtained in a pre-B cell line (22D6). In anotherpre-B cell line (300-19P), all segments replicated as early asdid Ca in MEL cells. Both 22D6 and 300-19P contain anundeleted germ line IgCH and rearrangements ofD and J andproduce D,u mRNA (24, 25).
It is possible that replication proceeds at a faster rate inexpressed regions of the genome in which chromatin is lesscondensed than in more condensed, inactive regions. Thus,
in cells in which the IgCH gene cluster is transcriptionallyactive, replication might proceed at too fast a rate for atemporal directionality to be clearly resolved. While noevidence exists for modulation of the rate of replication inactive DNA versus inactive DNA, this possibility cannottotally be ruled out from the results of this study.
It is also possible that more origins are active in the IgCHgene cluster in B cells than in non-B cells. As stated above,our data are consistent with the IgCH, J, and D segments inMEL cells and other non-B cells being part of a singlereplicon with an origin in the vicinity of Ca or furtherdownstream. In contrast, additional origins at various sitesin the IgCH gene cluster may be activated in B cells, resultingin replication from multiple replication forks rather than onereplication fork. If these origins are activated at approxi-mately the same time in the S phase, a temporal directional-ity would not be observed by our methods. This explanationis in agreement with studies suggesting that the mammaliangenome contains many potential origins of replication, ofwhich only a few are utilized in different specialized cells(35, 37). There are precedents for the use of alternativeorigins in a particular stretch of DNA. For example, therecan be several alternative origins of replication in the DNAof Escherichia coli bacteriophage T7 (26). The number oforigins of replication has been shown to change duringdevelopment in D. melanogaster (3). The recruitment ofadditional origins in the IgCH gene cluster in B cells mightindicate a need for replication initiated from a nearby originfor gene expression. Electron microscopic studies haveshown that nascent transcripts are associated with earlyreplication forks in Physarum polycephalum (22). In mousemitochondrial DNA, replication and transcription initiatefrom the same site (7). The specific positioning of origins ofreplication in relation to active genes has also been sug-gested by others (18, 31, 34). Thus, the initiation of replica-tion from specific origins may be an early step in theactivation of a gene. A technique described in a recent studyby James and Leffak (13) should prove useful in searchingfor closely spaced origins of replication in the expressedIgCH gene cluster in B cells. The identification of replicationorigins in the IgCH and other expressed or silent multigenefamilies should help to elucidate the relationship betweenDNA replication and gene activity.
ACKNOWLEDGMENTS
This study was supported by Public Health Service grant GM22332 to C.L.S. from the National Institutes of Health. M.A.I. wassupported by National Institutes of Health training grant CA 09060.K.S.H. was supported by National Institutes of Health fellowshipCA 07744. E.H.B. is a Special Fellow of the Leukemia Society ofAmerica.The technical assistance of V. Didamo is greatly appreciated.
LITERATURE CITED1. Alt, F. W., and D. Baltimore. 1982. Joining of immunoglobulin
heavy chain gene segments: implications from a chromosomewith evidence of three D-JH fusions. Proc. Natl. Acad. Sci. USA79:4118-4122.
2. Balazs, I., E. H. Brown, and C. L. Schildkraut. 1974. Thetemporal order of replication of some DNA cistrons. ColdSpring Harbor Symp. Quant. Biol. 38:239-245.
3. Blumenthal, A. B., H. J. Kriegstein, and D. S. Hogness. 1974.The units of DNA replication in Drosophila melanogasterchromosomes. Cold Spring Harbor Symp. Quant. Biol. 38:205-223.
4. Braunstein, J. D., D. Schulze, T. DelGiudice, A. Furst, and C. L.Schildkraut. 1982. The temporal order of replication of murine
MOL. CELL. BIOL.
Dow
nloa
ded
from
http
s://j
ourn
als.
asm
.org
/jour
nal/m
cb o
n 19
Oct
ober
202
1 by
118
.37.
7.19
7.

RATE OF REPLICATION OF IgCH 457
immunoglobulin heavy chain constant region sequences corre-sponds to their linear order in the genome. Nucleic Acids Res.10:6887-6902.
5. Brown, E. H., and C. L. Schildkraut. 1979. Perturbation ofgrowth and differentiation of Friend murine erythroleukemiacells by 5-bromodeoxyuridine incorporation in early S phase. J.Cell. Physiol. 99:261-277.
6. Calza, R. E., L. A. Eckhardt, T. DelGiudice, and C. L.Schildkraut. 1984. Changes in gene position are accompanied bya change in time of replication. Cell 36:689-696.
7. Chang, D. D., W. W. Hauswirth, and D. A. Clayton. 1985.Replication priming and transcription initate from precisely thesame site in mouse mitochondrial DNA. EMBO J. 4:1559-1567.
8. Edenberg, H. J., and J. A. Huberman. 1975. Eukaryotic chro-mosome replication. Annu. Rev. Genet. 9:245-284.
9. Furst, A., E.H. Brown, J. D. Braunstein, and C. L. Schildkraut.1981. a-Globin sequences are located in a region of early-replicating DNA in murine erythroleukemia cells. Proc. Natl.Acad. Sci. USA 78:1023-1027.
10. Goldman, M. A., G. P. Holmquist, M. C. Gray, L. A. Caston,and A. Nag. 1984. Replication timing of genes and middlereplication sequences. Science 224:686-692.
11. Hay, R. T., and M. L. DePamphilis. 1982. Initiation of SV40DNA replication in vivo: location and structure of 5' ends ofDNA synthesized in the ori region. Cell 28:767-779.
12. Heintz, N. H., J. D. Milbrandt, K. S. Greisen, and J. L. Hamlin.1983. Cloning of the initiation region of a mammalian chromo-somal replicon. Nature (London) 302:439-441.
13. James, D. C., and M. Leffak. 1986. Polarity of DNA replicationthrough the avian alpha-globin locus. Mol. Cell. Biol. 6:976-984.
14. Kaufmann, G., M. Zannis-Hadjopoulos, and R. G. Martin. 1985.Cloning of nascent monkey DNA synthesized early in the cellcycle. Mol. Cell. Biol. 5:721-727.
15. Kissane, J. M., and E. Robbins. 1958. The fluorometric mea-surement of deoxyribonucleic acid in animal tissues with specialreference to the central nervous system. J. Biol. Chem.233:184-188.
16. Kurosawa, Y., and S. Tonegawa. 1982. Organization, structure,and assembly of immunoglobulin heavy chain diversity DNAsegments. J. Exp. Med. 155:201-218.
17. Lang, R. B., L. W. Stanton, and K. B. Marcu. 1982. Onimmunoglobulin heavy chain gene switching: two -y2b genes arerearranged via switch sequences in MPC-11 cells but only one isexpressed. Nucleic Acids Res. 10:611-630.
18. Laskey, R. A., and R. M. Harland. 1981. Replication origins inthe eukaryotic chromosome. Cell 24:283-284.
19. Marcu, K. B., J. Banerji, N. A. Penncavage, R. Lang, and N.Arnheim. 1980. 5' Flanking region of immunoglobulin heavychain constant region genes displays length heterogeneity ingermlines of inbred mouse strains. Cell 22:187-196.
20. Martin, R. G. 1981. The transformation of cell growth andtransmogrification of DNA synthesis by simian virus 40. Adv.Cancer Res. 34:1-55.
21. Montiel, J. F., C. J. Norbury, M. F. Tuite, M. J. Dobson, J. S.Mills, A. J. Kingsman, and S. M. Kingsman. 1984. Character-ization of human chromosomal DNA sequences which replicateautonomously in Saccharomyces cerevisiae. Nucleic AcidsRes. 12:1049-1068.
22. Pierron, G., H. W. Sauer, B. Toublan, and R. Jalozot. 1982.Physical relationship between replicons and transcription unitsin Physarum polycephalum. Eur. J. Cell Biol. 29:104-113.
23. Reisman, D., J. Yates, and B. Sugden. 1985. A putative origin ofreplication of plasmids derived from Epstein-Barr virus is
composed of two cis-acting components. Mol. Cell. Biol.5:1822-1832.
24. Reth, M. G., and F. W. Alt. 1984. Novel immunoglobulin heavychains are produced from DJH gene segment rearrangements inlymphoid cells. Nature (London) 312:418-423.
25. Reth, M. G., P. Ammirati, S. Jackson, and F. W. Alt. 1985.Regulated progression of a cultured pre-B-cell line to the B-cellstate. Nature (London) 317:353-355.
26. Richardson, C. C. 1983. Bacteriophage T7: minimal require-ments for the replication of a duplex DNA molecule. Cell33:315-317.
27. Roeder, W. R., A. Maki, A. Traunecker, and S. Tonegawa. 1981.Linkage of the four -y subclass heavy chain genes. Proc. Natl.Acad. Sci. USA 78:474-478.
28. Roth, G. E., H. M. Blanton, L. J. Hager, and V. A. Zakian.1983. Isolation and characterization of sequences from mousechromosomal DNA with ARS function in yeasts. Mol. Cell.Biol. 3:1898-1908.
29. Saffer, L. D., and 0. L. Miller, Jr. 1986. Electron microscopicstudy of Saccharomyces cerevisiae rDNA chromatin replica-tion. Mol. Cell. Biol. 6:1148-1157.
30. Schibler, U., K. B. Marcu, and R. P. Perry. 1978. The synthesisand processing of the messenger RNA's specifying heavy andlight chain immunoglobulins in MPC-11 cells. Cell 15:1495-1509.
31. Seidman, M. M., and A. Levine. 1979. The asymmetric segre-gation of parental nucleosomes during chromosome replication.Cell 18:439-449.
32. Shimizu, A., N. Takahashi, Y. Yaoita, and T. Honjo. 1982.Organization of the constant-region gene family of the mouseimmunoglobulin heavy chain. Cell 28:499-506.
33. Silverstone, A., L. Sun, 0. N. Witte, and D. Baltimore. 1980.Biosynthesis of murine terminal deoxynucleotidyltransferase J.Biol. Chem. 255:791-7%.
34. Smithies, 0. 1982. The control of globin and other eukaryoticgenes. J. Cell. Physiol. l(Suppl.):137-143.
35. Taylor, J. H. 1977. Increase in DNA replication sites in cellsheld at the beginning of S phase. Chromosoma 62:291-300.
36. Taylor, J. H. 1984. Origins of replication and gene regulation.Mol. Cell. Biochem. 61:99-109.
37. Taylor, J. H., and J. C. Hozier. 1976. Evidence for a four micronreplication unit in CHO cells. Chromosoma (Berlin) 57:341-350.
38. Wahl, G. M., M. Stern, and G. R. Stark. 1979. Efficient transferof large DNA fragments from agarose gels to diazobenzyloxy-methyl-paper and rapid hybridization by using dextran sulfate.Proc. Natl. Acad. Sci. USA 76:3683-3687.
39. Wood, C., and S. Tonegawa. 1983. Diversity and joining seg-ments of mouse immunoglobulin heavy chain genes are closelylinked and in the same orientation: implications for the joiningmechanisms. Proc. Natl. Acad. Sci. USA 80:3030-3034.
40. Yates, J., N. Warren, D. Reisman, and B. Sugden. 1984. Acis-acting element from the Epstein-Barr viral genome thatpermits stable replication of recombinant plasmids in latentlyinfected cells. Proc. Natl. Acad. Sci. USA 81:3806-3810.
41. Yurov, Y. B., and N. A. Liapunova. 1977. The units of DNAreplication in the mammalian chromosomes: evidence for alarge size of replication units. Chromosoma (Berlin) 60:253-267.
42. Zannis-Hadjopoulos, M., G. Kaufmann, S. S. Wang, R. L.Lechner, E. Karawya, J. Hesse, and R. G. Martin. 1985. Prop-erties of some monkey DNA sequences obtained by a procedurethat enriches for DNA replication origins. Mol. Cell. Biol.5:1621-1629.
VOL. 7, 1987
Dow
nloa
ded
from
http
s://j
ourn
als.
asm
.org
/jour
nal/m
cb o
n 19
Oct
ober
202
1 by
118
.37.
7.19
7.