report and accounts 2015 - savillsir.savills.com/~/media/files/s/savills-ir-v2/annual...
TRANSCRIPT
Report and Accounts 2015
Savills p
lc R
epo
rt and
Acco
un
ts 2015
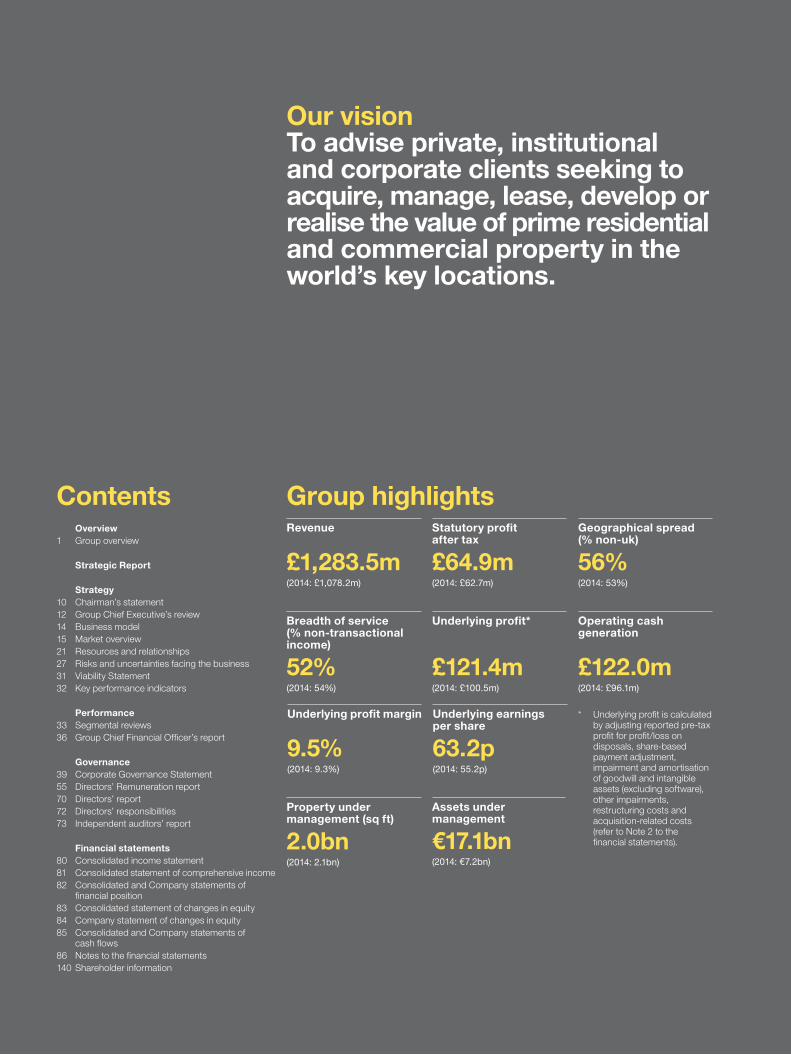
Revenue
£1,283.5m(2014: £1,078.2m)
Property under management (sq ft)
2.0bn(2014: 2.1bn)
Breadth of service (% non-transactional income)
52%(2014: 54%)
Statutory profit after tax
£64.9m(2014: £62.7m)
Underlying profit*
£121.4m(2014: £100.5m)
Underlying profit margin
9.5%(2014: 9.3%)
Geographical spread (% non-uk)
56%(2014: 53%)
Operating cash generation
£122.0m(2014: £96.1m)
Underlying earnings per share
63.2p(2014: 55.2p)
Assets under management
€17.1bn(2014: €7.2bn)
* Underlying profit is calculated by adjusting reported pre-tax profit for profit/loss on disposals, share-based payment adjustment, impairment and amortisation of goodwill and intangible assets (excluding software), other impairments, restructuring costs and acquisition-related costs (refer to Note 2 to the financial statements).
Group highlightsContents Overview1 Group overview
Strategic Report
Strategy10 Chairman’s statement12 Group Chief Executive’s review14 Business model15 Market overview21 Resources and relationships27 Risks and uncertainties facing the business31 Viability Statement32 Key performance indicators
Performance33 Segmental reviews36 Group Chief Financial Officer’s report
Governance39 Corporate Governance Statement55 Directors’ Remuneration report70 Directors’ report72 Directors’ responsibilities73 Independent auditors’ report
Financial statements80 Consolidated income statement81 Consolidated statement of comprehensive income82 Consolidated and Company statements of
financial position83 Consolidated statement of changes in equity84 Company statement of changes in equity85 Consolidated and Company statements of
cash flows86 Notes to the financial statements140 Shareholder information
Our vision To advise private, institutional and corporate clients seeking to acquire, manage, lease, develop or realise the value of prime residential and commercial property in the world’s key locations.

Transactional Advisory
The Transaction Advisory business stream comprises commercial, residential, leisure and agricultural leasing, tenant representation and investment advice on purchases and sales. See page 33
Consultancy
Provision of a wide range of professional property services including valuation, building and housing consultancy, environmental consultancy, landlord and tenant, rating, development, planning, strategic projects, corporate services and research. See page 34
Property and Facilities ManagementManagement of commercial, residential, leisure and agricultural property for owners. Provision of a comprehensive range of services to occupiers of property, ranging from strategic advice through project management to all services relating to a property.See page 35
Investment Management
Investment management of commercial and residential property portfolios for institutional, corporate or private investors, on a pooled or segregated account basis. See page 35
Pages 2-9 are examples of the services we provided to our clients in 2015.
Our services
Group overview
What we do Savills is a global real estate services provider listed on the London Stock Exchange. We have an international network of over 700 offices and associates and over 30,000 staff throughout the Americas, the UK, Continental Europe, Asia Pacific, Africa and the Middle East, offering a broad range of specialist advisory, management and transactional services to clients all over the world.
Ove
rview / S
trategy / Perform
ance / Governance / Financial statem
ents
SAVILLS PLC REPORT AND ACCOUNTS 2015 1

SAVILLS PLC REPORT AND ACCOUNTS 20152

TELEVISION CENTRE WOOD LANE, LONDON W12
Savills is marketing the residential scheme Television Centre on behalf of developers, Stanhope and Mitsui Fudosan. The scheme, part of the wider White City regeneration, provides circa 950 homes in two phases. It will also include 500,000 sq ft of office space, operational December 2017, and three television studies which will be live by early 2017.
Savills provided residential consultancy together with sales and marketing expertise throughout the planning process for this mixed use scheme. The residential scheme has a GDV of circa £500 million
and will be a combination of studios, one, two and three bedroom apartments and penthouses. Amenities include underground parking, residents’ lounge and private screening room, 24/7 concierge service, fully equipped gym and pool. The redevelopment will also include a new branch of members’ club, Soho House, along with rooftop pool, terrace and hotel.
How do you regenerate one of London’s oldest business areas into a new residential and cultural centre?
Ove
rview / S
trategy / Perform
ance / Governance / Financial statem
ents
SAVILLS PLC REPORT AND ACCOUNTS 2015 3

HERMÈS HEADQUARTERS CENTRAL PARIS
Savills acted as the exclusive agent for the sale of Hermès International’s headquarters in Paris, France, on behalf of a private investor. The sale price was in excess of €100m. The property is let entirely to Hermès International under a nine-year lease. It was restructured in 2006 and offers a total area of 5,848 sq m, distributed over a ground floor and nine upper floors, with good natural light and high-end finishes.
How do you sell an office property in central Paris?
SAVILLS PLC REPORT AND ACCOUNTS 20154

Ove
rview / S
trategy / Perform
ance / Governance / Financial statem
ents
SAVILLS PLC REPORT AND ACCOUNTS 2015 5

Where is the right place to locate my business?
CHINA LIFE INSURANCE KOWLOON, HONG KONG
Savills secured the headquarters for China Life Insurance – One HarbourGate, the whole 395,000 sq ft development, for the sale price of HK$5.8bn, achieving the biggest en bloc commercial transaction in Kowloon.
SAVILLS PLC REPORT AND ACCOUNTS 20156

Ove
rview / S
trategy / Perform
ance / Governance / Financial statem
ents
SAVILLS PLC REPORT AND ACCOUNTS 2015 7
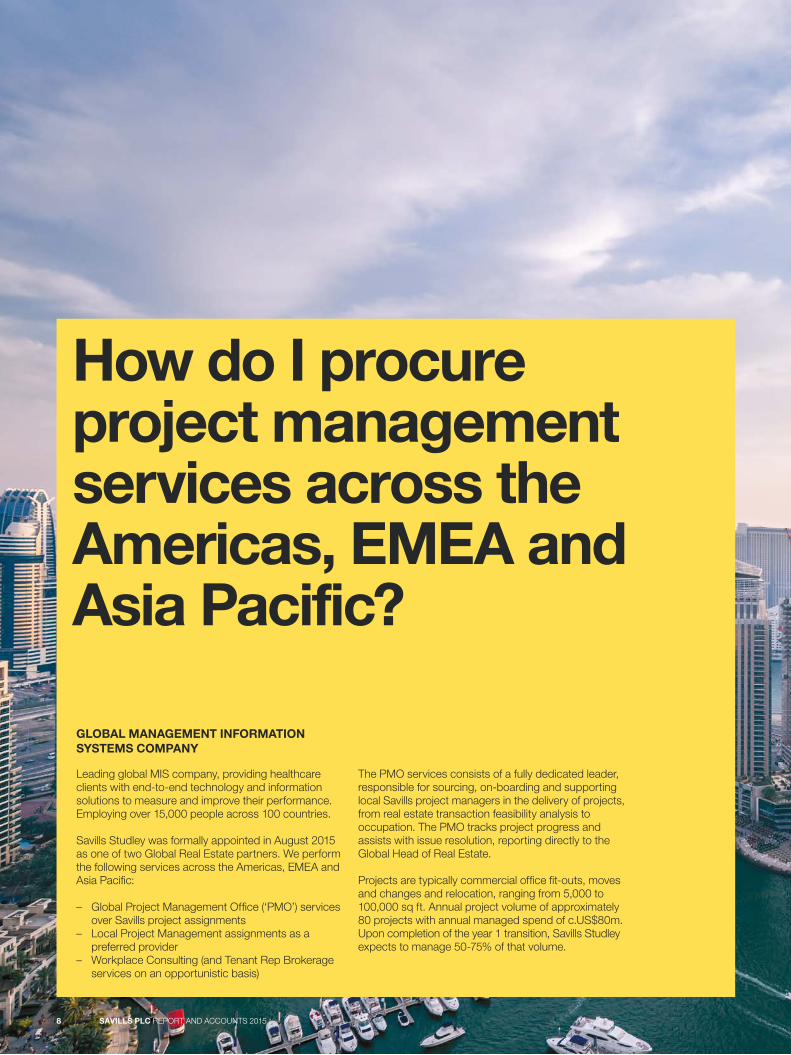
GLOBAL MANAGEMENT INFORMATION SYSTEMS COMPANY
Leading global MIS company, providing healthcare clients with end-to-end technology and information solutions to measure and improve their performance. Employing over 15,000 people across 100 countries.
Savills Studley was formally appointed in August 2015 as one of two Global Real Estate partners. We perform the following services across the Americas, EMEA and Asia Pacific:
– Global Project Management Office (‘PMO’) services over Savills project assignments
– Local Project Management assignments as a preferred provider
– Workplace Consulting (and Tenant Rep Brokerage services on an opportunistic basis)
The PMO services consists of a fully dedicated leader, responsible for sourcing, on-boarding and supporting local Savills project managers in the delivery of projects, from real estate transaction feasibility analysis to occupation. The PMO tracks project progress and assists with issue resolution, reporting directly to the Global Head of Real Estate.
Projects are typically commercial office fit-outs, moves and changes and relocation, ranging from 5,000 to 100,000 sq ft. Annual project volume of approximately 80 projects with annual managed spend of c.US$80m. Upon completion of the year 1 transition, Savills Studley expects to manage 50-75% of that volume.
How do I procure project management services across the Americas, EMEA and Asia Pacific?
SAVILLS PLC REPORT AND ACCOUNTS 20158

Ove
rview / S
trategy / Perform
ance / Governance / Financial statem
ents
SAVILLS PLC REPORT AND ACCOUNTS 2015 9
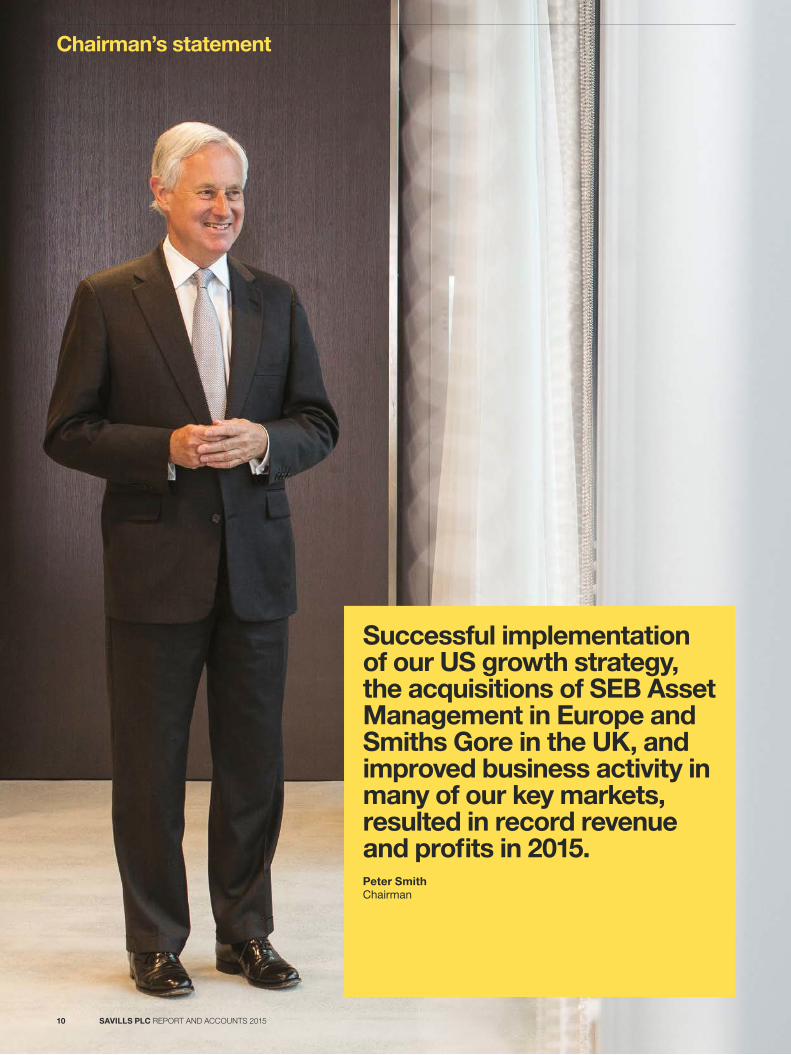
Chairman’s statement
Successful implementation of our US growth strategy, the acquisitions of SEB Asset Management in Europe and Smiths Gore in the UK, and improved business activity in many of our key markets, resulted in record revenue and profits in 2015.Peter SmithChairman
SAVILLS PLC REPORT AND ACCOUNTS 201510
ResultsThe Group’s underlying profit for the year increased by 21% to £121.4m (2014: £100.5m), on revenue which improved by 19% to £1,283.5m (2014: £1,078.2m). The Group’s statutory profit before tax increased by 16% to £98.6m (2014: £84.7m).
OverviewWith investors globally seeking secure income in a historically low interest rate environment, the allocation to Real Estate in investment portfolios has continued to grow. 2015 again demonstrated the importance of Savills strengths in the prime markets of many of the world’s key cities. Furthermore, the continued development of our US business, where a number of complementary acquisitions were completed by Savills Studley during the year, enhanced our position further in that market. On 31 August, Savills Investment Management (formerly ‘Cordea Savills’)completed the acquisition of SEB Asset Management AG, and as a result of the acquired business completing a substantial one-off transaction at the end of the year, our profits from Investment Management activities increased substantially over the previous year.
Our Transaction Advisory revenue grew by 25%, our Consultancy revenue by 6% and our Property Management revenue by 15%, boosted by the acquisition of Smiths Gore in the UK. We enjoyed a strong year in most of the commercial markets in which we operate including record performances in the UK, US and Asia and a further improvement in profits from our businesses in Continental Europe. Our Residential businesses weathered changeable conditions in a number of the world’s prime markets with UK revenue down by only 1% year on year. In Asia, the size and stability of our Property Management business, strong performances in China, Australia and Korea and significant market share gains in the commercial capital markets business in Hong Kong, collectively helped to mitigate the effect of subdued investment volumes in Hong Kong, Singapore and mainland China.
In Continental Europe, improved market conditions benefited our predominantly transaction orientated businesses with revenue increasing by 10% (22% in constant currency) and profitability further improved. Savills Investment Management, enhanced through the acquisition of SEB Asset Management delivered a substantially improved performance across its European platform increasing Assets Under Management (‘AUM’) by 138% (to €17.1bn), revenue by 59% and profits by 148%.
The Group’s underlying profit margin increased to 9.5% from 9.3% in 2014, despite the negative effects of the slowdown in UK Residential markets and the effect of business development expenditure in the US. Considerable performance improvement in the broader UK market, the substantial increase in profits from Investment Management together with the profit improvement in Continental Europe were the principal contributors to that increase.
Business developmentOver the last 10 years the global real estate market has been characterised by significant cross-border flows of capital and multi-national occupier requirements. The property services industry has seen a degree of consolidation as organisations have sought to rebalance their portfolio of services, grow into new markets or take advantage of weakness in the competition. During this period we have built the business around our core strategy of servicing investor and occupier requirements in the world’s key locations and maintaining a differentiated position from the competition, based around the quality of our property intelligence and the capability of our organisation to add value in both the commercial and residential markets.
Savills strategy is to be a leading advisor in the key markets in which we operate. Our global strategy is delivered locally by our experts on the ground with flexibility to adapt quickly to changes in circumstances and opportunities. They are supported by our regional and cross-border investment and occupier service specialists. Over the last few years we
have acquired a number of complementary businesses and added teams and individual hires to our strong core business. During 2015, we continued to build on the 2014 acquisition of Savills Studley with a number of transactions in the US and the acquisition of our first operation in Canada. In Asia Pacific, we acquired a significant interest in our first operation in Malaysia, a Residential business in Sydney and established our first occupier focused business in India.
We also focused on building our longer term management businesses with the acquisition of Smiths Gore, a long-established leading firm in rural and estate management in the UK, property management businesses in London and Singapore, and the SEB investment management business based in Frankfurt and Singapore.
BoardOn 26 January we announced that I would retire as Chairman at the forthcoming Annual General Meeting in May and that Nicholas Ferguson would succeed me. During this year we have reviewed the composition of the Board and, in addition to Nicholas’ appointment, we have also appointed Rupert Robson as non-executive Director and Chair of the Remuneration Committee and, in succession to Martin Angle, Liz Hewitt as Chair of the Audit Committee. Having served on the Board for 10 years, latterly as Senior Independent Director, Martin will also retire at the conclusion of the AGM. I thank him for his enormous contribution over the years and his particular support last year in respect of the Board review process and Chairman succession.
Tim Freshwater will become Senior Independent Director on Martin’s retirement.
DividendsAn initial interim dividend of 4.0p per share (2014: 3.75p) amounting to £5.3m was paid on 12 October 2015, and a final ordinary dividend of 8.0p (2014: 7.25p) is recommended, making the ordinary dividend 12.0p for the year (2014: 11.0p). In addition, a supplemental interim dividend of 14.0p (2014: 12p) is declared, based upon the underlying performance of our Transaction Advisory business. Taken together, the ordinary and supplemental dividends comprise an aggregate distribution for the year of 26.0p per share, representing an increase of 13% on the 2014 aggregate dividend of 23.0p. The final ordinary dividend of 8.0p per ordinary share will, subject to shareholders’ approval at the Annual General Meeting on 11 May 2016, be paid alongside the supplemental interim dividend of 14.0p per share on 16 May 2016 to shareholders on the register at 15 April 2016.
PeopleI would like to express my thanks to all our staff worldwide for their hard work, commitment and continued focus on client service, enabling the Group to deliver this record performance in 2015. I retire knowing that Savills is in very capable hands.
OutlookWe have made a good start to 2016 with a solid pipeline of business carried over from last year in many markets, although the impact of global macro-economic and political concerns on real estate markets worldwide is uncertain. At this stage, we retain a cautious view on some Asian markets, particularly the Tier 2 Chinese cities, and we expect the UK residential and commercial investment markets to be subdued, for the former, as Stamp Duty reforms take effect, and more generally in the run-up to the EU referendum in June. However, the strength of our enlarged US operation, the increased size of our Investment Management, Property Management and Consultancy businesses and the breadth of our UK business together with further improvement in Continental Europe, all bode well for the future of your Company. Accordingly, the Board’s expectations for the year as a whole remain unchanged.
Peter SmithChairman
Overview
/ Stra
teg
y / Perform
ance / Governance / Financial statem
ents
SAVILLS PLC REPORT AND ACCOUNTS 2015 11
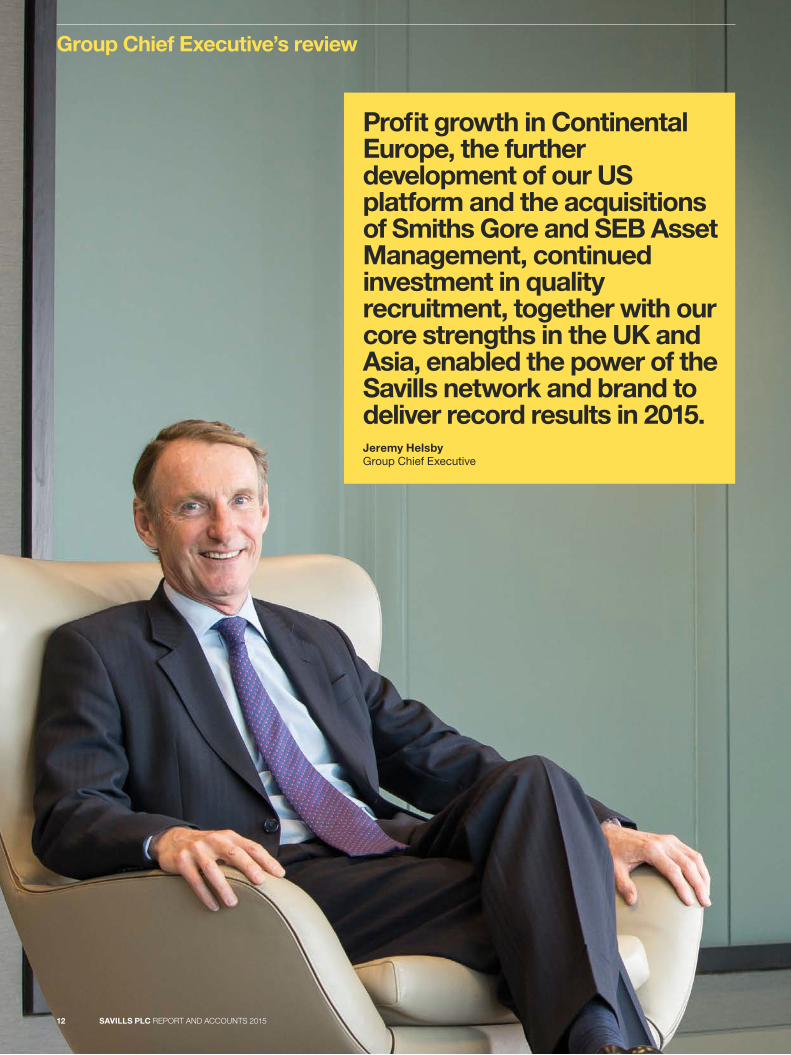
Group Chief Executive’s review
Profit growth in Continental Europe, the further development of our US platform and the acquisitions of Smiths Gore and SEB Asset Management, continued investment in quality recruitment, together with our core strengths in the UK and Asia, enabled the power of the Savills network and brand to deliver record results in 2015.Jeremy HelsbyGroup Chief Executive
SAVILLS PLC REPORT AND ACCOUNTS 201512
Our strategy Our strategy is to deliver value as a leading adviser to private, institutional and corporate clients seeking to occupy, acquire, manage, lease, develop or realise the value of prime residential and commercial property in the world’s key locations. The key components of our business strategy are as follows:
1. Commitment to clients – we aim to deliver the highest standards of client service through motivated and high calibre people
2. Business diversification
3. Geographical diversification
4. Maintain financial strength
5. Strength in both prime residential and commercial property
Key operating highlightsThe strength of our key commercial market positions and the resilience of our residential businesses underpinned an improved performance for Savills in 2015. – Transaction Advisory revenues up 25% driven by the contribution
from Savills Studley in the US, continued recovery in Continental European markets, market share gains in Asia and a strong performance in the UK
– Record revenue in the UK on the back of continued strength of commercial markets despite weaker Residential performance
– Growth in profits in Continental Europe following improved market conditions and the benefit of management actions taken in recent years
– Further growth from non-transactional services with Consultancy revenue up 6% and Property Management revenue up 15%, with the UK acquisition of Smiths Gore contributing to this increase
– Savills Investment Management more than doubled profits and AUM with the acquisition of SEB Asset Management
As anticipated, we experienced quieter market conditions in certain markets worldwide including Singapore, Taiwan, Japan and Tier 2 cities in China, but improved trading conditions in markets elsewhere including Australia, Tier 1 Chinese cities, Vietnam and Korea which together with the effect of increased market share in Hong Kong, counter-balanced the shortfall.
The US business, enhanced by a number of bolt-on acquisitions by Savills Studley, delivered good growth. Savills Investment Management (formerly ‘Cordea Savills’) achieved a significant change in scale with the acquisition in Germany of SEB Asset Management in August 2015. This was reflected in underlying profit growth of over 145% and AUM growing to €17.1bn (2014: €7.2bn). Continued recovery in Continental Europe saw the business increase profits substantially.
Overall the Group increased underlying profit by 21% to £121.4m (2014: £100.5m).
On a statutory basis, profit before tax increased 16% to £98.6m (2014: £84.7m).
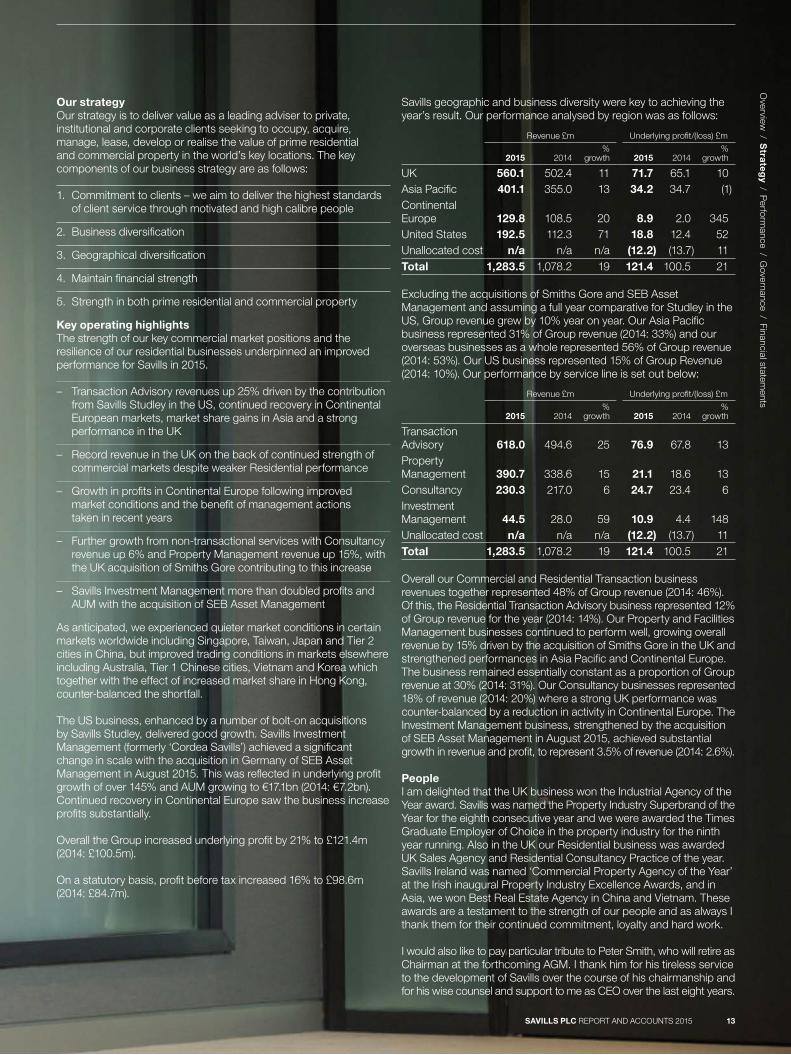
Savills geographic and business diversity were key to achieving the year’s result. Our performance analysed by region was as follows:
Revenue £m Underlying profit/(loss) £m
2015 2014%
growth 2015 2014%
growth
UK 560.1 502.4 11 71.7 65.1 10Asia Pacific 401.1 355.0 13 34.2 34.7 (1)Continental Europe 129.8 108.5 20 8.9 2.0 345United States 192.5 112.3 71 18.8 12.4 52Unallocated cost n/a n/a n/a (12.2) (13.7) 11Total 1,283.5 1,078.2 19 121.4 100.5 21
Excluding the acquisitions of Smiths Gore and SEB Asset Management and assuming a full year comparative for Studley in the US, Group revenue grew by 10% year on year. Our Asia Pacific business represented 31% of Group revenue (2014: 33%) and our overseas businesses as a whole represented 56% of Group revenue (2014: 53%). Our US business represented 15% of Group Revenue (2014: 10%). Our performance by service line is set out below:
Revenue £m Underlying profit/(loss) £m
2015 2014%
growth 2015 2014%
growth
Transaction Advisory 618.0 494.6 25 76.9 67.8 13Property Management 390.7 338.6 15 21.1 18.6 13Consultancy 230.3 217.0 6 24.7 23.4 6Investment Management 44.5 28.0 59 10.9 4.4 148Unallocated cost n/a n/a n/a (12.2) (13.7) 11Total 1,283.5 1,078.2 19 121.4 100.5 21
Overall our Commercial and Residential Transaction business revenues together represented 48% of Group revenue (2014: 46%). Of this, the Residential Transaction Advisory business represented 12% of Group revenue for the year (2014: 14%). Our Property and Facilities Management businesses continued to perform well, growing overall revenue by 15% driven by the acquisition of Smiths Gore in the UK and strengthened performances in Asia Pacific and Continental Europe. The business remained essentially constant as a proportion of Group revenue at 30% (2014: 31%). Our Consultancy businesses represented 18% of revenue (2014: 20%) where a strong UK performance was counter-balanced by a reduction in activity in Continental Europe. The Investment Management business, strengthened by the acquisition of SEB Asset Management in August 2015, achieved substantial growth in revenue and profit, to represent 3.5% of revenue (2014: 2.6%).
PeopleI am delighted that the UK business won the Industrial Agency of the Year award. Savills was named the Property Industry Superbrand of the Year for the eighth consecutive year and we were awarded the Times Graduate Employer of Choice in the property industry for the ninth year running. Also in the UK our Residential business was awarded UK Sales Agency and Residential Consultancy Practice of the year. Savills Ireland was named ‘Commercial Property Agency of the Year’ at the Irish inaugural Property Industry Excellence Awards, and in Asia, we won Best Real Estate Agency in China and Vietnam. These awards are a testament to the strength of our people and as always I thank them for their continued commitment, loyalty and hard work.
I would also like to pay particular tribute to Peter Smith, who will retire as Chairman at the forthcoming AGM. I thank him for his tireless service to the development of Savills over the course of his chairmanship and for his wise counsel and support to me as CEO over the last eight years.
Overview
/ Stra
teg
y / Perform
ance / Governance / Financial statem
ents
SAVILLS PLC REPORT AND ACCOUNTS 2015 13
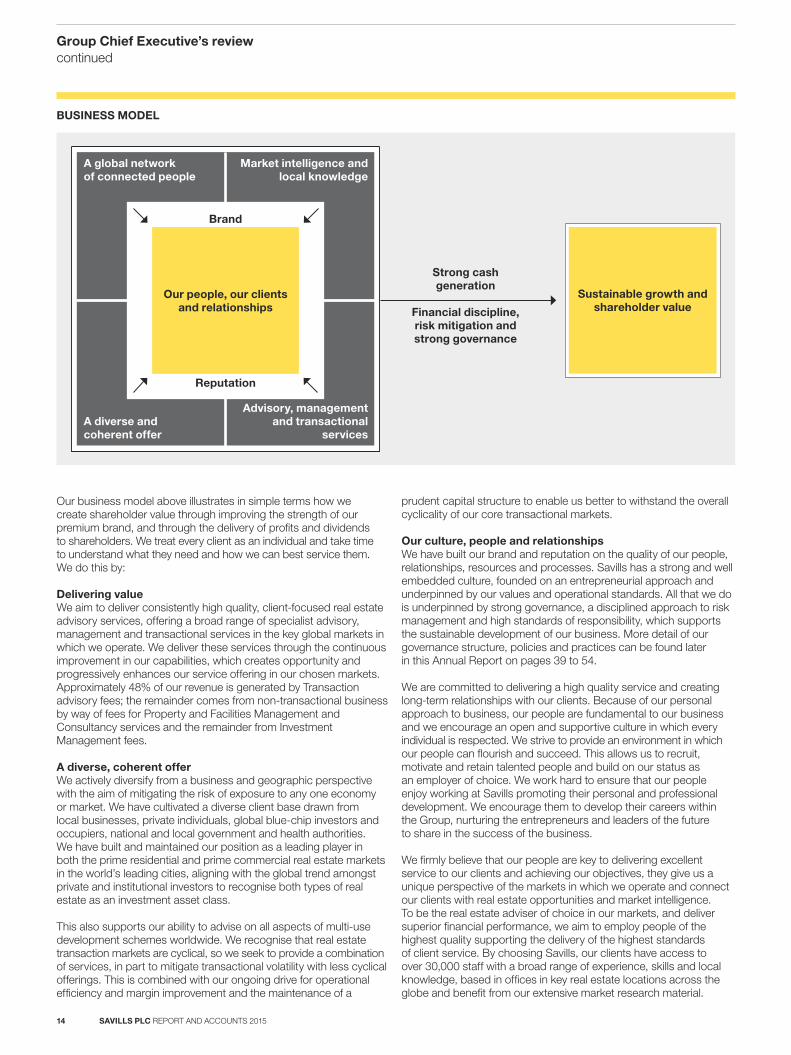
A global network of connected people
A diverse and coherent offer
Market intelligence and local knowledge
Advisory, management and transactional
services
Our people, our clients and relationships
Strong cash generation
Financial discipline, risk mitigation and strong governance
Brand
Reputation
Sustainable growth and shareholder value
Our business model above illustrates in simple terms how we create shareholder value through improving the strength of our premium brand, and through the delivery of profits and dividends to shareholders. We treat every client as an individual and take time to understand what they need and how we can best service them. We do this by:
Delivering valueWe aim to deliver consistently high quality, client-focused real estate advisory services, offering a broad range of specialist advisory, management and transactional services in the key global markets in which we operate. We deliver these services through the continuous improvement in our capabilities, which creates opportunity and progressively enhances our service offering in our chosen markets. Approximately 48% of our revenue is generated by Transaction advisory fees; the remainder comes from non-transactional business by way of fees for Property and Facilities Management and Consultancy services and the remainder from Investment Management fees.
A diverse, coherent offerWe actively diversify from a business and geographic perspective with the aim of mitigating the risk of exposure to any one economy or market. We have cultivated a diverse client base drawn from local businesses, private individuals, global blue-chip investors and occupiers, national and local government and health authorities. We have built and maintained our position as a leading player in both the prime residential and prime commercial real estate markets in the world’s leading cities, aligning with the global trend amongst private and institutional investors to recognise both types of real estate as an investment asset class.
This also supports our ability to advise on all aspects of multi-use development schemes worldwide. We recognise that real estate transaction markets are cyclical, so we seek to provide a combination of services, in part to mitigate transactional volatility with less cyclical offerings. This is combined with our ongoing drive for operational efficiency and margin improvement and the maintenance of a
prudent capital structure to enable us better to withstand the overall cyclicality of our core transactional markets.
Our culture, people and relationshipsWe have built our brand and reputation on the quality of our people, relationships, resources and processes. Savills has a strong and well embedded culture, founded on an entrepreneurial approach and underpinned by our values and operational standards. All that we do is underpinned by strong governance, a disciplined approach to risk management and high standards of responsibility, which supports the sustainable development of our business. More detail of our governance structure, policies and practices can be found later in this Annual Report on pages 39 to 54.
We are committed to delivering a high quality service and creating long-term relationships with our clients. Because of our personal approach to business, our people are fundamental to our business and we encourage an open and supportive culture in which every individual is respected. We strive to provide an environment in which our people can flourish and succeed. This allows us to recruit, motivate and retain talented people and build on our status as an employer of choice. We work hard to ensure that our people enjoy working at Savills promoting their personal and professional development. We encourage them to develop their careers within the Group, nurturing the entrepreneurs and leaders of the future to share in the success of the business.
We firmly believe that our people are key to delivering excellent service to our clients and achieving our objectives, they give us a unique perspective of the markets in which we operate and connect our clients with real estate opportunities and market intelligence. To be the real estate adviser of choice in our markets, and deliver superior financial performance, we aim to employ people of the highest quality supporting the delivery of the highest standards of client service. By choosing Savills, our clients have access to over 30,000 staff with a broad range of experience, skills and local knowledge, based in offices in key real estate locations across the globe and benefit from our extensive market research material.
BUSINESS MODEL
Group Chief Executive’s reviewcontinued
SAVILLS PLC REPORT AND ACCOUNTS 201514
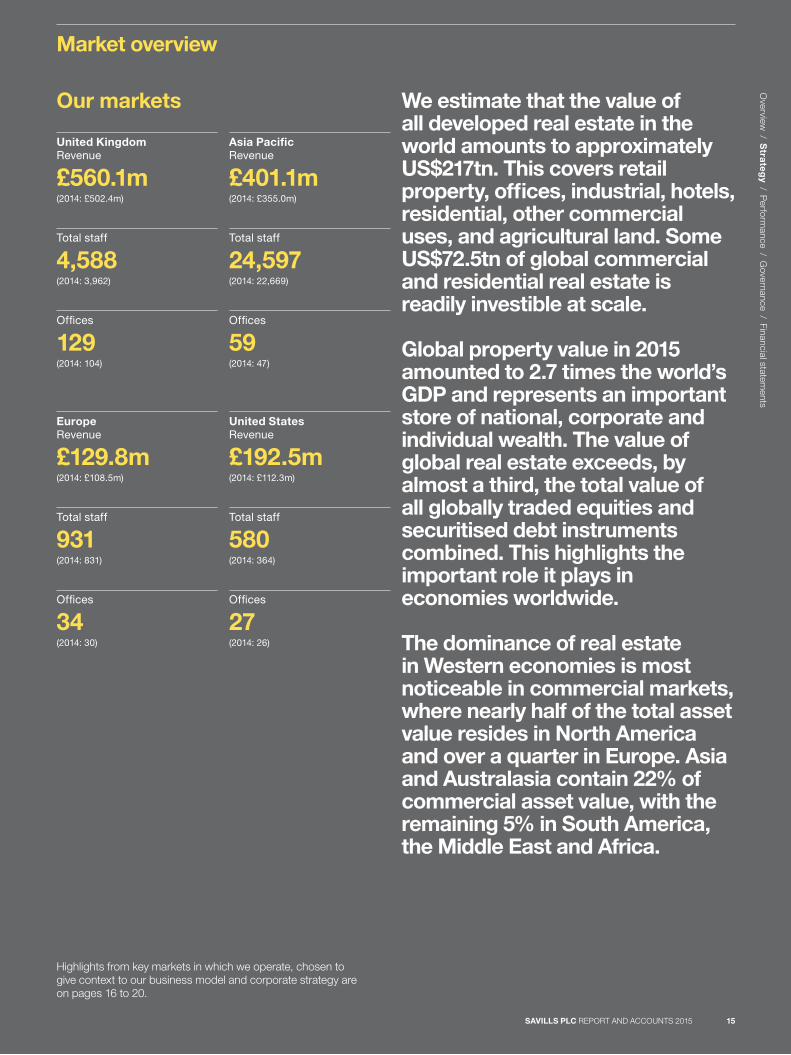
We estimate that the value of all developed real estate in the world amounts to approximately US$217tn. This covers retail property, offices, industrial, hotels, residential, other commercial uses, and agricultural land. Some US$72.5tn of global commercial and residential real estate is readily investible at scale.
Global property value in 2015 amounted to 2.7 times the world’s GDP and represents an important store of national, corporate and individual wealth. The value of global real estate exceeds, by almost a third, the total value of all globally traded equities and securitised debt instruments combined. This highlights the important role it plays in economies worldwide.
The dominance of real estate in Western economies is most noticeable in commercial markets, where nearly half of the total asset value resides in North America and over a quarter in Europe. Asia and Australasia contain 22% of commercial asset value, with the remaining 5% in South America, the Middle East and Africa.
Highlights from key markets in which we operate, chosen to give context to our business model and corporate strategy are on pages 16 to 20.
United Kingdom Revenue
£560.1m(2014: £502.4m)
Total staff
4,588(2014: 3,962)
Offices
129(2014: 104)
EuropeRevenue
£129.8m(2014: £108.5m)
Total staff
931(2014: 831)
Offices
34(2014: 30)
Asia PacificRevenue
£401.1m(2014: £355.0m)
Total staff
24,597(2014: 22,669)
Offices
59(2014: 47)
United StatesRevenue
£192.5m(2014: £112.3m)
Total staff
580(2014: 364)
Offices
27(2014: 26)
Market overview
Our markets
Overview
/ Stra
teg
y / Perform
ance / Governance / Financial statem
ents
SAVILLS PLC REPORT AND ACCOUNTS 2015 15
Market overviewcontinued
UK
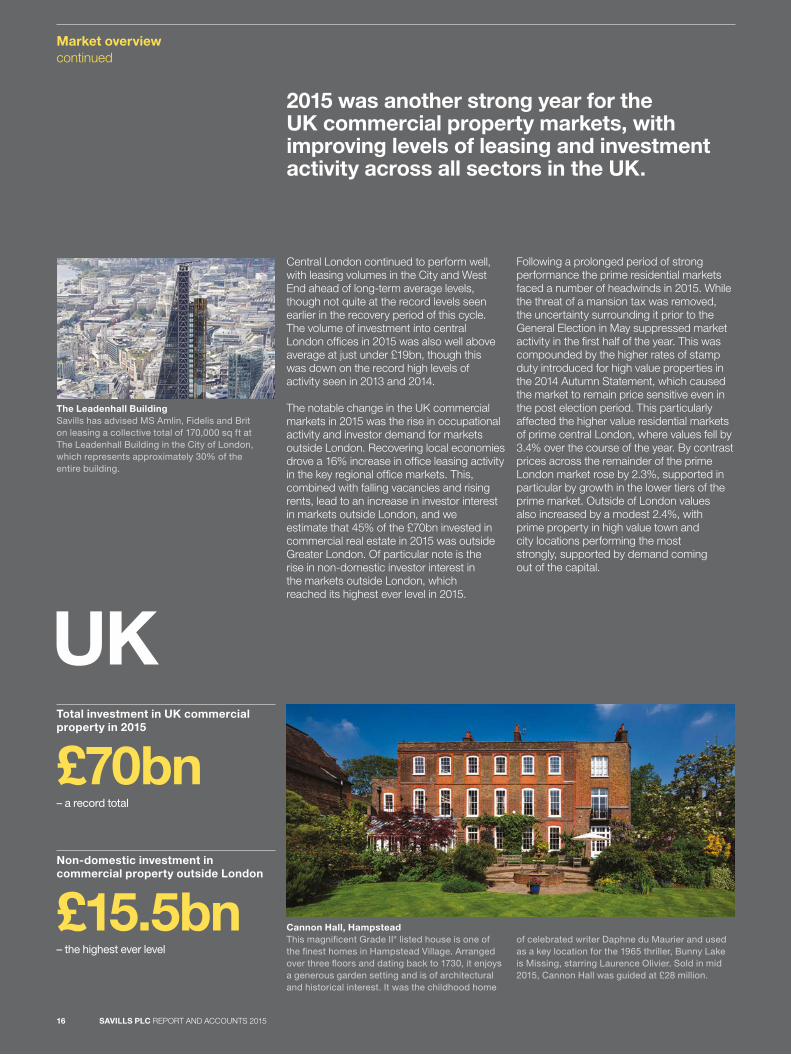
2015 was another strong year for the UK commercial property markets, with improving levels of leasing and investment activity across all sectors in the UK.
Central London continued to perform well, with leasing volumes in the City and West End ahead of long-term average levels, though not quite at the record levels seen earlier in the recovery period of this cycle. The volume of investment into central London offices in 2015 was also well above average at just under £19bn, though this was down on the record high levels of activity seen in 2013 and 2014.
The notable change in the UK commercial markets in 2015 was the rise in occupational activity and investor demand for markets outside London. Recovering local economies drove a 16% increase in office leasing activity in the key regional office markets. This, combined with falling vacancies and rising rents, lead to an increase in investor interest in markets outside London, and we estimate that 45% of the £70bn invested in commercial real estate in 2015 was outside Greater London. Of particular note is the rise in non-domestic investor interest in the markets outside London, which reached its highest ever level in 2015.
Following a prolonged period of strong performance the prime residential markets faced a number of headwinds in 2015. While the threat of a mansion tax was removed, the uncertainty surrounding it prior to the General Election in May suppressed market activity in the first half of the year. This was compounded by the higher rates of stamp duty introduced for high value properties in the 2014 Autumn Statement, which caused the market to remain price sensitive even in the post election period. This particularly affected the higher value residential markets of prime central London, where values fell by 3.4% over the course of the year. By contrast prices across the remainder of the prime London market rose by 2.3%, supported in particular by growth in the lower tiers of the prime market. Outside of London values also increased by a modest 2.4%, with prime property in high value town and city locations performing the most strongly, supported by demand coming out of the capital.
Cannon Hall, HampsteadThis magnificent Grade II* listed house is one of the finest homes in Hampstead Village. Arranged over three floors and dating back to 1730, it enjoys a generous garden setting and is of architectural and historical interest. It was the childhood home
of celebrated writer Daphne du Maurier and used as a key location for the 1965 thriller, Bunny Lake is Missing, starring Laurence Olivier. Sold in mid 2015, Cannon Hall was guided at £28 million.
Total investment in UK commercial property in 2015
£70bn– a record total
Non-domestic investment in commercial property outside London
£15.5bn– the highest ever level
The Leadenhall Building Savills has advised MS Amlin, Fidelis and Brit on leasing a collective total of 170,000 sq ft at The Leadenhall Building in the City of London, which represents approximately 30% of the entire building.
SAVILLS PLC REPORT AND ACCOUNTS 201516
12
3
7
4 6
8
5
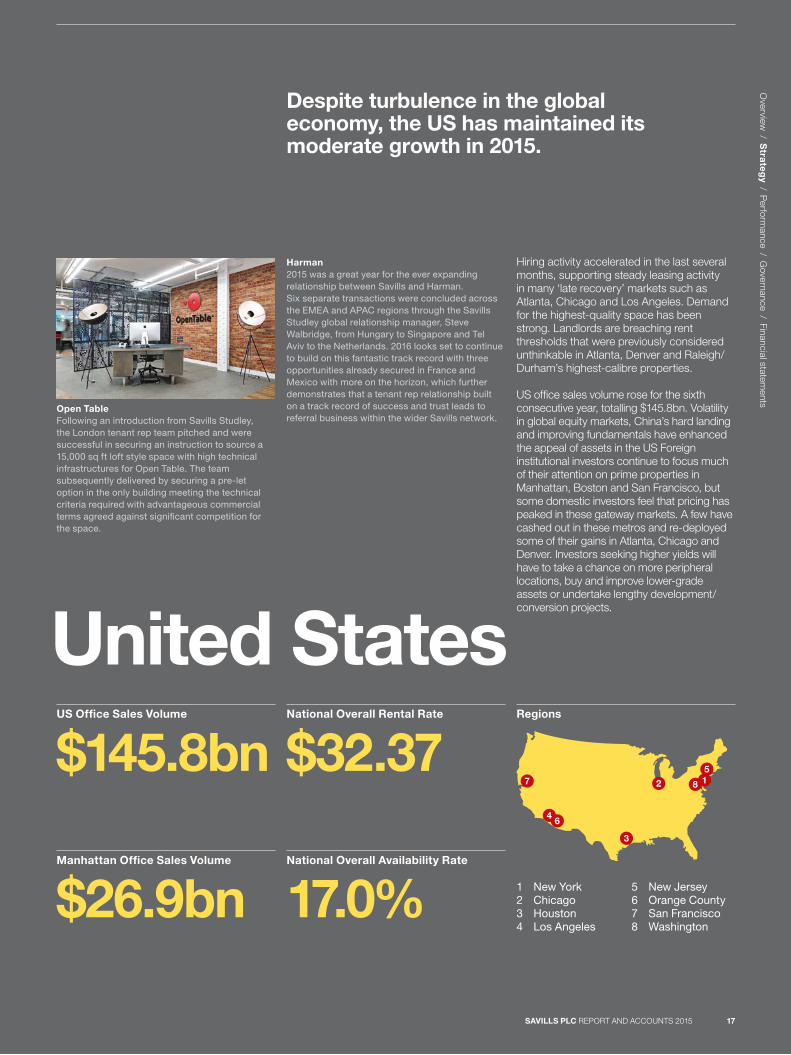
Despite turbulence in the global economy, the US has maintained its moderate growth in 2015.
Hiring activity accelerated in the last several months, supporting steady leasing activity in many ‘late recovery’ markets such as Atlanta, Chicago and Los Angeles. Demand for the highest-quality space has been strong. Landlords are breaching rent thresholds that were previously considered unthinkable in Atlanta, Denver and Raleigh/Durham’s highest-calibre properties.
US office sales volume rose for the sixth consecutive year, totalling $145.8bn. Volatility in global equity markets, China’s hard landing and improving fundamentals have enhanced the appeal of assets in the US Foreign institutional investors continue to focus much of their attention on prime properties in Manhattan, Boston and San Francisco, but some domestic investors feel that pricing has peaked in these gateway markets. A few have cashed out in these metros and re-deployed some of their gains in Atlanta, Chicago and Denver. Investors seeking higher yields will have to take a chance on more peripheral locations, buy and improve lower-grade assets or undertake lengthy development/conversion projects.
United StatesUS Office Sales Volume
$145.8bnNational Overall Rental Rate
$32.37
Manhattan Office Sales Volume
$26.9bnNational Overall Availability Rate
17.0% 1 New York 2 Chicago 3 Houston 4 Los Angeles
5 New Jersey 6 Orange County 7 San Francisco8 Washington
Regions
Open TableFollowing an introduction from Savills Studley, the London tenant rep team pitched and were successful in securing an instruction to source a 15,000 sq ft loft style space with high technical infrastructures for Open Table. The team subsequently delivered by securing a pre-let option in the only building meeting the technical criteria required with advantageous commercial terms agreed against significant competition for the space.
Harman2015 was a great year for the ever expanding relationship between Savills and Harman. Six separate transactions were concluded across the EMEA and APAC regions through the Savills Studley global relationship manager, Steve Walbridge, from Hungary to Singapore and Tel Aviv to the Netherlands. 2016 looks set to continue to build on this fantastic track record with three opportunities already secured in France and Mexico with more on the horizon, which further demonstrates that a tenant rep relationship built on a track record of success and trust leads to referral business within the wider Savills network.
Overview
/ Stra
teg
y / Perform
ance / Governance / Financial statem
ents
SAVILLS PLC REPORT AND ACCOUNTS 2015 17
23
1
7 105
6
9
8
4
11
Market overviewcontinued
Asia Pacific
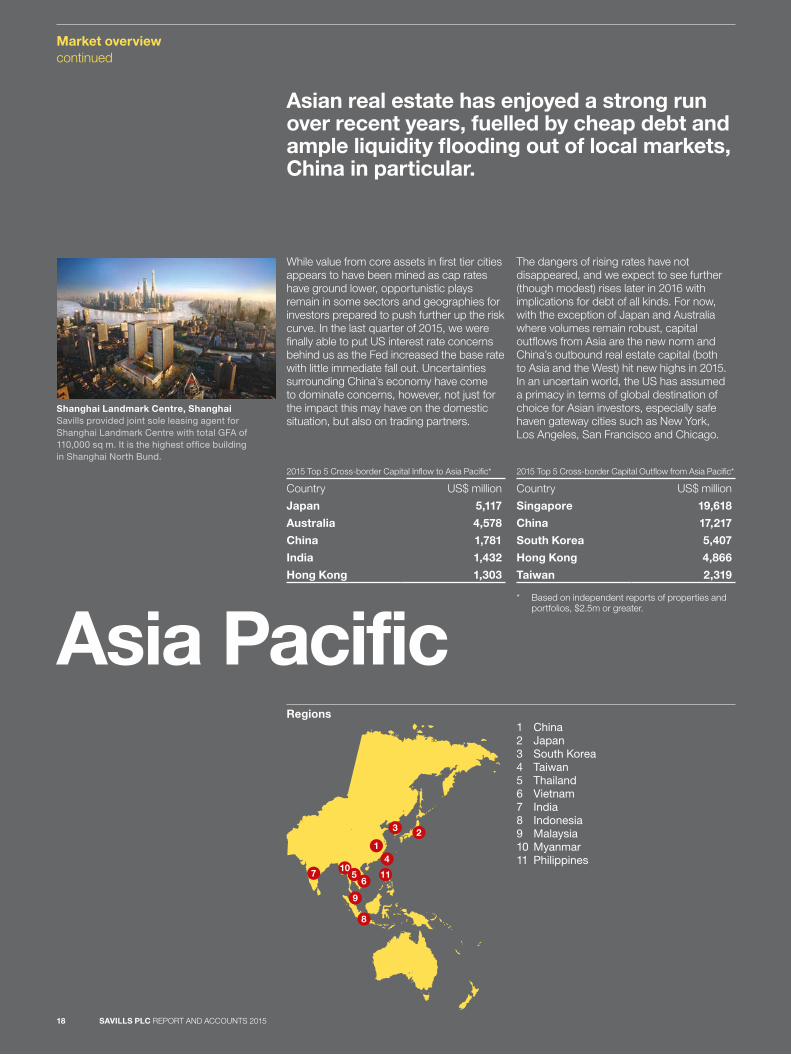
Asian real estate has enjoyed a strong run over recent years, fuelled by cheap debt and ample liquidity flooding out of local markets, China in particular.
While value from core assets in first tier cities appears to have been mined as cap rates have ground lower, opportunistic plays remain in some sectors and geographies for investors prepared to push further up the risk curve. In the last quarter of 2015, we were finally able to put US interest rate concerns behind us as the Fed increased the base rate with little immediate fall out. Uncertainties surrounding China’s economy have come to dominate concerns, however, not just for the impact this may have on the domestic situation, but also on trading partners.
The dangers of rising rates have not disappeared, and we expect to see further (though modest) rises later in 2016 with implications for debt of all kinds. For now, with the exception of Japan and Australia where volumes remain robust, capital outflows from Asia are the new norm and China’s outbound real estate capital (both to Asia and the West) hit new highs in 2015. In an uncertain world, the US has assumed a primacy in terms of global destination of choice for Asian investors, especially safe haven gateway cities such as New York, Los Angeles, San Francisco and Chicago.
Shanghai Landmark Centre, ShanghaiSavills provided joint sole leasing agent for Shanghai Landmark Centre with total GFA of 110,000 sq m. It is the highest office building in Shanghai North Bund.
1 China2 Japan3 South Korea4 Taiwan5 Thailand6 Vietnam7 India8 Indonesia9 Malaysia10 Myanmar 11 Philippines
Regions
2015 Top 5 Cross-border Capital Inflow to Asia Pacific*
Country US$ million
Japan 5,117
Australia 4,578
China 1,781
India 1,432
Hong Kong 1,303
2015 Top 5 Cross-border Capital Outflow from Asia Pacific*
Country US$ million
Singapore 19,618
China 17,217
South Korea 5,407
Hong Kong 4,866
Taiwan 2,319
* Based on independent reports of properties and portfolios, $2.5m or greater.
SAVILLS PLC REPORT AND ACCOUNTS 201518
17
8
23
46
9
10
5
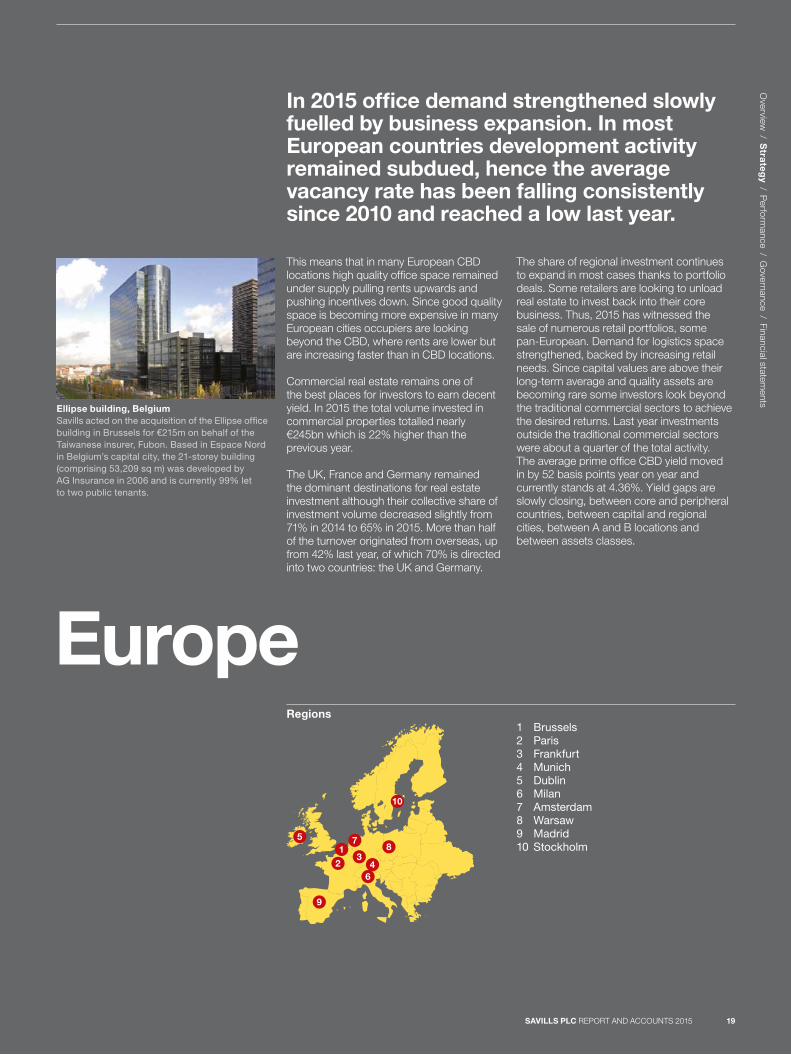
In 2015 office demand strengthened slowly fuelled by business expansion. In most European countries development activity remained subdued, hence the average vacancy rate has been falling consistently since 2010 and reached a low last year.
This means that in many European CBD locations high quality office space remained under supply pulling rents upwards and pushing incentives down. Since good quality space is becoming more expensive in many European cities occupiers are looking beyond the CBD, where rents are lower but are increasing faster than in CBD locations. Commercial real estate remains one of the best places for investors to earn decent yield. In 2015 the total volume invested in commercial properties totalled nearly €245bn which is 22% higher than the previous year.
The UK, France and Germany remained the dominant destinations for real estate investment although their collective share of investment volume decreased slightly from 71% in 2014 to 65% in 2015. More than half of the turnover originated from overseas, up from 42% last year, of which 70% is directed into two countries: the UK and Germany.
The share of regional investment continues to expand in most cases thanks to portfolio deals. Some retailers are looking to unload real estate to invest back into their core business. Thus, 2015 has witnessed the sale of numerous retail portfolios, some pan-European. Demand for logistics space strengthened, backed by increasing retail needs. Since capital values are above their long-term average and quality assets are becoming rare some investors look beyond the traditional commercial sectors to achieve the desired returns. Last year investments outside the traditional commercial sectors were about a quarter of the total activity. The average prime office CBD yield moved in by 52 basis points year on year and currently stands at 4.36%. Yield gaps are slowly closing, between core and peripheral countries, between capital and regional cities, between A and B locations and between assets classes.
Europe
Ellipse building, BelgiumSavills acted on the acquisition of the Ellipse office building in Brussels for €215m on behalf of the Taiwanese insurer, Fubon. Based in Espace Nord in Belgium’s capital city, the 21-storey building (comprising 53,209 sq m) was developed by AG Insurance in 2006 and is currently 99% let to two public tenants.
Regions1 Brussels2 Paris3 Frankfurt4 Munich5 Dublin6 Milan7 Amsterdam8 Warsaw9 Madrid10 Stockholm
Overview
/ Stra
teg
y / Perform
ance / Governance / Financial statem
ents
SAVILLS PLC REPORT AND ACCOUNTS 2015 19
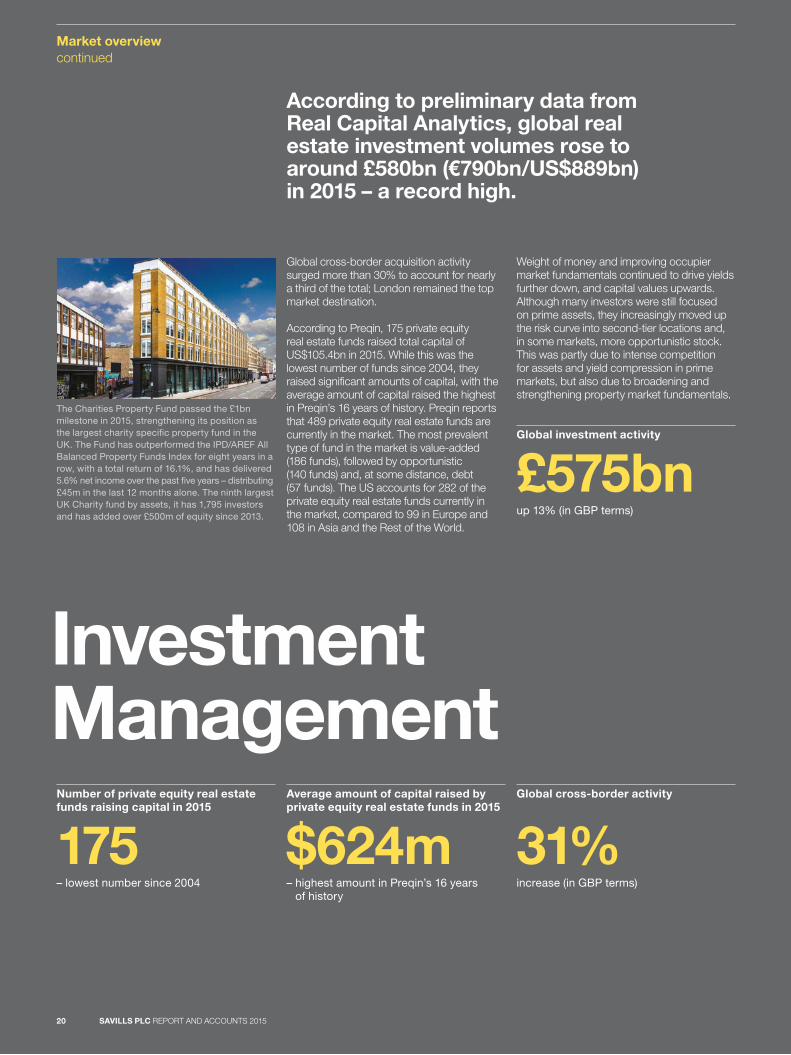
The Charities Property Fund passed the £1bn milestone in 2015, strengthening its position as the largest charity specific property fund in the UK. The Fund has outperformed the IPD/AREF All Balanced Property Funds Index for eight years in a row, with a total return of 16.1%, and has delivered 5.6% net income over the past five years – distributing £45m in the last 12 months alone. The ninth largest UK Charity fund by assets, it has 1,795 investors and has added over £500m of equity since 2013.
Market overviewcontinued
InvestmentManagement
Global cross-border acquisition activity surged more than 30% to account for nearly a third of the total; London remained the top market destination.
According to Preqin, 175 private equity real estate funds raised total capital of US$105.4bn in 2015. While this was the lowest number of funds since 2004, they raised significant amounts of capital, with the average amount of capital raised the highest in Preqin’s 16 years of history. Preqin reports that 489 private equity real estate funds are currently in the market. The most prevalent type of fund in the market is value-added (186 funds), followed by opportunistic (140 funds) and, at some distance, debt (57 funds). The US accounts for 282 of the private equity real estate funds currently in the market, compared to 99 in Europe and 108 in Asia and the Rest of the World.
Weight of money and improving occupier market fundamentals continued to drive yields further down, and capital values upwards. Although many investors were still focused on prime assets, they increasingly moved up the risk curve into second-tier locations and, in some markets, more opportunistic stock. This was partly due to intense competition for assets and yield compression in prime markets, but also due to broadening and strengthening property market fundamentals.
According to preliminary data from Real Capital Analytics, global real estate investment volumes rose to around £580bn (€790bn/US$889bn) in 2015 – a record high.
Number of private equity real estate funds raising capital in 2015
175– lowest number since 2004
Global investment activity
£575bnup 13% (in GBP terms)
Global cross-border activity
31%increase (in GBP terms)
Average amount of capital raised by private equity real estate funds in 2015
$624m– highest amount in Preqin’s 16 years
of history
SAVILLS PLC REPORT AND ACCOUNTS 201520
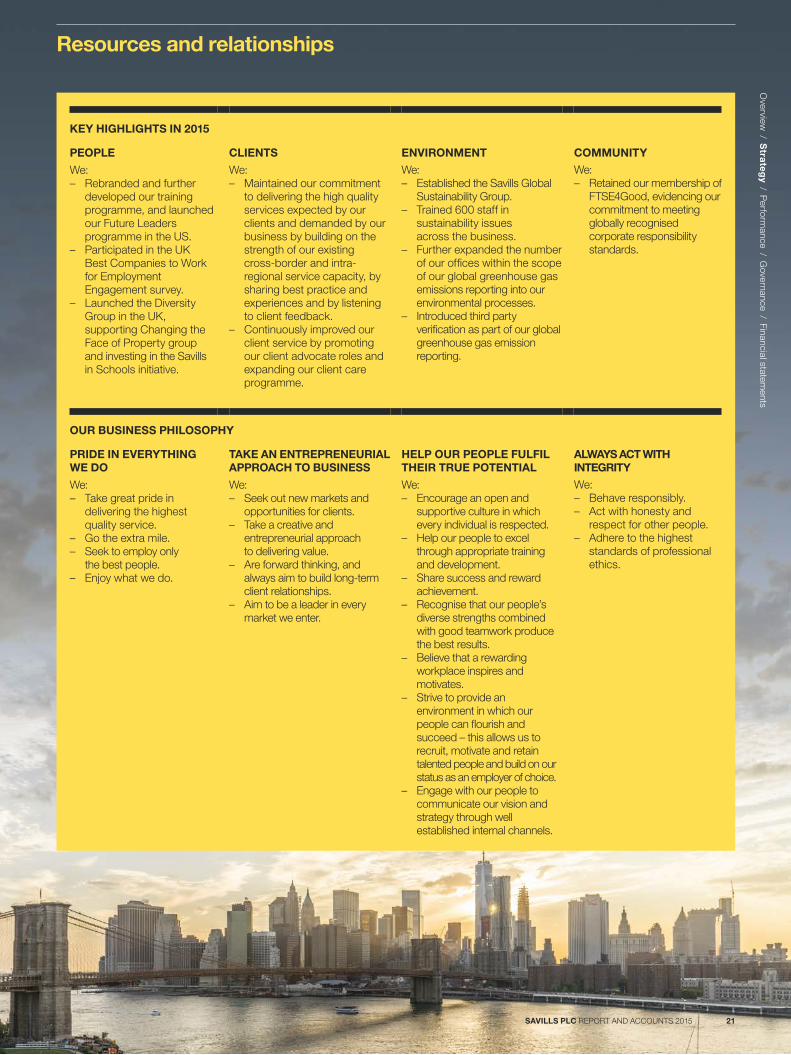
KEY HIGHLIGHTS IN 2015
PEOPLE CLIENTS ENVIRONMENT COMMUNITY
We: – Rebranded and further
developed our training programme, and launched our Future Leaders programme in the US.
– Participated in the UK Best Companies to Work for Employment Engagement survey.
– Launched the Diversity Group in the UK, supporting Changing the Face of Property group and investing in the Savills in Schools initiative.
We: – Maintained our commitment
to delivering the high quality services expected by our clients and demanded by our business by building on the strength of our existing cross-border and intra-regional service capacity, by sharing best practice and experiences and by listening to client feedback.
– Continuously improved our client service by promoting our client advocate roles and expanding our client care programme.
We: – Established the Savills Global
Sustainability Group. – Trained 600 staff in
sustainability issues across the business.
– Further expanded the number of our offices within the scope of our global greenhouse gas emissions reporting into our environmental processes.
– Introduced third party verification as part of our global greenhouse gas emission reporting.
We: – Retained our membership of
FTSE4Good, evidencing our commitment to meeting globally recognised corporate responsibility standards.
OUR BUSINESS PHILOSOPHY
PRIDE IN EVERYTHING WE DO
TAKE AN ENTREPRENEURIAL APPROACH TO BUSINESS
HELP OUR PEOPLE FULFIL THEIR TRUE POTENTIAL
ALWAYS ACT WITH INTEGRITY
We: – Take great pride in
delivering the highest quality service.
– Go the extra mile. – Seek to employ only
the best people. – Enjoy what we do.
We: – Seek out new markets and
opportunities for clients. – Take a creative and
entrepreneurial approach to delivering value.
– Are forward thinking, and always aim to build long-term client relationships.
– Aim to be a leader in every market we enter.
We: – Encourage an open and
supportive culture in which every individual is respected.
– Help our people to excel through appropriate training and development.
– Share success and reward achievement.
– Recognise that our people’s diverse strengths combined with good teamwork produce the best results.
– Believe that a rewarding workplace inspires and motivates.
– Strive to provide an environment in which our people can flourish and succeed – this allows us to recruit, motivate and retain talented people and build on our status as an employer of choice.
– Engage with our people to communicate our vision and strategy through well established internal channels.
We: – Behave responsibly. – Act with honesty and
respect for other people. – Adhere to the highest
standards of professional ethics.
Resources and relationshipsO
verview / S
trate
gy / P
erformance / G
overnance / Financial statements
SAVILLS PLC REPORT AND ACCOUNTS 2015 21
Resources and relationshipscontinued
PeopleThroughout this Report we refer to the importance of our people. They are key to our continued success. It is our vision to be the real estate adviser of choice in our selected markets and deliver superior financial performance and this can only be achieved through the dedication, commitment and excellence of our people.
Savills is committed to providing employment on an equal basis irrespective of gender, sexual orientation, marital or civil partner status, gender reassignment, race, nationality, ethnic or national origin, religion or belief, disability or age. We support the Core Conventions of the International Labour Organization.
Our people strategy remains focused on supporting delivery of the highest standards of client service through motivated and engaged people. We believe that a positive culture is essential to high quality client service. This positive culture is encapsulated in our business philosophy and our values. Our reputation has been built on our people and we believe that staff whose behaviours reflect in our business philosophy deliver the excellent client service that we strive to provide. Our business philosophy also captures our commitment to ethical, professional and responsible conduct and our entrepreneurial value-enhancing approach.
The following sections highlight our progress in the key areas behind our people strategy.
Increasing employee engagement In 2015 we asked our employees in the UK to participate in the Best Companies to Work for Employee Engagement survey, a people survey which allows us to measure and compare ourselves against other large organisations and helps to identify ways to improve how we do things. Over 400 companies and 540,000 employees participated. We have been recognised as reaching ‘One Star Status’, demonstrating our commitment to progressive and engaging employment practices. This year, we have focused on the areas highlighted for improvement and we intend to repeat the Best Companies Survey in 2016.
Developing our people for the long termWe want people to grow their careers at Savills and develop the skills and talent needed to grow our business. We firmly believe in the value of developing future talent from within the Group and the wider business community and we are working hard to help nurture the entrepreneurs and leaders of the future.
We continue to invest significantly in the development of all our people, for whom we recognise that career development and progression is very important. In the UK, we rebranded and restructured our training programme. We invested in a dedicated Training Suite at our City office and achieved our first award for our flagship course, Savills Raising the Bar. During the year, we also expanded our leadership programme to our European businesses.
Corporate responsibility at Savills Corporate responsibility (‘CR’) is our commitment to the positive impact that our business can make, through our people, to our stakeholders and the communities in which we live and work.
Overall responsibility for our CR programme sits with the Group Chief Executive and the Board. CR strategy is overseen by our CR Steering Group, comprising senior representatives from a range of businesses and central teams. CR strategy is implemented and delivered at country level across the four areas of CR which we believe are key to the success of our business and where we believe we can make the most difference: People, Clients, Environment and Community. By focusing on these key areas we give our businesses the freedom to adapt quickly and to respond at local level to new opportunities in the markets in which they operate. The Board receives annual and ad hoc updates on CR activities and progress. To ensure that we can readily identify emerging issues and respond to them on a timely basis, we continue to include the consideration of CR-related issues in our Key Risk Registers.
PolicySavills is committed to being a good corporate citizen in all aspects of its operations and activities. The Company, therefore, holds itself accountable for its social, environmental and economic impacts on the people and places where it does business. We endeavour to manage these impacts in a responsible and sustainable manner. To fulfil this aim the Group actively embraces a range of policies and practices that aim to foster a positive approach towards corporate responsibility as an integral part of our day to day activities.
Our CR policy focuses on those key areas where we believe we can make a difference. All of our businesses are expected to comply with local legal standards as an absolute minimum, while our established global framework provides the flexibility required to have meaning and impact at local level. At Savills, we learn through experience and we actively encourage our businesses to share their experiences and develop best practice to ensure that we continue to improve as an organisation.
The FTSE Group confirms that Savills plc has been independently assessed according to the FTSE4Good criteria, and has satisfied the requirements to remain a constituent of the FTSE4Good Index Series. Created by the global index company FTSE Group, FTSE4Good is an equity index series that is designed to facilitate investment in companies that meet globally recognised corporate responsibility standards. Companies in the FTSE4Good Index Series have met stringent environmental, social and governance criteria, and are positioned to capitalise on the benefits of responsible business practice.
BREEAM is a registered trademark of BRE (the Building Research Establishment Ltd. Community Trade Mark E5778551). The BREEAM marks, logos and symbols are the Copyright of BRE and are reproduced by permission.
SAVILLS PLC REPORT AND ACCOUNTS 201522
We now deliver training and development in all areas including management and leadership, client and business skills and professional and technical skills. We recognise that personal development occurs in many ways and we encourage all our staff to attend conferences, internal events, and participate in projects to supplement their Continuous Professional Development (‘CPD’). The format of our training varies from one-hour masterclasses, webinars, video content, to two-day pitching courses and management and leadership workshops. We encourage and support all our staff to complete their CPD and all our internal courses/programmes have CPD points associated with them. All of this is supported by a dedicated training team, who offer individual career development advice and a dedicated page on the Company intranet which pulls together all the information our people need to plan their personal development. We are progressively extending this programme across our regional businesses in Asia and the US, tailoring it as appropriate to best meet local requirements. In the US, we are committed to implementing a Young Leaders Programme, adopting a similar format to that of the UK.
Savills passionately believe that its graduates are the future leaders. Our graduates are given responsibility from the day they join the business, in teams who highly value their contribution, allowing them to be involved in some of the world’s most high-profile property deals and developments. Graduates are surrounded by experienced professionals and team members from whom they can seek advice and learn. Individual achievement is rewarded and Savills look for graduates with entrepreneurial flair. In the UK Savills were proud to be named The Times Graduate Employer of choice for Property for the 9th year in a row and we continue to see a record number of applicants for this, and our student summer scheme and work placement programmes. Our summer scheme also ranked number 11 in the UK in the Rate My Placement awards up from 32nd place in 2014.
We continue to work with some of our UK industry peers, the Changing the Face of Property (‘CTFOP’ group), on initiatives such as an apprenticeship programme to offer jobs to school leavers and other junior candidates without a university education.
Valuing diversitySavills is a global company and across all parts of our business we look to create an inclusive culture in which difference is accepted and valued. We believe that our ‘inclusive’ approach gives us a competitive advantage and underpins the success of our business by giving us the ability to select our employees from the highest quality individuals in the widest available pool of talent.
Our employees come from a wide range of backgrounds and have a diverse range of skills and experience. We have created a culture in which those skills, experience and perspectives are nurtured and encouraged.
At Savills, we have long realised that our reputation as a quality global real estate provider of choice is built on our people and that they are fundamental to the success of the business.
We believe that creating an inclusive and diverse culture supports the attraction and retention of talented people and supports effective performance. We respect our people for who they are, their knowledge, skills and experience as individuals and as valued members of the Savills team. We work together to bring out the best in each other and to sustain the strong working relationship ethic that has nurtured our ‘can do’ attitude. As at 31 December 2015 our total global workforce of 30,692 colleagues comprised 16,262 males and 14,430 females. Of these, 179 were senior executives (166 males, 13 females) comprising members of the Group Executive Board and Board members of the corporate entities whose financial information is incorporated in the Group’s 2015 consolidated accounts in this Annual Report. The Company’s Board of Directors comprised seven members, six males and one female.
Historically ours has been an industry which has struggled to recruit a high percentage of female graduates and we are encouraged that our graduate recruitment programme is helping to redress the balance at Savills where we have a 50/50 male to female ratio of graduates at entry.
Prior to any new appointment consideration is given to diversity in its broadest sense, with a view to appointing the best placed candidate for the role.
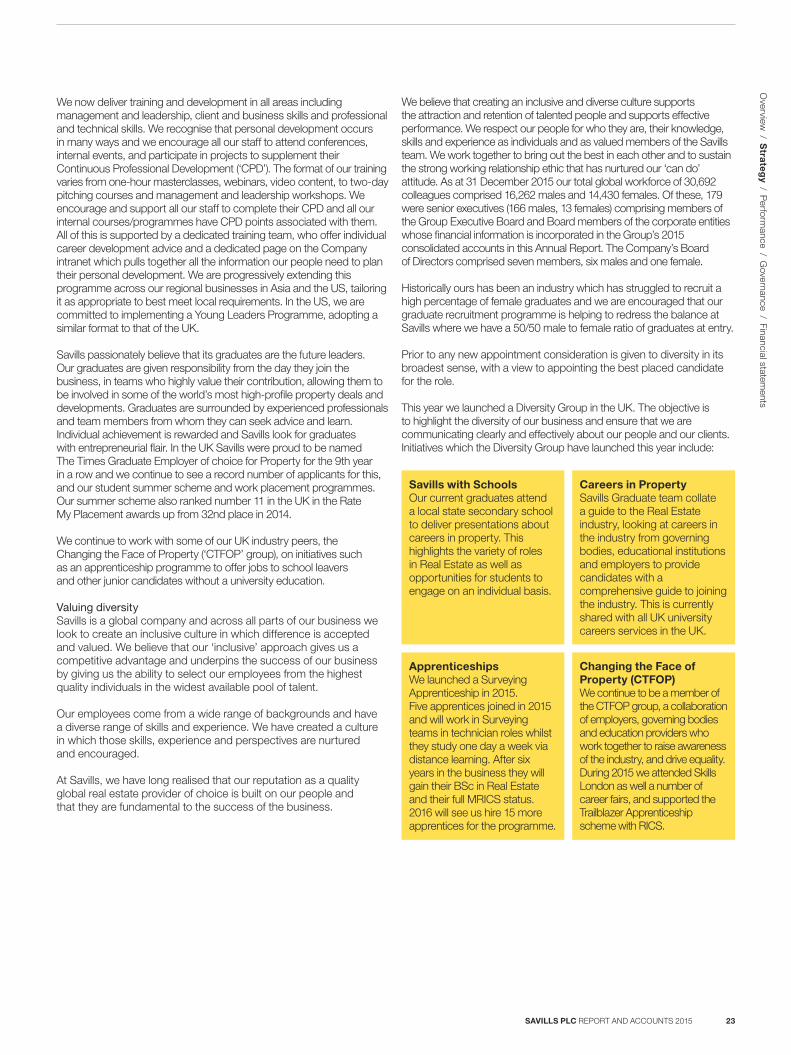
This year we launched a Diversity Group in the UK. The objective is to highlight the diversity of our business and ensure that we are communicating clearly and effectively about our people and our clients. Initiatives which the Diversity Group have launched this year include:
Savills with Schools Our current graduates attend a local state secondary school to deliver presentations about careers in property. This highlights the variety of roles in Real Estate as well as opportunities for students to engage on an individual basis.
Careers in PropertySavills Graduate team collate a guide to the Real Estate industry, looking at careers in the industry from governing bodies, educational institutions and employers to provide candidates with a comprehensive guide to joining the industry. This is currently shared with all UK university careers services in the UK.
ApprenticeshipsWe launched a Surveying Apprenticeship in 2015. Five apprentices joined in 2015 and will work in Surveying teams in technician roles whilst they study one day a week via distance learning. After six years in the business they will gain their BSc in Real Estate and their full MRICS status. 2016 will see us hire 15 more apprentices for the programme.
Changing the Face of Property (CTFOP)We continue to be a member of the CTFOP group, a collaboration of employers, governing bodies and education providers who work together to raise awareness of the industry, and drive equality. During 2015 we attended Skills London as well a number of career fairs, and supported the Trailblazer Apprenticeship scheme with RICS.
Overview
/ Stra
teg
y / Perform
ance / Governance / Financial statem
ents
SAVILLS PLC REPORT AND ACCOUNTS 2015 23
Resources and relationshipscontinued
Building a diverse and inclusive cultureOur aim is to have a workforce that is representative of the countries and the communities in which we live and work and we will continue to endeavour to improve the representation of women at Board and senior levels within the organisation and to sustain an inclusive culture in which all talent can thrive.
As an organisation committed to diversity in its workforce, we will continue to strengthen our policies, processes and practices to develop our diversity and inclusion plans within the Group’s markets and geographies, in alignment with our corporate goals.
Ethical commitmentSavills is committed to doing business legally and ethically wherever it operates. Savills Ethical Trading Policy is detailed in our Group Code of Conduct which is readily accessible in local languages to all staff to support their day to day decision making. We continue to maintain our focus on ensuring that our people worldwide work within our specified financial, operational and compliance framework and that these standards are consistently applied. We demand the highest professional standards from all of our people all of the time and have a zero tolerance to breaches. However, given the breadth of activities and the number of people we employ there may be occasions when we do not meet the high standards we aspire to. Where we fail to reach these high standards, we treat any breach with the utmost seriousness.
Human RightsAt Savills we recognise our responsibility as a global corporate citizen and we consider the concerns of the wider communities where we conduct our business.
We are committed to doing the right thing in the right way and this is reflected in the Savills Code of Conduct. The Code, which underpins our social, ethical and environmental commitments, clearly sets out the standards of behaviour that we expect our employees to demonstrate and adhere to in their day to day working life at Savills.
As an absolute minimum, our employee policies comply with local legislation in the jurisdictions in which we operate. We fully support the principles of UN Global Compact, the UN Declaration of Human Rights and the International Labour Organization’s (ILO) Core Conventions.
Any breaches of our Code of Conduct may be reported in accordance with the Company’s whistle-blowing procedure.
ClientsClient careWe are committed to delivering a high quality service and creating long-term partnerships with all our clients. To do this we place great importance on delivering exceptional client service over the longer term through building sustained relationships and ensuring that the Savills client experience is second to none.
Client review meetings are a vital part of our approach to client care and we invest in an independent client review programme to focus on how well we are doing in the way we plan and execute the services we provide, how well we communicate and what additional value we give our clients. This provides an important independent rating of the standard of our client service which is reviewed regularly and used to refine service delivery. Savills top clients have a dedicated client relationship lead (Client Advocate) whose core responsibility is to act as a focal point for client servicing enquiries, and in particular to allow any service issues on current instructions to be quickly identified and addressed. These client advocates also play a key role in reviewing our performance with the client in tandem with the client research programme to ensure that we understand where we have met or exceeded expectations and those areas in which we can do better. Ultimately this ensures that we have awareness of our clients’ real estate plans so that we can make the appropriate resources available.
Our client advocates are supported by a client management system which consolidates client data into readily accessible client intelligence reports. To complement this initiative we recognise that there are clients that benefit from a full Savills service offering and to meet these demands, we have a full client management programme in place with a dedicated Client Relationship Management (‘CRM’) team. Each of these clients has a client care plan which includes a review of the current year, meeting schedule for key contacts, financials for the year to date and future years, a client communication plan and a list of agreed actions and responsibilities. We have a CRM board in place whose responsibility it is to oversee the client management programme. This board meets bimonthly and reports into the UK Board.
EnvironmentA healthy safe and secure workplaceSavills is committed at the highest level to providing a safe and healthy working environment for all staff and others who are affected by our businesses so as to minimise the risk of injury and ill health.
Safe working practices form an integral part of our day to day business and we aim to find practical solutions to health and safety risks. To this end, our safety strategy is focused on priorities such as reducing occupational exposure to workplace hazards, maintaining regulatory compliance and seeking to continuously develop and strengthen our health and safety arrangements.
In 2015 we focused upon a number of training initiatives and awareness programmes using a variety of communication channels in order to ensure Health & Safety (‘H&S’) remained a key focus for all staff. We also introduced a dedicated online H&S forum to further enhance interaction amongst our global network of H&S Champions.
During the current year we will continue to promote our positive safety culture with further localised training and country specific safety campaigns. We also aim to enhance our current audit coverage in order to demonstrate our commitment to continuous improvement of safe working practices.
SAVILLS PLC REPORT AND ACCOUNTS 201524
Environmental impactAcross our global business, with more than 30,000 employees operating in over 700 offices worldwide, Savills is committed to reducing the impact our operations have on the natural environment. By actively seeking to reduce our environmental impact, we are able to achieve increased operational efficiencies and savings, both internally and for our clients.
As one of the world’s leading property advisers, Savills acknowledges the importance of demonstrating leadership in this area. This includes measuring, disclosing and being accountable for our environmental impacts. Accordingly, Savills participates in the international Carbon Disclosure Project (‘CDP’). Some 4,000 organisations around the globe measure and disclose their greenhouse gas emissions and climate change strategies as part of the CDP. This data is collected annually on behalf of institutional investors, purchasing organisations and various government bodies. In 2015, Savills achieved a disclosure score of 84 out of a possible 100.
In acknowledgement of this environmental leadership, in the UK, Savills UK won a Gold Award from the Mayor of London as part of his Business Energy Challenge. This was awarded in recognition of reducing average annual carbon intensity in our London offices by 41% compared to 2010/11.
As part of this continuing drive to mitigate our environmental impacts, and as a hallmark of quality, our offices continue to work to secure ISO14001 2004: the international standard for environmental management systems. 85 offices in the UK alone (as at 31 December 2015) have achieved ISO14001 accreditation (with offices previously part of Smiths Gore to be accredited in 2016).
Our Australian business had a year of achievements for sustainability efforts, notably for the work produced for the Sydney’s Better Building Partnership on cooling tower water usage.
In Asia Pacific, Savills Guardian was again awarded the Class of Excellence Wastewi$e label in Hong Kong’s Awards for Environmental Excellence. It has actively participated and been recognised since 2004. We have also participated in a number of other initiatives including Earth Hour (the ‘Lights Off’ event to save energy), the Energy Saving Charter on Indoor Temperature which actively promotes energy savings in buildings, and the Quality Water Recognition Scheme for Buildings.
Greenhouse gas emissions Our Greenhouse Gas Emissions Statement includes all emission sources required under the Companies Act 2006 (Strategic Report and Directors’ Reports) Regulations 2013 for the financial year to 31 December 2015, compared against our baseline year to 31 December 2013.
ScopeThis Greenhouse Gas Emissions Statement includes all emission sources required under the Companies Act 2006 (Strategic Report and Directors’ Reports) Regulations 2013 for the financial year to 31 December 2015, compared against our baseline year of 2013. Data is also shown for 2014. For 2015, we continued to expand the scope of our data collection for our global greenhouse gas (‘GHG’) emissions. We are now reporting on GHG emissions from our UK, Europe, USA, Australia, New Zealand, Hong Kong, Japan and Singapore operations. In subsequent years, we will seek to further expand this reporting boundary. A network of Environmental Reporting Nominees has also been established, reporting to the Group Legal Director & Company Secretary, to co-ordinate more efficient data collection worldwide. Specialist third-party verified environmental reporting software has also been adopted by this network to ease data collection, ensure conformity and complete the subsequent emission calculations.
MethodologyThese calculations use a GHG Protocol Corporate Accounting and Reporting Standard methodology. In a few cases complete or wholly reliable data was not available. So, we have determined the relevant emissions by using a range of standard carbon accounting measures, including extrapolating data from other parts of the reporting period. To allow easier year on year comparison, a per capita intensity ratio (based on our number of full-time equivalent employee numbers) has been chosen. We consider that this is the best means of reflecting our wide-ranging activities in a quantifiable common factor.
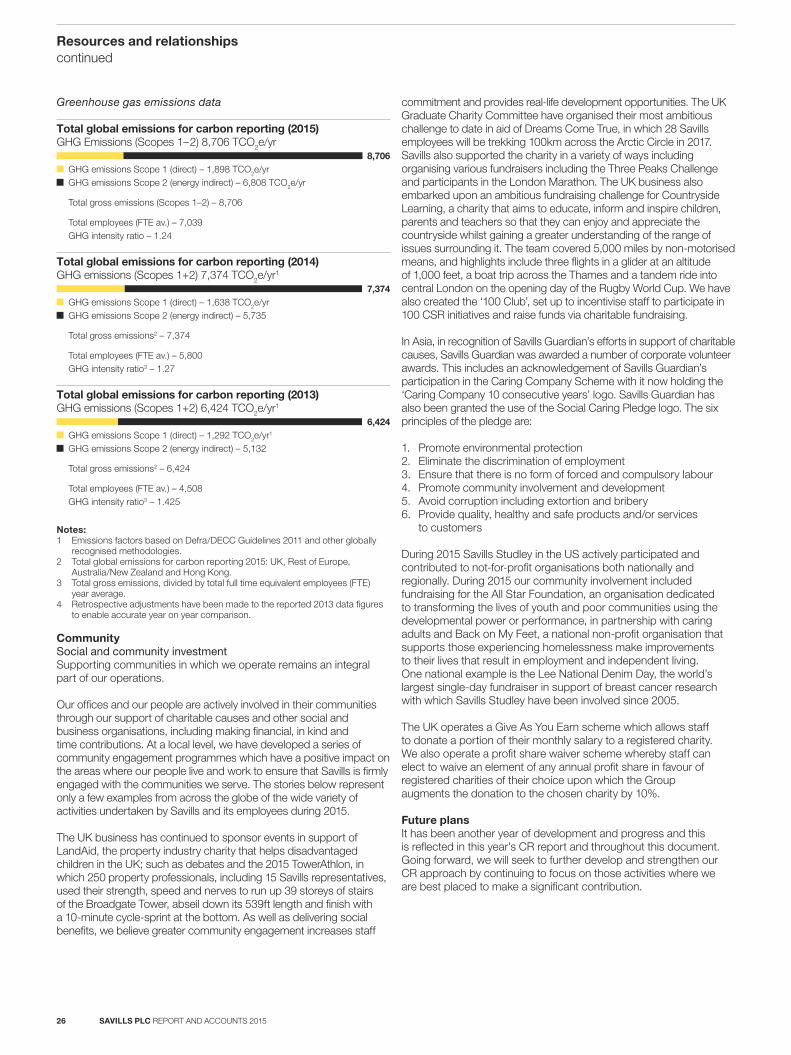
As can be seen from the results in the table on page 26, our Total Gross Emissions increased by approximately 18% from 2014 to 2015, but this overall increase reflects the aforementioned expansion of our reporting boundary in 2015. The corresponding figures for our per-capita intensity ratio, however, show an overall reduction of approximately 2.4%, despite our global FTE numbers increasing by around 21% during the reporting period. Against our base year, of 2013, this is now an improvement of over 12.5%. This significant decrease has been driven by targeted operational upgrades (e.g. of lighting, heating/cooling and computer management). At the corporate level, enhancements have also been achieved by the continued roll-out of environmental efficiency strategies, such as improved metering/monitoring, higher occupancy density levels and the application of green building principles during the selection/refurbishment of many of our occupied spaces. Savills is encouraged by the steady progress of our mitigation approach to date. We are confident of further reductions in our environmental footprint in the coming years.
Overview
/ Stra
teg
y / Perform
ance / Governance / Financial statem
ents
SAVILLS PLC REPORT AND ACCOUNTS 2015 25
Resources and relationshipscontinued
Greenhouse gas emissions data
Notes:1 Emissions factors based on Defra/DECC Guidelines 2011 and other globally
recognised methodologies.2 Total global emissions for carbon reporting 2015: UK, Rest of Europe,
Australia/New Zealand and Hong Kong.3 Total gross emissions, divided by total full time equivalent employees (FTE)
year average.4 Retrospective adjustments have been made to the reported 2013 data figures
to enable accurate year on year comparison.
CommunitySocial and community investmentSupporting communities in which we operate remains an integral part of our operations.
Our offices and our people are actively involved in their communities through our support of charitable causes and other social and business organisations, including making financial, in kind and time contributions. At a local level, we have developed a series of community engagement programmes which have a positive impact on the areas where our people live and work to ensure that Savills is firmly engaged with the communities we serve. The stories below represent only a few examples from across the globe of the wide variety of activities undertaken by Savills and its employees during 2015.
The UK business has continued to sponsor events in support of LandAid, the property industry charity that helps disadvantaged children in the UK; such as debates and the 2015 TowerAthlon, in which 250 property professionals, including 15 Savills representatives, used their strength, speed and nerves to run up 39 storeys of stairs of the Broadgate Tower, abseil down its 539ft length and finish with a 10-minute cycle-sprint at the bottom. As well as delivering social benefits, we believe greater community engagement increases staff
8,706
Total global emissions for carbon reporting (2015) GHG Emissions (Scopes 1–2) 8,706 TCO2e/yr
GHG emissions Scope 1 (direct) – 1,898 TCO2e/yrGHG emissions Scope 2 (energy indirect) – 6,808 TCO2e/yr
Total gross emissions (Scopes 1–2) – 8,706
Total employees (FTE av.) – 7,039GHG intensity ratio – 1.24
7,374
Total global emissions for carbon reporting (2014) GHG emissions (Scopes 1+2) 7,374 TCO2e/yr1
GHG emissions Scope 1 (direct) – 1,638 TCO2e/yrGHG emissions Scope 2 (energy indirect) – 5,735
Total gross emissions2 – 7,374
Total employees (FTE av.) – 5,800GHG intensity ratio3 – 1.27
6,424
Total global emissions for carbon reporting (2013) GHG emissions (Scopes 1+2) 6,424 TCO2e/yr1
GHG emissions Scope 1 (direct) – 1,292 TCO2e/yr1
GHG emissions Scope 2 (energy indirect) – 5,132
Total gross emissions2 – 6,424
Total employees (FTE av.) – 4,508GHG intensity ratio3 – 1.425
commitment and provides real-life development opportunities. The UK Graduate Charity Committee have organised their most ambitious challenge to date in aid of Dreams Come True, in which 28 Savills employees will be trekking 100km across the Arctic Circle in 2017. Savills also supported the charity in a variety of ways including organising various fundraisers including the Three Peaks Challenge and participants in the London Marathon. The UK business also embarked upon an ambitious fundraising challenge for Countryside Learning, a charity that aims to educate, inform and inspire children, parents and teachers so that they can enjoy and appreciate the countryside whilst gaining a greater understanding of the range of issues surrounding it. The team covered 5,000 miles by non-motorised means, and highlights include three flights in a glider at an altitude of 1,000 feet, a boat trip across the Thames and a tandem ride into central London on the opening day of the Rugby World Cup. We have also created the ‘100 Club’, set up to incentivise staff to participate in 100 CSR initiatives and raise funds via charitable fundraising.
In Asia, in recognition of Savills Guardian’s efforts in support of charitable causes, Savills Guardian was awarded a number of corporate volunteer awards. This includes an acknowledgement of Savills Guardian’s participation in the Caring Company Scheme with it now holding the ‘Caring Company 10 consecutive years’ logo. Savills Guardian has also been granted the use of the Social Caring Pledge logo. The six principles of the pledge are:
1. Promote environmental protection2. Eliminate the discrimination of employment3. Ensure that there is no form of forced and compulsory labour4. Promote community involvement and development5. Avoid corruption including extortion and bribery6. Provide quality, healthy and safe products and/or services
to customers
During 2015 Savills Studley in the US actively participated and contributed to not-for-profit organisations both nationally and regionally. During 2015 our community involvement included fundraising for the All Star Foundation, an organisation dedicated to transforming the lives of youth and poor communities using the developmental power or performance, in partnership with caring adults and Back on My Feet, a national non-profit organisation that supports those experiencing homelessness make improvements to their lives that result in employment and independent living. One national example is the Lee National Denim Day, the world’s largest single-day fundraiser in support of breast cancer research with which Savills Studley have been involved since 2005.
The UK operates a Give As You Earn scheme which allows staff to donate a portion of their monthly salary to a registered charity. We also operate a profit share waiver scheme whereby staff can elect to waive an element of any annual profit share in favour of registered charities of their choice upon which the Group augments the donation to the chosen charity by 10%.
Future plansIt has been another year of development and progress and this is reflected in this year’s CR report and throughout this document. Going forward, we will seek to further develop and strengthen our CR approach by continuing to focus on those activities where we are best placed to make a significant contribution.
SAVILLS PLC REPORT AND ACCOUNTS 201526
Risks and uncertainties facing the business
Identifying and managing our risksThe Board is responsible for the Group’s system of risk management and internal control. Risk management is recognised as an integral part of the Group’s activities. The Board determines the Group’s appetite for risk in pursuit of strategic objectives, and the level of risk that can be taken by the Group and its operating companies. Savills businesses worldwide are responsible for executing their activities in accordance with the risk appetite set by the Board, complemented by the Code of Conduct, Group policies and delegated authority limits. Risk is assessed across the Group using a systematic risk management model covering both external and internal factors and the potential impact and likelihood of those risks occurring. Risk assessments are incorporated into risk registers at Group and business level, which evolve to reflect the reduction/increase in identified risks and the emergence of new risks. Where it is considered that a risk can be mitigated further to the benefit of the business, responsibilities are assigned and action plans are agreed.
The Group’s Risk team facilitates the risk assessment process with Group and business unit management on behalf of the Board and challenges risk findings and the internal control framework to ensure that these are effective. Group policies and delegated authority levels set by the Board provide the means by which risks are reviewed and escalated to the appropriate level within the Group, up to and including the Board, for review and confirmation.
We have a clear framework for identifying and managing risk, both at an operational and strategic level. Our risk identification and mitigation processes have been designed to be appropriate to the ever-changing environments in which we operate.
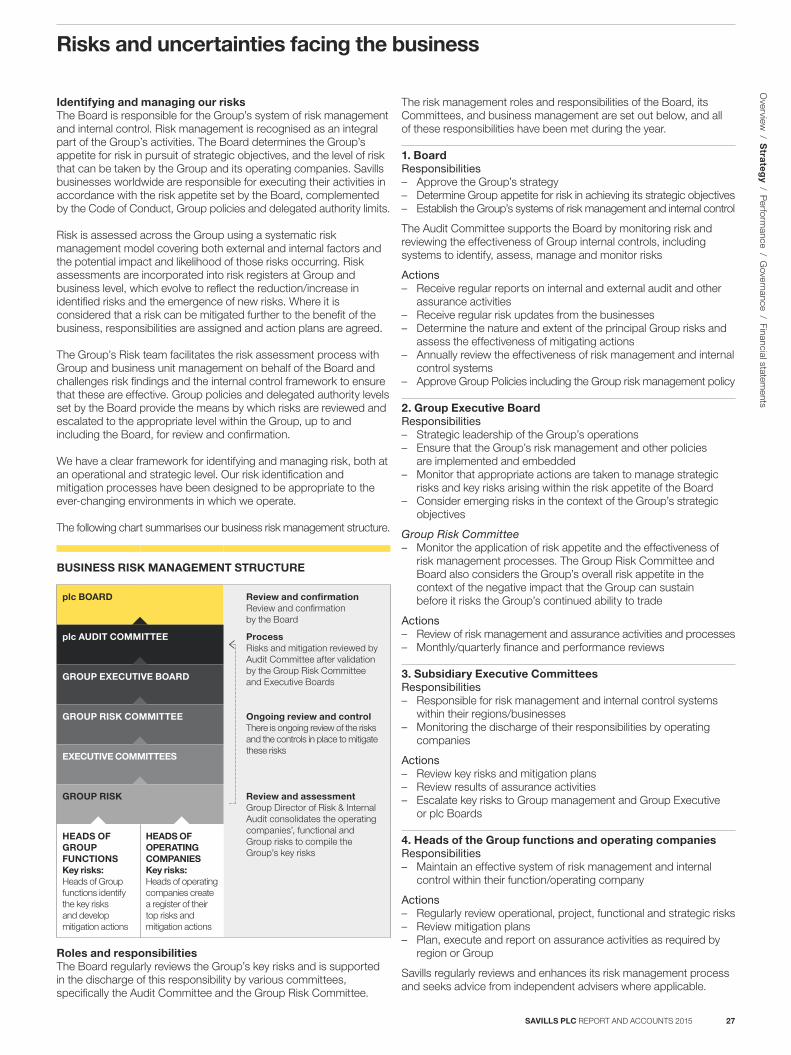
The following chart summarises our business risk management structure.
The risk management roles and responsibilities of the Board, its Committees, and business management are set out below, and all of these responsibilities have been met during the year.
1. BoardResponsibilities – Approve the Group’s strategy – Determine Group appetite for risk in achieving its strategic objectives – Establish the Group’s systems of risk management and internal control
The Audit Committee supports the Board by monitoring risk and reviewing the effectiveness of Group internal controls, including systems to identify, assess, manage and monitor risks
Actions – Receive regular reports on internal and external audit and other
assurance activities – Receive regular risk updates from the businesses – Determine the nature and extent of the principal Group risks and
assess the effectiveness of mitigating actions – Annually review the effectiveness of risk management and internal
control systems – Approve Group Policies including the Group risk management policy
2. Group Executive BoardResponsibilities – Strategic leadership of the Group’s operations – Ensure that the Group’s risk management and other policies
are implemented and embedded – Monitor that appropriate actions are taken to manage strategic
risks and key risks arising within the risk appetite of the Board – Consider emerging risks in the context of the Group’s strategic
objectives
Group Risk Committee – Monitor the application of risk appetite and the effectiveness of
risk management processes. The Group Risk Committee and Board also considers the Group’s overall risk appetite in the context of the negative impact that the Group can sustain before it risks the Group’s continued ability to trade
Actions – Review of risk management and assurance activities and processes – Monthly/quarterly finance and performance reviews
3. Subsidiary Executive CommitteesResponsibilities – Responsible for risk management and internal control systems
within their regions/businesses – Monitoring the discharge of their responsibilities by operating
companies
Actions – Review key risks and mitigation plans – Review results of assurance activities – Escalate key risks to Group management and Group Executive
or plc Boards
4. Heads of the Group functions and operating companiesResponsibilities – Maintain an effective system of risk management and internal
control within their function/operating company
Actions – Regularly review operational, project, functional and strategic risks – Review mitigation plans – Plan, execute and report on assurance activities as required by
region or Group
Savills regularly reviews and enhances its risk management process and seeks advice from independent advisers where applicable.
Roles and responsibilities The Board regularly reviews the Group’s key risks and is supported in the discharge of this responsibility by various committees, specifically the Audit Committee and the Group Risk Committee.
Overview
/ Stra
teg
y / Perform
ance / Governance / Financial statem
ents
SAVILLS PLC REPORT AND ACCOUNTS 2015 27
BUSINESS RISK MANAGEMENT STRUCTURE
plc BOARD Review and confirmationReview and confirmation by the Board
plc AUDIT COMMITTEE ProcessRisks and mitigation reviewed by Audit Committee after validation by the Group Risk Committee and Executive BoardsGROUP EXECUTIVE BOARD
GROUP RISK COMMITTEE Ongoing review and controlThere is ongoing review of the risks and the controls in place to mitigate these risks
EXECUTIVE COMMITTEES
GROUP RISK Review and assessmentGroup Director of Risk & Internal Audit consolidates the operating companies’, functional and Group risks to compile the Group’s key risks
HEADS OF GROUP FUNCTIONSKey risks: Heads of Group functions identify the key risks and develop mitigation actions
HEADS OF OPERATING COMPANIESKey risks: Heads of operating companies create a register of their top risks and mitigation actions
Risks and uncertainties facing the businesscontinued
KEY RISK 1: ECONOMIC/COUNTRY RISKS, PARTICULARLY THE IMPACT OF A GLOBAL ECONOMIC DOWNTURN
Change from 2014
Strategic objective: Geographic diversification / Financial strength
DescriptionGlobal market conditions are currently volatile, with economic uncertainty in some sectors and markets. Group earnings and/or our financial condition could be adversely affected by these and other macroeconomic uncertainties. Savills operates in a number of countries where the transactional business is the largest component and thereby increases the level of economic risk.
There is a currency risk from operating in a large number of countries.
MitigationThe strength of Savills business and brand and the focus on client service.
Our strategy of diversifying our service offering and geographic spread mitigates the impact on the business of economic downturns and weak market conditions in specific geographies, but these factors cannot entirely mitigate the overall risk to earnings. To manage these risks, we continually focus on our cost base and seek to improve operational efficiencies.
Contingency plans are in place to enable us to respond quickly to market information and economic trends. Continual monitoring of market conditions and market changes against our Group strategy, supported by the reforecasting and reporting in all of our businesses, are key to our ability to respond rapidly to changes in our operating environment.
Our exposure to countries with economies which are currently weak is balanced by our business in more stable markets. When considering new market entry we undertake due diligence including the impact assessment of political and economic issues in that particular country.
We manage currency risk in local operations through natural hedging and matching revenue and costs in the same currency.
KEY RISK 2: ACHIEVING THE RIGHT MARKET POSITIONING IN RESPONSE TO THE NEEDS OF OUR CLIENTS
Change from 2014
Strategic objective: Business diversification / Strength in residential and commercial markets / Geographical diversification / Commitment to clients
DescriptionThe markets in which we operate are highly competitive. Competition could lead to a reduction in market share and/or a decline in revenue. Our focus is on retaining existing clients as well as engaging with new clients. Our service offering continuously evolves and improves to meet the changing needs of our clients.
MitigationTo remain competitive in all markets, we continue to promote and differentiate our strengths whilst focusing on providing the quality of service that our clients require.
We continue to invest in the development of client relationships globally and associated systems to support our client service offering.
Principal risksThe Directors have carried out a robust assessment of the principal risks facing the Company – including in particular in 2015 those that would threaten its business model, future performance, solvency or liquidity. Our consideration of the key risks and uncertainties relating to the Group’s operations, along with their potential impact and the mitigations in place, is set out below. There may be other risks and uncertainties besides those listed below which may also adversely affect the Group and its performance. More detail can be found in the Audit Committee Report on pages 49 to 54.
In summary, our principal risks are:1. Economic/country risks, particularly the
impact of a global economic downturn 2. Achieving the right market positioning in
response to the needs of our clients3. Recruitment and retention of high-calibre staff 4. Reputational and brand risk 5. Legal risk 6. Failure or significant interruption to IT systems
causing disruption to client service 7. Business conduct8. Changes in the regulatory environment9. Acquisition/integration risk
SAVILLS PLC REPORT AND ACCOUNTS 201528
KEY RISK 3: RECRUITMENT AND RETENTION OF HIGH-CALIBRE STAFF
Change from 2014
Strategic objective: Financial strength / Commitment to clients
DescriptionWe recognise that the future success of our business is dependent on attracting, developing, motivating and retaining people of the highest quality.
MitigationWe continue to invest in the development of our people and invest in our training and development programmes across the businesses.
Our partnership style culture and profit sharing approach to remuneration is combined with selective use of share-based and other rewards to incentivise and retain our best people for the long-term benefit of the Group.
KEY RISK 4: REPUTATIONAL AND BRAND RISK
Change from 2014
Strategic objective: Strength in residential and commercial markets / Commitment to clients
DescriptionSavills is a strong brand with an excellent reputation in the markets in which we operate. The Group’s reputation could be damaged as a result of negative media coverage. We recognise the need to maintain this reputation by ensuring the quality of the service we provide.
MitigationWe recognise that our brand strength is vital to maintaining market share in established and new markets. A brand management programme is in place to ensure the brand’s positioning and identity is clearly and consistently promoted. Our social media policy is supported by guidance and training as well as ongoing monitoring. All external statements have to be appropriately approved.
We recognise that the quality of the service we offer is vital to maintaining the brand and we have in place policies, controls and processes to monitor the quality of our client service to support our programme of continuous improvement.
The Group has established corporate social responsibility programmes.
KEY RISK 5: LEGAL RISK
Change from 2014
Strategic objective: Financial strength / Commitment to clients
DescriptionFailure to fulfil our legal or contractual obligations to clients could subject the Group to action and/or claims from clients. The adverse outcome of such actions/claims could negatively impact our reputation, financial condition and/or the results of our businesses. For example: – in accepting client engagements, Group companies may
be subject to duty of care obligations. Failure to satisfy these obligations could result in claims being made against the relevant operating company;
– in our Property Management business, we may be responsible for appointing third-party contractors that provide construction and engineering services. Failure to discharge these responsibilities in accordance with our obligations could result in claims being made against the operating companies;
– in our Valuation Consultancy businesses, we can be subject to claims alleging the over-valuation of properties.
MitigationThe Group has a range of policies in place including client acceptance, legal and regulatory compliance, procurement, contractor management and valuation.
We have Best Practice groups policies, procedures and training which are designed to mitigate against the risk of such actions/claims being made and where such claims occur, to limit liability, particularly in relation to consultancy services such as Valuations. Such policies are regularly reviewed.
The Group maintains professional indemnity insurance to respond to and mitigate the Group’s financial exposure to such claims.
As described below, our strong emphasis on appropriate business conduct by all our employees, contractors and associates further mitigates this risk.
Overview
/ Stra
teg
y / Perform
ance / Governance / Financial statem
ents
SAVILLS PLC REPORT AND ACCOUNTS 2015 29
Risks and uncertainties facing the businesscontinued
KEY RISK 6: FAILURE OR SIGNIFICANT INTERRUPTION TO OUR IT SYSTEMS CAUSING DISRUPTION TO CLIENT SERVICE
Change from 2014
Strategic objective: Financial strength / Commitment to clients
DescriptionMajor failures in our IT systems may result in client service being interrupted or data being lost/corrupted causing damage to our reputation and consequential client and/or revenue loss.
There is a risk that an attack on our infrastructure by a malicious individual or group could be successful and impact the availability of critical systems.
MitigationSpecific back-up and resilience requirements are built into our systems. Our critical infrastructure is set up so far as is reasonably practical to prevent unauthorised access and reduce the likelihood and impact of a successful attack.
Our data centres are accredited to international information security standards.
Business continuity and disaster recovery plans are in place to cover the residual risks that cannot be mitigated.
We are constantly reviewing our resilience to cyber security attacks due to the increasing threat.
KEY RISK 7: BUSINESS CONDUCT
Change from 2014
Strategic objective: Business diversification / Geographical diversification / Commitment to clients
DescriptionWe operate in international markets that may present business conduct related risks involving, for example, fraud, bribery or corruption.
Failure by the Group and its employees to observe the highest standards of integrity and conduct in dealing with clients, suppliers and other stakeholders could result in civil and/or criminal penalties, regulatory sanction, debarring and/or reputational damage.
MitigationWe have programmes to promote compliance with our Code of Conduct, particularly in areas of higher risk such as procurement.
We have a zero tolerance approach to breaches of our Code of Conduct.
KEY RISK 8: CHANGES IN THE REGULATORY ENVIRONMENT
Change from 2014
Strategic objective: Commitment to clients
DescriptionWe are required to meet a broad range of regulatory compliance requirements in each of the markets in which we operate. For example: – some of our operations have regulatory licences; – in the UK, the Financial Conduct Authority (‘FCA’) regulates the
conduct of Savills Capital Advisors and, both generally and in relation to the Alternative Investment Fund Managers Directive, Savills Investment Management, and the insurance intermediary services provided to clients by Savills UK; our businesses are regulated by The Royal Institution of Chartered Surveyors (‘RICS’);
– Savills Investment Management entities are variously regulated by the Bank of Italy, FCA in Japan, BaFin in Germany and CSSF in Luxembourg;
– various countries, corporate entities and individuals are subject to financial sanctions, which require continuous monitoring in response to global events.
Failure to satisfy regulatory compliance requirements may result in fines being imposed, adverse publicity, brand/reputation damage and ultimately the withdrawal of regulatory approvals.
We also have a number of key statutory obligations including the protection of the health, safety and welfare of our staff and others affected by our activities. Environmental reporting requirements place data gathering responsibilities on our business in common with other listed companies.
MitigationOur Group Policy Framework, which sets out our standards for professional, regulatory, statutory compliance and business conduct, is reviewed regularly.
To support this Framework each business has its own regulatory and statutory compliance resources (who monitor regulatory developments and maintain the internal processes and controls required to fulfil our compliance obligations).
Our compliance environment, at all levels, is subject to regular review by internal audit and external assurance providers.
SAVILLS PLC REPORT AND ACCOUNTS 201530
KEY RISK 9: ACQUISITION/INTEGRATION RISK
NEW
Strategic objective: Business diversification / Geographical diversification / Strength in residential and commercial markets / Financial strength
DescriptionThe structuring and integration of acquisitions is critical to realising the benefits sought. People, systems and processes are key components
MitigationThe application of the Group acquisitions policy and procedures and the use of professional advisers in the due diligence process, together with clear allocation of responsibility and accountability to individuals for integration. Post-acquisition reporting keeps the Board aware of progress against plan.
Viability Statement In accordance with C2.2. of the 2014 revision of the Corporate Governance Code, the Directors have assessed the viability of the Group. The Directors assessment was over a three-year period, taking account of the Group’s current position and the potential impact of the principal risks documented in the Strategic Report on pages 27 to 31.
The Directors have determined that the three-year period is an appropriate period over which to provide its viability statement, being consistent with the period covered by the Group’s strategic planning process and with the cyclical nature of property markets. In making this statement the Directors have considered the resilience of the Group, taking account of its current position, the principal risks facing the business, the potential impact on market conditions of a severe economic downturn analogous to that experienced during the Global Financial Crisis in 2008/2009, and the effectiveness of any mitigating actions. The assessment considered the potential impacts of these risks on the business model, future performance, solvency and liquidity over the period.
The Board’s assessment has been made with reference to the Group’s current position and prospects, the Group’s strategic plan, the Board’s risk appetite and the Group’s principal risks and how these are managed, as detailed in the Strategic Report on pages 10 to 32. The strategy and associated principal risks underpin the Group’s three-year plan, which the Directors review at least annually. The three-year plan, including financing projections, is subject to sensitivity analysis which involves applying different assumptions to the underlying forecast both individually and in aggregate.
Based on this assessment, the Directors have a reasonable expectation that the Company will be able to continue in operation and meet its liabilities as they fall due over the three-year period.
The Directors also considered it appropriate to prepare the financial statements on the going concern basis as explained in Note 2.1 to the accounts.
Overview
/ Stra
teg
y / Perform
ance / Governance / Financial statem
ents
SAVILLS PLC REPORT AND ACCOUNTS 2015 31
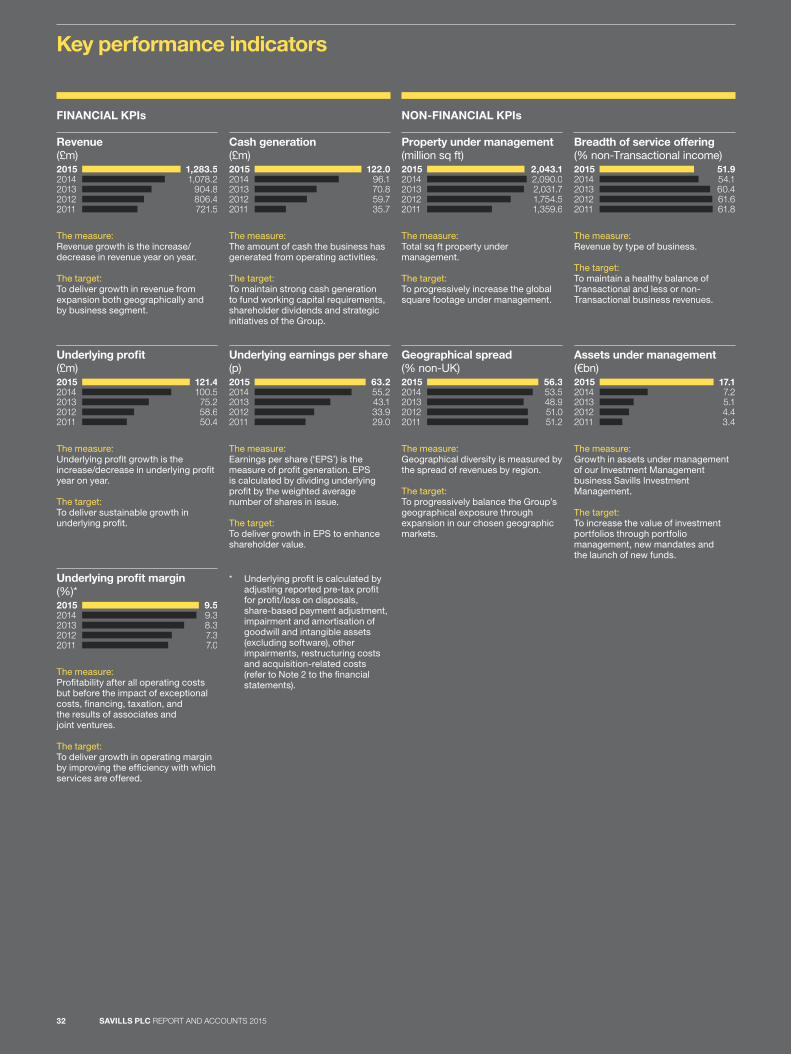
Page_HeadingPage_Heading_Level_2 continuedKey performance indicators
FINANCIAL KPIs NON-FINANCIAL KPIs
20152014201320122011
1,283.51,078.2
904.8806.4721.5
Revenue(£m)
20152014201320122011
2,043.12,090.02,031.71,754.51,359.6
Property under management(million sq ft)
20152014201320122011
122.096.170.859.735.7
Cash generation(£m)
20152014201320122011
51.954.160.461.661.8
Breadth of service offering(% non-Transactional income)
The measure: Revenue growth is the increase/decrease in revenue year on year.
The target: To deliver growth in revenue from expansion both geographically and by business segment.
20152014201320122011
9.59.38.37.37.0
Underlying pro�t margin(%)*
The measure: Profitability after all operating costs but before the impact of exceptional costs, financing, taxation, and the results of associates and joint ventures.
The target: To deliver growth in operating margin by improving the efficiency with which services are offered.
* Underlying profit is calculated by adjusting reported pre-tax profit for profit/loss on disposals, share-based payment adjustment, impairment and amortisation of goodwill and intangible assets (excluding software), other impairments, restructuring costs and acquisition-related costs (refer to Note 2 to the financial statements).
The measure: Total sq ft property under management.
The target: To progressively increase the global square footage under management.
The measure: The amount of cash the business has generated from operating activities.
The target: To maintain strong cash generation to fund working capital requirements, shareholder dividends and strategic initiatives of the Group.
The measure: Revenue by type of business.
The target: To maintain a healthy balance of Transactional and less or non-Transactional business revenues.
20152014201320122011
121.4100.575.258.650.4
Underlying pro�t(£m)
20152014201320122011
56.353.548.951.051.2
Geographical spread(% non-UK)
20152014201320122011
63.255.243.133.929.0
Underlying earnings per share(p)
20152014201320122011
17.17.25.14.43.4
Assets under management(€bn)
The measure: Underlying profit growth is the increase/decrease in underlying profit year on year.
The target: To deliver sustainable growth in underlying profit.
The measure: Geographical diversity is measured by the spread of revenues by region.
The target: To progressively balance the Group’s geographical exposure through expansion in our chosen geographic markets.
The measure: Earnings per share (‘EPS’) is the measure of profit generation. EPS is calculated by dividing underlying profit by the weighted average number of shares in issue.
The target: To deliver growth in EPS to enhance shareholder value.
The measure: Growth in assets under management of our Investment Management business Savills Investment Management.
The target: To increase the value of investment portfolios through portfolio management, new mandates and the launch of new funds.
SAVILLS PLC REPORT AND ACCOUNTS 201532
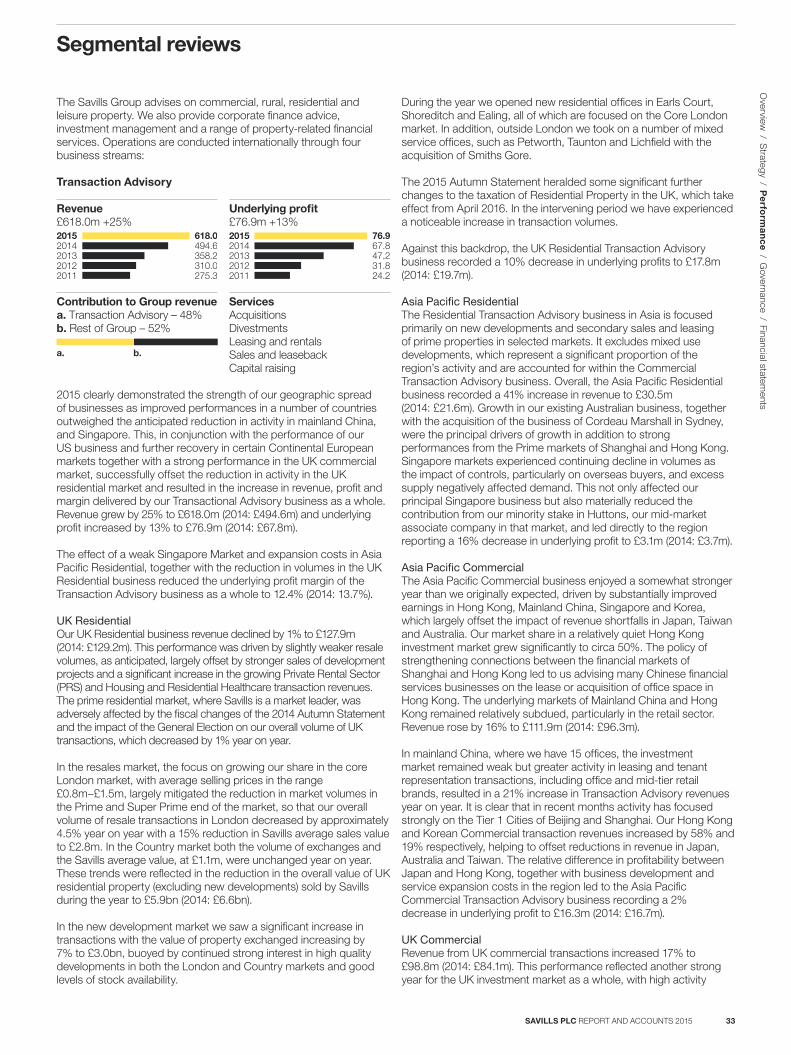
Segmental reviews
The Savills Group advises on commercial, rural, residential and leisure property. We also provide corporate finance advice, investment management and a range of property-related financial services. Operations are conducted internationally through four business streams:
Transaction Advisory
2015 clearly demonstrated the strength of our geographic spread of businesses as improved performances in a number of countries outweighed the anticipated reduction in activity in mainland China, and Singapore. This, in conjunction with the performance of our US business and further recovery in certain Continental European markets together with a strong performance in the UK commercial market, successfully offset the reduction in activity in the UK residential market and resulted in the increase in revenue, profit and margin delivered by our Transactional Advisory business as a whole. Revenue grew by 25% to £618.0m (2014: £494.6m) and underlying profit increased by 13% to £76.9m (2014: £67.8m).
The effect of a weak Singapore Market and expansion costs in Asia Pacific Residential, together with the reduction in volumes in the UK Residential business reduced the underlying profit margin of the Transaction Advisory business as a whole to 12.4% (2014: 13.7%).
UK ResidentialOur UK Residential business revenue declined by 1% to £127.9m (2014: £129.2m). This performance was driven by slightly weaker resale volumes, as anticipated, largely offset by stronger sales of development projects and a significant increase in the growing Private Rental Sector (PRS) and Housing and Residential Healthcare transaction revenues. The prime residential market, where Savills is a market leader, was adversely affected by the fiscal changes of the 2014 Autumn Statement and the impact of the General Election on our overall volume of UK transactions, which decreased by 1% year on year.
In the resales market, the focus on growing our share in the core London market, with average selling prices in the range £0.8m–£1.5m, largely mitigated the reduction in market volumes in the Prime and Super Prime end of the market, so that our overall volume of resale transactions in London decreased by approximately 4.5% year on year with a 15% reduction in Savills average sales value to £2.8m. In the Country market both the volume of exchanges and the Savills average value, at £1.1m, were unchanged year on year. These trends were reflected in the reduction in the overall value of UK residential property (excluding new developments) sold by Savills during the year to £5.9bn (2014: £6.6bn).
In the new development market we saw a significant increase in transactions with the value of property exchanged increasing by 7% to £3.0bn, buoyed by continued strong interest in high quality developments in both the London and Country markets and good levels of stock availability.
20112012201320142015 618.0
358.2494.6
310.0275.3
Revenue£618.0m +25%
20112012201320142015 76.9
47.267.8
31.824.2
Underlying pro�t£76.9m +13%
b.a.
Contribution to Group revenuea. Transaction Advisory – 48%b. Rest of Group – 52%
ServicesAcquisitionsDivestmentsLeasing and rentalsSales and leasebackCapital raising
During the year we opened new residential offices in Earls Court, Shoreditch and Ealing, all of which are focused on the Core London market. In addition, outside London we took on a number of mixed service offices, such as Petworth, Taunton and Lichfield with the acquisition of Smiths Gore.
The 2015 Autumn Statement heralded some significant further changes to the taxation of Residential Property in the UK, which take effect from April 2016. In the intervening period we have experienced a noticeable increase in transaction volumes.
Against this backdrop, the UK Residential Transaction Advisory business recorded a 10% decrease in underlying profits to £17.8m (2014: £19.7m).
Asia Pacific ResidentialThe Residential Transaction Advisory business in Asia is focused primarily on new developments and secondary sales and leasing of prime properties in selected markets. It excludes mixed use developments, which represent a significant proportion of the region’s activity and are accounted for within the Commercial Transaction Advisory business. Overall, the Asia Pacific Residential business recorded a 41% increase in revenue to £30.5m (2014: £21.6m). Growth in our existing Australian business, together with the acquisition of the business of Cordeau Marshall in Sydney, were the principal drivers of growth in addition to strong performances from the Prime markets of Shanghai and Hong Kong. Singapore markets experienced continuing decline in volumes as the impact of controls, particularly on overseas buyers, and excess supply negatively affected demand. This not only affected our principal Singapore business but also materially reduced the contribution from our minority stake in Huttons, our mid-market associate company in that market, and led directly to the region reporting a 16% decrease in underlying profit to £3.1m (2014: £3.7m).
Asia Pacific CommercialThe Asia Pacific Commercial business enjoyed a somewhat stronger year than we originally expected, driven by substantially improved earnings in Hong Kong, Mainland China, Singapore and Korea, which largely offset the impact of revenue shortfalls in Japan, Taiwan and Australia. Our market share in a relatively quiet Hong Kong investment market grew significantly to circa 50%. The policy of strengthening connections between the financial markets of Shanghai and Hong Kong led to us advising many Chinese financial services businesses on the lease or acquisition of office space in Hong Kong. The underlying markets of Mainland China and Hong Kong remained relatively subdued, particularly in the retail sector. Revenue rose by 16% to £111.9m (2014: £96.3m).
In mainland China, where we have 15 offices, the investment market remained weak but greater activity in leasing and tenant representation transactions, including office and mid-tier retail brands, resulted in a 21% increase in Transaction Advisory revenues year on year. It is clear that in recent months activity has focused strongly on the Tier 1 Cities of Beijing and Shanghai. Our Hong Kong and Korean Commercial transaction revenues increased by 58% and 19% respectively, helping to offset reductions in revenue in Japan, Australia and Taiwan. The relative difference in profitability between Japan and Hong Kong, together with business development and service expansion costs in the region led to the Asia Pacific Commercial Transaction Advisory business recording a 2% decrease in underlying profit to £16.3m (2014: £16.7m).
UK CommercialRevenue from UK commercial transactions increased 17% to £98.8m (2014: £84.1m). This performance reflected another strong year for the UK investment market as a whole, with high activity
Overview
/ Strategy / P
erfo
rma
nc
e / Governance / Financial statem
ents
SAVILLS PLC REPORT AND ACCOUNTS 2015 33
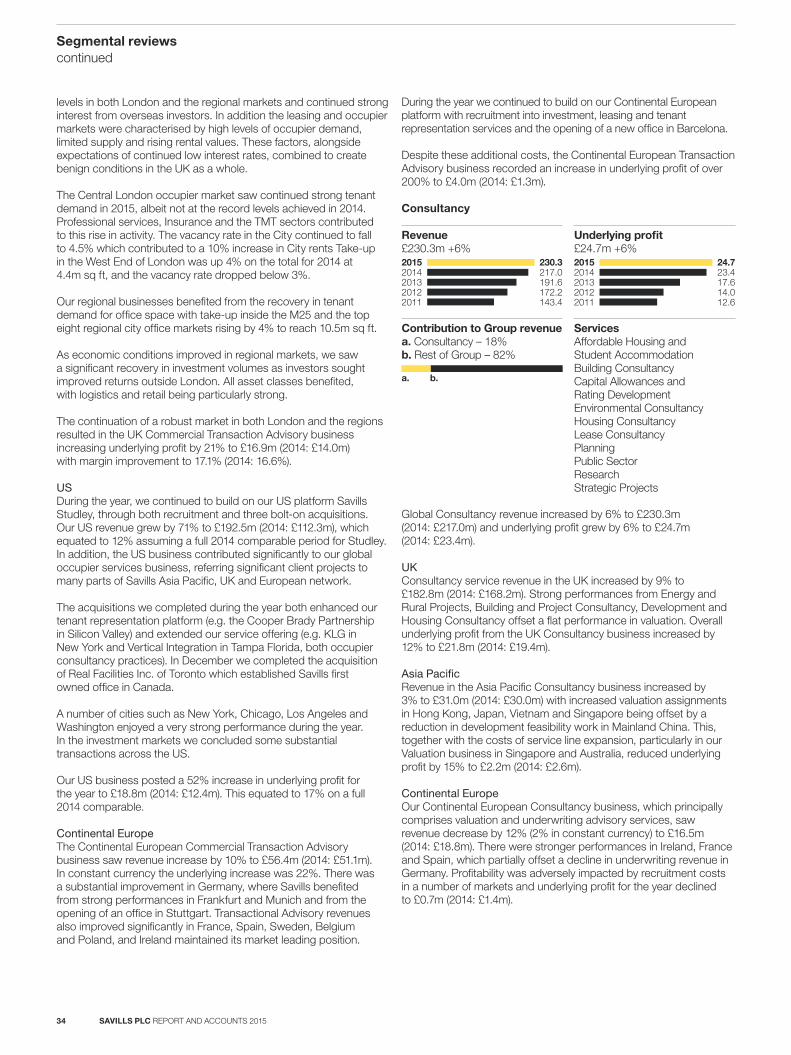
Segmental reviewscontinued
levels in both London and the regional markets and continued strong interest from overseas investors. In addition the leasing and occupier markets were characterised by high levels of occupier demand, limited supply and rising rental values. These factors, alongside expectations of continued low interest rates, combined to create benign conditions in the UK as a whole.
The Central London occupier market saw continued strong tenant demand in 2015, albeit not at the record levels achieved in 2014. Professional services, Insurance and the TMT sectors contributed to this rise in activity. The vacancy rate in the City continued to fall to 4.5% which contributed to a 10% increase in City rents Take-up in the West End of London was up 4% on the total for 2014 at 4.4m sq ft, and the vacancy rate dropped below 3%.
Our regional businesses benefited from the recovery in tenant demand for office space with take-up inside the M25 and the top eight regional city office markets rising by 4% to reach 10.5m sq ft.
As economic conditions improved in regional markets, we saw a significant recovery in investment volumes as investors sought improved returns outside London. All asset classes benefited, with logistics and retail being particularly strong.
The continuation of a robust market in both London and the regions resulted in the UK Commercial Transaction Advisory business increasing underlying profit by 21% to £16.9m (2014: £14.0m) with margin improvement to 17.1% (2014: 16.6%).
USDuring the year, we continued to build on our US platform Savills Studley, through both recruitment and three bolt-on acquisitions. Our US revenue grew by 71% to £192.5m (2014: £112.3m), which equated to 12% assuming a full 2014 comparable period for Studley. In addition, the US business contributed significantly to our global occupier services business, referring significant client projects to many parts of Savills Asia Pacific, UK and European network.
The acquisitions we completed during the year both enhanced our tenant representation platform (e.g. the Cooper Brady Partnership in Silicon Valley) and extended our service offering (e.g. KLG in New York and Vertical Integration in Tampa Florida, both occupier consultancy practices). In December we completed the acquisition of Real Facilities Inc. of Toronto which established Savills first owned office in Canada.
A number of cities such as New York, Chicago, Los Angeles and Washington enjoyed a very strong performance during the year. In the investment markets we concluded some substantial transactions across the US.
Our US business posted a 52% increase in underlying profit for the year to £18.8m (2014: £12.4m). This equated to 17% on a full 2014 comparable.
Continental EuropeThe Continental European Commercial Transaction Advisory business saw revenue increase by 10% to £56.4m (2014: £51.1m). In constant currency the underlying increase was 22%. There was a substantial improvement in Germany, where Savills benefited from strong performances in Frankfurt and Munich and from the opening of an office in Stuttgart. Transactional Advisory revenues also improved significantly in France, Spain, Sweden, Belgium and Poland, and Ireland maintained its market leading position.
During the year we continued to build on our Continental European platform with recruitment into investment, leasing and tenant representation services and the opening of a new office in Barcelona.
Despite these additional costs, the Continental European Transaction Advisory business recorded an increase in underlying profit of over 200% to £4.0m (2014: £1.3m).
Consultancy
Global Consultancy revenue increased by 6% to £230.3m (2014: £217.0m) and underlying profit grew by 6% to £24.7m (2014: £23.4m).
UKConsultancy service revenue in the UK increased by 9% to £182.8m (2014: £168.2m). Strong performances from Energy and Rural Projects, Building and Project Consultancy, Development and Housing Consultancy offset a flat performance in valuation. Overall underlying profit from the UK Consultancy business increased by 12% to £21.8m (2014: £19.4m).
Asia PacificRevenue in the Asia Pacific Consultancy business increased by 3% to £31.0m (2014: £30.0m) with increased valuation assignments in Hong Kong, Japan, Vietnam and Singapore being offset by a reduction in development feasibility work in Mainland China. This, together with the costs of service line expansion, particularly in our Valuation business in Singapore and Australia, reduced underlying profit by 15% to £2.2m (2014: £2.6m).
Continental EuropeOur Continental European Consultancy business, which principally comprises valuation and underwriting advisory services, saw revenue decrease by 12% (2% in constant currency) to £16.5m (2014: £18.8m). There were stronger performances in Ireland, France and Spain, which partially offset a decline in underwriting revenue in Germany. Profitability was adversely impacted by recruitment costs in a number of markets and underlying profit for the year declined to £0.7m (2014: £1.4m).
230.3
191.6217.0
172.2143.4
Revenue£230.3m +6%
20112012201320142015
20112012201320142015 24.7
17.623.4
14.012.6
Underlying pro�t£24.7m +6%
b.a.
Contribution to Group revenuea. Consultancy – 18%b. Rest of Group – 82%
ServicesAffordable Housing and Student Accommodation Building ConsultancyCapital Allowances andRating Development Environmental ConsultancyHousing ConsultancyLease ConsultancyPlanningPublic SectorResearchStrategic Projects
SAVILLS PLC REPORT AND ACCOUNTS 201534
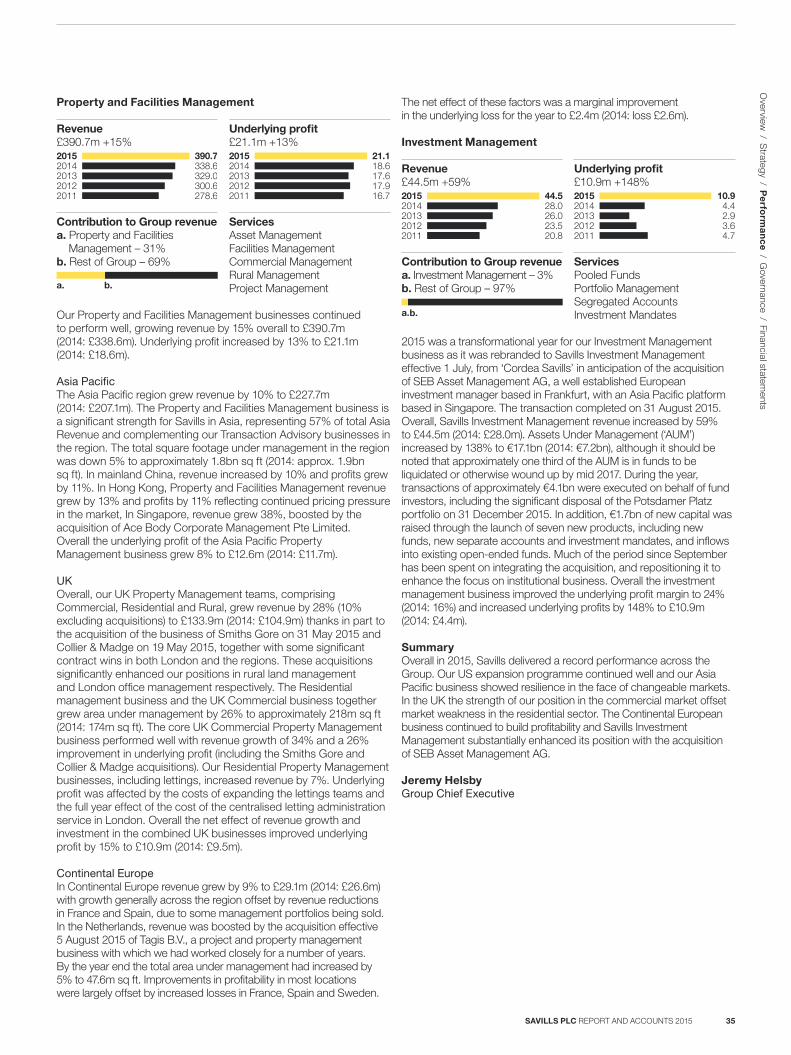
Property and Facilities Management
Our Property and Facilities Management businesses continued to perform well, growing revenue by 15% overall to £390.7m (2014: £338.6m). Underlying profit increased by 13% to £21.1m (2014: £18.6m).
Asia PacificThe Asia Pacific region grew revenue by 10% to £227.7m (2014: £207.1m). The Property and Facilities Management business is a significant strength for Savills in Asia, representing 57% of total Asia Revenue and complementing our Transaction Advisory businesses in the region. The total square footage under management in the region was down 5% to approximately 1.8bn sq ft (2014: approx. 1.9bn sq ft). In mainland China, revenue increased by 10% and profits grew by 11%. In Hong Kong, Property and Facilities Management revenue grew by 13% and profits by 11% reflecting continued pricing pressure in the market, In Singapore, revenue grew 38%, boosted by the acquisition of Ace Body Corporate Management Pte Limited. Overall the underlying profit of the Asia Pacific Property Management business grew 8% to £12.6m (2014: £11.7m).
UKOverall, our UK Property Management teams, comprising Commercial, Residential and Rural, grew revenue by 28% (10% excluding acquisitions) to £133.9m (2014: £104.9m) thanks in part to the acquisition of the business of Smiths Gore on 31 May 2015 and Collier & Madge on 19 May 2015, together with some significant contract wins in both London and the regions. These acquisitions significantly enhanced our positions in rural land management and London office management respectively. The Residential management business and the UK Commercial business together grew area under management by 26% to approximately 218m sq ft (2014: 174m sq ft). The core UK Commercial Property Management business performed well with revenue growth of 34% and a 26% improvement in underlying profit (including the Smiths Gore and Collier & Madge acquisitions). Our Residential Property Management businesses, including lettings, increased revenue by 7%. Underlying profit was affected by the costs of expanding the lettings teams and the full year effect of the cost of the centralised letting administration service in London. Overall the net effect of revenue growth and investment in the combined UK businesses improved underlying profit by 15% to £10.9m (2014: £9.5m).
Continental EuropeIn Continental Europe revenue grew by 9% to £29.1m (2014: £26.6m) with growth generally across the region offset by revenue reductions in France and Spain, due to some management portfolios being sold. In the Netherlands, revenue was boosted by the acquisition effective 5 August 2015 of Tagis B.V., a project and property management business with which we had worked closely for a number of years. By the year end the total area under management had increased by 5% to 47.6m sq ft. Improvements in profitability in most locations were largely offset by increased losses in France, Spain and Sweden.
20112012201320142015 390.7
329.0338.6
300.6278.6
Revenue£390.7m +15%
20112012201320142015 21.1
17.618.6
17.916.7
Underlying pro�t£21.1m +13%
b.a.
Contribution to Group revenuea. Property and Facilities Management – 31%b. Rest of Group – 69%
ServicesAsset ManagementFacilities ManagementCommercial ManagementRural ManagementProject Management
The net effect of these factors was a marginal improvement in the underlying loss for the year to £2.4m (2014: loss £2.6m).
Investment Management
2015 was a transformational year for our Investment Management business as it was rebranded to Savills Investment Management effective 1 July, from ‘Cordea Savills’ in anticipation of the acquisition of SEB Asset Management AG, a well established European investment manager based in Frankfurt, with an Asia Pacific platform based in Singapore. The transaction completed on 31 August 2015. Overall, Savills Investment Management revenue increased by 59% to £44.5m (2014: £28.0m). Assets Under Management (‘AUM’) increased by 138% to €17.1bn (2014: €7.2bn), although it should be noted that approximately one third of the AUM is in funds to be liquidated or otherwise wound up by mid 2017. During the year, transactions of approximately €4.1bn were executed on behalf of fund investors, including the significant disposal of the Potsdamer Platz portfolio on 31 December 2015. In addition, €1.7bn of new capital was raised through the launch of seven new products, including new funds, new separate accounts and investment mandates, and inflows into existing open-ended funds. Much of the period since September has been spent on integrating the acquisition, and repositioning it to enhance the focus on institutional business. Overall the investment management business improved the underlying profit margin to 24% (2014: 16%) and increased underlying profits by 148% to £10.9m (2014: £4.4m).
SummaryOverall in 2015, Savills delivered a record performance across the Group. Our US expansion programme continued well and our Asia Pacific business showed resilience in the face of changeable markets. In the UK the strength of our position in the commercial market offset market weakness in the residential sector. The Continental European business continued to build profitability and Savills Investment Management substantially enhanced its position with the acquisition of SEB Asset Management AG.
Jeremy HelsbyGroup Chief Executive
20112012201320142015 44.5
26.028.0
23.520.8
Revenue£44.5m +59%
20112012201320142015
Underlying pro�t£10.9m +148%
10.9
2.94.4
3.64.7
b.a.
Contribution to Group revenuea. Investment Management – 3%b. Rest of Group – 97%
ServicesPooled FundsPortfolio ManagementSegregated AccountsInvestment Mandates
Overview
/ Strategy / P
erfo
rma
nc
e / Governance / Financial statem
ents
SAVILLS PLC REPORT AND ACCOUNTS 2015 35
Group Chief Financial Officer’s reportFinancial review
Strong revenue and profit growth including margin improvement led to the Group’s robust £151m net cash position at year end and supports a 13% increase in the annual dividend.Simon ShawGroup Chief Financial Officer
SAVILLS PLC REPORT AND ACCOUNTS 201536
Financial highlights
– Group revenue up 19% to £1,283.5m (£1,271.0m in constant currency, 2014: £1,078.2m)
– Underlying profit up 21% to £121.4m (£120.1m in constant currency, 2014: £100.5m)
– Group profit before tax up 16% to £98.6m (2014: £84.7m)
– Underlying profit margin increased to 9.5% (2014: 9.3%)
– Underlying basic EPS grew 14% to 63.2p (2014: 55.2p)
– Final ordinary and supplementary interim dividends total 22.0p per share (2014: 19.25p) taking the total dividend for the year up 13% to 26.0p per share (2014: 23.0p)
Underlying profit marginUnderlying profit margin increased to 9.5% (2014: 9.3%) reflecting the effect of improved margins in the UK Commercial business, Continental Europe and Investment Management, which offset reduced margins in the Asia Pacific, UK Residential and US businesses, much of the latter being associated with business development expenditure.
TaxationThe tax charge for the year increased to £33.7m (2014: £22.0m). The effective tax rate on reported profits increased to 34.2% (2014: 26.0%) reflecting the effect of non-deductible acquisition costs. Of these the most significant is the charge for employment-linked deferred consideration in respect of the 2014 acquisition of Studley Inc.
The underlying effective tax rate remained consistent at 28.3% (2014: 26.6%), the slight rise reflecting increased profits in higher tax regions such as the US and Continental Europe.
Restructuring and acquisition-related costsDuring the period the Group incurred an aggregate restructuring charge of £1.6m (2014: £0.9m) and acquisition-related costs of £23.3m (2014: £16.6m). These costs included £2.8m of transaction and integration costs associated primarily with the acquisitions of Smiths Gore in the UK and SEB Asset Management in Germany. In addition, there was a £20.5m (2014: £9.9m) charge for future consideration payments which are contingent on the continuity of recipients’ employment in the future. This charge primarily relates to the acquisition of Studley, Inc.
These charges have been excluded from the calculation of underlying profit in line with Group policy.
Earnings per shareAs a result of the restructuring and acquisition costs referred to above, basic earnings per share increased marginally to 47.0p (2014: 46.8p). Adjusted on a consistent basis for restructuring, acquisition-related costs and impairment charges, profits and losses on disposals, certain share-based payment adjustments and amortisation of intangible assets (excluding software), underlying basic earnings per share increased by 14% to 63.2p (2014: 55.2p).
Fully diluted earnings per share increased by 2% to 46.4p (2014: 45.3p). The underlying fully diluted earnings per share increased by 17% to 62.3p (2014: 53.4p).
Cash resources, borrowings and liquidityYear end gross cash and cash equivalents increased 15% to £182.4m (2014: £158.1m). This principally reflected improved profits during the period, and the realisation of the cash benefit of deductions for tax losses utilised in the US.
Gross borrowings at year end increased to £31.4m (2014: £3.9m). These included £1.2m in respect of a working capital loan in Australia and £30.0m drawn under the Group’s multi-currency revolving credit facility (‘RCF’). Net cash at the year end was therefore £151.0m (2014: £154.2m).
Cash is typically retained in a number of subsidiaries in order to meet the requirements of commercial contracts or capital adequacy. In addition, cash in certain territories is retained principally to meet future growth requirements.
The Group’s cash flow profile is biased towards the second half of the year. This is as a result of seasonality in trading and the major cash outflows associated with dividends, profit-related remuneration payments and related payroll taxes in the first half. The Group cash inflow for the year from operating activities was £122.0m (2014: £96.1m), primarily as a result of improved trading in the Transaction Advisory business. As much of the Group’s revenue is transactional in nature, the Board’s strategy is to maintain low levels of gearing, but retain sufficient credit facilities to enable it to meet cash requirements during the year and finance the majority of business development opportunities as they arise. In December 2015, the Group entered into a new five year RCF of £250m with an accordion facility of a further £50m. The new RCF expires on 15 December 2020.
Capital and shareholders’ interestsDuring the year, 0.7m (2014: 0.6m) new shares were allotted to participants under the Performance Share Plan. 1.9m new shares were issued in the first of three instalments of deferred consideration for the acquisition of Studley. 3.9m shares remain to be issued in equal instalments on 30 May 2016 and 2017. In accordance with IFRS, all EPS measures for the year include the dilutive effect of this future obligation. The total number of ordinary shares in issue at 31 December 2015 was 137.9m (2014: 134.9m).
Overview
/ Strategy / P
erfo
rma
nc
e / Governance / Financial statem
ents
SAVILLS PLC REPORT AND ACCOUNTS 2015 37
Group Chief Financial Officer’s reportcontinued
Savills Pension SchemeThe funding level of the Savills Pension Scheme, which is closed to future service-based accrual, improved during the year as a result of a minor increase in long-term interest rates on the rate at which liabilities are discounted and the effect of planned contributions by the Company on asset values. The plan deficit at the year end amounted to £15.8m (2014: £19.4m).
Net assetsNet assets as at 31 December 2015 were £365.0m (2014: £330.3m). This movement reflected increased tangible assets, receivables and cash balances derived from the Group’s trading performance and acquisitions.
Key performance indicatorsThe Group uses a number of KPIs to measure its performance and review the impact of management strategies. These KPIs are detailed under the Key Performance Indicators section on page 32. The Group continues to review the mix of KPIs to ensure that these best measure our performance against our strategic objectives, in both financial and non-financial areas.
Financial policies and risk managementThe Group has financial risk management policies which cover financial risks considered material to the Group’s operations and results. These policies are subject to continuous review in light of developing regulation, accounting standards and practice. Compliance with these policies is mandatory for all Group companies and is reviewed regularly by the Board.
Treasury policies and objectivesThe Group Treasury policy is designed to reduce the financial risks faced by the Group, which primarily relate to funding and liquidity, interest rate exposure and currency rate exposures. The Group does not engage in trades of a speculative nature and only uses derivative financial instruments to hedge certain risk exposures. The Group’s financial instruments comprise borrowings, cash and liquid resources and various other items such as trade receivables and trade payables that arise directly from its operations. Surplus cash balances are generally held with A rated banks.
Interest rate riskThe Group finances its operations through a mixture of retained profits and bank borrowings, at both fixed and floating interest rates. Borrowings issued at variable rates expose the Group cash flow to interest rate risk, which is partially offset by cash held at variable rates. Borrowings issued at fixed rates expose the Group to fair value interest rate risk. Group policy is to maintain at least 70% of its borrowings in fixed rate instruments.
Liquidity riskThe Group prepares an annual funding plan which is approved by the Board and sets out the Group’s expected financing requirements for the next 12 months. These requirements are ordinarily expected to be met through existing cash balances, loan facilities and expected cash flows for the year.
Foreign currencyThe Group operates internationally and is exposed to foreign exchange risks. As both revenue and costs in each location are generally denominated in the same currency, transaction-related risks are relatively low and generally associated with intra Group activities. Consequently, the overriding foreign currency risk relates to the translation of overseas profits and losses into Sterling on consolidation. The Group does not actively seek to hedge risks arising from foreign currency translations due to their non-cash nature. As a result of the weakening of Sterling against the US Dollar, and currencies highly correlated thereto, the net impact of foreign exchange rate movements in 2015 was a £12.5m increase in revenue and an increase of £1.3m in underlying profit.
Simon ShawGroup Chief Financial Officer
SAVILLS PLC REPORT AND ACCOUNTS 201538
Responsibility for good governance lies with the Board. As a Board we are committed to maintaining the highest standards of corporate governance and understand that an effective, challenging and diverse Board is essential to enable the Group to deliver its strategy and long-term shareholder value. Further information on our strategy and business model can be found on pages 10 to 32.
We continue to work hard to maintain a culture where ‘doing the right thing’ is at the core of how we do business. The Board recognises the importance of setting the right tone at the top in order to guide our people’s behaviour and ensure that we live by and demonstrate the right values which in turn enable entrepreneurial and prudent management to deliver long-term success for the Group and its stakeholders. We fully recognise that at the heart of every successful organisation is a strong and healthy culture supported by a robust governance structure. As the custodian of Savills culture, the Board demands openness and transparency to maintain an environment in which honesty, integrity and fairness are valued and practised by our people every day. Our Code of Conduct is readily accessible in all local languages to all staff to support their day to day decision making. We demand the highest professional standards from all of our people all of the time and we have a zero tolerance approach to breaches of the Code of Conduct.
In September 2014, the Financial Reporting Council (‘FRC’) published the latest addition of the Corporate Governance Code (the ‘Code’) which included a number of changes relating to risk management, internal controls and the longer term viability of companies. A viability statement is therefore included in this Annual Report and can be found within the Strategic Report on page 31.
The Main Principles of the Code provide the framework for the reporting model which we have used for the last two years. Our approach to: Leadership and Effectiveness is described on pages 40 to 48; relations with shareholders is described on page 49; and Accountability is described on pages 48 to 54.
Board and Committee compositionEnsuring that we do the right thing in the right way requires the right leadership and it is important in my role as Chairman to ensure that the Board has the right blend of skills and experience. As an international business, we benefit from our Non-Executive Directors’ knowledge of and involvement with businesses in Hong Kong and China, the Middle East, Europe, and the US. The Board is collectively responsible for the long-term success of the Company and how it is directed and controlled, so our performance is thoroughly tested through an annual Board evaluation. This is facilitated by an independent external consultant at least once every three years. The last externally facilitated review was in respect of 2013, so this year’s evaluation was again conducted in-house, led by the Chairman and facilitated by the Group Legal Director & Company Secretary. The process and key conclusions are explained on page 46. Following this review, I am satisfied that the Board is performing effectively.
The Board also reviews Non-Executive Director independence on an annual basis and takes into account the individual’s professional characteristics, their behaviour at Board meetings and their contribution to unbiased and independent debate. All of the Non-Executive Directors are considered by the Board to be independent, including
Charles McVeigh, notwithstanding his long service. We are pleased that, as confirmed by this year’s Board evaluation, good progress has been made against the actions that the Board set itself for 2015 and we are confident that your Board has the right balance of skills, experience and diversity of personality to continue to encourage open, transparent debate and challenge.
Appointments and successionWe recognise the importance of planning for the future and with the support of the Nomination Committee we have continued to develop the Board this year. Our corporate strategy and business model are underpinned by a succession planning policy designed to progressively bring new skills and different perspectives to the Board and to complement the experience of our longer serving Directors so as to achieve an appropriate balance and position us to continue to challenge and debate corporate strategy.
During the year, the Nomination Committee and the Board agreed that it would be appropriate to appoint an additional Non-Executive Director to further expand the range of skills, experience and knowledge available to the Board. I am pleased to report that, following an extensive search process supported by an independent specialist search firm (as set out in detail in the Nomination Committee Report on pages 47 and 48), on 23 June 2015 Rupert Robson was appointed as a Non-Executive Director. Rupert has extensive experience which will complement and further enhance the wide-ranging skills and experience of the Board and its Committees and Rupert succeeded Tim Freshwater as Chairman of the Remuneration Committee on 1 October 2015.
In addition, during the year, the Nomination Committee, under the leadership of Martin Angle as Senior Independent Director, commenced the search for a further independent Non-Executive Director who would succeed me as Chairman when I retire from the Board at the conclusion of the AGM in May. This search, which concluded in January 2016 with the appointment of Nicholas Ferguson to the Board, was also supported by an independent, specialist search firm. I am very much looking forward to working with Nicholas to ensure a smooth handover. I have served as Chairman for over ten years which has been a period of considerable growth at Savills. I have no doubt that under Nicholas’ leadership I am leaving the Company in good hands. I would like to give my personal thanks to everyone I have worked with over the years as Chairman. The process for selecting Nicholas as the new Chairman is set out in detail in the Nomination Committee Report on pages 47 and 48.
On behalf of my fellow Directors I would like to welcome Rupert and Nicholas to the Board. Martin Angle will be retiring from the Board at the conclusion of the AGM in May and Tim Freshwater will be replacing him as Senior Independent Director. I would like to offer my thanks to Martin Angle for his contribution to the Group and the Audit Committee over the last nine years.
At least half of the Board members throughout the year were independent Non-Executive Directors (excluding the Chairman). Details of all the current Directors, their skills and experience are set out on page 44. In accordance with the Code, all Directors will stand for re-election or re-appointment (as applicable) at the Annual General Meeting (‘AGM’) on 11 May 2016 with the exception of myself and Martin Angle who are retiring from the Board. It being their first AGM, Rupert Robson and Nicholas Ferguson will be subject to re-appointment by the shareholders at the AGM.
DiversityWe believe that a diverse culture is an essential factor to the success of the business, and we fully support the Davies Report’s aspiration to promote greater female representation on listed company boards. During the year, the Board had one female Non-Executive Director, representing 20% of Non-Executive Board membership (excluding
Peter SmithChairman of Savills plc
SAVILLS PLC REPORT AND ACCOUNTS 2015 39
Overview
/ Strategy / P
erformance / G
ove
rna
nc
e / Financial statements
Corporate Governance StatementChairman’s introduction
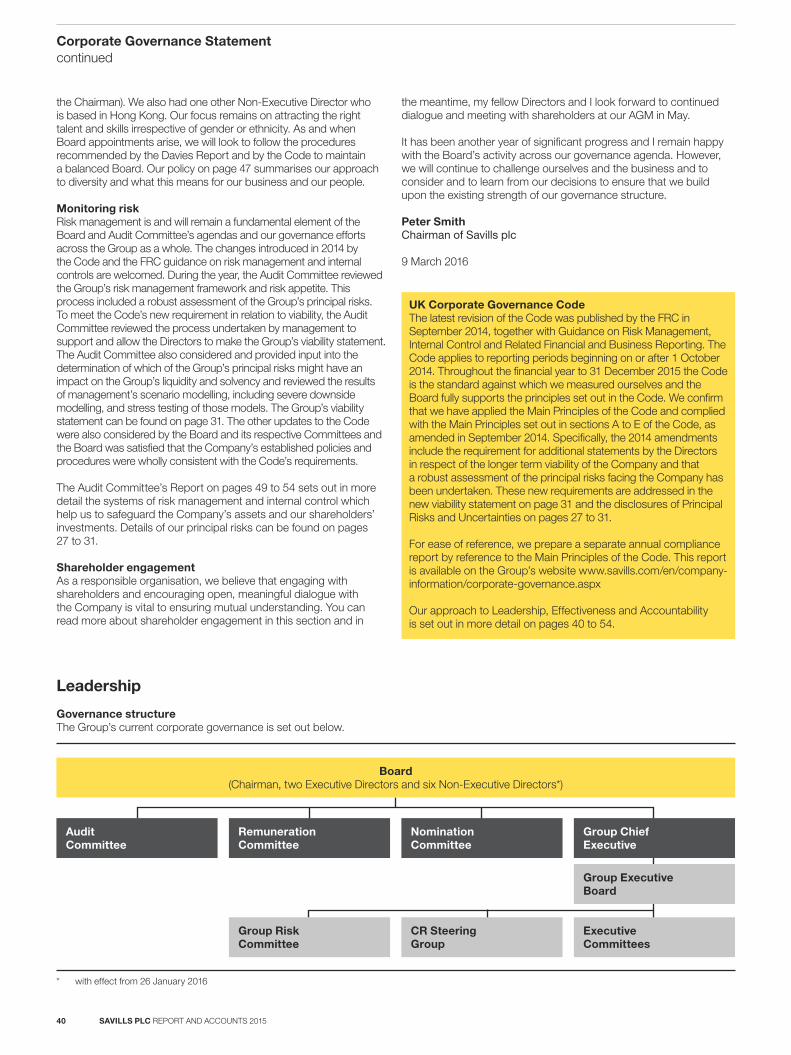
the Chairman). We also had one other Non-Executive Director who is based in Hong Kong. Our focus remains on attracting the right talent and skills irrespective of gender or ethnicity. As and when Board appointments arise, we will look to follow the procedures recommended by the Davies Report and by the Code to maintain a balanced Board. Our policy on page 47 summarises our approach to diversity and what this means for our business and our people.
Monitoring riskRisk management is and will remain a fundamental element of the Board and Audit Committee’s agendas and our governance efforts across the Group as a whole. The changes introduced in 2014 by the Code and the FRC guidance on risk management and internal controls are welcomed. During the year, the Audit Committee reviewed the Group’s risk management framework and risk appetite. This process included a robust assessment of the Group’s principal risks. To meet the Code’s new requirement in relation to viability, the Audit Committee reviewed the process undertaken by management to support and allow the Directors to make the Group’s viability statement. The Audit Committee also considered and provided input into the determination of which of the Group’s principal risks might have an impact on the Group’s liquidity and solvency and reviewed the results of management’s scenario modelling, including severe downside modelling, and stress testing of those models. The Group’s viability statement can be found on page 31. The other updates to the Code were also considered by the Board and its respective Committees and the Board was satisfied that the Company’s established policies and procedures were wholly consistent with the Code’s requirements.
The Audit Committee’s Report on pages 49 to 54 sets out in more detail the systems of risk management and internal control which help us to safeguard the Company’s assets and our shareholders’ investments. Details of our principal risks can be found on pages 27 to 31.
Shareholder engagementAs a responsible organisation, we believe that engaging with shareholders and encouraging open, meaningful dialogue with the Company is vital to ensuring mutual understanding. You can read more about shareholder engagement in this section and in
the meantime, my fellow Directors and I look forward to continued dialogue and meeting with shareholders at our AGM in May.
It has been another year of significant progress and I remain happy with the Board’s activity across our governance agenda. However, we will continue to challenge ourselves and the business and to consider and to learn from our decisions to ensure that we build upon the existing strength of our governance structure.
Peter SmithChairman of Savills plc
9 March 2016
UK Corporate Governance CodeThe latest revision of the Code was published by the FRC in September 2014, together with Guidance on Risk Management, Internal Control and Related Financial and Business Reporting. The Code applies to reporting periods beginning on or after 1 October 2014. Throughout the financial year to 31 December 2015 the Code is the standard against which we measured ourselves and the Board fully supports the principles set out in the Code. We confirm that we have applied the Main Principles of the Code and complied with the Main Principles set out in sections A to E of the Code, as amended in September 2014. Specifically, the 2014 amendments include the requirement for additional statements by the Directors in respect of the longer term viability of the Company and that a robust assessment of the principal risks facing the Company has been undertaken. These new requirements are addressed in the new viability statement on page 31 and the disclosures of Principal Risks and Uncertainties on pages 27 to 31.
For ease of reference, we prepare a separate annual compliance report by reference to the Main Principles of the Code. This report is available on the Group’s website www.savills.com/en/company-information/corporate-governance.aspx
Our approach to Leadership, Effectiveness and Accountability is set out in more detail on pages 40 to 54.
Leadership
Governance structureThe Group’s current corporate governance is set out below.
Audit Committee
Board(Chairman, two Executive Directors and six Non-Executive Directors*)
Remuneration Committee
Nomination Committee
Group Chief Executive
Group Executive Board
CR Steering Group
Group Risk Committee
Executive Committees
* with effect from 26 January 2016
SAVILLS PLC REPORT AND ACCOUNTS 201540
Corporate Governance Statement continued
The BoardRole of the BoardThe primary responsibility of the Board is to provide entrepreneurial leadership and to oversee the overall strategic development of the Group. In addition, the Board sets the Group’s values and standards and ensures that the Group’s businesses act ethically and that its obligations to its shareholders are understood and met. The Board delegates the management of the day to day operation of the business to the Group Chief Executive, supported by the Group Executive Board referred to on page 42, subject to appropriate risk parameters.
Matters reserved to the BoardThe Board has adopted a formal schedule of matters specifically reserved to it for decision making. A full schedule of matters reserved for the Board’s decision along with the Terms of Reference of the Board’s principal Committees can be found on the Company’s website at www.savills.com/en/company-information/corporate-governance.aspx.
The principal matters reserved for the Board are set out below:
Strategy and objectives Risk management
Reviewing and approving the Group’s strategy, objectives, business plans and budgets with a view to maintaining the Group’s established entrepreneurial driven business culture. Following implementation, the Board continuously monitors and analyses actual performance against desired outcomes and, where necessary, agrees adjustments or changes to the strategic plan to ensure the Group achieves its short, medium and long-term objectives.
Considering, testing and approving significant capital investment projects in line with strategy and taking a measured approach with the aim of: maintaining our position as a market leader; strengthening our presence in an existing market; or establishing the Savills brand in new markets through acquisitions or partnerships with well established high calibre local businesses with the skills to complement our existing capabilities and the ability to sit comfortably within the Savills business model. Where necessary, reviewing and approving divesting initiatives.
Establishing, monitoring and regulating the levels of risk which the Group is willing to accept in return for economic success and implementing systems of internal control, governance and approval authorities to safeguard shareholder investments.
Regularly analysing the impact of the Group’s adopted risk appetite against expected outcomes to ensure that the level of risk adopted by the Board is appropriate such that it can be effectively managed by the Group’s businesses and neither constrains growth nor has a negative impact on the Group’s reputation or finances. In response to actual outcomes and/or changes in the internal and external environments, regulating acceptable risk levels to reflect the evolution of strategy.
Governance Finance performance
Overseeing the performance of the Board and its principal Committees and that of individual Directors to ensure that they continue to be effective in support of Group strategy, policy and practice.
Planning to refresh or replace retiring or outgoing Directors so as to ensure that the different skills, experience and knowledge of the Directors is such that the Group remains capable of adapting to the changing environment as a consequence of it being directed by a set of competent, well rounded individuals who have the ability to formulate sensible and practical ideas capable of being translated into strategies which deliver results.
In line with the Board’s commitment to operate the Group’s businesses on an ethically, morally and legally sound basis from the top down, overseeing the development and approval of the Group’s governance structure and policies such as the Group’s Code of Conduct, standards of ethics and policy in relation to business practice, health, safety, environment, social and community responsibilities to ensure that the Group continues to do the ‘right thing’ and remains compliant with regulatory and legal requirements in each of the jurisdictions in which it operates.
Reviewing the performance of the Group’s businesses’ profits and cash management initiatives, assessed against the Group’s strategy, objectives, business plans and budgets to ensure that the financial resources generated by the businesses work to create additional value, costs are controlled and/or eliminated and that resource can be made available at the appropriate time to exploit business opportunities.
Reviewing changes to the Group’s capital structure and the issue of any securities in the context of achieving efficiencies or reducing the cost of capital to the Group.
Approving annual and half year results and trading updates, and accounting policies so as to ensure that communication with the Group’s shareholders is fair, balanced and understandable; and, subject to shareholder approval, the appointment and the remuneration of the External Auditors.
Approving the dividend policy and interim and supplemental dividends and recommending final dividends which are appropriate to the Group’s strategy, reflect the performance of the Group and give the Group the ability to continue to attract inward investment.
SAVILLS PLC REPORT AND ACCOUNTS 2015 41
Overview
/ Strategy / P
erformance / G
ove
rna
nc
e / Financial statements
Board CommitteesThe Board has established three principal Committees to which it has delegated certain of its responsibilities, which are set out below. The roles, membership and activities of these Committees can be found in the pages which follow.
Group Executive Board (‘GEB’)As mentioned above, the Group Chief Executive is supported by the GEB. The GEB is the key management committee of the Group. It is chaired by the Group Chief Executive and comprises the Group Chief Financial Officer, the Heads of the Principal Businesses and the Group Legal Director & Company Secretary. The GEB meets regularly and under the leadership of the Group Chief Executive, the GEB is responsible for the day to day management of the Group including overseeing the development and implementation of strategy, capital expenditure, and investment budgets, for the ongoing review and control of Group risks as detailed on pages 27 to 31 and reporting on these areas to the Board for approval, implementing Group policy, monitoring financial and operational performance of the Group and other specific matters delegated to it by the Board.
An explanation of how the Group creates and preserves value, and the strategy for delivering its objectives is included in the Group Chief Executive’s review on pages 12 to 14.
Membership of the GEB is detailed on page 45.
Board meetingsAttendance table
Meetings attended
Meetings eligible to
attend
Non-Executive Directors
Peter Smith 8 8
Martin Angle 8 8
Tim Freshwater 8 8
Liz Hewitt 8 8
Rupert Robson* 4 4
Charles McVeigh 8 8
Executive Directors
Jeremy Helsby** 8 8
Simon Shaw** 8 8
* Was appointed to the Board on 23 June 2015.** Members of the Group Executive Board.
The Board met formally eight times during the year and there was full attendance at all meetings by Directors, as shown in the table above.
Nomination CommitteeChaired by Peter Smith (save when Chairman succession was considered, when the Committee was chaired by Martin Angle, the Senior Independent Director)
Number of meetings in the year: 4
Role of the CommitteeThe Nomination Committee is responsible for the size, structure and composition of the Board, for reviewing and progressing appointments and for succession planning to ensure that the Board is refreshed progressively such that the balance of skills and experience available to the Board remains appropriate to the needs of the business. The Committee also makes recommendations to the Board on the membership of the principal Committees of the Board. The Nomination Committee Report can be found on pages 47 and 48.
Audit CommitteeChaired by Liz Hewitt from 13 May (previously chaired by Martin Angle until 13 May).
Number of meetings in the year: 4
Role of the Committee The Audit Committee is responsible for assisting the Board in fulfilling its financial and risk responsibilities, in particular for ensuring that the financial statements are fair, balanced and understandable. It oversees financial reporting, internal control, risk management and reviews the work of the Internal and External Auditors and advises the Board on the appointment of the External Auditors. The Audit Committee Report can be found on pages 49 to 54.
Remuneration CommitteeChaired by Rupert Robson from 1 October 2015 (and by Tim Freshwater up to 30 September 2015)
Number of meetings in the year: 3
Role of the CommitteeThe Remuneration Committee is responsible for determining the remuneration of the Chairman and the Executive Directors and for reviewing that of the members of the Group Executive Board. The Directors’ Remuneration Report can be found on pages 55 to 69.
SAVILLS PLC REPORT AND ACCOUNTS 201542
Corporate Governance Statement continued
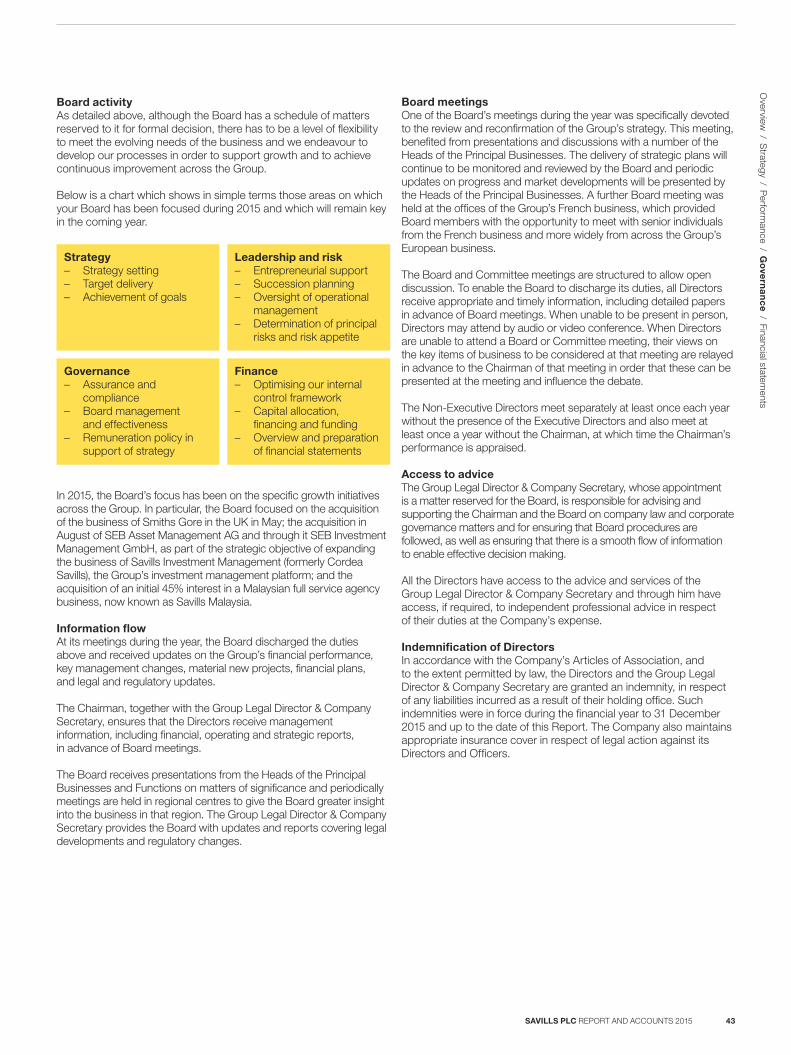
Board activityAs detailed above, although the Board has a schedule of matters reserved to it for formal decision, there has to be a level of flexibility to meet the evolving needs of the business and we endeavour to develop our processes in order to support growth and to achieve continuous improvement across the Group.
Below is a chart which shows in simple terms those areas on which your Board has been focused during 2015 and which will remain key in the coming year.
Strategy – Strategy setting – Target delivery – Achievement of goals
Leadership and risk – Entrepreneurial support – Succession planning – Oversight of operational
management – Determination of principal
risks and risk appetite
Governance – Assurance and
compliance – Board management
and effectiveness – Remuneration policy in
support of strategy
Finance – Optimising our internal
control framework – Capital allocation,
financing and funding – Overview and preparation
of financial statements
In 2015, the Board’s focus has been on the specific growth initiatives across the Group. In particular, the Board focused on the acquisition of the business of Smiths Gore in the UK in May; the acquisition in August of SEB Asset Management AG and through it SEB Investment Management GmbH, as part of the strategic objective of expanding the business of Savills Investment Management (formerly Cordea Savills), the Group’s investment management platform; and the acquisition of an initial 45% interest in a Malaysian full service agency business, now known as Savills Malaysia.
Information flowAt its meetings during the year, the Board discharged the duties above and received updates on the Group’s financial performance, key management changes, material new projects, financial plans, and legal and regulatory updates.
The Chairman, together with the Group Legal Director & Company Secretary, ensures that the Directors receive management information, including financial, operating and strategic reports, in advance of Board meetings.
The Board receives presentations from the Heads of the Principal Businesses and Functions on matters of significance and periodically meetings are held in regional centres to give the Board greater insight into the business in that region. The Group Legal Director & Company Secretary provides the Board with updates and reports covering legal developments and regulatory changes.
Board meetingsOne of the Board’s meetings during the year was specifically devoted to the review and reconfirmation of the Group’s strategy. This meeting, benefited from presentations and discussions with a number of the Heads of the Principal Businesses. The delivery of strategic plans will continue to be monitored and reviewed by the Board and periodic updates on progress and market developments will be presented by the Heads of the Principal Businesses. A further Board meeting was held at the offices of the Group’s French business, which provided Board members with the opportunity to meet with senior individuals from the French business and more widely from across the Group’s European business.
The Board and Committee meetings are structured to allow open discussion. To enable the Board to discharge its duties, all Directors receive appropriate and timely information, including detailed papers in advance of Board meetings. When unable to be present in person, Directors may attend by audio or video conference. When Directors are unable to attend a Board or Committee meeting, their views on the key items of business to be considered at that meeting are relayed in advance to the Chairman of that meeting in order that these can be presented at the meeting and influence the debate.
The Non-Executive Directors meet separately at least once each year without the presence of the Executive Directors and also meet at least once a year without the Chairman, at which time the Chairman’s performance is appraised.
Access to adviceThe Group Legal Director & Company Secretary, whose appointment is a matter reserved for the Board, is responsible for advising and supporting the Chairman and the Board on company law and corporate governance matters and for ensuring that Board procedures are followed, as well as ensuring that there is a smooth flow of information to enable effective decision making. All the Directors have access to the advice and services of the Group Legal Director & Company Secretary and through him have access, if required, to independent professional advice in respect of their duties at the Company’s expense.
Indemnification of DirectorsIn accordance with the Company’s Articles of Association, and to the extent permitted by law, the Directors and the Group Legal Director & Company Secretary are granted an indemnity, in respect of any liabilities incurred as a result of their holding office. Such indemnities were in force during the financial year to 31 December 2015 and up to the date of this Report. The Company also maintains appropriate insurance cover in respect of legal action against its Directors and Officers.
SAVILLS PLC REPORT AND ACCOUNTS 2015 43
Overview
/ Strategy / P
erformance / G
ove
rna
nc
e / Financial statements
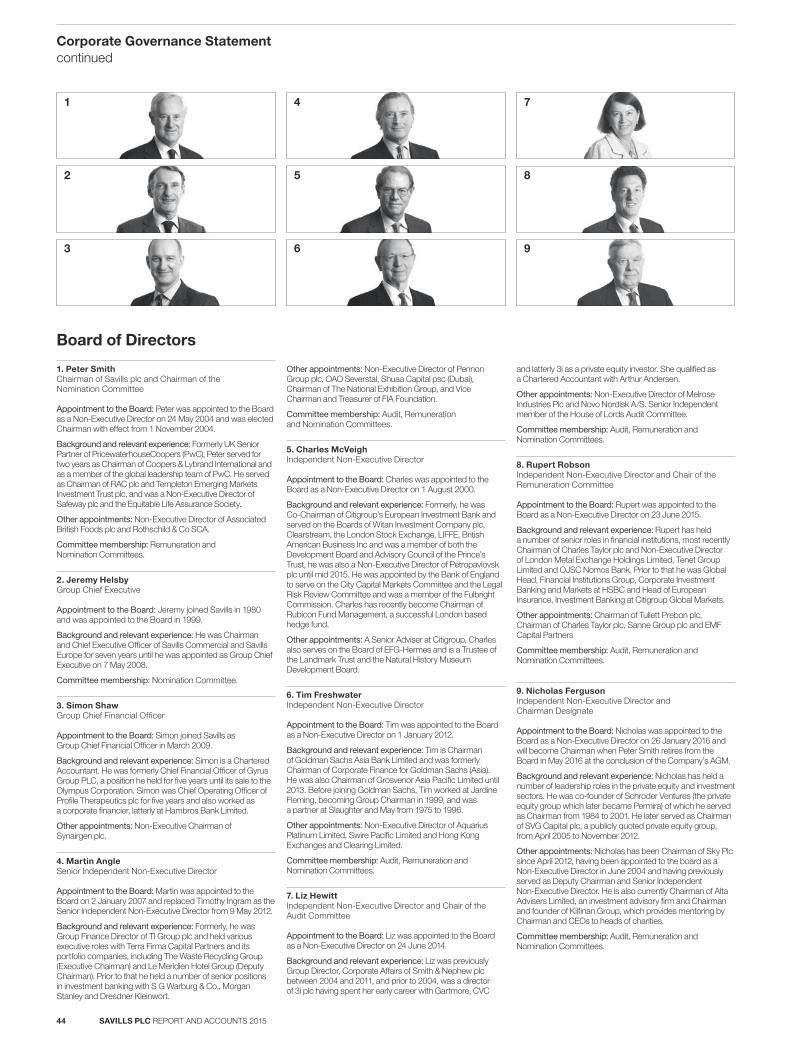
1 4 7
8
9
2 5
3 6
Board of Directors
1. Peter SmithChairman of Savills plc and Chairman of the Nomination Committee
Appointment to the Board: Peter was appointed to the Board as a Non-Executive Director on 24 May 2004 and was elected Chairman with effect from 1 November 2004.
Background and relevant experience: Formerly UK Senior Partner of PricewaterhouseCoopers (PwC), Peter served for two years as Chairman of Coopers & Lybrand International and as a member of the global leadership team of PwC. He served as Chairman of RAC plc and Templeton Emerging Markets Investment Trust plc, and was a Non-Executive Director of Safeway plc and the Equitable Life Assurance Society.
Other appointments: Non-Executive Director of Associated British Foods plc and Rothschild & Co SCA.
Committee membership: Remuneration and Nomination Committees.
2. Jeremy HelsbyGroup Chief Executive
Appointment to the Board: Jeremy joined Savills in 1980 and was appointed to the Board in 1999.
Background and relevant experience: He was Chairman and Chief Executive Officer of Savills Commercial and Savills Europe for seven years until he was appointed as Group Chief Executive on 7 May 2008.
Committee membership: Nomination Committee.
3. Simon ShawGroup Chief Financial Officer
Appointment to the Board: Simon joined Savills as Group Chief Financial Officer in March 2009.
Background and relevant experience: Simon is a Chartered Accountant. He was formerly Chief Financial Officer of Gyrus Group PLC, a position he held for five years until its sale to the Olympus Corporation. Simon was Chief Operating Officer of Profile Therapeutics plc for five years and also worked as a corporate financier, latterly at Hambros Bank Limited.
Other appointments: Non-Executive Chairman of Synairgen plc.
4. Martin AngleSenior Independent Non-Executive Director
Appointment to the Board: Martin was appointed to the Board on 2 January 2007 and replaced Timothy Ingram as the Senior Independent Non-Executive Director from 9 May 2012.
Background and relevant experience: Formerly, he was Group Finance Director of TI Group plc and held various executive roles with Terra Firma Capital Partners and its portfolio companies, including The Waste Recycling Group (Executive Chairman) and Le Meridien Hotel Group (Deputy Chairman). Prior to that he held a number of senior positions in investment banking with S G Warburg & Co., Morgan Stanley and Dresdner Kleinwort.
Other appointments: Non-Executive Director of Pennon Group plc, OAO Severstal, Shuaa Capital psc (Dubai), Chairman of The National Exhibition Group, and Vice Chairman and Treasurer of FIA Foundation.
Committee membership: Audit, Remuneration and Nomination Committees.
5. Charles McVeighIndependent Non-Executive Director
Appointment to the Board: Charles was appointed to the Board as a Non-Executive Director on 1 August 2000.
Background and relevant experience: Formerly, he was Co-Chairman of Citigroup’s European Investment Bank and served on the Boards of Witan Investment Company plc, Clearstream, the London Stock Exchange, LIFFE, British American Business Inc and was a member of both the Development Board and Advisory Council of the Prince’s Trust, he was also a Non-Executive Director of Petropavlovsk plc until mid 2015. He was appointed by the Bank of England to serve on the City Capital Markets Committee and the Legal Risk Review Committee and was a member of the Fulbright Commission. Charles has recently become Chairman of Rubicon Fund Management, a successful London based hedge fund.
Other appointments: A Senior Adviser at Citigroup, Charles also serves on the Board of EFG-Hermes and is a Trustee of the Landmark Trust and the Natural History Museum Development Board.
6. Tim FreshwaterIndependent Non-Executive Director
Appointment to the Board: Tim was appointed to the Board as a Non-Executive Director on 1 January 2012.
Background and relevant experience: Tim is Chairman of Goldman Sachs Asia Bank Limited and was formerly Chairman of Corporate Finance for Goldman Sachs (Asia). He was also Chairman of Grosvenor Asia Pacific Limited until 2013. Before joining Goldman Sachs, Tim worked at Jardine Fleming, becoming Group Chairman in 1999, and was a partner at Slaughter and May from 1975 to 1996.
Other appointments: Non-Executive Director of Aquarius Platinum Limited, Swire Pacific Limited and Hong Kong Exchanges and Clearing Limited.
Committee membership: Audit, Remuneration and Nomination Committees.
7. Liz HewittIndependent Non-Executive Director and Chair of the Audit Committee
Appointment to the Board: Liz was appointed to the Board as a Non-Executive Director on 24 June 2014.
Background and relevant experience: Liz was previously Group Director, Corporate Affairs of Smith & Nephew plc between 2004 and 2011, and prior to 2004, was a director of 3i plc having spent her early career with Gartmore, CVC
and latterly 3i as a private equity investor. She qualified as a Chartered Accountant with Arthur Andersen.
Other appointments: Non-Executive Director of Melrose Industries Plc and Novo Nordisk A/S. Senior Independent member of the House of Lords Audit Committee.
Committee membership: Audit, Remuneration and Nomination Committees.
8. Rupert RobsonIndependent Non-Executive Director and Chair of the Remuneration Committee
Appointment to the Board: Rupert was appointed to the Board as a Non-Executive Director on 23 June 2015.
Background and relevant experience: Rupert has held a number of senior roles in financial institutions, most recently Chairman of Charles Taylor plc and Non-Executive Director of London Metal Exchange Holdings Limited, Tenet Group Limited and OJSC Nomos Bank. Prior to that he was Global Head, Financial Institutions Group, Corporate Investment Banking and Markets at HSBC and Head of European Insurance, Investment Banking at Citigroup Global Markets.
Other appointments: Chairman of Tullett Prebon plc, Chairman of Charles Taylor plc, Sanne Group plc and EMF Capital Partners
Committee membership: Audit, Remuneration and Nomination Committees.
9. Nicholas FergusonIndependent Non-Executive Director and Chairman Designate
Appointment to the Board: Nicholas was appointed to the Board as a Non-Executive Director on 26 January 2016 and will become Chairman when Peter Smith retires from the Board in May 2016 at the conclusion of the Company’s AGM.
Background and relevant experience: Nicholas has held a number of leadership roles in the private equity and investment sectors. He was co-founder of Schroder Ventures (the private equity group which later became Permira) of which he served as Chairman from 1984 to 2001. He later served as Chairman of SVG Capital plc, a publicly quoted private equity group, from April 2005 to November 2012.
Other appointments: Nicholas has been Chairman of Sky Plc since April 2012, having been appointed to the board as a Non-Executive Director in June 2004 and having previously served as Deputy Chairman and Senior Independent Non-Executive Director. He is also currently Chairman of Alta Advisers Limited, an investment advisory firm and Chairman and founder of Kilfinan Group, which provides mentoring by Chairman and CEOs to heads of charities.
Committee membership: Audit, Remuneration and Nomination Committees.
SAVILLS PLC REPORT AND ACCOUNTS 201544
Corporate Governance Statement continued
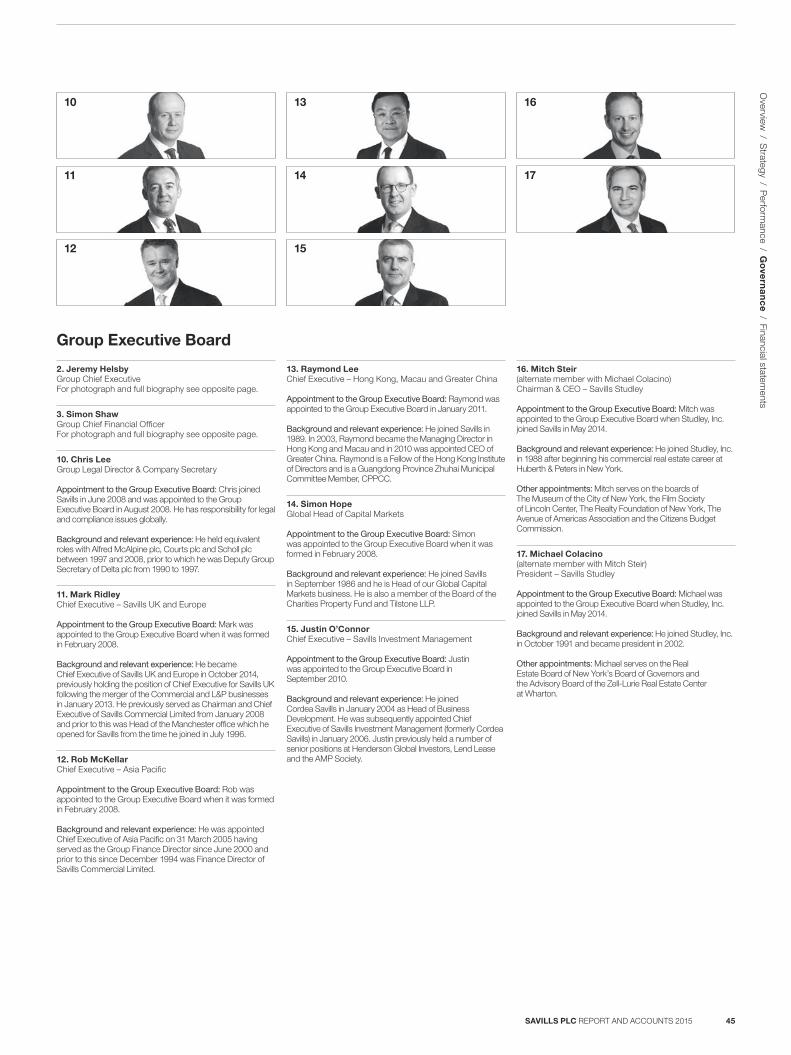
10 13
11 14
15
16
17
12
Group Executive Board
2. Jeremy HelsbyGroup Chief ExecutiveFor photograph and full biography see opposite page.
3. Simon ShawGroup Chief Financial OfficerFor photograph and full biography see opposite page.
10. Chris LeeGroup Legal Director & Company Secretary
Appointment to the Group Executive Board: Chris joined Savills in June 2008 and was appointed to the Group Executive Board in August 2008. He has responsibility for legal and compliance issues globally.
Background and relevant experience: He held equivalent roles with Alfred McAlpine plc, Courts plc and Scholl plc between 1997 and 2008, prior to which he was Deputy Group Secretary of Delta plc from 1990 to 1997.
11. Mark RidleyChief Executive – Savills UK and Europe
Appointment to the Group Executive Board: Mark was appointed to the Group Executive Board when it was formed in February 2008.
Background and relevant experience: He became Chief Executive of Savills UK and Europe in October 2014, previously holding the position of Chief Executive for Savills UK following the merger of the Commercial and L&P businesses in January 2013. He previously served as Chairman and Chief Executive of Savills Commercial Limited from January 2008 and prior to this was Head of the Manchester office which he opened for Savills from the time he joined in July 1996.
12. Rob McKellarChief Executive – Asia Pacific
Appointment to the Group Executive Board: Rob was appointed to the Group Executive Board when it was formed in February 2008.
Background and relevant experience: He was appointed Chief Executive of Asia Pacific on 31 March 2005 having served as the Group Finance Director since June 2000 and prior to this since December 1994 was Finance Director of Savills Commercial Limited.
13. Raymond LeeChief Executive – Hong Kong, Macau and Greater China
Appointment to the Group Executive Board: Raymond was appointed to the Group Executive Board in January 2011.
Background and relevant experience: He joined Savills in 1989. In 2003, Raymond became the Managing Director in Hong Kong and Macau and in 2010 was appointed CEO of Greater China. Raymond is a Fellow of the Hong Kong Institute of Directors and is a Guangdong Province Zhuhai Municipal Committee Member, CPPCC.
14. Simon HopeGlobal Head of Capital Markets
Appointment to the Group Executive Board: Simon was appointed to the Group Executive Board when it was formed in February 2008.
Background and relevant experience: He joined Savills in September 1986 and he is Head of our Global Capital Markets business. He is also a member of the Board of the Charities Property Fund and Tilstone LLP.
15. Justin O’ConnorChief Executive – Savills Investment Management
Appointment to the Group Executive Board: Justin was appointed to the Group Executive Board in September 2010.
Background and relevant experience: He joined Cordea Savills in January 2004 as Head of Business Development. He was subsequently appointed Chief Executive of Savills Investment Management (formerly Cordea Savills) in January 2006. Justin previously held a number of senior positions at Henderson Global Investors, Lend Lease and the AMP Society.
16. Mitch Steir(alternate member with Michael Colacino)Chairman & CEO – Savills Studley
Appointment to the Group Executive Board: Mitch was appointed to the Group Executive Board when Studley, Inc. joined Savills in May 2014.
Background and relevant experience: He joined Studley, Inc. in 1988 after beginning his commercial real estate career at Huberth & Peters in New York.
Other appointments: Mitch serves on the boards of The Museum of the City of New York, the Film Society of Lincoln Center, The Realty Foundation of New York, The Avenue of Americas Association and the Citizens Budget Commission.
17. Michael Colacino (alternate member with Mitch Steir)President – Savills Studley
Appointment to the Group Executive Board: Michael was appointed to the Group Executive Board when Studley, Inc. joined Savills in May 2014.
Background and relevant experience: He joined Studley, Inc. in October 1991 and became president in 2002.
Other appointments: Michael serves on the Real Estate Board of New York’s Board of Governors and the Advisory Board of the Zell-Lurie Real Estate Center at Wharton.
SAVILLS PLC REPORT AND ACCOUNTS 2015 45
Overview
/ Strategy / P
erformance / G
ove
rna
nc
e / Financial statements
Time commitments and conflictsThe Board is satisfied that the Chairman and each of the Non-Executive Directors committed sufficient time during the year to enable them to fulfil their duties as Directors of the Company. None of the Non-Executive Directors has any conflict of interest which has not been disclosed to the Board in accordance with the Company’s Articles of Association (‘Articles’).
Board evaluationIn accordance with the provisions of the Code it is our intention to conduct an external independent evaluation of Board effectiveness and performance and that of its principal Committees at least every three years.
This year the annual Board evaluation was led by the Chairman and supported by the Group Legal Director & Company Secretary. Next year the Board will engage an independent external facilitator to undertake the evaluation. The 2015 internal evaluation covered the performance of the Board as a whole as well as that of its Committees and involved each Board member completing a questionnaire and then using this as the background for a confidential interview. The evaluation covered six core themes: Board effectiveness, Board structure, working practices, succession planning, relationships with shareholders and future priorities in relation to Board performance. The feedback obtained was collated into a report which was presented to the Board.
The evaluation showed that the Board and its Committees continued to operate effectively without any significant areas of concern. In an effort to continue to improve, however, recommendations arising from the evaluation included: the need to further enhance succession plans in place covering both the executive and Non-Executive Directors, the need to maintain the culture of the Board and maintain continuity through a period of significant change in the membership of the Board, the need to have both updated and tested crisis management plans in place to allow the Board to respond to serious unexpected events and the need to keep the Group’s strategy and development plans under constant review to ensure that these remain appropriate in the light of the current market uncertainty.
Overall, the Board considers the performance of each Director to be effective and concluded that both the Board and its Committees continue to provide effective leadership and exert the required levels of governance and control. The shareholders should therefore support their re-election or re-appointment (as applicable) to the Board at the AGM in May. The Board will continue to review its procedures, effectiveness and development.
The skills and experience of the Directors are set out on page 44.
Effectiveness
Board composition and balance
Non-Executive Chairman – 1Non-Executive Directors – 5Executive Directors – 2
Balance of Non-Executive Directors and Executive Directors
Length of Tenure of Non-Executive Directors
10+ years – 25-9 years – 10-4 years – 3
At all times during the year at least half of the Board members, excluding the Chairman, were Independent Non-Executive Directors.
Chairman and Chief ExecutiveThe posts of Chairman and Group Chief Executive are distinct and separate and their roles and responsibilities are clearly established. The Chairman leads the Board and ensures the effective engagement and contribution of all Executive and Non-Executive Directors. The Group Chief Executive has responsibility for all Group businesses and acts in accordance with the authority delegated by the Board. There are a number of areas where the Board has delegated specific responsibility to management, including responsibility for the operational management of the Group’s businesses as well as reviewing strategic issues and risk matters in advance of these being considered by the Board and/or its Committees. The Board considers that throughout the year the Company was in full compliance with the Code.
Independence of the Non-Executive DirectorsThe Non-Executive Directors are responsible for bringing independent and objective judgement and scrutiny to matters before the Board and its Committees. The Board monitors the independence of its Non-Executive Directors, particularly those who have given long service. It is the view of the Board that each of the Non-Executive Directors brings considerable management expertise and is an Independent Non-Executive Director, being independent of management and having no business or other relationship which could interfere materially with the exercise of their judgement. In particular, notwithstanding his long service on the Board, the Board continues to consider that Charles McVeigh remains entirely independent in character and judgement. His experience provides valuable insight, knowledge and continuity.
Senior Independent DirectorMartin Angle is the Senior Independent Director and is available to shareholders if they have concerns which have not been addressed by contact with the Chairman and/or Group Chief Executive.
SAVILLS PLC REPORT AND ACCOUNTS 201546
Corporate Governance Statement continued
DiversityThe Board is aware that the number of women on boards remains a topic for debate for companies and regulators. We fully agree with the spirit and aspirations of the Davies Report to increase the number of women on company boards. However, all appointments to the Board are made on merit and within this context, whilst having regard to the recommendations of the Davies Report, the Board continues to view diversity in the widest sense, with a view to appointing the best-placed individual for the role. Appointing the best people to the Board is critical to the success of the Company and our focus remains on attracting the right talent and skills irrespective of gender or diversity.
The Board is committed to a culture that attracts and retains talented people to deliver outstanding performance and further enhance the success of the Group. The Board recognises the benefits of having diversity across all areas of the Group. In a sector which historically has struggled to retain a high percentage of female leaders, we are striving to redress the balance with our successful graduate recruitment programme which aims to have a balanced intake of males and females and should help to ensure that there continues to be a diversity of talent within the Company from which we can draw the future leaders of our Company. The Company’s policy on diversity applies across all levels of the Group and further details of the policy can be found in the Resources and Relationships section on pages 22 to 26.
The biographies of the Board members appear on page 44.
Board induction, training and supportTo ensure a full understanding of Savills and its businesses, following their appointment to the Board, each Director undergoes a comprehensive and tailored induction programme which introduces the Director to the Group’s businesses, its operations, strategic plans and key risks. New Directors are also provided with information on relevant share dealing policies, Directors’ duties, Company policies and governance. The induction also includes one to one briefings from the Heads of the Principal Businesses and an introduction to each Group business’s development strategy.
The Group Legal Director & Company Secretary is responsible for ensuring that the Directors receive regular updates on developments in legal and regulatory matters.
Directors’ conflicts of interestThe Directors are subject to a statutory duty under the Companies Act 2006 to avoid situations in which they have, or could have, an interest that conflicts or possibly may conflict with the interests of the Company. A Director will not be in breach of that duty if the relevant matter has been authorised by the other Directors in accordance with the Articles. The Board has adopted a set of guiding principles on managing conflicts and approved a process for identifying current and future actual and potential conflicts of interest. It was also agreed that the Nomination Committee would review authorised conflicts at least annually or if and when a new potential conflict situation was identified or a potential conflict situation materialised. During 2015, actual and potential conflicts of interest that were identified by each Director were subsequently authorised by the Nomination Committee, subject to appropriate conditions in accordance with the guiding principles. Procedures adopted to deal with conflicts of interest continue to operate effectively and the Board’s authorisation powers continue to be exercised properly in accordance with the Company’s Articles of Association.
Nomination Committee Report
The Nomination Committee has an important role to play in ensuring that the Board and its principal Committees have the right mix of skills, experience and diversity to deliver Group strategy and to create value. The Committee keeps under review and evaluates the composition of the Board and its Committees to maintain the appropriate balance of skills, knowledge and independence to be able to function effectively.
In consultation with the Chairmen of the principal Committees, the Nomination Committee will continue to monitor the needs of the Board and its Committees in the context of Group strategy, with the aim of ensuring that the Group’s succession planning policy evolves such that there is an identifiable supply of talent and experience available to the Board and its Committees from which to select successors.
MeetingsAttendance table
Committee memberMeetings attended
Meetings eligible to
attend
Peter Smith 4 4
Martin Angle 4 4
Tim Freshwater 4 4
Liz Hewitt 4 4
Rupert Robson* 2 2
Jeremy Helsby 4 4
* Rupert Robson was appointed to the Board on 23 June 2015.
As at 31 December 2015 and up to the date of this Report, the Nomination Committee was primarily composed of Independent Non-Executive Directors. Biographical details relating to each of the Committee members is shown on page 44.
SAVILLS PLC REPORT AND ACCOUNTS 2015 47
Overview
/ Strategy / P
erformance / G
ove
rna
nc
e / Financial statements
Peter SmithChairman of the Nomination Committee
During the year, the Committee comprised the Independent Non-Executive Directors, together with the Chairman and the Group Chief Executive. The Committee Chairman is Group Chairman, Peter Smith (save in circumstances where the Chairman’s succession is considered). Any other Director, the Group Legal Director & Company Secretary or an external adviser may be invited by the Committee to attend the meetings from time to time, as appropriate.
The Committee meets at least twice a year, or as required, and met four times during 2015. There was full attendance at all meetings by members, as shown in the table on page 42. Members of the Committee also attend the Company’s AGM at which there is an opportunity to meet with shareholders. The Committee Chairman is on hand to answer questions in the event that shareholders ask specific questions related to the Nomination Committee and its activities.
Committee objective and activitiesThe primary objective of the Committee is to review the size and composition of the Board and its key Committees and to plan for its progressive refreshing, with regard to balance and structure.
The Committee has standing items that it considers regularly under its Terms of Reference; for example, the Committee considered and approved Directors’ potential conflicts of interest and reviewed its own Terms of Reference (which are reviewed at least annually or as required, e.g. to reflect changes to the UK Corporate Governance Code or as a result of changes in regulations or best practice).
More detailed information on the role and responsibilities of the Committee can be found in the Committee’s Terms of Reference which can be accessed on the Company’s website at www.savills.com.
Succession planning and diversityThe Company adopts a formal, rigorous and transparent procedure for the appointment of new Directors and key Senior Executives with consideration to gender and diversity in its widest sense. Before making an appointment, the Committee assesses the balance of skills, knowledge, independence, experience and diversity of the Board and, in view of this assessment, will draw up a description of the role and competencies needed, with a view to appointing the best placed individual for the role. In making a recommendation to the Board on a Non-Executive Director appointment, the Nomination Committee specifically considers the expected time commitment of the proposed Non-Executive Director and other commitments they may already have. The Company uses recruitment consultants to assist the Committee in delivering its objectives and responsibilities; and the search firms are required to present a mix of suitable male and female candidates. No Director is involved in decisions regarding his or her own succession.
Activity during the yearDuring the year, the Committee focused on succession planning and in doing so, it considered the tenure, mix and diversity of skills and experience of existing Board members and those of prospective Board members in the context of the Group’s strategy. The Committee agreed that it would be appropriate to appoint an additional Non-Executive Director to ensure that the Board, as a whole, had an appropriate range of skills, experience and knowledge to support the future development of the business. In the search for prospective Non-Executive Directors, the Nomination Committee retained independent executive search firm Spencer Stuart as recruitment consultants. The Committee agreed the process, mandate and timetable with Spencer Stuart and oversaw the selection process. Spencer Stuart were asked to compile a long list of potential candidates which was reduced to a final shortlist of four candidates by the Committee. The four candidates were then interviewed by Peter Smith and the Group Chief Executive. Rupert Robson was identified as the preferred candidate and then met with the other Committee members. In considering the appointment, the Nomination Committee considered Rupert’s ability to make the appropriate time available to the Company in the light of his other
commitments, as noted in his biography on page 44 and was satisfied that he would be able to meet fully his obligations to the Company, which remains the view of the Committee. The unanimous recommendation of the Committee to the Board was that Rupert Robson be appointed as a Non-Executive Director with effect from 23 June 2015.
In anticipation of the succession of the Chairman, Odgers Berndtson were appointed during the year (from a shortlist of three executive search firms) to search for a new Non-Executive Director who would succeed Peter Smith on his retirement as Chairman at the close of the AGM in May 2016. Prior to external recruitment consultants being appointed, the qualities and skill set sought for the role as Chairman were agreed by the Board. The recruitment process was overseen by the Senior Independent Director. Following a detailed external search Odgers Berndtson compiled a long list of potential candidates which was reduced to a final shortlist by the Committee. Interviews were held with individuals on the short list by the Directors of the Board before Nicholas Ferguson was selected as the preferred candidate by the Committee. The unanimous recommendation of the Committee to the Board was that Nicholas Ferguson be appointed as a Non-Executive Director, which occurred with effect from 26 January 2016.
New Directors receive a tailored induction as detailed on page 47.
Coming yearThe Committee recognises the importance of planning for the future and of having a succession planning policy designed to bring in new skills and perspectives to the Board which complement the experience of the existing Board members. In the coming year the Committee will continue to keep the Board’s composition under review and consider how the composition may be enhanced to ensure that the Board continues to reflect the needs of the Company and its shareholders.
AccountabilityInternal control and risk managementThe Board has overall responsibility for risk management and internal controls across the Group. This responsibility includes the determination of the nature and extent of the principal risks the Board is willing to take to achieve its strategic objectives and for ensuring that an appropriate culture has been embedded throughout the organisation. Risk management is implemented from the top down. The Board is supported by the Audit Committee in discharging its oversight duties with regard to internal control and risk management.
Whilst the Board is responsible for ensuring that an appropriate culture has been embedded throughout the organisation and establishing and maintaining the Group’s system of risk management and internal control to safeguard shareholders’ investments and the Group’s assets (and for reviewing the effectiveness of this system), such a system is designed to manage rather than eliminate the risk of failure to achieve business objectives and can provide only reasonable and not absolute assurance against material misstatement or loss. Further details of the risk management process, the principal risks and uncertainties faced by the Group and the associated mitigating actions are set out on pages 27 to 31.
The Board’s attitude and appetite to risk is communicated to the Group’s businesses through the strategy planning processes. The Audit Committee monitors the ongoing status and progress of action plans against key risks on a regular basis and reports its findings to the Board.
Going concernThe Group’s business activities, together with the factors considered likely to affect its future development, performance and position are set out in the Strategic Report on pages 10 to 32. The financial position of the Group, its cash flows, liquidity position and borrowing facilities are described on pages 37 and 38. In addition, Note 3 to the financial statements includes the Group’s objectives, policies and processes for managing its capital, its financial risk management
SAVILLS PLC REPORT AND ACCOUNTS 201548
Corporate Governance Statement continued
objectives, details of its financial instruments and hedging activities, and its exposures to credit risk and liquidity risk.
The Group has considerable financial resources, including a £250m committed revolving credit facility (augmented by a £50m ‘accordion’ option which can be activated to increase the facility) that runs to December 2020. The Group has a broad geographic presence, service offering and extensive client spread ensuring that the Group is not over-dependent on one geography, service line or client. As a consequence, the Directors believe that the Group is well placed to manage its business risks successfully.
After making appropriate enquiries, the Directors have a reasonable expectation that the Company and the Group have adequate resources to continue as a going concern for the foreseeable future. Accordingly, they continue to adopt the going concern basis in preparing the Report and Accounts.
Relations with shareholdersDialogue with shareholdersThe Group recognises the importance of maintaining regular dialogue with its shareholders. The Group Chief Executive and Group Chief Financial Officer lead a regular programme of meetings and presentations with analysts and investors, including presentations following the publication of the Company’s full and half year results. This programme maintains a continuous two-way dialogue between the Company and shareholders, and helps to ensure that the Board is aware of shareholders’ views on a timely basis. The Board also normally receives feedback twice each year from its corporate brokers on investors’ and the market’s perceptions of the Company. The Chairman and the Senior Independent Director are also available to meet shareholders if so required. The Company has enjoyed and is appreciative of the significant shareholder support that it has enjoyed in recent years in relation to the Group’s remuneration policy, The Company continues to welcome shareholder views with regard to the Group’s Remuneration Policy and the Remuneration Committee gives due consideration to such views when raised. Details of the Company’s response to any shareholder views raised would be included in the relevant year’s Remuneration Report.
Constructive use of the Annual General MeetingThe AGM provides the Board with a valuable opportunity to communicate with private shareholders and is generally attended by all of the Directors. Shareholders are given the opportunity to ask questions before and during the meeting and to meet Directors following the conclusion of the formal part of the meeting. In accordance with the Code, the level and manner of voting of proxies lodged on each resolution at the AGM is declared at the meeting and published on the Company’s website. The outcome of the votes cast at the 2015 AGM in respect of the 2014 Directors’ Remuneration Report can be found on page 66. The Directors aim to give as much notice of the AGM and other general meetings as possible, which is at least 20 working days before the AGM and at least 14 working days before other general meetings in accordance with the UK Corporate Governance Code.
Details of the resolutions to be proposed at the 2016 AGM can be found in the AGM Notice which accompanies this Report and Accounts.
In accordance with the Articles of Association, electronic and paper proxy appointments and voting instructions must be received not later than 48 hours before a general meeting. The Company has taken advantage of the provisions within the Companies Act 2006 (‘CA 2006’) which allow communications with shareholders to be made electronically where shareholders have not requested hard copy documentation. Details of the information available to shareholders can be found on page 140. Information about the Company is also available on the Company’s website (www.savills.com).
Audit Committee Report
This report details the Committee’s major considerations and activities during the 2015 financial year in ensuring that the Company’s governance processes remain appropriate, robust, of a high standard and are rigorously applied.
The Audit Committee has a key role in ensuring the integrity of the Group’s financial statements, internal controls and effectiveness of its risk management processes. The Audit Committee also has a role in representing the interests of shareholders by monitoring the activities and conduct of management and the auditors. The principal changes to the 2014 UK Corporate Governance Code extended the Board’s responsibilities to undertake a robust assessment of the principal risks associated with the Company’s business model, future performance, solvency and liquidity; and requires a statement of the longer-term prospects and viability of the Company, as well as monitoring the Company’s risk management and internal controls systems.
During the year, the Committee reviewed the principal risks and risk appetite, to ensure the alignment of these with the Company’s strategic objectives. It monitored the effectiveness of the control environment through the review of reports from Internal Audit, management and the External Auditors and ensured the quality of the Company’s financial reporting by reviewing the 2014 Report and Accounts and the Half Year Financial Statements, and subsequently in 2016 the Company’s 2015 Report and Accounts. The Committee considered the processes supporting the assessment of the Group’s longer-term solvency and liquidity in support of the viability statement. The Committee agreed that three years was the appropriate period for the assessment of the viability statement as this is the timescale of the Group’s strategic planning process. The Committee will continue to monitor its own activities in the light of regulatory and best practice developments.
The key matters considered in the year are set out on pages 51 and 52.
The Audit Committee has reviewed the content of this year’s Annual Report and Accounts and has advised the Board that in its view the Report taken as a whole is in its opinion fair, balanced and understandable and that it provides the information necessary for shareholders to assess the Group’s position, performance, business model and strategy.
The Committee noted the unqualified opinion from the External Auditors on the 2015 Annual Report.
On behalf the Audit Committee, I would like to take the opportunity to thank Martin Angle, who served as Chair of the Audit Committee until May 2015, for his work for, and guidance of the Committee.
SAVILLS PLC REPORT AND ACCOUNTS 2015 49
Overview
/ Strategy / P
erformance / G
ove
rna
nc
e / Financial statements
Liz HewittChair of the Audit Committee
The Chair of the Committee meets informally, and is in regular contact with the Group Chief Financial Officer, Group Director of Risk & Internal Audit and the Group Legal Director & Company Secretary. This Group develops the Committee’s proposed annual work plan for consideration by the Committee and generally meets ahead of each full Committee meeting to prepare and identify key areas for consideration by the Committee. The Committee meets separately with the Group Chief Financial Officer, the External Auditors and the Group Director of Risk & Internal Audit without management being present.
The Non-Executive Chairman, Group Chief Executive, Group Chief Financial Officer, Group Financial Controller, Group Director of Risk & Internal Audit and Group Legal Director & Company Secretary attend each meeting, as does the lead audit partner from the Group’s External Auditors. Other senior executives from across the Group are invited to present reports to assist the Audit Committee in discharging its duties.
The Chair of the Committee also attends the AGM to respond to shareholder questions on its activities.
CompositionThe Committee is a core element of the Company’s governance framework. The Audit Committee is chaired by Liz Hewitt. Liz Hewitt became Committee Chairman when Martin Angle stood down as Committee Chairman at the conclusion of the 2015 AGM. Three independent Non-Executive Directors, Liz Hewitt (and previously Martin Angle), Tim Freshwater and Rupert Robson are members of the Committee. Members of the Committee are appointed by the Board following recommendations by the Nomination Committee and membership is reviewed annually by the Nomination Committee as part of the annual Board performance evaluation.
All members of the Committee receive induction including an overview of the business, its financial dynamics and risks, and meetings with senior management. Committee members are expected to have an understanding of the principles of, and recent developments in, financial reporting and internal controls, risk management, and internal and external audit roles and responsibilities.
Role, main objectives and responsibilitiesThe Committee’s role is to assist the Board in discharging its duties and responsibilities for financial reporting, internal control, the risk management process and in making recommendations to the Board on the appointment of the External Auditors. The Committee is responsible for the scope and results of the external audit work, its cost effectiveness and the independence and objectivity of the External Auditors.
The Committee is authorised to investigate any matter within its Terms of Reference (a copy of which can be found in the governance section of the Company’s website at www.savills.com/en/company-information/corporate-governance.aspx) and has access to the services of the Group Legal Director & Company Secretary and, where necessary, the authority to obtain external legal or other independent professional advice to fulfil its duties.
The Committee is responsible for reviewing the Group’s whistle-blowing arrangements, including ensuring that appropriate arrangements are in place for employees to be able to raise in confidence matters of alleged impropriety and for ensuring that appropriate follow-up actions are taken.
Activities of the CommitteeTo enable the Committee to carry out its duties and responsibilities effectively it works to a planned programme of activities focused on key events in the annual financial reporting cycle. This work includes items that the Committee considers regularly under its Terms of Reference. The Committee relies on information and support from management across the business, receiving reports and presentations from, business management, the heads of key Group functions, the Internal and External Auditors, which it challenges as appropriate, and reports its findings to the Board.
MeetingsAttendance table
The Committee met four times during the year and the attendance at the meetings is shown in the table below:
Committee memberMeetings attended
Meetings eligible to
attend
Liz Hewitt (Chair from 13 May 2015) 4 4
Tim Freshwater 4 4
Martin Angle (Chair until 13 May 2015) 4 4
Rupert Robson* 2 3
* Rupert Robson was appointed as a Director of the Company and member of the Committee on 23 June 2015.
As at 31 December 2015 and up to the date of this Report, the Audit Committee was comprised entirely of Independent Non-Executive Directors. The Board considers the Committee members to have recent and relevant financial experience as per the UK Corporate Governance Code. Biographical details of the Committee members are shown on page 44.
Martin Angle retires as a member of the Committee at the Committee’s March 2016 meeting.
SAVILLS PLC REPORT AND ACCOUNTS 201550
Corporate Governance Statement continued
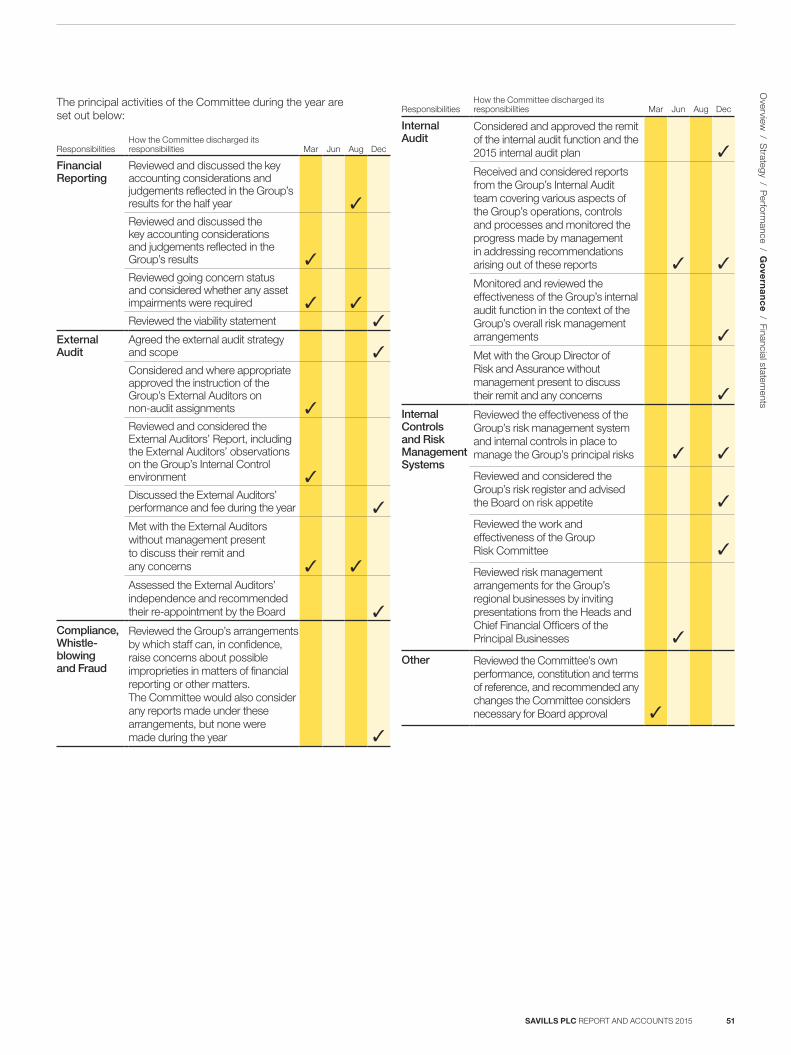
The principal activities of the Committee during the year are set out below:
ResponsibilitiesHow the Committee discharged its responsibilities Mar Jun Aug Dec
Financial Reporting
Reviewed and discussed the key accounting considerations and judgements reflected in the Group’s results for the half year ✓Reviewed and discussed the key accounting considerations and judgements reflected in the Group’s results ✓Reviewed going concern status and considered whether any asset impairments were required ✓ ✓Reviewed the viability statement ✓
External Audit
Agreed the external audit strategy and scope ✓Considered and where appropriate approved the instruction of the Group’s External Auditors on non-audit assignments ✓Reviewed and considered the External Auditors’ Report, including the External Auditors’ observations on the Group’s Internal Control environment ✓Discussed the External Auditors’ performance and fee during the year ✓Met with the External Auditors without management present to discuss their remit and any concerns ✓ ✓Assessed the External Auditors’ independence and recommended their re-appointment by the Board ✓
Compliance, Whistle‑ blowing and Fraud
Reviewed the Group’s arrangements by which staff can, in confidence, raise concerns about possible improprieties in matters of financial reporting or other matters. The Committee would also consider any reports made under these arrangements, but none were made during the year ✓
ResponsibilitiesHow the Committee discharged its responsibilities Mar Jun Aug Dec
Internal Audit
Considered and approved the remit of the internal audit function and the 2015 internal audit plan ✓Received and considered reports from the Group’s Internal Audit team covering various aspects of the Group’s operations, controls and processes and monitored the progress made by management in addressing recommendations arising out of these reports ✓ ✓Monitored and reviewed the effectiveness of the Group’s internal audit function in the context of the Group’s overall risk management arrangements ✓Met with the Group Director of Risk and Assurance without management present to discuss their remit and any concerns ✓
Internal Controls and Risk Management Systems
Reviewed the effectiveness of the Group’s risk management system and internal controls in place to manage the Group’s principal risks ✓ ✓
Reviewed and considered the Group’s risk register and advised the Board on risk appetite ✓
Reviewed the work and effectiveness of the Group Risk Committee ✓
Reviewed risk management arrangements for the Group’s regional businesses by inviting presentations from the Heads and Chief Financial Officers of the Principal Businesses ✓
Other Reviewed the Committee’s own performance, constitution and terms of reference, and recommended any changes the Committee considers necessary for Board approval ✓
SAVILLS PLC REPORT AND ACCOUNTS 2015 51
Overview
/ Strategy / P
erformance / G
ove
rna
nc
e / Financial statements
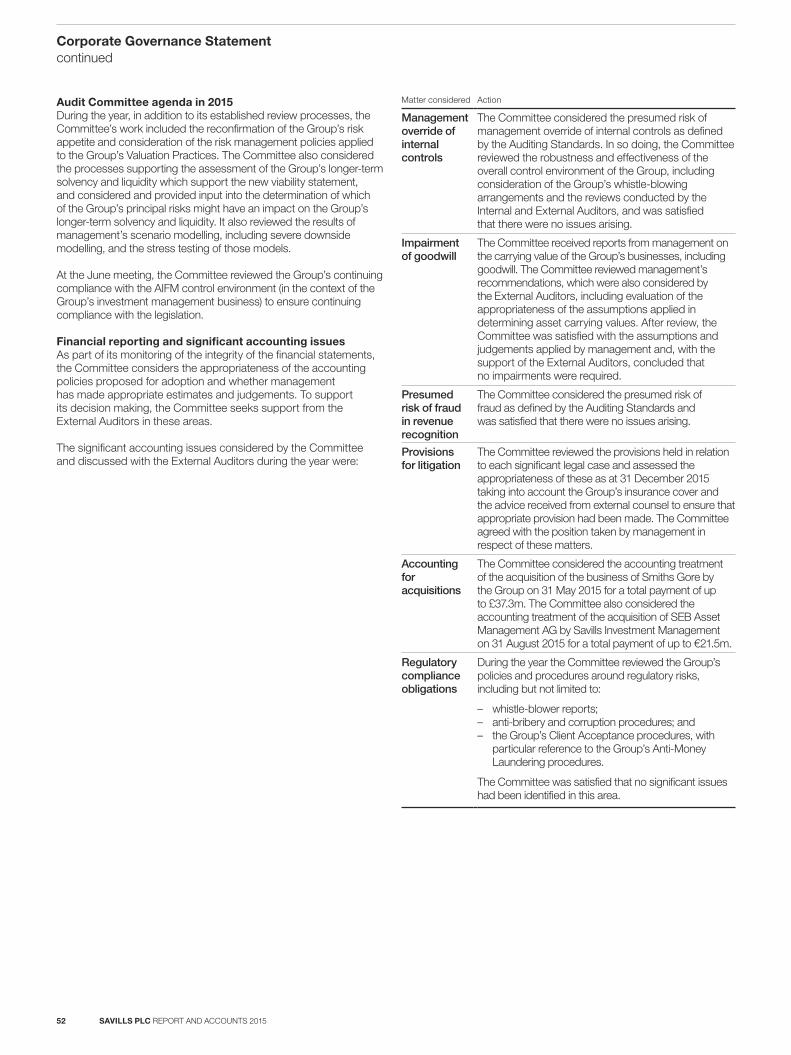
Audit Committee agenda in 2015During the year, in addition to its established review processes, the Committee’s work included the reconfirmation of the Group’s risk appetite and consideration of the risk management policies applied to the Group’s Valuation Practices. The Committee also considered the processes supporting the assessment of the Group’s longer-term solvency and liquidity which support the new viability statement, and considered and provided input into the determination of which of the Group’s principal risks might have an impact on the Group’s longer-term solvency and liquidity. It also reviewed the results of management’s scenario modelling, including severe downside modelling, and the stress testing of those models.
At the June meeting, the Committee reviewed the Group’s continuing compliance with the AIFM control environment (in the context of the Group’s investment management business) to ensure continuing compliance with the legislation.
Financial reporting and significant accounting issuesAs part of its monitoring of the integrity of the financial statements, the Committee considers the appropriateness of the accounting policies proposed for adoption and whether management has made appropriate estimates and judgements. To support its decision making, the Committee seeks support from the External Auditors in these areas.
The significant accounting issues considered by the Committee and discussed with the External Auditors during the year were:
Matter considered Action
Management override of internal controls
The Committee considered the presumed risk of management override of internal controls as defined by the Auditing Standards. In so doing, the Committee reviewed the robustness and effectiveness of the overall control environment of the Group, including consideration of the Group’s whistle-blowing arrangements and the reviews conducted by the Internal and External Auditors, and was satisfied that there were no issues arising.
Impairment of goodwill
The Committee received reports from management on the carrying value of the Group’s businesses, including goodwill. The Committee reviewed management’s recommendations, which were also considered by the External Auditors, including evaluation of the appropriateness of the assumptions applied in determining asset carrying values. After review, the Committee was satisfied with the assumptions and judgements applied by management and, with the support of the External Auditors, concluded that no impairments were required.
Presumed risk of fraud in revenue recognition
The Committee considered the presumed risk of fraud as defined by the Auditing Standards and was satisfied that there were no issues arising.
Provisions for litigation
The Committee reviewed the provisions held in relation to each significant legal case and assessed the appropriateness of these as at 31 December 2015 taking into account the Group’s insurance cover and the advice received from external counsel to ensure that appropriate provision had been made. The Committee agreed with the position taken by management in respect of these matters.
Accounting for acquisitions
The Committee considered the accounting treatment of the acquisition of the business of Smiths Gore by the Group on 31 May 2015 for a total payment of up to £37.3m. The Committee also considered the accounting treatment of the acquisition of SEB Asset Management AG by Savills Investment Management on 31 August 2015 for a total payment of up to €21.5m.
Regulatory compliance obligations
During the year the Committee reviewed the Group’s policies and procedures around regulatory risks, including but not limited to:
– whistle-blower reports; – anti-bribery and corruption procedures; and – the Group’s Client Acceptance procedures, with
particular reference to the Group’s Anti-Money Laundering procedures.
The Committee was satisfied that no significant issues had been identified in this area.
SAVILLS PLC REPORT AND ACCOUNTS 201552
Corporate Governance Statement continued
Internal AuditThe provision of Internal Audit services during 2015 was delivered by the Group’s Internal Audit team with support from a third-party service provider. The Board’s responsibility for internal control and risk is detailed on page 40 and is incorporated into this Report by reference.
During the year, the Committee reviewed and approved the Internal Audit plan, having regard to the complementary roles of the Internal Audit function and External Auditors. The Committee ensured that the Internal Audit team had the necessary resources and information made available to it to enable it to fulfil its mandate to the appropriate professional standards. The Committee reviewed Internal Audit reports on a regular basis and the Group Director of Risk & Assurance attended meetings and presented to the Committee. In assessing the performance of the Internal Audit function, the Committee considered and monitored its effectiveness in the context of the Company’s risk management system and took into account management’s assessment of and responsiveness to the Internal Auditor’s findings and recommendations and reports from the External Auditors on any issues identified during the course of their work.
Assessment of Risk Management and Internal ControlThe Audit Committee, on behalf of the Board undertook a robust review of the effectiveness of the system of risk management and internal control. In performing its review of effectiveness, the Committee reviewed and assessed the following reports and activities:
– internal audit reports on the review of the controls across the Group and the monitoring of management actions arising from these reviews;
– management’s own assessment of risk and the performance of the system of risk management and internal control during 2015;
– reports from the Group Director of Risk & Assurance including reports on Group-wide risk assessment activity and annual self-assessment findings; and
– reports from the External Auditors on any issues identified during the course of their work.
Having reviewed the effectiveness of the system of internal control, the Committee was satisfied that necessary actions have been, or are being taken to remedy any significant failings or weaknesses identified.
The integrity of the Group’s relationship with the External Auditor and the effectiveness of the External Audit process The Committee carried out a review of the effectiveness of the external audit process and considered the reappointment of PricewaterhouseCoopers LLP (‘PwC’) and the appropriateness of its fees. The review covered a broad range of matters including amongst other matters, the quality of PwC staff, its expertise, resources and the independence of the PwC audit.
The Committee considered the audit plan for the year and assessed how the External Auditors had performed. In deciding whether to recommend the reappointment of PwC the Committee considered the robustness of their challenge and findings on areas which require judgement, the strength and depth of the lead partners and feedback from the Group’s management.
There were no significant findings arising from the evaluation this year and the Committee concluded that both the audit and the audit process were effective. The Committee recommended to the Board that PwC be reappointed as External Auditors for a further year and a resolution recommending their reappointment will be put to shareholders at the 2016 AGM.
The Financial Reporting Council (‘FRC’) has amended the UK Corporate Governance Code to require audit tendering every 10 years on a comply or explain basis for FTSE 350 companies.
On 26 September 2014, the Competition Commission (‘CC’), now the Competition Markets Authority (‘CMA’), published its final Order on mandatory audit tendering for FTSE 350 companies such as Savills. This Order came into effect on 1 January 2015 and applies to financial years beginning on or after 1 January 2015 and therefore applies to the year which is subject to this Annual Report. The Order confirms that FTSE 350 companies will need to undertake a tendering process in respect of their statutory audit services at least every 10 years. Furthermore, if a company has not completed a tendering appointment process of statutory auditors for five consecutive financial years, the Order requires the Audit Committee of such company to state in its annual report when the company intends to conduct the tender and why such proposed date is in the best interests of the company (and such statement must be repeated in each subsequent report until a competitive tender is conducted).
The requirement for conducting mandatory audit tenders every 10 years is subject to transitional arrangements set out in the Order and, accordingly, this requirement does not apply to PwC’s proposed reappointment as External Auditors which will be proposed to the shareholders at the 2016 AGM.
SAVILLS PLC REPORT AND ACCOUNTS 2015 53
Overview
/ Strategy / P
erformance / G
ove
rna
nc
e / Financial statements
The Committee will be reviewing the Company’s audit tender timetable and processes as part of a wider review of the Order and in preparation for the audit tender which will be carried out at the end of the next lead audit partner term in 2020. The Committee concluded, following its review of the external audit process in 2015, that PwC remained objective and independent whilst at the same time having considerable knowledge and experience of the Group and providing expert services. Accordingly, the Committee is satisfied that the proposed retender of audit services in 2020 is in the best interests of the shareholders of the Company.
The EU has approved new EU-wide audit legislation for audit firm tendering requirements. The FRC is now considering the implementation of these changes, including transitional arrangements. The FRC is also proposing changes to its Ethical Standards for Auditors and to its Auditing Standards.
PwC has been the Company’s Auditor since 2001 following a tender for the external audit. The senior partner responsible is rotated every five years to ensure objectivity and the last lead partner change took place in 2011. At the close of the 2015 audit a new audit partner will have lead responsibility for the external audit. The transition to the new audit partner has already started.
Auditor IndependenceThe Committee recognises the importance of external auditor objectivity and monitors their independence. The Committee has established policies to consider the appropriateness of appointing the External Auditors to perform non-audit services, and whether the External Auditors are the most suitable supplier.
During the year, PwC was paid £1.4m for audit services and £1.2m for non-audit services, principally for advice on taxation and transaction-related matters. Details of the fees paid to the External Auditors can be found in Note 7.3 on page 99. Contracts for non-audit services in excess of £0.1m require Committee approval and the Chair of the Audit Committee is notified of new instructions for the delivery of non-audit services below this level.
The Committee is satisfied that in view of their knowledge and experience of the Company, PwC was best placed to provide such non-audit services and that their objectivity and independence has not been impaired by reason of this further work. In line with the Company’s policy on the provision of non-audit work, the Committee will review the provision of non-audit work provided by the External Auditors on a case-by-case basis.
In accordance with the Group’s policy, the following non-audit services may not be provided by the External Auditors:
– bookkeeping or other services related to the accounting records or financial statements;
– financial information systems design and implementation; – Internal Audit outsourcing services; – management functions or human resources advice; or – advising on senior executive (including Executive Director)
remuneration.
To further safeguard the independence of the Company’s External Auditors and the integrity of the audit process, recruitment of senior employees from the External Auditors is not allowed for an appropriate period after they cease to provide services to the Company. Disclosure of relevant audit informationThe Directors confirm that, insofar as they are each aware, there is no relevant audit information of which PwC is unaware and each Director has taken the steps that ought to have been taken as a Director to be aware of any relevant audit information and to establish that PwC is aware of that information.
SAVILLS PLC REPORT AND ACCOUNTS 201554
Corporate Governance Statement continued
Rupert RobsonChairman of the Remuneration Committee (appointed 1 October 2015)
* The dividend cost for 2015 comprises the cost of the final dividend recommended by the Board (amounting to £10.7m), payment of which is subject to shareholder approval at the Company’s Annual General Meeting (‘AGM’) scheduled to be held on 11 May 2016, the cost of the supplemental dividend (£18.7m) declared by the Board on 9 March 2016 (payable to shareholders on the Register of Members as at 15 April 2016) and the interim dividend (£5.3m) paid on 12 October 2015.
** Executive Director remuneration comprises the remuneration paid to the Group Chief Executive Officer and Group Chief Financial Officer job holders between 1 January 2011 and 31 December 2015. Since 1 July 2010 the Executive Director representation on the Board has comprised these job holders.
2011–2015 Overview
Underlying Profit 141%
Dividend Payments to Shareholders* 108%
Executive Director Remuneration** 86%
Total Shareholder Return 170%
Dear Shareholder
On behalf of the Board, having been appointed as the Chairman of the Remuneration Committee with effect from 1 October 2015, I am pleased to introduce our 2015 Directors’ Remuneration Report (the ‘Report’) which sets out Savills remuneration philosophy and policy in relation to Directors’ remuneration and how this was implemented in the year ended 31 December 2015. In the interests of succinct reporting we have not reproduced the Remuneration Policy report in full. We have provided the approved policy table at the end of this report for ease of reference. The full report can be found on our website.
Our remuneration philosophy Our focus and business policy is founded on the premise that staff in our sector are motivated through highly incentive-based (and therefore variable) remuneration consistent with our partnership style culture. We firmly believe that this approach best aligns shareholders’ and management’s interests and incentivises superior performance and the creation of long-term shareholder value. This approach also ensures that our reward arrangements are consistent with and sensitive to the cyclical nature of real estate markets.
Our Remuneration Policy is designed to deliver these objectives and to provide the reward potential necessary for the Company to attract, retain and motivate the high-calibre individuals on whom its continued growth and development depend. Reflecting this philosophy, the salaries for the Executive Directors, Group Executive Board members and senior fee-earners are set significantly below market medians for similar businesses, with a greater emphasis on the performance-related elements of profit share and/or, outside the UK, commission in the total reward package.
The Committee is mindful of its responsibility to reward appropriately, but not excessively, and rigorously assesses competitive positioning in setting remuneration and determining targets to ensure that reward properly reflects performance, that it supports the delivery of our strategic and operational objectives and that it is fair to management and shareholders alike. Overall, we expect employment costs over the cycle to be in the range of 65%–70% of revenues.
2015 performance and remunerationAnnual performance-related profit shareSavills delivered another excellent performance in 2015, delivering results significantly above expectations. Key highlights for the year included:
– Underlying profit of £121.4m which represented 21% growth on 2014;
– Revenue growth of 19% on 2014; and – Further improvement in the Group’s underlying profit margin
to 9.5% (2014: 9.3%).
Annual statement
SAVILLS PLC REPORT AND ACCOUNTS 2015 55
Overview
/ Strategy / P
erformance / G
ove
rna
nc
e / Financial statements
Directors’ Remuneration Report
GovernanceThis Report has been prepared on behalf of the Board by the Remuneration Committee (the ‘Committee’) in accordance with the requirements of the Companies Act 2006 and the Large and Medium-sized Companies and Groups (Accounts and Reports) (Amendment) Regulations 2013 (‘Regulations’) and the auditable disclosures referred to in the External Auditor’s Report on pages 73 to 79 as specified by the UK Listing Authority and the Regulations.
In addition to this, 2015 also saw further strong progress in the delivery of the Group’s longer-term strategic objectives, in particular:
– the acquisition, by Savills Investment Management, of SEB Asset Management, which achieves a step-change in the scale of the Group’s Investment Management platform;
– the continued successful integration of Savills Studley, in particular delivering the growth targeted for the year to expand the business geographic spread and broaden/further strengthen its service offering; and
– implementing a succession plan for the Group’s Asia Pacific business, including strengthening the Asia Pacific central management team through the recruitment of a Chief Operating/Financial Officer (to support the Asia Pacific Chief Executive) for the region.
Reflecting the very strong overall performance in 2015, the Committee considered it appropriate to approve annual performance-related profit share awards at the maximum potential in relation to the financial performance of the Group and in relation to delivery of strategic and operational objectives for the Executive Directors. We have provided transparent retrospective disclosure of the threshold, target and maximum financial targets which were set for the year, which can be found on page 59.
2016 remuneration An overview of the key decisions for 2016 is as follows:
– In line with our policy of not making annual incremental changes to base salary, there are no increases to base salary from last year.
– The variable remuneration structure will continue to operate in line with the current philosophy with the annual profit share based 70% on underlying profit before tax and 30% on the delivery for strategic objectives.
– The PSP award for the CEO will be an award of £550,000 which is the same as last year (200% of salary). The CFO award will be £250,000 (c.111% of salary) which is in line with 2014, and is lower than 2015.
– Following a review of the PSP performance targets and taking into consideration a number of factors including current global macro-economic and political concerns, the Committee decided to set the threshold EPS target at RPI +3% and the maximum target at RPI +8%. The Committee considers that this approach will most appropriately align the interests of management and shareholders. The relative total shareholder return target will remain in line with the previous years.
Governance developmentsOn behalf of the Remuneration Committee, I wanted to take the opportunity to thank Tim Freshwater, who served as Chairman of the Remuneration Committee until September 2015.
Last year we strengthened the malus and clawback provisions in our incentive programmes. As a Committee, we continue to monitor best practice developments in executive remuneration, and will particularly consider these as we undertake a review of our approach during the course of 2016, prior to submitting our Remuneration Policy to shareholders for approval in 2017. We would consult with shareholders prior to any substantive changes to our policy.
The Committee is appreciative of the significant shareholder support that it has enjoyed in recent years and welcomed shareholders’ endorsement of the 2014 Annual Remuneration Report at the 2015 AGM. We hope that you find this year’s Annual Remuneration Report equally clear and informative and that you will continue to support us by voting in favour of the resolution at this year’s AGM on 11 May 2016.
Rupert Robson Chairman of the Remuneration Committee
SAVILLS PLC REPORT AND ACCOUNTS 201556
Directors’ Remuneration Report continued
Annual Report on Remuneration
Role of the Committee The principal role of the Committee is to support the Group to achieve its strategic objectives by designing a remuneration policy consistent with the Group’s business model such that we have the ability to attract, recruit, retain and motivate the high-calibre individuals needed to deliver the Group’s strategy. The Committee is responsible for the broad policy governing senior staff pay and remuneration. It sets the actual levels of all elements of the remuneration of the Executive Directors and reviews that of Group Executive Board members. The Policy remains under periodic review to ensure that it remains consistent with the Company’s scale and scope of operations, supports business strategy and growth plans and helps drive the creation of shareholder value. The Committee also oversees the operation of Savills’ employee share schemes.
Committee members and attendeesAs shown in the table below, the Committee comprises the Independent Non-Executive Directors and the Non-Executive Chairman:
Committee member Position Status
Rupert Robson (appointed 23 June 2015)
Chair of the Committee (from 1 October 2015)
Independent
Tim Freshwater Chair of the Committee (to 30 September 2015)Member of the Committee (from 1 October 2015)
Independent
Martin Angle Member of the Committee
Independent
Liz Hewitt Member of the Committee
Independent
Peter Smith Member of the Committee
Non-Executive Chairman
Nicholas Ferguson, who joined the Board as an additional Independent Non-Executive Director on 26 January 2016, became a member of the Committee on the same date.
Committee attendee Position Status
Jeremy Helsby Group Chief Executive Officer
Attends by invitation (except when his own remuneration is discussed)
Chris Lee Group Legal Director & Company Secretary
Provides advice and support (except when his own remuneration is discussed) as well as acting as Secretary to the Committee
Simon Shaw, Group CFO, may be invited to attend meetings to provide an overview of market conditions and the Group’s financial performance.
MeetingsAttendance table
Committee memberMeetings attended
Meetings eligible to
attend
Rupert Robson (appointed 23 June 2015) 1 1
Tim Freshwater 4 4
Martin Angle 4 4
Liz Hewitt 4 4
Peter Smith 4 4
As at 31 December 2015 and up to the date of this Report, the Committee comprises Independent Non-Executive Directors and the Non-Executive Chairman. Biographical details relating to each of the Committee members are shown on page 44.
The Committee met four times during the year. The principal agenda items considered by the Committee during the year were as follows:
– reconfirming the Group’s remuneration policy in the context of the proposed new legislation relating to executive remuneration;
– agreeing performance targets for both the annual performance-related profit share and PSP awards;
– preparing an Annual Remuneration Report consistent with the legislation relating to executive remuneration;
– agreeing the remuneration packages of the Executive Directors and reviewing those of Group Executive Board members;
– approving the grant of Performance Share Plan awards; and – approving the grant of share awards to fee-earners and senior
managers across the Group.
Responsibilities of the CommitteeThe Committee’s principal responsibilities are to determine Company policy on senior executive remuneration and to set the remuneration arrangements of the Executive Directors and to review those of the members of the Group Executive Board. The Committee (excluding the Non-Executive Chairman) also determines the level of fees payable to the Non-Executive Chairman. In these respects, the Committee is advised by Deloitte LLP, who provide independent commentary on matters under consideration by the Committee and updates on market developments, legislative requirements and best practice, and internally by the Group Legal Director & Company Secretary.
Given the fundamental role that remuneration plays in the success of the Group, in terms of the recruitment, motivation and retention of high-quality staff, the Group Chief Executive Officer attends meetings by invitation and is consulted on the remuneration packages of the Group Chief Financial Officer and Group Executive Board members.
Advisers to the CommitteeIn determining Executive Director remuneration, the Committee has access to detailed external information and research on market trends and peer practice provided by its independent external adviser Deloitte LLP. Deloitte is a member of the Remuneration Consultants Group, and adheres to the voluntary code of conduct in relation to executive remuneration consulting in the UK. Deloitte’s fees are based on a time and material basis, within the parameters of an overall annual budget. In 2015, Deloitte received fees of £32,700 in relation to advice provided to the Committee. Deloitte provided no other services to the Group during the year.
SAVILLS PLC REPORT AND ACCOUNTS 2015 57
Overview
/ Strategy / P
erformance / G
ove
rna
nc
e / Financial statements
The Committee is satisfied that the advice received from Deloitte during the year was entirely objective and independent. The Committee will continue to keep these arrangements under review to ensure that they remain appropriate to the needs of the Committee in developing remuneration policy to support the delivery of Group strategy.
Terms of referenceThe Committee’s terms of reference, which are reviewed annually, or by exception to take account of regulatory changes or best practice, are available from the Group Legal Director & Company Secretary upon request or can be viewed on the Company’s website (www.savills.com).
Remuneration Policy
The Group’s remuneration arrangements for the Executive Directors, Group Executive Board members and senior fee-earners are structured to provide a competitive mix of variable performance-related (i.e. annual performance profit share and longer-term incentives) and fixed remuneration (principally base salary) to reflect individual and corporate performance. The objective is to set targets which are both achievable and stretching.
In determining the remuneration of the Executive Directors and reviewing that of the Group Executive Board members, the Committee reviews the role and responsibility of the individual, their performance and the arrangements applying across the wider
employee group. It also considers sector and broader market practice in the context of the prevailing economic conditions and corporate performance on environmental, social and governance issues.
Overview of the Remuneration PolicyA summary of the Remuneration Policy for Executive Directors and how it will be applied for 2016 is set out below.
The policy report, approved at the 2014 AGM, rather than the summary provided below, continues to be the policy under which the Company is bound. The policy table from the approved policy report is provided at the end of this report for ease of reference.
Element Summary of approach Application of policy for 2016
Base salary Base salaries are set significantly below market median levels, in line with the Group’s philosophy to place greater emphasis on variable, performance-related remuneration.
Salaries for 2016 are:
– Group Chief Executive Officer: £275,000 – Group Chief Financial Officer: £210,000
Pension Pension benefits are provided through a Group personal pension plan, as a non-pensionable salary supplement or as a contribution to a personal pension arrangement.
The CEO remains a member of the legacy defined benefit pension plan but no longer accrues benefits under the plan.
Pension contributions for 2016 are:
– Group Chief Executive Officer: 14% of salary – Group Chief Financial Officer: 18% of salary
Benefits Benefits include:
– Medical insurance benefits; – Car/car allowance (up to £9,000) – Permanent Health Insurance; – Life Insurance; and – Directors’ and Officers’ liability insurance
Benefits in line with policy.
Annual performance- related profit share
Reflects the Group’s annual profit performance and personal performance and contribution.
In line with the Group’s philosophy that there is greater emphasis on variable performance-related pay.
A portion of any award (on a progressive scale of up to a third) is deferred into Savills shares for three years.
Malus and clawback provisions apply.
The maximum annual profit share awards are:
– Group Chief Executive Officer: £2m – Group Chief Financial Officer: £1.5m.
For 2016 profit share awards, 70% will be based on the Group’s annual profit performance and 30% will be based on strategic performance goals.
Performance Share Plan
Awards of shares are made subject to a three-year performance period.
The maximum award potential is 200% of salary, subject to an overall maximum of £1m per participant.
Malus and clawback provisions apply.
The awards for 2016 will be:
– Group Chief Executive Officer: £550k – Group Chief Financial Officer: £250k.
For 2016 Performance Share Plan awards, 50% of the award will vest subject to Earnings Per Share performance and 50% will vest subject to relative TSR performance against the FTSE Mid 250 Index (excluding investment trusts).
SAVILLS PLC REPORT AND ACCOUNTS 201558
Directors’ Remuneration Report continued
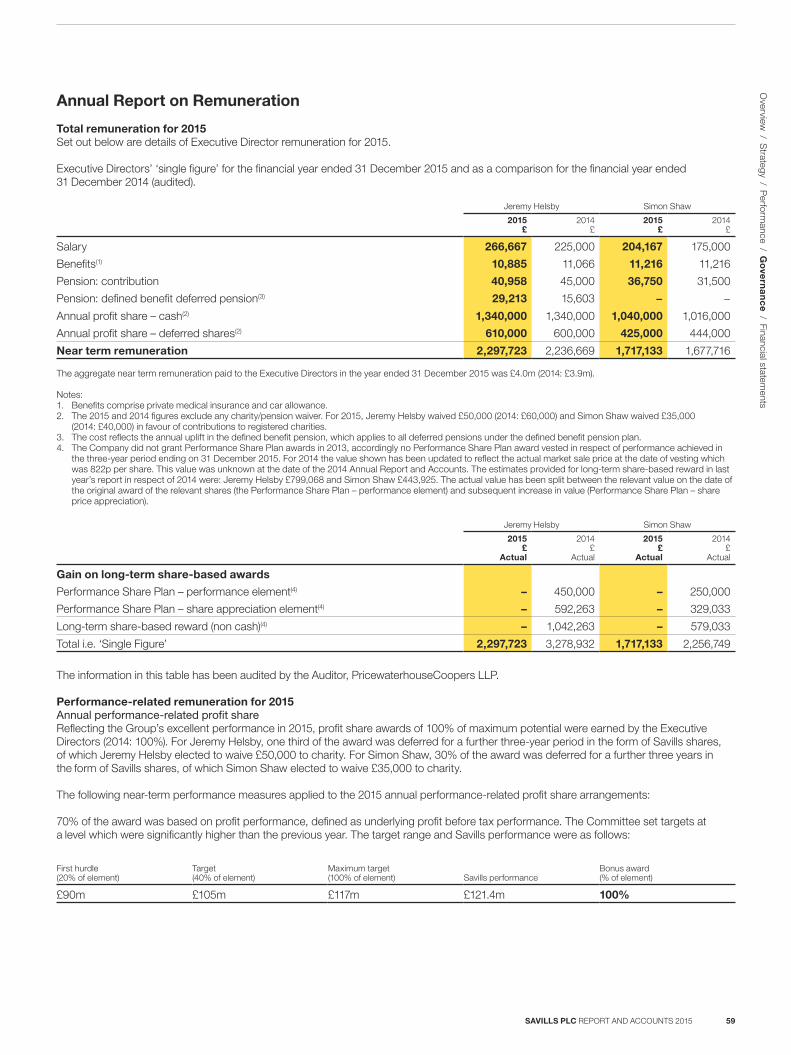
Annual Report on Remuneration
Total remuneration for 2015Set out below are details of Executive Director remuneration for 2015. Executive Directors’ ‘single figure’ for the financial year ended 31 December 2015 and as a comparison for the financial year ended 31 December 2014 (audited).
Jeremy Helsby Simon Shaw
2015£
2014£
2015£
2014£
Salary 266,667 225,000 204,167 175,000
Benefits(1) 10,885 11,066 11,216 11,216
Pension: contribution 40,958 45,000 36,750 31,500
Pension: defined benefit deferred pension(3) 29,213 15,603 − −
Annual profit share – cash(2) 1,340,000 1,340,000 1,040,000 1,016,000
Annual profit share – deferred shares(2) 610,000 600,000 425,000 444,000
Near term remuneration 2,297,723 2,236,669 1,717,133 1,677,716
The aggregate near term remuneration paid to the Executive Directors in the year ended 31 December 2015 was £4.0m (2014: £3.9m).
Notes:1. Benefits comprise private medical insurance and car allowance.2. The 2015 and 2014 figures exclude any charity/pension waiver. For 2015, Jeremy Helsby waived £50,000 (2014: £60,000) and Simon Shaw waived £35,000
(2014: £40,000) in favour of contributions to registered charities.3. The cost reflects the annual uplift in the defined benefit pension, which applies to all deferred pensions under the defined benefit pension plan.4. The Company did not grant Performance Share Plan awards in 2013, accordingly no Performance Share Plan award vested in respect of performance achieved in
the three-year period ending on 31 December 2015. For 2014 the value shown has been updated to reflect the actual market sale price at the date of vesting which was 822p per share. This value was unknown at the date of the 2014 Annual Report and Accounts. The estimates provided for long-term share-based reward in last year’s report in respect of 2014 were: Jeremy Helsby £799,068 and Simon Shaw £443,925. The actual value has been split between the relevant value on the date of the original award of the relevant shares (the Performance Share Plan – performance element) and subsequent increase in value (Performance Share Plan – share price appreciation).
Jeremy Helsby Simon Shaw
2015£
Actual
2014£
Actual
2015£
Actual
2014£
Actual
Gain on long-term share-based awards
Performance Share Plan – performance element(4) – 450,000 – 250,000
Performance Share Plan – share appreciation element(4) – 592,263 – 329,033
Long-term share-based reward (non cash)(4) – 1,042,263 – 579,033
Total i.e. ‘Single Figure’ 2,297,723 3,278,932 1,717,133 2,256,749
The information in this table has been audited by the Auditor, PricewaterhouseCoopers LLP.
Performance-related remuneration for 2015Annual performance-related profit shareReflecting the Group’s excellent performance in 2015, profit share awards of 100% of maximum potential were earned by the Executive Directors (2014: 100%). For Jeremy Helsby, one third of the award was deferred for a further three-year period in the form of Savills shares, of which Jeremy Helsby elected to waive £50,000 to charity. For Simon Shaw, 30% of the award was deferred for a further three years in the form of Savills shares, of which Simon Shaw elected to waive £35,000 to charity.
The following near-term performance measures applied to the 2015 annual performance-related profit share arrangements:
70% of the award was based on profit performance, defined as underlying profit before tax performance. The Committee set targets at a level which were significantly higher than the previous year. The target range and Savills performance were as follows:
First hurdle (20% of element)
Target (40% of element)
Maximum target (100% of element) Savills performance
Bonus award (% of element)
£90m £105m £117m £121.4m 100%
SAVILLS PLC REPORT AND ACCOUNTS 2015 59
Overview
/ Strategy / P
erformance / G
ove
rna
nc
e / Financial statements
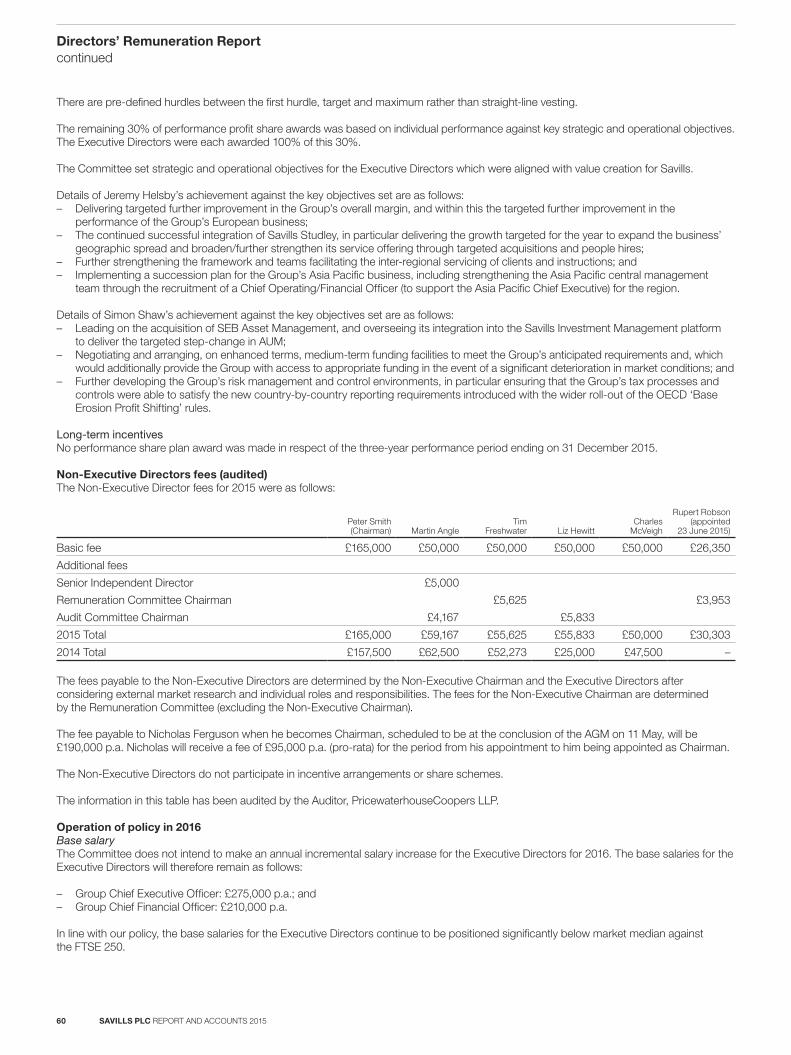
There are pre-defined hurdles between the first hurdle, target and maximum rather than straight-line vesting.
The remaining 30% of performance profit share awards was based on individual performance against key strategic and operational objectives. The Executive Directors were each awarded 100% of this 30%.
The Committee set strategic and operational objectives for the Executive Directors which were aligned with value creation for Savills.
Details of Jeremy Helsby’s achievement against the key objectives set are as follows: – Delivering targeted further improvement in the Group’s overall margin, and within this the targeted further improvement in the
performance of the Group’s European business; – The continued successful integration of Savills Studley, in particular delivering the growth targeted for the year to expand the business’
geographic spread and broaden/further strengthen its service offering through targeted acquisitions and people hires; – Further strengthening the framework and teams facilitating the inter-regional servicing of clients and instructions; and – Implementing a succession plan for the Group’s Asia Pacific business, including strengthening the Asia Pacific central management
team through the recruitment of a Chief Operating/Financial Officer (to support the Asia Pacific Chief Executive) for the region.
Details of Simon Shaw’s achievement against the key objectives set are as follows: – Leading on the acquisition of SEB Asset Management, and overseeing its integration into the Savills Investment Management platform
to deliver the targeted step-change in AUM; – Negotiating and arranging, on enhanced terms, medium-term funding facilities to meet the Group’s anticipated requirements and, which
would additionally provide the Group with access to appropriate funding in the event of a significant deterioration in market conditions; and – Further developing the Group’s risk management and control environments, in particular ensuring that the Group’s tax processes and
controls were able to satisfy the new country-by-country reporting requirements introduced with the wider roll-out of the OECD ‘Base Erosion Profit Shifting’ rules.
Long-term incentivesNo performance share plan award was made in respect of the three-year performance period ending on 31 December 2015.
Non-Executive Directors fees (audited)The Non-Executive Director fees for 2015 were as follows:
Peter Smith(Chairman) Martin Angle
TimFreshwater Liz Hewitt
CharlesMcVeigh
Rupert Robson (appointed
23 June 2015)
Basic fee £165,000 £50,000 £50,000 £50,000 £50,000 £26,350
Additional fees
Senior Independent Director £5,000
Remuneration Committee Chairman £5,625 £3,953
Audit Committee Chairman £4,167 £5,833
2015 Total £165,000 £59,167 £55,625 £55,833 £50,000 £30,303
2014 Total £157,500 £62,500 £52,273 £25,000 £47,500 –
The fees payable to the Non-Executive Directors are determined by the Non-Executive Chairman and the Executive Directors after considering external market research and individual roles and responsibilities. The fees for the Non-Executive Chairman are determined by the Remuneration Committee (excluding the Non-Executive Chairman).
The fee payable to Nicholas Ferguson when he becomes Chairman, scheduled to be at the conclusion of the AGM on 11 May, will be £190,000 p.a. Nicholas will receive a fee of £95,000 p.a. (pro-rata) for the period from his appointment to him being appointed as Chairman.
The Non-Executive Directors do not participate in incentive arrangements or share schemes.
The information in this table has been audited by the Auditor, PricewaterhouseCoopers LLP.
Operation of policy in 2016Base salary The Committee does not intend to make an annual incremental salary increase for the Executive Directors for 2016. The base salaries for the Executive Directors will therefore remain as follows:
– Group Chief Executive Officer: £275,000 p.a.; and – Group Chief Financial Officer: £210,000 p.a.
In line with our policy, the base salaries for the Executive Directors continue to be positioned significantly below market median against the FTSE 250.
SAVILLS PLC REPORT AND ACCOUNTS 201560
Directors’ Remuneration Report continued
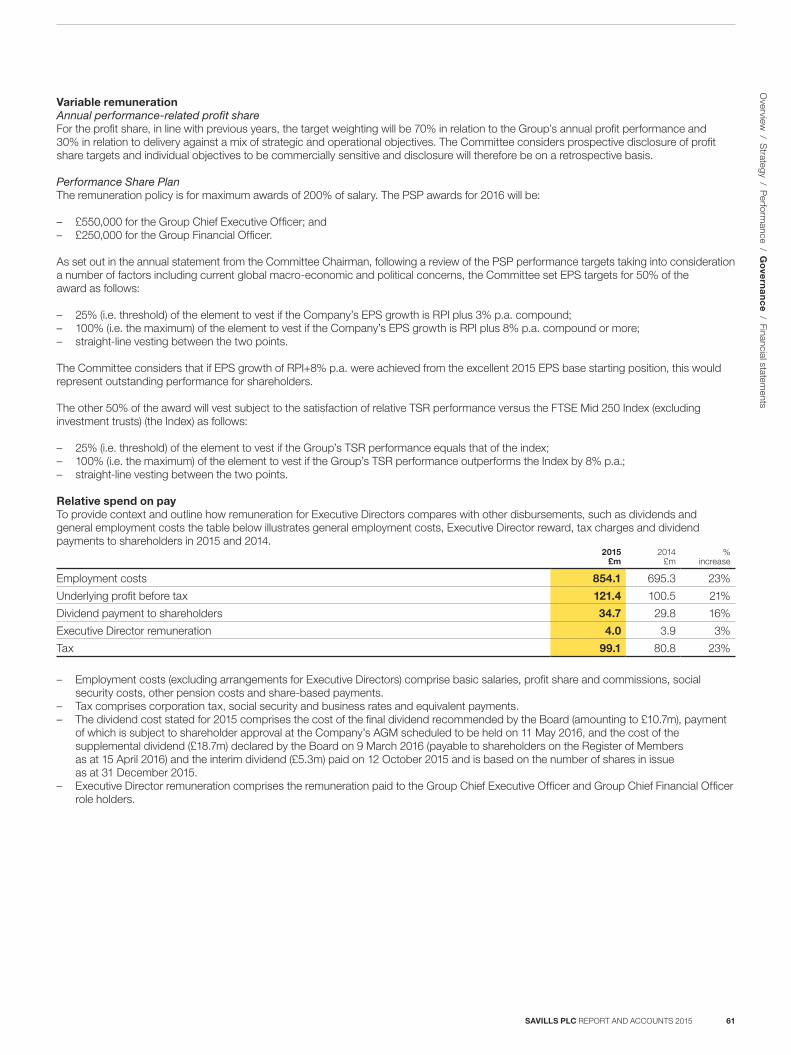
Variable remunerationAnnual performance-related profit shareFor the profit share, in line with previous years, the target weighting will be 70% in relation to the Group’s annual profit performance and 30% in relation to delivery against a mix of strategic and operational objectives. The Committee considers prospective disclosure of profit share targets and individual objectives to be commercially sensitive and disclosure will therefore be on a retrospective basis.
Performance Share Plan The remuneration policy is for maximum awards of 200% of salary. The PSP awards for 2016 will be:
– £550,000 for the Group Chief Executive Officer; and – £250,000 for the Group Financial Officer.
As set out in the annual statement from the Committee Chairman, following a review of the PSP performance targets taking into consideration a number of factors including current global macro-economic and political concerns, the Committee set EPS targets for 50% of the award as follows:
– 25% (i.e. threshold) of the element to vest if the Company’s EPS growth is RPI plus 3% p.a. compound; – 100% (i.e. the maximum) of the element to vest if the Company’s EPS growth is RPI plus 8% p.a. compound or more; – straight-line vesting between the two points.
The Committee considers that if EPS growth of RPI+8% p.a. were achieved from the excellent 2015 EPS base starting position, this would represent outstanding performance for shareholders.
The other 50% of the award will vest subject to the satisfaction of relative TSR performance versus the FTSE Mid 250 Index (excluding investment trusts) (the Index) as follows:
– 25% (i.e. threshold) of the element to vest if the Group’s TSR performance equals that of the index; – 100% (i.e. the maximum) of the element to vest if the Group’s TSR performance outperforms the Index by 8% p.a.; – straight-line vesting between the two points.
Relative spend on payTo provide context and outline how remuneration for Executive Directors compares with other disbursements, such as dividends and general employment costs the table below illustrates general employment costs, Executive Director reward, tax charges and dividend payments to shareholders in 2015 and 2014.
2015£m
2014£m
%increase
Employment costs 854.1 695.3 23%
Underlying profit before tax 121.4 100.5 21%
Dividend payment to shareholders 34.7 29.8 16%
Executive Director remuneration 4.0 3.9 3%
Tax 99.1 80.8 23%
– Employment costs (excluding arrangements for Executive Directors) comprise basic salaries, profit share and commissions, social security costs, other pension costs and share-based payments.
– Tax comprises corporation tax, social security and business rates and equivalent payments. – The dividend cost stated for 2015 comprises the cost of the final dividend recommended by the Board (amounting to £10.7m), payment
of which is subject to shareholder approval at the Company’s AGM scheduled to be held on 11 May 2016, and the cost of the supplemental dividend (£18.7m) declared by the Board on 9 March 2016 (payable to shareholders on the Register of Members as at 15 April 2016) and the interim dividend (£5.3m) paid on 12 October 2015 and is based on the number of shares in issue as at 31 December 2015.
– Executive Director remuneration comprises the remuneration paid to the Group Chief Executive Officer and Group Chief Financial Officer role holders.
SAVILLS PLC REPORT AND ACCOUNTS 2015 61
Overview
/ Strategy / P
erformance / G
ove
rna
nc
e / Financial statements
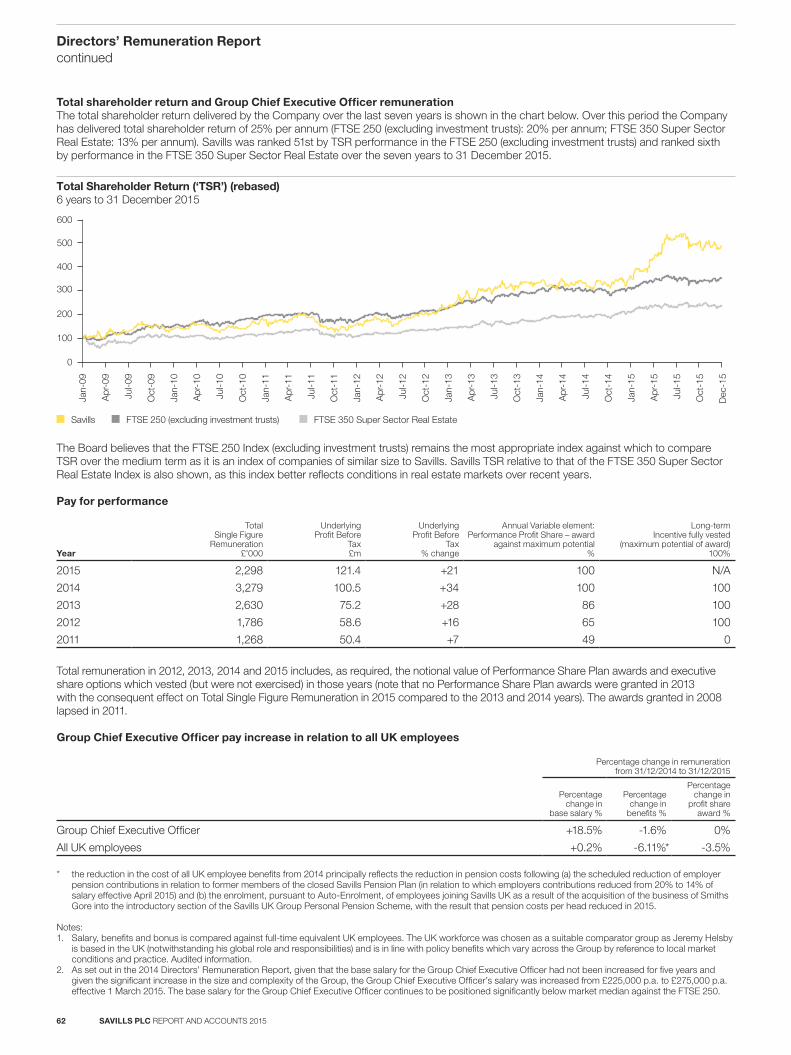
Total shareholder return and Group Chief Executive Officer remuneration The total shareholder return delivered by the Company over the last seven years is shown in the chart below. Over this period the Company has delivered total shareholder return of 25% per annum (FTSE 250 (excluding investment trusts): 20% per annum; FTSE 350 Super Sector Real Estate: 13% per annum). Savills was ranked 51st by TSR performance in the FTSE 250 (excluding investment trusts) and ranked sixth by performance in the FTSE 350 Super Sector Real Estate over the seven years to 31 December 2015.
Jan-
09
Apr
-09
Jul-0
9
Oct
-09
Jan-
10
Apr
-10
Jul-1
0
Oct
-10
Jan-
11
Apr
-11
Jul-1
1
Oct
-11
Jan-
12
Apr
-12
Jul-1
2
Oct
-12
Jan-
13
Apr
-13
Jul-1
3
Oct
-13
FTSE 350 Super Sector Real Estate
Jan-
14
Apr
-14
Jul-1
4
Oct
-14
Jan-
15
Apr
-15
Jul-1
5
Oct
-15
Dec
-15
0
100
300
200
400
500
600
Savills FTSE 250 (excluding investment trusts)
Total Shareholder Return (‘TSR’) (rebased)6 years to 31 December 2015
The Board believes that the FTSE 250 Index (excluding investment trusts) remains the most appropriate index against which to compare TSR over the medium term as it is an index of companies of similar size to Savills. Savills TSR relative to that of the FTSE 350 Super Sector Real Estate Index is also shown, as this index better reflects conditions in real estate markets over recent years.
Pay for performance
Year
TotalSingle Figure
Remuneration£’000
UnderlyingProfit Before
Tax£m
Underlying Profit Before
Tax % change
Annual Variable element: Performance Profit Share – award
against maximum potential%
Long-term Incentive fully vested
(maximum potential of award)100%
2015 2,298 121.4 +21 100 N/A
2014 3,279 100.5 +34 100 100
2013 2,630 75.2 +28 86 100
2012 1,786 58.6 +16 65 100
2011 1,268 50.4 +7 49 0
Total remuneration in 2012, 2013, 2014 and 2015 includes, as required, the notional value of Performance Share Plan awards and executive share options which vested (but were not exercised) in those years (note that no Performance Share Plan awards were granted in 2013 with the consequent effect on Total Single Figure Remuneration in 2015 compared to the 2013 and 2014 years). The awards granted in 2008 lapsed in 2011.
Group Chief Executive Officer pay increase in relation to all UK employees
Percentage change in remunerationfrom 31/12/2014 to 31/12/2015
Percentagechange in
base salary %
Percentagechange in
benefits %
Percentagechange in
profit shareaward %
Group Chief Executive Officer +18.5% -1.6% 0%
All UK employees +0.2% -6.11%* -3.5%
* the reduction in the cost of all UK employee benefits from 2014 principally reflects the reduction in pension costs following (a) the scheduled reduction of employer pension contributions in relation to former members of the closed Savills Pension Plan (in relation to which employers contributions reduced from 20% to 14% of salary effective April 2015) and (b) the enrolment, pursuant to Auto-Enrolment, of employees joining Savills UK as a result of the acquisition of the business of Smiths Gore into the introductory section of the Savills UK Group Personal Pension Scheme, with the result that pension costs per head reduced in 2015.
Notes:1. Salary, benefits and bonus is compared against full-time equivalent UK employees. The UK workforce was chosen as a suitable comparator group as Jeremy Helsby
is based in the UK (notwithstanding his global role and responsibilities) and is in line with policy benefits which vary across the Group by reference to local market conditions and practice. Audited information.
2. As set out in the 2014 Directors’ Remuneration Report, given that the base salary for the Group Chief Executive Officer had not been increased for five years and given the significant increase in the size and complexity of the Group, the Group Chief Executive Officer’s salary was increased from £225,000 p.a. to £275,000 p.a. effective 1 March 2015. The base salary for the Group Chief Executive Officer continues to be positioned significantly below market median against the FTSE 250.
SAVILLS PLC REPORT AND ACCOUNTS 201562
Directors’ Remuneration Report continued
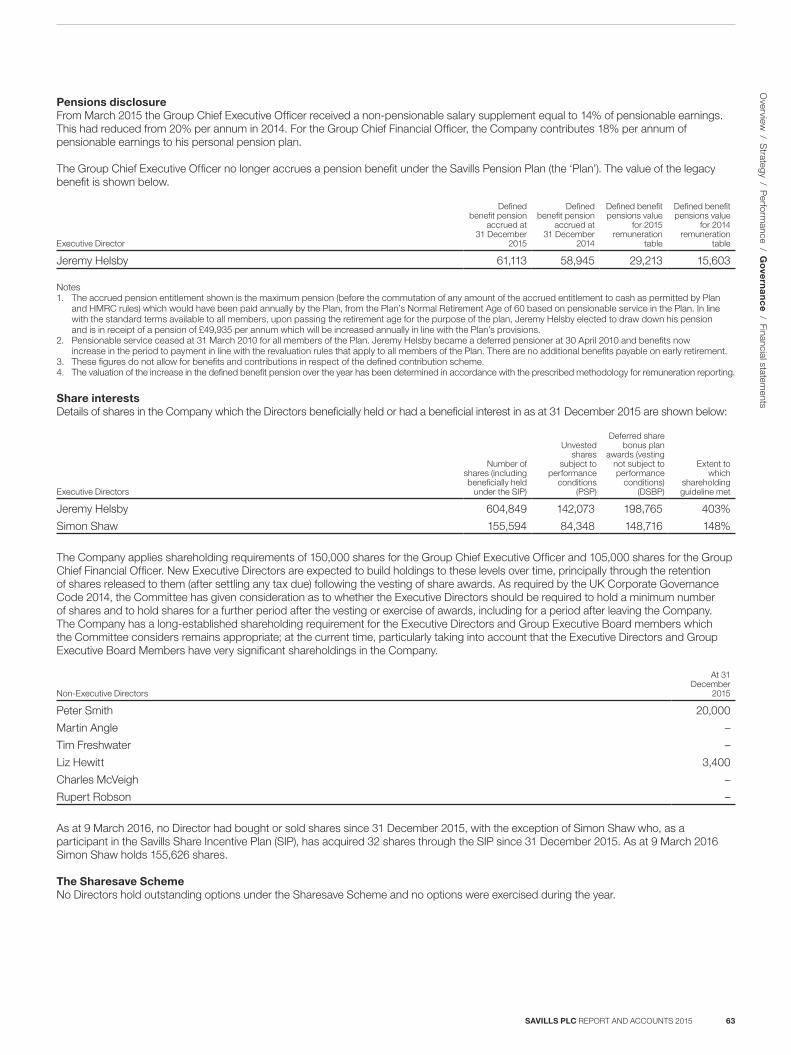
Pensions disclosure From March 2015 the Group Chief Executive Officer received a non-pensionable salary supplement equal to 14% of pensionable earnings. This had reduced from 20% per annum in 2014. For the Group Chief Financial Officer, the Company contributes 18% per annum of pensionable earnings to his personal pension plan.
The Group Chief Executive Officer no longer accrues a pension benefit under the Savills Pension Plan (the ‘Plan’). The value of the legacy benefit is shown below.
Executive Director
Definedbenefit pension
accrued at31 December
2015
Definedbenefit pension
accrued at31 December
2014
Defined benefitpensions value
for 2015 remuneration
table
Defined benefitpensions value
for 2014remuneration
table
Jeremy Helsby 61,113 58,945 29,213 15,603
Notes1. The accrued pension entitlement shown is the maximum pension (before the commutation of any amount of the accrued entitlement to cash as permitted by Plan
and HMRC rules) which would have been paid annually by the Plan, from the Plan’s Normal Retirement Age of 60 based on pensionable service in the Plan. In line with the standard terms available to all members, upon passing the retirement age for the purpose of the plan, Jeremy Helsby elected to draw down his pension and is in receipt of a pension of £49,935 per annum which will be increased annually in line with the Plan’s provisions.
2. Pensionable service ceased at 31 March 2010 for all members of the Plan. Jeremy Helsby became a deferred pensioner at 30 April 2010 and benefits now increase in the period to payment in line with the revaluation rules that apply to all members of the Plan. There are no additional benefits payable on early retirement.
3. These figures do not allow for benefits and contributions in respect of the defined contribution scheme.4. The valuation of the increase in the defined benefit pension over the year has been determined in accordance with the prescribed methodology for remuneration reporting.
Share interestsDetails of shares in the Company which the Directors beneficially held or had a beneficial interest in as at 31 December 2015 are shown below:
Executive Directors
Number ofshares (including beneficially held
under the SIP)
Unvestedshares
subject toperformance
conditions(PSP)
Deferred share bonus plan
awards (vesting not subject to performance
conditions) (DSBP)
Extent towhich
shareholdingguideline met
Jeremy Helsby 604,849 142,073 198,765 403%
Simon Shaw 155,594 84,348 148,716 148%
The Company applies shareholding requirements of 150,000 shares for the Group Chief Executive Officer and 105,000 shares for the Group Chief Financial Officer. New Executive Directors are expected to build holdings to these levels over time, principally through the retention of shares released to them (after settling any tax due) following the vesting of share awards. As required by the UK Corporate Governance Code 2014, the Committee has given consideration as to whether the Executive Directors should be required to hold a minimum number of shares and to hold shares for a further period after the vesting or exercise of awards, including for a period after leaving the Company. The Company has a long-established shareholding requirement for the Executive Directors and Group Executive Board members which the Committee considers remains appropriate; at the current time, particularly taking into account that the Executive Directors and Group Executive Board Members have very significant shareholdings in the Company.
Non-Executive Directors
At 31 December
2015
Peter Smith 20,000
Martin Angle –
Tim Freshwater –
Liz Hewitt 3,400
Charles McVeigh –
Rupert Robson –
As at 9 March 2016, no Director had bought or sold shares since 31 December 2015, with the exception of Simon Shaw who, as a participant in the Savills Share Incentive Plan (SIP), has acquired 32 shares through the SIP since 31 December 2015. As at 9 March 2016 Simon Shaw holds 155,626 shares.
The Sharesave SchemeNo Directors hold outstanding options under the Sharesave Scheme and no options were exercised during the year.
SAVILLS PLC REPORT AND ACCOUNTS 2015 63
Overview
/ Strategy / P
erformance / G
ove
rna
nc
e / Financial statements
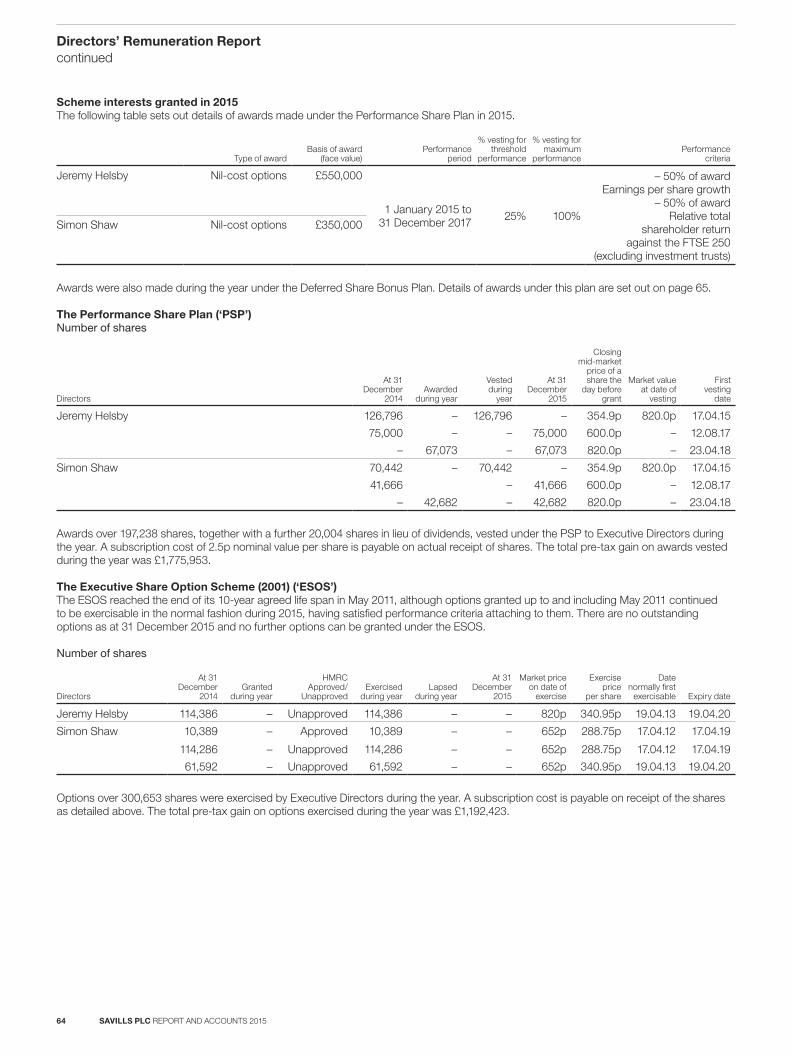
Scheme interests granted in 2015The following table sets out details of awards made under the Performance Share Plan in 2015.
Type of awardBasis of award
(face value)Performance
period
% vesting for threshold
performance
% vesting for maximum
performancePerformance
criteria
Jeremy Helsby Nil-cost options £550,000
1 January 2015 to 31 December 2017 25% 100%
– 50% of awardEarnings per share growth
– 50% of awardRelative total
shareholder returnagainst the FTSE 250
(excluding investment trusts)
Simon Shaw Nil-cost options £350,000
Awards were also made during the year under the Deferred Share Bonus Plan. Details of awards under this plan are set out on page 65.
The Performance Share Plan (‘PSP’)Number of shares
Directors
At 31 December
2014Awarded
during year
Vestedduring
year
At 31 December
2015
Closingmid-market
price of ashare the
day beforegrant
Market valueat date of
vesting
Firstvesting
date
Jeremy Helsby 126,796 – 126,796 – 354.9p 820.0p 17.04.15
75,000 – – 75,000 600.0p – 12.08.17
– 67,073 – 67,073 820.0p – 23.04.18
Simon Shaw 70,442 – 70,442 – 354.9p 820.0p 17.04.15
41,666 – 41,666 600.0p – 12.08.17
– 42,682 – 42,682 820.0p – 23.04.18
Awards over 197,238 shares, together with a further 20,004 shares in lieu of dividends, vested under the PSP to Executive Directors during the year. A subscription cost of 2.5p nominal value per share is payable on actual receipt of shares. The total pre-tax gain on awards vested during the year was £1,775,953.
The Executive Share Option Scheme (2001) (‘ESOS’)The ESOS reached the end of its 10-year agreed life span in May 2011, although options granted up to and including May 2011 continued to be exercisable in the normal fashion during 2015, having satisfied performance criteria attaching to them. There are no outstanding options as at 31 December 2015 and no further options can be granted under the ESOS.
Number of shares
Directors
At 31 December
2014Granted
during year
HMRCApproved/
UnapprovedExercised
during yearLapsed
during year
At 31 December
2015
Market priceon date of
exercise
Exercise price
per share
Date normally first
exercisable Expiry date
Jeremy Helsby 114,386 – Unapproved 114,386 – – 820p 340.95p 19.04.13 19.04.20
Simon Shaw 10,389 – Approved 10,389 – – 652p 288.75p 17.04.12 17.04.19
114,286 – Unapproved 114,286 – – 652p 288.75p 17.04.12 17.04.19
61,592 – Unapproved 61,592 – – 652p 340.95p 19.04.13 19.04.20
Options over 300,653 shares were exercised by Executive Directors during the year. A subscription cost is payable on receipt of the shares as detailed above. The total pre-tax gain on options exercised during the year was £1,192,423.
SAVILLS PLC REPORT AND ACCOUNTS 201564
Directors’ Remuneration Report continued
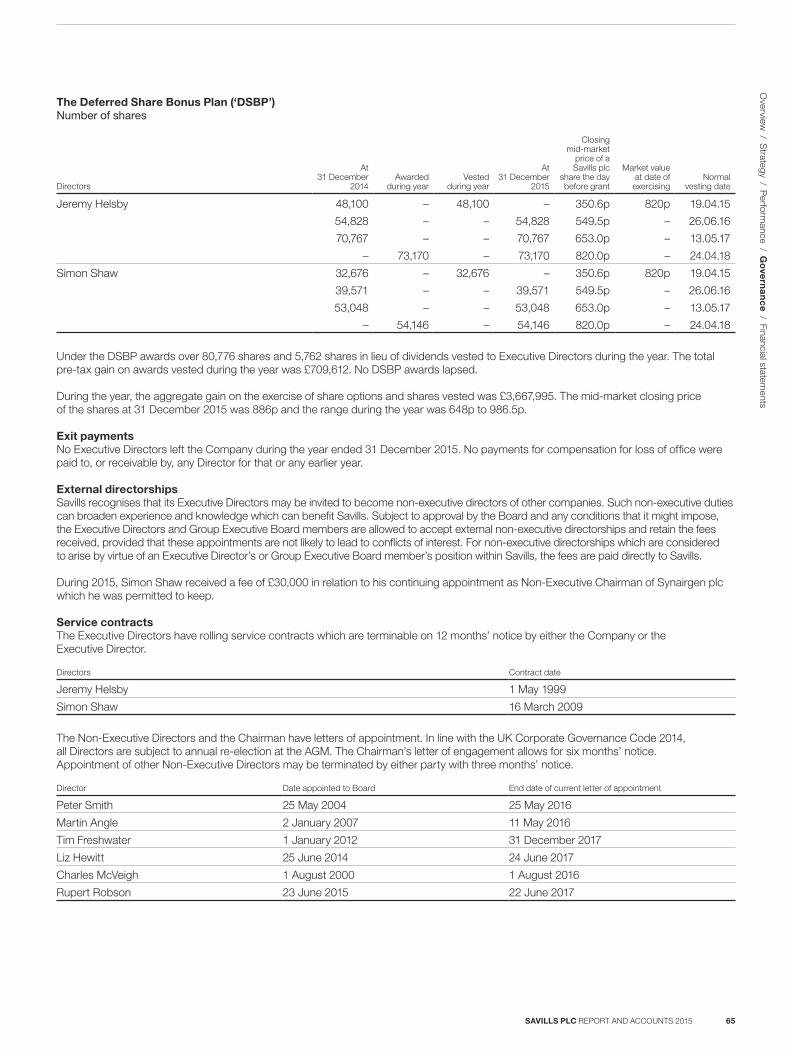
The Deferred Share Bonus Plan (‘DSBP’)Number of shares
Directors
At 31 December
2014Awarded
during yearVested
during year
At 31 December
2015
Closingmid-market
price of aSavills plc
share the daybefore grant
Market valueat date of
exercisingNormal
vesting date
Jeremy Helsby 48,100 – 48,100 – 350.6p 820p 19.04.15
54,828 – – 54,828 549.5p – 26.06.16
70,767 – – 70,767 653.0p – 13.05.17
– 73,170 – 73,170 820.0p – 24.04.18
Simon Shaw 32,676 – 32,676 – 350.6p 820p 19.04.15
39,571 – – 39,571 549.5p – 26.06.16
53,048 – – 53,048 653.0p – 13.05.17
– 54,146 – 54,146 820.0p – 24.04.18
Under the DSBP awards over 80,776 shares and 5,762 shares in lieu of dividends vested to Executive Directors during the year. The total pre-tax gain on awards vested during the year was £709,612. No DSBP awards lapsed.
During the year, the aggregate gain on the exercise of share options and shares vested was £3,667,995. The mid-market closing price of the shares at 31 December 2015 was 886p and the range during the year was 648p to 986.5p.
Exit paymentsNo Executive Directors left the Company during the year ended 31 December 2015. No payments for compensation for loss of office were paid to, or receivable by, any Director for that or any earlier year.
External directorshipsSavills recognises that its Executive Directors may be invited to become non-executive directors of other companies. Such non-executive duties can broaden experience and knowledge which can benefit Savills. Subject to approval by the Board and any conditions that it might impose, the Executive Directors and Group Executive Board members are allowed to accept external non-executive directorships and retain the fees received, provided that these appointments are not likely to lead to conflicts of interest. For non-executive directorships which are considered to arise by virtue of an Executive Director’s or Group Executive Board member’s position within Savills, the fees are paid directly to Savills.
During 2015, Simon Shaw received a fee of £30,000 in relation to his continuing appointment as Non-Executive Chairman of Synairgen plc which he was permitted to keep.
Service contractsThe Executive Directors have rolling service contracts which are terminable on 12 months’ notice by either the Company or the Executive Director.
Directors Contract date
Jeremy Helsby 1 May 1999
Simon Shaw 16 March 2009
The Non-Executive Directors and the Chairman have letters of appointment. In line with the UK Corporate Governance Code 2014, all Directors are subject to annual re-election at the AGM. The Chairman’s letter of engagement allows for six months’ notice. Appointment of other Non-Executive Directors may be terminated by either party with three months’ notice.
Director Date appointed to Board End date of current letter of appointment
Peter Smith 25 May 2004 25 May 2016
Martin Angle 2 January 2007 11 May 2016
Tim Freshwater 1 January 2012 31 December 2017
Liz Hewitt 25 June 2014 24 June 2017
Charles McVeigh 1 August 2000 1 August 2016
Rupert Robson 23 June 2015 22 June 2017
SAVILLS PLC REPORT AND ACCOUNTS 2015 65
Overview
/ Strategy / P
erformance / G
ove
rna
nc
e / Financial statements
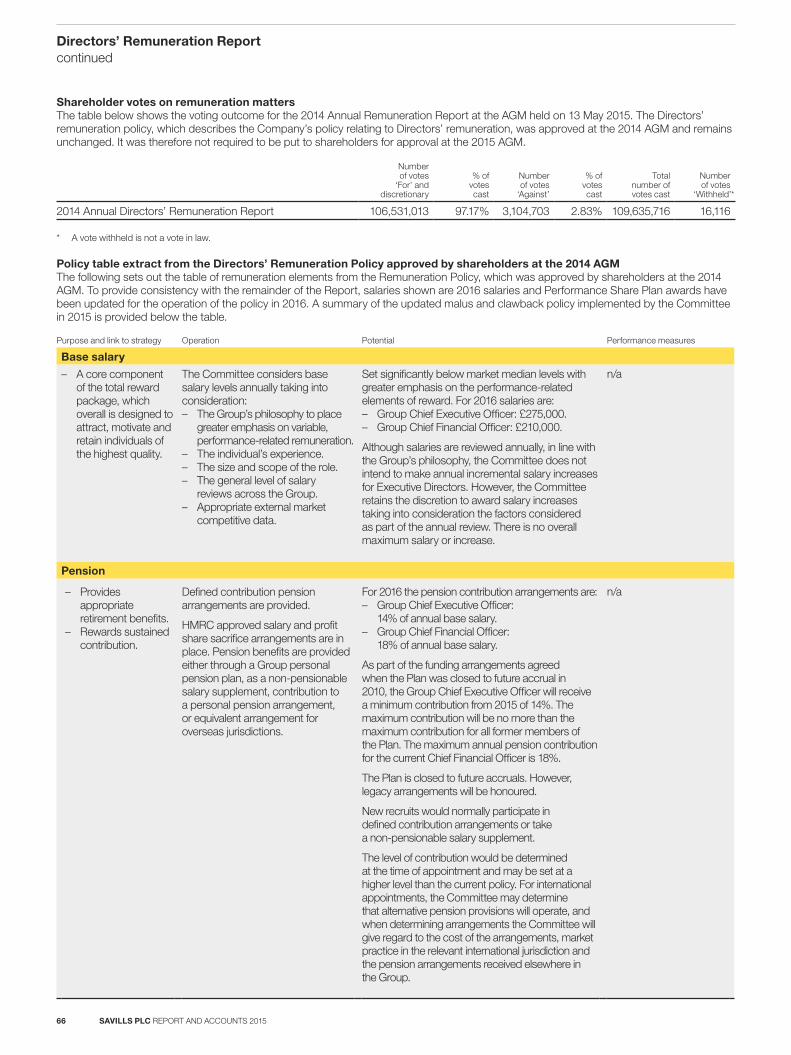
Shareholder votes on remuneration mattersThe table below shows the voting outcome for the 2014 Annual Remuneration Report at the AGM held on 13 May 2015. The Directors’ remuneration policy, which describes the Company’s policy relating to Directors’ remuneration, was approved at the 2014 AGM and remains unchanged. It was therefore not required to be put to shareholders for approval at the 2015 AGM.
Number of votes
‘For’ and discretionary
% of votes cast
Number of votes
‘Against’
% of votes cast
Total number of votes cast
Number of votes
‘Withheld’*
2014 Annual Directors’ Remuneration Report 106,531,013 97.17% 3,104,703 2.83% 109,635,716 16,116
* A vote withheld is not a vote in law.
Policy table extract from the Directors’ Remuneration Policy approved by shareholders at the 2014 AGMThe following sets out the table of remuneration elements from the Remuneration Policy, which was approved by shareholders at the 2014 AGM. To provide consistency with the remainder of the Report, salaries shown are 2016 salaries and Performance Share Plan awards have been updated for the operation of the policy in 2016. A summary of the updated malus and clawback policy implemented by the Committee in 2015 is provided below the table.
Purpose and link to strategy Operation Potential Performance measures
Base salary
– A core component of the total reward package, which overall is designed to attract, motivate and retain individuals of the highest quality.
The Committee considers base salary levels annually taking into consideration: – The Group’s philosophy to place
greater emphasis on variable, performance-related remuneration.
– The individual’s experience. – The size and scope of the role. – The general level of salary
reviews across the Group. – Appropriate external market
competitive data.
Set significantly below market median levels with greater emphasis on the performance-related elements of reward. For 2016 salaries are: – Group Chief Executive Officer: £275,000. – Group Chief Financial Officer: £210,000.
Although salaries are reviewed annually, in line with the Group’s philosophy, the Committee does not intend to make annual incremental salary increases for Executive Directors. However, the Committee retains the discretion to award salary increases taking into consideration the factors considered as part of the annual review. There is no overall maximum salary or increase.
n/a
Pension
– Provides appropriate retirement benefits.
– Rewards sustained contribution.
Defined contribution pension arrangements are provided.
HMRC approved salary and profit share sacrifice arrangements are in place. Pension benefits are provided either through a Group personal pension plan, as a non-pensionable salary supplement, contribution to a personal pension arrangement, or equivalent arrangement for overseas jurisdictions.
For 2016 the pension contribution arrangements are: – Group Chief Executive Officer:
14% of annual base salary. – Group Chief Financial Officer:
18% of annual base salary.
As part of the funding arrangements agreed when the Plan was closed to future accrual in 2010, the Group Chief Executive Officer will receive a minimum contribution from 2015 of 14%. The maximum contribution will be no more than the maximum contribution for all former members of the Plan. The maximum annual pension contribution for the current Chief Financial Officer is 18%.
The Plan is closed to future accruals. However, legacy arrangements will be honoured.
New recruits would normally participate in defined contribution arrangements or take a non-pensionable salary supplement.
The level of contribution would be determined at the time of appointment and may be set at a higher level than the current policy. For international appointments, the Committee may determine that alternative pension provisions will operate, and when determining arrangements the Committee will give regard to the cost of the arrangements, market practice in the relevant international jurisdiction and the pension arrangements received elsewhere in the Group.
n/a
SAVILLS PLC REPORT AND ACCOUNTS 201566
Directors’ Remuneration Report continued
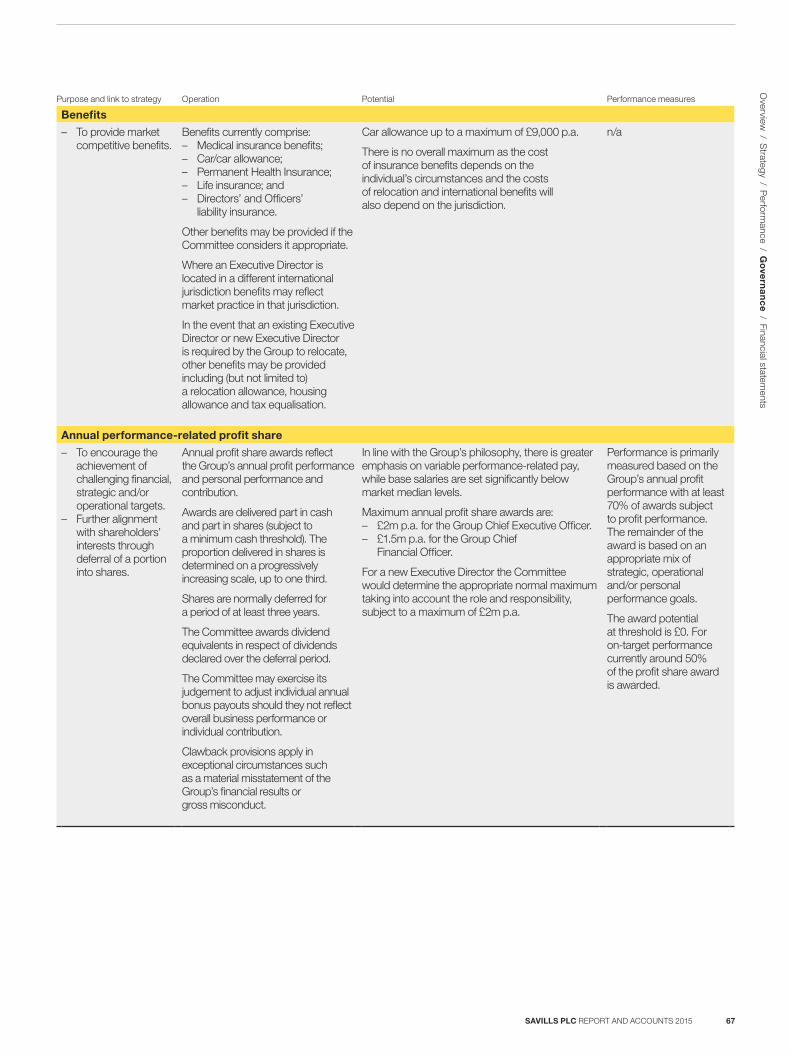
Purpose and link to strategy Operation Potential Performance measures
Benefits
– To provide market competitive benefits.
Benefits currently comprise: – Medical insurance benefits; – Car/car allowance; – Permanent Health Insurance; – Life insurance; and – Directors’ and Officers’
liability insurance.
Other benefits may be provided if the Committee considers it appropriate.
Where an Executive Director is located in a different international jurisdiction benefits may reflect market practice in that jurisdiction.
In the event that an existing Executive Director or new Executive Director is required by the Group to relocate, other benefits may be provided including (but not limited to) a relocation allowance, housing allowance and tax equalisation.
Car allowance up to a maximum of £9,000 p.a.
There is no overall maximum as the cost of insurance benefits depends on the individual’s circumstances and the costs of relocation and international benefits will also depend on the jurisdiction.
n/a
Annual performance-related profit share
– To encourage the achievement of challenging financial, strategic and/or operational targets.
– Further alignment with shareholders’ interests through deferral of a portion into shares.
Annual profit share awards reflect the Group’s annual profit performance and personal performance and contribution.
Awards are delivered part in cash and part in shares (subject to a minimum cash threshold). The proportion delivered in shares is determined on a progressively increasing scale, up to one third.
Shares are normally deferred for a period of at least three years.
The Committee awards dividend equivalents in respect of dividends declared over the deferral period.
The Committee may exercise its judgement to adjust individual annual bonus payouts should they not reflect overall business performance or individual contribution.
Clawback provisions apply in exceptional circumstances such as a material misstatement of the Group’s financial results or gross misconduct.
In line with the Group’s philosophy, there is greater emphasis on variable performance-related pay, while base salaries are set significantly below market median levels.
Maximum annual profit share awards are: – £2m p.a. for the Group Chief Executive Officer. – £1.5m p.a. for the Group Chief
Financial Officer.
For a new Executive Director the Committee would determine the appropriate normal maximum taking into account the role and responsibility, subject to a maximum of £2m p.a.
Performance is primarily measured based on the Group’s annual profit performance with at least 70% of awards subject to profit performance. The remainder of the award is based on an appropriate mix of strategic, operational and/or personal performance goals.
The award potential at threshold is £0. For on-target performance currently around 50% of the profit share award is awarded.
SAVILLS PLC REPORT AND ACCOUNTS 2015 67
Overview
/ Strategy / P
erformance / G
ove
rna
nc
e / Financial statements
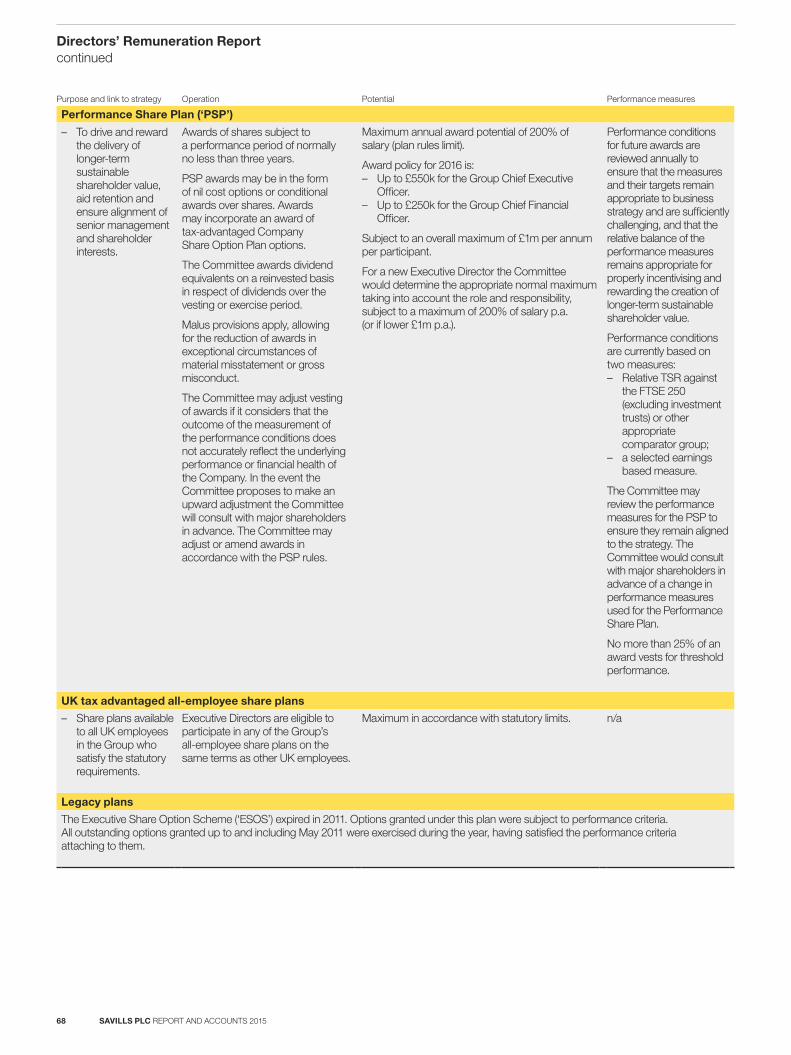
Purpose and link to strategy Operation Potential Performance measures
Performance Share Plan (‘PSP’)
– To drive and reward the delivery of longer-term sustainable shareholder value, aid retention and ensure alignment of senior management and shareholder interests.
Awards of shares subject to a performance period of normally no less than three years.
PSP awards may be in the form of nil cost options or conditional awards over shares. Awards may incorporate an award of tax-advantaged Company Share Option Plan options.
The Committee awards dividend equivalents on a reinvested basis in respect of dividends over the vesting or exercise period.
Malus provisions apply, allowing for the reduction of awards in exceptional circumstances of material misstatement or gross misconduct.
The Committee may adjust vesting of awards if it considers that the outcome of the measurement of the performance conditions does not accurately reflect the underlying performance or financial health of the Company. In the event the Committee proposes to make an upward adjustment the Committee will consult with major shareholders in advance. The Committee may adjust or amend awards in accordance with the PSP rules.
Maximum annual award potential of 200% of salary (plan rules limit).
Award policy for 2016 is: – Up to £550k for the Group Chief Executive
Officer. – Up to £250k for the Group Chief Financial
Officer.
Subject to an overall maximum of £1m per annum per participant.
For a new Executive Director the Committee would determine the appropriate normal maximum taking into account the role and responsibility, subject to a maximum of 200% of salary p.a. (or if lower £1m p.a.).
Performance conditions for future awards are reviewed annually to ensure that the measures and their targets remain appropriate to business strategy and are sufficiently challenging, and that the relative balance of the performance measures remains appropriate for properly incentivising and rewarding the creation of longer-term sustainable shareholder value.
Performance conditions are currently based on two measures: – Relative TSR against
the FTSE 250 (excluding investment trusts) or other appropriate comparator group;
– a selected earnings based measure.
The Committee may review the performance measures for the PSP to ensure they remain aligned to the strategy. The Committee would consult with major shareholders in advance of a change in performance measures used for the Performance Share Plan.
No more than 25% of an award vests for threshold performance.
UK tax advantaged all-employee share plans
– Share plans available to all UK employees in the Group who satisfy the statutory requirements.
Executive Directors are eligible to participate in any of the Group’s all-employee share plans on the same terms as other UK employees.
Maximum in accordance with statutory limits. n/a
Legacy plans
The Executive Share Option Scheme (‘ESOS’) expired in 2011. Options granted under this plan were subject to performance criteria. All outstanding options granted up to and including May 2011 were exercised during the year, having satisfied the performance criteria attaching to them.
SAVILLS PLC REPORT AND ACCOUNTS 201568
Directors’ Remuneration Report continued
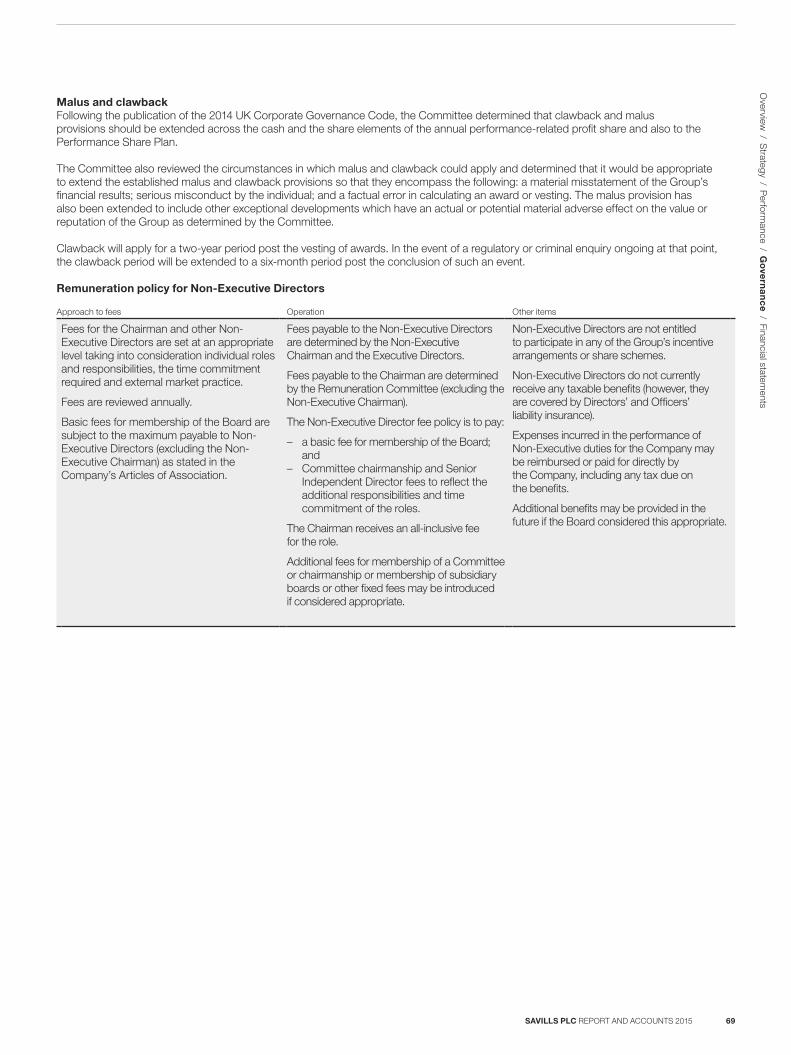
Malus and clawback Following the publication of the 2014 UK Corporate Governance Code, the Committee determined that clawback and malus provisions should be extended across the cash and the share elements of the annual performance-related profit share and also to the Performance Share Plan.
The Committee also reviewed the circumstances in which malus and clawback could apply and determined that it would be appropriate to extend the established malus and clawback provisions so that they encompass the following: a material misstatement of the Group’s financial results; serious misconduct by the individual; and a factual error in calculating an award or vesting. The malus provision has also been extended to include other exceptional developments which have an actual or potential material adverse effect on the value or reputation of the Group as determined by the Committee.
Clawback will apply for a two-year period post the vesting of awards. In the event of a regulatory or criminal enquiry ongoing at that point, the clawback period will be extended to a six-month period post the conclusion of such an event.
Remuneration policy for Non-Executive Directors
Approach to fees Operation Other items
Fees for the Chairman and other Non-Executive Directors are set at an appropriate level taking into consideration individual roles and responsibilities, the time commitment required and external market practice.
Fees are reviewed annually.
Basic fees for membership of the Board are subject to the maximum payable to Non-Executive Directors (excluding the Non-Executive Chairman) as stated in the Company’s Articles of Association.
Fees payable to the Non-Executive Directors are determined by the Non-Executive Chairman and the Executive Directors.
Fees payable to the Chairman are determined by the Remuneration Committee (excluding the Non-Executive Chairman).
The Non-Executive Director fee policy is to pay:
– a basic fee for membership of the Board; and
– Committee chairmanship and Senior Independent Director fees to reflect the additional responsibilities and time commitment of the roles.
The Chairman receives an all-inclusive fee for the role.
Additional fees for membership of a Committee or chairmanship or membership of subsidiary boards or other fixed fees may be introduced if considered appropriate.
Non-Executive Directors are not entitled to participate in any of the Group’s incentive arrangements or share schemes.
Non-Executive Directors do not currently receive any taxable benefits (however, they are covered by Directors’ and Officers’ liability insurance).
Expenses incurred in the performance of Non-Executive duties for the Company may be reimbursed or paid for directly by the Company, including any tax due on the benefits.
Additional benefits may be provided in the future if the Board considered this appropriate.
SAVILLS PLC REPORT AND ACCOUNTS 2015 69
Overview
/ Strategy / P
erformance / G
ove
rna
nc
e / Financial statements
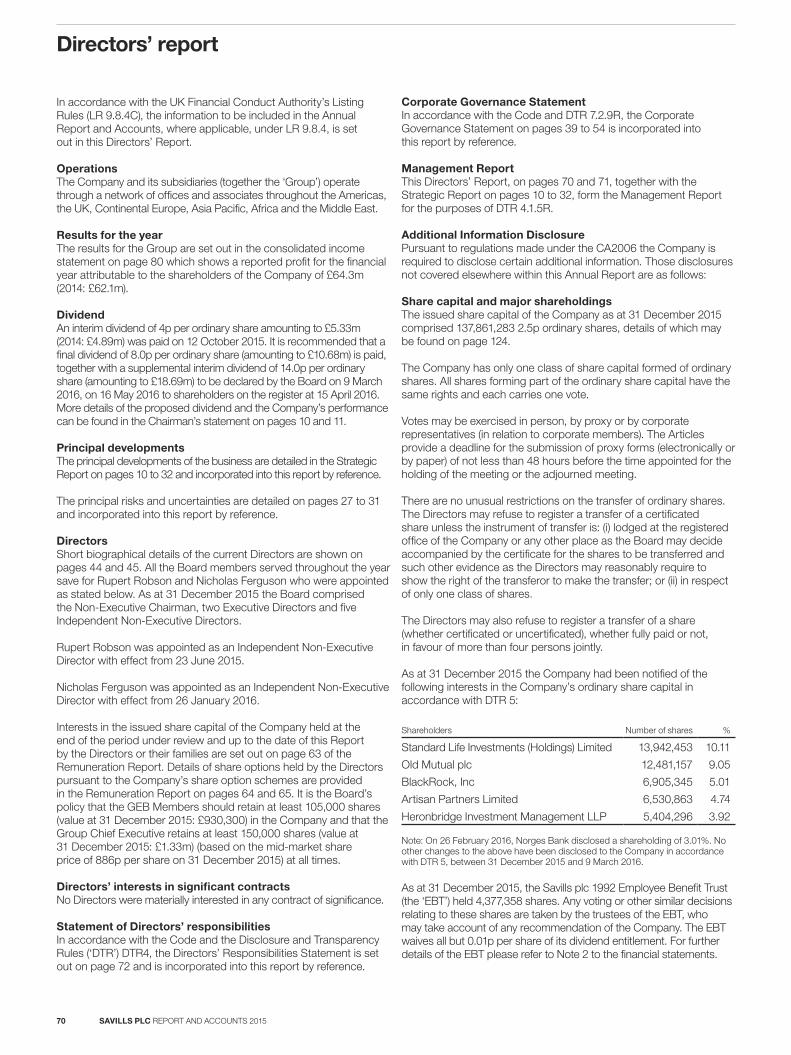
In accordance with the UK Financial Conduct Authority’s Listing Rules (LR 9.8.4C), the information to be included in the Annual Report and Accounts, where applicable, under LR 9.8.4, is set out in this Directors’ Report.
OperationsThe Company and its subsidiaries (together the ‘Group’) operate through a network of offices and associates throughout the Americas, the UK, Continental Europe, Asia Pacific, Africa and the Middle East.
Results for the yearThe results for the Group are set out in the consolidated income statement on page 80 which shows a reported profit for the financial year attributable to the shareholders of the Company of £64.3m (2014: £62.1m).
DividendAn interim dividend of 4p per ordinary share amounting to £5.33m (2014: £4.89m) was paid on 12 October 2015. It is recommended that a final dividend of 8.0p per ordinary share (amounting to £10.68m) is paid, together with a supplemental interim dividend of 14.0p per ordinary share (amounting to £18.69m) to be declared by the Board on 9 March 2016, on 16 May 2016 to shareholders on the register at 15 April 2016. More details of the proposed dividend and the Company’s performance can be found in the Chairman’s statement on pages 10 and 11.
Principal developmentsThe principal developments of the business are detailed in the Strategic Report on pages 10 to 32 and incorporated into this report by reference.
The principal risks and uncertainties are detailed on pages 27 to 31 and incorporated into this report by reference.
DirectorsShort biographical details of the current Directors are shown on pages 44 and 45. All the Board members served throughout the year save for Rupert Robson and Nicholas Ferguson who were appointed as stated below. As at 31 December 2015 the Board comprised the Non-Executive Chairman, two Executive Directors and five Independent Non-Executive Directors.
Rupert Robson was appointed as an Independent Non-Executive Director with effect from 23 June 2015.
Nicholas Ferguson was appointed as an Independent Non-Executive Director with effect from 26 January 2016.
Interests in the issued share capital of the Company held at the end of the period under review and up to the date of this Report by the Directors or their families are set out on page 63 of the Remuneration Report. Details of share options held by the Directors pursuant to the Company’s share option schemes are provided in the Remuneration Report on pages 64 and 65. It is the Board’s policy that the GEB Members should retain at least 105,000 shares (value at 31 December 2015: £930,300) in the Company and that the Group Chief Executive retains at least 150,000 shares (value at 31 December 2015: £1.33m) (based on the mid-market share price of 886p per share on 31 December 2015) at all times.
Directors’ interests in significant contractsNo Directors were materially interested in any contract of significance.
Statement of Directors’ responsibilitiesIn accordance with the Code and the Disclosure and Transparency Rules (‘DTR’) DTR4, the Directors’ Responsibilities Statement is set out on page 72 and is incorporated into this report by reference.
Corporate Governance StatementIn accordance with the Code and DTR 7.2.9R, the Corporate Governance Statement on pages 39 to 54 is incorporated into this report by reference.
Management ReportThis Directors’ Report, on pages 70 and 71, together with the Strategic Report on pages 10 to 32, form the Management Report for the purposes of DTR 4.1.5R.
Additional Information DisclosurePursuant to regulations made under the CA2006 the Company is required to disclose certain additional information. Those disclosures not covered elsewhere within this Annual Report are as follows:
Share capital and major shareholdingsThe issued share capital of the Company as at 31 December 2015 comprised 137,861,283 2.5p ordinary shares, details of which may be found on page 124.
The Company has only one class of share capital formed of ordinary shares. All shares forming part of the ordinary share capital have the same rights and each carries one vote.
Votes may be exercised in person, by proxy or by corporate representatives (in relation to corporate members). The Articles provide a deadline for the submission of proxy forms (electronically or by paper) of not less than 48 hours before the time appointed for the holding of the meeting or the adjourned meeting.
There are no unusual restrictions on the transfer of ordinary shares. The Directors may refuse to register a transfer of a certificated share unless the instrument of transfer is: (i) lodged at the registered office of the Company or any other place as the Board may decide accompanied by the certificate for the shares to be transferred and such other evidence as the Directors may reasonably require to show the right of the transferor to make the transfer; or (ii) in respect of only one class of shares.
The Directors may also refuse to register a transfer of a share (whether certificated or uncertificated), whether fully paid or not, in favour of more than four persons jointly.
As at 31 December 2015 the Company had been notified of the following interests in the Company’s ordinary share capital in accordance with DTR 5:
Shareholders Number of shares %
Standard Life Investments (Holdings) Limited 13,942,453 10.11
Old Mutual plc 12,481,157 9.05
BlackRock, Inc 6,905,345 5.01
Artisan Partners Limited 6,530,863 4.74
Heronbridge Investment Management LLP 5,404,296 3.92
Note: On 26 February 2016, Norges Bank disclosed a shareholding of 3.01%. No other changes to the above have been disclosed to the Company in accordance with DTR 5, between 31 December 2015 and 9 March 2016.
As at 31 December 2015, the Savills plc 1992 Employee Benefit Trust (the ‘EBT’) held 4,377,358 shares. Any voting or other similar decisions relating to these shares are taken by the trustees of the EBT, who may take account of any recommendation of the Company. The EBT waives all but 0.01p per share of its dividend entitlement. For further details of the EBT please refer to Note 2 to the financial statements.
SAVILLS PLC REPORT AND ACCOUNTS 201570
Directors’ report
Purchase of own sharesIn accordance with the Listing Rules, at the AGM on 13 May 2015, shareholders gave authority for a limited purchase of Savills shares of up to 10% of the issued share capital. During the year, no shares were purchased under the authority.
The Board proposes to seek shareholder approval at the AGM on 11 May 2016 to renew the Company’s authority to make market purchases of its own ordinary shares of 2.5p each for cancellation or to be held in treasury. Details of the proposed resolution are included in the Notice of AGM circulated to shareholders with this Annual Report (the ‘AGM Notice’).
Change of controlThere are no significant agreements which take effect, alter or terminate in the event of change of control of the Company except that under its banking arrangements, a change of control may trigger an early repayment obligation.
Articles of AssociationThe Company’s Articles are governed by relevant statutes and may be amended by special resolution of the shareholders in a general meeting.
The Company’s rules about the appointment and replacement of Directors are contained in the Articles. The powers of the Directors are determined by UK legislation and the Articles in force from time to time.
Unless determined by ordinary resolution of the Company, the number of Directors shall be not less than three and not more than 18. A Director is not required to hold any shares in the Company by way of qualification. However, as more fully described on page 63, in accordance with Board policy, the members of the GEB (which includes the Executive Directors) are expected to build up and maintain a shareholding in the Company. The Board may appoint any person to be a Director and such Director shall hold office only until the next AGM when he or she shall then be eligible for reappointment by the shareholders. The Articles provide that each Director shall retire from office at the third AGM after the AGM at which he or she was last elected. A retiring Director shall be eligible for re-election. However, in accordance with the Code, all Directors of the Company are subject to annual re-election.
Annual General MeetingThe AGM is to be held at 33 Margaret Street, London W1G 0JD at 12 noon on 11 May 2016; details are contained in the AGM Notice circulated to shareholders with this Report.
Half Year ReportLike many other listed public companies, we no longer circulate printed Half Year reports to shareholders. Rather, Half Year results’ statements are published on the Company’s website. This is consistent with our target of saving printing and distribution costs.
Political contributionsThere were no political contributions during the year (2014: £nil).
Employees’ policies and involvementThe Directors recognise that the quality, commitment and motivation of Savills staff is a key element in the success of the Group; see pages 22 and 23 for more information.
The Group provides regular updates covering performance, developments and progress to employees through regular newsletters, video addresses, the Group’s intranet, and social media and through formal and informal briefings. These arrangements also
aim at ensuring that all of our staff understand our strategy and to build knowledge on the part of employees of matters affecting the performance of the Group. The Group also consults with employees so as to ascertain their views in relation to decisions which are likely to affect their interests.
Employees are able to share in the Group’s success through performance-related profit share schemes (see page 68 for more details) and for UK employees (including Executive Directors), share plans which include a Sharesave Scheme and a Share Incentive Plan (‘SIP’). The Sharesave Scheme is an HMRC approved save-as-you-earn share option scheme which allows participants to purchase shares out of the proceeds of a linked savings contract at a price set at the time of option grant. Participants may elect to save up to £500 per month and options may normally be exercised in the six months following the maturity of the linked three-year savings contract. The potential for extending the Sharesave Scheme internationally remains under consideration. The SIP is also HMRC approved and through which participants may make regular purchases of shares (up to £150 per month which is the current statutory limit) from pre-tax income. Shares under the SIP normally vest after five years free from income tax and national insurance contributions.
Human Rights and equal opportunitiesWe support the principles of the UN Universal Declaration of Human Rights and the Core Principles of the International Labour Organization.
It is Group policy to provide employment on an equal basis irrespective of gender, sexual orientation, marital or civil partner status, gender reassignment, race, colour, nationality, ethnic or national origin, religion or belief, disability or age. In particular, the Group gives full consideration to applications for employment from disabled persons. Where existing employees become disabled, it is the Group’s policy wherever practicable to provide continuing employment and to provide training and career development and promotion to disabled employees.
Independent AuditorsIn accordance with Section 489 of the CA2006, a resolution for the reappointment of PricewaterhouseCoopers LLP as Auditors of the Company will be proposed at the forthcoming AGM.
Whistle-blowingThe Group encourages staff to report any concerns which they feel need to be brought to the attention of management. Whistle-blowing procedures, which are published on the Group’s intranet site, are available to staff who are concerned about possible impropriety, financial or otherwise, and who may wish to ensure that action is taken without fear or victimisation or reprisal.
Greenhouse Gas EmissionsDetails of the Group’s global greenhouse gas emissions for the financial year under review can be found on pages 25 and 26 and is incorporated into this report by reference.
By order of the Board
Chris LeeGroup Legal Director & Company Secretary9 March 2016
Savills plcRegistered in England No. 2122174
SAVILLS PLC REPORT AND ACCOUNTS 2015 71
Overview
/ Strategy / P
erformance / G
ove
rna
nc
e / Financial statements
Directors’ responsibility statementThe Directors are responsible for preparing the Annual Report, the Directors’ Remuneration Report and the financial statements in accordance with applicable law and regulations.
Company law requires the Directors to prepare financial statements for each financial year. Under that law the Directors have prepared the Company and Group financial statements in accordance with International Financial Reporting Standards (‘IFRSs’) as adopted by the European Union. Under company law the Directors must not approve the financial statements unless they are satisfied that they give a true and fair view of the state of affairs of the Company and the Group and of the profit or loss of the Company and Group for that period. In preparing these financial statements, the Directors are required to:
– select suitable accounting policies and then apply them consistently;
– make judgements and accounting estimates that are reasonable and prudent;
– state whether applicable IFRSs as adopted by the European Union have been followed, subject to any material departures disclosed and explained in the financial statements; and
– prepare the financial statements on the going concern basis unless it is inappropriate to presume that the Company will continue in business.
The Directors are responsible for keeping adequate accounting records that are sufficient to show and explain the Company’s transactions and disclose with reasonable accuracy at any time the financial position of the Company and the Group and enable them to ensure that the financial statements and the Directors’ Remuneration report comply with the Companies Act 2006 and, as regards the Group financial statements, Article 4 of the IAS Regulation. They are also responsible for safeguarding the assets of the Company and the Group and hence for taking reasonable steps for the prevention and detection of fraud and other irregularities.
The Directors are responsible for the maintenance and integrity of the Company’s website. Legislation in the United Kingdom governing the preparation and dissemination of financial statements may differ from legislation in other jurisdictions.
The Directors consider that the Annual Report and Accounts, taken as a whole, is fair, balanced and understandable and provides the information necessary for shareholders to assess the Company’s position and performance, business model and strategy.
Each of the Directors, whose names and functions are listed on page 44, confirms that to the best of his or her knowledge:
– the Group financial statements, which have been prepared in accordance with IFRSs as adopted by the EU, give a true and fair view of the assets, liabilities, financial position and profit of the Group; and
– the Strategic Report set out on pages 10 to 32 includes a fair review of the development and performance of the business and the position of the Group, together with a description of the principal risks and uncertainties that it faces.
For the purposes of Section 418 of the Companies Act 2006, each of the Directors as at the date of the approval of the Annual Report and Accounts confirms that:
– so far as the Director is aware, there is no relevant audit information of which the External Auditors are unaware; and
– the Director has taken all the steps that he/she ought to have taken as a Director in order to make himself/herself aware of any relevant audit information and to establish that the External Auditors are aware of that information.
After making enquiries, the Directors have a reasonable expectation that the Company and the Group have adequate resources to continue in operational existence for the foreseeable future. Accordingly, they continue to adopt the going concern basis in preparing the Annual Report and Accounts.
On behalf of the Board
Jeremy HelsbyGroup Chief Executive
Chris LeeGroup Legal Director & Company Secretary
Forward-looking statementsForward-looking statements have been made by the Directors in good faith using information up until the date on which they approved the Annual Report and Accounts. Forward-looking statements should be regarded with caution due to uncertainties in economic trends and business risks.
9 March 2016
SAVILLS PLC REPORT AND ACCOUNTS 201572
Directors’ responsibilities
Report on the financial statementsOur opinionIn our opinion:
– Savills plc’s Group financial statements and Company financial statements (the ‘financial statements’) give a true and fair view of the state of the Group’s and of the Company’s affairs as at 31 December 2015 and of the Group’s profit and the Group’s and the Company’s cash flows for the year then ended;
– the Group financial statements have been properly prepared in accordance with International Financial Reporting Standards (‘IFRSs’) as adopted by the European Union;
– the Company financial statements have been properly prepared in accordance with IFRSs as adopted by the European Union and as applied in accordance with the provisions of the Companies Act 2006; and
– the financial statements have been prepared in accordance with the requirements of the Companies Act 2006 and, as regards the Group financial statements, Article 4 of the IAS Regulation.
What we have auditedThe financial statements, included within the Report and Accounts (the ‘Annual Report’), comprise:
– the Consolidated and Company statements of financial position as at 31 December 2015;
– the Consolidated income statement and Consolidated statement of comprehensive income for the year then ended;
– the Consolidated and Company statements of cash flows for the year then ended;
– the Consolidated statement of changes in equity and the Company statement of changes in equity for the year then ended; and
– the Notes to the financial statements, which include a summary of significant accounting policies and other explanatory information.
The financial reporting framework that has been applied in the preparation of the financial statements is applicable law and IFRSs as adopted by the European Union and, as regards the Company financial statements, as applied in accordance with the provisions of the Companies Act 2006.
Our audit approachContextSavills plc is listed on the London Stock Exchange and is structured across four business lines, being Transactional Advisory, Property Consultancy, Property and Facilities Management, and Investment Management Services. The Group financial statements are a consolidation of reporting units that make up the four business lines, spread across four geographical regions, UK, US, Europe and Asia Pacific.
The Group has continued to expand through acquisition across its business lines. On grounds of materiality, we considered the acquisition of Smiths Gore, a UK-based rural property management business and the acquisition of SEB Asset Management, a European fund manager, to be an area of focus for the 2015 audit.
The Group is also subject to a number of legal claims in the normal course of business, often dating back to the height of the property market in 2007. The number of claims, particularly in respect of UK valuations, has continued to decline in 2015.
OverviewMateriality – Overall Group materiality: £6.0m (2014: £5.0m) which represents
5% of Group underlying profit before tax as defined in Note 2.2 to the financial statements.
Audit scope – We conducted audit work in the UK, the US and Asia Pacific,
and across all four of the Group’s business lines. – Audits of the complete financial information were performed on
the businesses in the UK, US, Hong Kong, and Australia. – We carried out procedures on parts of the business which
accounted for 83% (2014: 80.5%) of Group revenues and 86% (2014: 82.5%) of Group underlying profit before tax. We paid particular attention to the acquisition during the year of Smiths Gore in the UK Property and facilities management business, and of SEB in the Investment Management Services business.
Areas of focus – Goodwill impairment assessment – particularly for European
businesses. – Risk of fraud in revenue recognition in relation to cut-off of
transaction fees in the advisory and investment management businesses.
– Accounting for the acquisitions of Smiths Gore and SEB. – Provisions for litigation on valuations. – Recoverability of trade receivables in Asia. – Regulatory compliance obligations.
The scope of our audit and our areas of focusWe conducted our audit in accordance with International Standards on Auditing (UK and Ireland) (‘ISAs (UK & Ireland)’).
We designed our audit by determining materiality and assessing the risks of material misstatement in the financial statements. In particular, we looked at where the Directors made subjective judgements, for example in respect of significant accounting estimates that involved making assumptions and considering future events that are inherently uncertain. As in all of our audits we also addressed the risk of management override of internal controls, including evaluating whether there was evidence of bias by the Directors that represented a risk of material misstatement due to fraud.
SAVILLS PLC REPORT AND ACCOUNTS 2015 73
Overview
/ Strategy / P
erformance / G
ove
rna
nc
e / Financial statements
Independent auditors’ reportto the members of Savills plc
The risks of material misstatement that had the greatest effect on our audit, including the allocation of our resources and effort, are identified as ‘areas of focus’ in the table below. We have also set out how we tailored our audit to address these specific areas in order to provide an opinion on the financial statements as a whole, and any comments we make on the results of our procedures should be read in this context. This is not a complete list of all risks identified by our audit.
Area of focus How our audit addressed the area of focus
Goodwill impairment assessment – particularly for European businessesRefer to page 49 (Audit Committee Report), pages 88 and 96 (Significant Accounting Policies) and pages 108 to 110 (notes).
The Group carried £269.9m of goodwill at 31 December 2015 (2014: £228.0m) of which £41.9m related to new acquisitions and £228.0m to existing businesses.
£18.5m of the goodwill balance related to the acquisition of Smiths Gore and £1.8m related to the acquisition of SEB. The fair value exercises performed by management, which gave rise to the goodwill, are provisional under accounting standards (refer to the area of focus below on Accounting for the acquisitions of Smiths Gore and SEB), and both businesses are currently trading in line with the investment decision forecasts.
The carrying values of goodwill are contingent on future cash flows of the underlying cash-generating units (‘CGUs’) and there is a risk that if these cash flows do not meet the Directors’ expectations, the assets will be impaired.
No impairment charge was recognised in the year ended 31 December 2015.
We did not regard the acquisitions in the year as warranting particular focus in relation to impairment of goodwill and focused our assessment on the other CGUs in Europe with material amounts of goodwill. The Group’s performance in Europe continued to improve during 2015, but there is continued economic uncertainty and European property markets remain unsettled.
Focusing on the European businesses, we evaluated and challenged the Directors’ future cash flow forecasts and the process by which they were drawn up, and tested the underlying value in use calculations. We compared management’s forecast to the latest Board approved budget and found them to be consistent.
We challenged:
– the key assumptions for long-term growth rates in the forecasts by comparing them to historical results, as well as economic and industry forecasts for the relevant international property markets; and
– the discount rate used in the calculations by assessing the cost of capital for the Company and comparable organisations, and assessed the specific risk premium applied to the CGU in question.
We performed sensitivity analysis on the key assumptions within the cash flow forecasts. This included sensitising the discount rate applied to the future cash flows, and the short and longer-term growth rates and profit margins in Europe due to continued uncertainty in the macro-economic environment for a number of countries in the region. We ascertained the extent to which a reduction in these assumptions both individually or in aggregate would result in goodwill impairment, and considered the likelihood of such events occurring. We did not regard this to be reasonably possible.
Given the level of headroom, improved business performance in Savills Europe for 2015 and the continued uplift of property markets in Savills’ key European locations, we were satisfied that the carrying value of goodwill in Europe had been appropriately assessed.
Risk of fraud in revenue recognition in relation to cut-off of transaction fees in the advisory and investment management businesses Refer to page 49 (Audit Committee Report) and Note 2 to the financial statements for the Directors’ disclosures of the related accounting policies, judgements and estimates.
Our specific audit focus was on the risk that revenue may be recorded in the incorrect period in respect of transaction fees in the agency and investment management businesses, in light of the incentive schemes for management in those businesses designed to reward performance.
For more complex contracts, the recognition of revenue is largely dependent on the date the underlying transaction is deemed to be completed.
For material transactions, we evaluated the commercial rationale and the revenue recognition process adopted and determined that the related revenue had been booked on a consistent basis across the Group in accordance with Group policies and applicable IFRSs.
We tested a sample of revenue transactions to underlying contracts and third-party completion documentation, for example, property sales completion statements, or asset or property management contracts, determining that these sales had taken place and were recorded in the correct period. We additionally tested a sample of revenue to supporting documentation, cash receipts and related contracts, in order to verify that the income was correctly calculated.
There were no material issues identified by our testing of revenue recognition in the period.
SAVILLS PLC REPORT AND ACCOUNTS 201574
Independent auditors’ reportto the members of Savills plc continued
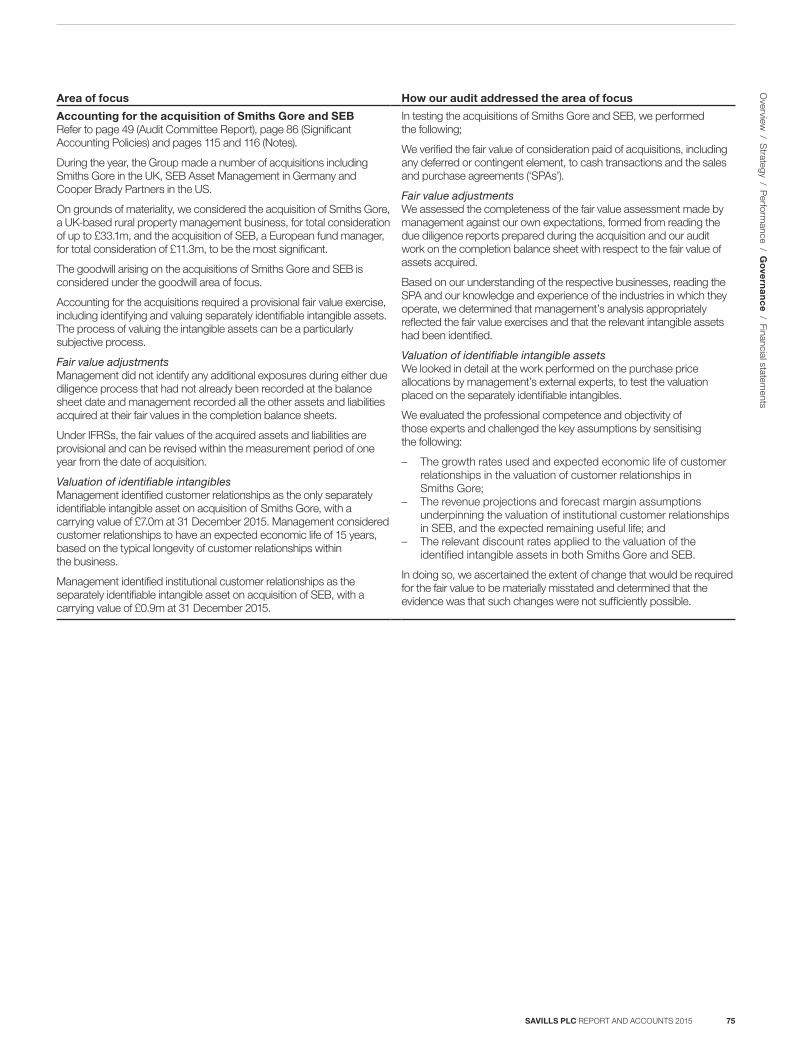
Area of focus How our audit addressed the area of focus
Accounting for the acquisition of Smiths Gore and SEBRefer to page 49 (Audit Committee Report), page 86 (Significant Accounting Policies) and pages 115 and 116 (Notes).
During the year, the Group made a number of acquisitions including Smiths Gore in the UK, SEB Asset Management in Germany and Cooper Brady Partners in the US.
On grounds of materiality, we considered the acquisition of Smiths Gore, a UK-based rural property management business, for total consideration of up to £33.1m, and the acquisition of SEB, a European fund manager, for total consideration of £11.3m, to be the most significant.
The goodwill arising on the acquisitions of Smiths Gore and SEB is considered under the goodwill area of focus.
Accounting for the acquisitions required a provisional fair value exercise, including identifying and valuing separately identifiable intangible assets. The process of valuing the intangible assets can be a particularly subjective process.
Fair value adjustmentsManagement did not identify any additional exposures during either due diligence process that had not already been recorded at the balance sheet date and management recorded all the other assets and liabilities acquired at their fair values in the completion balance sheets.
Under IFRSs, the fair values of the acquired assets and liabilities are provisional and can be revised within the measurement period of one year from the date of acquisition.
Valuation of identifiable intangiblesManagement identified customer relationships as the only separately identifiable intangible asset on acquisition of Smiths Gore, with a carrying value of £7.0m at 31 December 2015. Management considered customer relationships to have an expected economic life of 15 years, based on the typical longevity of customer relationships within the business.
Management identified institutional customer relationships as the separately identifiable intangible asset on acquisition of SEB, with a carrying value of £0.9m at 31 December 2015.
In testing the acquisitions of Smiths Gore and SEB, we performed the following;
We verified the fair value of consideration paid of acquisitions, including any deferred or contingent element, to cash transactions and the sales and purchase agreements (‘SPAs’).
Fair value adjustmentsWe assessed the completeness of the fair value assessment made by management against our own expectations, formed from reading the due diligence reports prepared during the acquisition and our audit work on the completion balance sheet with respect to the fair value of assets acquired.
Based on our understanding of the respective businesses, reading the SPA and our knowledge and experience of the industries in which they operate, we determined that management’s analysis appropriately reflected the fair value exercises and that the relevant intangible assets had been identified.
Valuation of identifiable intangible assetsWe looked in detail at the work performed on the purchase price allocations by management’s external experts, to test the valuation placed on the separately identifiable intangibles.
We evaluated the professional competence and objectivity of those experts and challenged the key assumptions by sensitising the following:
– The growth rates used and expected economic life of customer relationships in the valuation of customer relationships in Smiths Gore;
– The revenue projections and forecast margin assumptions underpinning the valuation of institutional customer relationships in SEB, and the expected remaining useful life; and
– The relevant discount rates applied to the valuation of the identified intangible assets in both Smiths Gore and SEB.
In doing so, we ascertained the extent of change that would be required for the fair value to be materially misstated and determined that the evidence was that such changes were not sufficiently possible.
SAVILLS PLC REPORT AND ACCOUNTS 2015 75
Overview
/ Strategy / P
erformance / G
ove
rna
nc
e / Financial statements
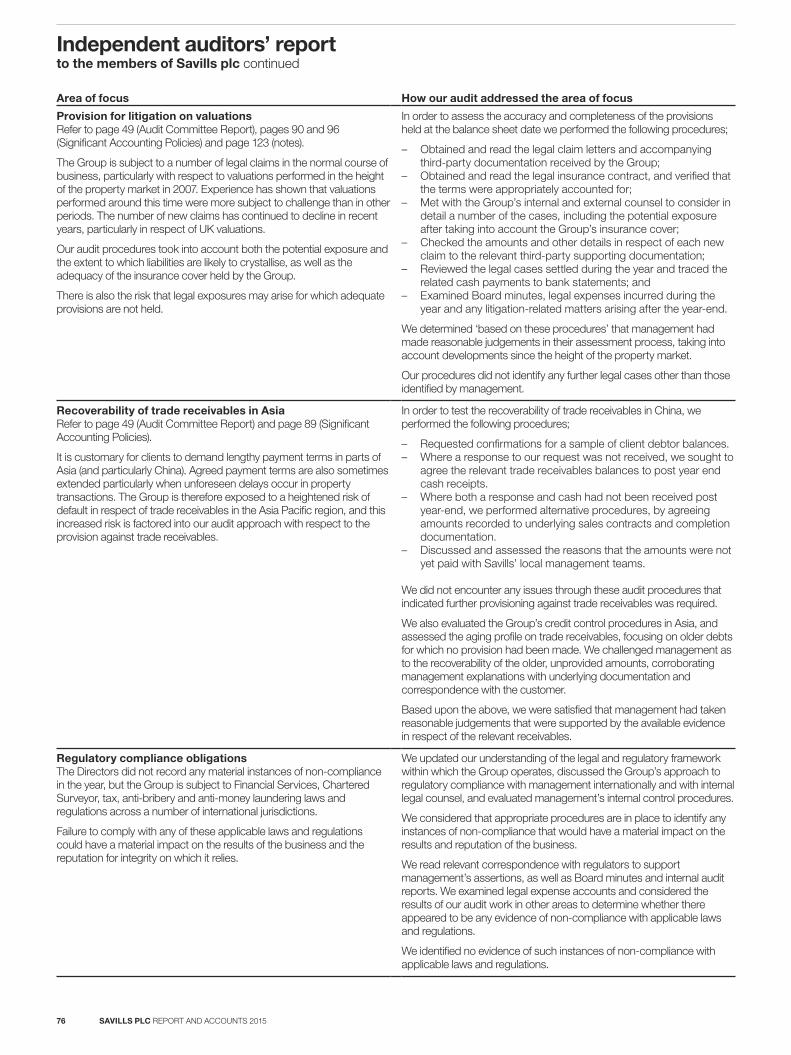
Area of focus How our audit addressed the area of focus
Provision for litigation on valuationsRefer to page 49 (Audit Committee Report), pages 90 and 96 (Significant Accounting Policies) and page 123 (notes).
The Group is subject to a number of legal claims in the normal course of business, particularly with respect to valuations performed in the height of the property market in 2007. Experience has shown that valuations performed around this time were more subject to challenge than in other periods. The number of new claims has continued to decline in recent years, particularly in respect of UK valuations.
Our audit procedures took into account both the potential exposure and the extent to which liabilities are likely to crystallise, as well as the adequacy of the insurance cover held by the Group.
There is also the risk that legal exposures may arise for which adequate provisions are not held.
In order to assess the accuracy and completeness of the provisions held at the balance sheet date we performed the following procedures;
– Obtained and read the legal claim letters and accompanying third-party documentation received by the Group;
– Obtained and read the legal insurance contract, and verified that the terms were appropriately accounted for;
– Met with the Group’s internal and external counsel to consider in detail a number of the cases, including the potential exposure after taking into account the Group’s insurance cover;
– Checked the amounts and other details in respect of each new claim to the relevant third-party supporting documentation;
– Reviewed the legal cases settled during the year and traced the related cash payments to bank statements; and
– Examined Board minutes, legal expenses incurred during the year and any litigation-related matters arising after the year-end.
We determined ‘based on these procedures’ that management had made reasonable judgements in their assessment process, taking into account developments since the height of the property market.
Our procedures did not identify any further legal cases other than those identified by management.
Recoverability of trade receivables in AsiaRefer to page 49 (Audit Committee Report) and page 89 (Significant Accounting Policies).
It is customary for clients to demand lengthy payment terms in parts of Asia (and particularly China). Agreed payment terms are also sometimes extended particularly when unforeseen delays occur in property transactions. The Group is therefore exposed to a heightened risk of default in respect of trade receivables in the Asia Pacific region, and this increased risk is factored into our audit approach with respect to the provision against trade receivables.
In order to test the recoverability of trade receivables in China, we performed the following procedures;
– Requested confirmations for a sample of client debtor balances. – Where a response to our request was not received, we sought to
agree the relevant trade receivables balances to post year end cash receipts.
– Where both a response and cash had not been received post year-end, we performed alternative procedures, by agreeing amounts recorded to underlying sales contracts and completion documentation.
– Discussed and assessed the reasons that the amounts were not yet paid with Savills’ local management teams.
We did not encounter any issues through these audit procedures that indicated further provisioning against trade receivables was required.
We also evaluated the Group’s credit control procedures in Asia, and assessed the aging profile on trade receivables, focusing on older debts for which no provision had been made. We challenged management as to the recoverability of the older, unprovided amounts, corroborating management explanations with underlying documentation and correspondence with the customer.
Based upon the above, we were satisfied that management had taken reasonable judgements that were supported by the available evidence in respect of the relevant receivables.
Regulatory compliance obligationsThe Directors did not record any material instances of non-compliance in the year, but the Group is subject to Financial Services, Chartered Surveyor, tax, anti-bribery and anti-money laundering laws and regulations across a number of international jurisdictions.
Failure to comply with any of these applicable laws and regulations could have a material impact on the results of the business and the reputation for integrity on which it relies.
We updated our understanding of the legal and regulatory framework within which the Group operates, discussed the Group’s approach to regulatory compliance with management internationally and with internal legal counsel, and evaluated management’s internal control procedures.
We considered that appropriate procedures are in place to identify any instances of non-compliance that would have a material impact on the results and reputation of the business.
We read relevant correspondence with regulators to support management’s assertions, as well as Board minutes and internal audit reports. We examined legal expense accounts and considered the results of our audit work in other areas to determine whether there appeared to be any evidence of non-compliance with applicable laws and regulations.
We identified no evidence of such instances of non-compliance with applicable laws and regulations.
SAVILLS PLC REPORT AND ACCOUNTS 201576
Independent auditors’ reportto the members of Savills plc continued
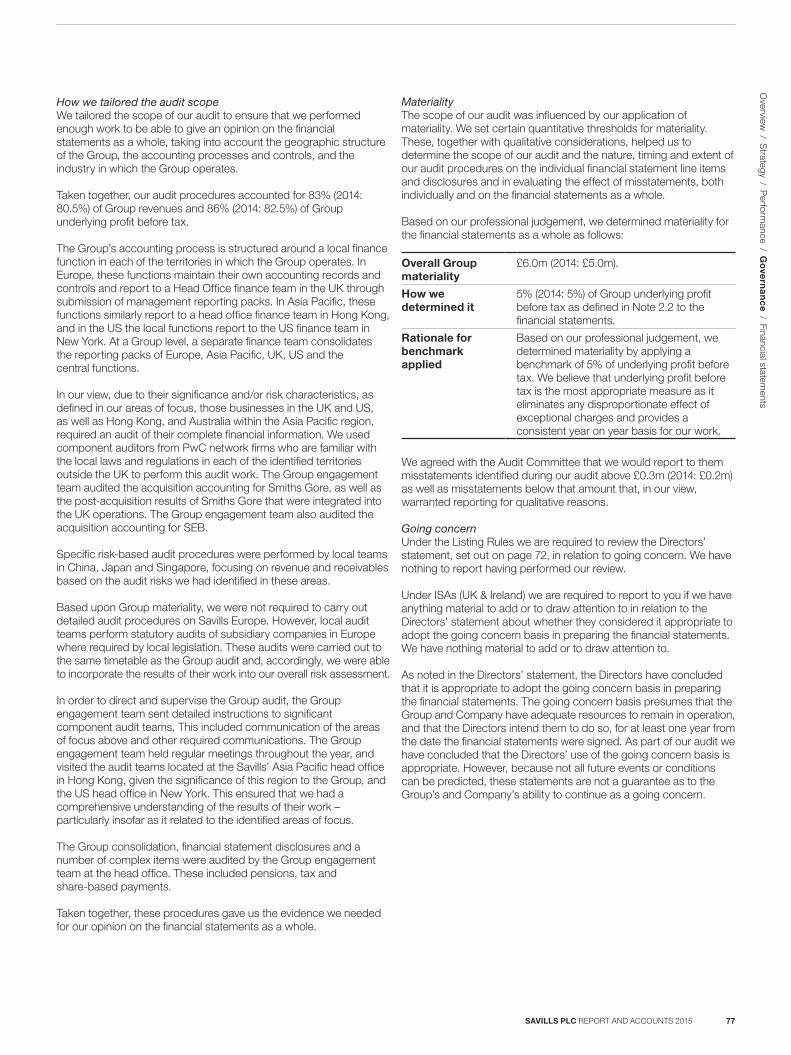
How we tailored the audit scopeWe tailored the scope of our audit to ensure that we performed enough work to be able to give an opinion on the financial statements as a whole, taking into account the geographic structure of the Group, the accounting processes and controls, and the industry in which the Group operates.
Taken together, our audit procedures accounted for 83% (2014: 80.5%) of Group revenues and 86% (2014: 82.5%) of Group underlying profit before tax.
The Group’s accounting process is structured around a local finance function in each of the territories in which the Group operates. In Europe, these functions maintain their own accounting records and controls and report to a Head Office finance team in the UK through submission of management reporting packs. In Asia Pacific, these functions similarly report to a head office finance team in Hong Kong, and in the US the local functions report to the US finance team in New York. At a Group level, a separate finance team consolidates the reporting packs of Europe, Asia Pacific, UK, US and the central functions.
In our view, due to their significance and/or risk characteristics, as defined in our areas of focus, those businesses in the UK and US, as well as Hong Kong, and Australia within the Asia Pacific region, required an audit of their complete financial information. We used component auditors from PwC network firms who are familiar with the local laws and regulations in each of the identified territories outside the UK to perform this audit work. The Group engagement team audited the acquisition accounting for Smiths Gore, as well as the post-acquisition results of Smiths Gore that were integrated into the UK operations. The Group engagement team also audited the acquisition accounting for SEB.
Specific risk-based audit procedures were performed by local teams in China, Japan and Singapore, focusing on revenue and receivables based on the audit risks we had identified in these areas.
Based upon Group materiality, we were not required to carry out detailed audit procedures on Savills Europe. However, local audit teams perform statutory audits of subsidiary companies in Europe where required by local legislation. These audits were carried out to the same timetable as the Group audit and, accordingly, we were able to incorporate the results of their work into our overall risk assessment.
In order to direct and supervise the Group audit, the Group engagement team sent detailed instructions to significant component audit teams. This included communication of the areas of focus above and other required communications. The Group engagement team held regular meetings throughout the year, and visited the audit teams located at the Savills’ Asia Pacific head office in Hong Kong, given the significance of this region to the Group, and the US head office in New York. This ensured that we had a comprehensive understanding of the results of their work – particularly insofar as it related to the identified areas of focus.
The Group consolidation, financial statement disclosures and a number of complex items were audited by the Group engagement team at the head office. These included pensions, tax and share-based payments.
Taken together, these procedures gave us the evidence we needed for our opinion on the financial statements as a whole.
MaterialityThe scope of our audit was influenced by our application of materiality. We set certain quantitative thresholds for materiality. These, together with qualitative considerations, helped us to determine the scope of our audit and the nature, timing and extent of our audit procedures on the individual financial statement line items and disclosures and in evaluating the effect of misstatements, both individually and on the financial statements as a whole.
Based on our professional judgement, we determined materiality for the financial statements as a whole as follows:
Overall Group materiality
£6.0m (2014: £5.0m).
How we determined it
5% (2014: 5%) of Group underlying profit before tax as defined in Note 2.2 to the financial statements.
Rationale for benchmark applied
Based on our professional judgement, we determined materiality by applying a benchmark of 5% of underlying profit before tax. We believe that underlying profit before tax is the most appropriate measure as it eliminates any disproportionate effect of exceptional charges and provides a consistent year on year basis for our work.
We agreed with the Audit Committee that we would report to them misstatements identified during our audit above £0.3m (2014: £0.2m) as well as misstatements below that amount that, in our view, warranted reporting for qualitative reasons.
Going concernUnder the Listing Rules we are required to review the Directors’ statement, set out on page 72, in relation to going concern. We have nothing to report having performed our review.
Under ISAs (UK & Ireland) we are required to report to you if we have anything material to add or to draw attention to in relation to the Directors’ statement about whether they considered it appropriate to adopt the going concern basis in preparing the financial statements. We have nothing material to add or to draw attention to.
As noted in the Directors’ statement, the Directors have concluded that it is appropriate to adopt the going concern basis in preparing the financial statements. The going concern basis presumes that the Group and Company have adequate resources to remain in operation, and that the Directors intend them to do so, for at least one year from the date the financial statements were signed. As part of our audit we have concluded that the Directors’ use of the going concern basis is appropriate. However, because not all future events or conditions can be predicted, these statements are not a guarantee as to the Group’s and Company’s ability to continue as a going concern.
SAVILLS PLC REPORT AND ACCOUNTS 2015 77
Overview
/ Strategy / P
erformance / G
ove
rna
nc
e / Financial statements
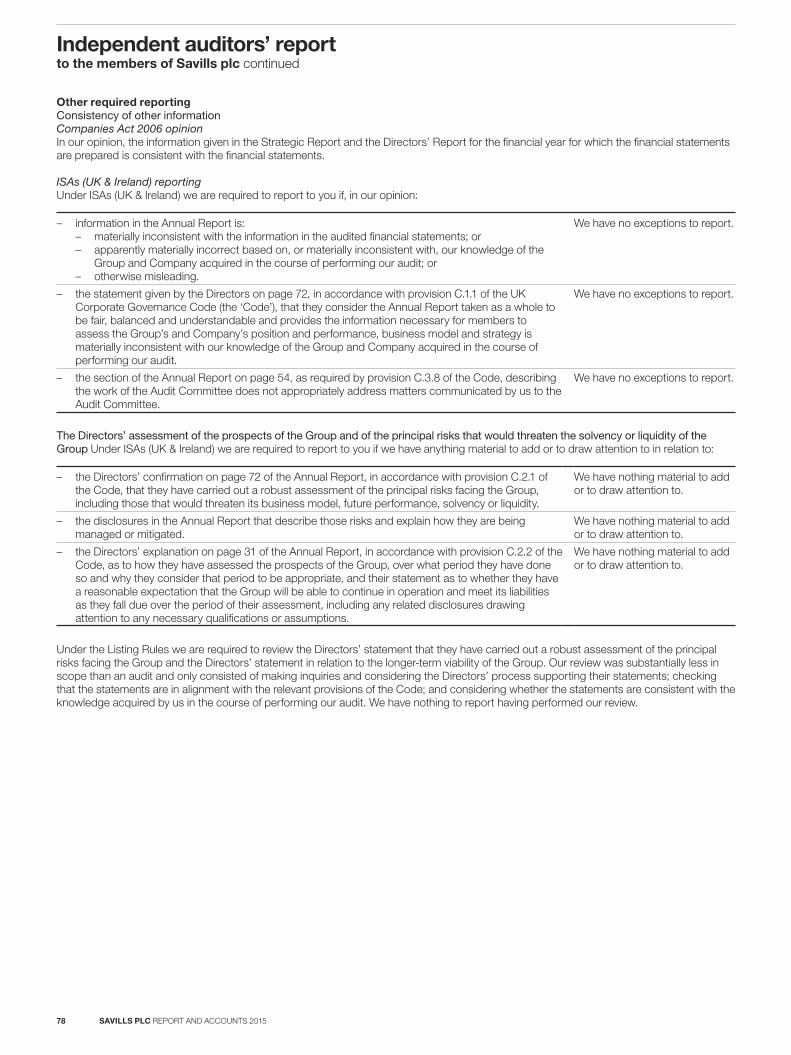
Other required reportingConsistency of other informationCompanies Act 2006 opinionIn our opinion, the information given in the Strategic Report and the Directors’ Report for the financial year for which the financial statements are prepared is consistent with the financial statements.
ISAs (UK & Ireland) reportingUnder ISAs (UK & Ireland) we are required to report to you if, in our opinion:
– information in the Annual Report is: – materially inconsistent with the information in the audited financial statements; or – apparently materially incorrect based on, or materially inconsistent with, our knowledge of the
Group and Company acquired in the course of performing our audit; or – otherwise misleading.
We have no exceptions to report.
– the statement given by the Directors on page 72, in accordance with provision C.1.1 of the UK Corporate Governance Code (the ‘Code’), that they consider the Annual Report taken as a whole to be fair, balanced and understandable and provides the information necessary for members to assess the Group’s and Company’s position and performance, business model and strategy is materially inconsistent with our knowledge of the Group and Company acquired in the course of performing our audit.
We have no exceptions to report.
– the section of the Annual Report on page 54, as required by provision C.3.8 of the Code, describing the work of the Audit Committee does not appropriately address matters communicated by us to the Audit Committee.
We have no exceptions to report.
The Directors’ assessment of the prospects of the Group and of the principal risks that would threaten the solvency or liquidity of the Group Under ISAs (UK & Ireland) we are required to report to you if we have anything material to add or to draw attention to in relation to:
– the Directors’ confirmation on page 72 of the Annual Report, in accordance with provision C.2.1 of the Code, that they have carried out a robust assessment of the principal risks facing the Group, including those that would threaten its business model, future performance, solvency or liquidity.
We have nothing material to add or to draw attention to.
– the disclosures in the Annual Report that describe those risks and explain how they are being managed or mitigated.
We have nothing material to add or to draw attention to.
– the Directors’ explanation on page 31 of the Annual Report, in accordance with provision C.2.2 of the Code, as to how they have assessed the prospects of the Group, over what period they have done so and why they consider that period to be appropriate, and their statement as to whether they have a reasonable expectation that the Group will be able to continue in operation and meet its liabilities as they fall due over the period of their assessment, including any related disclosures drawing attention to any necessary qualifications or assumptions.
We have nothing material to add or to draw attention to.
Under the Listing Rules we are required to review the Directors’ statement that they have carried out a robust assessment of the principal risks facing the Group and the Directors’ statement in relation to the longer-term viability of the Group. Our review was substantially less in scope than an audit and only consisted of making inquiries and considering the Directors’ process supporting their statements; checking that the statements are in alignment with the relevant provisions of the Code; and considering whether the statements are consistent with the knowledge acquired by us in the course of performing our audit. We have nothing to report having performed our review.
SAVILLS PLC REPORT AND ACCOUNTS 201578
Independent auditors’ reportto the members of Savills plc continued
Adequacy of accounting records and information and explanations receivedUnder the Companies Act 2006 we are required to report to you if, in our opinion:
– we have not received all the information and explanations we require for our audit; or
– adequate accounting records have not been kept by the Company, or returns adequate for our audit have not been received from branches not visited by us; or
– the Company financial statements and the part of the Directors’ Remuneration report to be audited are not in agreement with the accounting records and returns.
We have no exceptions to report arising from this responsibility.
Directors’ remunerationDirectors’ remuneration report – Companies Act 2006 opinionIn our opinion, the part of the Directors’ Remuneration report to be audited has been properly prepared in accordance with the Companies Act 2006.
Other Companies Act 2006 reportingUnder the Companies Act 2006 we are required to report to you if, in our opinion, certain disclosures of Directors’ remuneration specified by law are not made. We have no exceptions to report arising from this responsibility.
Corporate governance statementUnder the Listing Rules we are required to review the part of the Corporate Governance Statement relating to 10 further provisions of the Code. We have nothing to report having performed our review.
Responsibilities for the financial statements and the auditOur responsibilities and those of the DirectorsAs explained more fully in the Statement of Directors’ responsibilities, the Directors are responsible for the preparation of the financial statements and for being satisfied that they give a true and fair view.
Our responsibility is to audit and express an opinion on the financial statements in accordance with applicable law and ISAs (UK & Ireland). Those standards require us to comply with the Auditing Practices Board’s Ethical Standards for Auditors.
This report, including the opinions, has been prepared for and only for the Company’s members as a body in accordance with Chapter 3 of Part 16 of the Companies Act 2006 and for no other purpose. We do not, in giving these opinions, accept or assume responsibility for any other purpose or to any other person to whom this report is shown or into whose hands it may come save where expressly agreed by our prior consent in writing.
What an audit of financial statements involvesAn audit involves obtaining evidence about the amounts and disclosures in the financial statements sufficient to give reasonable assurance that the financial statements are free from material misstatement, whether caused by fraud or error. This includes an assessment of:
– whether the accounting policies are appropriate to the Group’s and the Company’s circumstances and have been consistently applied and adequately disclosed;
– the reasonableness of significant accounting estimates made by the Directors; and
– the overall presentation of the financial statements.
We primarily focus our work in these areas by assessing the Directors’ judgements against available evidence, forming our own judgements, and evaluating the disclosures in the financial statements.
We test and examine information, using sampling and other auditing techniques, to the extent we consider necessary to provide a reasonable basis for us to draw conclusions. We obtain audit evidence through testing the effectiveness of controls, substantive procedures or a combination of both.
In addition, we read all the financial and non-financial information in the Annual Report to identify material inconsistencies with the audited financial statements and to identify any information that is apparently materially incorrect based on, or materially inconsistent with, the knowledge acquired by us in the course of performing the audit. If we become aware of any apparent material misstatements or inconsistencies we consider the implications for our report.
David A Snell (Senior Statutory Auditor)for and on behalf of PricewaterhouseCoopers LLPChartered Accountants and Statutory AuditorsLondon9 March 2016
SAVILLS PLC REPORT AND ACCOUNTS 2015 79
Overview
/ Strategy / P
erformance / G
ove
rna
nc
e / Financial statements
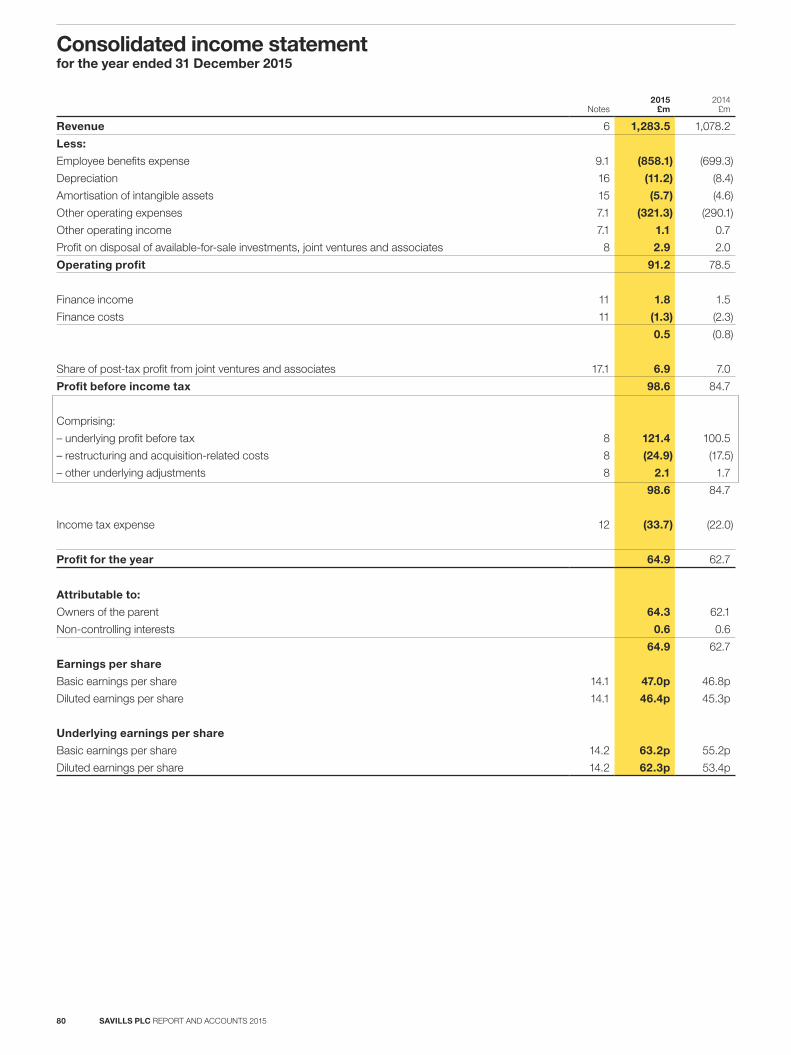
Notes2015
£m2014
£m
Revenue 6 1,283.5 1,078.2
Less:
Employee benefits expense 9.1 (858.1) (699.3)
Depreciation 16 (11.2) (8.4)
Amortisation of intangible assets 15 (5.7) (4.6)
Other operating expenses 7.1 (321.3) (290.1)
Other operating income 7.1 1.1 0.7
Profit on disposal of available-for-sale investments, joint ventures and associates 8 2.9 2.0
Operating profit 91.2 78.5
Finance income 11 1.8 1.5
Finance costs 11 (1.3) (2.3)
0.5 (0.8)
Share of post-tax profit from joint ventures and associates 17.1 6.9 7.0
Profit before income tax 98.6 84.7
Comprising:
– underlying profit before tax 8 121.4 100.5
– restructuring and acquisition-related costs 8 (24.9) (17.5)
– other underlying adjustments 8 2.1 1.7
98.6 84.7
Income tax expense 12 (33.7) (22.0)
Profit for the year 64.9 62.7
Attributable to:
Owners of the parent 64.3 62.1
Non-controlling interests 0.6 0.6
64.9 62.7
Earnings per share
Basic earnings per share 14.1 47.0p 46.8p
Diluted earnings per share 14.1 46.4p 45.3p
Underlying earnings per share
Basic earnings per share 14.2 63.2p 55.2p
Diluted earnings per share 14.2 62.3p 53.4p
SAVILLS PLC REPORT AND ACCOUNTS 201580
Consolidated income statementfor the year ended 31 December 2015
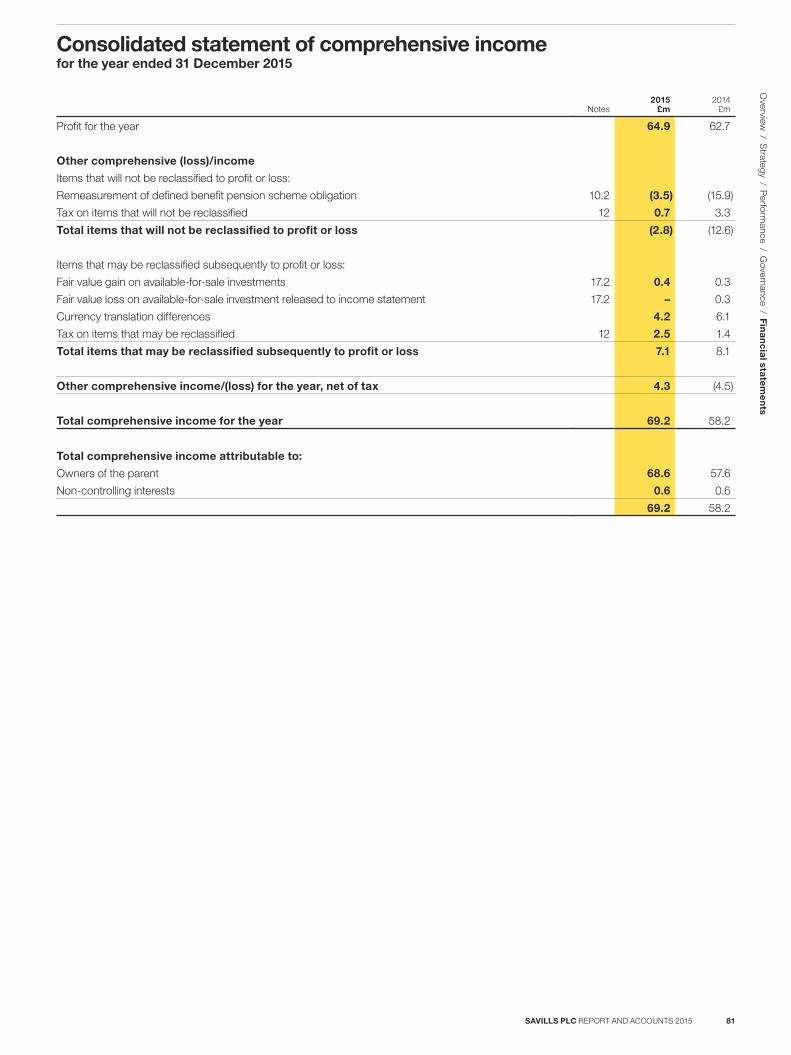
Notes2015
£m 2014
£m
Profit for the year 64.9 62.7
Other comprehensive (loss)/income
Items that will not be reclassified to profit or loss:
Remeasurement of defined benefit pension scheme obligation 10.2 (3.5) (15.9)
Tax on items that will not be reclassified 12 0.7 3.3
Total items that will not be reclassified to profit or loss (2.8) (12.6)
Items that may be reclassified subsequently to profit or loss:
Fair value gain on available-for-sale investments 17.2 0.4 0.3
Fair value loss on available-for-sale investment released to income statement 17.2 – 0.3
Currency translation differences 4.2 6.1
Tax on items that may be reclassified 12 2.5 1.4
Total items that may be reclassified subsequently to profit or loss 7.1 8.1
Other comprehensive income/(loss) for the year, net of tax 4.3 (4.5)
Total comprehensive income for the year 69.2 58.2
Total comprehensive income attributable to:
Owners of the parent 68.6 57.6
Non-controlling interests 0.6 0.6
69.2 58.2
SAVILLS PLC REPORT AND ACCOUNTS 2015 81
Consolidated statement of comprehensive incomefor the year ended 31 December 2015
Overview
/ Strategy / P
erformance / G
overnance / Fin
an
cia
l state
me
nts
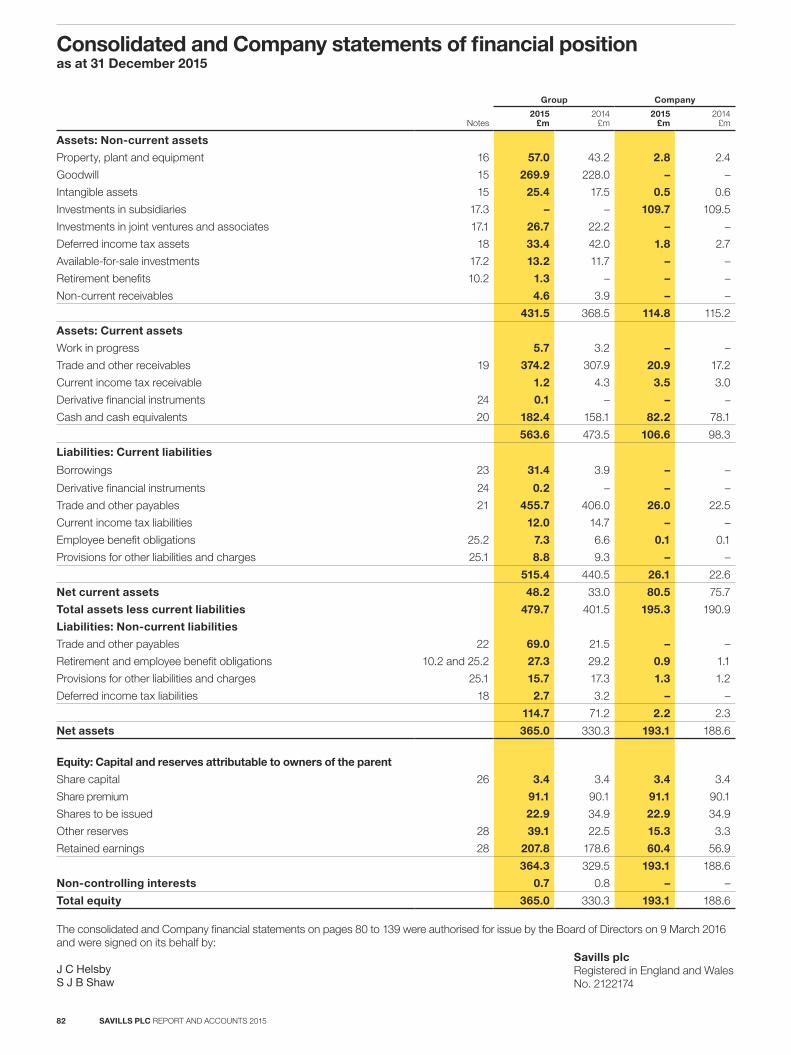
Group Company
Notes2015
£m2014
£m2015
£m2014
£m
Assets: Non-current assets
Property, plant and equipment 16 57.0 43.2 2.8 2.4
Goodwill 15 269.9 228.0 – –
Intangible assets 15 25.4 17.5 0.5 0.6
Investments in subsidiaries 17.3 – – 109.7 109.5
Investments in joint ventures and associates 17.1 26.7 22.2 – –
Deferred income tax assets 18 33.4 42.0 1.8 2.7
Available-for-sale investments 17.2 13.2 11.7 – –
Retirement benefits 10.2 1.3 – – –
Non-current receivables 4.6 3.9 – –
431.5 368.5 114.8 115.2
Assets: Current assets
Work in progress 5.7 3.2 – –
Trade and other receivables 19 374.2 307.9 20.9 17.2
Current income tax receivable 1.2 4.3 3.5 3.0
Derivative financial instruments 24 0.1 – – –
Cash and cash equivalents 20 182.4 158.1 82.2 78.1
563.6 473.5 106.6 98.3
Liabilities: Current liabilities
Borrowings 23 31.4 3.9 – –
Derivative financial instruments 24 0.2 – – –
Trade and other payables 21 455.7 406.0 26.0 22.5
Current income tax liabilities 12.0 14.7 – –
Employee benefit obligations 25.2 7.3 6.6 0.1 0.1
Provisions for other liabilities and charges 25.1 8.8 9.3 – –
515.4 440.5 26.1 22.6
Net current assets 48.2 33.0 80.5 75.7
Total assets less current liabilities 479.7 401.5 195.3 190.9
Liabilities: Non-current liabilities
Trade and other payables 22 69.0 21.5 – –
Retirement and employee benefit obligations 10.2 and 25.2 27.3 29.2 0.9 1.1
Provisions for other liabilities and charges 25.1 15.7 17.3 1.3 1.2
Deferred income tax liabilities 18 2.7 3.2 – –
114.7 71.2 2.2 2.3
Net assets 365.0 330.3 193.1 188.6
Equity: Capital and reserves attributable to owners of the parent
Share capital 26 3.4 3.4 3.4 3.4
Share premium 91.1 90.1 91.1 90.1
Shares to be issued 22.9 34.9 22.9 34.9
Other reserves 28 39.1 22.5 15.3 3.3
Retained earnings 28 207.8 178.6 60.4 56.9
364.3 329.5 193.1 188.6
Non-controlling interests 0.7 0.8 – –
Total equity 365.0 330.3 193.1 188.6
The consolidated and Company financial statements on pages 80 to 139 were authorised for issue by the Board of Directors on 9 March 2016 and were signed on its behalf by:
J C HelsbyS J B Shaw
Savills plcRegistered in England and WalesNo. 2122174
SAVILLS PLC REPORT AND ACCOUNTS 201582
Consolidated and Company statements of financial positionas at 31 December 2015
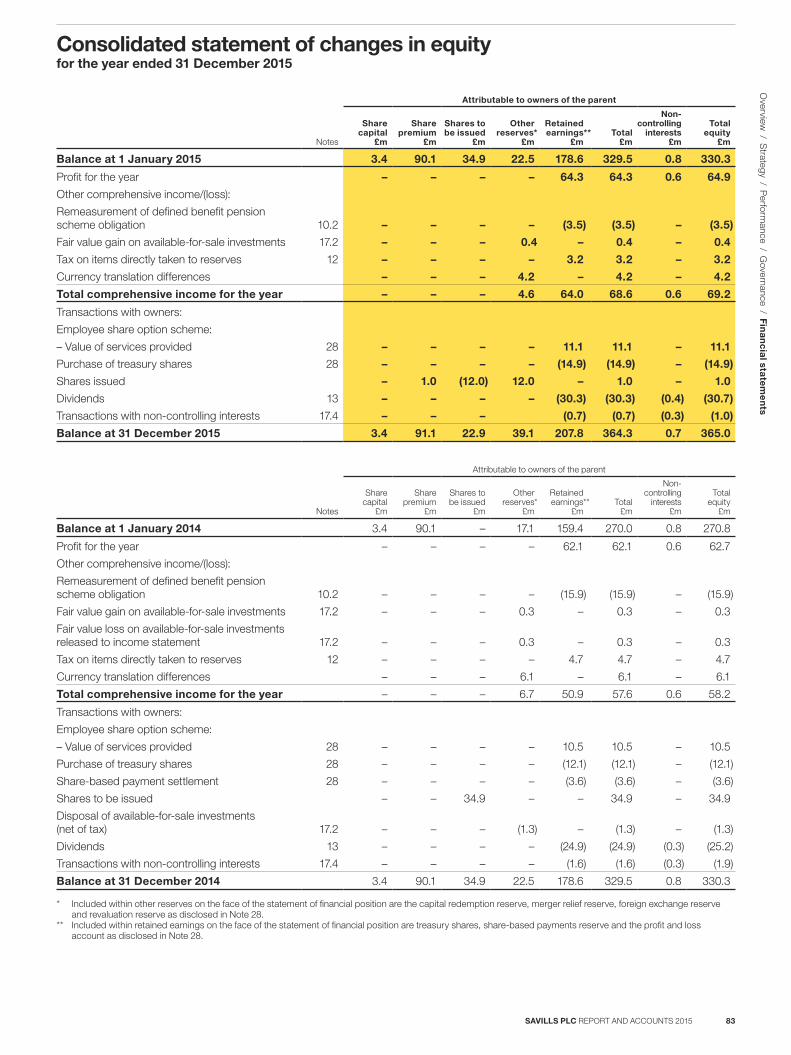
Attributable to owners of the parent
Notes
Share capital
£m
Share premium
£m
Shares to be issued
£m
Other reserves*
£m
Retainedearnings**
£mTotal
£m
Non-controlling
interests £m
Total equity
£m
Balance at 1 January 2015 3.4 90.1 34.9 22.5 178.6 329.5 0.8 330.3
Profit for the year – – – – 64.3 64.3 0.6 64.9
Other comprehensive income/(loss):
Remeasurement of defined benefit pension scheme obligation 10.2 – – – – (3.5) (3.5) – (3.5)
Fair value gain on available-for-sale investments 17.2 – – – 0.4 – 0.4 – 0.4
Tax on items directly taken to reserves 12 – – – – 3.2 3.2 – 3.2
Currency translation differences – – – 4.2 – 4.2 – 4.2
Total comprehensive income for the year – – – 4.6 64.0 68.6 0.6 69.2
Transactions with owners:
Employee share option scheme:
– Value of services provided 28 – – – – 11.1 11.1 – 11.1
Purchase of treasury shares 28 – – – – (14.9) (14.9) – (14.9)
Shares issued – 1.0 (12.0) 12.0 – 1.0 – 1.0
Dividends 13 – – – – (30.3) (30.3) (0.4) (30.7)
Transactions with non-controlling interests 17.4 – – – (0.7) (0.7) (0.3) (1.0)
Balance at 31 December 2015 3.4 91.1 22.9 39.1 207.8 364.3 0.7 365.0
Attributable to owners of the parent
Notes
Share capital
£m
Share premium
£m
Shares to be issued
£m
Otherreserves*
£m
Retainedearnings**
£mTotal
£m
Non-controlling
interests £m
Total equity
£m
Balance at 1 January 2014 3.4 90.1 – 17.1 159.4 270.0 0.8 270.8
Profit for the year – – – – 62.1 62.1 0.6 62.7
Other comprehensive income/(loss):
Remeasurement of defined benefit pension scheme obligation 10.2 – – – – (15.9) (15.9) – (15.9)
Fair value gain on available-for-sale investments 17.2 – – – 0.3 – 0.3 – 0.3
Fair value loss on available-for-sale investments released to income statement 17.2 – – – 0.3 – 0.3 – 0.3
Tax on items directly taken to reserves 12 – – – – 4.7 4.7 – 4.7
Currency translation differences – – – 6.1 – 6.1 – 6.1
Total comprehensive income for the year – – – 6.7 50.9 57.6 0.6 58.2
Transactions with owners:
Employee share option scheme:
– Value of services provided 28 – – – – 10.5 10.5 – 10.5
Purchase of treasury shares 28 – – – – (12.1) (12.1) – (12.1)
Share-based payment settlement 28 – – – – (3.6) (3.6) – (3.6)
Shares to be issued – – 34.9 – – 34.9 – 34.9
Disposal of available-for-sale investments (net of tax) 17.2 – – – (1.3) – (1.3) – (1.3)
Dividends 13 – – – – (24.9) (24.9) (0.3) (25.2)
Transactions with non-controlling interests 17.4 – – – – (1.6) (1.6) (0.3) (1.9)
Balance at 31 December 2014 3.4 90.1 34.9 22.5 178.6 329.5 0.8 330.3
* Included within other reserves on the face of the statement of financial position are the capital redemption reserve, merger relief reserve, foreign exchange reserve and revaluation reserve as disclosed in Note 28.
** Included within retained earnings on the face of the statement of financial position are treasury shares, share-based payments reserve and the profit and loss account as disclosed in Note 28.
SAVILLS PLC REPORT AND ACCOUNTS 2015 83
Consolidated statement of changes in equityfor the year ended 31 December 2015
Overview
/ Strategy / P
erformance / G
overnance / Fin
an
cia
l state
me
nts
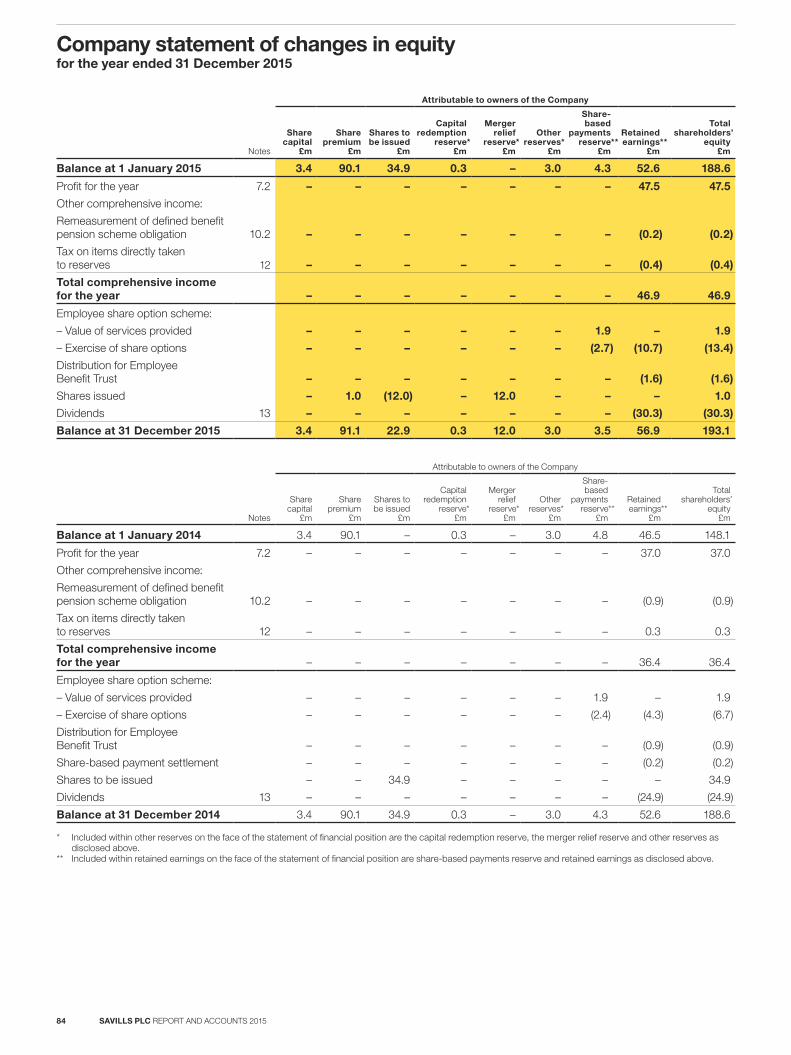
Attributable to owners of the Company
Notes
Share capital
£m
Share premium
£m
Shares to be issued
£m
Capital redemption
reserve*£m
Merger relief
reserve*£m
Otherreserves*
£m
Share-based
payments reserve**
£m
Retainedearnings**
£m
Total shareholders’
equity £m
Balance at 1 January 2015 3.4 90.1 34.9 0.3 – 3.0 4.3 52.6 188.6
Profit for the year 7.2 – – – – – – – 47.5 47.5
Other comprehensive income:
Remeasurement of defined benefit pension scheme obligation 10.2 – – – – – – – (0.2) (0.2)
Tax on items directly taken to reserves 12 – – – – – – – (0.4) (0.4)
Total comprehensive income for the year – – – – – – – 46.9 46.9
Employee share option scheme:
– Value of services provided – – – – – – 1.9 – 1.9
– Exercise of share options – – – – – – (2.7) (10.7) (13.4)
Distribution for Employee Benefit Trust – – – – – – – (1.6) (1.6)
Shares issued – 1.0 (12.0) – 12.0 – – – 1.0
Dividends 13 – – – – – – – (30.3) (30.3)
Balance at 31 December 2015 3.4 91.1 22.9 0.3 12.0 3.0 3.5 56.9 193.1
Attributable to owners of the Company
Notes
Share capital
£m
Share premium
£m
Shares to be issued
£m
Capital redemption
reserve*£m
Merger relief
reserve*£m
Otherreserves*
£m
Share-based
payments reserve**
£m
Retained earnings**
£m
Total shareholders’
equity £m
Balance at 1 January 2014 3.4 90.1 – 0.3 – 3.0 4.8 46.5 148.1
Profit for the year 7.2 – – – – – – – 37.0 37.0
Other comprehensive income:
Remeasurement of defined benefit pension scheme obligation 10.2 – – – – – – – (0.9) (0.9)
Tax on items directly taken to reserves 12 – – – – – – – 0.3 0.3
Total comprehensive income for the year – – – – – – – 36.4 36.4
Employee share option scheme:
– Value of services provided – – – – – – 1.9 – 1.9
– Exercise of share options – – – – – – (2.4) (4.3) (6.7)
Distribution for Employee Benefit Trust – – – – – – – (0.9) (0.9)
Share-based payment settlement – – – – – – – (0.2) (0.2)
Shares to be issued – – 34.9 – – – – – 34.9
Dividends 13 – – – – – – – (24.9) (24.9)
Balance at 31 December 2014 3.4 90.1 34.9 0.3 – 3.0 4.3 52.6 188.6
* Included within other reserves on the face of the statement of financial position are the capital redemption reserve, the merger relief reserve and other reserves as disclosed above.
** Included within retained earnings on the face of the statement of financial position are share-based payments reserve and retained earnings as disclosed above.
SAVILLS PLC REPORT AND ACCOUNTS 201584
Company statement of changes in equityfor the year ended 31 December 2015
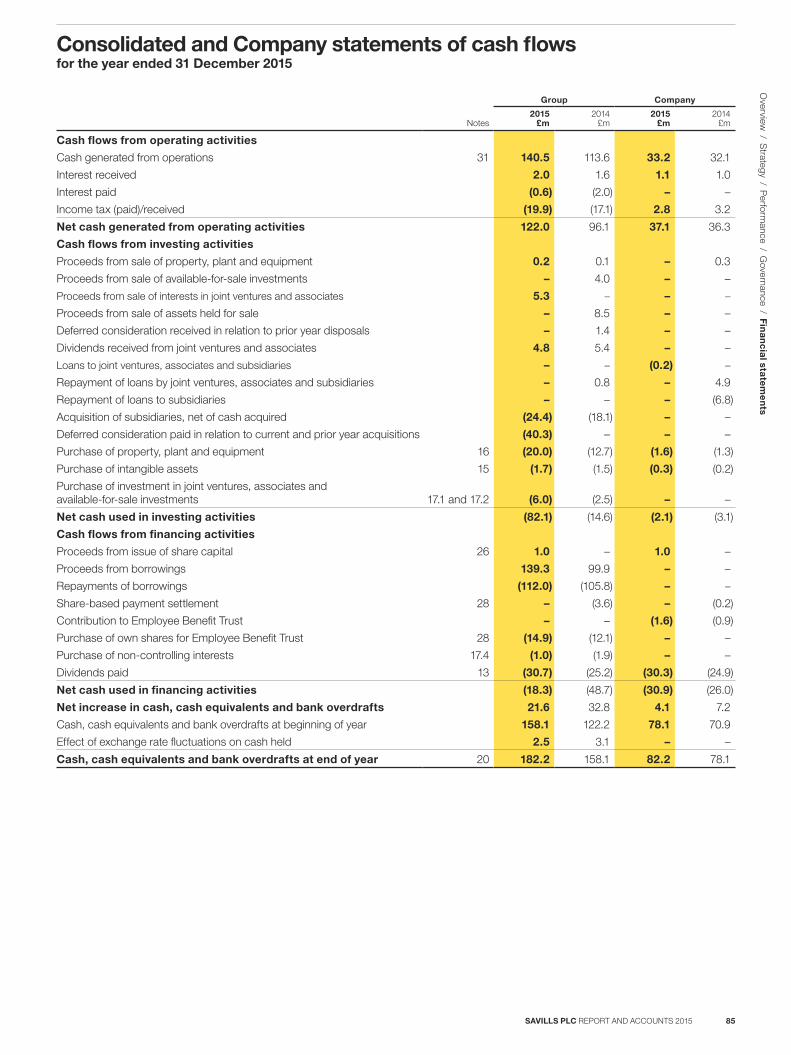
Group Company
Notes2015
£m2014
£m2015
£m2014
£m
Cash flows from operating activities
Cash generated from operations 31 140.5 113.6 33.2 32.1
Interest received 2.0 1.6 1.1 1.0
Interest paid (0.6) (2.0) – –
Income tax (paid)/received (19.9) (17.1) 2.8 3.2
Net cash generated from operating activities 122.0 96.1 37.1 36.3
Cash flows from investing activities
Proceeds from sale of property, plant and equipment 0.2 0.1 – 0.3
Proceeds from sale of available-for-sale investments – 4.0 – –
Proceeds from sale of interests in joint ventures and associates 5.3 – – –
Proceeds from sale of assets held for sale – 8.5 – –
Deferred consideration received in relation to prior year disposals – 1.4 – –
Dividends received from joint ventures and associates 4.8 5.4 – –
Loans to joint ventures, associates and subsidiaries – – (0.2) –
Repayment of loans by joint ventures, associates and subsidiaries – 0.8 – 4.9
Repayment of loans to subsidiaries – – – (6.8)
Acquisition of subsidiaries, net of cash acquired (24.4) (18.1) – –
Deferred consideration paid in relation to current and prior year acquisitions (40.3) – – –
Purchase of property, plant and equipment 16 (20.0) (12.7) (1.6) (1.3)
Purchase of intangible assets 15 (1.7) (1.5) (0.3) (0.2)
Purchase of investment in joint ventures, associates and available-for-sale investments 17.1 and 17.2 (6.0) (2.5) – –
Net cash used in investing activities (82.1) (14.6) (2.1) (3.1)
Cash flows from financing activities
Proceeds from issue of share capital 26 1.0 – 1.0 –
Proceeds from borrowings 139.3 99.9 – –
Repayments of borrowings (112.0) (105.8) – –
Share-based payment settlement 28 – (3.6) – (0.2)
Contribution to Employee Benefit Trust – – (1.6) (0.9)
Purchase of own shares for Employee Benefit Trust 28 (14.9) (12.1) – –
Purchase of non-controlling interests 17.4 (1.0) (1.9) – –
Dividends paid 13 (30.7) (25.2) (30.3) (24.9)
Net cash used in financing activities (18.3) (48.7) (30.9) (26.0)
Net increase in cash, cash equivalents and bank overdrafts 21.6 32.8 4.1 7.2
Cash, cash equivalents and bank overdrafts at beginning of year 158.1 122.2 78.1 70.9
Effect of exchange rate fluctuations on cash held 2.5 3.1 – –
Cash, cash equivalents and bank overdrafts at end of year 20 182.2 158.1 82.2 78.1
SAVILLS PLC REPORT AND ACCOUNTS 2015 85
Consolidated and Company statements of cash flowsfor the year ended 31 December 2015
Overview
/ Strategy / P
erformance / G
overnance / Fin
an
cia
l state
me
nts
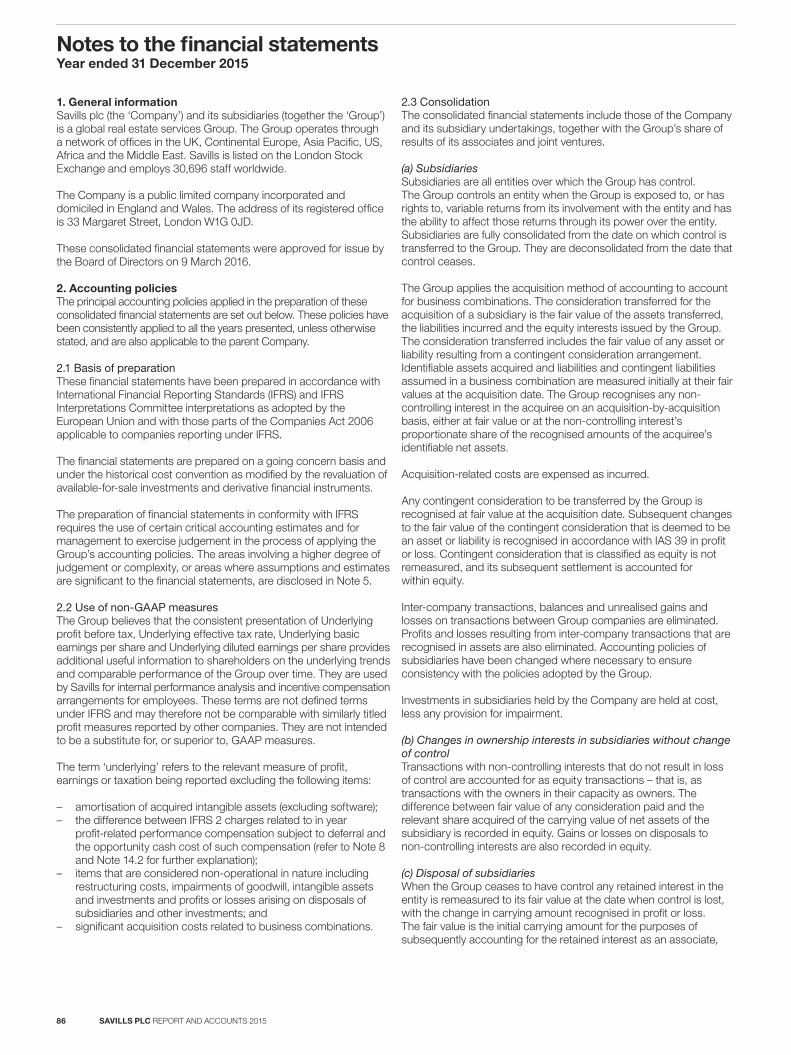
1. General informationSavills plc (the ‘Company’) and its subsidiaries (together the ‘Group’) is a global real estate services Group. The Group operates through a network of offices in the UK, Continental Europe, Asia Pacific, US, Africa and the Middle East. Savills is listed on the London Stock Exchange and employs 30,696 staff worldwide.
The Company is a public limited company incorporated and domiciled in England and Wales. The address of its registered office is 33 Margaret Street, London W1G 0JD.
These consolidated financial statements were approved for issue by the Board of Directors on 9 March 2016.
2. Accounting policiesThe principal accounting policies applied in the preparation of these consolidated financial statements are set out below. These policies have been consistently applied to all the years presented, unless otherwise stated, and are also applicable to the parent Company.
2.1 Basis of preparationThese financial statements have been prepared in accordance with International Financial Reporting Standards (IFRS) and IFRS Interpretations Committee interpretations as adopted by the European Union and with those parts of the Companies Act 2006 applicable to companies reporting under IFRS.
The financial statements are prepared on a going concern basis and under the historical cost convention as modified by the revaluation of available-for-sale investments and derivative financial instruments.
The preparation of financial statements in conformity with IFRS requires the use of certain critical accounting estimates and for management to exercise judgement in the process of applying the Group’s accounting policies. The areas involving a higher degree of judgement or complexity, or areas where assumptions and estimates are significant to the financial statements, are disclosed in Note 5.
2.2 Use of non-GAAP measuresThe Group believes that the consistent presentation of Underlying profit before tax, Underlying effective tax rate, Underlying basic earnings per share and Underlying diluted earnings per share provides additional useful information to shareholders on the underlying trends and comparable performance of the Group over time. They are used by Savills for internal performance analysis and incentive compensation arrangements for employees. These terms are not defined terms under IFRS and may therefore not be comparable with similarly titled profit measures reported by other companies. They are not intended to be a substitute for, or superior to, GAAP measures.
The term ‘underlying’ refers to the relevant measure of profit, earnings or taxation being reported excluding the following items:
– amortisation of acquired intangible assets (excluding software); – the difference between IFRS 2 charges related to in year
profit-related performance compensation subject to deferral and the opportunity cash cost of such compensation (refer to Note 8 and Note 14.2 for further explanation);
– items that are considered non-operational in nature including restructuring costs, impairments of goodwill, intangible assets and investments and profits or losses arising on disposals of subsidiaries and other investments; and
– significant acquisition costs related to business combinations.
2.3 ConsolidationThe consolidated financial statements include those of the Company and its subsidiary undertakings, together with the Group’s share of results of its associates and joint ventures.
(a) SubsidiariesSubsidiaries are all entities over which the Group has control. The Group controls an entity when the Group is exposed to, or has rights to, variable returns from its involvement with the entity and has the ability to affect those returns through its power over the entity. Subsidiaries are fully consolidated from the date on which control is transferred to the Group. They are deconsolidated from the date that control ceases.
The Group applies the acquisition method of accounting to account for business combinations. The consideration transferred for the acquisition of a subsidiary is the fair value of the assets transferred, the liabilities incurred and the equity interests issued by the Group. The consideration transferred includes the fair value of any asset or liability resulting from a contingent consideration arrangement. Identifiable assets acquired and liabilities and contingent liabilities assumed in a business combination are measured initially at their fair values at the acquisition date. The Group recognises any non-controlling interest in the acquiree on an acquisition-by-acquisition basis, either at fair value or at the non-controlling interest’s proportionate share of the recognised amounts of the acquiree’s identifiable net assets.
Acquisition-related costs are expensed as incurred.
Any contingent consideration to be transferred by the Group is recognised at fair value at the acquisition date. Subsequent changes to the fair value of the contingent consideration that is deemed to be an asset or liability is recognised in accordance with IAS 39 in profit or loss. Contingent consideration that is classified as equity is not remeasured, and its subsequent settlement is accounted for within equity.
Inter-company transactions, balances and unrealised gains and losses on transactions between Group companies are eliminated. Profits and losses resulting from inter-company transactions that are recognised in assets are also eliminated. Accounting policies of subsidiaries have been changed where necessary to ensure consistency with the policies adopted by the Group.
Investments in subsidiaries held by the Company are held at cost, less any provision for impairment.
(b) Changes in ownership interests in subsidiaries without change of controlTransactions with non-controlling interests that do not result in loss of control are accounted for as equity transactions – that is, as transactions with the owners in their capacity as owners. The difference between fair value of any consideration paid and the relevant share acquired of the carrying value of net assets of the subsidiary is recorded in equity. Gains or losses on disposals to non-controlling interests are also recorded in equity.
(c) Disposal of subsidiariesWhen the Group ceases to have control any retained interest in the entity is remeasured to its fair value at the date when control is lost, with the change in carrying amount recognised in profit or loss. The fair value is the initial carrying amount for the purposes of subsequently accounting for the retained interest as an associate,
SAVILLS PLC REPORT AND ACCOUNTS 201586
Notes to the financial statementsYear ended 31 December 2015
joint venture or financial asset. In addition, any amounts previously recognised in other comprehensive income in respect of that entity are accounted for as if the Group had directly disposed of the related assets or liabilities. This may mean that amounts previously recognised in other comprehensive income are reclassified to profit or loss.
(d) AssociatesAssociates are all entities over which the Group has significant influence but not control, generally accompanying a shareholding of between 20% and 50% of the voting rights. Investments in associates are accounted for using the equity method of accounting. Under the equity method, the investment is initially recognised at cost, and the carrying amount is increased or decreased to recognise the investor’s share of the profit or loss of the investee after the date of acquisition. The Group’s investment in associates includes goodwill (net of any accumulated impairment loss) identified on acquisition (see Note 17.1).
If the ownership interest in an associate is reduced but significant influence is retained, only a proportionate share of the amounts previously recognised in other comprehensive income is reclassified to profit or loss where appropriate.
The Group’s share of its associates’ post-acquisition profits or losses is recognised in the income statement and its share of post-acquisition movements in other comprehensive income is recognised in other comprehensive income with a corresponding adjustment to the carrying amount of the investment. When the Group’s share of losses in an associate equals or exceeds its interest in the associate, including any other unsecured receivables, the Group does not recognise further losses unless it has incurred legal or constructive obligations or made payments on behalf of the associate.
Unrealised gains on transactions between the Group and its associates are eliminated to the extent of the Group’s interest in the associates. Unrealised losses are also eliminated unless the transaction provides evidence of an impairment of the asset transferred. Accounting policies of associates have been changed where necessary to ensure consistency with the policies adopted by the Group.
Dilution gains and losses arising in investments in associates are recognised in the income statement.
(e) Joint arrangementsThe Group applies IFRS 11 to all joint arrangements. Under IFRS 11 investments in joint arrangements are classified as either joint operations or joint ventures depending on the contractual rights and obligations of each investor. The Group has assessed the nature of its joint arrangements and determined them to be joint ventures. Joint ventures are accounted for using the equity method.
Under the equity method of accounting, interests in joint ventures are initially recognised at cost and adjusted thereafter to recognise the Group’s share of the post-acquisition profits or losses and movements in other comprehensive income. When the Group’s share of losses in a joint venture equals or exceeds its interests in the joint ventures (which includes any long-term interests that, in substance, form part of the Group’s net investment in the joint ventures), the Group does not recognise further losses, unless it has incurred obligations or made payments on behalf of the joint ventures.
Unrealised gains on transactions between the Group and its joint ventures are eliminated to the extent of the Group’s interest in the joint ventures. Unrealised losses are also eliminated unless the transaction provides evidence of an impairment of the asset
transferred. Accounting policies of the joint ventures have been changed where necessary to ensure consistency with the policies adopted by the Group. 2.4 Segment reportingOperating segments are reported in a manner consistent with the internal reporting provided to the chief operating decision maker. The chief operating decision maker, who is responsible for allocating resources and assessing performance of the operating segments, has been identified as the Group Executive Board.
A business segment is a group of assets and operations engaged in providing products or services that are subject to risks and returns that are different from those of other business segments. A geographical segment is engaged in providing products or services within a particular economic environment that is subject to risks and returns that are different from those of segments operating in other economic environments.
As the Group is strongly affected by both differences in the types of services it provides and the geographical areas in which it operates, the matrix approach of disclosing both the business and geographical segments formats is used.
Revenues and expenses are allocated to segments on the basis that they are directly attributable or the relevant portion can be allocated on a reasonable basis.
2.5 Foreign currency translation(a) Functional and presentation currencyItems included in the financial statements of each of the Group’s entities are measured using the currency of the primary economic environment in which the entity operates (‘the functional currency’). The consolidated financial statements are presented in Sterling, which is also the Company’s functional and presentation currency.
(b) Transactions and balancesForeign currency transactions are translated into the functional currency using the exchange rates prevailing at the dates of the transactions. Foreign exchange gains and losses resulting from the settlement of such transactions and from the translation at year end exchange rates of monetary assets and liabilities denominated in foreign currencies are recognised in the income statement, except when deferred in other comprehensive income as qualifying cash flow hedges.
Translation differences on non-monetary financial assets and liabilities are reported as part of the fair value gain or loss and are recognised in the income statement, except for available-for-sale equity investments, which are recognised in other comprehensive income. Non-monetary items carried at historical cost are reported using the exchange rate at the date of the transaction.
(c) Group entitiesThe assets and liabilities of foreign operations, including goodwill and fair value adjustments arising on consolidation, are translated to the Group’s presentational currency at foreign exchange rates ruling at the reporting date. The income and expenses of foreign operations are translated at an average rate for the year where this rate approximates to the foreign exchange rates ruling at the dates of the transactions.
Exchange differences arising from this translation of foreign operations are taken directly to the foreign exchange reserve. When a foreign operation is disposed of, in part or in full, the relevant amount in the foreign exchange reserve is transferred to the income statement.
SAVILLS PLC REPORT AND ACCOUNTS 2015 87
O
verview / S
trategy / Perform
ance / Governance / F
ina
nc
ial sta
tem
en
ts
2.6 Property, plant and equipmentProperty, plant and equipment is stated at historical cost less accumulated depreciation and impairment. Historical cost includes expenditure directly attributable to acquisition.
Subsequent costs are included in the asset’s carrying amount or recognised as a separate asset, as appropriate, only when it is probable that the future economic benefits associated with the item will flow to the Group and the cost of the item can be measured reliably.
Provision for depreciation is made at rates calculated on a straight-line basis to write off the assets over their estimated useful lives as follows:
Freehold property 50 years
Short leasehold property (less than 50 years) Over unexpired term of lease
Equipment and motor vehicles 3–10 years
Residual values and useful lives are reviewed and adjusted if appropriate, at each reporting date.
An asset’s carrying amount is written down immediately to its recoverable amount if the asset’s carrying amount is greater than its estimated recoverable amount.
2.7 GoodwillGoodwill represents the excess of the cost of acquisition of a subsidiary or associate over the Group’s share of the fair value of identifiable net assets acquired.
In respect of associates, goodwill is included in the carrying value of the investment.
Goodwill is carried at cost less accumulated impairment losses. Separately recognised goodwill is tested annually for impairment, or more frequently if events or changes in circumstances indicate potential impairment. An impairment loss is recognised for the amount by which the carrying value exceeds the recoverable amount. The recoverable amount is the higher of value in use and fair value less costs of disposal. Impairment losses on goodwill are not reversed.
Goodwill is allocated to cash-generating units for the purpose of impairment testing. The allocation is made to those cash-generating units or groups of cash-generating units that are expected to benefit from the business combination in which the goodwill arose. The Group allocates goodwill to each business segment in the geographical region in which it operates (Note 15).
Gains and losses on the disposal of an entity include the carrying amount of goodwill relating to the entity sold.
2.8 Intangible assets other than goodwillIntangible assets acquired as part of business combinations and incremental contract costs are valued at fair value on acquisition and amortised over the useful life. Fair value on acquisition is determined by third-party valuation where the acquisition is significant.
Acquired computer software licences are capitalised on the basis of the costs incurred to acquire and bring to use the specific software. Costs associated with maintaining computer software programs are recognised as an expense as incurred.
Development costs that are directly attributable to the design and testing of identifiable and unique software products controlled by the Group are recognised as intangible assets when the following criteria are met:
– it is technically feasible to complete the software product so that it will be available for use;
– management intends to complete the software product and use or sell it;
– there is an ability to use or sell the software product; – it can be demonstrated how the software product will generate
probable future economic benefits; – adequate technical, financial and other resources to complete
the development and to use or sell the software product are available; and
– the expenditure attributable to the software product during its development can be reliably measured.
Measurement subsequent to initial recognition is at cost less accumulated amortisation and impairment.
Amortisation charges are spread on a straight-line basis over the period of the assets’ estimated useful lives as follows:
Customer relationships 3–15 years
Order back-log 5 years
Contracts – Investment, property management and other existing business contracts 2–20 years
Computer software 3–5 years
Acquired investment management contracts relating to open-ended funds have been attributed indefinite useful lives.
2.9 Impairment of other non-financial assetsAssets that have indefinite useful lives are not subject to amortisation or depreciation and are tested annually for impairment or whenever an indicator of impairment exists. Assets that are subject to amortisation or depreciation are reviewed for impairment whenever an indicator of impairment exists. An impairment loss is recognised to the extent that the carrying value exceeds the higher of the asset’s fair value less cost to sell and its value-in-use. Prior impairments of non-financial assets (other than goodwill) are reviewed for possible reversal at each reporting date.
Value-in-use is determined using the discounted cash flow method, with an appropriate discount rate to reflect market rates and specific risks associated with the asset.
For the purposes of assessing impairment, assets are grouped at the lowest levels for which there are separately identifiable cash flows (cash-generating units). Where it is not possible to estimate the recoverable amount of an individual asset, the Group estimates the recoverable amount of the cash-generating unit to which the asset belongs.
2.10 Financial instrumentsFinancial assets and liabilities are recognised on the Group’s statement of financial position at fair value when the Group becomes party to the contractual provisions of the instrument. Subsequent measurement depends on the classification and is discussed in paragraphs 2.11–2.16.
Financial assets and liabilities are offset and the net amount reported in the balance sheet where there is a legally enforceable right to offset the recognised amounts and there is an intention to settle on a net basis or realise the asset and settle the liability simultaneously.
SAVILLS PLC REPORT AND ACCOUNTS 201588
Notes to the financial statementsYear ended 31 December 2015 continued
The Group derecognises a financial asset when the contractual rights to the cash flows from the asset expire, or when it transfers the financial asset and substantially all the risks and rewards of ownership of the asset to another party. On derecognition of a financial asset in its entirety, the difference between the asset’s carrying amount and the sum of consideration received is recognised in profit or loss.
The Group derecognises financial liabilities when, and only when, the Group’s obligations are discharged, cancelled or have expired. The difference between the carrying amount of the financial liability derecognised and the consideration paid is recognised in profit or loss.
2.11 Available-for-sale investmentsAvailable-for-sale investments are stated at fair value, with changes in fair value being recognised in other comprehensive income. When such investments are disposed or become impaired, the accumulated gains and losses, previously recognised in other comprehensive income, are recognised in the income statement.
2.12 Trade receivablesTrade receivables are recognised initially at fair value and subsequently measured at amortised cost less provision for impairment. Receivables are discounted where the time value of money is material.
A provision for impairment of trade receivables is established when there is objective evidence that the Group will not be able to collect all amounts due according to the original terms of the receivables. Significant financial difficulties of the debtor, probability that the debtor will enter bankruptcy or financial reorganisation, and default or delinquency in payments are considered indicators that the trade receivable is impaired. The amount of the provision is the difference between the asset’s carrying amount and the present value of estimated future cash flows, discounted at the original effective interest rate.
The carrying amount of the asset is reduced through the use of an allowance account, and the amount of the loss is recognised in the income statement within ‘other operating expenses’. When a trade receivable is uncollected, it is written off against the allowance account for trade receivables. Subsequent recoveries of amounts previously written off are credited against ‘other operating expenses’ in the income statement.
2.13 Cash and cash equivalentsCash and cash equivalents include cash in hand and deposits held on call with banks, together with other short-term highly liquid investments with original maturities of three months or less and working capital overdrafts, which are subject to an insignificant risk of changes in value. Bank overdrafts are included under borrowings in the statement of financial position.
2.14 Bank borrowingsInterest-bearing bank loans and overdrafts are initially measured at fair value, net of transaction costs incurred, and subsequently measured at amortised cost using the effective interest rate method.
2.15 Trade payablesTrade payables are initially measured at fair value and subsequently measured at amortised cost, using the effective interest rate method. Trade payables are classified as current liabilities if payment is due within one year or less. If not, they are presented as non-current liabilities.
2.16 Derivative financial instruments and hedgingDerivatives are initially recognised at fair value on the date a derivative contract is entered into and are subsequently remeasured at fair value. The method of recognising the resulting gain or loss depends on whether the derivative is designated as a hedging instrument and if so, the nature of the item being hedged.
Certain derivatives do not qualify for hedge accounting. In these cases, changes in the fair value of all derivative instruments are recognised immediately in the income statement.
2.17 Share capitalOrdinary shares are classified as equity. Incremental costs directly attributable to the issue of new shares or options are shown in equity as a deduction, net of tax, from the proceeds. When share capital is repurchased, the amount of consideration paid, including directly attributable costs, is recognised as a charge to equity. Repurchased shares which are not cancelled, or shares purchased for the Employee Benefit Trust, are classified as treasury shares and presented as a deduction from total equity.
2.18 TaxationThe tax expense for the period comprises current and deferred tax. Tax is recognised in the income statement, except to the extent that it relates to items recognised in other comprehensive income or directly in equity. In this case, the tax is also recognised in other comprehensive income or directly in equity.
The current income tax charge is calculated on the basis of the tax laws enacted or substantively enacted at the balance sheet date in the countries where the Company and its subsidiaries operate and generate taxable income. Management periodically evaluates positions taken in tax returns with respect to situations in which applicable tax regulation is subject to interpretation. It establishes provisions where appropriate on the basis of amounts expected to be paid to the tax authorities.
Deferred income tax is recognised, using the liability method, on temporary differences arising between the tax bases of assets and liabilities and their carrying amounts in the consolidated financial statements. However, deferred tax liabilities are not recognised if they arise from the initial recognition of goodwill; deferred income tax is not accounted for if it arises from the initial recognition of an asset or liability in a transaction other than a business combination that at the time of the transaction affects neither accounting nor taxable profit or loss. Deferred income tax is determined using tax rates (and laws) that have been enacted or substantially enacted by the balance sheet date and are expected to apply when the related deferred income tax asset is realised or the deferred income tax liability is settled.
Deferred income tax assets are recognised only to the extent that it is probable that future taxable profit will be available against which the temporary differences can be utilised.
Deferred income tax is provided on temporary differences arising on investments in subsidiaries and associates except for deferred income tax liability where the timing of the reversal of the temporary difference is controlled by the Group and it is probable that the temporary difference will not reverse in the foreseeable future.
Deferred income tax assets and liabilities are offset when there is a legally enforceable right to offset current tax assets against current tax liabilities and when the deferred income tax assets and liabilities relate to income tax levied by the same taxation authority on either the same taxable entity or different taxable entities where there is an intention to settle the balances on a net basis.
SAVILLS PLC REPORT AND ACCOUNTS 2015 89
O
verview / S
trategy / Perform
ance / Governance / F
ina
nc
ial sta
tem
en
ts
2.19 Pension obligationsThe Group operates both defined benefit and defined contribution plans. A defined contribution plan is a pension plan under which the Group pays fixed contributions into a separate entity. The Group has no legal or constructive obligations to pay further contributions if the fund does not hold sufficient assets to pay all employees the benefits relating to employee service in the current and prior periods. A defined benefit plan is a pension plan that defines an amount of pension benefit that an employee will receive on retirement, usually dependent on one or more factors, such as age, years of service and compensation.
The liability recognised in the statement of financial position in respect of defined benefit pension plans is the present value of the defined benefit obligation at the reporting date less the fair value of plan assets. The defined benefit obligation is calculated annually by independent actuaries using the projected unit credit method. The present value of the defined benefit obligation is determined by discounting the estimated future cash outflows.
The defined benefit scheme charge consists of net interest costs, past service costs and the impact of any settlements or curtailments and is charged as an expense as they fall due.
All actuarial gains and losses are recognised immediately in other comprehensive income in the period in which they arise.
The Group also operates a defined contribution Group Personal Pension Plan for new entrants and a number of defined contribution individual pension plans. Contributions in respect of defined contribution pension schemes are charged to the income statement when they are payable. The Group has no further payment obligations once the contributions have been paid. Prepaid contributions are recognised as an asset to the extent that a cash refund or a reduction in the future payments is available.
The net defined benefit cost is allocated amongst participating Group subsidiaries on the basis of pensionable salaries.
2.20 Share-based paymentsThe Group operates equity-settled share-based compensation plans. The fair value of the employee services received in exchange for the grant of the options is recognised as an expense.
Non-market vesting conditions are included in assumptions about the number of options that are expected to vest. The total expense is recognised over the vesting period, which is the period over which all of the specified vesting conditions are to be satisfied. At the end of each reporting period, the Group revises its estimate of the number of options that are expected to vest based on the non-market vesting conditions. It recognises the impact of the revision to original estimates, if any, in the income statement, with a corresponding adjustment to equity.
All equity-settled share-based payments are measured at fair value at the date of grant. The fair value determined at the grant date of the equity-settled share-based payments is expensed on a straight-line basis over the vesting period, based on the Group’s estimate of shares that will eventually vest.
The fair value of equity-settled share-based payments is measured by the use of the Actuarial Binomial option pricing model. At each reporting date, the Group revises its estimates of the number of options that are expected to become exercisable. It recognises the impact of the revision of original estimates, if any, in the income statement, and a corresponding adjustment to equity over the remaining vesting period. The cash proceeds received net of any directly attributable transaction costs are credited to share capital (nominal value) and share premium when the options are exercised.
2.21 Employee Benefit TrustThe Company has established the Savills plc 1992 Employee Benefit Trust (the ‘EBT’), the purposes of which are to grant awards to employees, to acquire shares in the Company pursuant to the Savills Deferred Share Bonus Plan and the Savills Deferred Share Plan and to hold shares in the Company for subsequent transfer to employees on the vesting of the awards granted under the schemes. The assets and liabilities of the EBT are included in the Group statement of financial position. Investments in the Group’s own shares are shown as a deduction from equity.
2.22 ProvisionsProvisions are recognised when the Group has a present legal or constructive obligation as a result of a past event, it is probable that the Group will be required to settle that obligation and the amount has been reliably estimated. Provisions are measured at the Directors’ best estimate of the expenditure required to settle the obligation at the reporting date and are discounted to present value where the effect is material.
(a) Professional indemnity claimsProvisions on professional indemnity claims are recognised when it is probable that the Group will be required to settle claims against it as a result of a past event and the amount of the obligation can be reliably estimated.
(b) Dilapidation provisionsThe Group is required to perform dilapidation repairs and restore properties to agreed specifications on leased properties prior to the properties being vacated at the end of their lease term. Provision for such cost is made where a legal obligation is identified and the liability can be reasonably quantified.
(c) Onerous leasesA provision is recognised where the costs of meeting the obligations under a lease contract exceed the economic benefits expected to be received and is measured as the net least cost of exiting the contract, being the lower of the cost of fulfilling it and any compensation or penalties arising from the failure to fulfil it.
(d) Restructuring provisionA provision is recognised when there is a present constructive obligation to meet the costs of restructure. This arises when there is a detailed formal plan for the restructuring, identifying at least the business or part of the business concerned, principal locations affected and the location, function and approximate number of employees to be compensated for terminating their services and when the plan has been communicated to those affected by it, raising an expectation that the plan will be carried out.
2.23 RevenueRevenue comprises the fair value of the consideration received or receivable for the provision of services in the ordinary course of the Group’s activities. Revenue is shown net of value-added tax and amounts due to third parties and after elimination of revenue within the Group.
(a) Residential transactional feesGenerally, where contracts are unconditional, revenue is recognised on exchange of contracts. However, on more complex contracts, revenue will be recognised on the date of completion. On multi-unit developments, revenue is recognised on a staged basis, based on each contract, commencing when the underlying contracts are exchanged.
(b) Commercial transactional feesGenerally, revenue is recognised on the date of completion or when unconditional contracts have been exchanged.
SAVILLS PLC REPORT AND ACCOUNTS 201590
Notes to the financial statementsYear ended 31 December 2015 continued
(c) Property consultancyRevenue in respect of property consultancy represents commissions and fees recognised on a time basis, fixed fee or percentage of completion. Percentage of completion is principally measured by the proportion of actual costs incurred in relation to the best estimate of total costs expected for completion of the contract.
(d) Property and facilities managementRevenue represents fees earned for managing properties and providing facilities and is generally recognised in the period the services are provided using a straight-line basis over the term of the contract.
(e) Investment managementRevenue represents commissions and fees receivable, net of marketing costs in accordance with the relevant fee agreements.
Annual management fees are recognised, gross of costs, in the period to which the service has been provided, in accordance with the contracted fee agreements. Transaction fees are recognised on the date of completion of a purchase or sale transaction. Distribution fees are recognised on the completion of a signed subscription agreement and performance fees are recognised as earned and when approved by the fund.
(f) Work in progressWork in progress generally relates to consultancy revenue and is stated at the lower of cost and net realisable value. Cost includes an appropriate proportion of overheads.
(g) Interest incomeInterest income is recognised on a time-proportion basis using the effective interest method.
(h) Dividend incomeDividend income is recognised when the right to receive payment is established.
(i) Other incomeOther income includes interest and dividend income on available-for-sale investments plus fair value gains and losses on assets at fair value through profit or loss.
2.24 LeasesLeases of property, plant and equipment where the Group has substantially all the risks and rewards of ownership are classified as finance leases.
Finance lease assets are initially recognised at an amount equal to the lower of their fair value and the present value of the minimum lease payments at inception of the lease. The assets are then depreciated over the lower of the lease terms or the estimated useful lives of the assets.
The capital elements of future obligations under finance leases are included as liabilities in the statement of financial position. Leasing payments comprise capital and finance elements and the finance element is charged to the income statement.
The annual payments under all other lease agreements (operating leases) are charged to the income statement on a straight-line basis over the lease term. Benefits received and receivable as an incentive to enter into the operating lease are also spread on a straight-line basis over the lease term.
A lease is classified as onerous where the unavoidable costs of meeting the obligations under the contract exceed the economic benefits expected to be received under it.
2.25 DividendsDividend distributions are recognised as a liability in the Group’s financial statements in the period in which they are approved by the Company’s shareholders.
Interim dividends are recognised when paid.
2.26 Adoption of standards, amendments and interpretations to standardsStandards, amendments and interpretations mandatorily effective for the first time for the financial year beginning 1 January 2015 that are not relevant or considered significant to the Group include the following:
Amendments to IAS 19 Clarification on accounting for employee contributions to defined benefit plans
Amendments to IFRSs Annual Improvements to IFRSs 2011–2013 Cycle
Amendments to IFRSs Annual Improvements to IFRSs 2010–2012 Cycle
The following standards and amendments to published standards are mandatory for accounting periods beginning on or after 1 January 2016, and have not been early adopted:
– IFRS 16, ‘Leases’, effective for the accounting periods beginning on or after 1 January 2019 (subject to EU endorsement). The standard addresses the classification, measurement and recognition of leases with the objective of ensuring that lessees and lessors provide relevant information that faithfully represents those transactions. The standard supersedes IAS 17 ‘Leases’. The impact of the standard is currently being assessed.
– IFRS 15, ‘Revenue from contracts with customers’, effective for accounting periods beginning on or after 1 January 2018 (subject to EU endorsement). The standard establishes principles for reporting useful information to users of financial statements about the nature, amount, timing and uncertainty of revenue and cash flows arising from an entity’s contracts with customers. Revenue is recognised when a customer obtains control of a good or service and thus has the ability to direct the use and obtain the benefits from the good or service. The standard replaces IAS 18 ‘Revenue’ and IAS 11 ‘Construction contracts’ and related interpretations. The application of IFRS is not expected to have a material impact on the amounts recognised in the Group’s consolidated financial statements however, it may have a material impact on the disclosures. The impact of the standard is currently being assessed.
– IFRS 9, ‘Financial instruments’, including amendments, effective for accounting periods beginning on or after 1 January 2018. This standard addresses the classification, measurement and recognition of financial assets and financial liabilities. It replaces the guidance in IAS 39 that relates to the classification and measurement of financial instruments. IFRS 9 retains but simplifies the mixed measurement model and establishes three primary measurement categories for financial assets: amortised cost, fair value through other comprehensive income and fair value through profit and loss. The basis of classification depends on the entity’s business model and the contractual cash flow characteristics of the financial asset. There is now a new expected credit losses model that replaces the incurred loss impairment model used in IAS 39. For financial liabilities there were no changes to classification and measurement except for the recognition of changes in own credit risk in other comprehensive income, for liabilities designated at fair value through profit or loss. The application of IFRS 9 is not expected to have a material impact on the amounts reported in the Group’s consolidated financial statements.
SAVILLS PLC REPORT AND ACCOUNTS 2015 91
O
verview / S
trategy / Perform
ance / Governance / F
ina
nc
ial sta
tem
en
ts
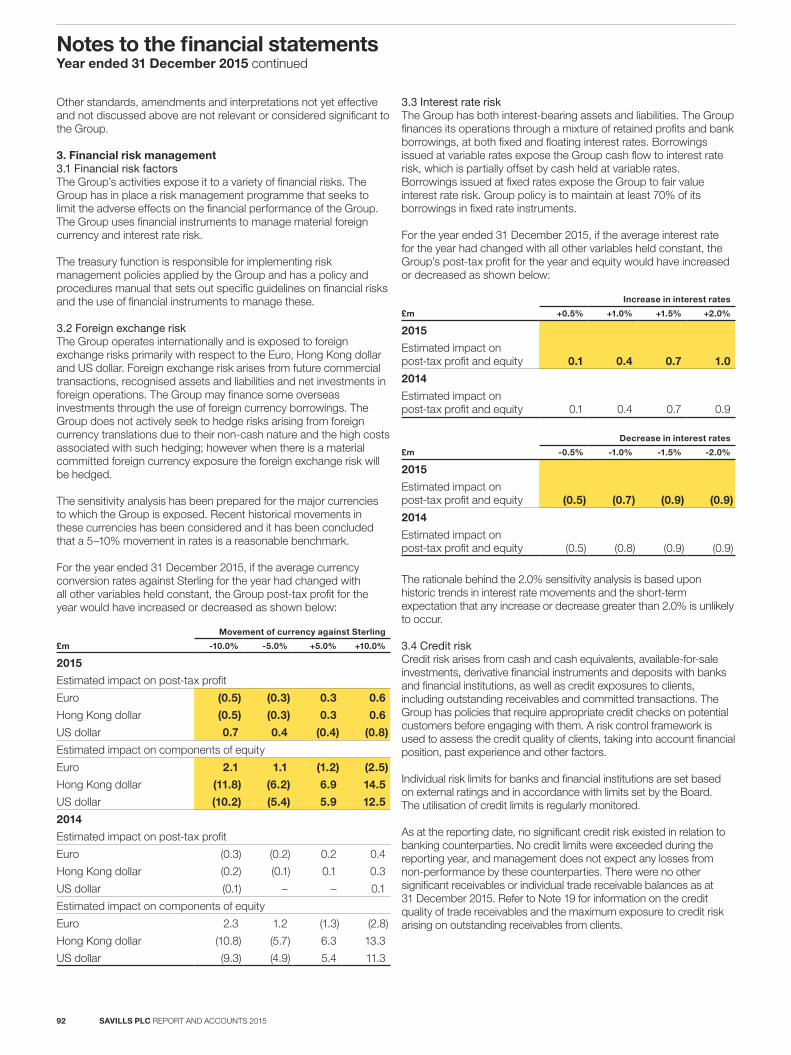
Other standards, amendments and interpretations not yet effective and not discussed above are not relevant or considered significant to the Group.
3. Financial risk management3.1 Financial risk factorsThe Group’s activities expose it to a variety of financial risks. The Group has in place a risk management programme that seeks to limit the adverse effects on the financial performance of the Group. The Group uses financial instruments to manage material foreign currency and interest rate risk.
The treasury function is responsible for implementing risk management policies applied by the Group and has a policy and procedures manual that sets out specific guidelines on financial risks and the use of financial instruments to manage these.
3.2 Foreign exchange riskThe Group operates internationally and is exposed to foreign exchange risks primarily with respect to the Euro, Hong Kong dollar and US dollar. Foreign exchange risk arises from future commercial transactions, recognised assets and liabilities and net investments in foreign operations. The Group may finance some overseas investments through the use of foreign currency borrowings. The Group does not actively seek to hedge risks arising from foreign currency translations due to their non-cash nature and the high costs associated with such hedging; however when there is a material committed foreign currency exposure the foreign exchange risk will be hedged.
The sensitivity analysis has been prepared for the major currencies to which the Group is exposed. Recent historical movements in these currencies has been considered and it has been concluded that a 5–10% movement in rates is a reasonable benchmark.
For the year ended 31 December 2015, if the average currency conversion rates against Sterling for the year had changed with all other variables held constant, the Group post-tax profit for the year would have increased or decreased as shown below:
£m
Movement of currency against Sterling
-10.0% -5.0% +5.0% +10.0%
2015
Estimated impact on post-tax profit
Euro (0.5) (0.3) 0.3 0.6
Hong Kong dollar (0.5) (0.3) 0.3 0.6
US dollar 0.7 0.4 (0.4) (0.8)
Estimated impact on components of equity
Euro 2.1 1.1 (1.2) (2.5)
Hong Kong dollar (11.8) (6.2) 6.9 14.5
US dollar (10.2) (5.4) 5.9 12.5
2014
Estimated impact on post-tax profit
Euro (0.3) (0.2) 0.2 0.4
Hong Kong dollar (0.2) (0.1) 0.1 0.3
US dollar (0.1) – – 0.1
Estimated impact on components of equity
Euro 2.3 1.2 (1.3) (2.8)
Hong Kong dollar (10.8) (5.7) 6.3 13.3
US dollar (9.3) (4.9) 5.4 11.3
3.3 Interest rate riskThe Group has both interest-bearing assets and liabilities. The Group finances its operations through a mixture of retained profits and bank borrowings, at both fixed and floating interest rates. Borrowings issued at variable rates expose the Group cash flow to interest rate risk, which is partially offset by cash held at variable rates. Borrowings issued at fixed rates expose the Group to fair value interest rate risk. Group policy is to maintain at least 70% of its borrowings in fixed rate instruments.
For the year ended 31 December 2015, if the average interest rate for the year had changed with all other variables held constant, the Group’s post-tax profit for the year and equity would have increased or decreased as shown below:
£m
Increase in interest rates
+0.5% +1.0% +1.5% +2.0%
2015
Estimated impact on post-tax profit and equity 0.1 0.4 0.7 1.0
2014
Estimated impact on post-tax profit and equity 0.1 0.4 0.7 0.9
£m
Decrease in interest rates
-0.5% -1.0% -1.5% -2.0%
2015
Estimated impact on post-tax profit and equity (0.5) (0.7) (0.9) (0.9)
2014
Estimated impact on post-tax profit and equity (0.5) (0.8) (0.9) (0.9)
The rationale behind the 2.0% sensitivity analysis is based upon historic trends in interest rate movements and the short-term expectation that any increase or decrease greater than 2.0% is unlikely to occur.
3.4 Credit riskCredit risk arises from cash and cash equivalents, available-for-sale investments, derivative financial instruments and deposits with banks and financial institutions, as well as credit exposures to clients, including outstanding receivables and committed transactions. The Group has policies that require appropriate credit checks on potential customers before engaging with them. A risk control framework is used to assess the credit quality of clients, taking into account financial position, past experience and other factors.
Individual risk limits for banks and financial institutions are set based on external ratings and in accordance with limits set by the Board. The utilisation of credit limits is regularly monitored.
As at the reporting date, no significant credit risk existed in relation to banking counterparties. No credit limits were exceeded during the reporting year, and management does not expect any losses from non-performance by these counterparties. There were no other significant receivables or individual trade receivable balances as at 31 December 2015. Refer to Note 19 for information on the credit quality of trade receivables and the maximum exposure to credit risk arising on outstanding receivables from clients.
SAVILLS PLC REPORT AND ACCOUNTS 201592
Notes to the financial statementsYear ended 31 December 2015 continued
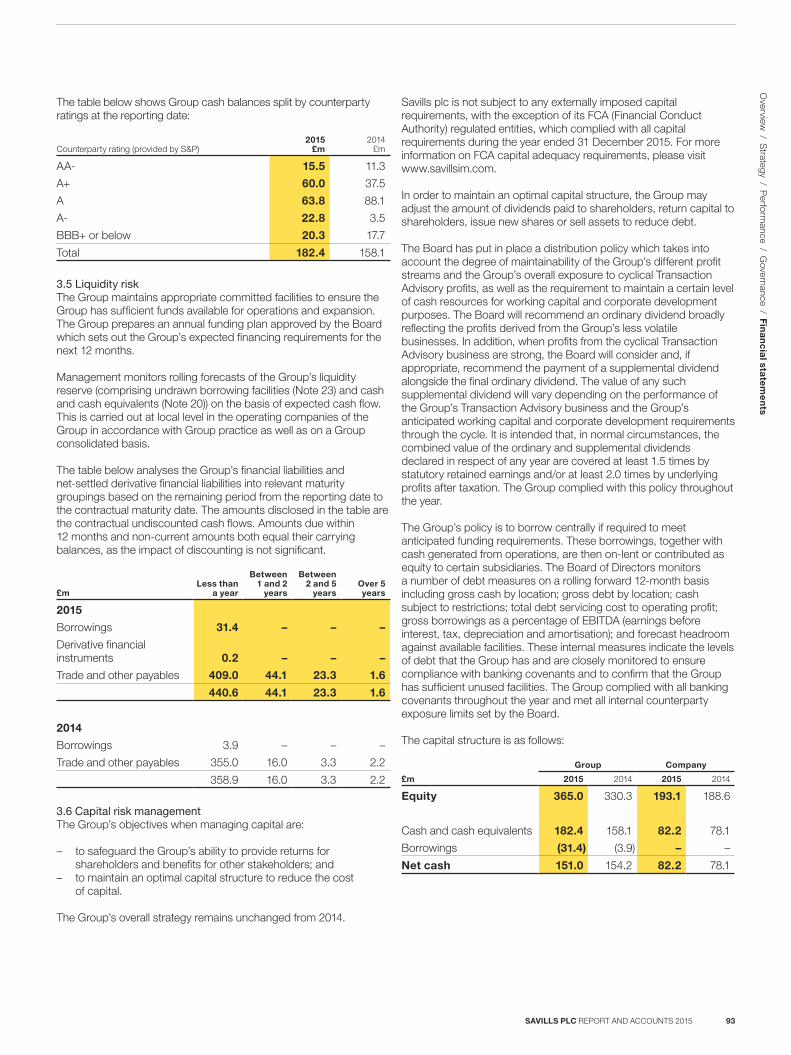
The table below shows Group cash balances split by counterparty ratings at the reporting date:
Counterparty rating (provided by S&P)2015
£m 2014
£m
AA- 15.5 11.3
A+ 60.0 37.5
A 63.8 88.1
A- 22.8 3.5
BBB+ or below 20.3 17.7
Total 182.4 158.1
3.5 Liquidity riskThe Group maintains appropriate committed facilities to ensure the Group has sufficient funds available for operations and expansion. The Group prepares an annual funding plan approved by the Board which sets out the Group’s expected financing requirements for the next 12 months.
Management monitors rolling forecasts of the Group’s liquidity reserve (comprising undrawn borrowing facilities (Note 23) and cash and cash equivalents (Note 20)) on the basis of expected cash flow. This is carried out at local level in the operating companies of the Group in accordance with Group practice as well as on a Group consolidated basis.
The table below analyses the Group’s financial liabilities and net-settled derivative financial liabilities into relevant maturity groupings based on the remaining period from the reporting date to the contractual maturity date. The amounts disclosed in the table are the contractual undiscounted cash flows. Amounts due within 12 months and non-current amounts both equal their carrying balances, as the impact of discounting is not significant.
£mLess than
a year
Between 1 and 2
years
Between 2 and 5
yearsOver 5 years
2015
Borrowings 31.4 – – –
Derivative financial instruments 0.2 – – –
Trade and other payables 409.0 44.1 23.3 1.6
440.6 44.1 23.3 1.6
2014
Borrowings 3.9 – – –
Trade and other payables 355.0 16.0 3.3 2.2
358.9 16.0 3.3 2.2
3.6 Capital risk managementThe Group’s objectives when managing capital are:
– to safeguard the Group’s ability to provide returns for shareholders and benefits for other stakeholders; and
– to maintain an optimal capital structure to reduce the cost of capital.
The Group’s overall strategy remains unchanged from 2014.
Savills plc is not subject to any externally imposed capital requirements, with the exception of its FCA (Financial Conduct Authority) regulated entities, which complied with all capital requirements during the year ended 31 December 2015. For more information on FCA capital adequacy requirements, please visit www.savillsim.com.
In order to maintain an optimal capital structure, the Group may adjust the amount of dividends paid to shareholders, return capital to shareholders, issue new shares or sell assets to reduce debt.
The Board has put in place a distribution policy which takes into account the degree of maintainability of the Group’s different profit streams and the Group’s overall exposure to cyclical Transaction Advisory profits, as well as the requirement to maintain a certain level of cash resources for working capital and corporate development purposes. The Board will recommend an ordinary dividend broadly reflecting the profits derived from the Group’s less volatile businesses. In addition, when profits from the cyclical Transaction Advisory business are strong, the Board will consider and, if appropriate, recommend the payment of a supplemental dividend alongside the final ordinary dividend. The value of any such supplemental dividend will vary depending on the performance of the Group’s Transaction Advisory business and the Group’s anticipated working capital and corporate development requirements through the cycle. It is intended that, in normal circumstances, the combined value of the ordinary and supplemental dividends declared in respect of any year are covered at least 1.5 times by statutory retained earnings and/or at least 2.0 times by underlying profits after taxation. The Group complied with this policy throughout the year.
The Group’s policy is to borrow centrally if required to meet anticipated funding requirements. These borrowings, together with cash generated from operations, are then on-lent or contributed as equity to certain subsidiaries. The Board of Directors monitors a number of debt measures on a rolling forward 12-month basis including gross cash by location; gross debt by location; cash subject to restrictions; total debt servicing cost to operating profit; gross borrowings as a percentage of EBITDA (earnings before interest, tax, depreciation and amortisation); and forecast headroom against available facilities. These internal measures indicate the levels of debt that the Group has and are closely monitored to ensure compliance with banking covenants and to confirm that the Group has sufficient unused facilities. The Group complied with all banking covenants throughout the year and met all internal counterparty exposure limits set by the Board.
The capital structure is as follows:
£m
Group Company
2015 2014 2015 2014
Equity 365.0 330.3 193.1 188.6
Cash and cash equivalents 182.4 158.1 82.2 78.1
Borrowings (31.4) (3.9) – –
Net cash 151.0 154.2 82.2 78.1
SAVILLS PLC REPORT AND ACCOUNTS 2015 93
O
verview / S
trategy / Perform
ance / Governance / F
ina
nc
ial sta
tem
en
ts
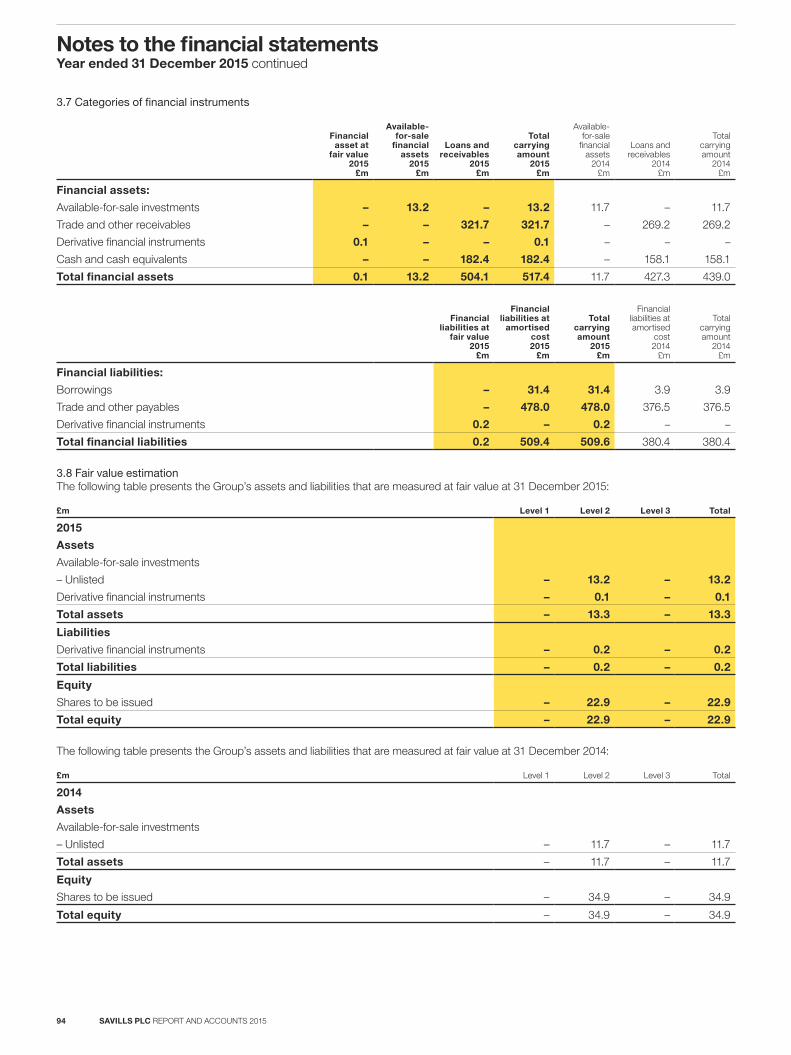
3.7 Categories of financial instruments
Financial asset at
fair value2015 £m
Available-for-sale
financial assets
2015£m
Loans and receivables
2015 £m
Total carrying amount
2015 £m
Available- for-sale
financial assets
2014 £m
Loans and receivables
2014 £m
Total carrying amount
2014 £m
Financial assets:
Available-for-sale investments – 13.2 – 13.2 11.7 – 11.7
Trade and other receivables – – 321.7 321.7 – 269.2 269.2
Derivative financial instruments 0.1 – – 0.1 – – –
Cash and cash equivalents – – 182.4 182.4 – 158.1 158.1
Total financial assets 0.1 13.2 504.1 517.4 11.7 427.3 439.0
Financial liabilities at
fair value2015
£m
Financial liabilities at
amortised cost 2015
£m
Total carrying amount
2015 £m
Financial liabilities at amortised
cost 2014
£m
Total carrying amount
2014 £m
Financial liabilities:
Borrowings – 31.4 31.4 3.9 3.9
Trade and other payables – 478.0 478.0 376.5 376.5
Derivative financial instruments 0.2 – 0.2 – –
Total financial liabilities 0.2 509.4 509.6 380.4 380.4
3.8 Fair value estimationThe following table presents the Group’s assets and liabilities that are measured at fair value at 31 December 2015:
£m Level 1 Level 2 Level 3 Total
2015
Assets
Available-for-sale investments
– Unlisted – 13.2 – 13.2
Derivative financial instruments – 0.1 – 0.1
Total assets – 13.3 – 13.3
Liabilities
Derivative financial instruments – 0.2 – 0.2
Total liabilities – 0.2 – 0.2
Equity
Shares to be issued – 22.9 – 22.9
Total equity – 22.9 – 22.9
The following table presents the Group’s assets and liabilities that are measured at fair value at 31 December 2014:
£m Level 1 Level 2 Level 3 Total
2014
Assets
Available-for-sale investments
– Unlisted – 11.7 – 11.7
Total assets – 11.7 – 11.7
Equity
Shares to be issued – 34.9 – 34.9
Total equity – 34.9 – 34.9
SAVILLS PLC REPORT AND ACCOUNTS 201594
Notes to the financial statementsYear ended 31 December 2015 continued
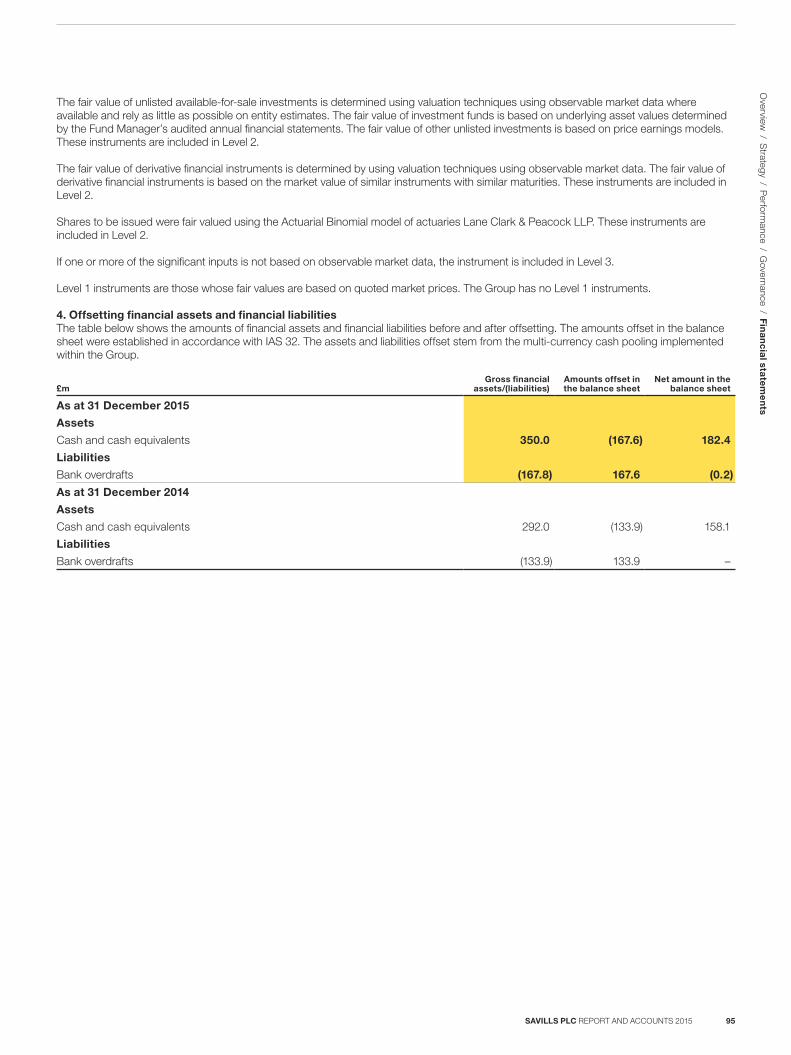
The fair value of unlisted available-for-sale investments is determined using valuation techniques using observable market data where available and rely as little as possible on entity estimates. The fair value of investment funds is based on underlying asset values determined by the Fund Manager’s audited annual financial statements. The fair value of other unlisted investments is based on price earnings models. These instruments are included in Level 2.
The fair value of derivative financial instruments is determined by using valuation techniques using observable market data. The fair value of derivative financial instruments is based on the market value of similar instruments with similar maturities. These instruments are included in Level 2.
Shares to be issued were fair valued using the Actuarial Binomial model of actuaries Lane Clark & Peacock LLP. These instruments are included in Level 2.
If one or more of the significant inputs is not based on observable market data, the instrument is included in Level 3.
Level 1 instruments are those whose fair values are based on quoted market prices. The Group has no Level 1 instruments.
4. Offsetting financial assets and financial liabilitiesThe table below shows the amounts of financial assets and financial liabilities before and after offsetting. The amounts offset in the balance sheet were established in accordance with IAS 32. The assets and liabilities offset stem from the multi-currency cash pooling implemented within the Group.
£mGross financial
assets/(liabilities)Amounts offset in the balance sheet
Net amount in the balance sheet
As at 31 December 2015
Assets
Cash and cash equivalents 350.0 (167.6) 182.4
Liabilities
Bank overdrafts (167.8) 167.6 (0.2)
As at 31 December 2014
Assets
Cash and cash equivalents 292.0 (133.9) 158.1
Liabilities
Bank overdrafts (133.9) 133.9 –
SAVILLS PLC REPORT AND ACCOUNTS 2015 95
O
verview / S
trategy / Perform
ance / Governance / F
ina
nc
ial sta
tem
en
ts
(d) Estimated impairment of assetsThe Group tests annually whether goodwill has suffered any impairment. All other assets are tested for impairment where there are indicators of impairment.
The recoverable amounts of cash-generating units have been determined based on value-in-use calculations. The use of this method requires the estimate of future cash flows expected to arise from the continuing operation of the cash-generating unit and the choice of a suitable discount rate in order to calculate the present value. Actual outcomes could vary significantly from these estimates. The estimates used in these financial statements are contained in Note 15.2.
(e) Valuation of intangible assets and useful lifeThe Group has made assumptions in relation to the potential future cash flows to be determined from separable intangible assets acquired as part of business combinations. This assessment involves assumptions relating to potential future revenues, appropriate discount rates and the useful life of such assets. These assumptions impact the income statement over the useful life of the intangible asset.
(f) ProvisionsThe Group and its subsidiaries are party to various legal claims. Provisions made within these financial statements and further details are contained in Note 25.1. Additional claims could be made which might not be covered by existing provisions or by insurance as detailed in Note 29.
(g) Fair value of options granted to employeesThe Group uses the Binomial Model in determining the fair value of options granted to employees under the Group’s various schemes as detailed in the Remuneration report. Information on such assumptions is contained in Note 27.6. The alteration of these assumptions may impact charges to the income statement over the vesting period of the award.
(h) Award of options and deferred shares to employeesThe Group applies judgement in deciding the proportion of the available bonus pool to be awarded to employees under its long-term share-based incentive scheme. The Group’s current policy is to deduct from the bonus pool an amount equal to the market value of the share price on the date of award. Under IFRS, the value of award is spread over the vesting period and charged to the income statement.
5. Critical accounting estimates and management judgementsEstimates are continually evaluated and are based on historical experience, current market conditions and other factors including expectations of future events that are believed to be reasonable under the circumstances. Actual results may differ from these estimates. Changes in accounting estimates may be necessary if there are changes in circumstances on which the estimate was based, or as a result of new information or more experience. The estimates and management judgements that have a significant risk of causing a material adjustment to the carrying amounts of assets and liabilities within the next financial year are discussed below.
(a) Pension benefitsThe present value of the defined benefit pension obligations depends on a number of factors that are determined on an actuarial basis using a number of assumptions including the discount rate. Any changes in these assumptions will impact the carrying amount of pension obligations. The Group determines the appropriate discount rate at the end of each year. In determining the appropriate discount rate, the Group considers the interest rates of high-quality corporate bonds that are denominated in the currency in which the benefits will be paid and that have terms to maturity approximating the terms of the related pension liability. Other key assumptions for pension obligations are based in part on current market conditions. Additional information is disclosed in Note 10.
(b) Income taxesThe Group is subject to income taxes in numerous jurisdictions. Judgement is required in determining the provision for income taxes. There are transactions and calculations for which the ultimate tax determination is uncertain. Where the final tax outcome of these matters is different from the amounts that were initially recorded, such differences will impact the income tax and deferred tax provisions in the period in which such determination is made.
(c) Deferred taxesThe recognition of deferred tax assets is based upon whether it is probable that sufficient and suitable taxable profits will be available in the future, against which the reversal of temporary differences can be deducted. Recognition, therefore, involves judgement regarding the future financial performance of the particular legal entity or tax group in which the deferred tax asset has been recognised, especially with regard to the extent that future taxable profits will be available against which losses can be utilised. Additional information is disclosed in Note 18.
SAVILLS PLC REPORT AND ACCOUNTS 201596
Notes to the financial statementsYear ended 31 December 2015 continued
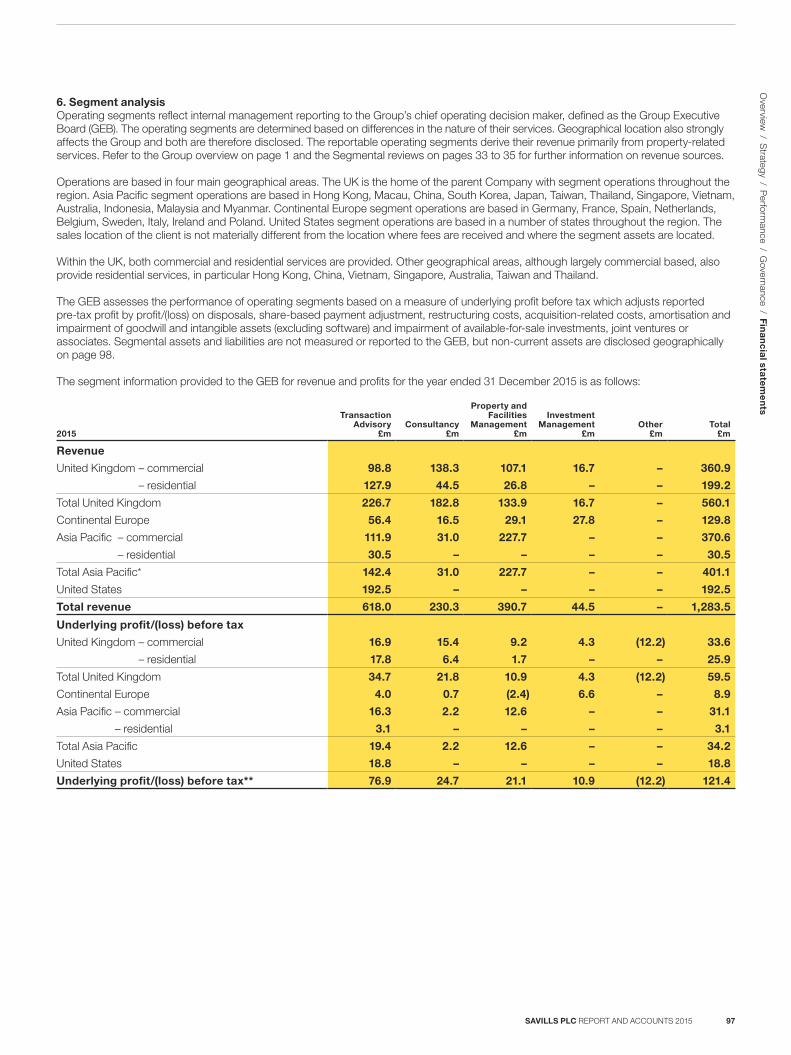
6. Segment analysisOperating segments reflect internal management reporting to the Group’s chief operating decision maker, defined as the Group Executive Board (GEB). The operating segments are determined based on differences in the nature of their services. Geographical location also strongly affects the Group and both are therefore disclosed. The reportable operating segments derive their revenue primarily from property-related services. Refer to the Group overview on page 1 and the Segmental reviews on pages 33 to 35 for further information on revenue sources.
Operations are based in four main geographical areas. The UK is the home of the parent Company with segment operations throughout the region. Asia Pacific segment operations are based in Hong Kong, Macau, China, South Korea, Japan, Taiwan, Thailand, Singapore, Vietnam, Australia, Indonesia, Malaysia and Myanmar. Continental Europe segment operations are based in Germany, France, Spain, Netherlands, Belgium, Sweden, Italy, Ireland and Poland. United States segment operations are based in a number of states throughout the region. The sales location of the client is not materially different from the location where fees are received and where the segment assets are located.
Within the UK, both commercial and residential services are provided. Other geographical areas, although largely commercial based, also provide residential services, in particular Hong Kong, China, Vietnam, Singapore, Australia, Taiwan and Thailand.
The GEB assesses the performance of operating segments based on a measure of underlying profit before tax which adjusts reported pre-tax profit by profit/(loss) on disposals, share-based payment adjustment, restructuring costs, acquisition-related costs, amortisation and impairment of goodwill and intangible assets (excluding software) and impairment of available-for-sale investments, joint ventures or associates. Segmental assets and liabilities are not measured or reported to the GEB, but non-current assets are disclosed geographically on page 98.
The segment information provided to the GEB for revenue and profits for the year ended 31 December 2015 is as follows:
2015
Transaction Advisory
£m Consultancy
£m
Property and Facilities
Management £m
Investment Management
£mOther
£mTotal
£m
Revenue
United Kingdom – commercial 98.8 138.3 107.1 16.7 – 360.9
– residential 127.9 44.5 26.8 – – 199.2
Total United Kingdom 226.7 182.8 133.9 16.7 – 560.1
Continental Europe 56.4 16.5 29.1 27.8 – 129.8
Asia Pacific – commercial 111.9 31.0 227.7 – – 370.6
– residential 30.5 – – – – 30.5
Total Asia Pacific* 142.4 31.0 227.7 – – 401.1
United States 192.5 – – – – 192.5
Total revenue 618.0 230.3 390.7 44.5 – 1,283.5
Underlying profit/(loss) before tax
United Kingdom – commercial 16.9 15.4 9.2 4.3 (12.2) 33.6
– residential 17.8 6.4 1.7 – – 25.9
Total United Kingdom 34.7 21.8 10.9 4.3 (12.2) 59.5
Continental Europe 4.0 0.7 (2.4) 6.6 – 8.9
Asia Pacific – commercial 16.3 2.2 12.6 – – 31.1
– residential 3.1 – – – – 3.1
Total Asia Pacific 19.4 2.2 12.6 – – 34.2
United States 18.8 – – – – 18.8
Underlying profit/(loss) before tax** 76.9 24.7 21.1 10.9 (12.2) 121.4
SAVILLS PLC REPORT AND ACCOUNTS 2015 97
O
verview / S
trategy / Perform
ance / Governance / F
ina
nc
ial sta
tem
en
ts
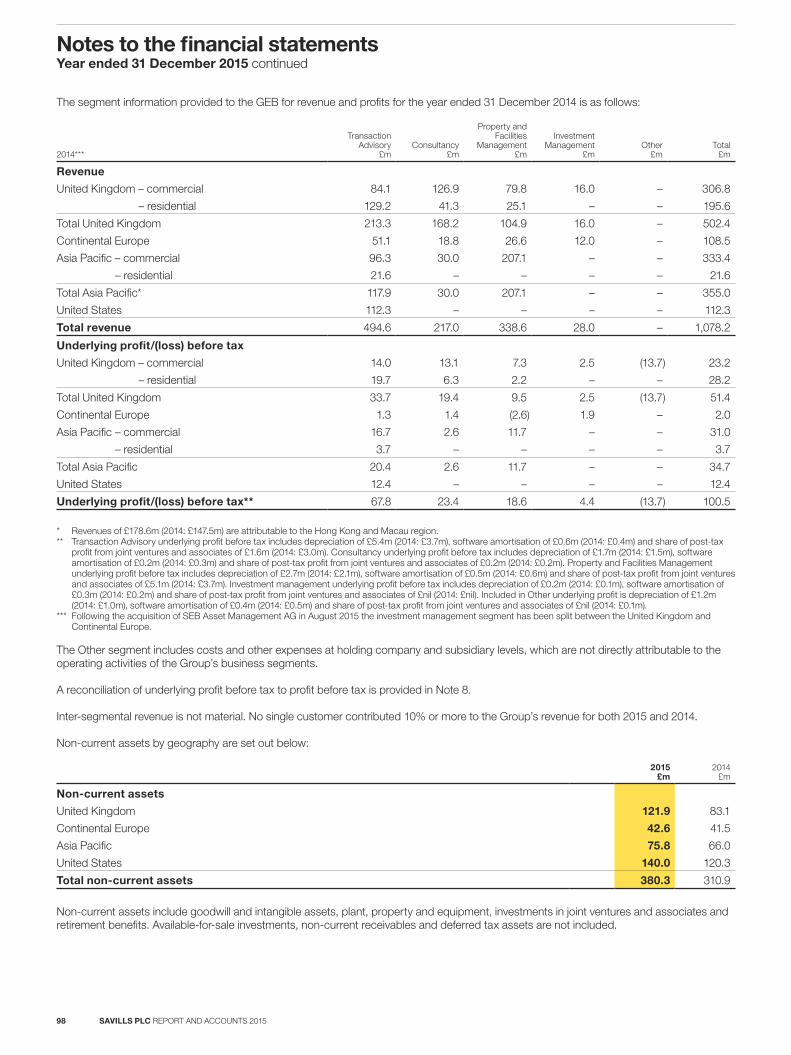
The segment information provided to the GEB for revenue and profits for the year ended 31 December 2014 is as follows:
2014***
Transaction Advisory
£m Consultancy
£m
Property and Facilities
Management £m
Investment Management
£mOther
£mTotal
£m
Revenue
United Kingdom – commercial 84.1 126.9 79.8 16.0 – 306.8
– residential 129.2 41.3 25.1 – – 195.6
Total United Kingdom 213.3 168.2 104.9 16.0 – 502.4
Continental Europe 51.1 18.8 26.6 12.0 – 108.5
Asia Pacific – commercial 96.3 30.0 207.1 – – 333.4
– residential 21.6 – – – – 21.6
Total Asia Pacific* 117.9 30.0 207.1 – – 355.0
United States 112.3 – – – – 112.3
Total revenue 494.6 217.0 338.6 28.0 – 1,078.2
Underlying profit/(loss) before tax
United Kingdom – commercial 14.0 13.1 7.3 2.5 (13.7) 23.2
– residential 19.7 6.3 2.2 – – 28.2
Total United Kingdom 33.7 19.4 9.5 2.5 (13.7) 51.4
Continental Europe 1.3 1.4 (2.6) 1.9 – 2.0
Asia Pacific – commercial 16.7 2.6 11.7 – – 31.0
– residential 3.7 – – – – 3.7
Total Asia Pacific 20.4 2.6 11.7 – – 34.7
United States 12.4 – – – – 12.4
Underlying profit/(loss) before tax** 67.8 23.4 18.6 4.4 (13.7) 100.5
* Revenues of £178.6m (2014: £147.5m) are attributable to the Hong Kong and Macau region.** Transaction Advisory underlying profit before tax includes depreciation of £5.4m (2014: £3.7m), software amortisation of £0.6m (2014: £0.4m) and share of post-tax
profit from joint ventures and associates of £1.6m (2014: £3.0m). Consultancy underlying profit before tax includes depreciation of £1.7m (2014: £1.5m), software amortisation of £0.2m (2014: £0.3m) and share of post-tax profit from joint ventures and associates of £0.2m (2014: £0.2m). Property and Facilities Management underlying profit before tax includes depreciation of £2.7m (2014: £2.1m), software amortisation of £0.5m (2014: £0.6m) and share of post-tax profit from joint ventures and associates of £5.1m (2014: £3.7m). Investment management underlying profit before tax includes depreciation of £0.2m (2014: £0.1m), software amortisation of £0.3m (2014: £0.2m) and share of post-tax profit from joint ventures and associates of £nil (2014: £nil). Included in Other underlying profit is depreciation of £1.2m (2014: £1.0m), software amortisation of £0.4m (2014: £0.5m) and share of post-tax profit from joint ventures and associates of £nil (2014: £0.1m).
*** Following the acquisition of SEB Asset Management AG in August 2015 the investment management segment has been split between the United Kingdom and Continental Europe.
The Other segment includes costs and other expenses at holding company and subsidiary levels, which are not directly attributable to the operating activities of the Group’s business segments.
A reconciliation of underlying profit before tax to profit before tax is provided in Note 8.
Inter-segmental revenue is not material. No single customer contributed 10% or more to the Group’s revenue for both 2015 and 2014.
Non-current assets by geography are set out below:
2015 £m
2014 £m
Non-current assets
United Kingdom 121.9 83.1
Continental Europe 42.6 41.5
Asia Pacific 75.8 66.0
United States 140.0 120.3
Total non-current assets 380.3 310.9
Non-current assets include goodwill and intangible assets, plant, property and equipment, investments in joint ventures and associates and retirement benefits. Available-for-sale investments, non-current receivables and deferred tax assets are not included.
SAVILLS PLC REPORT AND ACCOUNTS 201598
Notes to the financial statementsYear ended 31 December 2015 continued
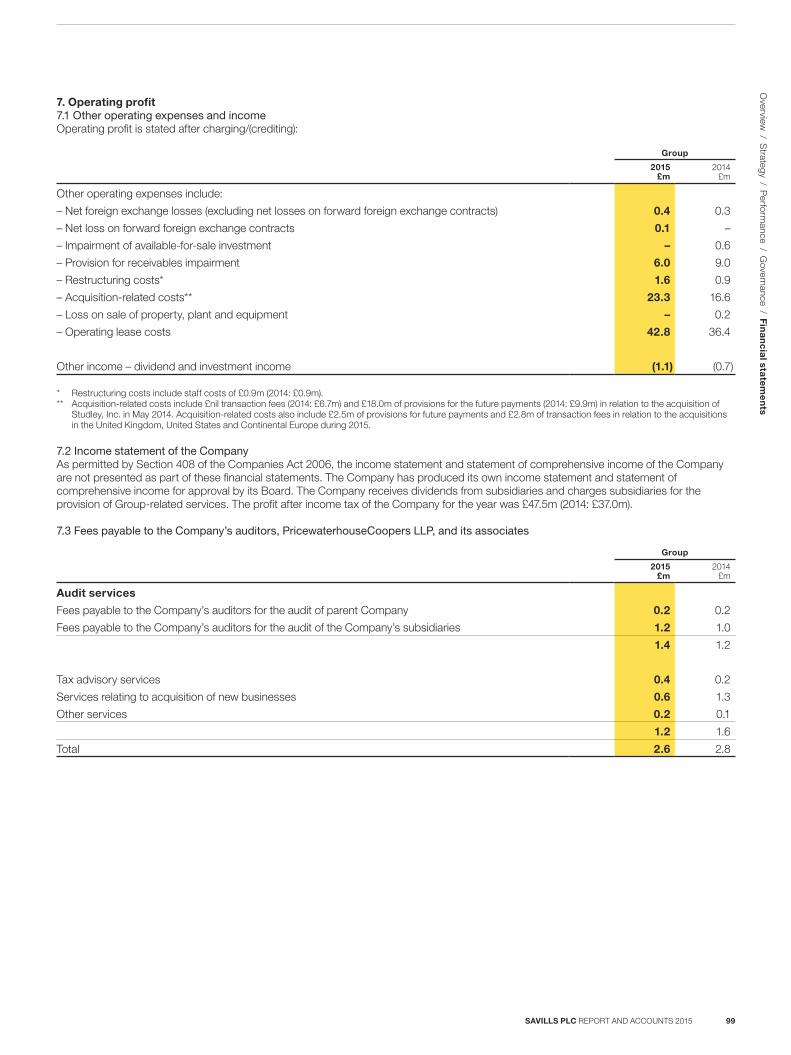
7. Operating profit7.1 Other operating expenses and incomeOperating profit is stated after charging/(crediting):
Group
2015 £m
2014 £m
Other operating expenses include:
– Net foreign exchange losses (excluding net losses on forward foreign exchange contracts) 0.4 0.3
– Net loss on forward foreign exchange contracts 0.1 –
– Impairment of available-for-sale investment – 0.6
– Provision for receivables impairment 6.0 9.0
– Restructuring costs* 1.6 0.9
– Acquisition-related costs** 23.3 16.6
– Loss on sale of property, plant and equipment – 0.2
– Operating lease costs 42.8 36.4
Other income – dividend and investment income (1.1) (0.7)
* Restructuring costs include staff costs of £0.9m (2014: £0.9m). ** Acquisition-related costs include £nil transaction fees (2014: £6.7m) and £18.0m of provisions for the future payments (2014: £9.9m) in relation to the acquisition of
Studley, Inc. in May 2014. Acquisition-related costs also include £2.5m of provisions for future payments and £2.8m of transaction fees in relation to the acquisitions in the United Kingdom, United States and Continental Europe during 2015.
7.2 Income statement of the CompanyAs permitted by Section 408 of the Companies Act 2006, the income statement and statement of comprehensive income of the Company are not presented as part of these financial statements. The Company has produced its own income statement and statement of comprehensive income for approval by its Board. The Company receives dividends from subsidiaries and charges subsidiaries for the provision of Group-related services. The profit after income tax of the Company for the year was £47.5m (2014: £37.0m).
7.3 Fees payable to the Company’s auditors, PricewaterhouseCoopers LLP, and its associates
Group
2015 £m
2014 £m
Audit services
Fees payable to the Company’s auditors for the audit of parent Company 0.2 0.2
Fees payable to the Company’s auditors for the audit of the Company’s subsidiaries 1.2 1.0
1.4 1.2
Tax advisory services 0.4 0.2
Services relating to acquisition of new businesses 0.6 1.3
Other services 0.2 0.1
1.2 1.6
Total 2.6 2.8
SAVILLS PLC REPORT AND ACCOUNTS 2015 99
O
verview / S
trategy / Perform
ance / Governance / F
ina
nc
ial sta
tem
en
ts
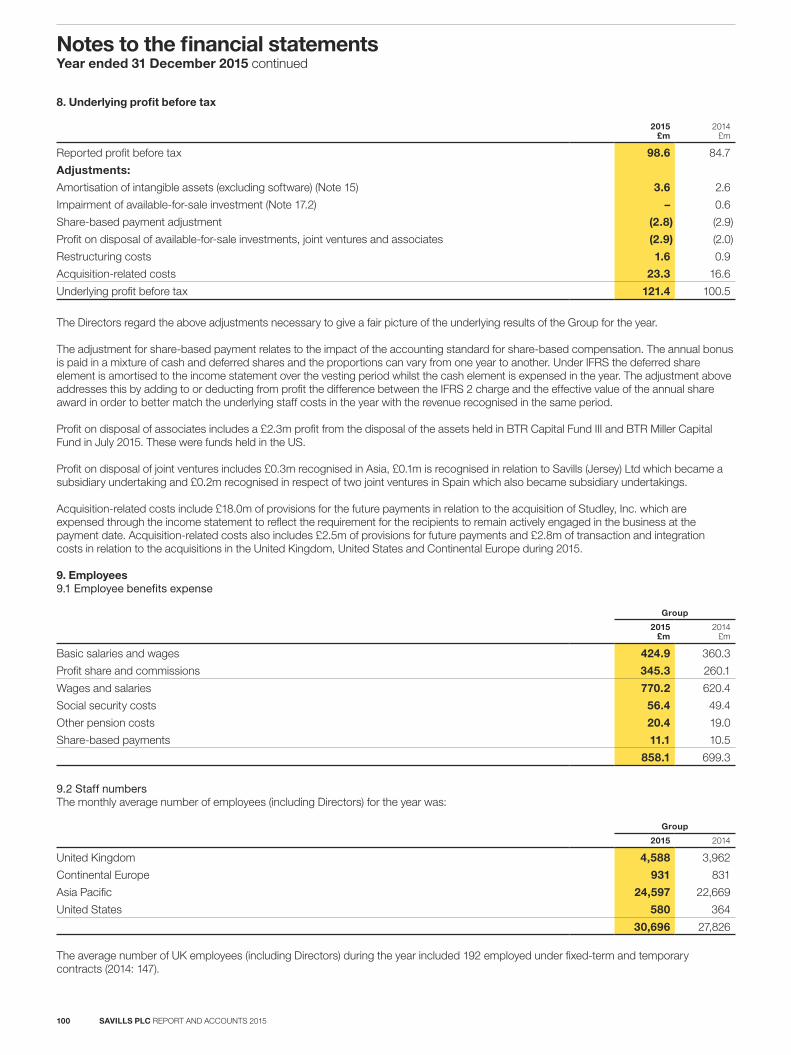
8. Underlying profit before tax
2015 £m
2014 £m
Reported profit before tax 98.6 84.7
Adjustments:
Amortisation of intangible assets (excluding software) (Note 15) 3.6 2.6
Impairment of available-for-sale investment (Note 17.2) – 0.6
Share-based payment adjustment (2.8) (2.9)
Profit on disposal of available-for-sale investments, joint ventures and associates (2.9) (2.0)
Restructuring costs 1.6 0.9
Acquisition-related costs 23.3 16.6
Underlying profit before tax 121.4 100.5
The Directors regard the above adjustments necessary to give a fair picture of the underlying results of the Group for the year.
The adjustment for share-based payment relates to the impact of the accounting standard for share-based compensation. The annual bonus is paid in a mixture of cash and deferred shares and the proportions can vary from one year to another. Under IFRS the deferred share element is amortised to the income statement over the vesting period whilst the cash element is expensed in the year. The adjustment above addresses this by adding to or deducting from profit the difference between the IFRS 2 charge and the effective value of the annual share award in order to better match the underlying staff costs in the year with the revenue recognised in the same period.
Profit on disposal of associates includes a £2.3m profit from the disposal of the assets held in BTR Capital Fund III and BTR Miller Capital Fund in July 2015. These were funds held in the US.
Profit on disposal of joint ventures includes £0.3m recognised in Asia, £0.1m is recognised in relation to Savills (Jersey) Ltd which became a subsidiary undertaking and £0.2m recognised in respect of two joint ventures in Spain which also became subsidiary undertakings.
Acquisition-related costs include £18.0m of provisions for the future payments in relation to the acquisition of Studley, Inc. which are expensed through the income statement to reflect the requirement for the recipients to remain actively engaged in the business at the payment date. Acquisition-related costs also includes £2.5m of provisions for future payments and £2.8m of transaction and integration costs in relation to the acquisitions in the United Kingdom, United States and Continental Europe during 2015.
9. Employees9.1 Employee benefits expense
Group
2015 £m
2014 £m
Basic salaries and wages 424.9 360.3
Profit share and commissions 345.3 260.1
Wages and salaries 770.2 620.4
Social security costs 56.4 49.4
Other pension costs 20.4 19.0
Share-based payments 11.1 10.5
858.1 699.3
9.2 Staff numbersThe monthly average number of employees (including Directors) for the year was:
Group
2015 2014
United Kingdom 4,588 3,962
Continental Europe 931 831
Asia Pacific 24,597 22,669
United States 580 364
30,696 27,826
The average number of UK employees (including Directors) during the year included 192 employed under fixed-term and temporary contracts (2014: 147).
SAVILLS PLC REPORT AND ACCOUNTS 2015100
Notes to the financial statementsYear ended 31 December 2015 continued
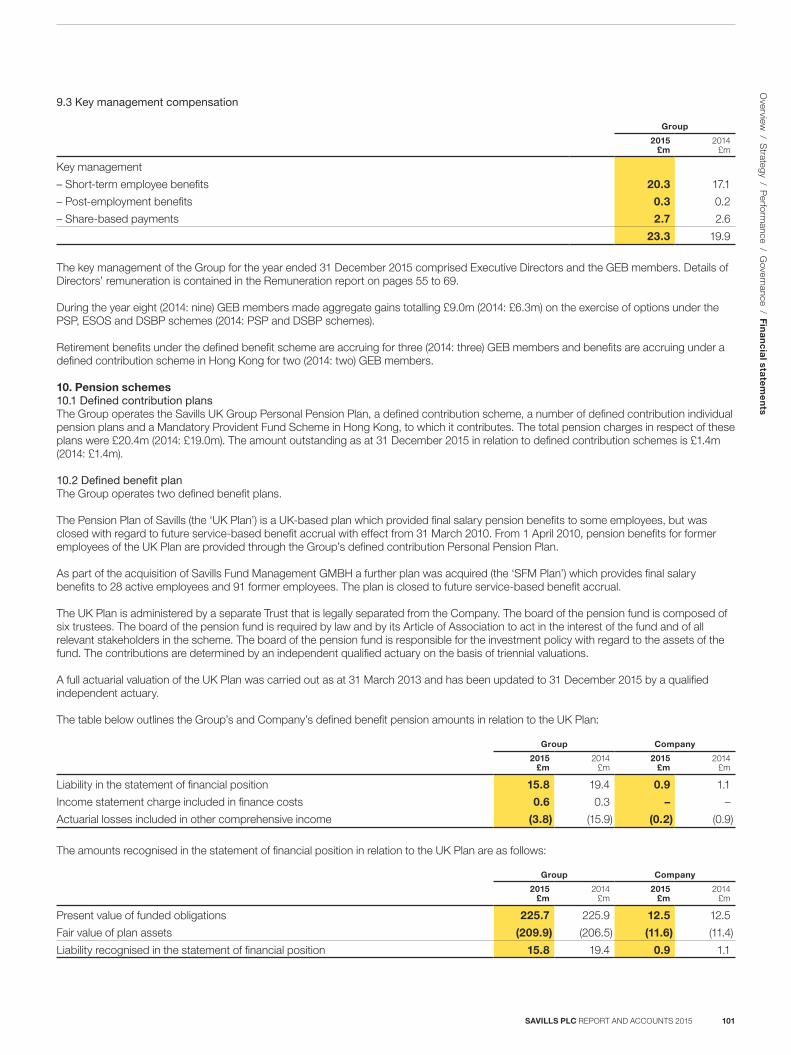
9.3 Key management compensation
Group
2015 £m
2014 £m
Key management
– Short-term employee benefits 20.3 17.1
– Post-employment benefits 0.3 0.2
– Share-based payments 2.7 2.6
23.3 19.9
The key management of the Group for the year ended 31 December 2015 comprised Executive Directors and the GEB members. Details of Directors’ remuneration is contained in the Remuneration report on pages 55 to 69.
During the year eight (2014: nine) GEB members made aggregate gains totalling £9.0m (2014: £6.3m) on the exercise of options under the PSP, ESOS and DSBP schemes (2014: PSP and DSBP schemes).
Retirement benefits under the defined benefit scheme are accruing for three (2014: three) GEB members and benefits are accruing under a defined contribution scheme in Hong Kong for two (2014: two) GEB members.
10. Pension schemes10.1 Defined contribution plansThe Group operates the Savills UK Group Personal Pension Plan, a defined contribution scheme, a number of defined contribution individual pension plans and a Mandatory Provident Fund Scheme in Hong Kong, to which it contributes. The total pension charges in respect of these plans were £20.4m (2014: £19.0m). The amount outstanding as at 31 December 2015 in relation to defined contribution schemes is £1.4m (2014: £1.4m).
10.2 Defined benefit plan The Group operates two defined benefit plans.
The Pension Plan of Savills (the ‘UK Plan’) is a UK-based plan which provided final salary pension benefits to some employees, but was closed with regard to future service-based benefit accrual with effect from 31 March 2010. From 1 April 2010, pension benefits for former employees of the UK Plan are provided through the Group’s defined contribution Personal Pension Plan.
As part of the acquisition of Savills Fund Management GMBH a further plan was acquired (the ‘SFM Plan’) which provides final salary benefits to 28 active employees and 91 former employees. The plan is closed to future service-based benefit accrual.
The UK Plan is administered by a separate Trust that is legally separated from the Company. The board of the pension fund is composed of six trustees. The board of the pension fund is required by law and by its Article of Association to act in the interest of the fund and of all relevant stakeholders in the scheme. The board of the pension fund is responsible for the investment policy with regard to the assets of the fund. The contributions are determined by an independent qualified actuary on the basis of triennial valuations.
A full actuarial valuation of the UK Plan was carried out as at 31 March 2013 and has been updated to 31 December 2015 by a qualified independent actuary.
The table below outlines the Group’s and Company’s defined benefit pension amounts in relation to the UK Plan:
Group Company
2015 £m
2014 £m
2015 £m
2014 £m
Liability in the statement of financial position 15.8 19.4 0.9 1.1
Income statement charge included in finance costs 0.6 0.3 – –
Actuarial losses included in other comprehensive income (3.8) (15.9) (0.2) (0.9)
The amounts recognised in the statement of financial position in relation to the UK Plan are as follows:
Group Company
2015 £m
2014 £m
2015 £m
2014 £m
Present value of funded obligations 225.7 225.9 12.5 12.5
Fair value of plan assets (209.9) (206.5) (11.6) (11.4)
Liability recognised in the statement of financial position 15.8 19.4 0.9 1.1
SAVILLS PLC REPORT AND ACCOUNTS 2015 101
O
verview / S
trategy / Perform
ance / Governance / F
ina
nc
ial sta
tem
en
ts
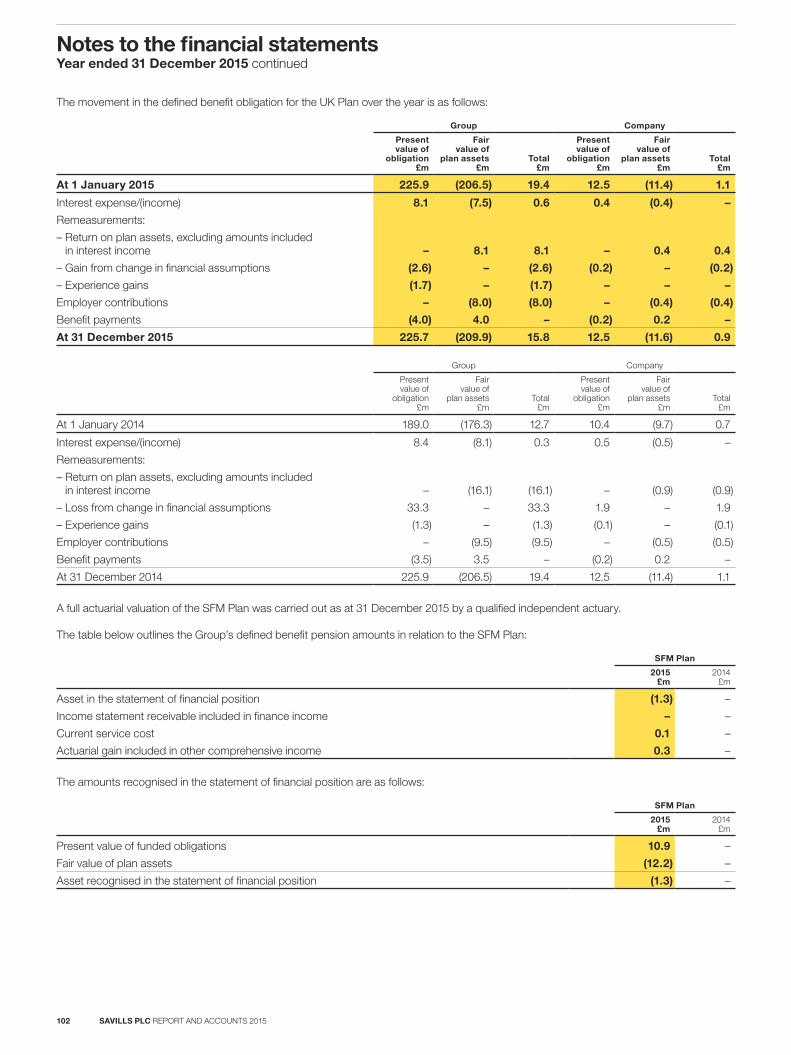
The movement in the defined benefit obligation for the UK Plan over the year is as follows:
Group Company
Present value of
obligation £m
Fair value of
plan assets £m
Total £m
Present value of
obligation £m
Fair value of
plan assets£m
Total £m
At 1 January 2015 225.9 (206.5) 19.4 12.5 (11.4) 1.1
Interest expense/(income) 8.1 (7.5) 0.6 0.4 (0.4) –
Remeasurements:
– Return on plan assets, excluding amounts included in interest income – 8.1 8.1 – 0.4 0.4
– Gain from change in financial assumptions (2.6) – (2.6) (0.2) – (0.2)
– Experience gains (1.7) – (1.7) – – –
Employer contributions – (8.0) (8.0) – (0.4) (0.4)
Benefit payments (4.0) 4.0 – (0.2) 0.2 –
At 31 December 2015 225.7 (209.9) 15.8 12.5 (11.6) 0.9
Group Company
Present value of
obligation £m
Fair value of
plan assets £m
Total £m
Present value of
obligation £m
Fair value of
plan assets £m
Total £m
At 1 January 2014 189.0 (176.3) 12.7 10.4 (9.7) 0.7
Interest expense/(income) 8.4 (8.1) 0.3 0.5 (0.5) –
Remeasurements:
– Return on plan assets, excluding amounts included in interest income – (16.1) (16.1) – (0.9) (0.9)
– Loss from change in financial assumptions 33.3 – 33.3 1.9 – 1.9
– Experience gains (1.3) – (1.3) (0.1) – (0.1)
Employer contributions – (9.5) (9.5) – (0.5) (0.5)
Benefit payments (3.5) 3.5 – (0.2) 0.2 –
At 31 December 2014 225.9 (206.5) 19.4 12.5 (11.4) 1.1
A full actuarial valuation of the SFM Plan was carried out as at 31 December 2015 by a qualified independent actuary.
The table below outlines the Group’s defined benefit pension amounts in relation to the SFM Plan:
SFM Plan
2015£m
2014£m
Asset in the statement of financial position (1.3) –
Income statement receivable included in finance income – –
Current service cost 0.1 –
Actuarial gain included in other comprehensive income 0.3 –
The amounts recognised in the statement of financial position are as follows:
SFM Plan
2015£m
2014£m
Present value of funded obligations 10.9 –
Fair value of plan assets (12.2) –
Asset recognised in the statement of financial position (1.3) –
SAVILLS PLC REPORT AND ACCOUNTS 2015102
Notes to the financial statementsYear ended 31 December 2015 continued
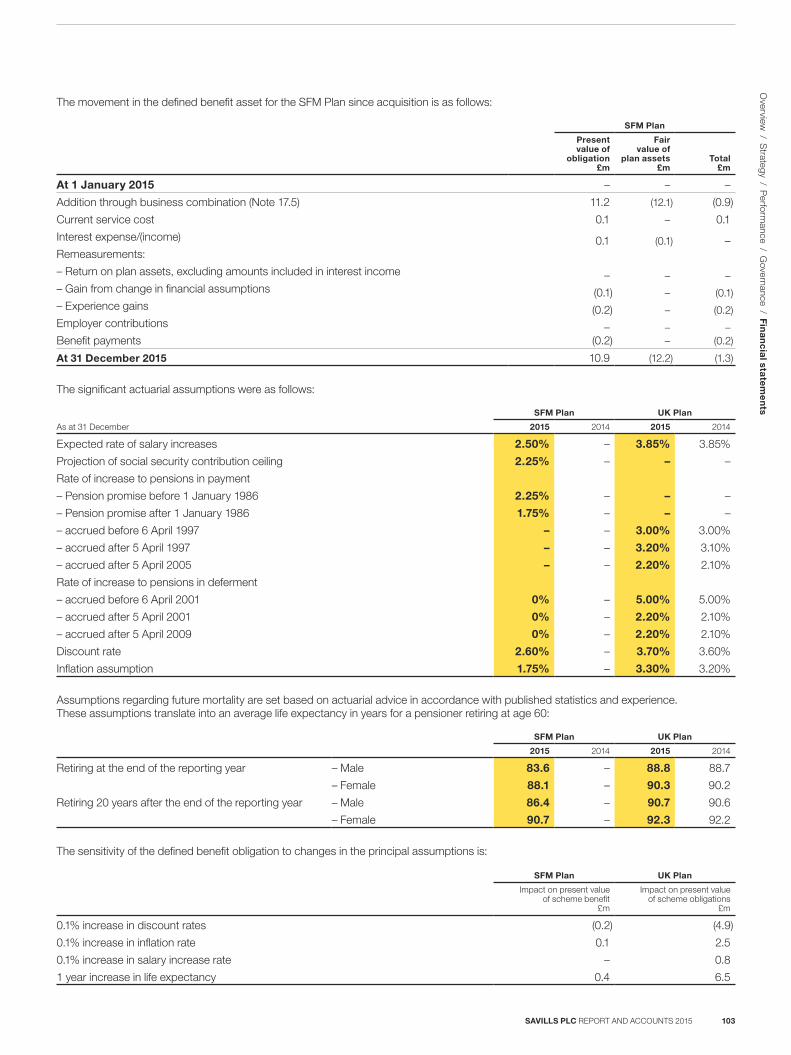
The movement in the defined benefit asset for the SFM Plan since acquisition is as follows:
SFM Plan
Present value of
obligation £m
Fair value of
plan assets£m
Total £m
At 1 January 2015 – – –
Addition through business combination (Note 17.5) 11.2 (12.1) (0.9)
Current service cost 0.1 – 0.1
Interest expense/(income) 0.1 (0.1) –Remeasurements:
– Return on plan assets, excluding amounts included in interest income – – –– Gain from change in financial assumptions (0.1) – (0.1)– Experience gains (0.2) – (0.2)Employer contributions – – –Benefit payments (0.2) – (0.2)
At 31 December 2015 10.9 (12.2) (1.3)
The significant actuarial assumptions were as follows:
SFM Plan UK Plan
As at 31 December 2015 2014 2015 2014
Expected rate of salary increases 2.50% – 3.85% 3.85%
Projection of social security contribution ceiling 2.25% – – –
Rate of increase to pensions in payment
– Pension promise before 1 January 1986 2.25% – – –
– Pension promise after 1 January 1986 1.75% – – –
– accrued before 6 April 1997 – – 3.00% 3.00%
– accrued after 5 April 1997 – – 3.20% 3.10%
– accrued after 5 April 2005 – – 2.20% 2.10%
Rate of increase to pensions in deferment
– accrued before 6 April 2001 0% – 5.00% 5.00%
– accrued after 5 April 2001 0% – 2.20% 2.10%
– accrued after 5 April 2009 0% – 2.20% 2.10%
Discount rate 2.60% – 3.70% 3.60%
Inflation assumption 1.75% – 3.30% 3.20%
Assumptions regarding future mortality are set based on actuarial advice in accordance with published statistics and experience. These assumptions translate into an average life expectancy in years for a pensioner retiring at age 60:
SFM Plan UK Plan
2015 2014 2015 2014
Retiring at the end of the reporting year – Male 83.6 – 88.8 88.7
– Female 88.1 – 90.3 90.2
Retiring 20 years after the end of the reporting year – Male 86.4 – 90.7 90.6
– Female 90.7 – 92.3 92.2
The sensitivity of the defined benefit obligation to changes in the principal assumptions is:
SFM Plan UK Plan
Impact on present value of scheme benefit
£m
Impact on present value of scheme obligations
£m
0.1% increase in discount rates (0.2) (4.9)
0.1% increase in inflation rate 0.1 2.5
0.1% increase in salary increase rate – 0.8
1 year increase in life expectancy 0.4 6.5
SAVILLS PLC REPORT AND ACCOUNTS 2015 103
O
verview / S
trategy / Perform
ance / Governance / F
ina
nc
ial sta
tem
en
ts
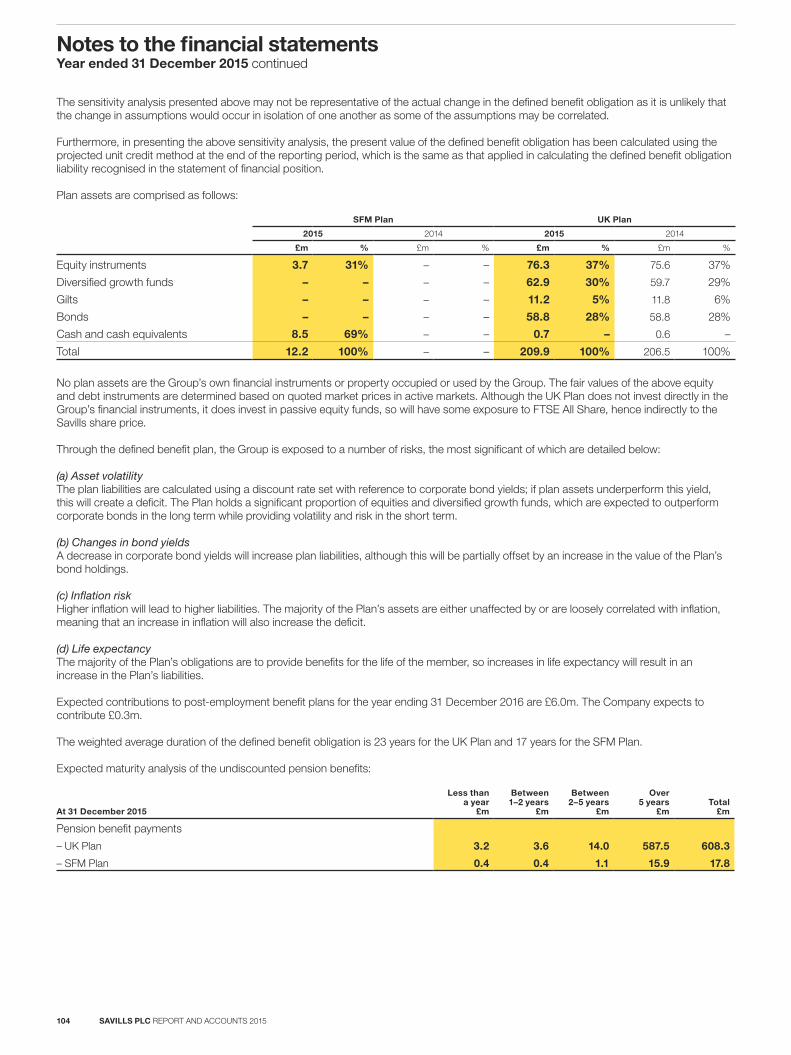
The sensitivity analysis presented above may not be representative of the actual change in the defined benefit obligation as it is unlikely that the change in assumptions would occur in isolation of one another as some of the assumptions may be correlated.
Furthermore, in presenting the above sensitivity analysis, the present value of the defined benefit obligation has been calculated using the projected unit credit method at the end of the reporting period, which is the same as that applied in calculating the defined benefit obligation liability recognised in the statement of financial position.
Plan assets are comprised as follows:
SFM Plan UK Plan
2015 2014 2015 2014
£m % £m % £m % £m %
Equity instruments 3.7 31% – – 76.3 37% 75.6 37%
Diversified growth funds – – – – 62.9 30% 59.7 29%
Gilts – – – – 11.2 5% 11.8 6%
Bonds – – – – 58.8 28% 58.8 28%
Cash and cash equivalents 8.5 69% – – 0.7 – 0.6 –
Total 12.2 100% – – 209.9 100% 206.5 100%
No plan assets are the Group’s own financial instruments or property occupied or used by the Group. The fair values of the above equity and debt instruments are determined based on quoted market prices in active markets. Although the UK Plan does not invest directly in the Group’s financial instruments, it does invest in passive equity funds, so will have some exposure to FTSE All Share, hence indirectly to the Savills share price.
Through the defined benefit plan, the Group is exposed to a number of risks, the most significant of which are detailed below:
(a) Asset volatilityThe plan liabilities are calculated using a discount rate set with reference to corporate bond yields; if plan assets underperform this yield, this will create a deficit. The Plan holds a significant proportion of equities and diversified growth funds, which are expected to outperform corporate bonds in the long term while providing volatility and risk in the short term.
(b) Changes in bond yieldsA decrease in corporate bond yields will increase plan liabilities, although this will be partially offset by an increase in the value of the Plan’s bond holdings.
(c) Inflation riskHigher inflation will lead to higher liabilities. The majority of the Plan’s assets are either unaffected by or are loosely correlated with inflation, meaning that an increase in inflation will also increase the deficit.
(d) Life expectancyThe majority of the Plan’s obligations are to provide benefits for the life of the member, so increases in life expectancy will result in an increase in the Plan’s liabilities.
Expected contributions to post-employment benefit plans for the year ending 31 December 2016 are £6.0m. The Company expects to contribute £0.3m.
The weighted average duration of the defined benefit obligation is 23 years for the UK Plan and 17 years for the SFM Plan.
Expected maturity analysis of the undiscounted pension benefits:
At 31 December 2015
Less than a year
£m
Between 1–2 years
£m
Between 2–5 years
£m
Over 5 years
£mTotal
£m
Pension benefit payments
– UK Plan 3.2 3.6 14.0 587.5 608.3
– SFM Plan 0.4 0.4 1.1 15.9 17.8
SAVILLS PLC REPORT AND ACCOUNTS 2015104
Notes to the financial statementsYear ended 31 December 2015 continued
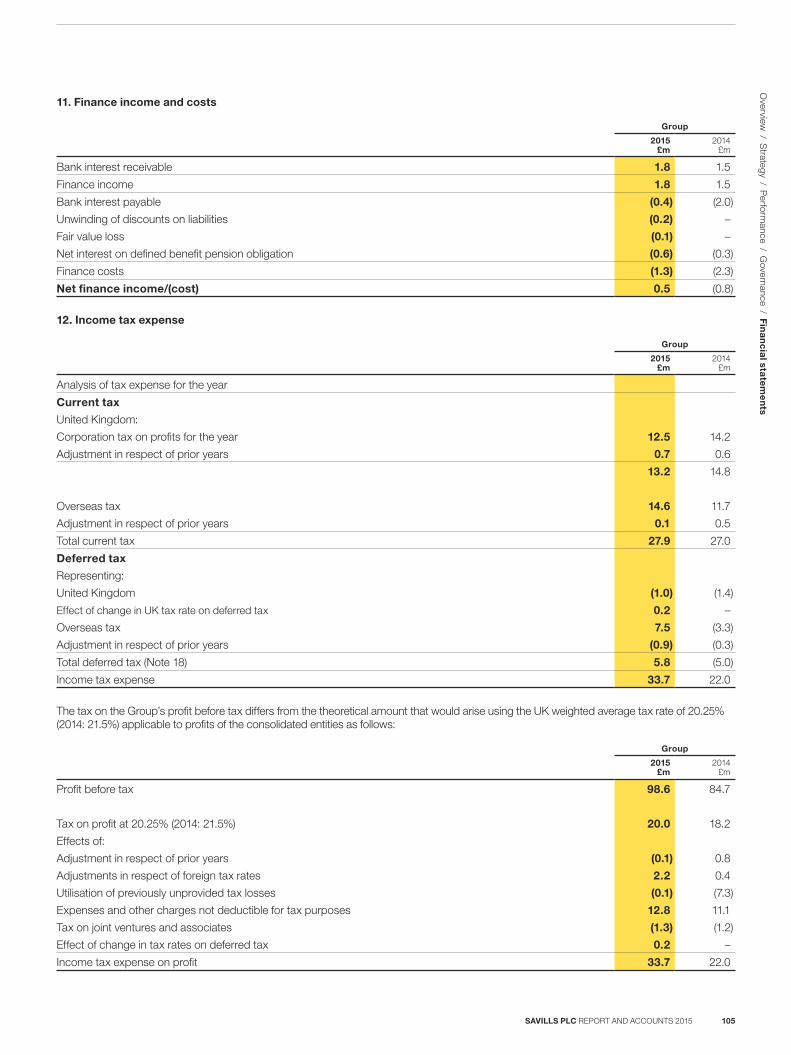
11. Finance income and costs
Group
2015 £m
2014 £m
Bank interest receivable 1.8 1.5
Finance income 1.8 1.5
Bank interest payable (0.4) (2.0)
Unwinding of discounts on liabilities (0.2) –
Fair value loss (0.1) –
Net interest on defined benefit pension obligation (0.6) (0.3)
Finance costs (1.3) (2.3)
Net finance income/(cost) 0.5 (0.8)
12. Income tax expense
Group
2015 £m
2014 £m
Analysis of tax expense for the year
Current tax
United Kingdom:
Corporation tax on profits for the year 12.5 14.2
Adjustment in respect of prior years 0.7 0.6
13.2 14.8
Overseas tax 14.6 11.7
Adjustment in respect of prior years 0.1 0.5
Total current tax 27.9 27.0
Deferred tax
Representing:
United Kingdom (1.0) (1.4)
Effect of change in UK tax rate on deferred tax 0.2 –
Overseas tax 7.5 (3.3)
Adjustment in respect of prior years (0.9) (0.3)
Total deferred tax (Note 18) 5.8 (5.0)
Income tax expense 33.7 22.0
The tax on the Group’s profit before tax differs from the theoretical amount that would arise using the UK weighted average tax rate of 20.25% (2014: 21.5%) applicable to profits of the consolidated entities as follows:
Group
2015 £m
2014 £m
Profit before tax 98.6 84.7
Tax on profit at 20.25% (2014: 21.5%) 20.0 18.2
Effects of:
Adjustment in respect of prior years (0.1) 0.8
Adjustments in respect of foreign tax rates 2.2 0.4
Utilisation of previously unprovided tax losses (0.1) (7.3)
Expenses and other charges not deductible for tax purposes 12.8 11.1
Tax on joint ventures and associates (1.3) (1.2)
Effect of change in tax rates on deferred tax 0.2 –
Income tax expense on profit 33.7 22.0
SAVILLS PLC REPORT AND ACCOUNTS 2015 105
O
verview / S
trategy / Perform
ance / Governance / F
ina
nc
ial sta
tem
en
ts
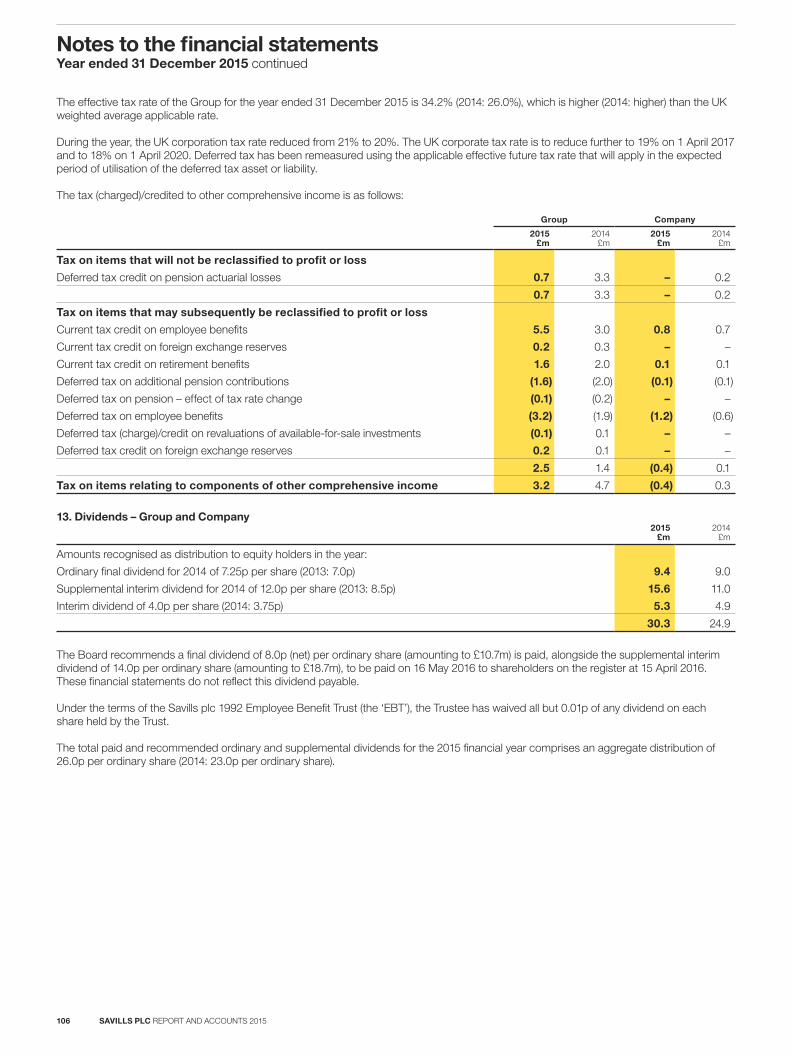
The effective tax rate of the Group for the year ended 31 December 2015 is 34.2% (2014: 26.0%), which is higher (2014: higher) than the UK weighted average applicable rate.
During the year, the UK corporation tax rate reduced from 21% to 20%. The UK corporate tax rate is to reduce further to 19% on 1 April 2017 and to 18% on 1 April 2020. Deferred tax has been remeasured using the applicable effective future tax rate that will apply in the expected period of utilisation of the deferred tax asset or liability.
The tax (charged)/credited to other comprehensive income is as follows:
Group Company
2015 £m
2014 £m
2015 £m
2014 £m
Tax on items that will not be reclassified to profit or loss
Deferred tax credit on pension actuarial losses 0.7 3.3 – 0.2
0.7 3.3 – 0.2
Tax on items that may subsequently be reclassified to profit or loss
Current tax credit on employee benefits 5.5 3.0 0.8 0.7
Current tax credit on foreign exchange reserves 0.2 0.3 – –
Current tax credit on retirement benefits 1.6 2.0 0.1 0.1
Deferred tax on additional pension contributions (1.6) (2.0) (0.1) (0.1)
Deferred tax on pension – effect of tax rate change (0.1) (0.2) – –
Deferred tax on employee benefits (3.2) (1.9) (1.2) (0.6)
Deferred tax (charge)/credit on revaluations of available-for-sale investments (0.1) 0.1 – –
Deferred tax credit on foreign exchange reserves 0.2 0.1 – –
2.5 1.4 (0.4) 0.1
Tax on items relating to components of other comprehensive income 3.2 4.7 (0.4) 0.3
13. Dividends – Group and Company2015
£m 2014
£m
Amounts recognised as distribution to equity holders in the year:
Ordinary final dividend for 2014 of 7.25p per share (2013: 7.0p) 9.4 9.0
Supplemental interim dividend for 2014 of 12.0p per share (2013: 8.5p) 15.6 11.0
Interim dividend of 4.0p per share (2014: 3.75p) 5.3 4.9
30.3 24.9
The Board recommends a final dividend of 8.0p (net) per ordinary share (amounting to £10.7m) is paid, alongside the supplemental interim dividend of 14.0p per ordinary share (amounting to £18.7m), to be paid on 16 May 2016 to shareholders on the register at 15 April 2016. These financial statements do not reflect this dividend payable.
Under the terms of the Savills plc 1992 Employee Benefit Trust (the ‘EBT’), the Trustee has waived all but 0.01p of any dividend on each share held by the Trust.
The total paid and recommended ordinary and supplemental dividends for the 2015 financial year comprises an aggregate distribution of 26.0p per ordinary share (2014: 23.0p per ordinary share).
SAVILLS PLC REPORT AND ACCOUNTS 2015106
Notes to the financial statementsYear ended 31 December 2015 continued
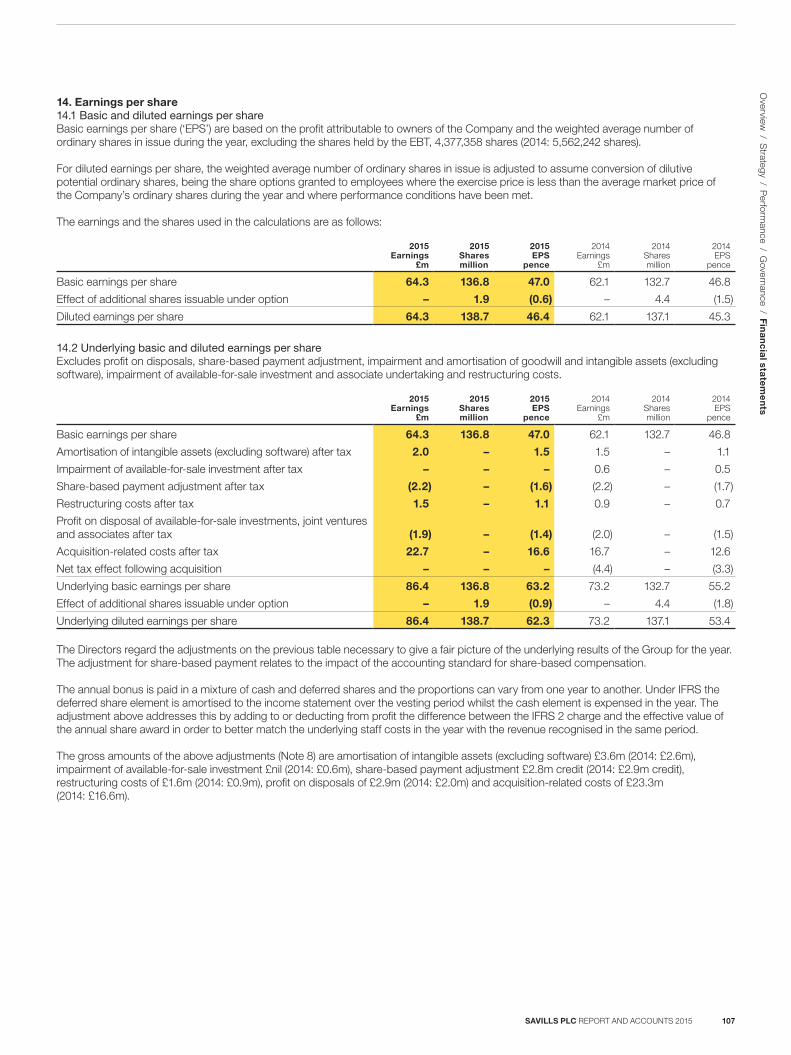
14. Earnings per share14.1 Basic and diluted earnings per shareBasic earnings per share (‘EPS’) are based on the profit attributable to owners of the Company and the weighted average number of ordinary shares in issue during the year, excluding the shares held by the EBT, 4,377,358 shares (2014: 5,562,242 shares).
For diluted earnings per share, the weighted average number of ordinary shares in issue is adjusted to assume conversion of dilutive potential ordinary shares, being the share options granted to employees where the exercise price is less than the average market price of the Company’s ordinary shares during the year and where performance conditions have been met.
The earnings and the shares used in the calculations are as follows:
2015 Earnings
£m
2015Sharesmillion
2015EPS
pence
2014 Earnings
£m
2014Sharesmillion
2014EPS
pence
Basic earnings per share 64.3 136.8 47.0 62.1 132.7 46.8
Effect of additional shares issuable under option – 1.9 (0.6) – 4.4 (1.5)
Diluted earnings per share 64.3 138.7 46.4 62.1 137.1 45.3
14.2 Underlying basic and diluted earnings per shareExcludes profit on disposals, share-based payment adjustment, impairment and amortisation of goodwill and intangible assets (excluding software), impairment of available-for-sale investment and associate undertaking and restructuring costs.
2015 Earnings
£m
2015Sharesmillion
2015EPS
pence
2014 Earnings
£m
2014Sharesmillion
2014EPS
pence
Basic earnings per share 64.3 136.8 47.0 62.1 132.7 46.8
Amortisation of intangible assets (excluding software) after tax 2.0 – 1.5 1.5 – 1.1
Impairment of available-for-sale investment after tax – – – 0.6 – 0.5
Share-based payment adjustment after tax (2.2) – (1.6) (2.2) – (1.7)
Restructuring costs after tax 1.5 – 1.1 0.9 – 0.7
Profit on disposal of available-for-sale investments, joint ventures and associates after tax (1.9) – (1.4) (2.0) – (1.5)
Acquisition-related costs after tax 22.7 – 16.6 16.7 – 12.6
Net tax effect following acquisition – – – (4.4) – (3.3)
Underlying basic earnings per share 86.4 136.8 63.2 73.2 132.7 55.2
Effect of additional shares issuable under option – 1.9 (0.9) – 4.4 (1.8)
Underlying diluted earnings per share 86.4 138.7 62.3 73.2 137.1 53.4
The Directors regard the adjustments on the previous table necessary to give a fair picture of the underlying results of the Group for the year. The adjustment for share-based payment relates to the impact of the accounting standard for share-based compensation.
The annual bonus is paid in a mixture of cash and deferred shares and the proportions can vary from one year to another. Under IFRS the deferred share element is amortised to the income statement over the vesting period whilst the cash element is expensed in the year. The adjustment above addresses this by adding to or deducting from profit the difference between the IFRS 2 charge and the effective value of the annual share award in order to better match the underlying staff costs in the year with the revenue recognised in the same period.
The gross amounts of the above adjustments (Note 8) are amortisation of intangible assets (excluding software) £3.6m (2014: £2.6m), impairment of available-for-sale investment £nil (2014: £0.6m), share-based payment adjustment £2.8m credit (2014: £2.9m credit), restructuring costs of £1.6m (2014: £0.9m), profit on disposals of £2.9m (2014: £2.0m) and acquisition-related costs of £23.3m (2014: £16.6m).
SAVILLS PLC REPORT AND ACCOUNTS 2015 107
O
verview / S
trategy / Perform
ance / Governance / F
ina
nc
ial sta
tem
en
ts
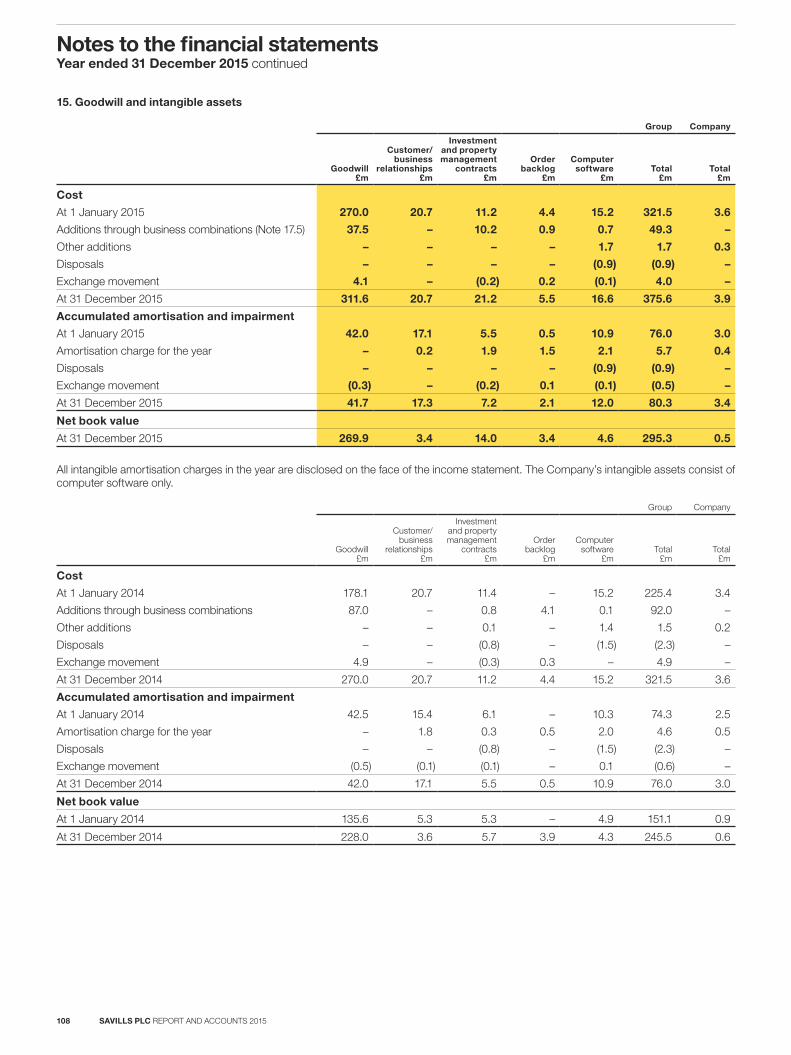
15. Goodwill and intangible assets
Group Company
Goodwill £m
Customer/ business
relationships £m
Investment and property management
contracts£m
Orderbacklog
£m
Computer software
£mTotal
£mTotal
£m
Cost
At 1 January 2015 270.0 20.7 11.2 4.4 15.2 321.5 3.6
Additions through business combinations (Note 17.5) 37.5 – 10.2 0.9 0.7 49.3 –
Other additions – – – – 1.7 1.7 0.3
Disposals – – – – (0.9) (0.9) –
Exchange movement 4.1 – (0.2) 0.2 (0.1) 4.0 –
At 31 December 2015 311.6 20.7 21.2 5.5 16.6 375.6 3.9
Accumulated amortisation and impairment
At 1 January 2015 42.0 17.1 5.5 0.5 10.9 76.0 3.0
Amortisation charge for the year – 0.2 1.9 1.5 2.1 5.7 0.4
Disposals – – – – (0.9) (0.9) –
Exchange movement (0.3) – (0.2) 0.1 (0.1) (0.5) –
At 31 December 2015 41.7 17.3 7.2 2.1 12.0 80.3 3.4
Net book value
At 31 December 2015 269.9 3.4 14.0 3.4 4.6 295.3 0.5
All intangible amortisation charges in the year are disclosed on the face of the income statement. The Company’s intangible assets consist of computer software only.
Group Company
Goodwill £m
Customer/ business
relationships £m
Investment and property management
contracts£m
Orderbacklog
£m
Computer software
£mTotal
£mTotal
£m
Cost
At 1 January 2014 178.1 20.7 11.4 – 15.2 225.4 3.4
Additions through business combinations 87.0 – 0.8 4.1 0.1 92.0 –
Other additions – – 0.1 – 1.4 1.5 0.2
Disposals – – (0.8) – (1.5) (2.3) –
Exchange movement 4.9 – (0.3) 0.3 – 4.9 –
At 31 December 2014 270.0 20.7 11.2 4.4 15.2 321.5 3.6
Accumulated amortisation and impairment
At 1 January 2014 42.5 15.4 6.1 – 10.3 74.3 2.5
Amortisation charge for the year – 1.8 0.3 0.5 2.0 4.6 0.5
Disposals – – (0.8) – (1.5) (2.3) –
Exchange movement (0.5) (0.1) (0.1) – 0.1 (0.6) –
At 31 December 2014 42.0 17.1 5.5 0.5 10.9 76.0 3.0
Net book value
At 1 January 2014 135.6 5.3 5.3 – 4.9 151.1 0.9
At 31 December 2014 228.0 3.6 5.7 3.9 4.3 245.5 0.6
SAVILLS PLC REPORT AND ACCOUNTS 2015108
Notes to the financial statementsYear ended 31 December 2015 continued
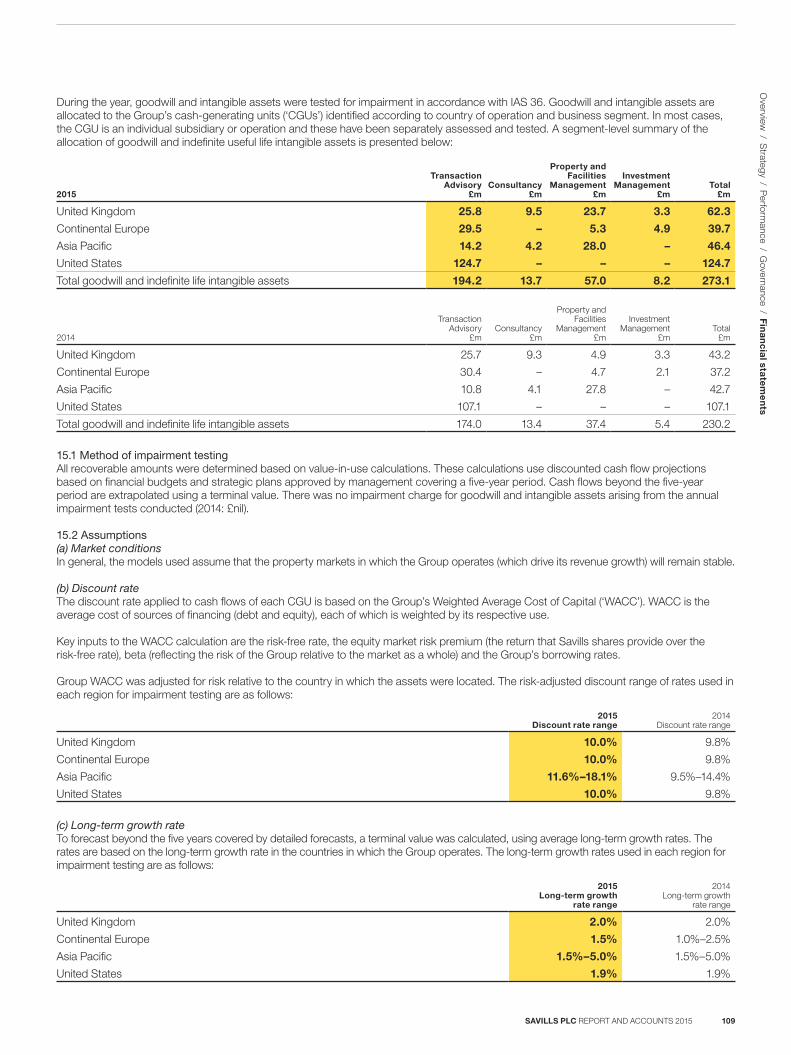
During the year, goodwill and intangible assets were tested for impairment in accordance with IAS 36. Goodwill and intangible assets are allocated to the Group’s cash-generating units (‘CGUs’) identified according to country of operation and business segment. In most cases, the CGU is an individual subsidiary or operation and these have been separately assessed and tested. A segment-level summary of the allocation of goodwill and indefinite useful life intangible assets is presented below:
2015
Transaction Advisory
£mConsultancy
£m
Property and Facilities
Management £m
Investment Management
£mTotal
£m
United Kingdom 25.8 9.5 23.7 3.3 62.3
Continental Europe 29.5 – 5.3 4.9 39.7
Asia Pacific 14.2 4.2 28.0 – 46.4
United States 124.7 – – – 124.7
Total goodwill and indefinite life intangible assets 194.2 13.7 57.0 8.2 273.1
2014
Transaction Advisory
£mConsultancy
£m
Property and Facilities
Management £m
Investment Management
£mTotal
£m
United Kingdom 25.7 9.3 4.9 3.3 43.2
Continental Europe 30.4 – 4.7 2.1 37.2
Asia Pacific 10.8 4.1 27.8 – 42.7
United States 107.1 – – – 107.1
Total goodwill and indefinite life intangible assets 174.0 13.4 37.4 5.4 230.2
15.1 Method of impairment testingAll recoverable amounts were determined based on value-in-use calculations. These calculations use discounted cash flow projections based on financial budgets and strategic plans approved by management covering a five-year period. Cash flows beyond the five-year period are extrapolated using a terminal value. There was no impairment charge for goodwill and intangible assets arising from the annual impairment tests conducted (2014: £nil).
15.2 Assumptions(a) Market conditionsIn general, the models used assume that the property markets in which the Group operates (which drive its revenue growth) will remain stable.
(b) Discount rateThe discount rate applied to cash flows of each CGU is based on the Group’s Weighted Average Cost of Capital (‘WACC’). WACC is the average cost of sources of financing (debt and equity), each of which is weighted by its respective use.
Key inputs to the WACC calculation are the risk-free rate, the equity market risk premium (the return that Savills shares provide over the risk-free rate), beta (reflecting the risk of the Group relative to the market as a whole) and the Group’s borrowing rates.
Group WACC was adjusted for risk relative to the country in which the assets were located. The risk-adjusted discount range of rates used in each region for impairment testing are as follows:
2015 Discount rate range
2014 Discount rate range
United Kingdom 10.0% 9.8%
Continental Europe 10.0% 9.8%
Asia Pacific 11.6%–18.1% 9.5%–14.4%
United States 10.0% 9.8%
(c) Long-term growth rateTo forecast beyond the five years covered by detailed forecasts, a terminal value was calculated, using average long-term growth rates. The rates are based on the long-term growth rate in the countries in which the Group operates. The long-term growth rates used in each region for impairment testing are as follows:
2015 Long-term growth
rate range
2014 Long-term growth
rate range
United Kingdom 2.0% 2.0%
Continental Europe 1.5% 1.0%–2.5%
Asia Pacific 1.5%–5.0% 1.5%–5.0%
United States 1.9% 1.9%
SAVILLS PLC REPORT AND ACCOUNTS 2015 109
O
verview / S
trategy / Perform
ance / Governance / F
ina
nc
ial sta
tem
en
ts
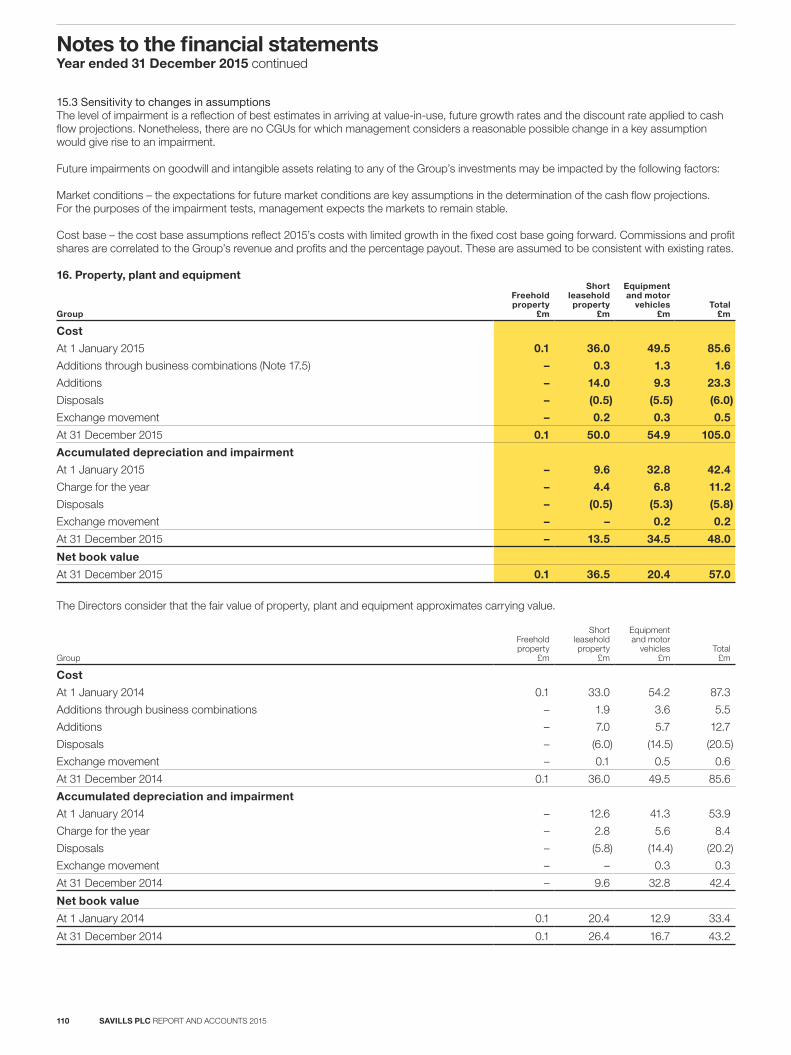
15.3 Sensitivity to changes in assumptionsThe level of impairment is a reflection of best estimates in arriving at value-in-use, future growth rates and the discount rate applied to cash flow projections. Nonetheless, there are no CGUs for which management considers a reasonable possible change in a key assumption would give rise to an impairment.
Future impairments on goodwill and intangible assets relating to any of the Group’s investments may be impacted by the following factors:
Market conditions – the expectations for future market conditions are key assumptions in the determination of the cash flow projections. For the purposes of the impairment tests, management expects the markets to remain stable.
Cost base – the cost base assumptions reflect 2015’s costs with limited growth in the fixed cost base going forward. Commissions and profit shares are correlated to the Group’s revenue and profits and the percentage payout. These are assumed to be consistent with existing rates.
16. Property, plant and equipment
Group
Freehold property
£m
Short leasehold
property £m
Equipment and motor
vehicles £m
Total £m
Cost
At 1 January 2015 0.1 36.0 49.5 85.6
Additions through business combinations (Note 17.5) – 0.3 1.3 1.6
Additions – 14.0 9.3 23.3
Disposals – (0.5) (5.5) (6.0)
Exchange movement – 0.2 0.3 0.5
At 31 December 2015 0.1 50.0 54.9 105.0
Accumulated depreciation and impairment
At 1 January 2015 – 9.6 32.8 42.4
Charge for the year – 4.4 6.8 11.2
Disposals – (0.5) (5.3) (5.8)
Exchange movement – – 0.2 0.2
At 31 December 2015 – 13.5 34.5 48.0
Net book value
At 31 December 2015 0.1 36.5 20.4 57.0
The Directors consider that the fair value of property, plant and equipment approximates carrying value.
Group
Freehold property
£m
Short leasehold
property £m
Equipment and motor
vehicles £m
Total £m
Cost
At 1 January 2014 0.1 33.0 54.2 87.3
Additions through business combinations – 1.9 3.6 5.5
Additions – 7.0 5.7 12.7
Disposals – (6.0) (14.5) (20.5)
Exchange movement – 0.1 0.5 0.6
At 31 December 2014 0.1 36.0 49.5 85.6
Accumulated depreciation and impairment
At 1 January 2014 – 12.6 41.3 53.9
Charge for the year – 2.8 5.6 8.4
Disposals – (5.8) (14.4) (20.2)
Exchange movement – – 0.3 0.3
At 31 December 2014 – 9.6 32.8 42.4
Net book value
At 1 January 2014 0.1 20.4 12.9 33.4
At 31 December 2014 0.1 26.4 16.7 43.2
SAVILLS PLC REPORT AND ACCOUNTS 2015110
Notes to the financial statementsYear ended 31 December 2015 continued
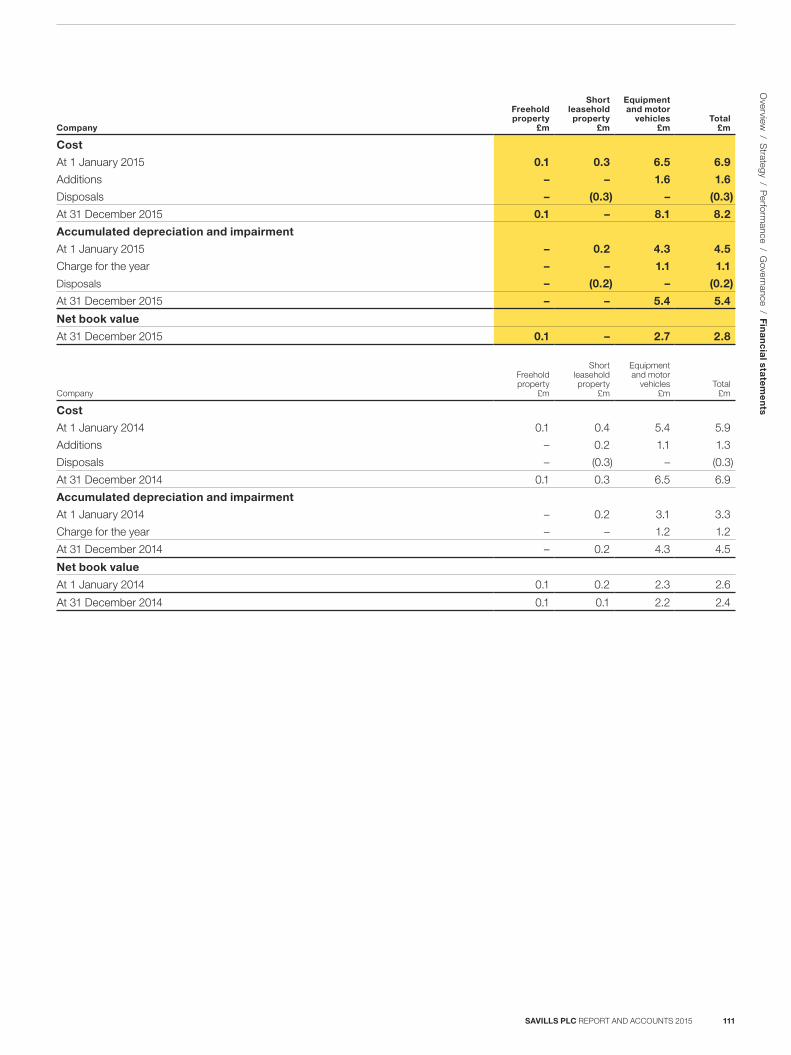
Company
Freehold property
£m
Short leasehold property
£m
Equipment and motor
vehicles £m
Total £m
Cost
At 1 January 2015 0.1 0.3 6.5 6.9
Additions – – 1.6 1.6
Disposals – (0.3) – (0.3)
At 31 December 2015 0.1 – 8.1 8.2
Accumulated depreciation and impairment
At 1 January 2015 – 0.2 4.3 4.5
Charge for the year – – 1.1 1.1
Disposals – (0.2) – (0.2)
At 31 December 2015 – – 5.4 5.4
Net book value
At 31 December 2015 0.1 – 2.7 2.8
Company
Freehold property
£m
Short leasehold property
£m
Equipment and motor
vehicles £m
Total £m
Cost
At 1 January 2014 0.1 0.4 5.4 5.9
Additions – 0.2 1.1 1.3
Disposals – (0.3) – (0.3)
At 31 December 2014 0.1 0.3 6.5 6.9
Accumulated depreciation and impairment
At 1 January 2014 – 0.2 3.1 3.3
Charge for the year – – 1.2 1.2
At 31 December 2014 – 0.2 4.3 4.5
Net book value
At 1 January 2014 0.1 0.2 2.3 2.6
At 31 December 2014 0.1 0.1 2.2 2.4
SAVILLS PLC REPORT AND ACCOUNTS 2015 111
O
verview / S
trategy / Perform
ance / Governance / F
ina
nc
ial sta
tem
en
ts
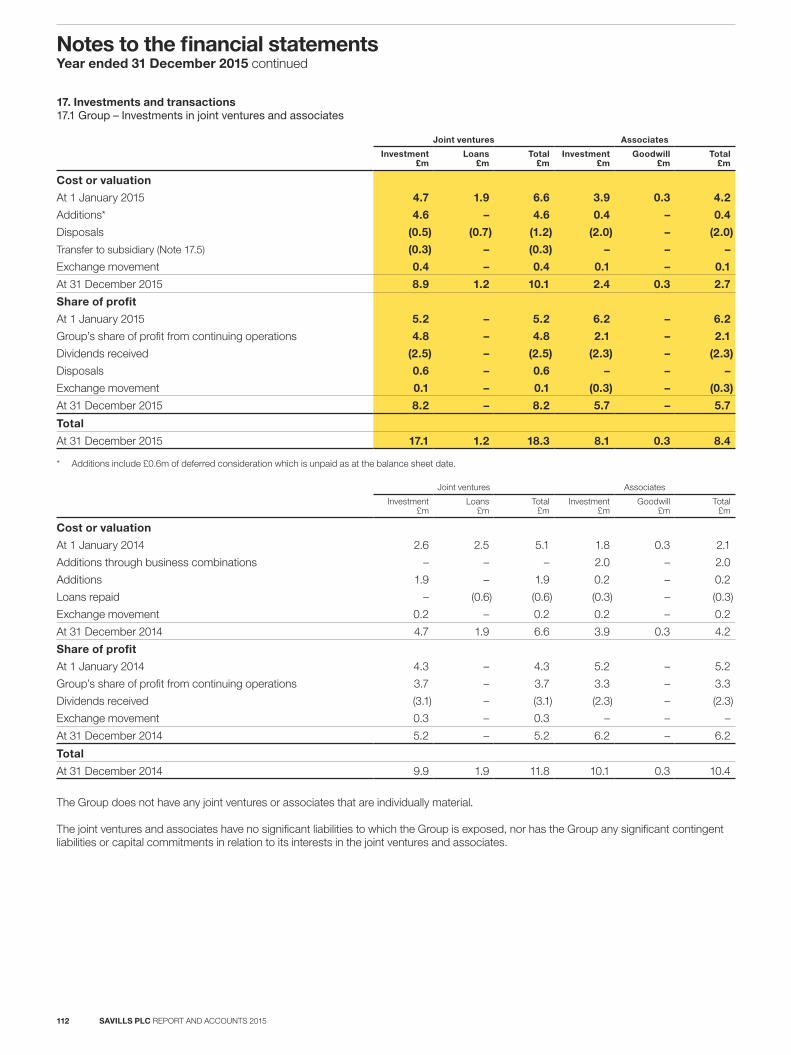
17. Investments and transactions 17.1 Group – Investments in joint ventures and associates
Joint ventures Associates
Investment £m
Loans £m
Total £m
Investment £m
Goodwill £m
Total £m
Cost or valuation
At 1 January 2015 4.7 1.9 6.6 3.9 0.3 4.2
Additions* 4.6 – 4.6 0.4 – 0.4
Disposals (0.5) (0.7) (1.2) (2.0) – (2.0)
Transfer to subsidiary (Note 17.5) (0.3) – (0.3) – – –
Exchange movement 0.4 – 0.4 0.1 – 0.1
At 31 December 2015 8.9 1.2 10.1 2.4 0.3 2.7
Share of profit
At 1 January 2015 5.2 – 5.2 6.2 – 6.2
Group’s share of profit from continuing operations 4.8 – 4.8 2.1 – 2.1
Dividends received (2.5) – (2.5) (2.3) – (2.3)
Disposals 0.6 – 0.6 – – –
Exchange movement 0.1 – 0.1 (0.3) – (0.3)
At 31 December 2015 8.2 – 8.2 5.7 – 5.7
Total
At 31 December 2015 17.1 1.2 18.3 8.1 0.3 8.4
* Additions include £0.6m of deferred consideration which is unpaid as at the balance sheet date.
Joint ventures Associates
Investment £m
Loans £m
Total £m
Investment £m
Goodwill £m
Total £m
Cost or valuation
At 1 January 2014 2.6 2.5 5.1 1.8 0.3 2.1
Additions through business combinations – – – 2.0 – 2.0
Additions 1.9 – 1.9 0.2 – 0.2
Loans repaid – (0.6) (0.6) (0.3) – (0.3)
Exchange movement 0.2 – 0.2 0.2 – 0.2
At 31 December 2014 4.7 1.9 6.6 3.9 0.3 4.2
Share of profit
At 1 January 2014 4.3 – 4.3 5.2 – 5.2
Group’s share of profit from continuing operations 3.7 – 3.7 3.3 – 3.3
Dividends received (3.1) – (3.1) (2.3) – (2.3)
Exchange movement 0.3 – 0.3 – – –
At 31 December 2014 5.2 – 5.2 6.2 – 6.2
Total
At 31 December 2014 9.9 1.9 11.8 10.1 0.3 10.4
The Group does not have any joint ventures or associates that are individually material.
The joint ventures and associates have no significant liabilities to which the Group is exposed, nor has the Group any significant contingent liabilities or capital commitments in relation to its interests in the joint ventures and associates.
SAVILLS PLC REPORT AND ACCOUNTS 2015112
Notes to the financial statementsYear ended 31 December 2015 continued
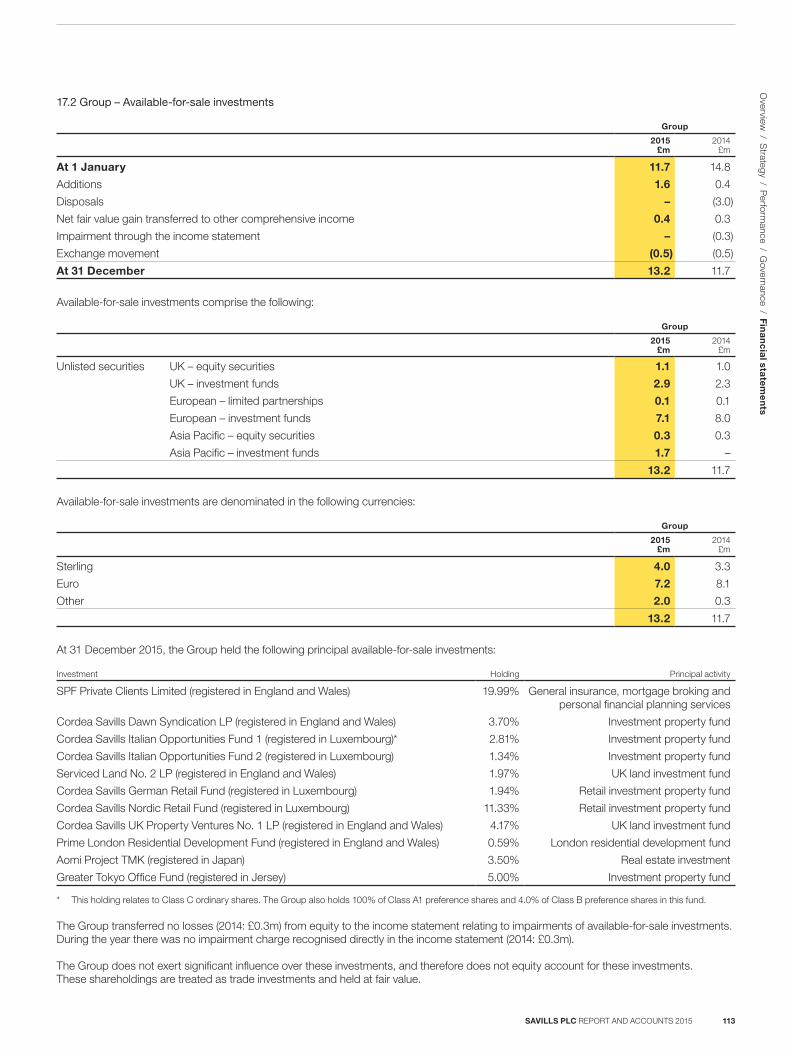
17.2 Group – Available-for-sale investments
Group
2015 £m
2014 £m
At 1 January 11.7 14.8
Additions 1.6 0.4
Disposals – (3.0)
Net fair value gain transferred to other comprehensive income 0.4 0.3
Impairment through the income statement – (0.3)
Exchange movement (0.5) (0.5)
At 31 December 13.2 11.7
Available-for-sale investments comprise the following:
Group
2015 £m
2014 £m
Unlisted securities UK – equity securities 1.1 1.0
UK – investment funds 2.9 2.3
European – limited partnerships 0.1 0.1
European – investment funds 7.1 8.0
Asia Pacific – equity securities 0.3 0.3
Asia Pacific – investment funds 1.7 –
13.2 11.7
Available-for-sale investments are denominated in the following currencies:
Group
2015 £m
2014 £m
Sterling 4.0 3.3
Euro 7.2 8.1
Other 2.0 0.3
13.2 11.7
At 31 December 2015, the Group held the following principal available-for-sale investments:
Investment Holding Principal activity
SPF Private Clients Limited (registered in England and Wales) 19.99% General insurance, mortgage broking and personal financial planning services
Cordea Savills Dawn Syndication LP (registered in England and Wales) 3.70% Investment property fund
Cordea Savills Italian Opportunities Fund 1 (registered in Luxembourg)* 2.81% Investment property fund
Cordea Savills Italian Opportunities Fund 2 (registered in Luxembourg) 1.34% Investment property fund
Serviced Land No. 2 LP (registered in England and Wales) 1.97% UK land investment fund
Cordea Savills German Retail Fund (registered in Luxembourg) 1.94% Retail investment property fund
Cordea Savills Nordic Retail Fund (registered in Luxembourg) 11.33% Retail investment property fund
Cordea Savills UK Property Ventures No. 1 LP (registered in England and Wales) 4.17% UK land investment fund
Prime London Residential Development Fund (registered in England and Wales) 0.59% London residential development fund
Aomi Project TMK (registered in Japan) 3.50% Real estate investment
Greater Tokyo Office Fund (registered in Jersey) 5.00% Investment property fund
* This holding relates to Class C ordinary shares. The Group also holds 100% of Class A1 preference shares and 4.0% of Class B preference shares in this fund.
The Group transferred no losses (2014: £0.3m) from equity to the income statement relating to impairments of available-for-sale investments. During the year there was no impairment charge recognised directly in the income statement (2014: £0.3m).
The Group does not exert significant influence over these investments, and therefore does not equity account for these investments. These shareholdings are treated as trade investments and held at fair value.
SAVILLS PLC REPORT AND ACCOUNTS 2015 113
O
verview / S
trategy / Perform
ance / Governance / F
ina
nc
ial sta
tem
en
ts
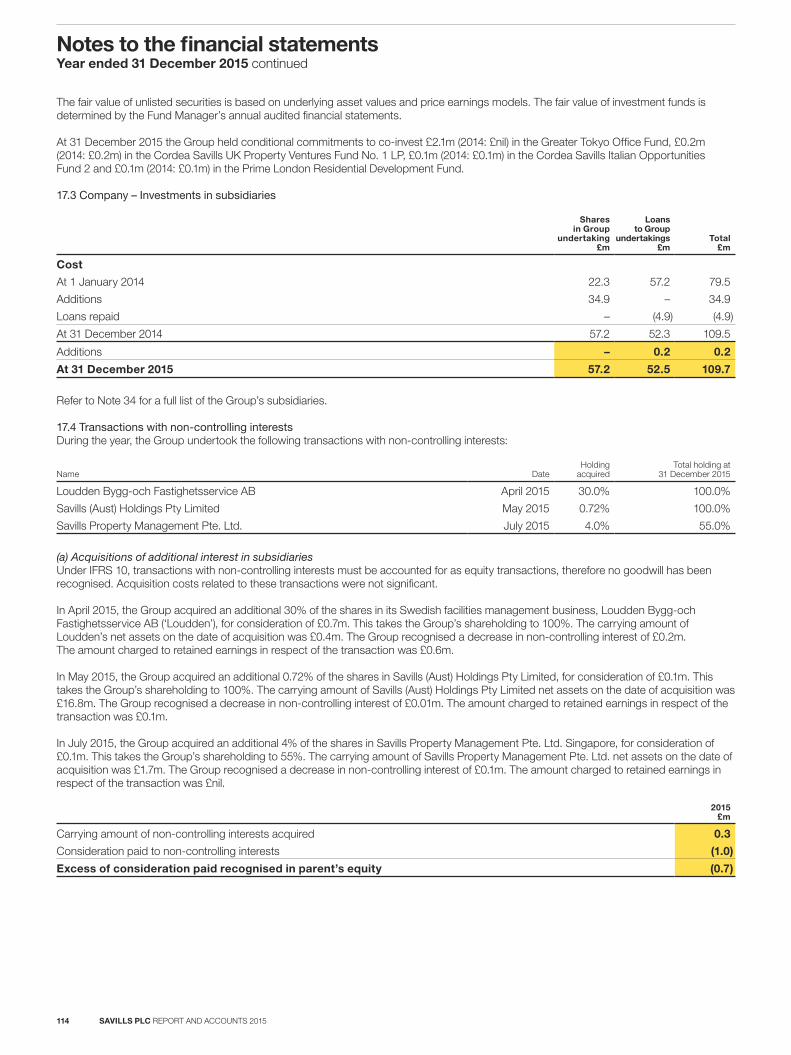
The fair value of unlisted securities is based on underlying asset values and price earnings models. The fair value of investment funds is determined by the Fund Manager’s annual audited financial statements.
At 31 December 2015 the Group held conditional commitments to co-invest £2.1m (2014: £nil) in the Greater Tokyo Office Fund, £0.2m (2014: £0.2m) in the Cordea Savills UK Property Ventures Fund No. 1 LP, £0.1m (2014: £0.1m) in the Cordea Savills Italian Opportunities Fund 2 and £0.1m (2014: £0.1m) in the Prime London Residential Development Fund.
17.3 Company – Investments in subsidiaries
Shares in Group
undertaking £m
Loans to Group
undertakings £m
Total £m
Cost
At 1 January 2014 22.3 57.2 79.5
Additions 34.9 – 34.9
Loans repaid – (4.9) (4.9)
At 31 December 2014 57.2 52.3 109.5
Additions – 0.2 0.2
At 31 December 2015 57.2 52.5 109.7
Refer to Note 34 for a full list of the Group’s subsidiaries.
17.4 Transactions with non-controlling interestsDuring the year, the Group undertook the following transactions with non-controlling interests:
Name DateHolding
acquiredTotal holding at
31 December 2015
Loudden Bygg-och Fastighetsservice AB April 2015 30.0% 100.0%
Savills (Aust) Holdings Pty Limited May 2015 0.72% 100.0%
Savills Property Management Pte. Ltd. July 2015 4.0% 55.0%
(a) Acquisitions of additional interest in subsidiariesUnder IFRS 10, transactions with non-controlling interests must be accounted for as equity transactions, therefore no goodwill has been recognised. Acquisition costs related to these transactions were not significant.
In April 2015, the Group acquired an additional 30% of the shares in its Swedish facilities management business, Loudden Bygg-och Fastighetsservice AB (‘Loudden’), for consideration of £0.7m. This takes the Group’s shareholding to 100%. The carrying amount of Loudden’s net assets on the date of acquisition was £0.4m. The Group recognised a decrease in non-controlling interest of £0.2m. The amount charged to retained earnings in respect of the transaction was £0.6m.
In May 2015, the Group acquired an additional 0.72% of the shares in Savills (Aust) Holdings Pty Limited, for consideration of £0.1m. This takes the Group’s shareholding to 100%. The carrying amount of Savills (Aust) Holdings Pty Limited net assets on the date of acquisition was £16.8m. The Group recognised a decrease in non-controlling interest of £0.01m. The amount charged to retained earnings in respect of the transaction was £0.1m.
In July 2015, the Group acquired an additional 4% of the shares in Savills Property Management Pte. Ltd. Singapore, for consideration of £0.1m. This takes the Group’s shareholding to 55%. The carrying amount of Savills Property Management Pte. Ltd. net assets on the date of acquisition was £1.7m. The Group recognised a decrease in non-controlling interest of £0.1m. The amount charged to retained earnings in respect of the transaction was £nil.
2015 £m
Carrying amount of non-controlling interests acquired 0.3
Consideration paid to non-controlling interests (1.0)
Excess of consideration paid recognised in parent’s equity (0.7)
SAVILLS PLC REPORT AND ACCOUNTS 2015114
Notes to the financial statementsYear ended 31 December 2015 continued
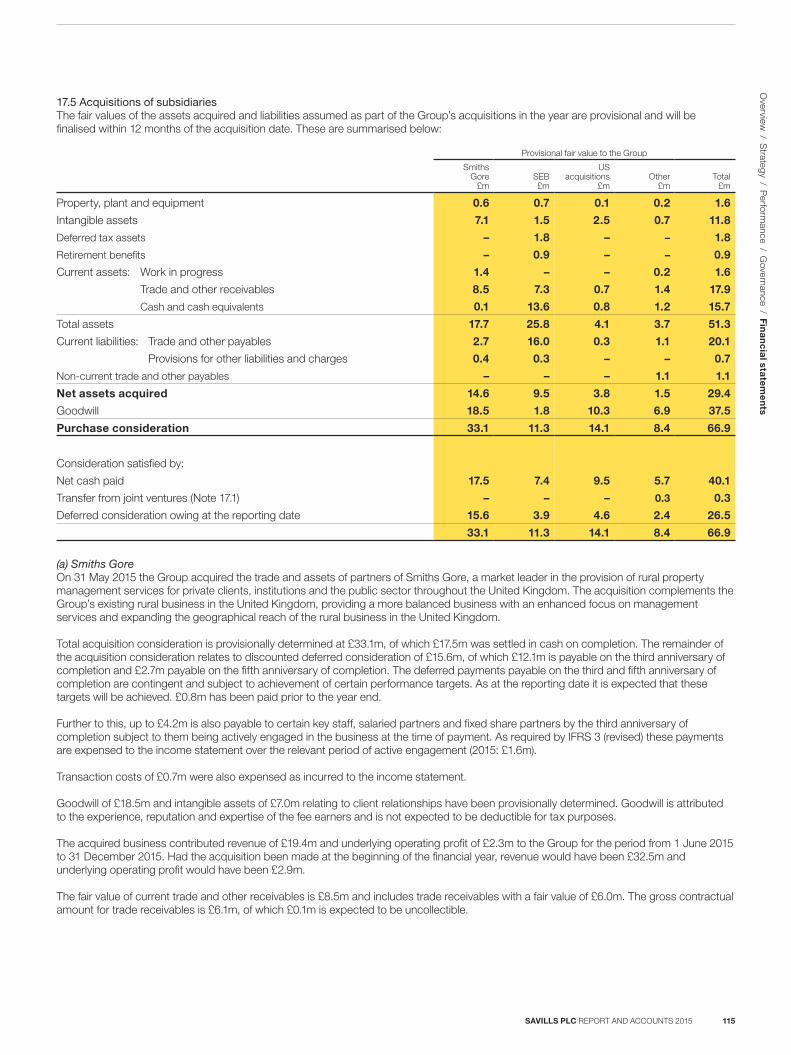
17.5 Acquisitions of subsidiariesThe fair values of the assets acquired and liabilities assumed as part of the Group’s acquisitions in the year are provisional and will be finalised within 12 months of the acquisition date. These are summarised below:
Provisional fair value to the Group
Smiths Gore
£mSEB £m
US acquisitions
£mOther
£mTotal
£m
Property, plant and equipment 0.6 0.7 0.1 0.2 1.6
Intangible assets 7.1 1.5 2.5 0.7 11.8
Deferred tax assets – 1.8 – – 1.8
Retirement benefits – 0.9 – – 0.9
Current assets: Work in progress 1.4 – – 0.2 1.6
Trade and other receivables 8.5 7.3 0.7 1.4 17.9
Cash and cash equivalents 0.1 13.6 0.8 1.2 15.7
Total assets 17.7 25.8 4.1 3.7 51.3
Current liabilities: Trade and other payables 2.7 16.0 0.3 1.1 20.1
Provisions for other liabilities and charges 0.4 0.3 – – 0.7
Non-current trade and other payables – – – 1.1 1.1
Net assets acquired 14.6 9.5 3.8 1.5 29.4
Goodwill 18.5 1.8 10.3 6.9 37.5
Purchase consideration 33.1 11.3 14.1 8.4 66.9
Consideration satisfied by:
Net cash paid 17.5 7.4 9.5 5.7 40.1
Transfer from joint ventures (Note 17.1) – – – 0.3 0.3
Deferred consideration owing at the reporting date 15.6 3.9 4.6 2.4 26.5
33.1 11.3 14.1 8.4 66.9
(a) Smiths GoreOn 31 May 2015 the Group acquired the trade and assets of partners of Smiths Gore, a market leader in the provision of rural property management services for private clients, institutions and the public sector throughout the United Kingdom. The acquisition complements the Group’s existing rural business in the United Kingdom, providing a more balanced business with an enhanced focus on management services and expanding the geographical reach of the rural business in the United Kingdom.
Total acquisition consideration is provisionally determined at £33.1m, of which £17.5m was settled in cash on completion. The remainder of the acquisition consideration relates to discounted deferred consideration of £15.6m, of which £12.1m is payable on the third anniversary of completion and £2.7m payable on the fifth anniversary of completion. The deferred payments payable on the third and fifth anniversary of completion are contingent and subject to achievement of certain performance targets. As at the reporting date it is expected that these targets will be achieved. £0.8m has been paid prior to the year end.
Further to this, up to £4.2m is also payable to certain key staff, salaried partners and fixed share partners by the third anniversary of completion subject to them being actively engaged in the business at the time of payment. As required by IFRS 3 (revised) these payments are expensed to the income statement over the relevant period of active engagement (2015: £1.6m).
Transaction costs of £0.7m were also expensed as incurred to the income statement.
Goodwill of £18.5m and intangible assets of £7.0m relating to client relationships have been provisionally determined. Goodwill is attributed to the experience, reputation and expertise of the fee earners and is not expected to be deductible for tax purposes.
The acquired business contributed revenue of £19.4m and underlying operating profit of £2.3m to the Group for the period from 1 June 2015 to 31 December 2015. Had the acquisition been made at the beginning of the financial year, revenue would have been £32.5m and underlying operating profit would have been £2.9m.
The fair value of current trade and other receivables is £8.5m and includes trade receivables with a fair value of £6.0m. The gross contractual amount for trade receivables is £6.1m, of which £0.1m is expected to be uncollectible.
SAVILLS PLC REPORT AND ACCOUNTS 2015 115
O
verview / S
trategy / Perform
ance / Governance / F
ina
nc
ial sta
tem
en
ts
(b) SEB Asset Management AG (‘SEB’)On 31 August 2015 the Group acquired 100% of the equity of SEB, an international real estate investment manager.
Total acquisition consideration is provisionally determined at £11.3m, of which £7.4m was settled in cash on completion. The remainder of the acquisition consideration relates to discounted deferred consideration of £3.9m which is payable on the second anniversary of completion.
Transaction and integration costs of £1.9m were also expensed as incurred to the income statement.
Goodwill of £1.8m and intangible assets of £0.9m relating to client relationships have been provisionally determined. Goodwill is attributed to the experience, reputation and expertise of the fee earners and is not expected to be deductible for tax purposes.
The acquired business contributed revenue of £16.8m and underlying operating profit of £6.5m to the Group for the period from 1 September 2015 to 31 December 2015. Had the acquisition been made at the beginning of the financial year, revenue would have been £35.2m and underlying operating profit would have been £8.7m.
The fair value of current trade and other receivables is £7.3m and includes trade receivables with a fair value of £5.4m. The gross contractual amount for trade receivables is £5.4m, all of which is expected to be collectible.
(c) US acquisitionsIn April 2015, the Group acquired 100% of the assets of the Cooper Brady Partnership, a leading commercial real estate services firm specialising in tenant representation in the Silicon Valley, California. The Group also acquired 100% of the equity of Vertical Integration, Inc. and KLG Advisors (Kelly Legan & Gerard, Inc.). Vertical Integration, Inc. provides full-service real estate solutions for corporate and government entities and KLG Advisors provides corporate real estate advisory services. These acquisitions significantly strengthen the Group’s Occupier Services offerings in the US.
Total acquisition consideration for these transactions is provisionally determined at £14.1m. Cash consideration payable on completion of these transactions amounted to £9.5m. Deferred consideration of up to £4.6m is payable in instalments by the third anniversary of completion, of which £0.8m is subject to achievement of certain revenue targets. As at the reporting date it is expected that these targets will be achieved.
Further to this, £2.7m is payable in instalments by the fourth anniversary of completion and is subject to certain employment conditions. As required by IFRS 3 (revised) these payments are expensed to the income statement over the relevant period of employment ( 2015: £0.7m).
Transaction costs of £0.4m were also expensed to the income statement.
Goodwill of £10.3m and intangible assets of £2.5m relating to the order backlog (£0.9m) and client contracts (£1.6m) has been provisionally determined. Goodwill is attributable to the experience, reputation and expertise of key staff and is not expected to be deductible for tax purposes.
The acquired businesses contributed revenue of £11.2m and underlying operating profit of £0.5m to the Group for the period from April 2015 to 31 December 2015. Had the acquisitions been made at the beginning of the financial year, revenue would have been £13.7m and underlying operating profit would have been £0.9m.
The fair value of current trade and other receivables is £0.7m and includes trade receivables with a fair value of £0.7m. The gross contractual amount for trade receivables is £0.7m, all of which is expected to be collectible.
(d) Other acquisitionsDuring the year, the Group also acquired 100% of Colliers & Madge plc, a London-based commercial property management business, Savills (Jersey) Ltd, a residential agency in Jersey, Ace Body Corporate Management Pte Ltd, a property management business in Singapore, Real Facilities Inc. and related companies, a full service commercial real estate firm committed exclusively to representing tenants in Toronto, Tagis B.V. and Tagis Property Management B.V., a project and property management business in the Netherlands, Savills Activos Adjudicados S.L., a property consultancy business in Spain and Savills High Street Retail S.L., an occupier services business in Spain.
The Group also acquired the trade and assets of Cordeau Marshall Pty Ltd, a residential agency in Australia and ProDirections Ltd., a project management consultancy in New Zealand.
Cash consideration for these transactions amounted to £5.7m. The remainder of the acquisition consideration relates deferred consideration of £2.4m, £1.5m of which is payable within one year of the reporting date.
A further £1.2m is subject to service conditions and will be expensed to the income statement over the period of service.
Transaction costs of £0.2m were also expensed as incurred to the income statement.
Goodwill of £6.9m and intangible assets of £0.7m relating to customer contracts have been provisionally determined. Goodwill is attributable to the experience and expertise of key staff and strong industry reputation and is not expected to be deductible for tax purposes.
The acquired businesses contributed revenue of £5.9m and underlying operating profit of £0.8m to the Group for the period from acquisition to 31 December 2015. Had the acquisitions been made at the beginning of the financial year, revenue would have been £11.1m and underlying operating profit would have been £1.5m.
SAVILLS PLC REPORT AND ACCOUNTS 2015116
Notes to the financial statementsYear ended 31 December 2015 continued
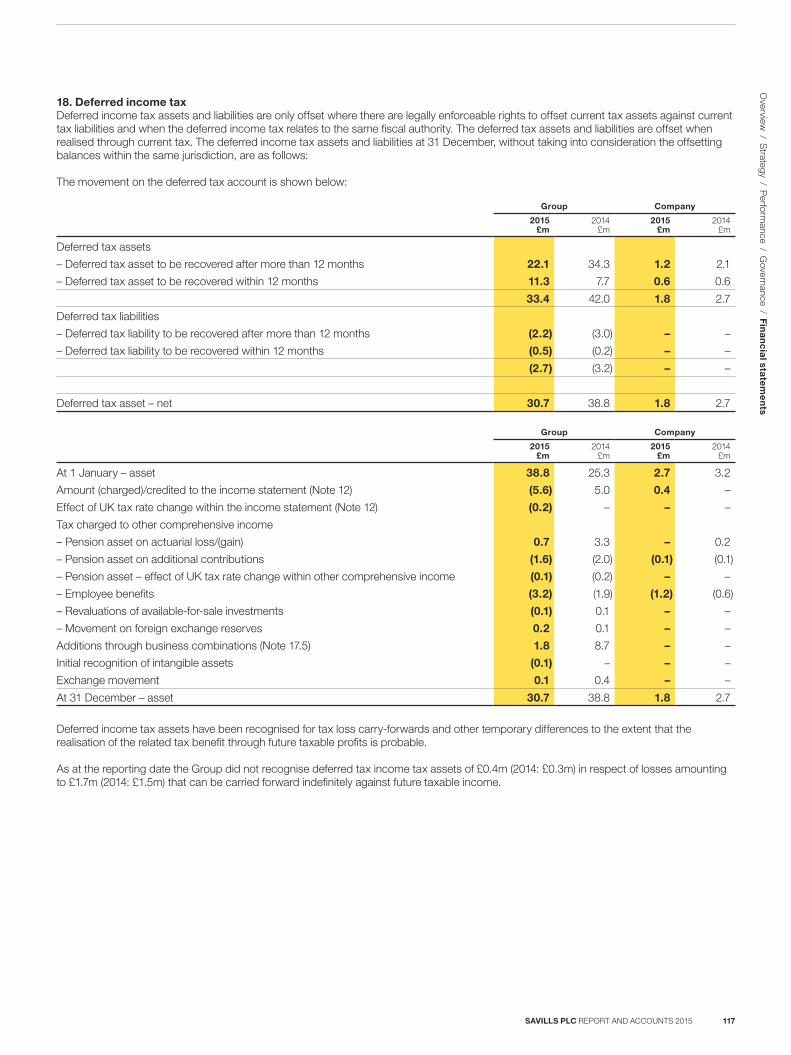
18. Deferred income taxDeferred income tax assets and liabilities are only offset where there are legally enforceable rights to offset current tax assets against current tax liabilities and when the deferred income tax relates to the same fiscal authority. The deferred tax assets and liabilities are offset when realised through current tax. The deferred income tax assets and liabilities at 31 December, without taking into consideration the offsetting balances within the same jurisdiction, are as follows:
The movement on the deferred tax account is shown below:
Group Company
2015 £m
2014 £m
2015 £m
2014 £m
Deferred tax assets
– Deferred tax asset to be recovered after more than 12 months 22.1 34.3 1.2 2.1
– Deferred tax asset to be recovered within 12 months 11.3 7.7 0.6 0.6
33.4 42.0 1.8 2.7
Deferred tax liabilities
– Deferred tax liability to be recovered after more than 12 months (2.2) (3.0) – –
– Deferred tax liability to be recovered within 12 months (0.5) (0.2) – –
(2.7) (3.2) – –
Deferred tax asset – net 30.7 38.8 1.8 2.7
Group Company
2015£m
2014£m
2015£m
2014£m
At 1 January – asset 38.8 25.3 2.7 3.2
Amount (charged)/credited to the income statement (Note 12) (5.6) 5.0 0.4 –
Effect of UK tax rate change within the income statement (Note 12) (0.2) – – –
Tax charged to other comprehensive income
– Pension asset on actuarial loss/(gain) 0.7 3.3 – 0.2
– Pension asset on additional contributions (1.6) (2.0) (0.1) (0.1)
– Pension asset – effect of UK tax rate change within other comprehensive income (0.1) (0.2) – –
– Employee benefits (3.2) (1.9) (1.2) (0.6)
– Revaluations of available-for-sale investments (0.1) 0.1 – –
– Movement on foreign exchange reserves 0.2 0.1 – –
Additions through business combinations (Note 17.5) 1.8 8.7 – –
Initial recognition of intangible assets (0.1) – – –
Exchange movement 0.1 0.4 – –
At 31 December – asset 30.7 38.8 1.8 2.7
Deferred income tax assets have been recognised for tax loss carry-forwards and other temporary differences to the extent that the realisation of the related tax benefit through future taxable profits is probable.
As at the reporting date the Group did not recognise deferred tax income tax assets of £0.4m (2014: £0.3m) in respect of losses amounting to £1.7m (2014: £1.5m) that can be carried forward indefinitely against future taxable income.
SAVILLS PLC REPORT AND ACCOUNTS 2015 117
O
verview / S
trategy / Perform
ance / Governance / F
ina
nc
ial sta
tem
en
ts
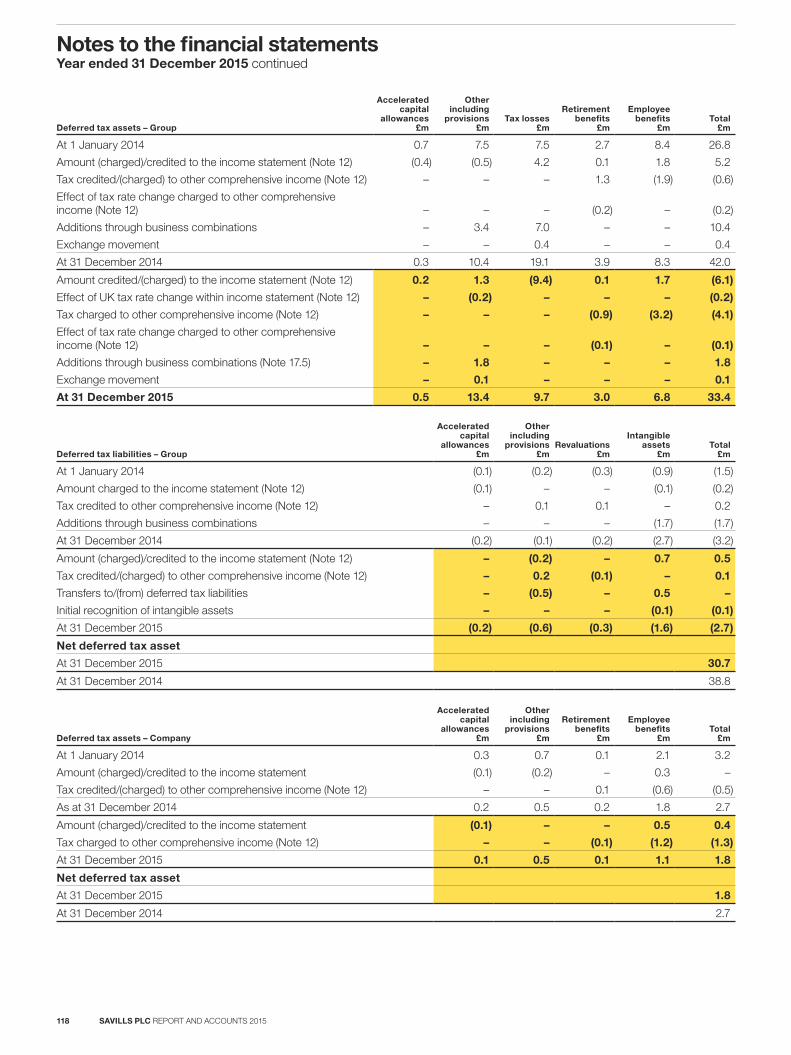
Deferred tax assets – Group
Accelerated capital
allowances £m
Other including
provisions £m
Tax losses £m
Retirement benefits
£m
Employee benefits
£m Total
£m
At 1 January 2014 0.7 7.5 7.5 2.7 8.4 26.8
Amount (charged)/credited to the income statement (Note 12) (0.4) (0.5) 4.2 0.1 1.8 5.2
Tax credited/(charged) to other comprehensive income (Note 12) – – – 1.3 (1.9) (0.6)
Effect of tax rate change charged to other comprehensive income (Note 12) – – – (0.2) – (0.2)
Additions through business combinations – 3.4 7.0 – – 10.4
Exchange movement – – 0.4 – – 0.4
At 31 December 2014 0.3 10.4 19.1 3.9 8.3 42.0
Amount credited/(charged) to the income statement (Note 12) 0.2 1.3 (9.4) 0.1 1.7 (6.1)
Effect of UK tax rate change within income statement (Note 12) – (0.2) – – – (0.2)
Tax charged to other comprehensive income (Note 12) – – – (0.9) (3.2) (4.1)
Effect of tax rate change charged to other comprehensive income (Note 12) – – – (0.1) – (0.1)
Additions through business combinations (Note 17.5) – 1.8 – – – 1.8
Exchange movement – 0.1 – – – 0.1
At 31 December 2015 0.5 13.4 9.7 3.0 6.8 33.4
Deferred tax liabilities – Group
Accelerated capital
allowances £m
Other including
provisions £m
Revaluations £m
Intangible assets
£mTotal
£m
At 1 January 2014 (0.1) (0.2) (0.3) (0.9) (1.5)
Amount charged to the income statement (Note 12) (0.1) – – (0.1) (0.2)
Tax credited to other comprehensive income (Note 12) – 0.1 0.1 – 0.2
Additions through business combinations – – – (1.7) (1.7)
At 31 December 2014 (0.2) (0.1) (0.2) (2.7) (3.2)
Amount (charged)/credited to the income statement (Note 12) – (0.2) – 0.7 0.5
Tax credited/(charged) to other comprehensive income (Note 12) – 0.2 (0.1) – 0.1
Transfers to/(from) deferred tax liabilities – (0.5) – 0.5 –
Initial recognition of intangible assets – – – (0.1) (0.1)
At 31 December 2015 (0.2) (0.6) (0.3) (1.6) (2.7)
Net deferred tax asset
At 31 December 2015 30.7
At 31 December 2014 38.8
Deferred tax assets – Company
Accelerated capital
allowances £m
Other including
provisions £m
Retirement benefits
£m
Employee benefits
£m Total
£m
At 1 January 2014 0.3 0.7 0.1 2.1 3.2
Amount (charged)/credited to the income statement (0.1) (0.2) – 0.3 –
Tax credited/(charged) to other comprehensive income (Note 12) – – 0.1 (0.6) (0.5)
As at 31 December 2014 0.2 0.5 0.2 1.8 2.7
Amount (charged)/credited to the income statement (0.1) – – 0.5 0.4
Tax charged to other comprehensive income (Note 12) – – (0.1) (1.2) (1.3)
At 31 December 2015 0.1 0.5 0.1 1.1 1.8
Net deferred tax asset
At 31 December 2015 1.8
At 31 December 2014 2.7
SAVILLS PLC REPORT AND ACCOUNTS 2015118
Notes to the financial statementsYear ended 31 December 2015 continued
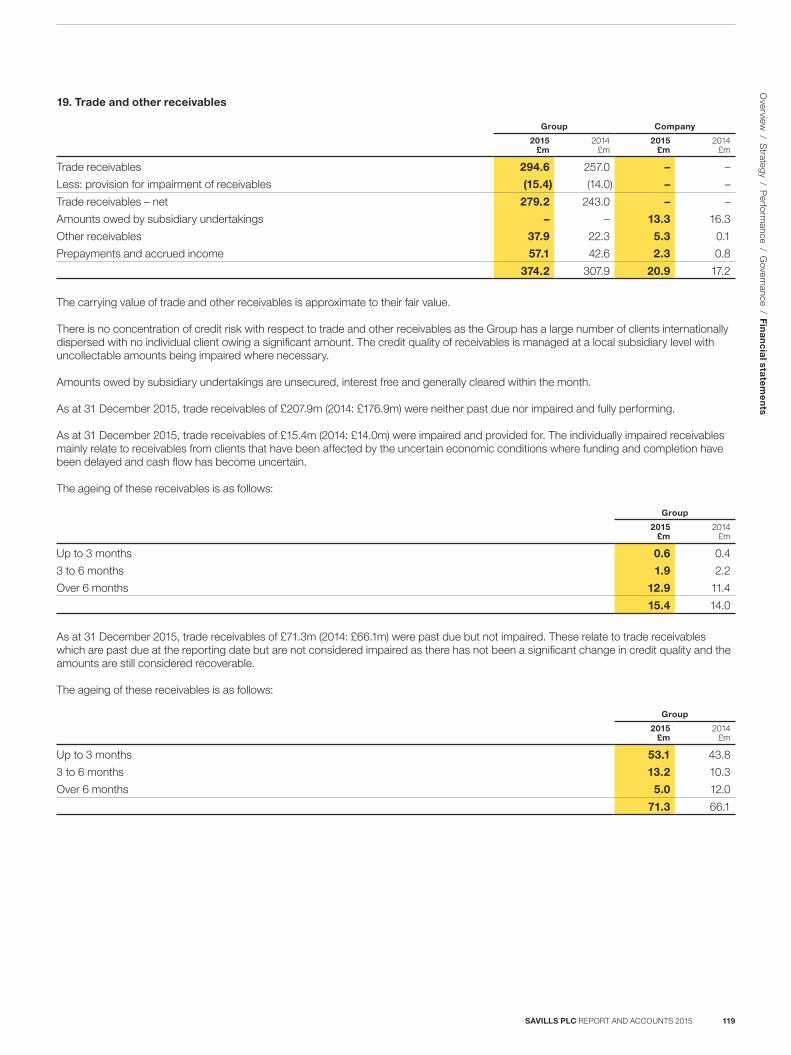
19. Trade and other receivables
Group Company
2015 £m
2014 £m
2015 £m
2014 £m
Trade receivables 294.6 257.0 – –
Less: provision for impairment of receivables (15.4) (14.0) – –
Trade receivables – net 279.2 243.0 – –
Amounts owed by subsidiary undertakings – – 13.3 16.3
Other receivables 37.9 22.3 5.3 0.1
Prepayments and accrued income 57.1 42.6 2.3 0.8
374.2 307.9 20.9 17.2
The carrying value of trade and other receivables is approximate to their fair value.
There is no concentration of credit risk with respect to trade and other receivables as the Group has a large number of clients internationally dispersed with no individual client owing a significant amount. The credit quality of receivables is managed at a local subsidiary level with uncollectable amounts being impaired where necessary.
Amounts owed by subsidiary undertakings are unsecured, interest free and generally cleared within the month.
As at 31 December 2015, trade receivables of £207.9m (2014: £176.9m) were neither past due nor impaired and fully performing.
As at 31 December 2015, trade receivables of £15.4m (2014: £14.0m) were impaired and provided for. The individually impaired receivables mainly relate to receivables from clients that have been affected by the uncertain economic conditions where funding and completion have been delayed and cash flow has become uncertain.
The ageing of these receivables is as follows:
Group
2015 £m
2014 £m
Up to 3 months 0.6 0.4
3 to 6 months 1.9 2.2
Over 6 months 12.9 11.4
15.4 14.0
As at 31 December 2015, trade receivables of £71.3m (2014: £66.1m) were past due but not impaired. These relate to trade receivables which are past due at the reporting date but are not considered impaired as there has not been a significant change in credit quality and the amounts are still considered recoverable.
The ageing of these receivables is as follows:
Group
2015 £m
2014 £m
Up to 3 months 53.1 43.8
3 to 6 months 13.2 10.3
Over 6 months 5.0 12.0
71.3 66.1
SAVILLS PLC REPORT AND ACCOUNTS 2015 119
O
verview / S
trategy / Perform
ance / Governance / F
ina
nc
ial sta
tem
en
ts
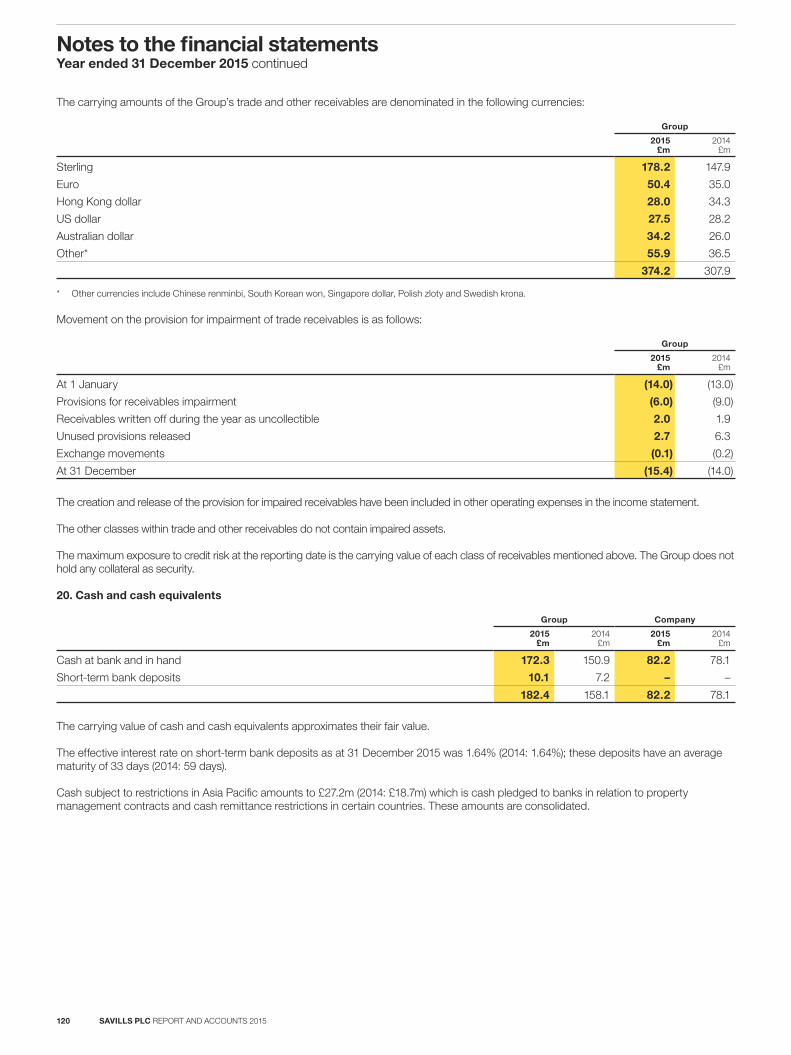
The carrying amounts of the Group’s trade and other receivables are denominated in the following currencies:
Group
2015 £m
2014 £m
Sterling 178.2 147.9
Euro 50.4 35.0
Hong Kong dollar 28.0 34.3
US dollar 27.5 28.2
Australian dollar 34.2 26.0
Other* 55.9 36.5
374.2 307.9
* Other currencies include Chinese renminbi, South Korean won, Singapore dollar, Polish zloty and Swedish krona.
Movement on the provision for impairment of trade receivables is as follows:
Group
2015 £m
2014 £m
At 1 January (14.0) (13.0)
Provisions for receivables impairment (6.0) (9.0)
Receivables written off during the year as uncollectible 2.0 1.9
Unused provisions released 2.7 6.3
Exchange movements (0.1) (0.2)
At 31 December (15.4) (14.0)
The creation and release of the provision for impaired receivables have been included in other operating expenses in the income statement.
The other classes within trade and other receivables do not contain impaired assets.
The maximum exposure to credit risk at the reporting date is the carrying value of each class of receivables mentioned above. The Group does not hold any collateral as security.
20. Cash and cash equivalents
Group Company
2015 £m
2014 £m
2015 £m
2014 £m
Cash at bank and in hand 172.3 150.9 82.2 78.1
Short-term bank deposits 10.1 7.2 – –
182.4 158.1 82.2 78.1
The carrying value of cash and cash equivalents approximates their fair value.
The effective interest rate on short-term bank deposits as at 31 December 2015 was 1.64% (2014: 1.64%); these deposits have an average maturity of 33 days (2014: 59 days).
Cash subject to restrictions in Asia Pacific amounts to £27.2m (2014: £18.7m) which is cash pledged to banks in relation to property management contracts and cash remittance restrictions in certain countries. These amounts are consolidated.
SAVILLS PLC REPORT AND ACCOUNTS 2015120
Notes to the financial statementsYear ended 31 December 2015 continued
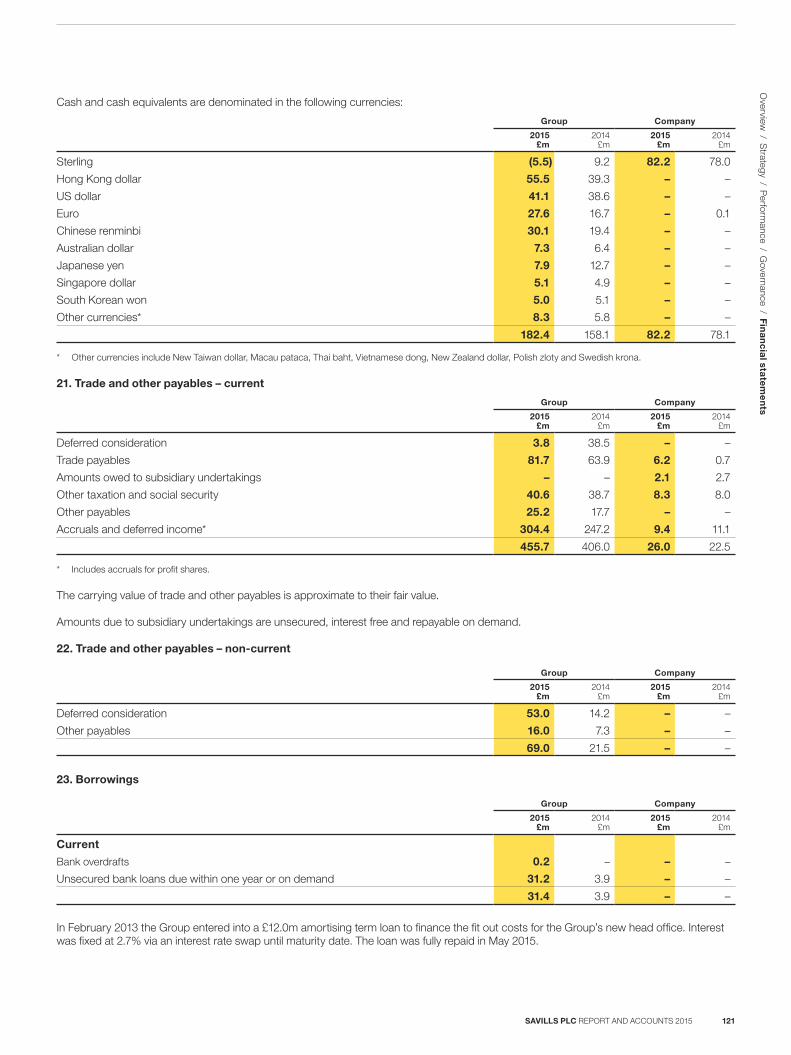
Cash and cash equivalents are denominated in the following currencies:
Group Company
2015 £m
2014 £m
2015 £m
2014 £m
Sterling (5.5) 9.2 82.2 78.0
Hong Kong dollar 55.5 39.3 – –
US dollar 41.1 38.6 – –
Euro 27.6 16.7 – 0.1
Chinese renminbi 30.1 19.4 – –
Australian dollar 7.3 6.4 – –
Japanese yen 7.9 12.7 – –
Singapore dollar 5.1 4.9 – –
South Korean won 5.0 5.1 – –
Other currencies* 8.3 5.8 – –
182.4 158.1 82.2 78.1
* Other currencies include New Taiwan dollar, Macau pataca, Thai baht, Vietnamese dong, New Zealand dollar, Polish zloty and Swedish krona.
21. Trade and other payables – current
Group Company
2015 £m
2014 £m
2015 £m
2014 £m
Deferred consideration 3.8 38.5 – –
Trade payables 81.7 63.9 6.2 0.7
Amounts owed to subsidiary undertakings – – 2.1 2.7
Other taxation and social security 40.6 38.7 8.3 8.0
Other payables 25.2 17.7 – –
Accruals and deferred income* 304.4 247.2 9.4 11.1
455.7 406.0 26.0 22.5
* Includes accruals for profit shares.
The carrying value of trade and other payables is approximate to their fair value.
Amounts due to subsidiary undertakings are unsecured, interest free and repayable on demand.
22. Trade and other payables – non-current
Group Company
2015 £m
2014 £m
2015 £m
2014 £m
Deferred consideration 53.0 14.2 – –
Other payables 16.0 7.3 – –
69.0 21.5 – –
23. Borrowings
Group Company
2015 £m
2014 £m
2015 £m
2014 £m
Current
Bank overdrafts 0.2 – – –
Unsecured bank loans due within one year or on demand 31.2 3.9 – –
31.4 3.9 – –
In February 2013 the Group entered into a £12.0m amortising term loan to finance the fit out costs for the Group’s new head office. Interest was fixed at 2.7% via an interest rate swap until maturity date. The loan was fully repaid in May 2015.
SAVILLS PLC REPORT AND ACCOUNTS 2015 121
O
verview / S
trategy / Perform
ance / Governance / F
ina
nc
ial sta
tem
en
ts
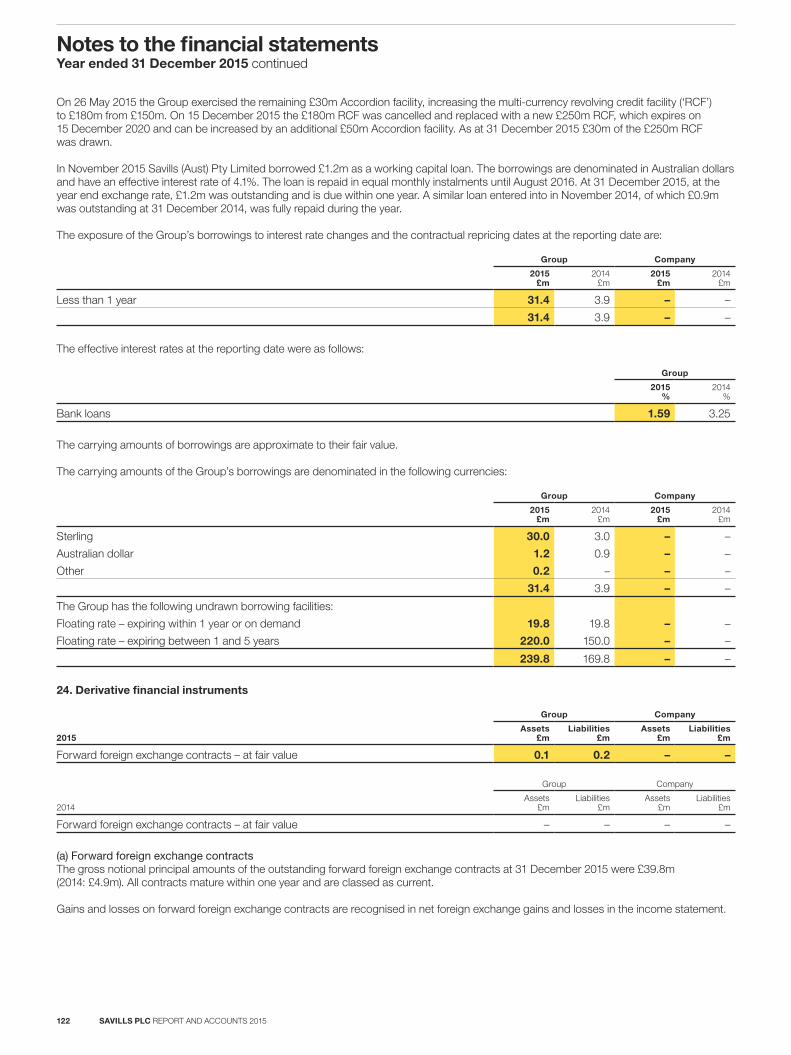
On 26 May 2015 the Group exercised the remaining £30m Accordion facility, increasing the multi-currency revolving credit facility (‘RCF’) to £180m from £150m. On 15 December 2015 the £180m RCF was cancelled and replaced with a new £250m RCF, which expires on 15 December 2020 and can be increased by an additional £50m Accordion facility. As at 31 December 2015 £30m of the £250m RCF was drawn.
In November 2015 Savills (Aust) Pty Limited borrowed £1.2m as a working capital loan. The borrowings are denominated in Australian dollars and have an effective interest rate of 4.1%. The loan is repaid in equal monthly instalments until August 2016. At 31 December 2015, at the year end exchange rate, £1.2m was outstanding and is due within one year. A similar loan entered into in November 2014, of which £0.9m was outstanding at 31 December 2014, was fully repaid during the year.
The exposure of the Group’s borrowings to interest rate changes and the contractual repricing dates at the reporting date are:
Group Company
2015 £m
2014 £m
2015 £m
2014 £m
Less than 1 year 31.4 3.9 – –
31.4 3.9 – –
The effective interest rates at the reporting date were as follows:
Group
2015 %
2014 %
Bank loans 1.59 3.25
The carrying amounts of borrowings are approximate to their fair value.
The carrying amounts of the Group’s borrowings are denominated in the following currencies:
Group Company
2015 £m
2014 £m
2015 £m
2014 £m
Sterling 30.0 3.0 – –
Australian dollar 1.2 0.9 – –
Other 0.2 – – –
31.4 3.9 – –
The Group has the following undrawn borrowing facilities:
Floating rate – expiring within 1 year or on demand 19.8 19.8 – –
Floating rate – expiring between 1 and 5 years 220.0 150.0 – –
239.8 169.8 – –
24. Derivative financial instruments
2015
Group Company
Assets £m
Liabilities £m
Assets £m
Liabilities £m
Forward foreign exchange contracts – at fair value 0.1 0.2 – –
2014
Group Company
Assets £m
Liabilities £m
Assets £m
Liabilities £m
Forward foreign exchange contracts – at fair value – – – –
(a) Forward foreign exchange contractsThe gross notional principal amounts of the outstanding forward foreign exchange contracts at 31 December 2015 were £39.8m (2014: £4.9m). All contracts mature within one year and are classed as current.
Gains and losses on forward foreign exchange contracts are recognised in net foreign exchange gains and losses in the income statement.
SAVILLS PLC REPORT AND ACCOUNTS 2015122
Notes to the financial statementsYear ended 31 December 2015 continued
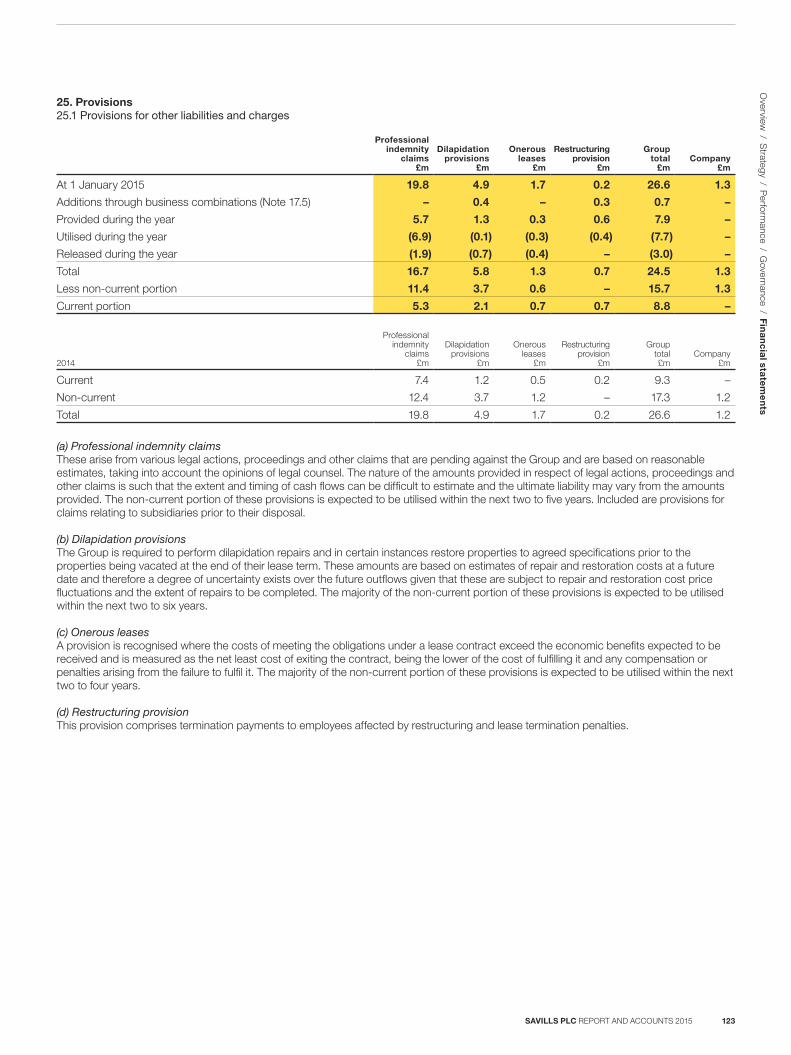
25. Provisions25.1 Provisions for other liabilities and charges
Professional indemnity
claims £m
Dilapidation provisions
£m
Onerous leases
£m
Restructuring provision
£m
Group total
£mCompany
£m
At 1 January 2015 19.8 4.9 1.7 0.2 26.6 1.3
Additions through business combinations (Note 17.5) – 0.4 – 0.3 0.7 –
Provided during the year 5.7 1.3 0.3 0.6 7.9 –
Utilised during the year (6.9) (0.1) (0.3) (0.4) (7.7) –
Released during the year (1.9) (0.7) (0.4) – (3.0) –
Total 16.7 5.8 1.3 0.7 24.5 1.3
Less non-current portion 11.4 3.7 0.6 – 15.7 1.3
Current portion 5.3 2.1 0.7 0.7 8.8 –
2014
Professional indemnity
claims £m
Dilapidation provisions
£m
Onerous leases
£m
Restructuring provision
£m
Group total £m
Company £m
Current 7.4 1.2 0.5 0.2 9.3 –
Non-current 12.4 3.7 1.2 – 17.3 1.2
Total 19.8 4.9 1.7 0.2 26.6 1.2
(a) Professional indemnity claimsThese arise from various legal actions, proceedings and other claims that are pending against the Group and are based on reasonable estimates, taking into account the opinions of legal counsel. The nature of the amounts provided in respect of legal actions, proceedings and other claims is such that the extent and timing of cash flows can be difficult to estimate and the ultimate liability may vary from the amounts provided. The non-current portion of these provisions is expected to be utilised within the next two to five years. Included are provisions for claims relating to subsidiaries prior to their disposal.
(b) Dilapidation provisionsThe Group is required to perform dilapidation repairs and in certain instances restore properties to agreed specifications prior to the properties being vacated at the end of their lease term. These amounts are based on estimates of repair and restoration costs at a future date and therefore a degree of uncertainty exists over the future outflows given that these are subject to repair and restoration cost price fluctuations and the extent of repairs to be completed. The majority of the non-current portion of these provisions is expected to be utilised within the next two to six years.
(c) Onerous leasesA provision is recognised where the costs of meeting the obligations under a lease contract exceed the economic benefits expected to be received and is measured as the net least cost of exiting the contract, being the lower of the cost of fulfilling it and any compensation or penalties arising from the failure to fulfil it. The majority of the non-current portion of these provisions is expected to be utilised within the next two to four years.
(d) Restructuring provisionThis provision comprises termination payments to employees affected by restructuring and lease termination penalties.
SAVILLS PLC REPORT AND ACCOUNTS 2015 123
O
verview / S
trategy / Perform
ance / Governance / F
ina
nc
ial sta
tem
en
ts
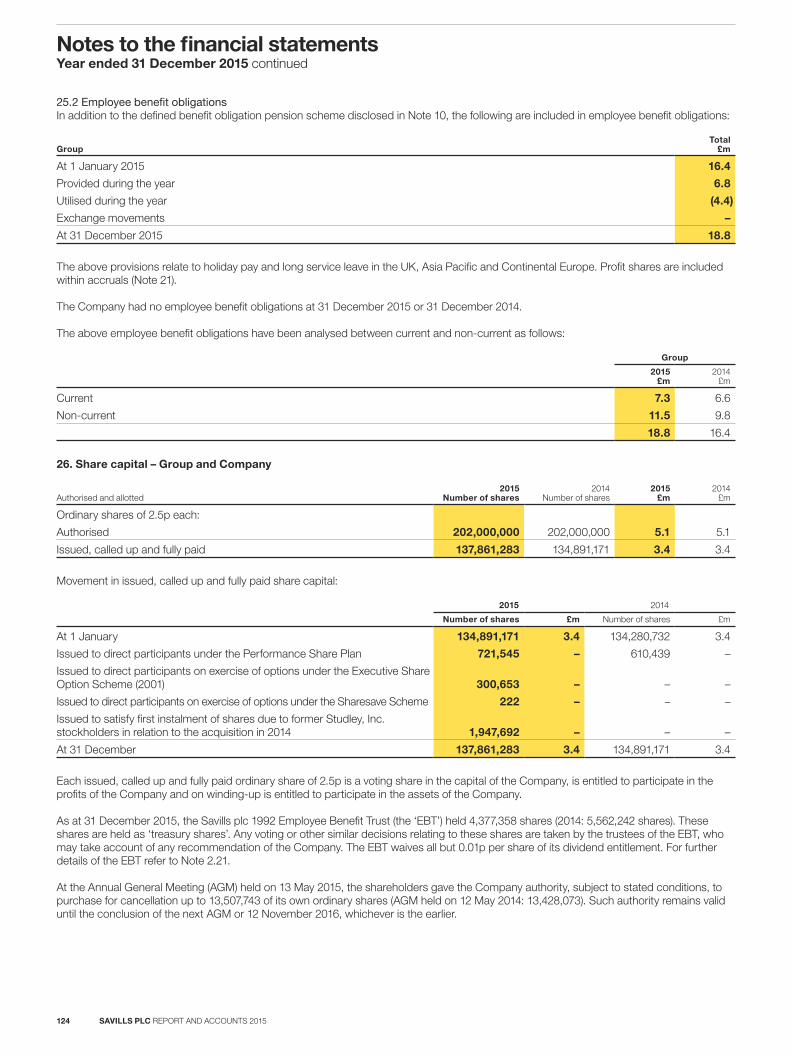
25.2 Employee benefit obligationsIn addition to the defined benefit obligation pension scheme disclosed in Note 10, the following are included in employee benefit obligations:
GroupTotal
£m
At 1 January 2015 16.4
Provided during the year 6.8
Utilised during the year (4.4)
Exchange movements –
At 31 December 2015 18.8
The above provisions relate to holiday pay and long service leave in the UK, Asia Pacific and Continental Europe. Profit shares are included within accruals (Note 21).
The Company had no employee benefit obligations at 31 December 2015 or 31 December 2014. The above employee benefit obligations have been analysed between current and non-current as follows:
Group
2015 £m
2014 £m
Current 7.3 6.6
Non-current 11.5 9.8
18.8 16.4
26. Share capital – Group and Company
Authorised and allotted2015
Number of shares2014
Number of shares2015
£m2014
£m
Ordinary shares of 2.5p each:
Authorised 202,000,000 202,000,000 5.1 5.1
Issued, called up and fully paid 137,861,283 134,891,171 3.4 3.4
Movement in issued, called up and fully paid share capital:
2015 2014
Number of shares £m Number of shares £m
At 1 January 134,891,171 3.4 134,280,732 3.4
Issued to direct participants under the Performance Share Plan 721,545 – 610,439 –
Issued to direct participants on exercise of options under the Executive Share Option Scheme (2001) 300,653 – – –
Issued to direct participants on exercise of options under the Sharesave Scheme 222 – – –
Issued to satisfy first instalment of shares due to former Studley, Inc. stockholders in relation to the acquisition in 2014 1,947,692 – – –
At 31 December 137,861,283 3.4 134,891,171 3.4
Each issued, called up and fully paid ordinary share of 2.5p is a voting share in the capital of the Company, is entitled to participate in the profits of the Company and on winding-up is entitled to participate in the assets of the Company.
As at 31 December 2015, the Savills plc 1992 Employee Benefit Trust (the ‘EBT’) held 4,377,358 shares (2014: 5,562,242 shares). These shares are held as ‘treasury shares’. Any voting or other similar decisions relating to these shares are taken by the trustees of the EBT, who may take account of any recommendation of the Company. The EBT waives all but 0.01p per share of its dividend entitlement. For further details of the EBT refer to Note 2.21.
At the Annual General Meeting (AGM) held on 13 May 2015, the shareholders gave the Company authority, subject to stated conditions, to purchase for cancellation up to 13,507,743 of its own ordinary shares (AGM held on 12 May 2014: 13,428,073). Such authority remains valid until the conclusion of the next AGM or 12 November 2016, whichever is the earlier.
SAVILLS PLC REPORT AND ACCOUNTS 2015124
Notes to the financial statementsYear ended 31 December 2015 continued
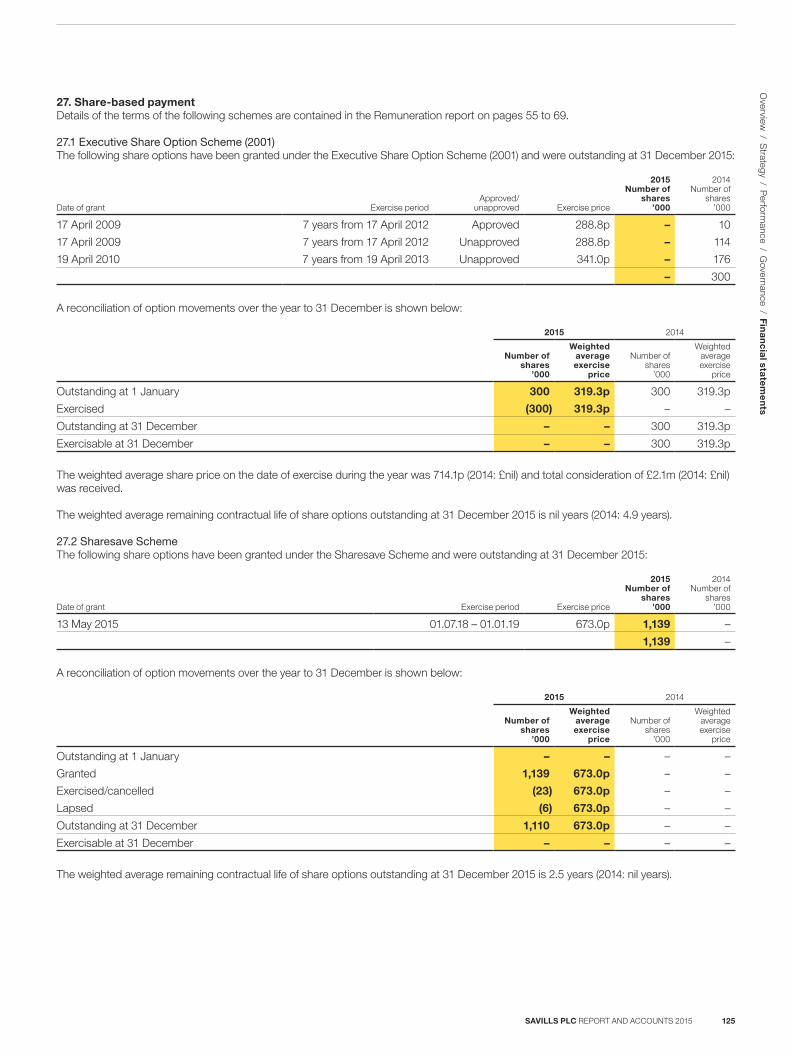
27. Share-based paymentDetails of the terms of the following schemes are contained in the Remuneration report on pages 55 to 69.
27.1 Executive Share Option Scheme (2001)The following share options have been granted under the Executive Share Option Scheme (2001) and were outstanding at 31 December 2015:
Date of grant Exercise periodApproved/
unapproved Exercise price
2015 Number of
shares ’000
2014 Number of
shares ’000
17 April 2009 7 years from 17 April 2012 Approved 288.8p – 10
17 April 2009 7 years from 17 April 2012 Unapproved 288.8p – 114
19 April 2010 7 years from 19 April 2013 Unapproved 341.0p – 176
– 300
A reconciliation of option movements over the year to 31 December is shown below:
2015 2014
Number of shares
’000
Weighted average exercise
price
Number of shares
’000
Weighted average exercise
price
Outstanding at 1 January 300 319.3p 300 319.3p
Exercised (300) 319.3p – –
Outstanding at 31 December – – 300 319.3p
Exercisable at 31 December – – 300 319.3p
The weighted average share price on the date of exercise during the year was 714.1p (2014: £nil) and total consideration of £2.1m (2014: £nil) was received.
The weighted average remaining contractual life of share options outstanding at 31 December 2015 is nil years (2014: 4.9 years).
27.2 Sharesave SchemeThe following share options have been granted under the Sharesave Scheme and were outstanding at 31 December 2015:
Date of grant Exercise period Exercise price
2015 Number of
shares ’000
2014 Number of
shares ’000
13 May 2015 01.07.18 – 01.01.19 673.0p 1,139 –
1,139 –
A reconciliation of option movements over the year to 31 December is shown below:
2015 2014
Number of shares
’000
Weighted average exercise
price
Number of shares
’000
Weighted average exercise
price
Outstanding at 1 January – – – –
Granted 1,139 673.0p – –
Exercised/cancelled (23) 673.0p – –
Lapsed (6) 673.0p – –
Outstanding at 31 December 1,110 673.0p – –
Exercisable at 31 December – – – –
The weighted average remaining contractual life of share options outstanding at 31 December 2015 is 2.5 years (2014: nil years).
SAVILLS PLC REPORT AND ACCOUNTS 2015 125
O
verview / S
trategy / Perform
ance / Governance / F
ina
nc
ial sta
tem
en
ts
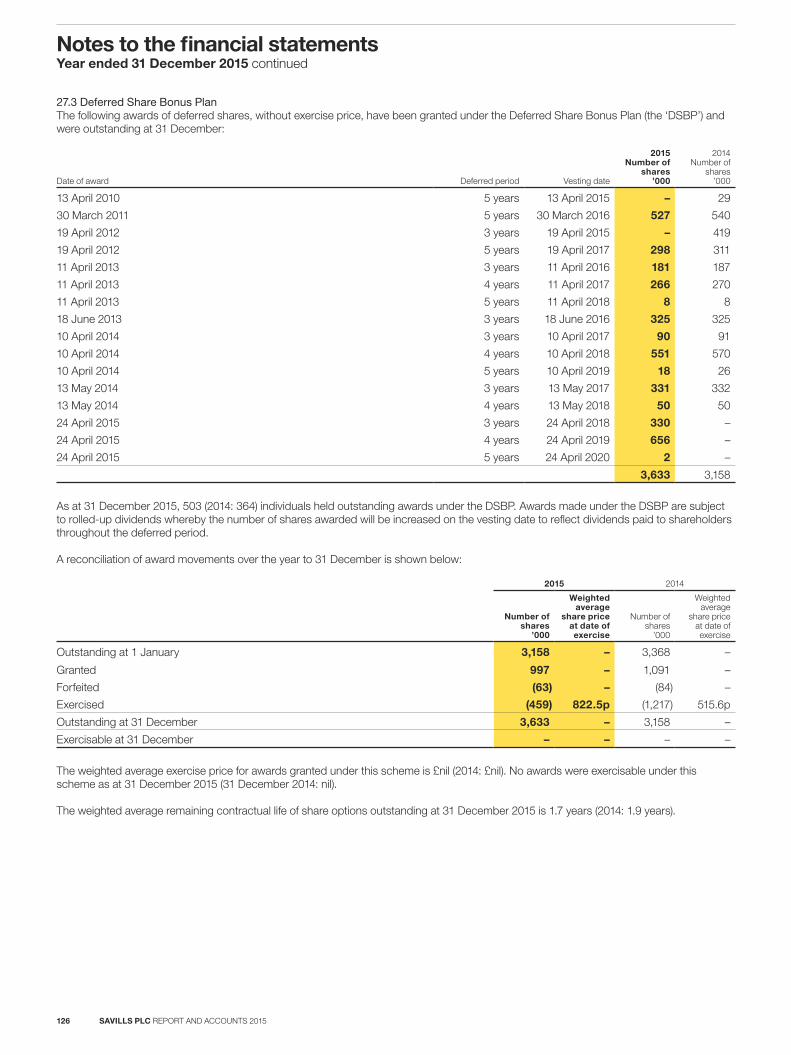
27.3 Deferred Share Bonus PlanThe following awards of deferred shares, without exercise price, have been granted under the Deferred Share Bonus Plan (the ‘DSBP’) and were outstanding at 31 December:
Date of award Deferred period Vesting date
2015 Number of
shares ’000
2014 Number of
shares ’000
13 April 2010 5 years 13 April 2015 – 29
30 March 2011 5 years 30 March 2016 527 540
19 April 2012 3 years 19 April 2015 – 419
19 April 2012 5 years 19 April 2017 298 311
11 April 2013 3 years 11 April 2016 181 187
11 April 2013 4 years 11 April 2017 266 270
11 April 2013 5 years 11 April 2018 8 8
18 June 2013 3 years 18 June 2016 325 325
10 April 2014 3 years 10 April 2017 90 91
10 April 2014 4 years 10 April 2018 551 570
10 April 2014 5 years 10 April 2019 18 26
13 May 2014 3 years 13 May 2017 331 332
13 May 2014 4 years 13 May 2018 50 50
24 April 2015 3 years 24 April 2018 330 –
24 April 2015 4 years 24 April 2019 656 –
24 April 2015 5 years 24 April 2020 2 –
3,633 3,158
As at 31 December 2015, 503 (2014: 364) individuals held outstanding awards under the DSBP. Awards made under the DSBP are subject to rolled-up dividends whereby the number of shares awarded will be increased on the vesting date to reflect dividends paid to shareholders throughout the deferred period.
A reconciliation of award movements over the year to 31 December is shown below:
2015 2014
Number of shares
’000
Weighted average
share price at date of exercise
Number of shares
’000
Weighted average
share price at date of exercise
Outstanding at 1 January 3,158 – 3,368 –
Granted 997 – 1,091 –
Forfeited (63) – (84) –
Exercised (459) 822.5p (1,217) 515.6p
Outstanding at 31 December 3,633 – 3,158 –
Exercisable at 31 December – – – –
The weighted average exercise price for awards granted under this scheme is £nil (2014: £nil). No awards were exercisable under this scheme as at 31 December 2015 (31 December 2014: nil).
The weighted average remaining contractual life of share options outstanding at 31 December 2015 is 1.7 years (2014: 1.9 years).
SAVILLS PLC REPORT AND ACCOUNTS 2015126
Notes to the financial statementsYear ended 31 December 2015 continued
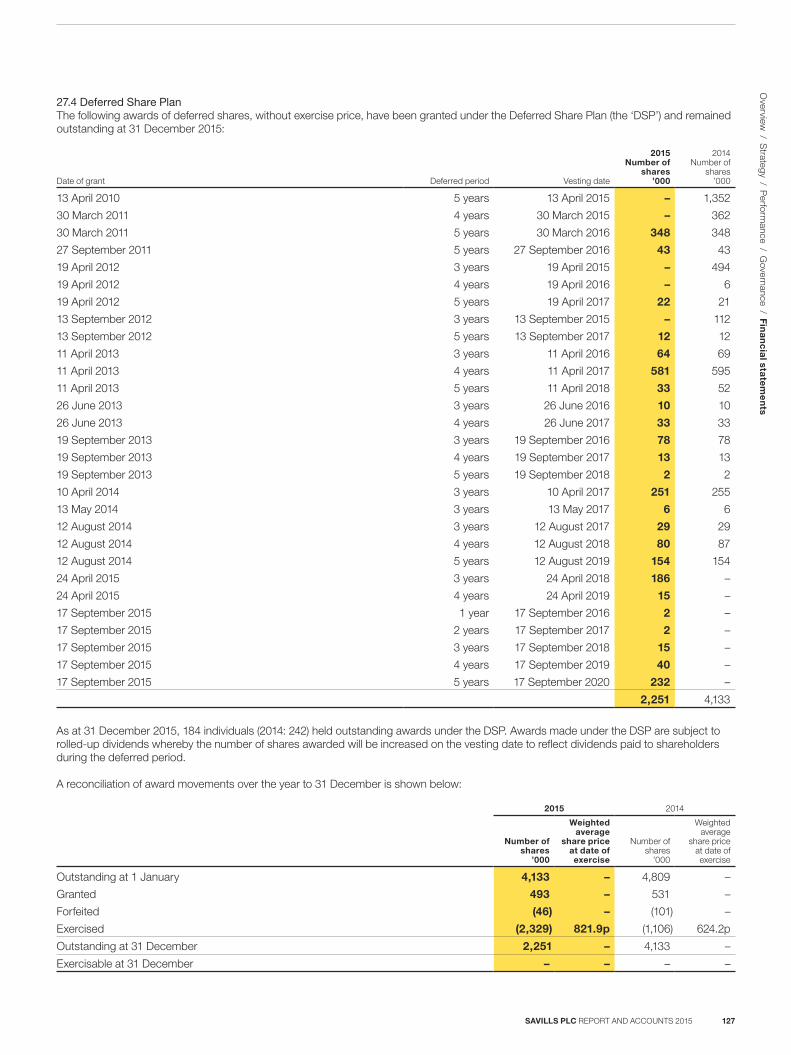
27.4 Deferred Share PlanThe following awards of deferred shares, without exercise price, have been granted under the Deferred Share Plan (the ‘DSP’) and remained outstanding at 31 December 2015:
Date of grant Deferred period Vesting date
2015 Number of
shares ’000
2014 Number of
shares ’000
13 April 2010 5 years 13 April 2015 – 1,352
30 March 2011 4 years 30 March 2015 – 362
30 March 2011 5 years 30 March 2016 348 348
27 September 2011 5 years 27 September 2016 43 43
19 April 2012 3 years 19 April 2015 – 494
19 April 2012 4 years 19 April 2016 – 6
19 April 2012 5 years 19 April 2017 22 21
13 September 2012 3 years 13 September 2015 – 112
13 September 2012 5 years 13 September 2017 12 12
11 April 2013 3 years 11 April 2016 64 69
11 April 2013 4 years 11 April 2017 581 595
11 April 2013 5 years 11 April 2018 33 52
26 June 2013 3 years 26 June 2016 10 10
26 June 2013 4 years 26 June 2017 33 33
19 September 2013 3 years 19 September 2016 78 78
19 September 2013 4 years 19 September 2017 13 13
19 September 2013 5 years 19 September 2018 2 2
10 April 2014 3 years 10 April 2017 251 255
13 May 2014 3 years 13 May 2017 6 6
12 August 2014 3 years 12 August 2017 29 29
12 August 2014 4 years 12 August 2018 80 87
12 August 2014 5 years 12 August 2019 154 154
24 April 2015 3 years 24 April 2018 186 –
24 April 2015 4 years 24 April 2019 15 –
17 September 2015 1 year 17 September 2016 2 –
17 September 2015 2 years 17 September 2017 2 –
17 September 2015 3 years 17 September 2018 15 –
17 September 2015 4 years 17 September 2019 40 –
17 September 2015 5 years 17 September 2020 232 –
2,251 4,133
As at 31 December 2015, 184 individuals (2014: 242) held outstanding awards under the DSP. Awards made under the DSP are subject to rolled-up dividends whereby the number of shares awarded will be increased on the vesting date to reflect dividends paid to shareholders during the deferred period.
A reconciliation of award movements over the year to 31 December is shown below:
2015 2014
Number of shares
’000
Weighted average
share price at date of exercise
Number of shares
’000
Weighted average
share price at date of exercise
Outstanding at 1 January 4,133 – 4,809 –
Granted 493 – 531 –
Forfeited (46) – (101) –
Exercised (2,329) 821.9p (1,106) 624.2p
Outstanding at 31 December 2,251 – 4,133 –
Exercisable at 31 December – – – –
SAVILLS PLC REPORT AND ACCOUNTS 2015 127
O
verview / S
trategy / Perform
ance / Governance / F
ina
nc
ial sta
tem
en
ts
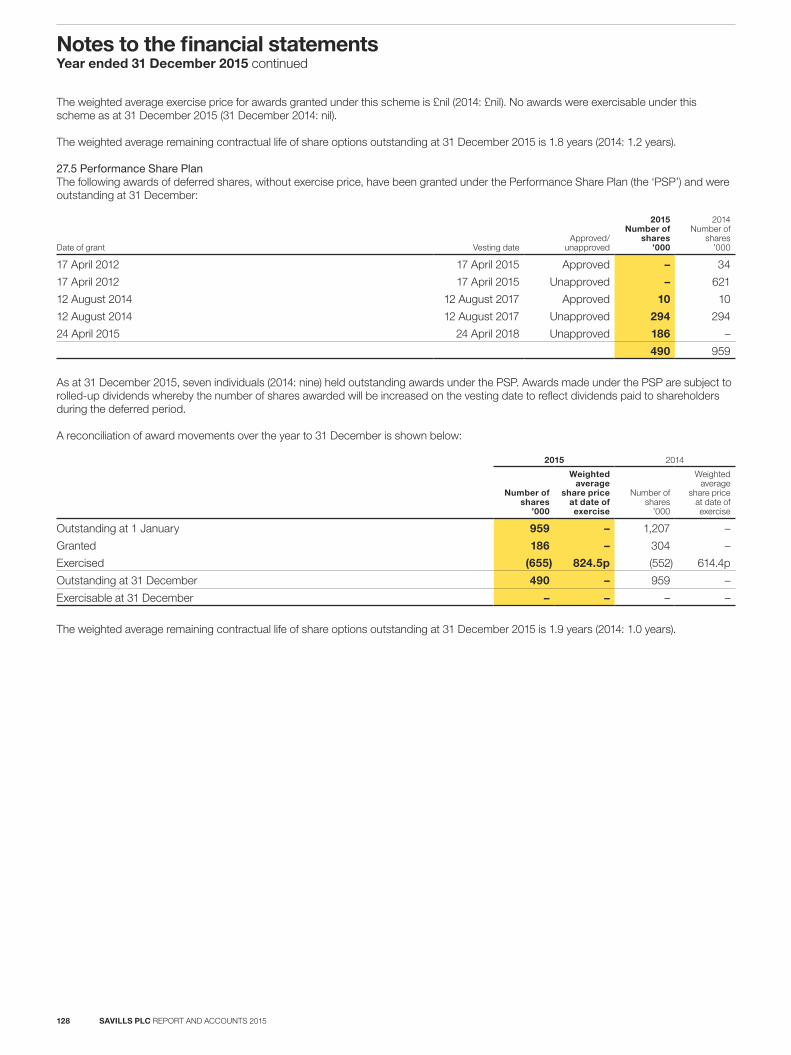
The weighted average exercise price for awards granted under this scheme is £nil (2014: £nil). No awards were exercisable under this scheme as at 31 December 2015 (31 December 2014: nil).
The weighted average remaining contractual life of share options outstanding at 31 December 2015 is 1.8 years (2014: 1.2 years).
27.5 Performance Share PlanThe following awards of deferred shares, without exercise price, have been granted under the Performance Share Plan (the ‘PSP’) and were outstanding at 31 December:
Date of grant Vesting dateApproved/
unapproved
2015 Number of
shares ’000
2014 Number of
shares ’000
17 April 2012 17 April 2015 Approved – 34
17 April 2012 17 April 2015 Unapproved – 621
12 August 2014 12 August 2017 Approved 10 10
12 August 2014 12 August 2017 Unapproved 294 294
24 April 2015 24 April 2018 Unapproved 186 –
490 959
As at 31 December 2015, seven individuals (2014: nine) held outstanding awards under the PSP. Awards made under the PSP are subject to rolled-up dividends whereby the number of shares awarded will be increased on the vesting date to reflect dividends paid to shareholders during the deferred period.
A reconciliation of award movements over the year to 31 December is shown below:
2015 2014
Number of shares
’000
Weighted average
share price at date of exercise
Number of shares
’000
Weighted average
share price at date of exercise
Outstanding at 1 January 959 – 1,207 –
Granted 186 – 304 –
Exercised (655) 824.5p (552) 614.4p
Outstanding at 31 December 490 – 959 –
Exercisable at 31 December – – – –
The weighted average remaining contractual life of share options outstanding at 31 December 2015 is 1.9 years (2014: 1.0 years).
SAVILLS PLC REPORT AND ACCOUNTS 2015128
Notes to the financial statementsYear ended 31 December 2015 continued
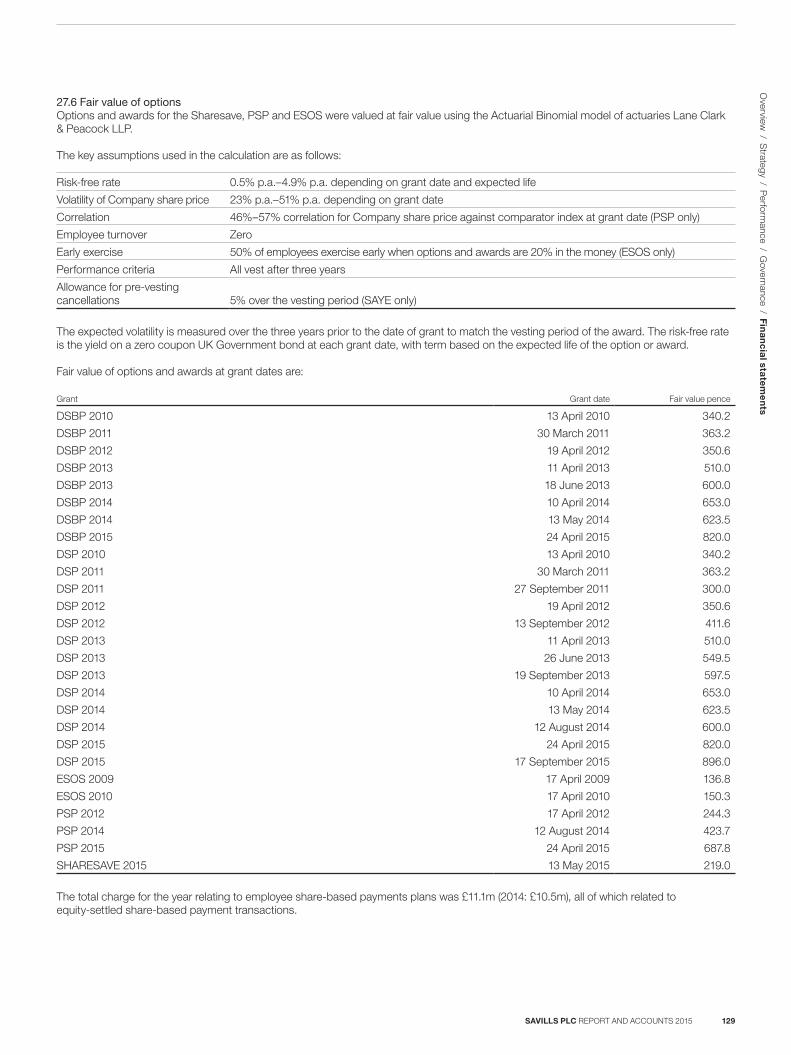
27.6 Fair value of optionsOptions and awards for the Sharesave, PSP and ESOS were valued at fair value using the Actuarial Binomial model of actuaries Lane Clark & Peacock LLP.
The key assumptions used in the calculation are as follows:
Risk-free rate 0.5% p.a.–4.9% p.a. depending on grant date and expected life
Volatility of Company share price 23% p.a.–51% p.a. depending on grant date
Correlation 46%–57% correlation for Company share price against comparator index at grant date (PSP only)
Employee turnover Zero
Early exercise 50% of employees exercise early when options and awards are 20% in the money (ESOS only)
Performance criteria All vest after three years
Allowance for pre-vesting cancellations 5% over the vesting period (SAYE only)
The expected volatility is measured over the three years prior to the date of grant to match the vesting period of the award. The risk-free rate is the yield on a zero coupon UK Government bond at each grant date, with term based on the expected life of the option or award.
Fair value of options and awards at grant dates are:
Grant Grant date Fair value pence
DSBP 2010 13 April 2010 340.2
DSBP 2011 30 March 2011 363.2
DSBP 2012 19 April 2012 350.6
DSBP 2013 11 April 2013 510.0
DSBP 2013 18 June 2013 600.0
DSBP 2014 10 April 2014 653.0
DSBP 2014 13 May 2014 623.5
DSBP 2015 24 April 2015 820.0
DSP 2010 13 April 2010 340.2
DSP 2011 30 March 2011 363.2
DSP 2011 27 September 2011 300.0
DSP 2012 19 April 2012 350.6
DSP 2012 13 September 2012 411.6
DSP 2013 11 April 2013 510.0
DSP 2013 26 June 2013 549.5
DSP 2013 19 September 2013 597.5
DSP 2014 10 April 2014 653.0
DSP 2014 13 May 2014 623.5
DSP 2014 12 August 2014 600.0
DSP 2015 24 April 2015 820.0
DSP 2015 17 September 2015 896.0
ESOS 2009 17 April 2009 136.8
ESOS 2010 17 April 2010 150.3
PSP 2012 17 April 2012 244.3
PSP 2014 12 August 2014 423.7
PSP 2015 24 April 2015 687.8
SHARESAVE 2015 13 May 2015 219.0
The total charge for the year relating to employee share-based payments plans was £11.1m (2014: £10.5m), all of which related to equity-settled share-based payment transactions.
SAVILLS PLC REPORT AND ACCOUNTS 2015 129
O
verview / S
trategy / Perform
ance / Governance / F
ina
nc
ial sta
tem
en
ts
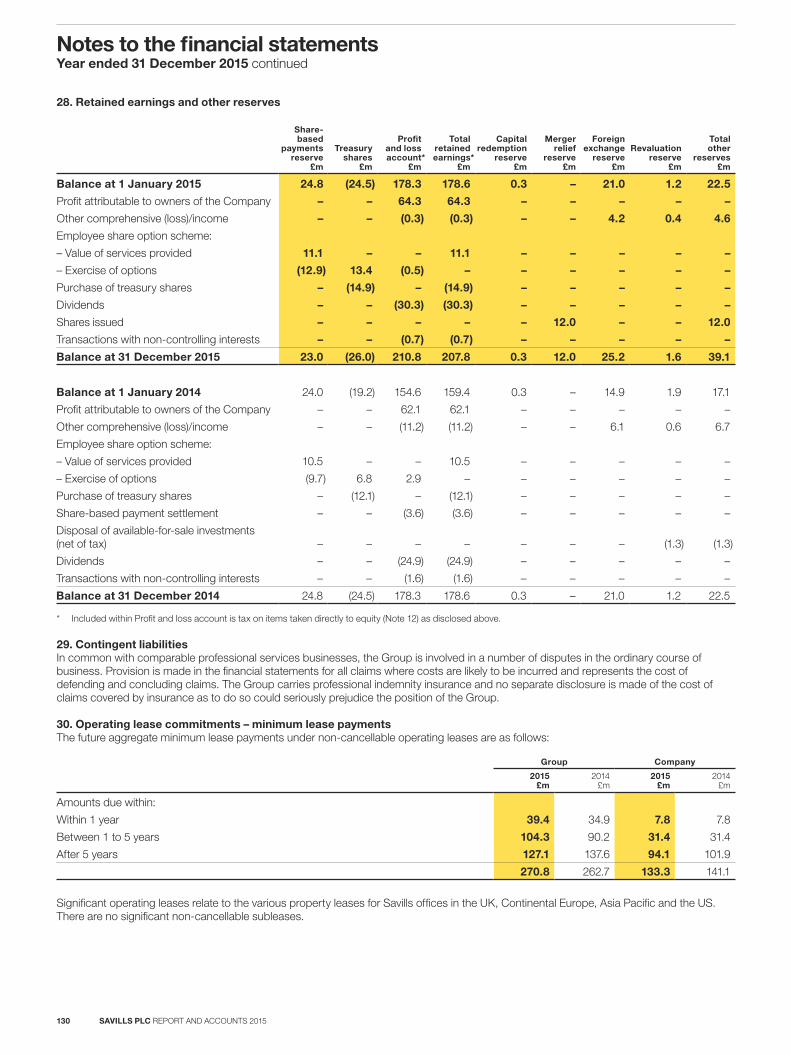
28. Retained earnings and other reserves
Share-based
payments reserve
£m
Treasury shares
£m
Profit and loss account*
£m
Total retainedearnings*
£m
Capital redemption
reserve £m
Merger relief
reserve£m
Foreign exchange
reserve £m
Revaluation reserve
£m
Total other
reserves £m
Balance at 1 January 2015 24.8 (24.5) 178.3 178.6 0.3 – 21.0 1.2 22.5
Profit attributable to owners of the Company – – 64.3 64.3 – – – – –
Other comprehensive (loss)/income – – (0.3) (0.3) – – 4.2 0.4 4.6
Employee share option scheme:
– Value of services provided 11.1 – – 11.1 – – – – –
– Exercise of options (12.9) 13.4 (0.5) – – – – – –
Purchase of treasury shares – (14.9) – (14.9) – – – – –
Dividends – – (30.3) (30.3) – – – – –
Shares issued – – – – – 12.0 – – 12.0
Transactions with non-controlling interests – – (0.7) (0.7) – – – – –
Balance at 31 December 2015 23.0 (26.0) 210.8 207.8 0.3 12.0 25.2 1.6 39.1
Balance at 1 January 2014 24.0 (19.2) 154.6 159.4 0.3 – 14.9 1.9 17.1
Profit attributable to owners of the Company – – 62.1 62.1 – – – – –
Other comprehensive (loss)/income – – (11.2) (11.2) – – 6.1 0.6 6.7
Employee share option scheme:
– Value of services provided 10.5 – – 10.5 – – – – –
– Exercise of options (9.7) 6.8 2.9 – – – – – –
Purchase of treasury shares – (12.1) – (12.1) – – – – –
Share-based payment settlement – – (3.6) (3.6) – – – – –
Disposal of available-for-sale investments (net of tax) – – – – – – – (1.3) (1.3)
Dividends – – (24.9) (24.9) – – – – –
Transactions with non-controlling interests – – (1.6) (1.6) – – – – –
Balance at 31 December 2014 24.8 (24.5) 178.3 178.6 0.3 – 21.0 1.2 22.5
* Included within Profit and loss account is tax on items taken directly to equity (Note 12) as disclosed above.
29. Contingent liabilitiesIn common with comparable professional services businesses, the Group is involved in a number of disputes in the ordinary course of business. Provision is made in the financial statements for all claims where costs are likely to be incurred and represents the cost of defending and concluding claims. The Group carries professional indemnity insurance and no separate disclosure is made of the cost of claims covered by insurance as to do so could seriously prejudice the position of the Group.
30. Operating lease commitments – minimum lease paymentsThe future aggregate minimum lease payments under non-cancellable operating leases are as follows:
Group Company
2015£m
2014 £m
2015 £m
2014 £m
Amounts due within:
Within 1 year 39.4 34.9 7.8 7.8
Between 1 to 5 years 104.3 90.2 31.4 31.4
After 5 years 127.1 137.6 94.1 101.9
270.8 262.7 133.3 141.1
Significant operating leases relate to the various property leases for Savills offices in the UK, Continental Europe, Asia Pacific and the US. There are no significant non-cancellable subleases.
SAVILLS PLC REPORT AND ACCOUNTS 2015130
Notes to the financial statementsYear ended 31 December 2015 continued
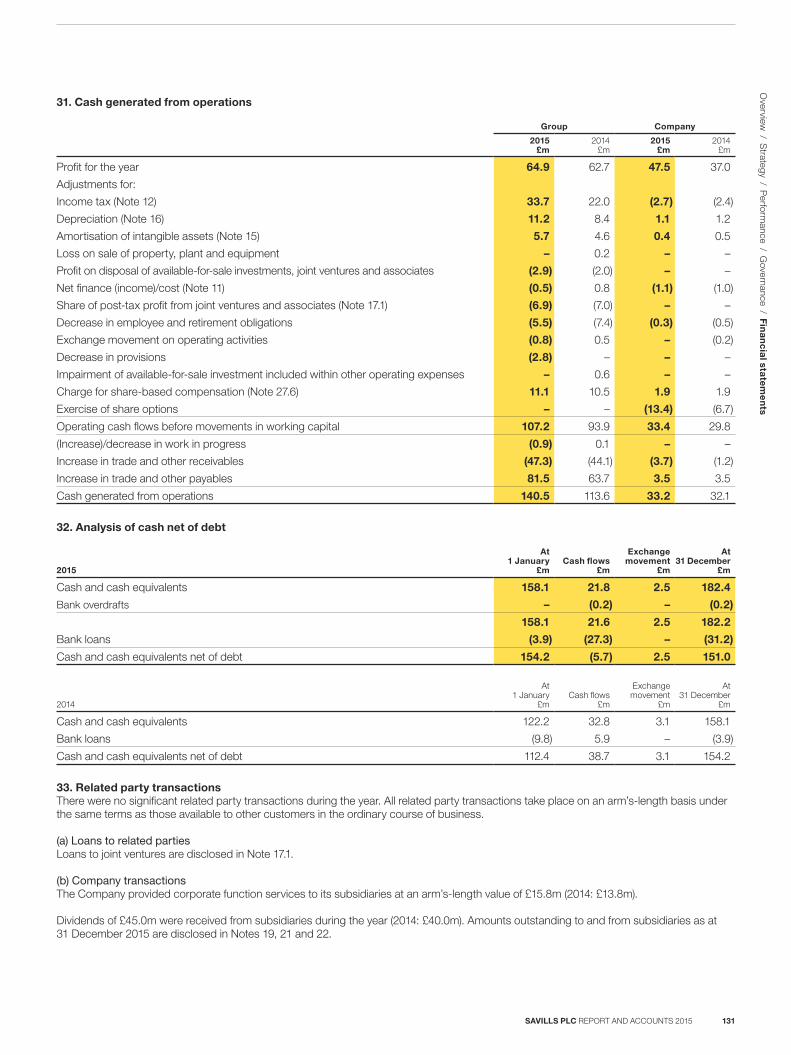
31. Cash generated from operations
Group Company
2015 £m
2014 £m
2015£m
2014 £m
Profit for the year 64.9 62.7 47.5 37.0
Adjustments for:
Income tax (Note 12) 33.7 22.0 (2.7) (2.4)
Depreciation (Note 16) 11.2 8.4 1.1 1.2
Amortisation of intangible assets (Note 15) 5.7 4.6 0.4 0.5
Loss on sale of property, plant and equipment – 0.2 – –
Profit on disposal of available-for-sale investments, joint ventures and associates (2.9) (2.0) – –
Net finance (income)/cost (Note 11) (0.5) 0.8 (1.1) (1.0)
Share of post-tax profit from joint ventures and associates (Note 17.1) (6.9) (7.0) – –
Decrease in employee and retirement obligations (5.5) (7.4) (0.3) (0.5)
Exchange movement on operating activities (0.8) 0.5 – (0.2)
Decrease in provisions (2.8) – – –
Impairment of available-for-sale investment included within other operating expenses – 0.6 – –
Charge for share-based compensation (Note 27.6) 11.1 10.5 1.9 1.9
Exercise of share options – – (13.4) (6.7)
Operating cash flows before movements in working capital 107.2 93.9 33.4 29.8
(Increase)/decrease in work in progress (0.9) 0.1 – –
Increase in trade and other receivables (47.3) (44.1) (3.7) (1.2)
Increase in trade and other payables 81.5 63.7 3.5 3.5
Cash generated from operations 140.5 113.6 33.2 32.1
32. Analysis of cash net of debt
2015
At 1 January
£mCash flows
£m
Exchange movement
£m
At 31 December
£m
Cash and cash equivalents 158.1 21.8 2.5 182.4
Bank overdrafts – (0.2) – (0.2)
158.1 21.6 2.5 182.2
Bank loans (3.9) (27.3) – (31.2)
Cash and cash equivalents net of debt 154.2 (5.7) 2.5 151.0
2014
At 1 January
£mCash flows
£m
Exchange movement
£m
At 31 December
£m
Cash and cash equivalents 122.2 32.8 3.1 158.1
Bank loans (9.8) 5.9 – (3.9)
Cash and cash equivalents net of debt 112.4 38.7 3.1 154.2
33. Related party transactionsThere were no significant related party transactions during the year. All related party transactions take place on an arm’s-length basis under the same terms as those available to other customers in the ordinary course of business.
(a) Loans to related partiesLoans to joint ventures are disclosed in Note 17.1.
(b) Company transactionsThe Company provided corporate function services to its subsidiaries at an arm’s-length value of £15.8m (2014: £13.8m).
Dividends of £45.0m were received from subsidiaries during the year (2014: £40.0m). Amounts outstanding to and from subsidiaries as at 31 December 2015 are disclosed in Notes 19, 21 and 22.
SAVILLS PLC REPORT AND ACCOUNTS 2015 131
O
verview / S
trategy / Perform
ance / Governance / F
ina
nc
ial sta
tem
en
ts
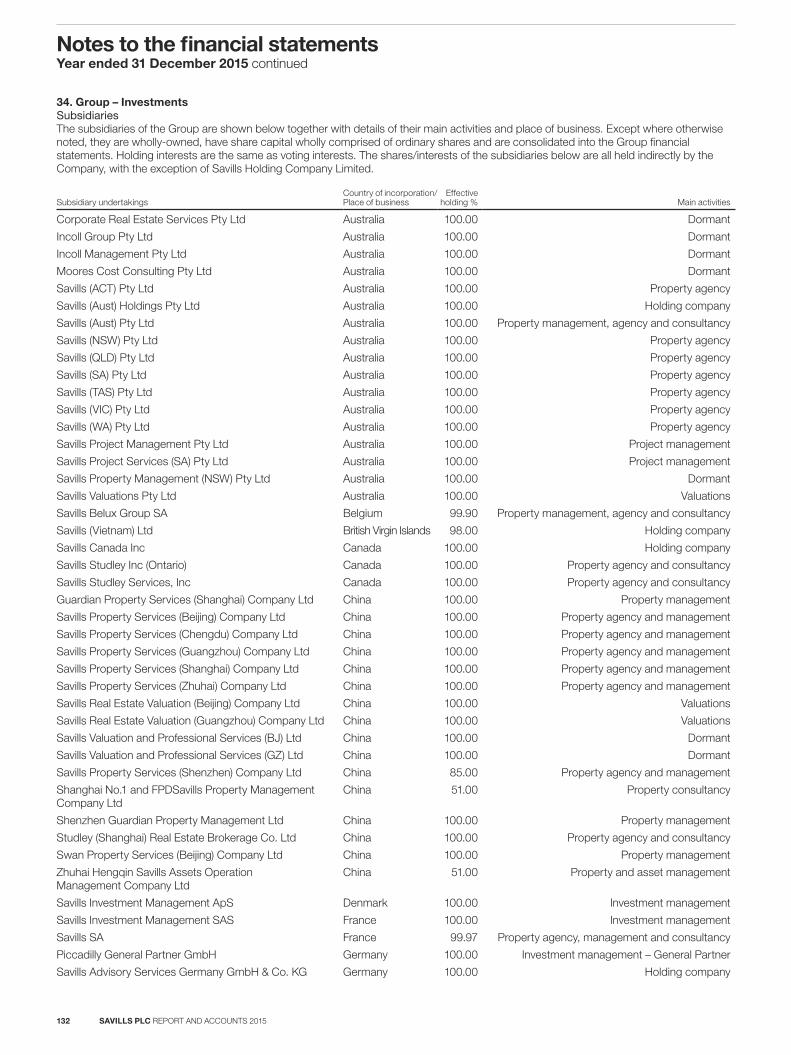
34. Group – InvestmentsSubsidiariesThe subsidiaries of the Group are shown below together with details of their main activities and place of business. Except where otherwise noted, they are wholly-owned, have share capital wholly comprised of ordinary shares and are consolidated into the Group financial statements. Holding interests are the same as voting interests. The shares/interests of the subsidiaries below are all held indirectly by the Company, with the exception of Savills Holding Company Limited.
Subsidiary undertakingsCountry of incorporation/Place of business
Effective holding % Main activities
Corporate Real Estate Services Pty Ltd Australia 100.00 Dormant
Incoll Group Pty Ltd Australia 100.00 Dormant
Incoll Management Pty Ltd Australia 100.00 Dormant
Moores Cost Consulting Pty Ltd Australia 100.00 Dormant
Savills (ACT) Pty Ltd Australia 100.00 Property agency
Savills (Aust) Holdings Pty Ltd Australia 100.00 Holding company
Savills (Aust) Pty Ltd Australia 100.00 Property management, agency and consultancy
Savills (NSW) Pty Ltd Australia 100.00 Property agency
Savills (QLD) Pty Ltd Australia 100.00 Property agency
Savills (SA) Pty Ltd Australia 100.00 Property agency
Savills (TAS) Pty Ltd Australia 100.00 Property agency
Savills (VIC) Pty Ltd Australia 100.00 Property agency
Savills (WA) Pty Ltd Australia 100.00 Property agency
Savills Project Management Pty Ltd Australia 100.00 Project management
Savills Project Services (SA) Pty Ltd Australia 100.00 Project management
Savills Property Management (NSW) Pty Ltd Australia 100.00 Dormant
Savills Valuations Pty Ltd Australia 100.00 Valuations
Savills Belux Group SA Belgium 99.90 Property management, agency and consultancy
Savills (Vietnam) Ltd British Virgin Islands 98.00 Holding company
Savills Canada Inc Canada 100.00 Holding company
Savills Studley Inc (Ontario) Canada 100.00 Property agency and consultancy
Savills Studley Services, Inc Canada 100.00 Property agency and consultancy
Guardian Property Services (Shanghai) Company Ltd China 100.00 Property management
Savills Property Services (Beijing) Company Ltd China 100.00 Property agency and management
Savills Property Services (Chengdu) Company Ltd China 100.00 Property agency and management
Savills Property Services (Guangzhou) Company Ltd China 100.00 Property agency and management
Savills Property Services (Shanghai) Company Ltd China 100.00 Property agency and management
Savills Property Services (Zhuhai) Company Ltd China 100.00 Property agency and management
Savills Real Estate Valuation (Beijing) Company Ltd China 100.00 Valuations
Savills Real Estate Valuation (Guangzhou) Company Ltd China 100.00 Valuations
Savills Valuation and Professional Services (BJ) Ltd China 100.00 Dormant
Savills Valuation and Professional Services (GZ) Ltd China 100.00 Dormant
Savills Property Services (Shenzhen) Company Ltd China 85.00 Property agency and management
Shanghai No.1 and FPDSavills Property Management Company Ltd
China 51.00 Property consultancy
Shenzhen Guardian Property Management Ltd China 100.00 Property management
Studley (Shanghai) Real Estate Brokerage Co. Ltd China 100.00 Property agency and consultancy
Swan Property Services (Beijing) Company Ltd China 100.00 Property management
Zhuhai Hengqin Savills Assets Operation Management Company Ltd
China 51.00 Property and asset management
Savills Investment Management ApS Denmark 100.00 Investment management
Savills Investment Management SAS France 100.00 Investment management
Savills SA France 99.97 Property agency, management and consultancy
Piccadilly General Partner GmbH Germany 100.00 Investment management – General Partner
Savills Advisory Services Germany GmbH & Co. KG Germany 100.00 Holding company
SAVILLS PLC REPORT AND ACCOUNTS 2015132
Notes to the financial statementsYear ended 31 December 2015 continued
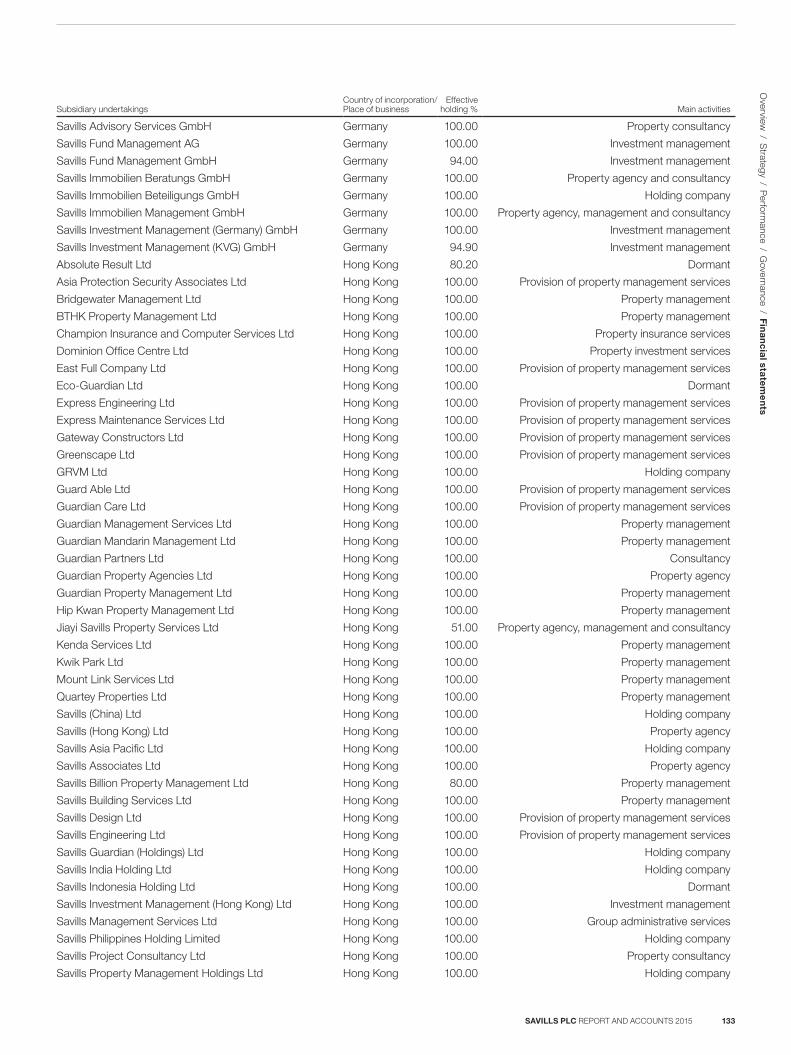
Subsidiary undertakingsCountry of incorporation/Place of business
Effective holding % Main activities
Savills Advisory Services GmbH Germany 100.00 Property consultancy
Savills Fund Management AG Germany 100.00 Investment management
Savills Fund Management GmbH Germany 94.00 Investment management
Savills Immobilien Beratungs GmbH Germany 100.00 Property agency and consultancy
Savills Immobilien Beteiligungs GmbH Germany 100.00 Holding company
Savills Immobilien Management GmbH Germany 100.00 Property agency, management and consultancy
Savills Investment Management (Germany) GmbH Germany 100.00 Investment management
Savills Investment Management (KVG) GmbH Germany 94.90 Investment management
Absolute Result Ltd Hong Kong 80.20 Dormant
Asia Protection Security Associates Ltd Hong Kong 100.00 Provision of property management services
Bridgewater Management Ltd Hong Kong 100.00 Property management
BTHK Property Management Ltd Hong Kong 100.00 Property management
Champion Insurance and Computer Services Ltd Hong Kong 100.00 Property insurance services
Dominion Office Centre Ltd Hong Kong 100.00 Property investment services
East Full Company Ltd Hong Kong 100.00 Provision of property management services
Eco-Guardian Ltd Hong Kong 100.00 Dormant
Express Engineering Ltd Hong Kong 100.00 Provision of property management services
Express Maintenance Services Ltd Hong Kong 100.00 Provision of property management services
Gateway Constructors Ltd Hong Kong 100.00 Provision of property management services
Greenscape Ltd Hong Kong 100.00 Provision of property management services
GRVM Ltd Hong Kong 100.00 Holding company
Guard Able Ltd Hong Kong 100.00 Provision of property management services
Guardian Care Ltd Hong Kong 100.00 Provision of property management services
Guardian Management Services Ltd Hong Kong 100.00 Property management
Guardian Mandarin Management Ltd Hong Kong 100.00 Property management
Guardian Partners Ltd Hong Kong 100.00 Consultancy
Guardian Property Agencies Ltd Hong Kong 100.00 Property agency
Guardian Property Management Ltd Hong Kong 100.00 Property management
Hip Kwan Property Management Ltd Hong Kong 100.00 Property management
Jiayi Savills Property Services Ltd Hong Kong 51.00 Property agency, management and consultancy
Kenda Services Ltd Hong Kong 100.00 Property management
Kwik Park Ltd Hong Kong 100.00 Property management
Mount Link Services Ltd Hong Kong 100.00 Property management
Quartey Properties Ltd Hong Kong 100.00 Property management
Savills (China) Ltd Hong Kong 100.00 Holding company
Savills (Hong Kong) Ltd Hong Kong 100.00 Property agency
Savills Asia Pacific Ltd Hong Kong 100.00 Holding company
Savills Associates Ltd Hong Kong 100.00 Property agency
Savills Billion Property Management Ltd Hong Kong 80.00 Property management
Savills Building Services Ltd Hong Kong 100.00 Property management
Savills Design Ltd Hong Kong 100.00 Provision of property management services
Savills Engineering Ltd Hong Kong 100.00 Provision of property management services
Savills Guardian (Holdings) Ltd Hong Kong 100.00 Holding company
Savills India Holding Ltd Hong Kong 100.00 Holding company
Savills Indonesia Holding Ltd Hong Kong 100.00 Dormant
Savills Investment Management (Hong Kong) Ltd Hong Kong 100.00 Investment management
Savills Management Services Ltd Hong Kong 100.00 Group administrative services
Savills Philippines Holding Limited Hong Kong 100.00 Holding company
Savills Project Consultancy Ltd Hong Kong 100.00 Property consultancy
Savills Property Management Holdings Ltd Hong Kong 100.00 Holding company
SAVILLS PLC REPORT AND ACCOUNTS 2015 133
O
verview / S
trategy / Perform
ance / Governance / F
ina
nc
ial sta
tem
en
ts
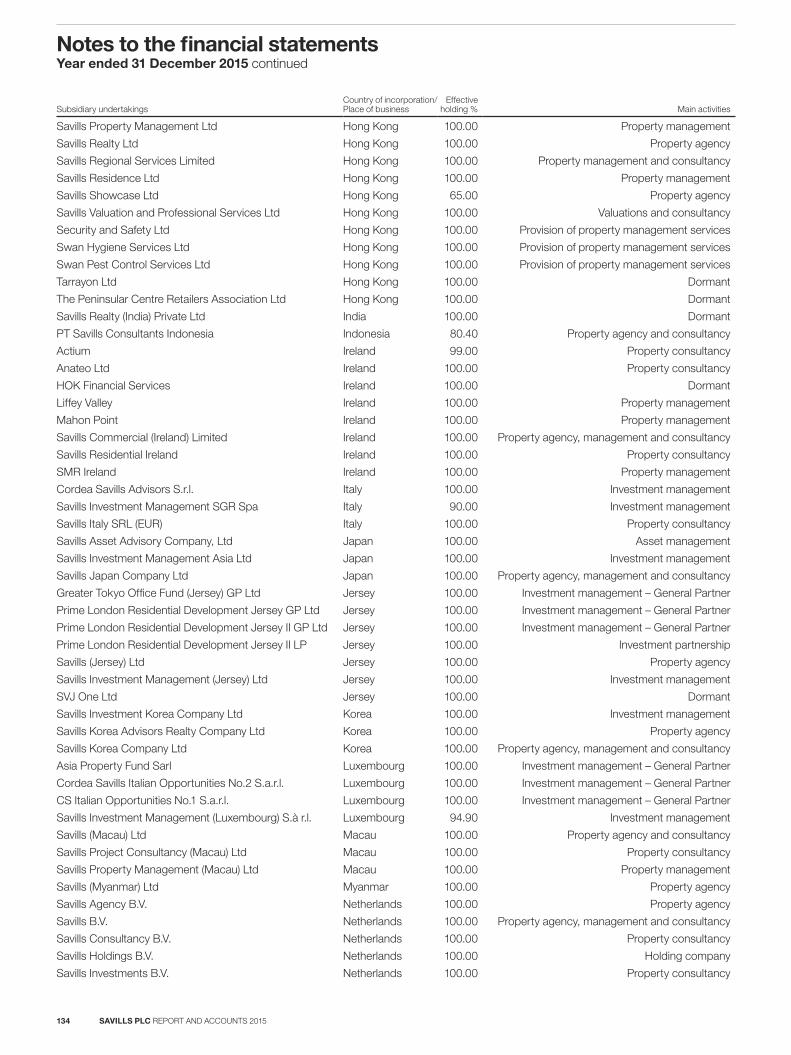
Subsidiary undertakingsCountry of incorporation/Place of business
Effective holding % Main activities
Savills Property Management Ltd Hong Kong 100.00 Property management
Savills Realty Ltd Hong Kong 100.00 Property agency
Savills Regional Services Limited Hong Kong 100.00 Property management and consultancy
Savills Residence Ltd Hong Kong 100.00 Property management
Savills Showcase Ltd Hong Kong 65.00 Property agency
Savills Valuation and Professional Services Ltd Hong Kong 100.00 Valuations and consultancy
Security and Safety Ltd Hong Kong 100.00 Provision of property management services
Swan Hygiene Services Ltd Hong Kong 100.00 Provision of property management services
Swan Pest Control Services Ltd Hong Kong 100.00 Provision of property management services
Tarrayon Ltd Hong Kong 100.00 Dormant
The Peninsular Centre Retailers Association Ltd Hong Kong 100.00 Dormant
Savills Realty (India) Private Ltd India 100.00 Dormant
PT Savills Consultants Indonesia Indonesia 80.40 Property agency and consultancy
Actium Ireland 99.00 Property consultancy
Anateo Ltd Ireland 100.00 Property consultancy
HOK Financial Services Ireland 100.00 Dormant
Liffey Valley Ireland 100.00 Property management
Mahon Point Ireland 100.00 Property management
Savills Commercial (Ireland) Limited Ireland 100.00 Property agency, management and consultancy
Savills Residential Ireland Ireland 100.00 Property consultancy
SMR Ireland Ireland 100.00 Property management
Cordea Savills Advisors S.r.l. Italy 100.00 Investment management
Savills Investment Management SGR Spa Italy 90.00 Investment management
Savills Italy SRL (EUR) Italy 100.00 Property consultancy
Savills Asset Advisory Company, Ltd Japan 100.00 Asset management
Savills Investment Management Asia Ltd Japan 100.00 Investment management
Savills Japan Company Ltd Japan 100.00 Property agency, management and consultancy
Greater Tokyo Office Fund (Jersey) GP Ltd Jersey 100.00 Investment management – General Partner
Prime London Residential Development Jersey GP Ltd Jersey 100.00 Investment management – General Partner
Prime London Residential Development Jersey II GP Ltd Jersey 100.00 Investment management – General Partner
Prime London Residential Development Jersey II LP Jersey 100.00 Investment partnership
Savills (Jersey) Ltd Jersey 100.00 Property agency
Savills Investment Management (Jersey) Ltd Jersey 100.00 Investment management
SVJ One Ltd Jersey 100.00 Dormant
Savills Investment Korea Company Ltd Korea 100.00 Investment management
Savills Korea Advisors Realty Company Ltd Korea 100.00 Property agency
Savills Korea Company Ltd Korea 100.00 Property agency, management and consultancy
Asia Property Fund Sarl Luxembourg 100.00 Investment management – General Partner
Cordea Savills Italian Opportunities No.2 S.a.r.l. Luxembourg 100.00 Investment management – General Partner
CS Italian Opportunities No.1 S.a.r.l. Luxembourg 100.00 Investment management – General Partner
Savills Investment Management (Luxembourg) S.à r.l. Luxembourg 94.90 Investment management
Savills (Macau) Ltd Macau 100.00 Property agency and consultancy
Savills Project Consultancy (Macau) Ltd Macau 100.00 Property consultancy
Savills Property Management (Macau) Ltd Macau 100.00 Property management
Savills (Myanmar) Ltd Myanmar 100.00 Property agency
Savills Agency B.V. Netherlands 100.00 Property agency
Savills B.V. Netherlands 100.00 Property agency, management and consultancy
Savills Consultancy B.V. Netherlands 100.00 Property consultancy
Savills Holdings B.V. Netherlands 100.00 Holding company
Savills Investments B.V. Netherlands 100.00 Property consultancy
SAVILLS PLC REPORT AND ACCOUNTS 2015134
Notes to the financial statementsYear ended 31 December 2015 continued
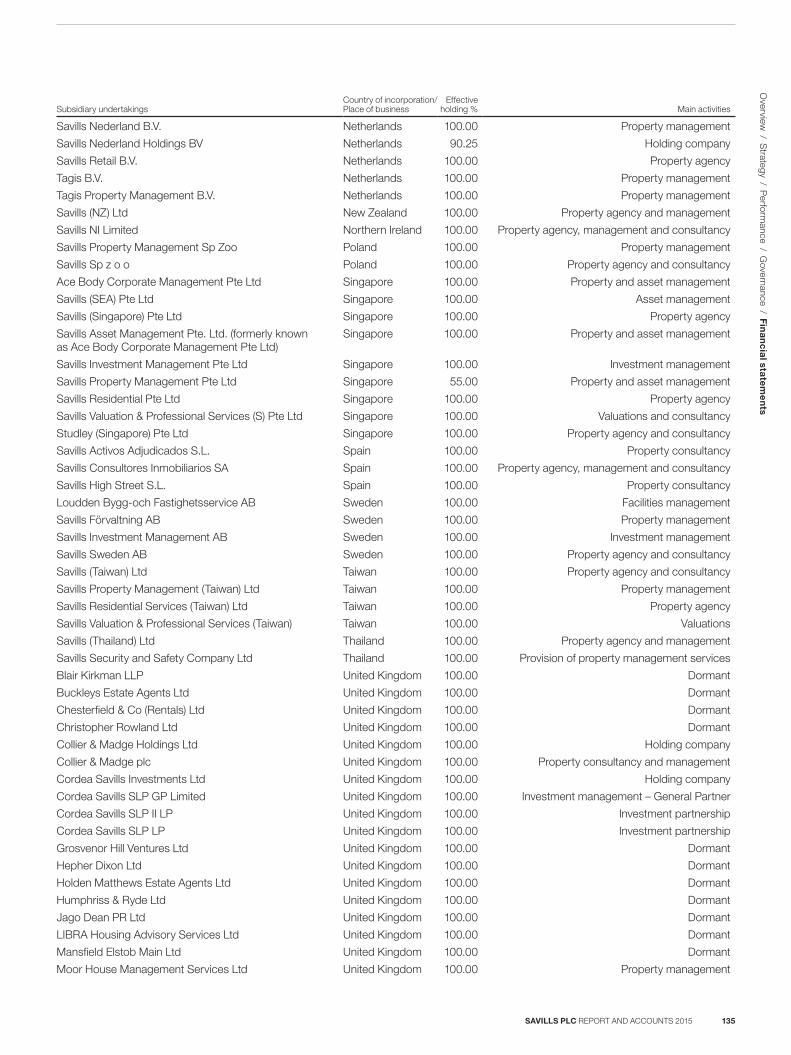
Subsidiary undertakingsCountry of incorporation/Place of business
Effective holding % Main activities
Savills Nederland B.V. Netherlands 100.00 Property management
Savills Nederland Holdings BV Netherlands 90.25 Holding company
Savills Retail B.V. Netherlands 100.00 Property agency
Tagis B.V. Netherlands 100.00 Property management
Tagis Property Management B.V. Netherlands 100.00 Property management
Savills (NZ) Ltd New Zealand 100.00 Property agency and management
Savills NI Limited Northern Ireland 100.00 Property agency, management and consultancy
Savills Property Management Sp Zoo Poland 100.00 Property management
Savills Sp z o o Poland 100.00 Property agency and consultancy
Ace Body Corporate Management Pte Ltd Singapore 100.00 Property and asset management
Savills (SEA) Pte Ltd Singapore 100.00 Asset management
Savills (Singapore) Pte Ltd Singapore 100.00 Property agency
Savills Asset Management Pte. Ltd. (formerly known as Ace Body Corporate Management Pte Ltd)
Singapore 100.00 Property and asset management
Savills Investment Management Pte Ltd Singapore 100.00 Investment management
Savills Property Management Pte Ltd Singapore 55.00 Property and asset management
Savills Residential Pte Ltd Singapore 100.00 Property agency
Savills Valuation & Professional Services (S) Pte Ltd Singapore 100.00 Valuations and consultancy
Studley (Singapore) Pte Ltd Singapore 100.00 Property agency and consultancy
Savills Activos Adjudicados S.L. Spain 100.00 Property consultancy
Savills Consultores Inmobiliarios SA Spain 100.00 Property agency, management and consultancy
Savills High Street S.L. Spain 100.00 Property consultancy
Loudden Bygg-och Fastighetsservice AB Sweden 100.00 Facilities management
Savills Förvaltning AB Sweden 100.00 Property management
Savills Investment Management AB Sweden 100.00 Investment management
Savills Sweden AB Sweden 100.00 Property agency and consultancy
Savills (Taiwan) Ltd Taiwan 100.00 Property agency and consultancy
Savills Property Management (Taiwan) Ltd Taiwan 100.00 Property management
Savills Residential Services (Taiwan) Ltd Taiwan 100.00 Property agency
Savills Valuation & Professional Services (Taiwan) Taiwan 100.00 Valuations
Savills (Thailand) Ltd Thailand 100.00 Property agency and management
Savills Security and Safety Company Ltd Thailand 100.00 Provision of property management services
Blair Kirkman LLP United Kingdom 100.00 Dormant
Buckleys Estate Agents Ltd United Kingdom 100.00 Dormant
Chesterfield & Co (Rentals) Ltd United Kingdom 100.00 Dormant
Christopher Rowland Ltd United Kingdom 100.00 Dormant
Collier & Madge Holdings Ltd United Kingdom 100.00 Holding company
Collier & Madge plc United Kingdom 100.00 Property consultancy and management
Cordea Savills Investments Ltd United Kingdom 100.00 Holding company
Cordea Savills SLP GP Limited United Kingdom 100.00 Investment management – General Partner
Cordea Savills SLP II LP United Kingdom 100.00 Investment partnership
Cordea Savills SLP LP United Kingdom 100.00 Investment partnership
Grosvenor Hill Ventures Ltd United Kingdom 100.00 Dormant
Hepher Dixon Ltd United Kingdom 100.00 Dormant
Holden Matthews Estate Agents Ltd United Kingdom 100.00 Dormant
Humphriss & Ryde Ltd United Kingdom 100.00 Dormant
Jago Dean PR Ltd United Kingdom 100.00 Dormant
LIBRA Housing Advisory Services Ltd United Kingdom 100.00 Dormant
Mansfield Elstob Main Ltd United Kingdom 100.00 Dormant
Moor House Management Services Ltd United Kingdom 100.00 Property management
SAVILLS PLC REPORT AND ACCOUNTS 2015 135
O
verview / S
trategy / Perform
ance / Governance / F
ina
nc
ial sta
tem
en
ts
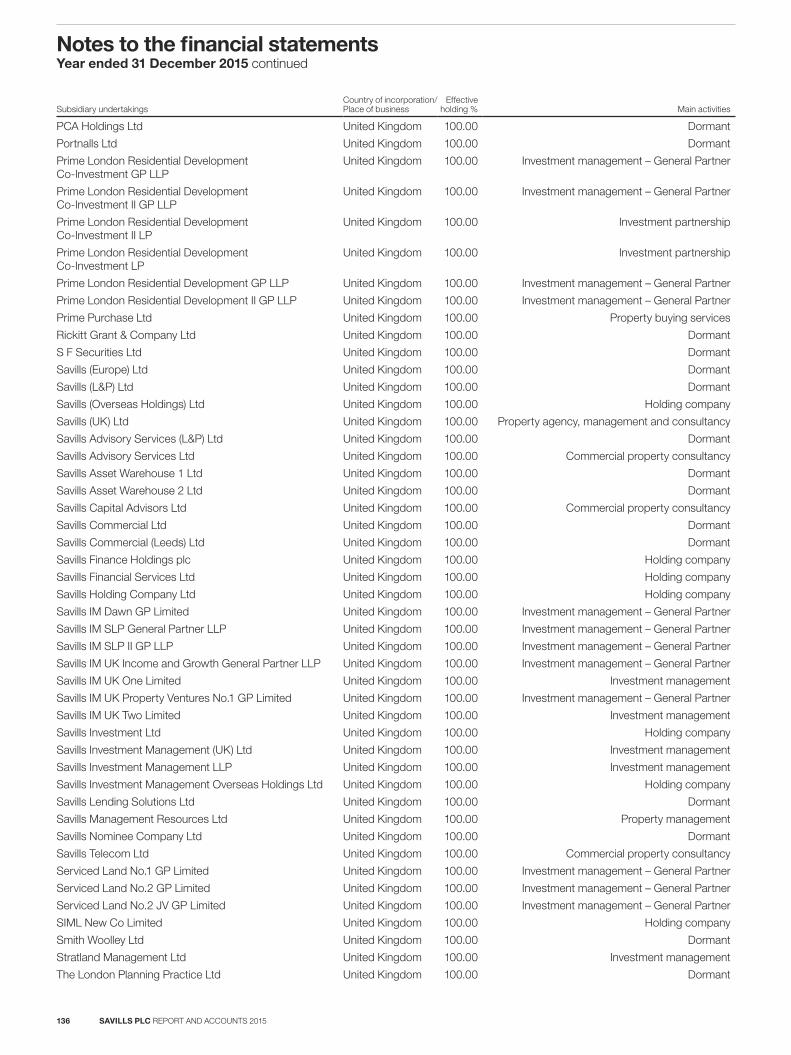
Subsidiary undertakingsCountry of incorporation/Place of business
Effective holding % Main activities
PCA Holdings Ltd United Kingdom 100.00 Dormant
Portnalls Ltd United Kingdom 100.00 Dormant
Prime London Residential Development Co-Investment GP LLP
United Kingdom 100.00 Investment management – General Partner
Prime London Residential Development Co-Investment II GP LLP
United Kingdom 100.00 Investment management – General Partner
Prime London Residential Development Co-Investment II LP
United Kingdom 100.00 Investment partnership
Prime London Residential Development Co-Investment LP
United Kingdom 100.00 Investment partnership
Prime London Residential Development GP LLP United Kingdom 100.00 Investment management – General Partner
Prime London Residential Development II GP LLP United Kingdom 100.00 Investment management – General Partner
Prime Purchase Ltd United Kingdom 100.00 Property buying services
Rickitt Grant & Company Ltd United Kingdom 100.00 Dormant
S F Securities Ltd United Kingdom 100.00 Dormant
Savills (Europe) Ltd United Kingdom 100.00 Dormant
Savills (L&P) Ltd United Kingdom 100.00 Dormant
Savills (Overseas Holdings) Ltd United Kingdom 100.00 Holding company
Savills (UK) Ltd United Kingdom 100.00 Property agency, management and consultancy
Savills Advisory Services (L&P) Ltd United Kingdom 100.00 Dormant
Savills Advisory Services Ltd United Kingdom 100.00 Commercial property consultancy
Savills Asset Warehouse 1 Ltd United Kingdom 100.00 Dormant
Savills Asset Warehouse 2 Ltd United Kingdom 100.00 Dormant
Savills Capital Advisors Ltd United Kingdom 100.00 Commercial property consultancy
Savills Commercial Ltd United Kingdom 100.00 Dormant
Savills Commercial (Leeds) Ltd United Kingdom 100.00 Dormant
Savills Finance Holdings plc United Kingdom 100.00 Holding company
Savills Financial Services Ltd United Kingdom 100.00 Holding company
Savills Holding Company Ltd United Kingdom 100.00 Holding company
Savills IM Dawn GP Limited United Kingdom 100.00 Investment management – General Partner
Savills IM SLP General Partner LLP United Kingdom 100.00 Investment management – General Partner
Savills IM SLP II GP LLP United Kingdom 100.00 Investment management – General Partner
Savills IM UK Income and Growth General Partner LLP United Kingdom 100.00 Investment management – General Partner
Savills IM UK One Limited United Kingdom 100.00 Investment management
Savills IM UK Property Ventures No.1 GP Limited United Kingdom 100.00 Investment management – General Partner
Savills IM UK Two Limited United Kingdom 100.00 Investment management
Savills Investment Ltd United Kingdom 100.00 Holding company
Savills Investment Management (UK) Ltd United Kingdom 100.00 Investment management
Savills Investment Management LLP United Kingdom 100.00 Investment management
Savills Investment Management Overseas Holdings Ltd United Kingdom 100.00 Holding company
Savills Lending Solutions Ltd United Kingdom 100.00 Dormant
Savills Management Resources Ltd United Kingdom 100.00 Property management
Savills Nominee Company Ltd United Kingdom 100.00 Dormant
Savills Telecom Ltd United Kingdom 100.00 Commercial property consultancy
Serviced Land No.1 GP Limited United Kingdom 100.00 Investment management – General Partner
Serviced Land No.2 GP Limited United Kingdom 100.00 Investment management – General Partner
Serviced Land No.2 JV GP Limited United Kingdom 100.00 Investment management – General Partner
SIML New Co Limited United Kingdom 100.00 Holding company
Smith Woolley Ltd United Kingdom 100.00 Dormant
Stratland Management Ltd United Kingdom 100.00 Investment management
The London Planning Practice Ltd United Kingdom 100.00 Dormant
SAVILLS PLC REPORT AND ACCOUNTS 2015136
Notes to the financial statementsYear ended 31 December 2015 continued
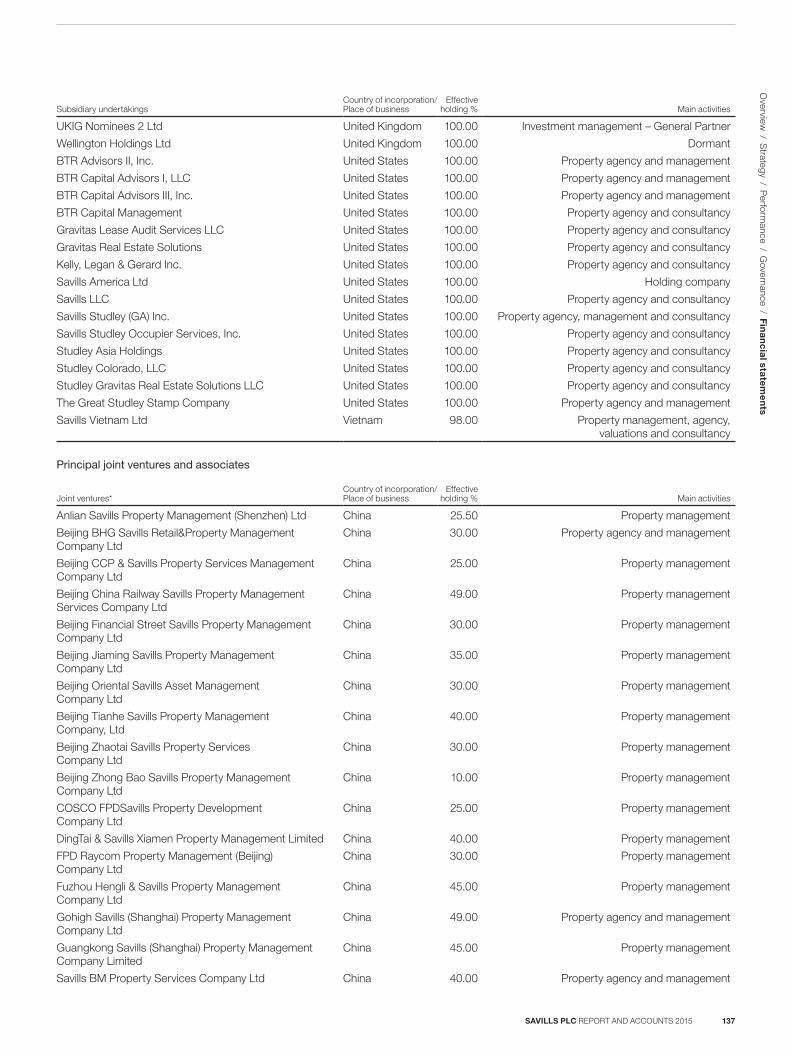
Subsidiary undertakingsCountry of incorporation/Place of business
Effective holding % Main activities
UKIG Nominees 2 Ltd United Kingdom 100.00 Investment management – General Partner
Wellington Holdings Ltd United Kingdom 100.00 Dormant
BTR Advisors II, Inc. United States 100.00 Property agency and management
BTR Capital Advisors I, LLC United States 100.00 Property agency and management
BTR Capital Advisors III, Inc. United States 100.00 Property agency and management
BTR Capital Management United States 100.00 Property agency and consultancy
Gravitas Lease Audit Services LLC United States 100.00 Property agency and consultancy
Gravitas Real Estate Solutions United States 100.00 Property agency and consultancy
Kelly, Legan & Gerard Inc. United States 100.00 Property agency and consultancy
Savills America Ltd United States 100.00 Holding company
Savills LLC United States 100.00 Property agency and consultancy
Savills Studley (GA) Inc. United States 100.00 Property agency, management and consultancy
Savills Studley Occupier Services, Inc. United States 100.00 Property agency and consultancy
Studley Asia Holdings United States 100.00 Property agency and consultancy
Studley Colorado, LLC United States 100.00 Property agency and consultancy
Studley Gravitas Real Estate Solutions LLC United States 100.00 Property agency and consultancy
The Great Studley Stamp Company United States 100.00 Property agency and management
Savills Vietnam Ltd Vietnam 98.00 Property management, agency, valuations and consultancy
Principal joint ventures and associates
Joint ventures*Country of incorporation/Place of business
Effective holding % Main activities
Anlian Savills Property Management (Shenzhen) Ltd China 25.50 Property management
Beijing BHG Savills Retail&Property Management Company Ltd
China 30.00 Property agency and management
Beijing CCP & Savills Property Services Management Company Ltd
China 25.00 Property management
Beijing China Railway Savills Property Management Services Company Ltd
China 49.00 Property management
Beijing Financial Street Savills Property Management Company Ltd
China 30.00 Property management
Beijing Jiaming Savills Property Management Company Ltd
China 35.00 Property management
Beijing Oriental Savills Asset Management Company Ltd
China 30.00 Property management
Beijing Tianhe Savills Property Management Company, Ltd
China 40.00 Property management
Beijing Zhaotai Savills Property Services Company Ltd
China 30.00 Property management
Beijing Zhong Bao Savills Property Management Company Ltd
China 10.00 Property management
COSCO FPDSavills Property Development Company Ltd
China 25.00 Property management
DingTai & Savills Xiamen Property Management Limited China 40.00 Property management
FPD Raycom Property Management (Beijing) Company Ltd
China 30.00 Property management
Fuzhou Hengli & Savills Property Management Company Ltd
China 45.00 Property management
Gohigh Savills (Shanghai) Property Management Company Ltd
China 49.00 Property agency and management
Guangkong Savills (Shanghai) Property Management Company Limited
China 45.00 Property management
Savills BM Property Services Company Ltd China 40.00 Property agency and management
SAVILLS PLC REPORT AND ACCOUNTS 2015 137
O
verview / S
trategy / Perform
ance / Governance / F
ina
nc
ial sta
tem
en
ts
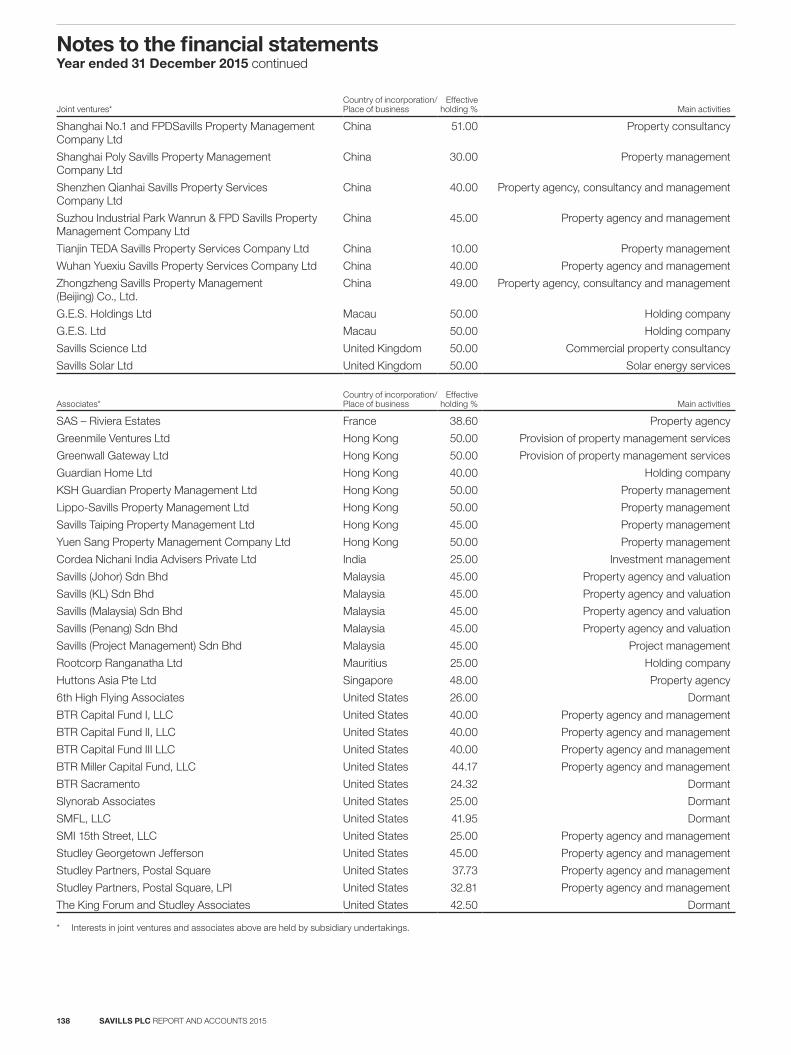
Joint ventures*Country of incorporation/Place of business
Effective holding % Main activities
Shanghai No.1 and FPDSavills Property Management Company Ltd
China 51.00 Property consultancy
Shanghai Poly Savills Property Management Company Ltd
China 30.00 Property management
Shenzhen Qianhai Savills Property Services Company Ltd
China 40.00 Property agency, consultancy and management
Suzhou Industrial Park Wanrun & FPD Savills Property Management Company Ltd
China 45.00 Property agency and management
Tianjin TEDA Savills Property Services Company Ltd China 10.00 Property management
Wuhan Yuexiu Savills Property Services Company Ltd China 40.00 Property agency and management
Zhongzheng Savills Property Management (Beijing) Co., Ltd.
China 49.00 Property agency, consultancy and management
G.E.S. Holdings Ltd Macau 50.00 Holding company
G.E.S. Ltd Macau 50.00 Holding company
Savills Science Ltd United Kingdom 50.00 Commercial property consultancy
Savills Solar Ltd United Kingdom 50.00 Solar energy services
Associates*Country of incorporation/Place of business
Effective holding % Main activities
SAS – Riviera Estates France 38.60 Property agency
Greenmile Ventures Ltd Hong Kong 50.00 Provision of property management services
Greenwall Gateway Ltd Hong Kong 50.00 Provision of property management services
Guardian Home Ltd Hong Kong 40.00 Holding company
KSH Guardian Property Management Ltd Hong Kong 50.00 Property management
Lippo-Savills Property Management Ltd Hong Kong 50.00 Property management
Savills Taiping Property Management Ltd Hong Kong 45.00 Property management
Yuen Sang Property Management Company Ltd Hong Kong 50.00 Property management
Cordea Nichani India Advisers Private Ltd India 25.00 Investment management
Savills (Johor) Sdn Bhd Malaysia 45.00 Property agency and valuation
Savills (KL) Sdn Bhd Malaysia 45.00 Property agency and valuation
Savills (Malaysia) Sdn Bhd Malaysia 45.00 Property agency and valuation
Savills (Penang) Sdn Bhd Malaysia 45.00 Property agency and valuation
Savills (Project Management) Sdn Bhd Malaysia 45.00 Project management
Rootcorp Ranganatha Ltd Mauritius 25.00 Holding company
Huttons Asia Pte Ltd Singapore 48.00 Property agency
6th High Flying Associates United States 26.00 Dormant
BTR Capital Fund I, LLC United States 40.00 Property agency and management
BTR Capital Fund II, LLC United States 40.00 Property agency and management
BTR Capital Fund III LLC United States 40.00 Property agency and management
BTR Miller Capital Fund, LLC United States 44.17 Property agency and management
BTR Sacramento United States 24.32 Dormant
Slynorab Associates United States 25.00 Dormant
SMFL, LLC United States 41.95 Dormant
SMI 15th Street, LLC United States 25.00 Property agency and management
Studley Georgetown Jefferson United States 45.00 Property agency and management
Studley Partners, Postal Square United States 37.73 Property agency and management
Studley Partners, Postal Square, LPI United States 32.81 Property agency and management
The King Forum and Studley Associates United States 42.50 Dormant
* Interests in joint ventures and associates above are held by subsidiary undertakings.
SAVILLS PLC REPORT AND ACCOUNTS 2015138
Notes to the financial statementsYear ended 31 December 2015 continued

The total non-controlling interest for the year is £0.7m. The non-controlling interests in respect of the above subsidiaries that the Group does not own a holding of 100% are not considered to be individually material.
See Note 17.4 for transactions with non-controlling interests and Note 20 for details on restrictions on the Group’s ability to access cash in the Group’s Asia Pacific operating subsidiaries.
SAVILLS PLC REPORT AND ACCOUNTS 2015 139
O
verview / S
trategy / Perform
ance / Governance / F
ina
nc
ial sta
tem
en
ts
Key dates for 2016 Date
Annual General Meeting 11 May 2016
Financial half year end 30 June 2016
Announcement of half year results 9 August 2016
WebsiteVisit our investor relations website www.savills.com for full up to date investor relations information, including the latest share price, recent Annual and Half Year Reports, results presentations and financial news. Shareholder enquiriesFor shareholder enquiries please contact our Registrars, Equiniti. For general enquiries please call our Shareholder Services helpline on: 0871 384 2018 (overseas holders need to ring +44 (0)121 415 7047). Calls to Equiniti’s 0871 numbers are charged at 8p per minute plus network extras. Other network service providers’ costs may vary. Lines are open from 8.30am to 5.30pm, Monday to Friday, excluding bank holidays. For further administrative queries in respect of your shareholding please access our Registrars’ website at www.shareview.co.uk Electronic communicationsIf you would prefer to receive shareholder communications electronically in future, including your annual and half-yearly reports and notices of meetings, please visit our Registrars’ website, www.shareview.co.uk and follow the link to ‘Register for e-communications’ under the Shareholder Services section. Half Year ReportLike many other listed public companies, we no longer circulate printed Half Year Reports to shareholders. Rather, Half Year results’ statements are published on the Company’s website. We believe that this is of benefit to those shareholders who do not wish to be burdened with such paper documents, and to the Company, as it is consistent with our target of saving printing and distribution costs.
Professional advisers and service providersSolicitorsCMS Cameron McKenna LLPMitre House160 Aldersgate StreetLondon EC1A 4DD RegistrarsEquinitiAspect HouseSpencer RoadLancingWest Sussex BN99 6DA AuditorPricewaterhouseCoopers LLP1 Embankment PlaceLondon WC2N 6RH Joint StockbrokersUBS Investment Bank1 Finsbury AvenueLondon EC2M 2PP Numis Securities LtdThe London StockExchange Building10 Paternoster SquareLondon EC4M 7LT Principal BankersBarclays Bank PLC1 Churchill PlaceLondon E14 5HP
SAVILLS PLC REPORT AND ACCOUNTS 2015140
Shareholder information
Warning about unsolicited investment contactsShare fraud includes scams where investors are contacted unexpectedly and offered shares that often turn out to be worthless or non-existent or offered an inflated price for shares they own. These calls come from fraudsters operating in ‘boiler rooms’ that are mostly based abroad. Shareholders who buy or sell their shares in this way usually lose their money. The Financial Conduct Authority (‘FCA’) has found most share fraud victims are experienced investors who lose an average of £20,000, with around £200m lost in the UK each year. Protect yourself – if you are offered discounted shares, unsolicited investment advice, an inflated price for your shares or free company or research reports, you should take precautionary measures before handing over your money. 1. Get the name of the person and organisation contacting you.2. Check the Financial Services Register at www.fca.org.uk/register to ensure
that they are authorised.3. Contact the firm using the details on the Financial Services Register. If there
are no details or you are told they are out of date, contact FCA Helpline on 0800 111 6768 or fill out a share fraud reporting form which can be found on the FCA website.
4. Search the list of unauthorised firms and individuals to avoid at www.fca.org.uk /scams and remember: if it sounds too good to be true, it probably is!
If you have already paid money to share fraudsters you should inform the FCA by calling its Helpline 0800 111 6768 or by calling Action Fraud on 0300 123 2040. If you use an unauthorised firm to buy or sell shares or other investments, you will not have access to the Financial Ombudsman Service or the Financial Services Compensation Scheme if things go wrong.
Cautionary note regarding forward-looking statementsCertain statements included in this Annual Report are forward-looking and are therefore subject to risks, assumptions and uncertainties that could cause actual results to differ materially from those expressed or implied because they relate to future events. These forward-looking statements include, but are not limited to, statements relating to the Company’s expectations. Forward-looking statements can be identified by the use of relevant terminology including the words: ‘believes’, ‘estimates’, ‘anticipates’, ‘expects’, ‘intends’, ‘forecasts’, ‘plans’, ‘goal’, ‘target’, ‘aim’, ‘may’, ‘will’, ‘would’, ‘could’ or ‘should’ or, in each case, their negative or other variations or comparable terminology and include all matters that are not historical facts. They appear in a number of places throughout this Annual Report and include statements regarding our intentions, beliefs or current expectations and those of our Officers, Directors and employees concerning, amongst other things, our results of operations, financial condition, liquidity, prospects, growth, strategies and the businesses we operate. Other factors that could cause actual results to differ materially from those estimated by the forward-looking statements include, but are not limited to: – Global economic business conditions; – Monetary and interest rate policies; – Foreign currency exchange rates; – Equity and property prices; – The impact of competition, inflation; – Changes to regulations, taxes; – Changes to consumer saving and spending habits; and – Our success in managing the above factors.
Consequently, our actual future financial condition, performance and results could differ materially from the plans, goals and expectations set out in our forward-looking statements. Accordingly, no assurance can be given that any particular expectation will be met and readers are cautioned not to place undue reliance on forward-looking statements which speak only at their respective dates. The Company undertakes no obligation to publicly update any forward-looking statement, whether as a result of new information, future events or otherwise.
Designed and produced by Gatherwww.gather.london
The paper used in this Report is derived from sustainable sources

Savills plc33 Margaret StreetLondon W1G 0JD T: +44 (0)20 7499 8644F: +44 (0)20 7495 3773
Registered in EnglandNo. 2122174