report on the capacity, demand, and reserves … produced several analyses of potential changes to...
TRANSCRIPT

Report on the Capacity, Demand, and Reserves in the ERCOT Region
December 2012
Winter Update

Tab NotesDisclaimer Please read.
Definitions List of definitions
Changes from 2012 CDR List of changes from the 2012 CDR (May)
Executive Summary Synopsis of considerations for this report
SummerSummary Provides load forecast, generation resources, and reserve margin for Summer 2013 through Summer 2022
SummerCapacities Lists units and their capabilities used in determining the generation resources in the Summer Summary
SummerFuelTypes Lists generation fuel types by MW and by percentage for Summer 2013 through Summer 2022
Contents
2

Disclaimer
CDR WORKING PAPER
FOR PLANNING PURPOSES ONLY
This ERCOT Working Paper has been prepared for specific ERCOT and market participant purposes and has been developed from data provided by ERCOT market participants. The data may contain errors or become obsolete and thereby affect the conclusions and opinions of the Working Paper. ERCOT MAKES NO WARRANTY, EXPRESS OR IMPLIED, INCLUDING ANY WARRANTY OF MERCHANTABILITY OR FITNESS FOR ANY PARTICULAR PURPOSE, AND DISCLAIMS ANY AND ALL LIABILITY WITH RESPECT TO THE ACCURACY OF SAME OR THE FITNESS OR APPROPRIATENESS OF SAME FOR ANY PARTICULAR USE. THIS ERCOT WORKING PAPER IS SUPPLIED WITH ALL FAULTS. The specific suitability for any use of the Working Paper and its accuracy should be confirmed by each ERCOT market participant that contributed data for this Working Paper.
This Working Paper is based on data submitted by ERCOT market participants as part of their Annual Load Data Request (ALDR) and their resource asset registration and on data in the EIA-411. As such, this data is updated on an ongoing basis, which means that this report can be rendered obsolete without notice.
3

Available Mothballed Generation
Effective Load-Carrying Capability (ELCC) of Wind Generation
Forecast Zone
LRs (Load Resources)
Mothballed Capacity
Mothballed Unit
Net Dependable CapabilityMaximum sustainable capability of a generation resource as demonstrated by performance testing.
Non-Synchronous Tie
A generation resource for which a generation entity has submitted a Notification of Suspension of Operations, for which ERCOT has declined to execute an RMR agreement, and for which the generation entity has not announced retirement of the generation resource.
Any non-synchronous transmission interconnection between ERCOT and non-ERCOT electric power systems
The difference in the available mothballed generation (see definition above) and the total mothballed capacity.
Definitions
The probability that a mothballed unit will return to service, as provided by its owner, multiplied by the capacity of the unit, and summed across all mothballed units. Return probabilities are considered protected information under the ERCOT Protocols and therefore are not included in this report.
The percentage capacity of wind generation that the Generation Adequacy Task Force (GATF) has recommended to be included in the CDR. The value is 8.7% of the nameplate capacity listed in the Unit Capacities tables, both installed capacity and planned capacity.
Loads capable of reducing or increasing the need for electrical energy or providing Ancillary Services to the ERCOT System, as described in the ERCOT Protocols, Section 6, Ancillary Services. These Resources may provide the following Ancillary Services: Responsive Reserve Service, Non-Spinning Reserve Service, Replacement Reserve Service, and Regulation Service. The Resources must be registered and qualified by ERCOT and will be scheduled by a Qualified Scheduling Entity
Forecast Zones have the same boundaries as the 2003 ERCOT Congestion Management Zones. Each Resource will be mapped to a Forecast Zone during the registration process.
4
Other Potential ResourcesCapacity resources that include one of the following: • Remaining "mothballed" capacity not included as resources in the reserve margin calculation • Remaining DC tie capacity not included as resources in the reserve margin calculation, and
Planned Units in Full Interconnection Study Phase
Private Networks
Reliability Must-Run (RMR) Unit
Signed IA (Interconnection Agreement)
Switchable Unit
An agreement that sets forth requirements for physical connection between an eligible transmission service customer and a transmission or distribution service provider
A generation resource that can be connected to either the ERCOT transmission grid or a grid outside the ERCOT Region.
• New generating units that have initiated full transmission interconnection studies through the ERCOT generation interconnection process (Note that new wind units would be included based on the appropriate discounted capacity value applied to existing wind generating units.)
To connect new generation to the ERCOT grid, a generation developer must go through a set procedure. The first step is a high-level screening study to determine the effects of adding the new generation on the transmission system. The second step is the full interconnection study. These are detailed studies done by the transmission owners to determine the effects of the addition of new generation on the transmission system.
An electric network connected to the ERCOT transmission grid that contains load that is not directly metered by ERCOT (i.e., load that is typically netted with internal generation).
A generation resource unit operated under the terms of an agreement with ERCOT that would not otherwise be operated except that they are necessary to provide voltage support, stability or management of localized transmission constraints under first contingency criteria.
5

1 The following units entered into mothball status:
Name UnitCode Fuel CapacityMonticello 1 * MNSES_UNIT1 Coal 565 Monticello 2 * MNSES_UNIT2 Coal 565 Sam Bertron 1 SRB_SRB_G1 Gas 118 Sam Bertron 2 SRB_SRB_G2 Gas 174 Sam Bertron 3 SRB_SRB_G3 Gas 230 Sam Bertron 4 SRB_SRB_G4 Gas 230 Sam Bertron T2 SRB_SRBGT_2 Gas 13 AES Deepwater APD_APD_G1 Other 138
Total 2,033 * expected to return prior to Summer 2013
2 Removed Projects:
Name Expected InService Fuel Capacity ReasonColeto Creek 2 Dec-16 Coal 660 CancelledLas Brisas Dec-17 Pet Coke 1,240 Air Permit RevokedRRE Solar Oct-13 Solar 60 SuspendedBaker Ranch Dec-12 Wind 400 Cancelled
Total 2,360
3 Added Projects
Name Expected InService Fuel CapacityNoTrees Battery Jan-13 Storage 36 Ferguson Replacement Jul-14 Gas 570 Texas Clean Energy Jan-16 Coal 240 Goldthwaite Wind Energy Dec-13 Wind 150 Midway Wind Farms Dec-13 Wind 161 Moore Wind 1 Aug-14 Wind 149 Conway Windfarm Dec-14 Wind 600 DC_R Tie Jun-14 Other 150 Mesquite Creek Wind Mar-15 Wind 249
Total 2,305
4 Change in Registered Capacity
Reduction of 266 MW capacity over all units
Changes from 2012 CDR (May Release)
6
1. http://interchange.puc.texas.gov/WebApp/Interchange/application/dbapps/filings/pgSearch_Results.asp?TXT_CNTR_NO=40000&TXT_ITEM_NO=3082. http://interchange.puc.texas.gov/WebApp/Interchange/application/dbapps/filings/pgSearch_Results.asp?TXT_CNTR_NO=40000&TXT_ITEM_NO=319
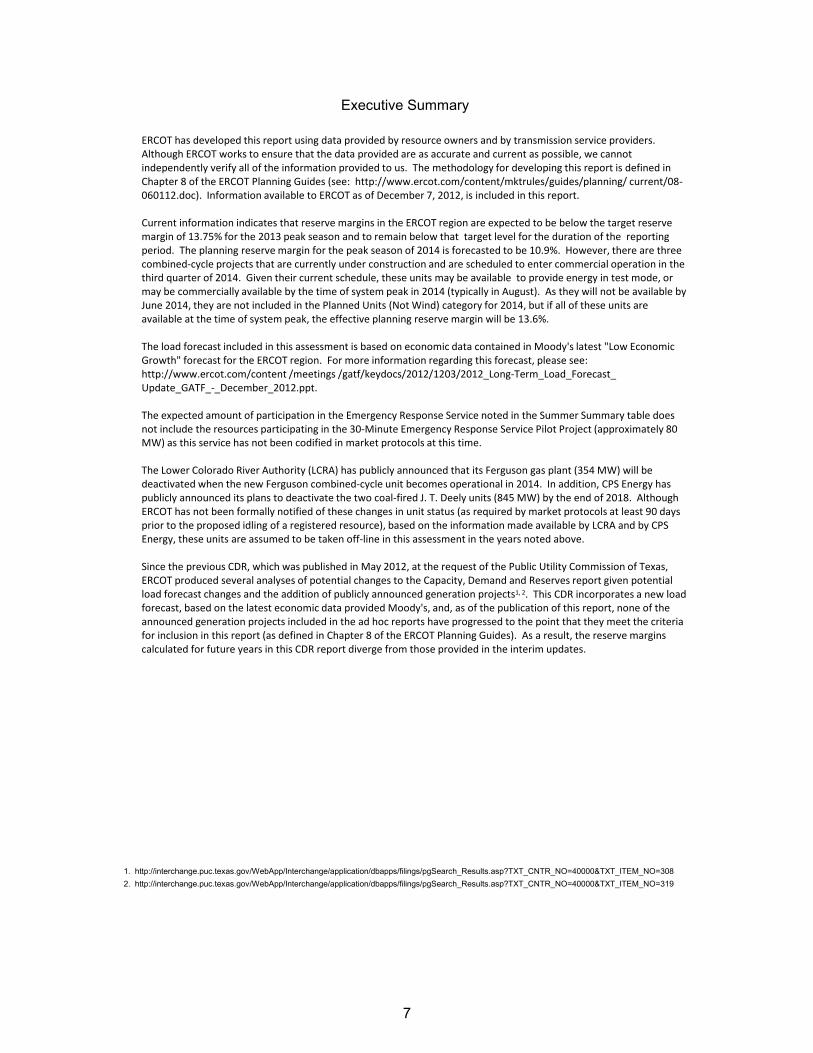
Executive Summary
ERCOT has developed this report using data provided by resource owners and by transmission service providers. Although ERCOT works to ensure that the data provided are as accurate and current as possible, we cannot independently verify all of the information provided to us. The methodology for developing this report is defined in Chapter 8 of the ERCOT Planning Guides (see: http://www.ercot.com/content/mktrules/guides/planning/ current/08-060112.doc). Information available to ERCOT as of December 7, 2012, is included in this report. Current information indicates that reserve margins in the ERCOT region are expected to be below the target reserve margin of 13.75% for the 2013 peak season and to remain below that target level for the duration of the reporting period. The planning reserve margin for the peak season of 2014 is forecasted to be 10.9%. However, there are three combined-cycle projects that are currently under construction and are scheduled to enter commercial operation in the third quarter of 2014. Given their current schedule, these units may be available to provide energy in test mode, or may be commercially available by the time of system peak in 2014 (typically in August). As they will not be available by June 2014, they are not included in the Planned Units (Not Wind) category for 2014, but if all of these units are available at the time of system peak, the effective planning reserve margin will be 13.6%. The load forecast included in this assessment is based on economic data contained in Moody's latest "Low Economic Growth" forecast for the ERCOT region. For more information regarding this forecast, please see: http://www.ercot.com/content /meetings /gatf/keydocs/2012/1203/2012_Long-Term_Load_Forecast_ Update_GATF_-_December_2012.ppt. The expected amount of participation in the Emergency Response Service noted in the Summer Summary table does not include the resources participating in the 30-Minute Emergency Response Service Pilot Project (approximately 80 MW) as this service has not been codified in market protocols at this time. The Lower Colorado River Authority (LCRA) has publicly announced that its Ferguson gas plant (354 MW) will be deactivated when the new Ferguson combined-cycle unit becomes operational in 2014. In addition, CPS Energy has publicly announced its plans to deactivate the two coal-fired J. T. Deely units (845 MW) by the end of 2018. Although ERCOT has not been formally notified of these changes in unit status (as required by market protocols at least 90 days prior to the proposed idling of a registered resource), based on the information made available by LCRA and by CPS Energy, these units are assumed to be taken off-line in this assessment in the years noted above. Since the previous CDR, which was published in May 2012, at the request of the Public Utility Commission of Texas, ERCOT produced several analyses of potential changes to the Capacity, Demand and Reserves report given potential load forecast changes and the addition of publicly announced generation projects1, 2. This CDR incorporates a new load forecast, based on the latest economic data provided Moody's, and, as of the publication of this report, none of the announced generation projects included in the ad hoc reports have progressed to the point that they meet the criteria for inclusion in this report (as defined in Chapter 8 of the ERCOT Planning Guides). As a result, the reserve margins calculated for future years in this CDR report diverge from those provided in the interim updates.
7

Load Forecast: 2013 2014 2015 2016 2017 2018 2019 2020 2021 2022Total Summer Peak Demand, MW 67,998 69,807 72,071 74,191 75,409 76,186 76,882 77,608 78,380 79,055 less LRS Serving as Responsive Reserve, MW 1,222 1,222 1,222 1,222 1,222 1,222 1,222 1,222 1,222 1,222 less LRS Serving as Non-Spinning Reserve, MW - - - - - - - - - - less Emergency Response Service 432 475 523 575 632 696 765 842 926 1,019 less Energy Efficiency Programs (per SB1125) 392 518 648 781 917 1,054 1,193 1,210 1,225 1,238 Firm Load Forecast, MW 65,952 67,592 69,679 71,613 72,637 73,214 73,702 74,334 75,007 75,576
Resources: 2013 2014 2015 2016 2017 2018 2019 2020 2021 2022Installed Capacity, MW 64,217 64,217 63,863 63,863 63,863 63,863 63,018 63,018 63,018 63,018 Capacity from Private Networks, MW 4,390 4,390 4,390 4,390 4,390 4,390 4,390 4,390 4,390 4,390 Effective Load-Carrying Capability (ELCC) of Wind Generation, MW 873 873 873 873 873 873 873 873 873 873 RMR Units to be under Contract, MW - - - - - - - - - - Operational Generation, MW 69,480 69,480 69,126 69,126 69,126 69,126 68,281 68,281 68,281 68,281
50% of Non-Synchronous Ties, MW 553 628 628 628 628 628 628 628 628 628 Switchable Units, MW 2,962 2,962 2,962 2,962 2,962 2,962 2,962 2,962 2,962 2,962 Available Mothballed Generation, MW 911 1,068 1,200 877 536 229 - - - - Planned Units (not wind) with Signed IA and Air Permit, MW 961 961 3,149 4,169 5,549 5,549 5,549 5,549 5,549 5,549 ELCC of Planned Wind Units with Signed IA, MW 83 161 226 258 258 258 258 258 258 258 Total Resources, MW 74,950 75,260 77,291 78,020 79,059 78,752 77,678 77,678 77,678 77,678
less Switchable Units Unavailable to ERCOT, MW 317 317 317 317 317 317 317 317 - - less Retiring Units, MW - - - - - - - - - - Resources, MW 74,633 74,943 76,974 77,703 78,742 78,435 77,361 77,361 77,678 77,678
Reserve Margin 13.2% 10.9% 10.5% 8.5% 8.4% 7.1% 5.0% 4.1% 3.6% 2.8%(Resources - Firm Load Forecast)/Firm Load Forecast
2012 Report on the Capacity, Demand, and Reserves in the ERCOT Region (December Update)Summer Summary
8

2012 Report on the Capacity, Demand, and Reserves in the ERCOT Region (December Update)
Summer Summary
50,000
55,000
60,000
65,000
70,000
75,000
80,000
85,000
90,000
2013 2014 2015 2016 2017 2018 2019 2020 2021 2022
MW
Year
Summer Peak Loads and Resources
Firm Load Forecast Resources Forecast + Target Reserve Margin
9

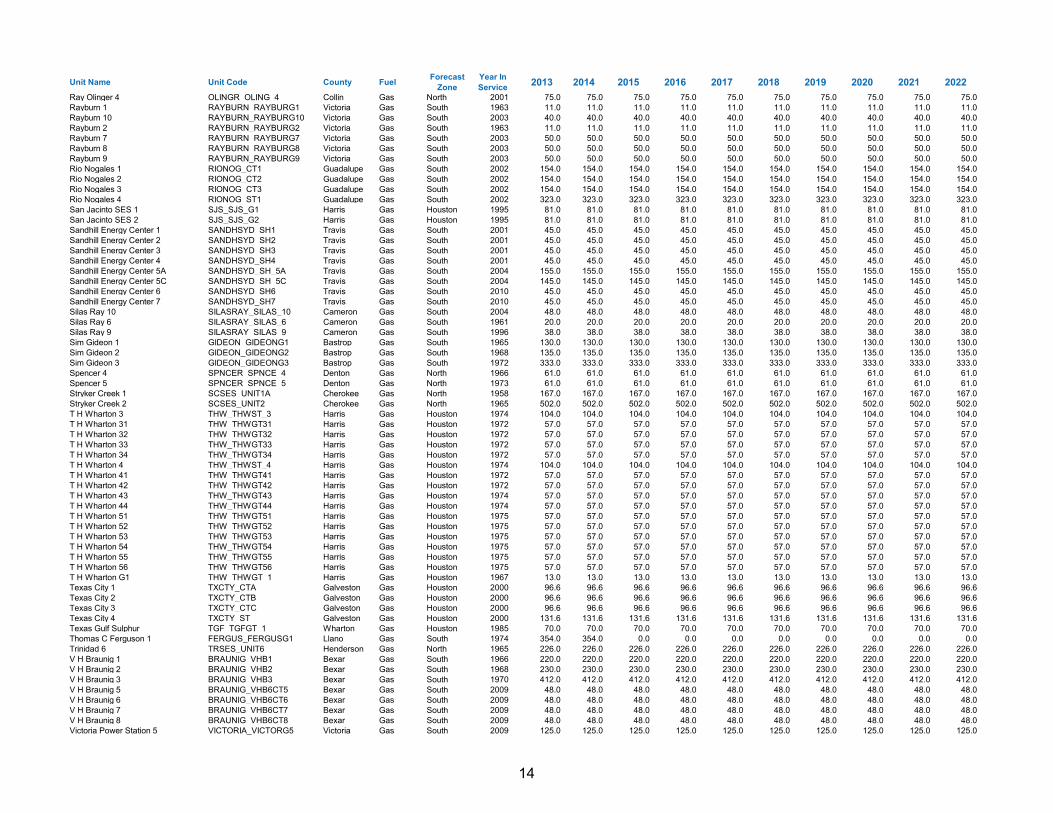
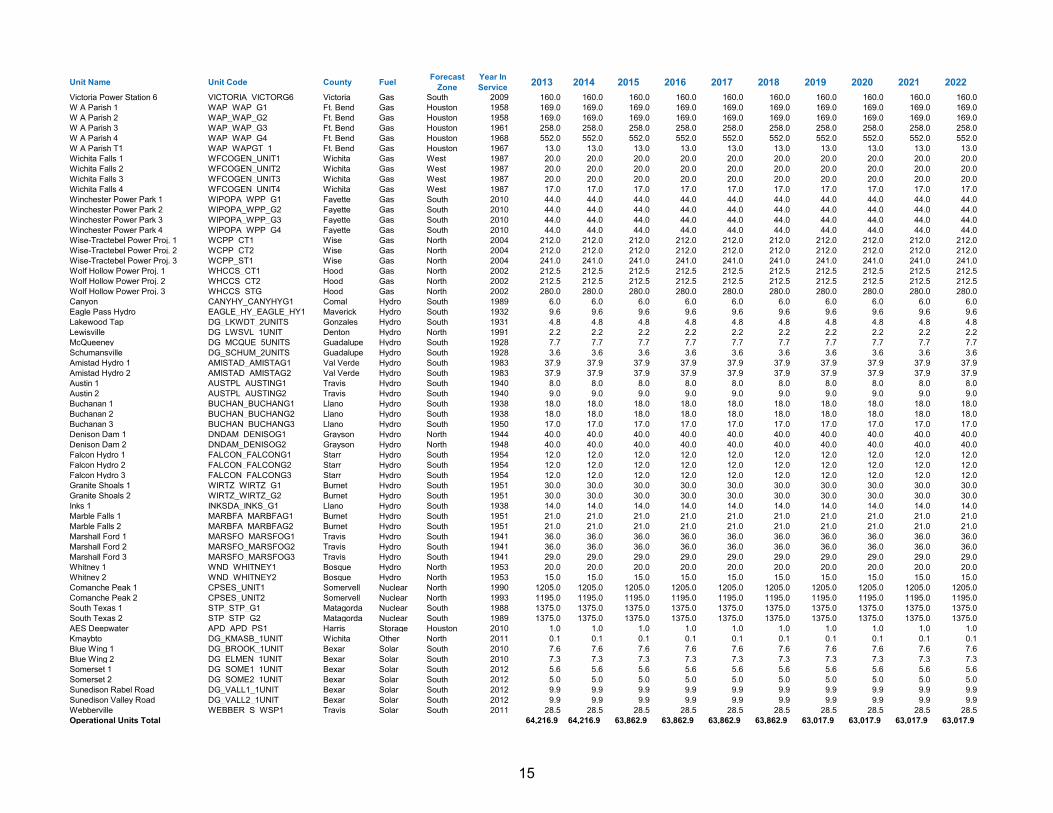
Individual Unit Capacities and CharacteristicsUnits used in determining the total generation resources in the Summer Summary
Unit Name Unit Code County Fuel Forecast Zone
Year In Service 2013 2014 2015 2016 2017 2018 2019 2020 2021 2022
Operational UnitsAlvin AV_DG1 Galveston Biomass Houston 2002 6.7 6.7 6.7 6.7 6.7 6.7 6.7 6.7 6.7 6.7Austin Landfill Gas DG_SPRIN_4UNITS Travis Biomass South 2007 6.4 6.4 6.4 6.4 6.4 6.4 6.4 6.4 6.4 6.4Covel Gardens Power Station DG_MEDIN_1UNIT Bexar Biomass South 2005 9.6 9.6 9.6 9.6 9.6 9.6 9.6 9.6 9.6 9.6DFW Gas Recovery DG_BIO2_4UNITS Denton Biomass North 2009 6.4 6.4 6.4 6.4 6.4 6.4 6.4 6.4 6.4 6.4DG_Bioenergy Partners DG_BIOE_2UNITS Denton Biomass North 1988 6.2 6.2 6.2 6.2 6.2 6.2 6.2 6.2 6.2 6.2Farmer's Branch Landfill DG_HBR Denton Biomass North 2011 3.2 3.2 3.2 3.2 3.2 3.2 3.2 3.2 3.2 3.2FW Region Gen Facility DG_RDLML_1UNIT Tarrant Biomass North 2006 1.6 1.6 1.6 1.6 1.6 1.6 1.6 1.6 1.6 1.6Humble HB_DG1 Harris Biomass Houston 2002 10.0 10.0 10.0 10.0 10.0 10.0 10.0 10.0 10.0 10.0Liberty LB_DG1 Harris Biomass Houston 2002 3.9 3.9 3.9 3.9 3.9 3.9 3.9 3.9 3.9 3.9Lufkin Biomass LFBIO_UNIT1 Angelina Biomass North 2011 53.0 53.0 53.0 53.0 53.0 53.0 53.0 53.0 53.0 53.0McKinney Landfill DG_MKNSW_2UNITS Collin Biomass North 2011 3.2 3.2 3.2 3.2 3.2 3.2 3.2 3.2 3.2 3.2Mesquite Creek Energy DG_FREIH_2UNITS Comal Biomass South 2010 3.2 3.2 3.2 3.2 3.2 3.2 3.2 3.2 3.2 3.2Nacogdoches Power NACPW_UNIT1 Nacogdoches Biomass North 2012 105.0 105.0 105.0 105.0 105.0 105.0 105.0 105.0 105.0 105.0Skyline Landfill Energy DG_FERIS_4UNITS Dallas Biomass North 2007 6.4 6.4 6.4 6.4 6.4 6.4 6.4 6.4 6.4 6.4Trinity Bay TRN_DG1 Chambers Biomass Houston 2002 3.9 3.9 3.9 3.9 3.9 3.9 3.9 3.9 3.9 3.9Trinity Oaks LFG DG_KLBRG_1UNIT Dallas Biomass North 2009 3.2 3.2 3.2 3.2 3.2 3.2 3.2 3.2 3.2 3.2Walzem Road DG_WALZE_4UNITS Bexar Biomass South 2002 9.8 9.8 9.8 9.8 9.8 9.8 9.8 9.8 9.8 9.8Westside DG_WSTHL_3UNITS Parker Biomass North 2010 4.8 4.8 4.8 4.8 4.8 4.8 4.8 4.8 4.8 4.8Big Brown 1 BBSES_UNIT1 Freestone Coal North 1971 600.0 600.0 600.0 600.0 600.0 600.0 600.0 600.0 600.0 600.0Big Brown 2 BBSES_UNIT2 Freestone Coal North 1972 595.0 595.0 595.0 595.0 595.0 595.0 595.0 595.0 595.0 595.0Coleto Creek COLETO_COLETOG1 Goliad Coal South 1980 650.0 650.0 650.0 650.0 650.0 650.0 650.0 650.0 650.0 650.0Fayette Power Project 1 FPPYD1_FPP_G1 Fayette Coal South 1979 604.0 604.0 604.0 604.0 604.0 604.0 604.0 604.0 604.0 604.0Fayette Power Project 2 FPPYD1_FPP_G2 Fayette Coal South 1980 599.0 599.0 599.0 599.0 599.0 599.0 599.0 599.0 599.0 599.0Fayette Power Project 3 FPPYD2_FPP_G3 Fayette Coal South 1988 441.0 441.0 441.0 441.0 441.0 441.0 441.0 441.0 441.0 441.0Gibbons Creek 1 GIBCRK_GIB_CRG1 Grimes Coal North 1982 470.0 470.0 470.0 470.0 470.0 470.0 470.0 470.0 470.0 470.0J K Spruce 1 CALAVERS_JKS1 Bexar Coal South 1992 555.0 555.0 555.0 555.0 555.0 555.0 555.0 555.0 555.0 555.0J K Spruce 2 CALAVERS_JKS2 Bexar Coal South 2010 775.0 775.0 775.0 775.0 775.0 775.0 775.0 775.0 775.0 775.0J T Deely 1 CALAVERS_JTD1 Bexar Coal South 1977 425.0 425.0 425.0 425.0 425.0 425.0 0.0 0.0 0.0 0.0J T Deely 2 CALAVERS_JTD2 Bexar Coal South 1978 420.0 420.0 420.0 420.0 420.0 420.0 0.0 0.0 0.0 0.0Limestone 1 LEG_LEG_G1 Limestone Coal North 1985 831.0 831.0 831.0 831.0 831.0 831.0 831.0 831.0 831.0 831.0Limestone 2 LEG_LEG_G2 Limestone Coal North 1986 858.0 858.0 858.0 858.0 858.0 858.0 858.0 858.0 858.0 858.0Martin Lake 1 MLSES_UNIT1 Rusk Coal North 1977 800.0 800.0 800.0 800.0 800.0 800.0 800.0 800.0 800.0 800.0Martin Lake 2 MLSES_UNIT2 Rusk Coal North 1978 805.0 805.0 805.0 805.0 805.0 805.0 805.0 805.0 805.0 805.0Martin Lake 3 MLSES_UNIT3 Rusk Coal North 1979 805.0 805.0 805.0 805.0 805.0 805.0 805.0 805.0 805.0 805.0Monticello 1 MNSES_UNIT1 Titus Coal North 1974 565.0 565.0 565.0 565.0 565.0 565.0 565.0 565.0 565.0 565.0Monticello 2 MNSES_UNIT2 Titus Coal North 1975 565.0 565.0 565.0 565.0 565.0 565.0 565.0 565.0 565.0 565.0Monticello 3 MNSES_UNIT3 Titus Coal North 1978 760.0 760.0 760.0 760.0 760.0 760.0 760.0 760.0 760.0 760.0Oak Grove SES Unit 1 OGSES_UNIT1A Robertson Coal North 2011 840.0 840.0 840.0 840.0 840.0 840.0 840.0 840.0 840.0 840.0Oak Grove SES Unit 2 OGSES_UNIT2 Robertson Coal North 2011 825.0 825.0 825.0 825.0 825.0 825.0 825.0 825.0 825.0 825.0Oklaunion 1 OKLA_OKLA_G1 Wilbarger Coal West 1986 650.0 650.0 650.0 650.0 650.0 650.0 650.0 650.0 650.0 650.0San Miguel 1 SANMIGL_SANMIGG1 Atascosa Coal South 1982 391.0 391.0 391.0 391.0 391.0 391.0 391.0 391.0 391.0 391.0Sandow 5 SD5SES_UNIT5 Milam Coal South 2010 570.0 570.0 570.0 570.0 570.0 570.0 570.0 570.0 570.0 570.0Twin Oaks 1 TNP_ONE_TNP_O_1 Robertson Coal North 1990 156.0 156.0 156.0 156.0 156.0 156.0 156.0 156.0 156.0 156.0Twin Oaks 2 TNP_ONE_TNP_O_2 Robertson Coal North 1991 156.0 156.0 156.0 156.0 156.0 156.0 156.0 156.0 156.0 156.0W A Parish 5 WAP_WAP_G5 Ft. Bend Coal Houston 1977 659.0 659.0 659.0 659.0 659.0 659.0 659.0 659.0 659.0 659.0W A Parish 6 WAP_WAP_G6 Ft. Bend Coal Houston 1978 658.0 658.0 658.0 658.0 658.0 658.0 658.0 658.0 658.0 658.0W A Parish 7 WAP_WAP_G7 Ft. Bend Coal Houston 1980 577.0 577.0 577.0 577.0 577.0 577.0 577.0 577.0 577.0 577.0W A Parish 8 WAP_WAP_G8 Ft. Bend Coal Houston 1982 610.0 610.0 610.0 610.0 610.0 610.0 610.0 610.0 610.0 610.0A von Rosenberg 1-CT1 BRAUNIG_AVR1_CT1 Bexar Gas South 2000 155.0 155.0 155.0 155.0 155.0 155.0 155.0 155.0 155.0 155.0A von Rosenberg 1-CT2 BRAUNIG_AVR1_CT2 Bexar Gas South 2000 155.0 155.0 155.0 155.0 155.0 155.0 155.0 155.0 155.0 155.0A von Rosenberg 1-ST1 BRAUNIG_AVR1_ST Bexar Gas South 2000 180.0 180.0 180.0 180.0 180.0 180.0 180.0 180.0 180.0 180.0Atkins 7 ATKINS_ATKINSG7 Brazos Gas North 1973 20.0 20.0 20.0 20.0 20.0 20.0 20.0 20.0 20.0 20.0B M Davis 1 B_DAVIS_B_DAVIG1 Nueces Gas South 1974 335.0 335.0 335.0 335.0 335.0 335.0 335.0 335.0 335.0 335.0B M Davis 2 B_DAVIS_B_DAVIG2 Nueces Gas South 1976 319.0 319.0 319.0 319.0 319.0 319.0 319.0 319.0 319.0 319.0
Operational capacities are based on unit testing as provided by the plant owners. This list includes MW available to the grid from private network (self-serve) units. It also includes distributed generation units that have registered with ERCOT.
10

Unit Name Unit Code County Fuel Forecast Zone
Year In Service 2013 2014 2015 2016 2017 2018 2019 2020 2021 2022
B M Davis 3 B_DAVIS_B_DAVIG3 Nueces Gas South 2009 157.0 157.0 157.0 157.0 157.0 157.0 157.0 157.0 157.0 157.0B M Davis 4 B_DAVIS_B_DAVIG4 Nueces Gas South 2009 157.0 157.0 157.0 157.0 157.0 157.0 157.0 157.0 157.0 157.0Bastrop Energy Center 1 BASTEN_GTG1100 Bastrop Gas South 2002 150.0 150.0 150.0 150.0 150.0 150.0 150.0 150.0 150.0 150.0Bastrop Energy Center 2 BASTEN_GTG2100 Bastrop Gas South 2002 150.0 150.0 150.0 150.0 150.0 150.0 150.0 150.0 150.0 150.0Bastrop Energy Center 3 BASTEN_ST0100 Bastrop Gas South 2002 233.0 233.0 233.0 233.0 233.0 233.0 233.0 233.0 233.0 233.0Big Spring CARBN_BSP_1 Howard Gas West 2006 17.5 17.5 17.5 17.5 17.5 17.5 17.5 17.5 17.5 17.5Bosque County Peaking 1 BOSQUESW_BSQSU_1 Bosque Gas North 2000 149.0 149.0 149.0 149.0 149.0 149.0 149.0 149.0 149.0 149.0Bosque County Peaking 2 BOSQUESW_BSQSU_2 Bosque Gas North 2000 149.0 149.0 149.0 149.0 149.0 149.0 149.0 149.0 149.0 149.0Bosque County Peaking 3 BOSQUESW_BSQSU_3 Bosque Gas North 2001 145.0 145.0 145.0 145.0 145.0 145.0 145.0 145.0 145.0 145.0Bosque County Peaking 4 BOSQUESW_BSQSU_4 Bosque Gas North 2001 78.0 78.0 78.0 78.0 78.0 78.0 78.0 78.0 78.0 78.0Bosque County Unit 5 BOSQUESW_BSQSU_5 Bosque Gas North 2009 205.0 205.0 205.0 205.0 205.0 205.0 205.0 205.0 205.0 205.0Brazos Valley 1 BVE_UNIT1 Ft Bend Gas Houston 2003 166.0 166.0 166.0 166.0 166.0 166.0 166.0 166.0 166.0 166.0Brazos Valley 2 BVE_UNIT2 Ft Bend Gas Houston 2003 166.0 166.0 166.0 166.0 166.0 166.0 166.0 166.0 166.0 166.0Brazos Valley 3 BVE_UNIT3 Ft Bend Gas Houston 2003 270.0 270.0 270.0 270.0 270.0 270.0 270.0 270.0 270.0 270.0Calenergy (Falcon Seaboard) 1 FLCNS_UNIT1 Howard Gas West 1987 75.0 75.0 75.0 75.0 75.0 75.0 75.0 75.0 75.0 75.0Calenergy (Falcon Seaboard) 2 FLCNS_UNIT2 Howard Gas West 1987 75.0 75.0 75.0 75.0 75.0 75.0 75.0 75.0 75.0 75.0Calenergy (Falcon Seaboard) 3 FLCNS_UNIT3 Howard Gas West 1988 70.0 70.0 70.0 70.0 70.0 70.0 70.0 70.0 70.0 70.0Cedar Bayou 1 CBY_CBY_G1 Chambers Gas Houston 1970 745.0 745.0 745.0 745.0 745.0 745.0 745.0 745.0 745.0 745.0Cedar Bayou 2 CBY_CBY_G2 Chambers Gas Houston 1972 749.0 749.0 749.0 749.0 749.0 749.0 749.0 749.0 749.0 749.0Cedar Bayou 4 CBY4_CT41 Chambers Gas Houston 2009 163.0 163.0 163.0 163.0 163.0 163.0 163.0 163.0 163.0 163.0Cedar Bayou 5 CBY4_CT42 Chambers Gas Houston 2009 163.0 163.0 163.0 163.0 163.0 163.0 163.0 163.0 163.0 163.0Cedar Bayou 6 CBY4_ST04 Chambers Gas Houston 2009 178.0 178.0 178.0 178.0 178.0 178.0 178.0 178.0 178.0 178.0Colorado Bend Energy Center CBEC_GT1 Wharton Gas Houston 2007 76.0 76.0 76.0 76.0 76.0 76.0 76.0 76.0 76.0 76.0Colorado Bend Energy Center CBEC_GT2 Wharton Gas Houston 2007 69.0 69.0 69.0 69.0 69.0 69.0 69.0 69.0 69.0 69.0Colorado Bend Energy Center CBEC_GT3 Wharton Gas Houston 2008 72.0 72.0 72.0 72.0 72.0 72.0 72.0 72.0 72.0 72.0Colorado Bend Energy Center CBEC_GT4 Wharton Gas Houston 2008 72.0 72.0 72.0 72.0 72.0 72.0 72.0 72.0 72.0 72.0Colorado Bend Energy Center CBEC_STG1 Wharton Gas Houston 2007 103.0 103.0 103.0 103.0 103.0 103.0 103.0 103.0 103.0 103.0Colorado Bend Energy Center CBEC_STG2 Wharton Gas Houston 2008 106.0 106.0 106.0 106.0 106.0 106.0 106.0 106.0 106.0 106.0CVC Channelview 1 CVC_CVC_G1 Harris Gas Houston 2008 156.0 156.0 156.0 156.0 156.0 156.0 156.0 156.0 156.0 156.0CVC Channelview 2 CVC_CVC_G2 Harris Gas Houston 2008 158.0 158.0 158.0 158.0 158.0 158.0 158.0 158.0 158.0 158.0CVC Channelview 3 CVC_CVC_G3 Harris Gas Houston 2008 160.0 160.0 160.0 160.0 160.0 160.0 160.0 160.0 160.0 160.0CVC Channelview 5 CVC_CVC_G5 Harris Gas Houston 2008 122.0 122.0 122.0 122.0 122.0 122.0 122.0 122.0 122.0 122.0Dansby 1 DANSBY_DANSBYG1 Brazos Gas North 1978 110.0 110.0 110.0 110.0 110.0 110.0 110.0 110.0 110.0 110.0Dansby 2 DANSBY_DANSBYG2 Brazos Gas North 2004 48.0 48.0 48.0 48.0 48.0 48.0 48.0 48.0 48.0 48.0Dansby 3 DANSBY_DANSBYG3 Brazos Gas North 2010 48.0 48.0 48.0 48.0 48.0 48.0 48.0 48.0 48.0 48.0Decker Creek 1 DECKER_DPG1 Travis Gas South 2000 315.0 315.0 315.0 315.0 315.0 315.0 315.0 315.0 315.0 315.0Decker Creek 2 DECKER_DPG2 Travis Gas South 2000 420.0 420.0 420.0 420.0 420.0 420.0 420.0 420.0 420.0 420.0Decker Creek G1 DECKER_DPGT_1 Travis Gas South 2000 48.0 48.0 48.0 48.0 48.0 48.0 48.0 48.0 48.0 48.0Decker Creek G2 DECKER_DPGT_2 Travis Gas South 2000 48.0 48.0 48.0 48.0 48.0 48.0 48.0 48.0 48.0 48.0Decker Creek G3 DECKER_DPGT_3 Travis Gas South 2000 48.0 48.0 48.0 48.0 48.0 48.0 48.0 48.0 48.0 48.0Decker Creek G4 DECKER_DPGT_4 Travis Gas South 2000 48.0 48.0 48.0 48.0 48.0 48.0 48.0 48.0 48.0 48.0DeCordova A DCSES_CT10 Hood Gas North 2010 71.0 71.0 71.0 71.0 71.0 71.0 71.0 71.0 71.0 71.0DeCordova B DCSES_CT20 Hood Gas North 2010 70.0 70.0 70.0 70.0 70.0 70.0 70.0 70.0 70.0 70.0DeCordova C DCSES_CT30 Hood Gas North 2010 69.0 69.0 69.0 69.0 69.0 69.0 69.0 69.0 69.0 69.0DeCordova D DCSES_CT40 Hood Gas North 2010 68.0 68.0 68.0 68.0 68.0 68.0 68.0 68.0 68.0 68.0Deer Park Energy Center 1 DDPEC_GT1 Harris Gas Houston 2002 183.0 183.0 183.0 183.0 183.0 183.0 183.0 183.0 183.0 183.0Deer Park Energy Center 2 DDPEC_GT2 Harris Gas Houston 2002 199.0 199.0 199.0 199.0 199.0 199.0 199.0 199.0 199.0 199.0Deer Park Energy Center 3 DDPEC_GT3 Harris Gas Houston 2002 183.0 183.0 183.0 183.0 183.0 183.0 183.0 183.0 183.0 183.0Deer Park Energy Center 4 DDPEC_GT4 Harris Gas Houston 2002 199.0 199.0 199.0 199.0 199.0 199.0 199.0 199.0 199.0 199.0Deer Park Energy Center S DDPEC_ST1 Harris Gas Houston 2002 290.0 290.0 290.0 290.0 290.0 290.0 290.0 290.0 290.0 290.0Ennis Power Station 1 ETCCS_UNIT1 Ellis Gas North 2002 116.0 116.0 116.0 116.0 116.0 116.0 116.0 116.0 116.0 116.0Ennis Power Station 2 ETCCS_CT1 Ellis Gas North 2002 196.0 196.0 196.0 196.0 196.0 196.0 196.0 196.0 196.0 196.0ExTex La Porte Pwr Stn (AirPro) 1 AZ_AZ_G1 Harris Gas Houston 2009 38.0 38.0 38.0 38.0 38.0 38.0 38.0 38.0 38.0 38.0ExTex La Porte Pwr Stn (AirPro) 2 AZ_AZ_G2 Harris Gas Houston 2009 38.0 38.0 38.0 38.0 38.0 38.0 38.0 38.0 38.0 38.0ExTex La Porte Pwr Stn (AirPro) 3 AZ_AZ_G3 Harris Gas Houston 2009 38.0 38.0 38.0 38.0 38.0 38.0 38.0 38.0 38.0 38.0ExTex La Porte Pwr Stn (AirPro) 4 AZ_AZ_G4 Harris Gas Houston 2009 38.0 38.0 38.0 38.0 38.0 38.0 38.0 38.0 38.0 38.0Forney Energy Center GT11 FRNYPP_GT11 Kaufman Gas North 2003 159.7 159.7 159.7 159.7 159.7 159.7 159.7 159.7 159.7 159.7Forney Energy Center GT12 FRNYPP_GT12 Kaufman Gas North 2003 159.7 159.7 159.7 159.7 159.7 159.7 159.7 159.7 159.7 159.7Forney Energy Center GT13 FRNYPP_GT13 Kaufman Gas North 2003 159.7 159.7 159.7 159.7 159.7 159.7 159.7 159.7 159.7 159.7Forney Energy Center GT21 FRNYPP_GT21 Kaufman Gas North 2003 159.7 159.7 159.7 159.7 159.7 159.7 159.7 159.7 159.7 159.7Forney Energy Center GT22 FRNYPP_GT22 Kaufman Gas North 2003 159.7 159.7 159.7 159.7 159.7 159.7 159.7 159.7 159.7 159.7Forney Energy Center GT23 FRNYPP_GT23 Kaufman Gas North 2003 159.7 159.7 159.7 159.7 159.7 159.7 159.7 159.7 159.7 159.7Forney Energy Center STG10 FRNYPP_ST10 Kaufman Gas North 2003 400.9 400.9 400.9 400.9 400.9 400.9 400.9 400.9 400.9 400.9
11

Unit Name Unit Code County Fuel Forecast Zone
Year In Service 2013 2014 2015 2016 2017 2018 2019 2020 2021 2022
Forney Energy Center STG20 FRNYPP_ST20 Kaufman Gas North 2003 400.9 400.9 400.9 400.9 400.9 400.9 400.9 400.9 400.9 400.9Freestone Energy Center 1 FREC_GT1 Freestone Gas North 2002 151.6 151.6 151.6 151.6 151.6 151.6 151.6 151.6 151.6 151.6Freestone Energy Center 2 FREC_GT2 Freestone Gas North 2002 151.6 151.6 151.6 151.6 151.6 151.6 151.6 151.6 151.6 151.6Freestone Energy Center 3 FREC_ST3 Freestone Gas North 2002 176.2 176.2 176.2 176.2 176.2 176.2 176.2 176.2 176.2 176.2Freestone Energy Center 4 FREC_GT4 Freestone Gas North 2002 151.7 151.7 151.7 151.7 151.7 151.7 151.7 151.7 151.7 151.7Freestone Energy Center 5 FREC_GT5 Freestone Gas North 2002 151.7 151.7 151.7 151.7 151.7 151.7 151.7 151.7 151.7 151.7Freestone Energy Center 6 FREC_ST6 Freestone Gas North 2002 174.5 174.5 174.5 174.5 174.5 174.5 174.5 174.5 174.5 174.5Frontera 1 FRONTERA_FRONTEG1 Hidalgo Gas South 1999 145.0 145.0 145.0 145.0 145.0 145.0 145.0 145.0 145.0 145.0Frontera 2 FRONTERA_FRONTEG2 Hidalgo Gas South 1999 145.0 145.0 145.0 145.0 145.0 145.0 145.0 145.0 145.0 145.0Frontera 3 FRONTERA_FRONTEG3 Hidalgo Gas South 2000 185.0 185.0 185.0 185.0 185.0 185.0 185.0 185.0 185.0 185.0Graham 1 GRSES_UNIT1 Young Gas West 1960 225.0 225.0 225.0 225.0 225.0 225.0 225.0 225.0 225.0 225.0Graham 2 GRSES_UNIT2 Young Gas West 1969 390.0 390.0 390.0 390.0 390.0 390.0 390.0 390.0 390.0 390.0Greens Bayou 5 GBY_GBY_5 Harris Gas Houston 1973 406.0 406.0 406.0 406.0 406.0 406.0 406.0 406.0 406.0 406.0Greens Bayou 73 GBY_GBYGT73 Harris Gas Houston 1976 46.0 46.0 46.0 46.0 46.0 46.0 46.0 46.0 46.0 46.0Greens Bayou 74 GBY_GBYGT74 Harris Gas Houston 1976 46.0 46.0 46.0 46.0 46.0 46.0 46.0 46.0 46.0 46.0Greens Bayou 81 GBY_GBYGT81 Harris Gas Houston 1976 46.0 46.0 46.0 46.0 46.0 46.0 46.0 46.0 46.0 46.0Greens Bayou 83 GBY_GBYGT83 Harris Gas Houston 1976 56.0 56.0 56.0 56.0 56.0 56.0 56.0 56.0 56.0 56.0Greens Bayou 84 GBY_GBYGT84 Harris Gas Houston 1976 58.0 58.0 58.0 58.0 58.0 58.0 58.0 58.0 58.0 58.0Greenville Engine Plant STEAM_ENGINE_1 Hunt Gas North 2010 8.4 8.4 8.4 8.4 8.4 8.4 8.4 8.4 8.4 8.4Greenville Engine Plant STEAM_ENGINE_2 Hunt Gas North 2010 8.4 8.4 8.4 8.4 8.4 8.4 8.4 8.4 8.4 8.4Greenville Engine Plant STEAM_ENGINE_3 Hunt Gas North 2010 8.4 8.4 8.4 8.4 8.4 8.4 8.4 8.4 8.4 8.4Guadalupe Gen Stn 1 GUADG_GAS1 Guadalupe Gas South 2000 151.0 151.0 151.0 151.0 151.0 151.0 151.0 151.0 151.0 151.0Guadalupe Gen Stn 2 GUADG_GAS2 Guadalupe Gas South 2000 151.0 151.0 151.0 151.0 151.0 151.0 151.0 151.0 151.0 151.0Guadalupe Gen Stn 3 GUADG_GAS3 Guadalupe Gas South 2000 149.0 149.0 149.0 149.0 149.0 149.0 149.0 149.0 149.0 149.0Guadalupe Gen Stn 4 GUADG_GAS4 Guadalupe Gas South 2000 152.0 152.0 152.0 152.0 152.0 152.0 152.0 152.0 152.0 152.0Guadalupe Gen Stn 5 GUADG_STM5 Guadalupe Gas South 2000 170.0 170.0 170.0 170.0 170.0 170.0 170.0 170.0 170.0 170.0Guadalupe Gen Stn 6 GUADG_STM6 Guadalupe Gas South 2000 169.0 169.0 169.0 169.0 169.0 169.0 169.0 169.0 169.0 169.0Handley 3 HLSES_UNIT3 Tarrant Gas North 1963 395.0 395.0 395.0 395.0 395.0 395.0 395.0 395.0 395.0 395.0Handley 4 HLSES_UNIT4 Tarrant Gas North 1976 435.0 435.0 435.0 435.0 435.0 435.0 435.0 435.0 435.0 435.0Handley 5 HLSES_UNIT5 Tarrant Gas North 1977 435.0 435.0 435.0 435.0 435.0 435.0 435.0 435.0 435.0 435.0Hays Energy Facility 1 HAYSEN_HAYSENG1 Hays Gas South 2002 216.0 216.0 216.0 216.0 216.0 216.0 216.0 216.0 216.0 216.0Hays Energy Facility 2 HAYSEN_HAYSENG2 Hays Gas South 2002 216.0 216.0 216.0 216.0 216.0 216.0 216.0 216.0 216.0 216.0Hays Energy Facility 3 HAYSEN_HAYSENG3 Hays Gas South 2002 225.0 225.0 225.0 225.0 225.0 225.0 225.0 225.0 225.0 225.0Hays Energy Facility 4 HAYSEN_HAYSENG4 Hays Gas South 2002 225.0 225.0 225.0 225.0 225.0 225.0 225.0 225.0 225.0 225.0Hidalgo 1 DUKE_DUKE_GT1 Hidalgo Gas South 2000 143.0 143.0 143.0 143.0 143.0 143.0 143.0 143.0 143.0 143.0Hidalgo 2 DUKE_DUKE_GT2 Hidalgo Gas South 2000 143.0 143.0 143.0 143.0 143.0 143.0 143.0 143.0 143.0 143.0Hidalgo 3 DUKE_DUKE_ST1 Hidalgo Gas South 2000 172.0 172.0 172.0 172.0 172.0 172.0 172.0 172.0 172.0 172.0Jack County GenFacility 1 JACKCNTY_CT1 Jack Gas North 2005 166.0 166.0 166.0 166.0 166.0 166.0 166.0 166.0 166.0 166.0Jack County GenFacility 1 JACKCNTY_CT2 Jack Gas North 2005 165.0 165.0 165.0 165.0 165.0 165.0 165.0 165.0 165.0 165.0Jack County GenFacility 1 JACKCNTY_STG Jack Gas North 2005 295.0 295.0 295.0 295.0 295.0 295.0 295.0 295.0 295.0 295.0Jack County GenFacility 2 JCKCNTY2_CT3 Jack Gas North 2011 166.0 166.0 166.0 166.0 166.0 166.0 166.0 166.0 166.0 166.0Jack County GenFacility 2 JCKCNTY2_CT4 Jack Gas North 2011 165.0 165.0 165.0 165.0 165.0 165.0 165.0 165.0 165.0 165.0Jack County GenFacility 2 JCKCNTY2_ST2 Jack Gas North 2011 295.0 295.0 295.0 295.0 295.0 295.0 295.0 295.0 295.0 295.0Johnson County GenFacility 1 TEN_CT1 Johnson Gas North 1997 163.0 163.0 163.0 163.0 163.0 163.0 163.0 163.0 163.0 163.0Johnson County GenFacility 2 TEN_STG Johnson Gas North 1997 106.0 106.0 106.0 106.0 106.0 106.0 106.0 106.0 106.0 106.0Lake Hubbard 1 LHSES_UNIT1 Dallas Gas North 1970 392.0 392.0 392.0 392.0 392.0 392.0 392.0 392.0 392.0 392.0Lake Hubbard 2 LH2SES_UNIT2 Dallas Gas North 2010 515.0 515.0 515.0 515.0 515.0 515.0 515.0 515.0 515.0 515.0Lamar Power Project CT11 LPCCS_CT11 Lamar Gas North 2000 153.8 153.8 153.8 153.8 153.8 153.8 153.8 153.8 153.8 153.8Lamar Power Project CT12 LPCCS_CT12 Lamar Gas North 2000 153.8 153.8 153.8 153.8 153.8 153.8 153.8 153.8 153.8 153.8Lamar Power Project CT21 LPCCS_CT21 Lamar Gas North 2000 153.8 153.8 153.8 153.8 153.8 153.8 153.8 153.8 153.8 153.8Lamar Power Project CT22 LPCCS_CT22 Lamar Gas North 2000 153.8 153.8 153.8 153.8 153.8 153.8 153.8 153.8 153.8 153.8Lamar Power Project STG1 LPCCS_UNIT1 Lamar Gas North 2000 193.4 193.4 193.4 193.4 193.4 193.4 193.4 193.4 193.4 193.4Lamar Power Project STG2 LPCCS_UNIT2 Lamar Gas North 2000 193.4 193.4 193.4 193.4 193.4 193.4 193.4 193.4 193.4 193.4Laredo Peaking 4 LARDVFTN_G4 Webb Gas South 2008 94.2 94.2 94.2 94.2 94.2 94.2 94.2 94.2 94.2 94.2Laredo Peaking 5 LARDVFTN_G5 Webb Gas South 2008 94.2 94.2 94.2 94.2 94.2 94.2 94.2 94.2 94.2 94.2Leon Creek Peaking 1 LEON_CRK_LCPCT1 Bexar Gas South 2004 46.0 46.0 46.0 46.0 46.0 46.0 46.0 46.0 46.0 46.0Leon Creek Peaking 2 LEON_CRK_LCPCT2 Bexar Gas South 2004 46.0 46.0 46.0 46.0 46.0 46.0 46.0 46.0 46.0 46.0Leon Creek Peaking 3 LEON_CRK_LCPCT3 Bexar Gas South 2004 46.0 46.0 46.0 46.0 46.0 46.0 46.0 46.0 46.0 46.0Leon Creek Peaking 4 LEON_CRK_LCPCT4 Bexar Gas South 2004 46.0 46.0 46.0 46.0 46.0 46.0 46.0 46.0 46.0 46.0Lost Pines 1 LOSTPI_LOSTPGT1 Bastrop Gas South 2001 168.0 168.0 168.0 168.0 168.0 168.0 168.0 168.0 168.0 168.0Lost Pines 2 LOSTPI_LOSTPGT2 Bastrop Gas South 2001 156.0 156.0 156.0 156.0 156.0 156.0 156.0 156.0 156.0 156.0Lost Pines 3 LOSTPI_LOSTPST1 Bastrop Gas South 2001 178.0 178.0 178.0 178.0 178.0 178.0 178.0 178.0 178.0 178.0Magic Valley 1 NEDIN_NEDIN_G1 Hidalgo Gas South 2001 208.6 208.6 208.6 208.6 208.6 208.6 208.6 208.6 208.6 208.6
12

Unit Name Unit Code County Fuel Forecast Zone
Year In Service 2013 2014 2015 2016 2017 2018 2019 2020 2021 2022
Magic Valley 2 NEDIN_NEDIN_G2 Hidalgo Gas South 2001 208.6 208.6 208.6 208.6 208.6 208.6 208.6 208.6 208.6 208.6Magic Valley 3 NEDIN_NEDIN_G3 Hidalgo Gas South 2001 253.0 253.0 253.0 253.0 253.0 253.0 253.0 253.0 253.0 253.0Midlothian 1 MDANP_CT1 Ellis Gas North 2001 216.0 216.0 216.0 216.0 216.0 216.0 216.0 216.0 216.0 216.0Midlothian 2 MDANP_CT2 Ellis Gas North 2001 216.0 216.0 216.0 216.0 216.0 216.0 216.0 216.0 216.0 216.0Midlothian 3 MDANP_CT3 Ellis Gas North 2001 216.0 216.0 216.0 216.0 216.0 216.0 216.0 216.0 216.0 216.0Midlothian 4 MDANP_CT4 Ellis Gas North 2001 216.0 216.0 216.0 216.0 216.0 216.0 216.0 216.0 216.0 216.0Midlothian 5 MDANP_CT5 Ellis Gas North 2002 225.0 225.0 225.0 225.0 225.0 225.0 225.0 225.0 225.0 225.0Midlothian 6 MDANP_CT6 Ellis Gas North 2002 225.0 225.0 225.0 225.0 225.0 225.0 225.0 225.0 225.0 225.0Morgan Creek A MGSES_CT1 Mitchell Gas West 1988 68.0 68.0 68.0 68.0 68.0 68.0 68.0 68.0 68.0 68.0Morgan Creek B MGSES_CT2 Mitchell Gas West 1988 68.0 68.0 68.0 68.0 68.0 68.0 68.0 68.0 68.0 68.0Morgan Creek C MGSES_CT3 Mitchell Gas West 1988 68.0 68.0 68.0 68.0 68.0 68.0 68.0 68.0 68.0 68.0Morgan Creek D MGSES_CT4 Mitchell Gas West 1988 68.0 68.0 68.0 68.0 68.0 68.0 68.0 68.0 68.0 68.0Morgan Creek E MGSES_CT5 Mitchell Gas West 1988 68.0 68.0 68.0 68.0 68.0 68.0 68.0 68.0 68.0 68.0Morgan Creek F MGSES_CT6 Mitchell Gas West 1988 67.0 67.0 67.0 67.0 67.0 67.0 67.0 67.0 67.0 67.0Mountain Creek 6 MCSES_UNIT6 Dallas Gas North 1956 120.0 120.0 120.0 120.0 120.0 120.0 120.0 120.0 120.0 120.0Mountain Creek 7 MCSES_UNIT7 Dallas Gas North 1958 115.0 115.0 115.0 115.0 115.0 115.0 115.0 115.0 115.0 115.0Mountain Creek 8 MCSES_UNIT8 Dallas Gas North 1967 565.0 565.0 565.0 565.0 565.0 565.0 565.0 565.0 565.0 565.0Nueces Bay 7 NUECES_B_NUECESG7 Nueces Gas South 1972 319.0 319.0 319.0 319.0 319.0 319.0 319.0 319.0 319.0 319.0Nueces Bay 8 NUECES_B_NUECESG8 Nueces Gas South 2009 157.0 157.0 157.0 157.0 157.0 157.0 157.0 157.0 157.0 157.0Nueces Bay 9 NUECES_B_NUECESG9 Nueces Gas South 2009 157.0 157.0 157.0 157.0 157.0 157.0 157.0 157.0 157.0 157.0O W Sommers 1 CALAVERS_OWS1 Bexar Gas South 1972 420.0 420.0 420.0 420.0 420.0 420.0 420.0 420.0 420.0 420.0O W Sommers 2 CALAVERS_OWS2 Bexar Gas South 1974 420.0 420.0 420.0 420.0 420.0 420.0 420.0 420.0 420.0 420.0Odessa-Ector Gen Stn C11 OECCS_CT11 Ector Gas West 2001 151.0 151.0 151.0 151.0 151.0 151.0 151.0 151.0 151.0 151.0Odessa-Ector Gen Stn C12 OECCS_CT12 Ector Gas West 2001 140.4 140.4 140.4 140.4 140.4 140.4 140.4 140.4 140.4 140.4Odessa-Ector Gen Stn C21 OECCS_CT21 Ector Gas West 2001 144.7 144.7 144.7 144.7 144.7 144.7 144.7 144.7 144.7 144.7Odessa-Ector Gen Stn C22 OECCS_CT22 Ector Gas West 2001 142.4 142.4 142.4 142.4 142.4 142.4 142.4 142.4 142.4 142.4Odessa-Ector Gen Stn ST1 OECCS_UNIT1 Ector Gas West 2001 210.0 210.0 210.0 210.0 210.0 210.0 210.0 210.0 210.0 210.0Odessa-Ector Gen Stn ST2 OECCS_UNIT2 Ector Gas West 2001 210.0 210.0 210.0 210.0 210.0 210.0 210.0 210.0 210.0 210.0Paris Energy Center 1 TNSKA_GT1 Lamar Gas North 1989 76.0 76.0 76.0 76.0 76.0 76.0 76.0 76.0 76.0 76.0Paris Energy Center 2 TNSKA_GT2 Lamar Gas North 1989 76.0 76.0 76.0 76.0 76.0 76.0 76.0 76.0 76.0 76.0Paris Energy Center 3 TNSKA_STG Lamar Gas North 1990 87.0 87.0 87.0 87.0 87.0 87.0 87.0 87.0 87.0 87.0PasGen PSG_PSG_GT2 Harris Gas Houston 2000 164.0 164.0 164.0 164.0 164.0 164.0 164.0 164.0 164.0 164.0PasGen PSG_PSG_GT3 Harris Gas Houston 2000 164.0 164.0 164.0 164.0 164.0 164.0 164.0 164.0 164.0 164.0PasGen PSG_PSG_ST2 Harris Gas Houston 2000 167.0 167.0 167.0 167.0 167.0 167.0 167.0 167.0 167.0 167.0Pearsall 1 PEARSALL_PEARS_1 Frio Gas South 1961 25.0 25.0 25.0 25.0 25.0 25.0 25.0 25.0 25.0 25.0Pearsall 2 PEARSALL_PEARS_2 Frio Gas South 1961 25.0 25.0 25.0 25.0 25.0 25.0 25.0 25.0 25.0 25.0Pearsall 3 PEARSALL_PEARS_3 Frio Gas South 1961 25.0 25.0 25.0 25.0 25.0 25.0 25.0 25.0 25.0 25.0Pearsall Engine Plant PEARSAL2_AGR_A Frio Gas South 2010 50.6 50.6 50.6 50.6 50.6 50.6 50.6 50.6 50.6 50.6Pearsall Engine Plant PEARSAL2_AGR_B Frio Gas South 2010 50.6 50.6 50.6 50.6 50.6 50.6 50.6 50.6 50.6 50.6Pearsall Engine Plant PEARSAL2_AGR_C Frio Gas South 2010 50.6 50.6 50.6 50.6 50.6 50.6 50.6 50.6 50.6 50.6Pearsall Engine Plant PEARSAL2_AGR_D Frio Gas South 2010 50.6 50.6 50.6 50.6 50.6 50.6 50.6 50.6 50.6 50.6Permian Basin A PB2SES_CT1 Ward Gas West 1988 68.0 68.0 68.0 68.0 68.0 68.0 68.0 68.0 68.0 68.0Permian Basin B PB2SES_CT2 Ward Gas West 1988 65.0 65.0 65.0 65.0 65.0 65.0 65.0 65.0 65.0 65.0Permian Basin C PB2SES_CT3 Ward Gas West 1988 68.0 68.0 68.0 68.0 68.0 68.0 68.0 68.0 68.0 68.0Permian Basin D PB2SES_CT4 Ward Gas West 1990 69.0 69.0 69.0 69.0 69.0 69.0 69.0 69.0 69.0 69.0Permian Basin E PB2SES_CT5 Ward Gas West 1990 70.0 70.0 70.0 70.0 70.0 70.0 70.0 70.0 70.0 70.0Powerlane Plant 1 STEAM1A_STEAM_1 Hunt Gas North 2009 20.0 20.0 20.0 20.0 20.0 20.0 20.0 20.0 20.0 20.0Powerlane Plant 2 STEAM_STEAM_2 Hunt Gas North 1967 26.0 26.0 26.0 26.0 26.0 26.0 26.0 26.0 26.0 26.0Powerlane Plant 3 STEAM_STEAM_3 Hunt Gas North 1978 41.0 41.0 41.0 41.0 41.0 41.0 41.0 41.0 41.0 41.0Quail Run Energy GT1 QALSW_GT2 Ector Gas West 2007 74.0 74.0 74.0 74.0 74.0 74.0 74.0 74.0 74.0 74.0Quail Run Energy GT2 QALSW_GT3 Ector Gas West 2008 72.0 72.0 72.0 72.0 72.0 72.0 72.0 72.0 72.0 72.0Quail Run Energy GT3 QALSW_STG1 Ector Gas West 2007 98.0 98.0 98.0 98.0 98.0 98.0 98.0 98.0 98.0 98.0Quail Run Energy GT4 QALSW_STG2 Ector Gas West 2008 98.0 98.0 98.0 98.0 98.0 98.0 98.0 98.0 98.0 98.0Quail Run Energy STG1 QALSW_GT1 Ector Gas West 2007 74.0 74.0 74.0 74.0 74.0 74.0 74.0 74.0 74.0 74.0Quail Run Energy STG2 QALSW_GT4 Ector Gas West 2008 72.0 72.0 72.0 72.0 72.0 72.0 72.0 72.0 72.0 72.0R W Miller 1 MIL_MILLERG1 Palo Pinto Gas North 2000 75.0 75.0 75.0 75.0 75.0 75.0 75.0 75.0 75.0 75.0R W Miller 2 MIL_MILLERG2 Palo Pinto Gas North 2000 120.0 120.0 120.0 120.0 120.0 120.0 120.0 120.0 120.0 120.0R W Miller 3 MIL_MILLERG3 Palo Pinto Gas North 2000 208.0 208.0 208.0 208.0 208.0 208.0 208.0 208.0 208.0 208.0R W Miller 4 MIL_MILLERG4 Palo Pinto Gas North 2000 104.0 104.0 104.0 104.0 104.0 104.0 104.0 104.0 104.0 104.0R W Miller 5 MIL_MILLERG5 Palo Pinto Gas North 2000 104.0 104.0 104.0 104.0 104.0 104.0 104.0 104.0 104.0 104.0Ray Olinger 1 OLINGR_OLING_1 Collin Gas North 1967 78.0 78.0 78.0 78.0 78.0 78.0 78.0 78.0 78.0 78.0Ray Olinger 2 OLINGR_OLING_2 Collin Gas North 1971 107.0 107.0 107.0 107.0 107.0 107.0 107.0 107.0 107.0 107.0Ray Olinger 3 OLINGR_OLING_3 Collin Gas North 1975 146.0 146.0 146.0 146.0 146.0 146.0 146.0 146.0 146.0 146.0
13
Unit Name Unit Code County Fuel Forecast Zone
Year In Service 2013 2014 2015 2016 2017 2018 2019 2020 2021 2022
Ray Olinger 4 OLINGR_OLING_4 Collin Gas North 2001 75.0 75.0 75.0 75.0 75.0 75.0 75.0 75.0 75.0 75.0Rayburn 1 RAYBURN_RAYBURG1 Victoria Gas South 1963 11.0 11.0 11.0 11.0 11.0 11.0 11.0 11.0 11.0 11.0Rayburn 10 RAYBURN_RAYBURG10 Victoria Gas South 2003 40.0 40.0 40.0 40.0 40.0 40.0 40.0 40.0 40.0 40.0Rayburn 2 RAYBURN_RAYBURG2 Victoria Gas South 1963 11.0 11.0 11.0 11.0 11.0 11.0 11.0 11.0 11.0 11.0Rayburn 7 RAYBURN_RAYBURG7 Victoria Gas South 2003 50.0 50.0 50.0 50.0 50.0 50.0 50.0 50.0 50.0 50.0Rayburn 8 RAYBURN_RAYBURG8 Victoria Gas South 2003 50.0 50.0 50.0 50.0 50.0 50.0 50.0 50.0 50.0 50.0Rayburn 9 RAYBURN_RAYBURG9 Victoria Gas South 2003 50.0 50.0 50.0 50.0 50.0 50.0 50.0 50.0 50.0 50.0Rio Nogales 1 RIONOG_CT1 Guadalupe Gas South 2002 154.0 154.0 154.0 154.0 154.0 154.0 154.0 154.0 154.0 154.0Rio Nogales 2 RIONOG_CT2 Guadalupe Gas South 2002 154.0 154.0 154.0 154.0 154.0 154.0 154.0 154.0 154.0 154.0Rio Nogales 3 RIONOG_CT3 Guadalupe Gas South 2002 154.0 154.0 154.0 154.0 154.0 154.0 154.0 154.0 154.0 154.0Rio Nogales 4 RIONOG_ST1 Guadalupe Gas South 2002 323.0 323.0 323.0 323.0 323.0 323.0 323.0 323.0 323.0 323.0San Jacinto SES 1 SJS_SJS_G1 Harris Gas Houston 1995 81.0 81.0 81.0 81.0 81.0 81.0 81.0 81.0 81.0 81.0San Jacinto SES 2 SJS_SJS_G2 Harris Gas Houston 1995 81.0 81.0 81.0 81.0 81.0 81.0 81.0 81.0 81.0 81.0Sandhill Energy Center 1 SANDHSYD_SH1 Travis Gas South 2001 45.0 45.0 45.0 45.0 45.0 45.0 45.0 45.0 45.0 45.0Sandhill Energy Center 2 SANDHSYD_SH2 Travis Gas South 2001 45.0 45.0 45.0 45.0 45.0 45.0 45.0 45.0 45.0 45.0Sandhill Energy Center 3 SANDHSYD_SH3 Travis Gas South 2001 45.0 45.0 45.0 45.0 45.0 45.0 45.0 45.0 45.0 45.0Sandhill Energy Center 4 SANDHSYD_SH4 Travis Gas South 2001 45.0 45.0 45.0 45.0 45.0 45.0 45.0 45.0 45.0 45.0Sandhill Energy Center 5A SANDHSYD_SH_5A Travis Gas South 2004 155.0 155.0 155.0 155.0 155.0 155.0 155.0 155.0 155.0 155.0Sandhill Energy Center 5C SANDHSYD_SH_5C Travis Gas South 2004 145.0 145.0 145.0 145.0 145.0 145.0 145.0 145.0 145.0 145.0Sandhill Energy Center 6 SANDHSYD_SH6 Travis Gas South 2010 45.0 45.0 45.0 45.0 45.0 45.0 45.0 45.0 45.0 45.0Sandhill Energy Center 7 SANDHSYD_SH7 Travis Gas South 2010 45.0 45.0 45.0 45.0 45.0 45.0 45.0 45.0 45.0 45.0Silas Ray 10 SILASRAY_SILAS_10 Cameron Gas South 2004 48.0 48.0 48.0 48.0 48.0 48.0 48.0 48.0 48.0 48.0Silas Ray 6 SILASRAY_SILAS_6 Cameron Gas South 1961 20.0 20.0 20.0 20.0 20.0 20.0 20.0 20.0 20.0 20.0Silas Ray 9 SILASRAY_SILAS_9 Cameron Gas South 1996 38.0 38.0 38.0 38.0 38.0 38.0 38.0 38.0 38.0 38.0Sim Gideon 1 GIDEON_GIDEONG1 Bastrop Gas South 1965 130.0 130.0 130.0 130.0 130.0 130.0 130.0 130.0 130.0 130.0Sim Gideon 2 GIDEON_GIDEONG2 Bastrop Gas South 1968 135.0 135.0 135.0 135.0 135.0 135.0 135.0 135.0 135.0 135.0Sim Gideon 3 GIDEON_GIDEONG3 Bastrop Gas South 1972 333.0 333.0 333.0 333.0 333.0 333.0 333.0 333.0 333.0 333.0Spencer 4 SPNCER_SPNCE_4 Denton Gas North 1966 61.0 61.0 61.0 61.0 61.0 61.0 61.0 61.0 61.0 61.0Spencer 5 SPNCER_SPNCE_5 Denton Gas North 1973 61.0 61.0 61.0 61.0 61.0 61.0 61.0 61.0 61.0 61.0Stryker Creek 1 SCSES_UNIT1A Cherokee Gas North 1958 167.0 167.0 167.0 167.0 167.0 167.0 167.0 167.0 167.0 167.0Stryker Creek 2 SCSES_UNIT2 Cherokee Gas North 1965 502.0 502.0 502.0 502.0 502.0 502.0 502.0 502.0 502.0 502.0T H Wharton 3 THW_THWST_3 Harris Gas Houston 1974 104.0 104.0 104.0 104.0 104.0 104.0 104.0 104.0 104.0 104.0T H Wharton 31 THW_THWGT31 Harris Gas Houston 1972 57.0 57.0 57.0 57.0 57.0 57.0 57.0 57.0 57.0 57.0T H Wharton 32 THW_THWGT32 Harris Gas Houston 1972 57.0 57.0 57.0 57.0 57.0 57.0 57.0 57.0 57.0 57.0T H Wharton 33 THW_THWGT33 Harris Gas Houston 1972 57.0 57.0 57.0 57.0 57.0 57.0 57.0 57.0 57.0 57.0T H Wharton 34 THW_THWGT34 Harris Gas Houston 1972 57.0 57.0 57.0 57.0 57.0 57.0 57.0 57.0 57.0 57.0T H Wharton 4 THW_THWST_4 Harris Gas Houston 1974 104.0 104.0 104.0 104.0 104.0 104.0 104.0 104.0 104.0 104.0T H Wharton 41 THW_THWGT41 Harris Gas Houston 1972 57.0 57.0 57.0 57.0 57.0 57.0 57.0 57.0 57.0 57.0T H Wharton 42 THW_THWGT42 Harris Gas Houston 1972 57.0 57.0 57.0 57.0 57.0 57.0 57.0 57.0 57.0 57.0T H Wharton 43 THW_THWGT43 Harris Gas Houston 1974 57.0 57.0 57.0 57.0 57.0 57.0 57.0 57.0 57.0 57.0T H Wharton 44 THW_THWGT44 Harris Gas Houston 1974 57.0 57.0 57.0 57.0 57.0 57.0 57.0 57.0 57.0 57.0T H Wharton 51 THW_THWGT51 Harris Gas Houston 1975 57.0 57.0 57.0 57.0 57.0 57.0 57.0 57.0 57.0 57.0T H Wharton 52 THW_THWGT52 Harris Gas Houston 1975 57.0 57.0 57.0 57.0 57.0 57.0 57.0 57.0 57.0 57.0T H Wharton 53 THW_THWGT53 Harris Gas Houston 1975 57.0 57.0 57.0 57.0 57.0 57.0 57.0 57.0 57.0 57.0T H Wharton 54 THW_THWGT54 Harris Gas Houston 1975 57.0 57.0 57.0 57.0 57.0 57.0 57.0 57.0 57.0 57.0T H Wharton 55 THW_THWGT55 Harris Gas Houston 1975 57.0 57.0 57.0 57.0 57.0 57.0 57.0 57.0 57.0 57.0T H Wharton 56 THW_THWGT56 Harris Gas Houston 1975 57.0 57.0 57.0 57.0 57.0 57.0 57.0 57.0 57.0 57.0T H Wharton G1 THW_THWGT_1 Harris Gas Houston 1967 13.0 13.0 13.0 13.0 13.0 13.0 13.0 13.0 13.0 13.0Texas City 1 TXCTY_CTA Galveston Gas Houston 2000 96.6 96.6 96.6 96.6 96.6 96.6 96.6 96.6 96.6 96.6Texas City 2 TXCTY_CTB Galveston Gas Houston 2000 96.6 96.6 96.6 96.6 96.6 96.6 96.6 96.6 96.6 96.6Texas City 3 TXCTY_CTC Galveston Gas Houston 2000 96.6 96.6 96.6 96.6 96.6 96.6 96.6 96.6 96.6 96.6Texas City 4 TXCTY_ST Galveston Gas Houston 2000 131.6 131.6 131.6 131.6 131.6 131.6 131.6 131.6 131.6 131.6Texas Gulf Sulphur TGF_TGFGT_1 Wharton Gas Houston 1985 70.0 70.0 70.0 70.0 70.0 70.0 70.0 70.0 70.0 70.0Thomas C Ferguson 1 FERGUS_FERGUSG1 Llano Gas South 1974 354.0 354.0 0.0 0.0 0.0 0.0 0.0 0.0 0.0 0.0Trinidad 6 TRSES_UNIT6 Henderson Gas North 1965 226.0 226.0 226.0 226.0 226.0 226.0 226.0 226.0 226.0 226.0V H Braunig 1 BRAUNIG_VHB1 Bexar Gas South 1966 220.0 220.0 220.0 220.0 220.0 220.0 220.0 220.0 220.0 220.0V H Braunig 2 BRAUNIG_VHB2 Bexar Gas South 1968 230.0 230.0 230.0 230.0 230.0 230.0 230.0 230.0 230.0 230.0V H Braunig 3 BRAUNIG_VHB3 Bexar Gas South 1970 412.0 412.0 412.0 412.0 412.0 412.0 412.0 412.0 412.0 412.0V H Braunig 5 BRAUNIG_VHB6CT5 Bexar Gas South 2009 48.0 48.0 48.0 48.0 48.0 48.0 48.0 48.0 48.0 48.0V H Braunig 6 BRAUNIG_VHB6CT6 Bexar Gas South 2009 48.0 48.0 48.0 48.0 48.0 48.0 48.0 48.0 48.0 48.0V H Braunig 7 BRAUNIG_VHB6CT7 Bexar Gas South 2009 48.0 48.0 48.0 48.0 48.0 48.0 48.0 48.0 48.0 48.0V H Braunig 8 BRAUNIG_VHB6CT8 Bexar Gas South 2009 48.0 48.0 48.0 48.0 48.0 48.0 48.0 48.0 48.0 48.0Victoria Power Station 5 VICTORIA_VICTORG5 Victoria Gas South 2009 125.0 125.0 125.0 125.0 125.0 125.0 125.0 125.0 125.0 125.0
14
Unit Name Unit Code County Fuel Forecast Zone
Year In Service 2013 2014 2015 2016 2017 2018 2019 2020 2021 2022
Victoria Power Station 6 VICTORIA_VICTORG6 Victoria Gas South 2009 160.0 160.0 160.0 160.0 160.0 160.0 160.0 160.0 160.0 160.0W A Parish 1 WAP_WAP_G1 Ft. Bend Gas Houston 1958 169.0 169.0 169.0 169.0 169.0 169.0 169.0 169.0 169.0 169.0W A Parish 2 WAP_WAP_G2 Ft. Bend Gas Houston 1958 169.0 169.0 169.0 169.0 169.0 169.0 169.0 169.0 169.0 169.0W A Parish 3 WAP_WAP_G3 Ft. Bend Gas Houston 1961 258.0 258.0 258.0 258.0 258.0 258.0 258.0 258.0 258.0 258.0W A Parish 4 WAP_WAP_G4 Ft. Bend Gas Houston 1968 552.0 552.0 552.0 552.0 552.0 552.0 552.0 552.0 552.0 552.0W A Parish T1 WAP_WAPGT_1 Ft. Bend Gas Houston 1967 13.0 13.0 13.0 13.0 13.0 13.0 13.0 13.0 13.0 13.0Wichita Falls 1 WFCOGEN_UNIT1 Wichita Gas West 1987 20.0 20.0 20.0 20.0 20.0 20.0 20.0 20.0 20.0 20.0Wichita Falls 2 WFCOGEN_UNIT2 Wichita Gas West 1987 20.0 20.0 20.0 20.0 20.0 20.0 20.0 20.0 20.0 20.0Wichita Falls 3 WFCOGEN_UNIT3 Wichita Gas West 1987 20.0 20.0 20.0 20.0 20.0 20.0 20.0 20.0 20.0 20.0Wichita Falls 4 WFCOGEN_UNIT4 Wichita Gas West 1987 17.0 17.0 17.0 17.0 17.0 17.0 17.0 17.0 17.0 17.0Winchester Power Park 1 WIPOPA_WPP_G1 Fayette Gas South 2010 44.0 44.0 44.0 44.0 44.0 44.0 44.0 44.0 44.0 44.0Winchester Power Park 2 WIPOPA_WPP_G2 Fayette Gas South 2010 44.0 44.0 44.0 44.0 44.0 44.0 44.0 44.0 44.0 44.0Winchester Power Park 3 WIPOPA_WPP_G3 Fayette Gas South 2010 44.0 44.0 44.0 44.0 44.0 44.0 44.0 44.0 44.0 44.0Winchester Power Park 4 WIPOPA_WPP_G4 Fayette Gas South 2010 44.0 44.0 44.0 44.0 44.0 44.0 44.0 44.0 44.0 44.0Wise-Tractebel Power Proj. 1 WCPP_CT1 Wise Gas North 2004 212.0 212.0 212.0 212.0 212.0 212.0 212.0 212.0 212.0 212.0Wise-Tractebel Power Proj. 2 WCPP_CT2 Wise Gas North 2004 212.0 212.0 212.0 212.0 212.0 212.0 212.0 212.0 212.0 212.0Wise-Tractebel Power Proj. 3 WCPP_ST1 Wise Gas North 2004 241.0 241.0 241.0 241.0 241.0 241.0 241.0 241.0 241.0 241.0Wolf Hollow Power Proj. 1 WHCCS_CT1 Hood Gas North 2002 212.5 212.5 212.5 212.5 212.5 212.5 212.5 212.5 212.5 212.5Wolf Hollow Power Proj. 2 WHCCS_CT2 Hood Gas North 2002 212.5 212.5 212.5 212.5 212.5 212.5 212.5 212.5 212.5 212.5Wolf Hollow Power Proj. 3 WHCCS_STG Hood Gas North 2002 280.0 280.0 280.0 280.0 280.0 280.0 280.0 280.0 280.0 280.0Canyon CANYHY_CANYHYG1 Comal Hydro South 1989 6.0 6.0 6.0 6.0 6.0 6.0 6.0 6.0 6.0 6.0Eagle Pass Hydro EAGLE_HY_EAGLE_HY1 Maverick Hydro South 1932 9.6 9.6 9.6 9.6 9.6 9.6 9.6 9.6 9.6 9.6Lakewood Tap DG_LKWDT_2UNITS Gonzales Hydro South 1931 4.8 4.8 4.8 4.8 4.8 4.8 4.8 4.8 4.8 4.8Lewisville DG_LWSVL_1UNIT Denton Hydro North 1991 2.2 2.2 2.2 2.2 2.2 2.2 2.2 2.2 2.2 2.2McQueeney DG_MCQUE_5UNITS Guadalupe Hydro South 1928 7.7 7.7 7.7 7.7 7.7 7.7 7.7 7.7 7.7 7.7Schumansville DG_SCHUM_2UNITS Guadalupe Hydro South 1928 3.6 3.6 3.6 3.6 3.6 3.6 3.6 3.6 3.6 3.6Amistad Hydro 1 AMISTAD_AMISTAG1 Val Verde Hydro South 1983 37.9 37.9 37.9 37.9 37.9 37.9 37.9 37.9 37.9 37.9Amistad Hydro 2 AMISTAD_AMISTAG2 Val Verde Hydro South 1983 37.9 37.9 37.9 37.9 37.9 37.9 37.9 37.9 37.9 37.9Austin 1 AUSTPL_AUSTING1 Travis Hydro South 1940 8.0 8.0 8.0 8.0 8.0 8.0 8.0 8.0 8.0 8.0Austin 2 AUSTPL_AUSTING2 Travis Hydro South 1940 9.0 9.0 9.0 9.0 9.0 9.0 9.0 9.0 9.0 9.0Buchanan 1 BUCHAN_BUCHANG1 Llano Hydro South 1938 18.0 18.0 18.0 18.0 18.0 18.0 18.0 18.0 18.0 18.0Buchanan 2 BUCHAN_BUCHANG2 Llano Hydro South 1938 18.0 18.0 18.0 18.0 18.0 18.0 18.0 18.0 18.0 18.0Buchanan 3 BUCHAN_BUCHANG3 Llano Hydro South 1950 17.0 17.0 17.0 17.0 17.0 17.0 17.0 17.0 17.0 17.0Denison Dam 1 DNDAM_DENISOG1 Grayson Hydro North 1944 40.0 40.0 40.0 40.0 40.0 40.0 40.0 40.0 40.0 40.0Denison Dam 2 DNDAM_DENISOG2 Grayson Hydro North 1948 40.0 40.0 40.0 40.0 40.0 40.0 40.0 40.0 40.0 40.0Falcon Hydro 1 FALCON_FALCONG1 Starr Hydro South 1954 12.0 12.0 12.0 12.0 12.0 12.0 12.0 12.0 12.0 12.0Falcon Hydro 2 FALCON_FALCONG2 Starr Hydro South 1954 12.0 12.0 12.0 12.0 12.0 12.0 12.0 12.0 12.0 12.0Falcon Hydro 3 FALCON_FALCONG3 Starr Hydro South 1954 12.0 12.0 12.0 12.0 12.0 12.0 12.0 12.0 12.0 12.0Granite Shoals 1 WIRTZ_WIRTZ_G1 Burnet Hydro South 1951 30.0 30.0 30.0 30.0 30.0 30.0 30.0 30.0 30.0 30.0Granite Shoals 2 WIRTZ_WIRTZ_G2 Burnet Hydro South 1951 30.0 30.0 30.0 30.0 30.0 30.0 30.0 30.0 30.0 30.0Inks 1 INKSDA_INKS_G1 Llano Hydro South 1938 14.0 14.0 14.0 14.0 14.0 14.0 14.0 14.0 14.0 14.0Marble Falls 1 MARBFA_MARBFAG1 Burnet Hydro South 1951 21.0 21.0 21.0 21.0 21.0 21.0 21.0 21.0 21.0 21.0Marble Falls 2 MARBFA_MARBFAG2 Burnet Hydro South 1951 21.0 21.0 21.0 21.0 21.0 21.0 21.0 21.0 21.0 21.0Marshall Ford 1 MARSFO_MARSFOG1 Travis Hydro South 1941 36.0 36.0 36.0 36.0 36.0 36.0 36.0 36.0 36.0 36.0Marshall Ford 2 MARSFO_MARSFOG2 Travis Hydro South 1941 36.0 36.0 36.0 36.0 36.0 36.0 36.0 36.0 36.0 36.0Marshall Ford 3 MARSFO_MARSFOG3 Travis Hydro South 1941 29.0 29.0 29.0 29.0 29.0 29.0 29.0 29.0 29.0 29.0Whitney 1 WND_WHITNEY1 Bosque Hydro North 1953 20.0 20.0 20.0 20.0 20.0 20.0 20.0 20.0 20.0 20.0Whitney 2 WND_WHITNEY2 Bosque Hydro North 1953 15.0 15.0 15.0 15.0 15.0 15.0 15.0 15.0 15.0 15.0Comanche Peak 1 CPSES_UNIT1 Somervell Nuclear North 1990 1205.0 1205.0 1205.0 1205.0 1205.0 1205.0 1205.0 1205.0 1205.0 1205.0Comanche Peak 2 CPSES_UNIT2 Somervell Nuclear North 1993 1195.0 1195.0 1195.0 1195.0 1195.0 1195.0 1195.0 1195.0 1195.0 1195.0South Texas 1 STP_STP_G1 Matagorda Nuclear South 1988 1375.0 1375.0 1375.0 1375.0 1375.0 1375.0 1375.0 1375.0 1375.0 1375.0South Texas 2 STP_STP_G2 Matagorda Nuclear South 1989 1375.0 1375.0 1375.0 1375.0 1375.0 1375.0 1375.0 1375.0 1375.0 1375.0AES Deepwater APD_APD_PS1 Harris Storage Houston 2010 1.0 1.0 1.0 1.0 1.0 1.0 1.0 1.0 1.0 1.0Kmaybto DG_KMASB_1UNIT Wichita Other North 2011 0.1 0.1 0.1 0.1 0.1 0.1 0.1 0.1 0.1 0.1Blue Wing 1 DG_BROOK_1UNIT Bexar Solar South 2010 7.6 7.6 7.6 7.6 7.6 7.6 7.6 7.6 7.6 7.6Blue Wing 2 DG_ELMEN_1UNIT Bexar Solar South 2010 7.3 7.3 7.3 7.3 7.3 7.3 7.3 7.3 7.3 7.3Somerset 1 DG_SOME1_1UNIT Bexar Solar South 2012 5.6 5.6 5.6 5.6 5.6 5.6 5.6 5.6 5.6 5.6Somerset 2 DG_SOME2_1UNIT Bexar Solar South 2012 5.0 5.0 5.0 5.0 5.0 5.0 5.0 5.0 5.0 5.0Sunedison Rabel Road DG_VALL1_1UNIT Bexar Solar South 2012 9.9 9.9 9.9 9.9 9.9 9.9 9.9 9.9 9.9 9.9Sunedison Valley Road DG_VALL2_1UNIT Bexar Solar South 2012 9.9 9.9 9.9 9.9 9.9 9.9 9.9 9.9 9.9 9.9Webberville WEBBER_S_WSP1 Travis Solar South 2011 28.5 28.5 28.5 28.5 28.5 28.5 28.5 28.5 28.5 28.5Operational Units Total 64,216.9 64,216.9 63,862.9 63,862.9 63,862.9 63,862.9 63,017.9 63,017.9 63,017.9 63,017.9
15

Unit Name Unit Code County Fuel Forecast Zone
Year In Service 2013 2014 2015 2016 2017 2018 2019 2020 2021 2022
Generation from Private Use Networks 4,390.0 4,390.0 4,390.0 4,390.0 4,390.0 4,390.0 4,390.0 4,390.0 4,390.0 4,390.0
RMR Units Total 0.0 0.0 0.0 0.0 0.0 0.0 0.0 0.0 0.0 0.0
DC-TiesEagle Pass DC_S Maverick Other South 36.0 36.0 36.0 36.0 36.0 36.0 36.0 36.0 36.0 36.0East DC_E Fannin Other North 600.0 600.0 600.0 600.0 600.0 600.0 600.0 600.0 600.0 600.0Laredo VFT DC_L Webb Other South 100.0 100.0 100.0 100.0 100.0 100.0 100.0 100.0 100.0 100.0North DC_N Wilbarger Other West 220.0 220.0 220.0 220.0 220.0 220.0 220.0 220.0 220.0 220.0Sharyland (Railroad) DC_R Hidalgo Other South 150.0 300.0 300.0 300.0 300.0 300.0 300.0 300.0 300.0 300.0DC-Ties Total 1,106.0 1,256.0 1,256.0 1,256.0 1,256.0 1,256.0 1,256.0 1,256.0 1,256.0 1,256.0
Switchable ResourcesKiamichi Energy Facility 1CT101 KMCHI_1CT101 Fannin Gas North 2003 153.0 153.0 153.0 153.0 153.0 153.0 153.0 153.0 153.0 153.0Kiamichi Energy Facility 1CT201 KMCHI_1CT201 Fannin Gas North 2003 155.0 155.0 155.0 155.0 155.0 155.0 155.0 155.0 155.0 155.0Kiamichi Energy Facility 1ST KMCHI_1ST Fannin Gas North 2003 315.0 315.0 315.0 315.0 315.0 315.0 315.0 315.0 315.0 315.0Kiamichi Energy Facility 2CT101 KMCHI_2CT101 Fannin Gas North 2003 153.0 153.0 153.0 153.0 153.0 153.0 153.0 153.0 153.0 153.0Kiamichi Energy Facility 2CT201 KMCHI_2CT201 Fannin Gas North 2003 155.0 155.0 155.0 155.0 155.0 155.0 155.0 155.0 155.0 155.0Kiamichi Energy Facility 2ST KMCHI_2ST Fannin Gas North 2003 315.0 315.0 315.0 315.0 315.0 315.0 315.0 315.0 315.0 315.0Tenaska-Frontier 1 FTR_FTR_G1 Grimes Gas North 2000 160.0 160.0 160.0 160.0 160.0 160.0 160.0 160.0 160.0 160.0Tenaska-Frontier 2 FTR_FTR_G2 Grimes Gas North 2000 160.0 160.0 160.0 160.0 160.0 160.0 160.0 160.0 160.0 160.0Tenaska-Frontier 3 FTR_FTR_G3 Grimes Gas North 2000 160.0 160.0 160.0 160.0 160.0 160.0 160.0 160.0 160.0 160.0Tenaska-Frontier 4 FTR_FTR_G4 Grimes Gas North 2000 390.0 390.0 390.0 390.0 390.0 390.0 390.0 390.0 390.0 390.0Tenaska-Gateway 1 TGCCS_CT1 Rusk Gas North 2001 156.0 156.0 156.0 156.0 156.0 156.0 156.0 156.0 156.0 156.0Tenaska-Gateway 2 TGCCS_CT2 Rusk Gas North 2001 135.0 135.0 135.0 135.0 135.0 135.0 135.0 135.0 135.0 135.0Tenaska-Gateway 3 TGCCS_CT3 Rusk Gas North 2001 153.0 153.0 153.0 153.0 153.0 153.0 153.0 153.0 153.0 153.0Tenaska-Gateway 4 TGCCS_UNIT4 Rusk Gas North 2001 402.0 402.0 402.0 402.0 402.0 402.0 402.0 402.0 402.0 402.0Switchable Resources Total 2,962.0 2,962.0 2,962.0 2,962.0 2,962.0 2,962.0 2,962.0 2,962.0 2,962.0 2,962.0
Wind ResourcesGreen Mountain Energy 1 BRAZ_WND_WND1 Scurry Wind West 2003 99.0 99.0 99.0 99.0 99.0 99.0 99.0 99.0 99.0 99.0Green Mountain Energy 2 BRAZ_WND_WND2 Scurry Wind West 2003 61.0 61.0 61.0 61.0 61.0 61.0 61.0 61.0 61.0 61.0Barton Chapel Wind BRTSW_BCW1 Jack Wind North 2007 120.0 120.0 120.0 120.0 120.0 120.0 120.0 120.0 120.0 120.0Buffalo Gap Wind Farm 1 BUFF_GAP_UNIT1 Taylor Wind West 2006 121.0 121.0 121.0 121.0 121.0 121.0 121.0 121.0 121.0 121.0Buffalo Gap Wind Farm 2 BUFF_GAP_UNIT2_1 Taylor Wind West 2007 115.5 115.5 115.5 115.5 115.5 115.5 115.5 115.5 115.5 115.5Buffalo Gap Wind Farm 2 BUFF_GAP_UNIT2_2 Taylor Wind West 2007 117 117 117 117 117 117 117 117 117 117Buffalo Gap Wind Farm 3 BUFF_GAP_UNIT3 Taylor Wind West 2008 170.0 170.0 170.0 170.0 170.0 170.0 170.0 170.0 170.0 170.0Bull Creek Wind Plant BULLCRK_WND1 Borden Wind West 2009 88.0 88.0 88.0 88.0 88.0 88.0 88.0 88.0 88.0 88.0Bull Creek Wind Plant BULLCRK_WND2 Borden Wind West 2009 90.0 90.0 90.0 90.0 90.0 90.0 90.0 90.0 90.0 90.0Capricorn Ridge Wind 4 CAPRIDG4_CR4 Sterling Wind West 2008 113.0 113.0 113.0 113.0 113.0 113.0 113.0 113.0 113.0 113.0Capricorn Ridge Wind 1 CAPRIDGE_CR1 Sterling Wind West 2007 215.0 215.0 215.0 215.0 215.0 215.0 215.0 215.0 215.0 215.0Capricorn Ridge Wind 3 CAPRIDGE_CR2 Sterling Wind West 2007 150.0 150.0 150.0 150.0 150.0 150.0 150.0 150.0 150.0 150.0Capricorn Ridge Wind 2 CAPRIDGE_CR3 Sterling Wind West 2008 186.0 186.0 186.0 186.0 186.0 186.0 186.0 186.0 186.0 186.0Cedro Hill Wind CEDROHIL_CHW1 Webb Wind South 2010 150.0 150.0 150.0 150.0 150.0 150.0 150.0 150.0 150.0 150.0Champion Wind Farm CHAMPION_UNIT1 Nolan Wind West 2008 127.0 127.0 127.0 127.0 127.0 127.0 127.0 127.0 127.0 127.0Papalote Creek Wind COTTON_PAP2 San Patricio Wind South 2010 200.0 200.0 200.0 200.0 200.0 200.0 200.0 200.0 200.0 200.0Camp Springs 1 CSEC_CSECG1 Scurry Wind West 2007 134.0 134.0 134.0 134.0 134.0 134.0 134.0 134.0 134.0 134.0Camp Springs 2 CSEC_CSECG2 Scurry Wind West 2007 124.0 124.0 124.0 124.0 124.0 124.0 124.0 124.0 124.0 124.0TSTC West Texas Wind DG_ROSC2_1UNIT Nolan Wind West 2008 2.0 2.0 2.0 2.0 2.0 2.0 2.0 2.0 2.0 2.0Elbow Creek Wind Project ELB_ELBCREEK Howard Wind West 2008 119.0 119.0 119.0 119.0 119.0 119.0 119.0 119.0 119.0 119.0Snyder Wind Farm ENAS_ENA1 Scurry Wind West 2007 63.0 63.0 63.0 63.0 63.0 63.0 63.0 63.0 63.0 63.0Silver Star FLTCK_SSI Eastland Wind North 2008 60.0 60.0 60.0 60.0 60.0 60.0 60.0 60.0 60.0 60.0Goat Wind 2 GOAT_GOATWIN2 Sterling Wind West 2010 70.0 70.0 70.0 70.0 70.0 70.0 70.0 70.0 70.0 70.0Goat Wind GOAT_GOATWIND Sterling Wind West 2008 80.0 80.0 80.0 80.0 80.0 80.0 80.0 80.0 80.0 80.0Horse Hollow Wind Callahan HHGT_CALLAHAN Kendall Wind South 2009 114.0 114.0 114.0 114.0 114.0 114.0 114.0 114.0 114.0 114.0Horse Hollow Wind 1 HHGT_HHOLLOW1 Kendall Wind South 2009 213.0 213.0 213.0 213.0 213.0 213.0 213.0 213.0 213.0 213.0Horse Hollow Wind 2 HHGT_HHOLLOW2 Kendall Wind South 2009 184.0 184.0 184.0 184.0 184.0 184.0 184.0 184.0 184.0 184.0Horse Hollow Wind 3 HHGT_HHOLLOW3 Kendall Wind South 2009 224.0 224.0 224.0 224.0 224.0 224.0 224.0 224.0 224.0 224.0Horse Hollow Wind 4 HHGT_HHOLLOW4 Kendall Wind South 2009 115.0 115.0 115.0 115.0 115.0 115.0 115.0 115.0 115.0 115.0Callahan Wind CALLAHAN_WND1 Callahan Wind West 2004 0.0 0.0 0.0 0.0 0.0 0.0 0.0 0.0 0.0 0.0Horse Hollow Wind 1 H_HOLLOW_WND1 Taylor Wind West 2005 0.0 0.0 0.0 0.0 0.0 0.0 0.0 0.0 0.0 0.0Horse Hollow Wind 2 HHOLLOW2_WIND1 Taylor Wind West 2006 0.0 0.0 0.0 0.0 0.0 0.0 0.0 0.0 0.0 0.0Horse Hollow Wind 3 HHOLLOW3_WND_1 Taylor Wind West 2006 0.0 0.0 0.0 0.0 0.0 0.0 0.0 0.0 0.0 0.0
16

Unit Name Unit Code County Fuel Forecast Zone
Year In Service 2013 2014 2015 2016 2017 2018 2019 2020 2021 2022
Horse Hollow Wind 4 HHOLLOW4_WND1 Taylor Wind West 2006 0.0 0.0 0.0 0.0 0.0 0.0 0.0 0.0 0.0 0.0Hackberry Wind Farm HWF_HWFG1 Shackelford Wind West 2008 162.0 162.0 162.0 162.0 162.0 162.0 162.0 162.0 162.0 162.0Inadale Wind INDL_INADALE1 Nolan Wind West 2008 197.0 197.0 197.0 197.0 197.0 197.0 197.0 197.0 197.0 197.0Desert Sky Wind Farm 1 INDNENR_INDNENR Pecos Wind West 2002 84.0 84.0 84.0 84.0 84.0 84.0 84.0 84.0 84.0 84.0Desert Sky Wind Farm 2 INDNENR_INDNENR_2 Pecos Wind West 2002 77.0 77.0 77.0 77.0 77.0 77.0 77.0 77.0 77.0 77.0Indian Mesa Wind Farm INDNNWP_INDNNWP Pecos Wind West 2001 83.0 83.0 83.0 83.0 83.0 83.0 83.0 83.0 83.0 83.0Sherbino I KEO_KEO_SM1 Pecos Wind West 2008 150.0 150.0 150.0 150.0 150.0 150.0 150.0 150.0 150.0 150.0King Mountain NE KING_NE_KINGNE Upton Wind West 2001 79.0 79.0 79.0 79.0 79.0 79.0 79.0 79.0 79.0 79.0King Mountain NW KING_NW_KINGNW Upton Wind West 2001 79.0 79.0 79.0 79.0 79.0 79.0 79.0 79.0 79.0 79.0King Mountain SE KING_SE_KINGSE Upton Wind West 2001 40.0 40.0 40.0 40.0 40.0 40.0 40.0 40.0 40.0 40.0King Mountain SW KING_SW_KINGSW Upton Wind West 2001 79.0 79.0 79.0 79.0 79.0 79.0 79.0 79.0 79.0 79.0Kunitz Wind KUNITZ_WIND_LGE Culberson Wind West 1995 40.0 40.0 40.0 40.0 40.0 40.0 40.0 40.0 40.0 40.0Delaware Mountain Wind Farm KUNITZ_WIND_NWP Culberson Wind West 2010 30.0 30.0 30.0 30.0 30.0 30.0 30.0 30.0 30.0 30.0Langford Wind Power LGD_LANGFORD Tom Green Wind West 2009 155.0 155.0 155.0 155.0 155.0 155.0 155.0 155.0 155.0 155.0Mesquite Wind LNCRK_G83 Shackelford Wind West 2006 200.0 200.0 200.0 200.0 200.0 200.0 200.0 200.0 200.0 200.0Post Oak Wind 1 LNCRK2_G871 Shackelford Wind West 2007 100.0 100.0 100.0 100.0 100.0 100.0 100.0 100.0 100.0 100.0Post Oak Wind 2 LNCRK2_G872 Shackelford Wind West 2007 100.0 100.0 100.0 100.0 100.0 100.0 100.0 100.0 100.0 100.0Loraine Windpark I LONEWOLF_G1 Mitchell Wind West 2009 50.0 50.0 50.0 50.0 50.0 50.0 50.0 50.0 50.0 50.0Loraine Windpark II LONEWOLF_G2 Mitchell Wind West 2009 51.0 51.0 51.0 51.0 51.0 51.0 51.0 51.0 51.0 51.0Loraine Windpark III LONEWOLF_G3 Mitchell Wind West 2011 26.0 26.0 26.0 26.0 26.0 26.0 26.0 26.0 26.0 26.0Loraine Windpark IV LONEWOLF_G4 Mitchell Wind West 2011 24.0 24.0 24.0 24.0 24.0 24.0 24.0 24.0 24.0 24.0Forest Creek Wind Farm MCDLD_FCW1 Glasscock Wind West 2007 124.0 124.0 124.0 124.0 124.0 124.0 124.0 124.0 124.0 124.0Sand Bluff Wind Farm MCDLD_SBW1 Glasscock Wind West 2008 90.0 90.0 90.0 90.0 90.0 90.0 90.0 90.0 90.0 90.0McAdoo Wind Farm MWEC_G1 Dickens Wind West 2008 150.0 150.0 150.0 150.0 150.0 150.0 150.0 150.0 150.0 150.0Notrees-1 NWF_NWF1 Winkler Wind West 2009 153.0 153.0 153.0 153.0 153.0 153.0 153.0 153.0 153.0 153.0Ocotillo Wind Farm OWF_OWF Howard Wind West 2008 60.0 60.0 60.0 60.0 60.0 60.0 60.0 60.0 60.0 60.0Papalote Creek Wind Farm PAP1_PAP1 San Patricio Wind South 2009 180.0 180.0 180.0 180.0 180.0 180.0 180.0 180.0 180.0 180.0Panther Creek 1 PC_NORTH_PANTHER1 Howard Wind West 2008 143.0 143.0 143.0 143.0 143.0 143.0 143.0 143.0 143.0 143.0Panther Creek 2 PC_SOUTH_PANTHER2 Howard Wind West 2008 116.0 116.0 116.0 116.0 116.0 116.0 116.0 116.0 116.0 116.0Panther Creek 3 PC_SOUTH_PANTHER3 Howard Wind West 2009 200.0 200.0 200.0 200.0 200.0 200.0 200.0 200.0 200.0 200.0Penascal Wind PENA_UNIT1 Kenedy Wind South 2009 161.0 161.0 161.0 161.0 161.0 161.0 161.0 161.0 161.0 161.0Penascal Wind PENA_UNIT2 Kenedy Wind South 2009 142.0 142.0 142.0 142.0 142.0 142.0 142.0 142.0 142.0 142.0Penascal Wind PENA3_UNIT3 Kenedy Wind South 2010 101.0 101.0 101.0 101.0 101.0 101.0 101.0 101.0 101.0 101.0Pyron Wind Farm PYR_PYRON1 Scurry Wind West 2008 249.0 249.0 249.0 249.0 249.0 249.0 249.0 249.0 249.0 249.0Red Canyon RDCANYON_RDCNY1 Borden Wind West 2006 84.0 84.0 84.0 84.0 84.0 84.0 84.0 84.0 84.0 84.0Texas Big Spring SGMTN_SIGNALMT Howard Wind West 1999 34.0 34.0 34.0 34.0 34.0 34.0 34.0 34.0 34.0 34.0South Trent Wind Farm STWF_T1 Nolan Wind West 2008 101.0 101.0 101.0 101.0 101.0 101.0 101.0 101.0 101.0 101.0West Texas Wind Energy SW_MESA_SW_MESA Upton Wind West 1999 74.0 74.0 74.0 74.0 74.0 74.0 74.0 74.0 74.0 74.0Stanton Wind Energy SWEC_G1 Martin Wind West 2008 124.0 124.0 124.0 124.0 124.0 124.0 124.0 124.0 124.0 124.0Sweetwater Wind 3 SWEETWN2_WND2 Nolan Wind West 2004 98.0 98.0 98.0 98.0 98.0 98.0 98.0 98.0 98.0 98.0Sweetwater Wind 2 SWEETWN2_WND24 Nolan Wind West 2006 16.0 16.0 16.0 16.0 16.0 16.0 16.0 16.0 16.0 16.0Sweetwater Wind 4 SWEETWN3_WND3A Nolan Wind West 2005 29.5 29.5 29.5 29.5 29.5 29.5 29.5 29.5 29.5 29.5Sweetwater Wind 4 SWEETWN3_WND3B Nolan Wind West 2005 100.5 100.5 100.5 100.5 100.5 100.5 100.5 100.5 100.5 100.5Sweetwater Wind 7 SWEETWN4_WND4A Nolan Wind West 2007 118.0 118.0 118.0 118.0 118.0 118.0 118.0 118.0 118.0 118.0Sweetwater Wind 6 SWEETWN4_WND4B Nolan Wind West 2007 104.0 104.0 104.0 104.0 104.0 104.0 104.0 104.0 104.0 104.0Sweetwater Wind 5 SWEETWN4_WND5 Nolan Wind West 2007 79.0 79.0 79.0 79.0 79.0 79.0 79.0 79.0 79.0 79.0Sweetwater Wind 1 SWEETWND_WND1 Nolan Wind West 2003 37.0 37.0 37.0 37.0 37.0 37.0 37.0 37.0 37.0 37.0Gulf Wind I TGW_T1 Kenedy Wind South 2010 142.0 142.0 142.0 142.0 142.0 142.0 142.0 142.0 142.0 142.0Gulf Wind II TGW_T2 Kenedy Wind South 2010 142.0 142.0 142.0 142.0 142.0 142.0 142.0 142.0 142.0 142.0Roscoe Wind Farm TKWSW1_ROSCOE Nolan Wind West 2008 209.0 209.0 209.0 209.0 209.0 209.0 209.0 209.0 209.0 209.0Trent Wind Farm TRENT_TRENT Nolan Wind West 2001 151.0 151.0 151.0 151.0 151.0 151.0 151.0 151.0 151.0 151.0Turkey Track Wind Energy Center TTWEC_G1 Nolan Wind West 2008 170.0 170.0 170.0 170.0 170.0 170.0 170.0 170.0 170.0 170.0Whirlwind Energy WEC_WECG1 Floyd Wind West 2007 57.0 57.0 57.0 57.0 57.0 57.0 57.0 57.0 57.0 57.0Wolfe Ridge WHTTAIL_WR1 Cooke Wind North 2008 113.0 113.0 113.0 113.0 113.0 113.0 113.0 113.0 113.0 113.0Pecos Wind (Woodward 1) WOODWRD1_WOODWRD1 Pecos Wind West 2001 83.0 83.0 83.0 83.0 83.0 83.0 83.0 83.0 83.0 83.0Pecos Wind (Woodward 2) WOODWRD2_WOODWRD2 Pecos Wind West 2001 77.0 77.0 77.0 77.0 77.0 77.0 77.0 77.0 77.0 77.0Harbor Wind DG_NUECE_6UNITS Nueces Wind South 2012 9.0 9.0 9.0 9.0 9.0 9.0 9.0 9.0 9.0 9.0Sherbino 2 KEO_SHRBINO2 Pecos Wind West 2012 150.0 150.0 150.0 150.0 150.0 150.0 150.0 150.0 150.0 150.0Trinity Hills TRINITY_TH1_BUS1 Young Wind North 2012 118.0 118.0 118.0 118.0 118.0 118.0 118.0 118.0 118.0 118.0Trinity Hills TRINITY_TH1_BUS2 Young Wind North 2012 108.0 108.0 108.0 108.0 108.0 108.0 108.0 108.0 108.0 108.0Magic Valley Wind REDFISH_MV1A Willacy Wind South 2012 103.0 103.0 103.0 103.0 103.0 103.0 103.0 103.0 103.0 103.0Magic Valley Wind REDFISH_MV1B Willacy Wind South 2012 103.0 103.0 103.0 103.0 103.0 103.0 103.0 103.0 103.0 103.0Wind Resources Total 10,034 10,034 10,034 10,034 10,034 10,034 10,034 10,034 10,034 10,034
17

Unit Name Unit Code County Fuel Forecast Zone
Year In Service 2013 2014 2015 2016 2017 2018 2019 2020 2021 2022
Mothballed ResourcesSam Bertron 1 SRB_SRB_G1 Harris Gas Houston 1958 118.0 118.0 118.0 118.0 118.0 118.0 118.0 118.0 118.0 118.0 Sam Bertron 2 SRB_SRB_G2 Harris Gas Houston 1956 174.0 174.0 174.0 174.0 174.0 174.0 174.0 174.0 174.0 174.0 Sam Bertron 3 SRB_SRB_G3 Harris Gas Houston 1959 230.0 230.0 230.0 230.0 230.0 230.0 230.0 230.0 230.0 230.0 Sam Bertron 4 SRB_SRB_G4 Harris Gas Houston 1960 230.0 230.0 230.0 230.0 230.0 230.0 230.0 230.0 230.0 230.0 Sam Bertron T2 SRB_SRBGT_2 Harris Gas Houston 1967 13.0 13.0 13.0 13.0 13.0 13.0 13.0 13.0 13.0 13.0 AES Deepwater APD_APD_G1 Harris Other Houston 1986 138.0 138.0 138.0 138.0 138.0 138.0 138.0 138.0 138.0 138.0 Atkins 3 ATKINS_ATKINSG3 Brazos Gas North 1954 12.0 12.0 12.0 12.0 12.0 12.0 12.0 12.0 12.0 12.0 Atkins 4 ATKINS_ATKINSG4 Brazos Gas North 1958 22.0 22.0 22.0 22.0 22.0 22.0 22.0 22.0 22.0 22.0 Atkins 5 ATKINS_ATKINSG5 Brazos Gas North 1965 25.0 25.0 25.0 25.0 25.0 25.0 25.0 25.0 25.0 25.0 Atkins 6 ATKINS_ATKINSG6 Brazos Gas North 1969 50.0 50.0 50.0 50.0 50.0 50.0 50.0 50.0 50.0 50.0 Greens Bayou GT82 GBY_GBYGT82 Harris Gas Houston 1976 58.0 58.0 58.0 58.0 58.0 58.0 58.0 58.0 58.0 58.0 Leon Creek 3 LEON_CRK_LCP3G3 Bexar Gas South 1953 56.0 56.0 56.0 56.0 56.0 56.0 56.0 56.0 56.0 56.0 Leon Creek 4 LEON_CRK_LCP4G4 Bexar Gas South 1959 88.0 88.0 88.0 88.0 88.0 88.0 88.0 88.0 88.0 88.0 North Texas 1 NTX_NTX_1 Parker Gas North 1958 18.0 18.0 18.0 18.0 18.0 18.0 18.0 18.0 18.0 18.0 North Texas 2 NTX_NTX_2 Parker Gas North 1958 18.0 18.0 18.0 18.0 18.0 18.0 18.0 18.0 18.0 18.0 North Texas 3 NTX_NTX_3 Parker Gas North 1963 39.0 39.0 39.0 39.0 39.0 39.0 39.0 39.0 39.0 39.0 Permian Basin 6 PBSES_UNIT6 Ward Gas West 2009 515.0 515.0 515.0 515.0 515.0 515.0 515.0 515.0 515.0 515.0 Silas Ray 5 SILASRAY_SILAS_5 Cameron Gas South 1951 10.0 10.0 10.0 10.0 10.0 10.0 10.0 10.0 10.0 10.0 Valley 1 VLSES_UNIT1 Fannin Gas North 1962 174.0 174.0 174.0 174.0 174.0 174.0 174.0 174.0 174.0 174.0 Valley 2 VLSES_UNIT2 Fannin Gas North 1967 520.0 520.0 520.0 520.0 520.0 520.0 520.0 520.0 520.0 520.0 Valley 3 VLSES_UNIT3 Fannin Gas North 1971 375.0 375.0 375.0 375.0 375.0 375.0 375.0 375.0 375.0 375.0 Mothballed Resources Total 2,883.0 2,883.0 2,883.0 2,883.0 2,883.0 2,883.0 2,883.0 2,883.0 2,883.0 2,883.0
New Units with Signed IA and Air PermitSandy Creek 1 SCES_UNIT1 McLennan Coal North 2013 925.0 925.0 925.0 925.0 925.0 925.0 925.0 925.0 925.0 925.0 NoTrees Battery NWF_NBS Winkler Storage West 2013 36.0 36.0 36.0 36.0 36.0 36.0 36.0 36.0 36.0 36.0 Panda Sherman Power 10INR0021 Grayson Gas North 2014 - - 809.0 809.0 809.0 809.0 809.0 809.0 809.0 809.0 Panda Temple Power 10INR0020a Bell Gas North 2014 - - 809.0 809.0 809.0 809.0 809.0 809.0 809.0 809.0 Panda Temple Power 10INR0020b Bell Gas North 2016 - - - 780.0 780.0 780.0 780.0 780.0 780.0 780.0 Ferguson Replacement Project 13INR0021 Llano Gas North 2014 - - 570.0 570.0 570.0 570.0 570.0 570.0 570.0 570.0 Texas Clean Energy Project 13INR0023 Ector Coal West 2016 - - - 240.0 240.0 240.0 240.0 240.0 240.0 240.0 Pondera King Power Project 10INR0022 Harris Gas Houston 2016 - - - - 1,380.0 1,380.0 1,380.0 1,380.0 1,380.0 1,380.0 New Units with Signed IA and Air Permit Total 961.0 961.0 3,149.0 4,169.0 5,549.0 5,549.0 5,549.0 5,549.0 5,549.0 5,549.0
New Wind GenerationSenate Wind Project SENATEWD_UNIT1 Jack Wind West 2013 150.0 150.0 150.0 150.0 150.0 150.0 150.0 150.0 150.0 150.0Blue Summit Windfarm BLSUMMIT_BLSMT1_5 Wilbarger Wind West 2013 9.0 9.0 9.0 9.0 9.0 9.0 9.0 9.0 9.0 9.0Blue Summit Windfarm BLSUMMIT_BLSMT1_6 Wilbarger Wind West 2013 126.4 126.4 126.4 126.4 126.4 126.4 126.4 126.4 126.4 126.4WKN Mozart MOZART_WIND_1 Kent Wind West 2013 30.0 30.0 30.0 30.0 30.0 30.0 30.0 30.0 30.0 30.0Whitetail Wind Energy Project EXGNWTL_WIND_1 Webb Wind South 2013 92.0 92.0 92.0 92.0 92.0 92.0 92.0 92.0 92.0 92.0Anacacho Windfarm ANACACHO_ANA Kinney Wind South 2013 100.0 100.0 100.0 100.0 100.0 100.0 100.0 100.0 100.0 100.0Los Vientos LV1_LV1A Cameron Wind South 2013 200.1 200.1 200.1 200.1 200.1 200.1 200.1 200.1 200.1 200.1Los Vientos LV1_LV1B Cameron Wind South 2013 201.6 201.6 201.6 201.6 201.6 201.6 201.6 201.6 201.6 201.6Bobcat Wind BCATWIND_WIND_1 Clay Wind North 2013 50.0 50.0 50.0 50.0 50.0 50.0 50.0 50.0 50.0 50.0Penascal Wind Farm 3 06INR0022c Kenedy Wind 2013 0.0 202.0 202.0 202.0 202.0 202.0 202.0 202.0 202.0 202.0Goldthwaite Wind Energy 11INR0013 Mills Wind 2013 0.0 150.0 150.0 150.0 150.0 150.0 150.0 150.0 150.0 150.0Midway Farms Wind 11INR0054 San Patricio Wind 2013 0.0 161.0 161.0 161.0 161.0 161.0 161.0 161.0 161.0 161.0Stephens Ranch Wind Project 12INR0034 Borden Wind 2014 0.0 378.0 378.0 378.0 378.0 378.0 378.0 378.0 378.0 378.0Moore Wind 1 11INR0050 Crosby Wind 2014 0.0 0.0 149.0 149.0 149.0 149.0 149.0 149.0 149.0 149.0Conway Windfarm 13INR0005 Carson Wind 2014 0.0 0.0 600.0 600.0 600.0 600.0 600.0 600.0 600.0 600.0Mesquite Creek Wind 09INR0051 Borden Wind 2015 0.0 0.0 0.0 249.0 249.0 249.0 249.0 249.0 249.0 249.0Gunsight Mountain 08INR0018 Howard Wind 2016 0.0 0.0 0.0 120.0 120.0 120.0 120.0 120.0 120.0 120.0New Wind Generation Total 959.1 1,850.1 2,599.1 2,968.1 2,968.1 2,968.1 2,968.1 2,968.1 2,968.1 2,968.1
Excluded Resources, per notification from developerCobisa-Greenville 06INR0006 Hunt Gas - - - 1,792.0 1,792.0 1,792.0 1,792.0 1,792.0 1,792.0 1,792.0
18

Fuel Type 2013 2014 2015 2016 2017 2018 2019 2020 2021 2022
Biomass 246 246 246 246 246 246 246 246 246 246 Coal 19,140 19,140 19,140 19,380 19,380 19,380 18,535 18,535 18,535 18,535 Hydro 548 548 548 548 548 548 548 548 548 548 Gas 47,018 47,018 48,852 49,632 51,012 51,012 51,012 51,012 51,329 51,329 Nuclear 5,150 5,150 5,150 5,150 5,150 5,150 5,150 5,150 5,150 5,150 Other 553 628 628 628 628 628 628 628 628 628 Solar 74 74 74 74 74 74 74 74 74 74 Storage 37 37 37 37 37 37 37 37 37 37 Wind 956 1,034 1,099 1,131 1,131 1,131 1,131 1,131 1,131 1,131 Total 73,722 73,875 75,774 76,826 78,206 78,206 77,361 77,361 77,678 77,678
Fuel Type 2013 2014 2015 2016 2017 2018 2019 2020 2021 2022
Biomass 0.3% 0.3% 0.3% 0.3% 0.3% 0.3% 0.3% 0.3% 0.3% 0.3%Coal 26.0% 25.9% 25.3% 25.2% 24.8% 24.8% 24.0% 24.0% 23.9% 23.9%Hydro 0.7% 0.7% 0.7% 0.7% 0.7% 0.7% 0.7% 0.7% 0.7% 0.7%Natural Gas 63.8% 63.6% 64.5% 64.6% 65.2% 65.2% 65.9% 65.9% 66.1% 66.1%Nuclear 7.0% 7.0% 6.8% 6.7% 6.6% 6.6% 6.7% 6.7% 6.6% 6.6%Other 0.8% 0.9% 0.8% 0.8% 0.8% 0.8% 0.8% 0.8% 0.8% 0.8%Solar 0.1% 0.1% 0.1% 0.1% 0.1% 0.1% 0.1% 0.1% 0.1% 0.1%Storage 0.1% 0.1% 0.0% 0.0% 0.0% 0.0% 0.0% 0.0% 0.0% 0.0%Wind 1.3% 1.4% 1.5% 1.5% 1.4% 1.4% 1.5% 1.5% 1.5% 1.5%
Summer Fuel Types - ERCOT
Fuel type is based on the primary fuel. Capacities of the wind units are included at 8.7% of nameplate capacity. Available capacity from private network (self-serve) units is included based on historical contribution during grid scarcity conditions; distributed generation units that have registered with ERCOT are included. DC Tie imports are listed as Other and mothballed capacity is excluded.
In MW
In Percentages
19