results for the first quarter 2018 - cdn1.a1.group · and the yesss! customer base in 2017. this...
TRANSCRIPT

Results for the First Quarter 2018
Key financial and operating highlights in the first quarter 2018
� Group total revenues and EBITDA increased by 1.2% and 0.2% respectively on a proforma1 basis. On an adjusted basis2,
revenues and EBITDA grew by 4.0% and 6.7%.
� Last year, revenues and EBITDA included positive one-off effects ( EUR 15.2 mn in EBITDA in Q1 2017) with the main
effects in Austria.
� Negative FX effects in Q1 2018: EUR 13.9 mn in total revenues and EUR 6.9 mn in EBITDA.
� Operationally, total revenue growth was mostly driven by the increase in equipment revenues and service revenues with
the latter growing in all markets except for Slovenia.
� Solid fixed-line service revenue growth and mobile service revenues rose slightly without the negative roaming impact.
� Adjusted EBITDA was driven by higher fixed-line service revenues, a better equipment margin and cost efficiencies:
� Investment into A1 Digital and its market entry in Germany were compensated by savings in other markets.
� Austria: Higher fixed-line service revenues, a better equipment margin and cost efficiencies drove the adjusted EBITDA
growth of 9.7%.
� Reported net result grew by 30.2% in Q1 2018 excluding D&A from the amortisation of the brand in the amount of
EUR 101.1 mn; reported net result of EUR 24.5 mn in Q1 2018 compared to EUR 96.4 mn in Q1 2017, still adversely im-
pacted by the amortisation of the brand which started and was communicated in 2017.
� Group outlook 2018 unchanged: total revenue growth of 1-2% (on a reported basis), CAPEX3 of approx. EUR 750 mn.
Key performance indicators Proforma view
in EUR million Q1 2018 reported
Q1 2017 proforma % change
Total revenues 1,075.9 1,062.9 1.2
Service revenues 931.3 936.5 – 0.5
Equipment revenues 123.7 102.8 20.3
Other operating income 20.9 23.6 – 11.7
EBITDA 341.5 340.9 0.2
% of total revenues 31.7% 32.1%
Adjusted EBITDA 347.5 325.6 6.7
EBIT 51.6 127.1 – 59.4
% of total revenues 4.8% 12.0%
Wireless indicators Q1 2018 reported
Q1 2017 proforma % change
Wireless subscribers (thousands) 20,640.4 20,621.7 0.1
thereof postpaid 15,703.0 15,074.4 4.2
thereof prepaid 4,937.4 5,547.4 – 11.0
MoU (per Ø subscriber)*) 339.3 323.1 5.0
ARPU (in EUR) 8.4 8.5 – 0.7
Churn (%) 1.8% 2.0%
Wireline indicators Q1 2018 reported
Q1 2017 proforma % change
RGUs (thousands) 6,034.7 6,076.4 – 0.7 If not stated otherwise, all financial figures are based on IAS 18; all comparisons are given year-on-year. EBITDA is defined as net income excluding financial result, income taxes, depreciation and amortisation and impairment charges. *) Minutes of Use no longer include M2M subscribers. Comparative figures have been adjusted accordingly. 1 Proforma figures include M&A transactions made between the start of the comparison period and the end of the reporting period. 2 Adjusted numbers are excluding one-off effects, FX effects and restructuring charges. 3 Does not include investment in spectrum and acquisitions.

A1 Telekom Austria Group 2
Table of Contents
First quarter results1 3
Detailed analysis on quarterly results1 7
Outlook 16
Reconciliation tables 18
Additional information 26
Condensed consolidated financial statements 27
1 Alternative performance measures are included in this report. For details please refer to the reconciliation tables on page 18.

A1 Telekom Austria Group 3
First quarter results
Vienna, 24 April 2018 – Today, the A1 Telekom Austria Group (VSE: TKA, OTC US: TKAGY) announces its
results for the first quarter of 2018, ending 31 March 2018.
As of 1 January 2018, A1 Telekom Austria Group initially applied IFRS 15, electing the modified retrospec-
tive approach for the initial application in accordance with the transition guidance. Accordingly, the infor-
mation presented for 2017 has not been restated - i.e. it is presented, as previously reported, under IAS
18 and related interpretations. The following presentation is based on IAS 18 (i.e. without adoption of
IFRS 15). In the Selected Explanatory Notes to the Consolidated Interim Financial Statements a reconcilia-
tion from IFRS 15 to IAS 18 is provided. The new revenue recognition accounting standard under IFRS 15
requires accounting for the life cycle value of contracts by allocating the total revenues from a contract to
the different deliverables of the contract based on their relative fair values.
Income Statement (reported, IAS 18)
Reported view
in EUR million Q1 2018 reported
Q1 2017 reported % change
Service revenues 931.3 932.7 – 0.2
Equipment revenues 123.7 102.8 20.3
Other operating income 20.9 23.4 – 10.7
Total revenues 1,075.9 1,058.9 1.6
Cost of service – 340.9 – 341.1 0.1
Cost of equipment – 140.6 – 127.7 – 10.1
Selling, general & administrative expenses – 250.3 – 247.7 – 1.0
Other expenses – 2.6 – 2.8 5.4
Total costs and expenses – 734.4 – 719.4 – 2.1
EBITDA 341.5 339.5 0.6
% of total revenues 31.7% 32.1%
Adjusted EBITDA 347.5 324.2 7.2
Depreciation and amortisation – 289.8 – 213.1 – 36.0
EBIT 51.6 126.4 – 59.2
% of total revenues 4.8% 11.9%
Interest income 3.2 3.5 – 8.9
Interest expense – 21.9 – 24.7 11.5
Other financial expense – 2.7 – 4.1 34.5
Foreign currency exchange differences 3.2 4.5 – 27.8
Equity interest in net income of affiliates 0.1 – 0.1 n.m.
Earnings before income tax 33.6 105.5 – 68.1
Income tax – 9.2 – 9.1 – 1.0
Net result*)
24.5 96.4 – 74.6 Adjusted EBITDA is EBITDA excluding one-off effects, FX effects and restructuring charges. *) Attributable to equity holders of the parent, non controlling interests and hybrid capital owners
Summary of Profit and Loss (proforma2, IAS 18)
The following factors should be considered in the analysis of A1 Telekom Austria Group’s operating re-
sults:
2 Proforma figures include effects of M&A transactions executed between the start of the comparison period and the end of the reporting period.
The presentation for the
conference call and key
figures of the A1 Telekom
Austria Group in Excel format
(‘Fact Sheet Q1 2018’) are
available on the website at
www.a1.group.

4 Results for the First Quarter 2018
� The acquisition of the fixed-line provider Garant (Gomel) in Belarus, consolidated as of
1 August 2017.
� The acquisition of the fixed-line operator Metronet in Croatia, consolidated as of 1 February 2017.
� One-off effects in Q1 2017 (EUR 15.4 mn in revenues and EUR 15.2 mn in EBITDA) and in Q1 2018
(EUR 0.9 mn in revenues and EUR 0.8 mn in EBITDA) with the following main effects:
� A positive one-off effect in Austria in the amount of EUR 10.6 mn in fixed-line service revenues
stemming from the reversal of an accrual for wholesale services in Q1 2017.
� A positive one-off effect of EUR 3.6 mn in the Austrian segment in other operating income,
stemming from the release of an asset retirement obligation in Q1 2017.
� Total negative FX effects amounting to EUR 13.9 mn for total revenues and EUR 6.9 mn for EBITDA
in the first quarter of 2018, stemming solely from Belarus while the Republic of Serbia and Croatia
registered some positive FX effects.
� There were no restructuring charges in Q1 2018 (positive EUR 0.1 mn in Q1 2017).
In the first quarter of 2018, the mobile subscriber base of A1 Telekom Austria Group remained stable at
20.6 million subscribers. Declining prepaid subscriber numbers in Austria, Bulgaria, Belarus, the Republic
of Macedonia and Slovenia were outweighed by the growth of M2M subscribers of A1 Digital as well as
growth in Croatia and the Republic of Serbia. The number of revenue generating units (RGUs) in the fixed-
line business of the Group declined mainly due to fewer voice and broadband RGUs in Austria, which was
partly offset by an RGU increase in Belarus and the Republic of Macedonia.
Group total revenues increased by 1.2% (reported: +1.6%). Excluding one-off and FX effect total revenues
rose by 4.0% with growth in all segments except for Slovenia. Negative effects stemming from the aboli-
tion of retail roaming in the EU as of 15 June 2017 derive mostly from Austria and Slovenia. Group service
revenues declined, but grew by 0.6% without the one-off effects.
Group total costs and expenses increased in the first quarter of 2018 driven by higher cost of equipment,
sales area costs, roaming expenses and content costs partly mitigated by savings in network engineering
and maintenance.
EBITDA was stable (+0.2%) with positive contribution from all segments apart from Belarus and Slovenia.
Adjusted for one-off effects, restructuring charges as well as the FX impact, EBITDA rose by 6.7% with
growth in all markets except for Slovenia as solid revenue growth and a better equipment margin out-
weighed higher total costs and expenses.
Depreciation and amortisation increased in the first quarter of 2018 due to the brand amortisation result-
ing from the group-wide rebranding announced in September 2017 (for details please refer to the Out-
look). In Q1 2018, the brand value amortisation resulting thereof amounted to EUR 101.1 mn and
stemmed primarily from the segment Bulgaria as well as, to a lesser extent, from the segments Belarus,
Croatia and Republic of Macedonia. In Austria, D&A declined due to the end of depreciation of frequencies
and the YESSS! customer base in 2017. This led to a decline in operating income in Q1 2018. Excluding
the effects of the rebranding, operating income increased by 20.2% (reported: +20.8%).
The reported negative financial result decreased in Q1 2018, resulting from lower interest expenses on
financial liabilities. Income taxes increased slightly as the tax benefit from the release of deferred tax liabil-
ities on brand names was more than offset by higher taxable income. In total, the reported net result de-
creased in Q1 2018, but increased by 30.2% without the D&A impact of the brand value amortisation.
Group revenues increased by
1.2% year-on-year
(reported: +1.6%)
Group adjusted EBITDA
increase of 6.7%

A1 Telekom Austria Group 5
Balance Sheet (reported, IAS 18)
Reported view
in EUR million
31 Mar 2018
reported
31 Dec 2017
reported %
change
31 Mar 2018
reported
31 Dec 2017
reported %
change
Cash, cash equivalents &
other short-term investments 56.8 202.4 – 71.9 Short-term debt 404.0 0.6 n.m.
Accounts receivable 690.1 679.3 1.6 Accounts payable 763.3 784.2 – 2.7
Other current assets 282.1 257.1 9.7 Other current liabilities 469.0 458.9 2.2
Inventories 101.6 87.4 16.2 Current liabilities 1,636.3 1,243.7 31.6
Current assets 1,130.7 1,226.3 – 7.8
Property, plant & equipment 2,609.5 2,627.9 – 0.7 Long-term debt 2,534.4 2,533.6 0.0
Intangibles 1,943.3 2,075.9 – 6.4 Other liabilities 884.0 923.6 – 4.3
Goodwill 1,277.4 1,276.3 0.1 Non-current liabilities 3,418.4 3,457.2 – 1.1
Investments in affiliates
& long-term investments 45.3 46.9 – 3.3
Other non-current assets 372.8 385.0 – 3.2 Shareholder's equity 2,324.4 2,937.4 – 20.9
Non-current assets 6,248.3 6,412.0 – 2.6
Total assets 7,379.0 7,638.3 – 3.4
Total liabilities and
equity 7,379.0 7,638.3 – 3.4
As of 31 March 2018, the balance sheet total declined by 3.4% to EUR 7,379.0 mn compared with
EUR 7,638.3 mn as of 31 December 2017. The decrease of current assets was driven by the decline in
cash and cash equivalents, following the redemption of the EUR 600 mn hybrid bond at the first call date
on 1 February 2018. Non-current assets decreased, primarily driven by the reduction in intangible assets
resulting from brand value amortisations in connection with Group-wide rebranding and the amortisation
of licences. The increase in current liabilities was above all attributable to the drawing of short-term credit
facilities as part of the refinancing of the above-mentioned hybrid bond. Non-current liabilities decreased
as a result of the reduction in non-current provisions, which were mainly driven by payments for restruc-
turing, and lower deferred tax liabilities.
The decrease in shareholder’s equity was primarily driven by the redemption of the EUR 600 mn hybrid
bond, which was classified as equity. The equity ratio as of 31 March 2018 amounted to 31.5% after
38.5% as of 31 December 2017.
Net Debt (reported, IAS 18)
Reported view
in EUR million 31 Mar 2018
reported 31 Dec 2017
reported % change
Net debt 2,881.5 2,331.8 23.6
Net Debt / EBITDA (12 months) 2.1x 1.7x
The redemption of the hybrid bond resulted in an increase in net debt and a higher net debt to EBITDA
ratio.

6 Results for the First Quarter 2018
Cash Flow (reported, IAS 18)
Reported view
in EUR million Q1 2018 reported
Q1 2017 reported % change
Earnings before income tax (EBT) 33.6 105.5 – 68.1
Net cash flow from operating activities 269.3 261.9 2.8
Net cash flow from investing activities – 183.4 – 273.1 32.9
Net cash flow from financing activities – 231.6 – 392.4 41.0
Adjustment to cash flows due to exchange rate
fluctuations 0.2 0.0 n.m.
Net change in cash and cash equivalents – 145.5 – 403.7 63.9
Earnings before income tax (EBT) declined year-on-year as the higher EBITDA was more than offset by the
brand value amortisation in conjunction with the Group-wide rebranding. Cash flow from operating activi-
ties increased year-on-year due to the improvement in results of operations. The changes in working capi-
tal and other financial positions in the reporting period in the amount of EUR 74.6 mn (Q1 2017: EUR 76.4
mn) were driven by payments for restructuring as well as by prepaid expenses, increases in inventories
and accounts receivable. Cash flow from investing activities went down year-on-year as the comparison
period was impacted by the cash outflow from the acquisition of Metronet. Regarding Cash flow from fi-
nancing activities the comparison period was characterised by the principal payments on a EUR 500 mn
bond, while Q1 2018 was driven by the redemption of the EUR 600 mn hybrid bond on 1 February 2018.
This cash outflow was partly mitigated by drawings of short-term credit facilities.
Free cash flow, which is calculated as cash flow from operating activities less capital expenditures paid
and interest paid plus proceeds from the sale of plant, property and equipment increased from
EUR 37.5 mn in Q1 2017 to EUR 82.6 mn in Q1 2018. This was mainly attributable to the lower interest
payments and capital expenditures paid as well as the operational improvement.
Capital Expenditures (reported, IAS 18)
In Q1 2018, capital expenditures decreased by 19.3% year-on-year to EUR 145.3 mn, mainly driven by
lower investments in Slovenia and Austria. Tangible capital expenditures decreased by 14.8% to
EUR 117.9 mn primarily due to lower investments in the Austrian fibre rollout as a result of adverse
weather conditions compared to last year. The decrease in intangible capital expenditures of 34.2% to
EUR 27.4 mn was entirely driven by the capitalisation of a long-term IRU (Indefeasible Rights of Use) con-
tract for fibre-optic lines in Slovenia in the comparison period.
Personnel (reported, IAS 18)
Reported view
End of period (full-time equivalent) Q1 2018 reported
Q1 2017 reported % change
Austria 8,239 8,322 – 1.0
International operations 10,252 10,045 2.1
Corporate & other 349 246 42.2
Total 18,840 18,613 1.2
While the headcount in the Austrian segment was further reduced, the CEE segments saw an increase
mainly driven by M&A activities in Belarus and Croatia. The rise in corporate & other was driven by A1 Digi-
tal.
M&A drove the increase in
International Operations
headcount

A1 Telekom Austria Group 7
Detailed analysis on quarterly results (proforma, IAS 18)3
Segment Austria
Key performance indicators Proforma view ( = Reported view) Financials
in EUR million Q1 2018 reported
Q1 2017 proforma % change
Total revenues 654.6 643.3 1.8
Service revenues 592.3 594.9 – 0.4
thereof mobile service revenues 254.6 252.7 0.7
thereof fixed-line service revenues 337.7 342.2 – 1.3
Equipment revenues 49.2 32.9 49.5
Other operating income 13.1 15.5 – 15.1
EBITDA 234.8 228.3 2.8
% of total revenues 35.9% 35.5%
Adjusted EBITDA 234.8 214.0 9.7
EBIT 127.3 109.0 16.8
% of total revenues 19.4% 16.9%
Wireless indicators Q1 2018 reported
Q1 2017 proforma % change
Wireless subscribers (thousands) 5,307.0 5,399.2 – 1.7
thereof postpaid 3,777.9 3,697.6 2.2
thereof prepaid 1,529.1 1,701.6 – 10.1
MoU (per Ø subscriber) 267.5 255.1 4.8
ARPU (in EUR) 16.0 15.6 2.7
Churn (%) 1.7% 1.7%
Wireline indicators Q1 2018 reported
Q1 2017 proforma % change
RGUs (thousands) 3,378.7 3,476.8 – 2.8 Adjusted EBITDA is EBITDA excluding one-off effects, FX effects and restructuring charges.
As there have been no M&A transactions in Austria between the beginning of the comparison period
and the end of the period under review, the following analysis is based on reported figures.
In Q1 2018, the major trends in the competitive environment in Austria remained unchanged. In the mo-
bile market, A1 continues to follow its multi-brand strategy and higher granularity in market segmentation.
In the high-value segment, the company aims to profit from propositions with additional attractive services
like ‘zero-rated’ services, higher roaming packages and customer-friendly apps. In the no-frills and pre-
paid segment competition remained intense and the company reacted with attractive propositions via its
bob and YESSS! brands. Additionally, subsidies for bob customers were introduced in Q4 2017 for the first
time. Overall, after higher investments in the fourth quarter 2017 due to Christmas promotions, subsidies
were reduced in Q1 2018 both for A1 and bob customers. Prices for new customers in the mobile premium
segment have been adjusted as of 1 February 2018. An indexation of 2.1% for existing customers in both
the mobile high-value and the fixed-line businesses has been effective as of 1 April 2018. In March 2018,
A1 connect PLUS was launched, which serves as a new platform for convergent products.
3 The following tables are presented on a proforma basis and include effects of M&A transactions executed between the start of the comparison period and the end of the reporting period. This affects the segments of Croatia and Belarus. The proforma view is equivalent to the reported view for the other segments. Average monthly revenue per fixed-line (ARPL) is available on a reported basis only. For the reconciliation tables, including reported and proforma values, as well as the difference thereof, see page 18.

8 Results for the First Quarter 2018
The fixed-line business continued to profit from the monthly fee increase for existing customers as of 1 Au-
gust 2017 as well as ongoing high demand for broadband products with higher speeds and TV options. In
this context, next to the classical fibre infrastructure, the hybrid modem as a combination of the fixed-line
and mobile networks remains central to providing fixed-line products with higher bandwidths. Beyond
that, the Austrian broadband market continued to be shaped by the ongoing high demand for mobile WiFi
routers with unlimited data offerings.
In the first quarter of 2018, the total number of mobile communication subscribers declined entirely due to
the decrease in prepaid customers and despite an increase in postpaid customers. A higher demand for
mobile WiFi routers and high-value tariffs helped to slow down the subscriber decline. Net additions came
in negative at -28,200, entirely driven by the prepaid segment.
In the fixed-line business, total revenue generating units (RGUs) decreased in Q1 2018 mainly due to
losses of voice RGUs. While the demand for fibre upgrades remained continuously strong and TV RGUs
also continued to exhibit solid growth, the number of fixed-line broadband RGUs declined year-on-year as
the above mentioned price increase as of 1 August 2017 led to higher churn and due to some substitution
by WiFi routers. Compared to Q4 and Q3, the number of broadband RGUs remained stable.
In the first quarter of 2018, total revenues increased by 1.8% despite positive one-off effects in the
amount of EUR 14.4 mn in the comparison period. Without these one-off effects, the increase amounts to
4.1%. Also, total service revenues rose by 1.4% excluding the one-off effects. Fixed-line service revenues
rose on the back of the above mentioned price increase as well as solid demand for higher bandwidth
products and TV options, which also drove ARPL higher. Mobile service revenues rose as increased reve-
nues from high-value customers and mobile WiFi routers as well visitor roaming more than outweighed
negative effects on customer roaming after the abolition of retail roaming within the EU as of 15 June
2017. Equipment revenues rose due to a more expensive handset portfolio and higher quantities as well
as ICT equipment revenues caused by larger customer projects.
ARPU increased in Q1 2018 compared to last year due to the rise in the number of mobile WiFi router cus-
tomers and high-value customers as well as visitor roaming overcompensating the negative customer
roaming effect.
Total costs and expenses were higher in the first quarter of 2018 compared to the same period last year.
Costs of equipment increased due to a more expensive handset portfolio and higher quantities as well as
higher ICT equipment costs, which were partly compensated by promotional deals. Overall, subsidies in-
creased due to a higher subsidy level and increased quantities. Higher product-related costs such as com-
missions, content costs and costs for leased lines, were fully offset by lower workforce costs which were
impacted by some time-shifts in projects to upcoming quarters .
In total, adjusted EBITDA4 increased by 9.7% due to higher fixed-line service revenues, a better equipment
margin and cost efficiencies.
4 Adjusted EBITDA is EBITDA excluding one-off effects, FX effects and restructuring charges.
4.5% year-on-year TV RGU
growth
Adjusted EBITDA rose by
9.7%

A1 Telekom Austria Group 9
Segment Bulgaria
Key performance indicators Proforma view ( = Reported view) Financials
in EUR million Q1 2018 reported
Q1 2017 proforma % change
Total revenues 107.0 103.5 3.4
Service revenues 89.3 86.7 3.0
thereof mobile service revenues 64.6 64.8 – 0.3
thereof fixed-line service revenues 24.7 21.9 12.7
Equipment revenues 16.2 15.7 2.8
Other operating income 1.6 1.1 42.2
EBITDA 31.2 28.2 10.7
% of total revenues 29.2% 27.3%
Adjusted EBITDA 30.8 28.6 7.8
EBIT – 78.3 – 0.7 n.m.
% of total revenues – 73.2% – 0.7%
Wireless indicators Q1 2018 reported
Q1 2017 proforma % change
Wireless subscribers (thousands) 3,959.4 4,090.3 – 3.2
thereof postpaid 3,506.3 3,491.3 0.4
thereof prepaid 453.1 599.1 – 24.4
MoU (per Ø subscriber)*) 318.9 304.7 4.6
ARPU (in EUR) 5.4 5.3 2.9
Churn (%) 1.5% 2.1%
Wireline indicators Q1 2018 reported
Q1 2017 proforma % change
RGUs (thousands) 1,005.1 1,006.8 – 0.2 Adjusted EBITDA is EBITDA excluding one-off effects, FX effects and restructuring charges. *) Minutes of Use no longer include M2M subscribers. Comparative figures have been adjusted accordingly.
As there have been no M&A transactions in Bulgaria between the beginning of the comparison period
and the end of the period under review, the following analysis is based on reported figures.
In the Bulgarian market, the trend of stabilisation continued. Mobiltel maintained its focus on value-based
management and enhanced efforts to retain high-value customers with convergent offers. In the mobile
business, customer retention in the residential segment remained a challenge while the business segment
continued to improve and showed a slight increase in a year-on-year comparison. Fixed-line trends con-
tinued to be encouraging on the back of corporate solutions as well as successful up and cross selling for
residential customers. As of 1 February 2018, a new mobile tariff portfolio was launched which includes a
new digital package giving access to cloud storage and mobile TV with sport channels at higher prices.
Total mobile subscribers declined year-on-year in the first quarter of 2018 due to the prepaid segment
which was impacted by the national regulation for a limited number of prepaid card activations per per-
son, effective since 1 July 2017. The contract segment grew following demand for smartphones and mo-
bile broadband services. Total fixed-line revenue generating units (RGUs) decreased slightly, driven by the
decrease in fixed-line voice services, mostly offset by positive trends in broadband and TV.
Total revenues continued the positive trend of the last quarters and rose by 3.4%, driven by higher service
revenues. Fixed-line service revenues increased, supported by the launch of the exclusive sports TV pack-
age in Q1 2017, upselling activities and high demand for customised fixed-line corporate solutions. Mo-
bile service revenues remained stable as the slight increase in the business segment due to more custom-
ers and less repricing outweighed lower customer roaming.
10 Results for the First Quarter 2018
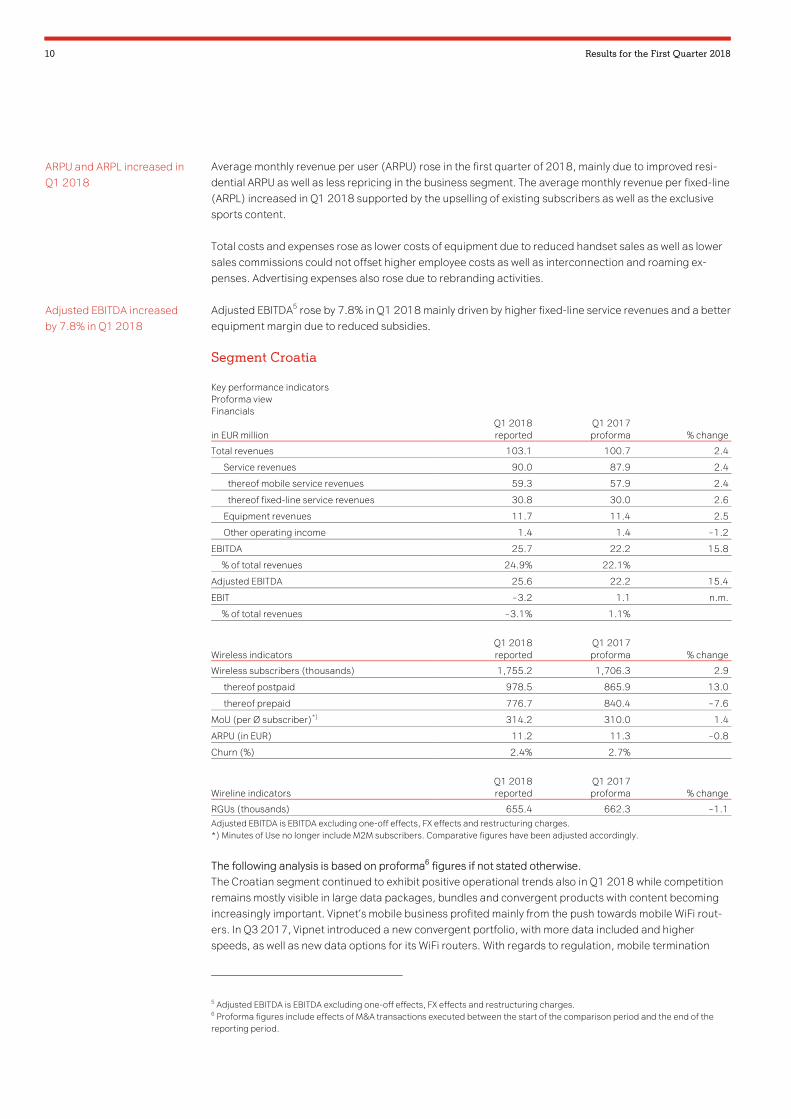
Average monthly revenue per user (ARPU) rose in the first quarter of 2018, mainly due to improved resi-
dential ARPU as well as less repricing in the business segment. The average monthly revenue per fixed-line
(ARPL) increased in Q1 2018 supported by the upselling of existing subscribers as well as the exclusive
sports content.
Total costs and expenses rose as lower costs of equipment due to reduced handset sales as well as lower
sales commissions could not offset higher employee costs as well as interconnection and roaming ex-
penses. Advertising expenses also rose due to rebranding activities.
Adjusted EBITDA5 rose by 7.8% in Q1 2018 mainly driven by higher fixed-line service revenues and a better
equipment margin due to reduced subsidies.
Segment Croatia
Key performance indicators Proforma view Financials
in EUR million Q1 2018 reported
Q1 2017 proforma % change
Total revenues 103.1 100.7 2.4
Service revenues 90.0 87.9 2.4
thereof mobile service revenues 59.3 57.9 2.4
thereof fixed-line service revenues 30.8 30.0 2.6
Equipment revenues 11.7 11.4 2.5
Other operating income 1.4 1.4 – 1.2
EBITDA 25.7 22.2 15.8
% of total revenues 24.9% 22.1%
Adjusted EBITDA 25.6 22.2 15.4
EBIT – 3.2 1.1 n.m.
% of total revenues – 3.1% 1.1%
Wireless indicators Q1 2018 reported
Q1 2017 proforma % change
Wireless subscribers (thousands) 1,755.2 1,706.3 2.9
thereof postpaid 978.5 865.9 13.0
thereof prepaid 776.7 840.4 – 7.6
MoU (per Ø subscriber)*) 314.2 310.0 1.4
ARPU (in EUR) 11.2 11.3 – 0.8
Churn (%) 2.4% 2.7%
Wireline indicators Q1 2018 reported
Q1 2017 proforma % change
RGUs (thousands) 655.4 662.3 – 1.1 Adjusted EBITDA is EBITDA excluding one-off effects, FX effects and restructuring charges. *) Minutes of Use no longer include M2M subscribers. Comparative figures have been adjusted accordingly.
The following analysis is based on proforma6 figures if not stated otherwise.
The Croatian segment continued to exhibit positive operational trends also in Q1 2018 while competition
remains mostly visible in large data packages, bundles and convergent products with content becoming
increasingly important. Vipnet’s mobile business profited mainly from the push towards mobile WiFi rout-
ers. In Q3 2017, Vipnet introduced a new convergent portfolio, with more data included and higher
speeds, as well as new data options for its WiFi routers. With regards to regulation, mobile termination
5 Adjusted EBITDA is EBITDA excluding one-off effects, FX effects and restructuring charges. 6 Proforma figures include effects of M&A transactions executed between the start of the comparison period and the end of the reporting period.
ARPU and ARPL increased in
Q1 2018
Adjusted EBITDA increased
by 7.8% in Q1 2018

A1 Telekom Austria Group 11
rates have been cut since July 2017 while frequency usage fees have been lowered as of December 2017.
The fixed-line business profited from the acquisition of Metronet, consolidated as of 1 February 2017.
Mobile subscribers grew, with gains in the contract subscriber base due to the strong growth of WiFi rout-
ers as well as the ongoing general shift from prepaid to contract in the market. In the fixed-line business,
revenue generating units (RGUs) declined due to the shift towards mobile WiFi routers.
In the first quarter of 2018, total revenues grew by 2.4%. Mobile service revenues increased as lower inter-
connection revenues due to the above-mentioned termination rate cut were outweighed by growth in mo-
bile WiFi routers. Fixed-line service revenues continued to grow but at a lower rate due to the shift towards
mobile WiFi routers. Equipment revenues rose due to more sales following higher subsidies.
Average monthly revenue per user (ARPU) decreased in the first quarter of 2018 due to lower interconnec-
tion revenues. Average monthly revenue per fixed line (ARPL) rose on a reported basis as the consolida-
tion of Metronet with a higher ARPL outweighed the decline in fixed-line RGUs.
In the first quarter of 2018, total costs and expenses decreased due to lower bad debt and MTR cut driven
lower interconnection costs. Equipment costs rose due to increased quantities and subsidy level.
Adjusted EBITDA7 increased by 15.4% year-on-year due to service revenue growth and lower total costs
and expenses.
Segment Belarus
Key performance indicators Proforma view Financials
in EUR million Q1 2018 reported
Q1 2017 proforma % change
Total revenues 88.3 94.5 – 6.6
Service revenues 67.6 76.3 – 11.4
thereof mobile service revenues 59.0 67.6 – 12.7
thereof fixed-line service revenues 8.5 8.6 – 1.0
Equipment revenues 17.4 14.1 22.9
Other operating income 3.4 4.1 – 18.0
EBITDA 38.9 46.2 – 15.7
% of total revenues 44.1% 48.8%
Adjusted EBITDA 45.8 45.0 1.9
EBIT 21.2 33.6 – 37.0
% of total revenues 24.0% 35.6%
Wireless indicators Q1 2018 reported
Q1 2017 proforma % change
Wireless subscribers (thousands) 4,842.6 4,881.6 – 0.8
thereof postpaid 3,955.5 3,945.9 0.2
thereof prepaid 887.1 935.7 – 5.2
MoU (per Ø subscriber)*) 436.3 415.1 5.1
ARPU (in EUR) 4.1 4.6 – 11.9
Churn (%) 1.5% 1.8%
Wireline indicators Q1 2018 reported
Q1 2017 proforma % change
RGUs (thousands) 475.5 439.7 8.1 Adjusted EBITDA is EBITDA excluding one-off effects, FX effects and restructuring charges.
7 Adjusted EBITDA is EBITDA excluding one-off effects, FX effects and restructuring charges.
Total service revenues and
equipment revenues
increased in Q1 2018
Adjusted EBITDA rose by
15.4% year-on-year

12 Results for the First Quarter 2018
*) Minutes of Use no longer include M2M subscribers. Comparative figures have been adjusted accordingly.
The following analysis is based on proforma8 figures if not stated otherwise.
In Belarus, operational developments continued to face macroeconomic challenges, nevertheless there
are some improvements and GDP is expected to grow by 2.8% in 2018 (IMF estimate; 2017: +2.4%). The
government continued to be restrictive on price increases in order to stabilise inflation, which came in at
5.4% in March 2018.
velcom strengthened its fixed-line business through the acquisition of Garant (Gomel), consolidated as of
1 August 2017 and has been offering cloud services and digital products with its own data centre since
September 2017. In March and April 2017, inflation-linked price increases were implemented in the fixed-
line and mobile businesses respectively. As of 1 April 2018 prices for mobile subscribers were increased
by 3.0%. Despite its lack of a 4G license, velcom maintained its superior standard in terms of the coverage
and quality of its mobile network while facing strong mobile competition based on unlimited data offers.
To counter these challenges, velcom launched a new youth mobile tariff plan with included data volumes
of up to 4 GB and selected social networks and messenger to be used independently of data limits as of
January 2018. This led to an increase in the company’s mobile contract customer base, while the number
of prepaid customers decreased due to database cleansing of inactive SIM cards. Revenue generating
units in the fixed-line business grew following upselling to multi-play propositions.
In Q1 2018, the Belarusian Rouble depreciated by 16.0% compared to the same period last year (period
average). Due to the negative FX effect of EUR 16.8 mn, total revenues declined in Euro terms, while they
rose by 11.2% (reported: +13.1%) on a local currency basis. This rise was driven by higher equipment rev-
enues, which rose due to higher quantities and a switch towards a more expensive handset portfolio. Ser-
vice revenues also rose due to inflation-linked price increases and ongoing growth in data consumption.
Total costs and expenses rose on a local currency basis, driven by higher costs of equipment due to higher
quantities and more expensive handsets. Costs of services also rose driven, inter alia, by higher frequency
fees, site rentals, content costs and IT maintenance.
On a local currency basis, EBITDA rose slightly by 0.4% (reported: +1.0%) in the first quarter of 2018 com-
pared to the same period last year, as the increase in service revenues outweighed higher costs of service.
In Euro terms, EBITDA decreased due to the negative FX translation effect of EUR 7.4 mn. Adjusted
EBITDA9 increased by 1.9%.
8 Proforma figures include effects of M&A transactions executed between the start of the comparison period and the end of the reporting period. 9 Adjusted EBITDA is EBITDA excluding one-off effects, FX effects and restructuring charges.
Belarusian Rouble
depreciated by 16.0% in Q1
EBITDA increase of 0.4%
year-on-year in local
currency

A1 Telekom Austria Group 13
Segment Slovenia
Key performance indicators Proforma view ( = Reported view) Financials
in EUR million Q1 2018 reported
Q1 2017 proforma % change
Total revenues 49.3 52.9 – 6.8
Service revenues 38.9 41.7 – 6.7
thereof mobile service revenues 30.2 33.1 – 8.8
thereof fixed-line service revenues 8.7 8.6 1.6
Equipment revenues 9.2 10.1 – 8.8
Other operating income 1.1 1.0 9.2
EBITDA 7.4 12.1 – 39.2
% of total revenues 15.0% 22.9%
Adjusted EBITDA 7.4 12.1 – 39.2
EBIT 0.2 3.7 – 94.2
% of total revenues 0.4% 7.1%
Wireless indicators Q1 2018 reported
Q1 2017 proforma % change
Wireless subscribers (thousands) 697.6 717.0 – 2.7
thereof postpaid 604.4 601.7 0.5
thereof prepaid 93.2 115.3 – 19.2
MoU (per Ø subscriber)*) 375.2 361.8 3.7
ARPU (in EUR) 14.4 15.5 – 7.2
Churn (%) 1.6% 1.7%
Wireline indicators Q1 2018 reported
Q1 2017 proforma % change
RGUs (thousands) 171.4 176.4 – 2.8 Adjusted EBITDA is EBITDA excluding one-off effects, FX effects and restructuring charges. *) Minutes of Use no longer include M2M subscribers. Comparative figures have been adjusted accordingly.
As there have been no M&A transactions in Slovenia between the beginning of the comparison period and
the end of the period under review, the following analysis is based on reported figures.
In the first quarter of 2018, the Slovenian telecommunications market was still characterised by fierce
competition in the mobile market, with a focus on convergent tariffs with high discounts and competitive
mobile tariffs including high data allowances. As a result, the number of mobile customers and mobile
monthly fees declined. Together with lower customer roaming revenues this led to a decline in total reve-
nues in Slovenia of 6.8%. To counter this trend, prices in the mobile residential and mobile SME business
segment have been increased by 1 Euro as of 1 April 2018.
In the fixed-line business, TV content has become a major differentiation factor as some commercial TV
channels have changed from a free air distribution to a fixed-line-only distribution, for which customers
now need to pay. Following the resulting higher content costs, prices for IPTV were increased by 3 Euro for
all customers as of 1 January 2018 which helped to grow fixed-line service revenues. Overall, total service
revenues declined.
Total costs and expenses increased, mainly driven by higher roaming, administration, corporate network
and equipment costs . Together with lower total revenues, this led to a sharp adjusted EBITDA10 decline of
39.2%.
10 Adjusted EBITDA is EBITDA excluding one-off effects, FX effects and restructuring charges.
Total revenues declined by
6.8%
Adjusted EBITDA declined
sharply by 39.2%

14 Results for the First Quarter 2018
Segment Republic of Serbia
Key performance indicators Proforma view ( = Reported view) Financials
in EUR million Q1 2018 reported
Q1 2017 proforma % change
Total revenues 57.0 51.0 11.9
Service revenues 37.3 32.3 15.4
thereof mobile service revenues 36.1 31.0 16.4
Equipment revenues 18.7 17.4 7.4
Other operating income 1.1 1.3 – 16.1
EBITDA 9.8 7.7 26.7
% of total revenues 17.1% 15.1%
Adjusted EBITDA 9.3 7.7 21.1
EBIT – 1.4 – 3.3 58.8
% of total revenues – 2.4% – 6.5%
Wireless indicators Q1 2018 reported
Q1 2017 proforma % change
Wireless subscribers (thousands) 2,174.9 2,155.8 0.9
thereof postpaid 1,392.1 1,254.9 10.9
thereof prepaid 782.8 900.9 – 13.1
MoU (per Ø subscriber)*) 312.4 271.0 15.3
ARPU (in EUR) 5.5 4.8 15.1
Churn (%) 3.2% 3.2% Adjusted EBITDA is EBITDA excluding one-off effects, FX effects and restructuring charges. *) Minutes of Use no longer include M2M subscribers. Comparative figures have been adjusted accordingly.
As there have been no M&A transactions in the Republic of Serbia between the beginning of the
comparison period and the end of the period under review, the following analysis is based on
reported figures.
In the segment Republic of Serbia, vip mobile faces a highly competitive market with aggressive conver-
gent offers which include high data allowances at high discounts. The company addressed this market en-
vironment by means of a repositioning and the introduction of flat tariffs in June 2017. The improving
trends were already visible in the contract subscriber numbers, which were also supported by high de-
mand for mobile WiFi routers. The resulting higher mobile service revenues outweighed the regulation-
driven lower interconnection revenues due to another mobile termination rate cut in January 2018 and led
to strong ARPU growth as well as an increase in total revenues of 11.9%.
Total costs and expenses rose driven by higher equipment and interconnection costs. The latter rose due
to unlimited tariffs which led to increased outgoing traffic. Equipment costs increased due to the in-
creased number of postpaid subscribers with subsidised devices and mobile WiFi routers. Following the
service revenue increase, adjusted EBITDA11 rose sharply by 21.1%.
11 Adjusted EBITDA is EBITDA excluding one-off effects, FX effects and restructuring charges. Difference between EBITDA and adjusted EBITDA stem mainly from FX effects in the segment Republic of Serbia.
Total revenues increased by
11.9%
Adjusted EBITDA increase of
21.1%

A1 Telekom Austria Group 15
Segment Republic of Macedonia
Key performance indicators Proforma view ( = Reported view) Financials
in EUR million Q1 2018 reported
Q1 2017 proforma % change
Total revenues 28.1 27.3 2.9
Service revenues 26.3 25.6 2.7
thereof mobile service revenues 20.1 19.2 4.6
thereof fixed-line service revenues 6.2 6.4 – 2.8
Equipment revenues 1.6 1.6 3.4
Other operating income 0.2 0.1 31.4
EBITDA 7.0 5.9 17.5
% of total revenues 24.9% 21.8%
Adjusted EBITDA 7.0 5.7 22.3
EBIT – 0.5 – 5.8 90.6
% of total revenues – 1.9% – 21.2%
Wireless indicators Q1 2018 reported
Q1 2017 proforma % change
Wireless subscribers (thousands) 1,064.1 1,105.8 – 3.8
thereof postpaid 648.7 651.4 – 0.4
thereof prepaid 415.4 454.4 – 8.6
MoU (per Ø subscriber)*) 421.7 429.1 – 1.7
ARPU (in EUR) 6.3 5.8 8.2
Churn (%) 1.7% 1.7%
Wireline indicators Q1 2018 reported
Q1 2017 proforma % change
RGUs (thousands) 348.6 314.5 10.9 Adjusted EBITDA is EBITDA excluding one-off effects, FX effects and restructuring charges. *) Minutes of Use no longer include M2M subscribers. Comparative figures have been adjusted accordingly.
As there have been no M&A transactions in the Republic of Macedonia between the beginning of the
comparison period and the end of the period under review, the following analysis is based on
reported figures.
Also in Q1 2018, customer retention was the major focus of all market players in the Macedonian seg-
ment. In the mobile as well as the fixed-line market, customers are leaning towards multiple-play offers
rather than maintaining multiple single-play subscriptions. This increases the competitive advantage of
convergent operators, such as one.Vip and led to an increase in the number of revenue generating units
(RGU) and a decrease in mobile prepaid subscribers. As of end of March 2018, one.Vip increased the data
volume in its mobile tariffs to meet increasing customer demands. This followed the introduction of WiFi
routers in May 2017.
Total revenues increased by 2.9% mainly due to higher total service revenues as mobile service revenues
rose, supported by higher monthly fees, while interconnection revenues declined. Total costs and ex-
penses fell in a year-on-year comparison, driven by lower content costs as well as cost synergies deriving
from the merger with ONE. This led to adjusted EBITDA12 growth of 22.3%.
12 Adjusted EBITDA is EBITDA excluding one-off effects, FX effects and restructuring charges.
Adjusted EBITDA growth of
22.3% in Q1 2018

16 Results for the First Quarter 2018
A1 Telekom Austria Group outlook for the full year 2018 unchanged
In Q1 2018, A1 Telekom Austria Group again managed to grow total revenues and EBITDA via a clear focus on
high-value customers and attractive fixed-line propositions, both on a reported and on a proforma basis. This
was achieved despite the fact that most of the Group’s mobile markets continued to be characterised by intense
competition and regulatory burdens. Once more, results were negatively impacted by the stepwise abolition of
retail roaming in the EU during the last two years. In Q1 2018, the negative roaming impact was in line with ex-
pectations. The Belarusian Rouble followed the movement of the Russian Rouble and depreciated by 16.0% year-
on-year (period average). Cost efficiencies and a better equipment margin enabled the translation of the solid
revenue growth into an EBITDA increase. Moreover, results profited from acquisitions in the fixed-line business.
In 2017, the A1 Telekom Austria Group decided to harmonise its brands throughout the Group and to roll out the
‘A1’ brand in a gradual manner, depending on local circumstances. This triggered the amortisation of local brand
values, which had reached a total of around EUR 350 mn by the end of 2016. The respective companies will
amortise the brand values until the phase-out of the old brands, which is expected to have a negative impact on
the net result until the financial year 2019. More than half of the impact already came through in 2017 and Q1
2018.
For the full year 2018, most of the market dynamics mentioned above are expected to remain. Both in Austria and
in the CEE markets, the competitive environment in mobile markets is anticipated to continue, while demand for
fixed-line services is expected to remain a positive driver across all markets. In the CEE segments, operational re-
sults are expected to benefit increasingly from measures taken in the past as well as from the macroeconomic
improvements, with GDP growth forecasted in all markets.
The negative roaming impact is anticipated to amount to approximately 1.0% to 1.5% of Group EBITDA for the full
year 2018. Contrary to the supportive FX development in 2017, the operational performance in Belarus is ex-
pected to be negatively affected by a devaluation of the Belarusian Rouble.
In this business environment, the Management of A1 Telekom Austria Group remains committed to its growth
strategy and is concentrating on the following focus areas: exceling in the core business, the expansion of prod-
ucts and services as well as value-accretive mergers and acquisitions. As in the previous year, results should gain
support from ongoing efforts to continuously increase operating efficiency. For the year 2018, the Management
of A1 Telekom Austria Group expects to achieve modest growth in total revenues on a reported basis.
A1 Telekom Austria Group remains committed to the LTE rollout across its markets as well as the accelerated fibre
deployment in Austria. Capital expenditures before spectrum investments and acquisitions are expected to re-
main almost stable in 2018 (EUR 750 mn).
Whilst the Management of A1 Telekom Austria Group acknowledges the limited predictability of the Belarusian
Rouble, it expects the currency to devalue by approximately 10% versus the EUR (period average) in 2018.
Based on the improved operational and financial performance of the Group, a new expected dividend level was
agreed upon by América Móvil and Österreichische Bundes- und Industriebeteiligungen GmbH (ÖBIB) in 2016.
Starting with the financial year 2016, this dividend expectation entails the payment of EUR 0.20 per share to be
maintained or increased on a sustainable basis in line with the operational and financial developments of the
Group.
In order to ensure its financial flexibility, A1 Telekom Austria Group remains committed to maintaining its
Baa2/BBB ratings from Moody’s and Standard & Poor’s. With regards to frequencies, in Austria the NRA an-
nounced that an auction on the 3.4-3.8 GHz band will be held in 2018.13
13 Please note that this a list of potential spectrum awards procedures. The Group is not permitted to comment on whether A1 Telekom Austria Group is planning and sees a need to participate and acquire spectrum in the abovementioned procedures.

A1 Telekom Austria Group 17
Reconciliation tables and consolidated financial statements

18 Results for the First Quarter 2018
Reconciliation tables – IAS18 and IFRS 15 reconciliation
As of 1 January 2018, A1 Telekom Austria Group initially applied IFRS 15, electing the modified retro-spec-
tive approach for the initial application in accordance with the transition guidance. Accordingly, the infor-
mation presented for 2017 has not been restated - i.e. it is presented, as previously reported, under IAS
18 and related interpretations. The following tables provide a reconciliation from IFRS 15 to IAS 18. The
new revenue recognition accounting standard under IFRS 15 requires accounting for the life cycle value of
contracts by allocating the total revenues from a contract to the different deliverables of the contract
based on their relative fair values.
Income Statement (reported)
in EUR million Q1 2018
IAS18 Q1 2017
IAS18 % change Q1 2018
IFRS15
Service revenues 931.3 932.7 – 0.2 898.5
Equipment revenues 123.7 102.8 20.3 153.7
Other operating income 20.9 23.4 – 10.7 20.9
Total revenues 1,075.9 1,058.9 1.6 1,073.1
Cost of service – 340.9 – 341.1 0.1 – 340.9
Cost of equipment – 140.6 – 127.7 – 10.1 – 140.4
Selling, general &
administrative expenses – 250.3 – 247.7 – 1.0 – 240.2
Other expenses – 2.6 – 2.8 5.4 – 2.6
Total costs and expenses – 734.4 – 719.4 – 2.1 – 724.2
EBITDA 341.5 339.5 0.6 348.9
% of total revenues 31.7% 32.1% 32.5%
Depreciation and amortisation – 289.8 – 213.1 – 36.0 – 289.8
EBIT 51.6 126.4 – 59.2 59.1
% of total revenues 4.8% 11.9% 5.5%
Interest income 3.2 3.5 – 8.9 1.2
Interest expense – 21.9 – 24.7 11.5 – 21.9
Other financial expense – 2.7 – 4.1 34.5 – 2.7
Foreign currency exchange
differences 3.2 4.5 – 27.8 3.2
Equity interest in net income of
affiliates 0.1 – 0.1 o.A. 0.1
Earnings before income tax 33.6 105.5 – 68.1 39.0
Income tax – 9.2 – 9.1 – 1.0 – 10.7
Net result*)
24.5 96.4 – 74.6 28.4
A1 Telekom Austria Group 19
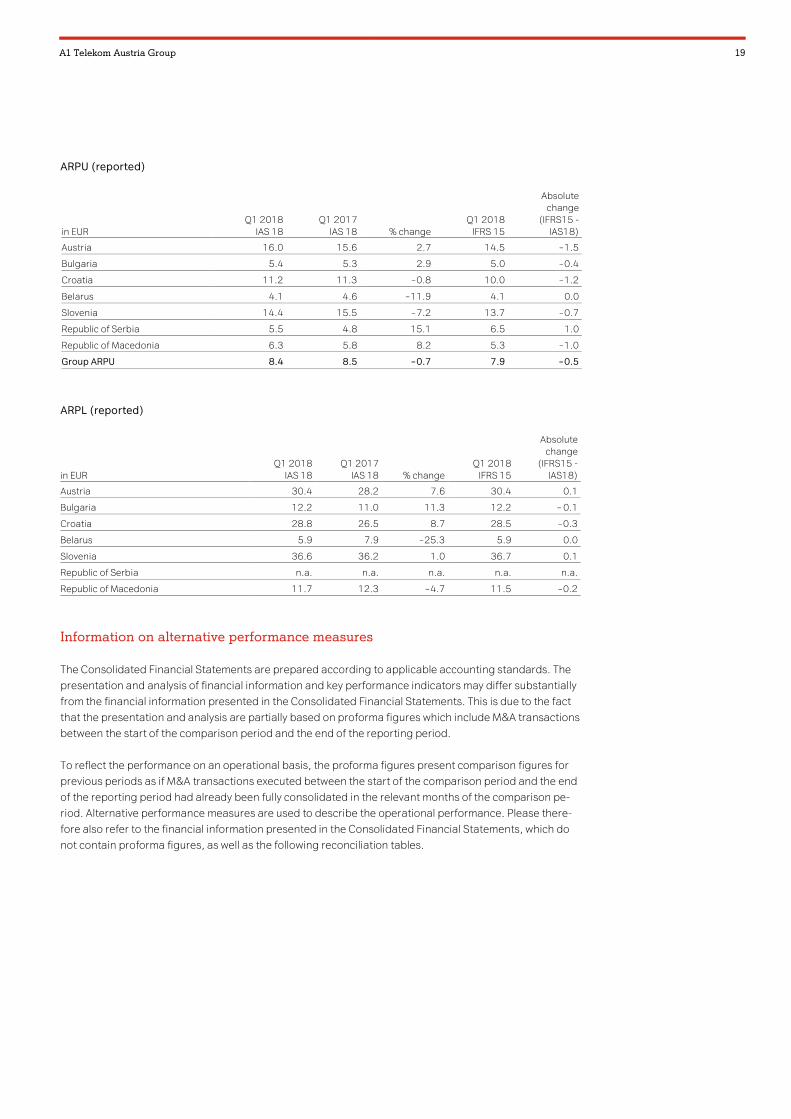
ARPU (reported)
in EUR Q1 2018
IAS 18 Q1 2017
IAS 18 % change Q1 2018
IFRS 15
Absolute change
(IFRS15 - IAS18)
Austria 16.0 15.6 2.7 14.5 – 1.5
Bulgaria 5.4 5.3 2.9 5.0 – 0.4
Croatia 11.2 11.3 – 0.8 10.0 – 1.2
Belarus 4.1 4.6 – 11.9 4.1 0.0
Slovenia 14.4 15.5 – 7.2 13.7 – 0.7
Republic of Serbia 5.5 4.8 15.1 6.5 1.0
Republic of Macedonia 6.3 5.8 8.2 5.3 – 1.0
Group ARPU 8.4 8.5 – 0.7 7.9 – 0.5
ARPL (reported)
in EUR Q1 2018
IAS 18 Q1 2017
IAS 18 % change Q1 2018
IFRS 15
Absolute change
(IFRS15 - IAS18)
Austria 30.4 28.2 7.6 30.4 0.1
Bulgaria 12.2 11.0 11.3 12.2 – 0.1
Croatia 28.8 26.5 8.7 28.5 – 0.3
Belarus 5.9 7.9 – 25.3 5.9 0.0
Slovenia 36.6 36.2 1.0 36.7 0.1
Republic of Serbia n.a. n.a. n.a. n.a. n.a.
Republic of Macedonia 11.7 12.3 – 4.7 11.5 – 0.2
Information on alternative performance measures
The Consolidated Financial Statements are prepared according to applicable accounting standards. The
presentation and analysis of financial information and key performance indicators may differ substantially
from the financial information presented in the Consolidated Financial Statements. This is due to the fact
that the presentation and analysis are partially based on proforma figures which include M&A transactions
between the start of the comparison period and the end of the reporting period.
To reflect the performance on an operational basis, the proforma figures present comparison figures for
previous periods as if M&A transactions executed between the start of the comparison period and the end
of the reporting period had already been fully consolidated in the relevant months of the comparison pe-
riod. Alternative performance measures are used to describe the operational performance. Please there-
fore also refer to the financial information presented in the Consolidated Financial Statements, which do
not contain proforma figures, as well as the following reconciliation tables.

20 Results for the First Quarter 2018
Group - Adjusted EBITDA (reported and proforma)
in EUR million Q1 2018 Q1 2017 % change
EBITDA (reported) 341.5 339.5 0.6
FX translation effect 6.9
One-off effects – 0.8 – 15.2
Restructuring charges 0.0 – 0.1
Adjusted EBITDA (reported) 347.5 324.2 7.2
M&A effect 1.4
Adjusted EBITDA (proforma) 347.5 325.6 6.7
Austria - Adjusted EBITDA (reported)
in EUR million Q1 2018 Q1 2017 % change
EBITDA (reported) 234.8 228.3 2.8
One-off effects – 14.2
Restructuring charges 0.0 – 0.1
Adjusted EBITDA (reported) 234.8 214.0 9.7
ARPL (reported)
ARPL-relevant revenues are fixed retail revenues and fixed interconnection revenues. The ARPL is calcu-
lated by dividing ARPL-relevant revenues by average fixed access lines in a certain period. The difference
to fixed-line service revenues are interconnection transit revenues, solutions & connectivity revenues and
other revenues.
ARPL-relevant revenues (in EUR million) Q1 2018 reported
Q1 2017 reported % change
Austria 192.2 185.7 3.5
Bulgaria 19.5 17.8 9.4
Croatia 25.5 23.7 7.9
Belarus 5.4 4.1 30.0
Slovenia 7.7 7.7 0.7
Republic of Serbia n.a. n.a. n.a.
Republic of Macedonia 5.3 5.3 1.1
Access lines (in '000) Q1 2018 reported
Q1 2017 reported % change
Austria 2,102.6 2,187.5 – 3.9
Bulgaria 529.1 537.0 – 1.5
Croatia 294.8 305.0 – 3.3
Belarus 302.6 174.4 73.5
Slovenia 70.6 70.7 – 0.1
Republic of Serbia n.a. n.a. n.a.
Republic of Macedonia 152.4 142.7 6.9
ARPU (proforma)
ARPU-relevant revenues are wireless service revenues, i.e. mobile retail revenues (incl. customer roaming)
and mobile interconnection as well as visitor roaming and national roaming revenues. The ARPU is calcu-
lated based on ARPU-relevant revenues divided by the average subscribers in a certain period.

A1 Telekom Austria Group 21
Free Cashflow (reported)
(in EUR million) 1-3 M 2018
reported 1-3 M 2017
reported % change
Net cash flow from operating activities 269.3 261.9 2.8
Capital expenditures paid – 187.7 – 208.9 10.1
Proceeds from sale of plant, property and
equipment 2.5 8.5 – 71.0
Interest paid – 1.4 – 23.9 94.3
Free cash flow 82.6 37.5 120.2
Belarus Key Financials in EUR and BYN (reported and proforma)
Due to the impact on the consolidated results of occasionally substantial fluctuations in the Belarusian
Rouble, the performance of the Belarusian segment is also presented in local currency.
in EUR million Q1 2018 reported
Q1 2017 reported % change
Total revenues 88.3 92.9 – 4.9
Total costs and expenses – 49.4 – 47.0 – 5.0
EBITDA 38.9 45.9 – 15.1
in BYN million Q1 2018 reported
Q1 2017 reported % change
Total revenues 214.1 189.2 13.1
Total costs and expenses – 119.7 – 95.8 – 24.9
EBITDA 94.4 93.4 1.0
in EUR million Q1 2018 reported
Q1 2017 proforma % change
Total revenues 88.3 94.5 – 6.6
Total costs and expenses – 49.4 – 48.3 – 2.1
EBITDA 38.9 46.2 – 15.7
in BYN million Q1 2018 reported
Q1 2017 proforma % change
Total revenues 214.1 192.5 11.2
Total costs and expenses – 119.7 – 98.5 – 21.6
EBITDA 94.4 94.0 0.4
Proforma and reported results
The following section provides for the proforma values in the previous section the corresponding reported
values as well as the differences between both. The differences stem from the M&A activities listed below.
� The acquisition of the fixed-line provider Garant (Gomel) in Belarus, consolidated as of 1 August
2017.
� The acquisition of the fixed-line operator Metronet in Croatia, consolidated as of 1 February 2017.
22 Results for the First Quarter 2018
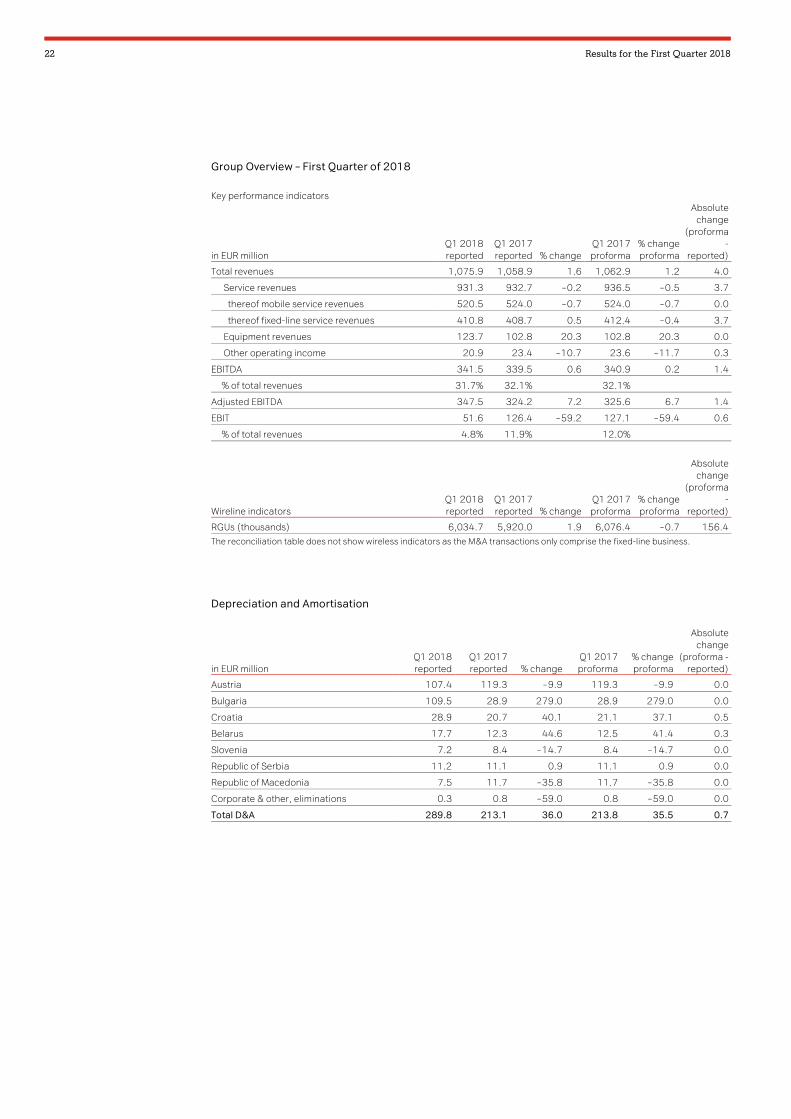
Group Overview – First Quarter of 2018
Key performance indicators
in EUR million Q1 2018 reported
Q1 2017 reported % change
Q1 2017 proforma
% change proforma
Absolute change
(proforma -
reported)
Total revenues 1,075.9 1,058.9 1.6 1,062.9 1.2 4.0
Service revenues 931.3 932.7 – 0.2 936.5 – 0.5 3.7
thereof mobile service revenues 520.5 524.0 – 0.7 524.0 – 0.7 0.0
thereof fixed-line service revenues 410.8 408.7 0.5 412.4 – 0.4 3.7
Equipment revenues 123.7 102.8 20.3 102.8 20.3 0.0
Other operating income 20.9 23.4 – 10.7 23.6 – 11.7 0.3
EBITDA 341.5 339.5 0.6 340.9 0.2 1.4
% of total revenues 31.7% 32.1% 32.1%
Adjusted EBITDA 347.5 324.2 7.2 325.6 6.7 1.4
EBIT 51.6 126.4 – 59.2 127.1 – 59.4 0.6
% of total revenues 4.8% 11.9% 12.0%
Wireline indicators Q1 2018 reported
Q1 2017 reported % change
Q1 2017 proforma
% change proforma
Absolute change
(proforma -
reported)
RGUs (thousands) 6,034.7 5,920.0 1.9 6,076.4 – 0.7 156.4 The reconciliation table does not show wireless indicators as the M&A transactions only comprise the fixed-line business.
Depreciation and Amortisation
in EUR million Q1 2018 reported
Q1 2017 reported % change
Q1 2017 proforma
% change proforma
Absolute change
(proforma - reported)
Austria 107.4 119.3 – 9.9 119.3 – 9.9 0.0
Bulgaria 109.5 28.9 279.0 28.9 279.0 0.0
Croatia 28.9 20.7 40.1 21.1 37.1 0.5
Belarus 17.7 12.3 44.6 12.5 41.4 0.3
Slovenia 7.2 8.4 – 14.7 8.4 – 14.7 0.0
Republic of Serbia 11.2 11.1 0.9 11.1 0.9 0.0
Republic of Macedonia 7.5 11.7 – 35.8 11.7 – 35.8 0.0
Corporate & other, eliminations 0.3 0.8 – 59.0 0.8 – 59.0 0.0
Total D&A 289.8 213.1 36.0 213.8 35.5 0.7

A1 Telekom Austria Group 23
EBIT
in EUR million Q1 2018 reported
Q1 2017 reported % change
Q1 2017 proforma
% change proforma
Absolute change
(proforma - reported)
Austria 127.3 109.0 16.8 109.0 16.8 0.0
Bulgaria – 78.3 – 0.7 n.a. – 0.7 n.a. 0.0
Croatia – 3.2 0.5 n.a. 1.1 n.a. 0.6
Belarus 21.2 33.6 – 36.9 33.6 – 37.0 0.0
Slovenia 0.2 3.7 – 94.2 3.7 – 94.2 0.0
Republic of Serbia – 1.4 – 3.3 58.8 – 3.3 58.8 0.0
Republic of Macedonia – 0.5 – 5.8 90.6 – 5.8 90.6 0.0
Corporate & other, eliminations – 13.6 – 10.6 – 28.6 – 10.6 – 28.6 0.0
Total EBIT 51.6 126.4 – 59.2 127.1 – 59.4 0.6
Capital Expenditures*)
in EUR million Q1 2018 reported
Q1 2017 reported % change
Q1 2017 proforma
% change proforma
Absolute change
(proforma - reported)
Austria 102.2 118.5 – 13.7 118.5 – 13.7 0.0
Bulgaria 11.1 14.7 – 24.7 14.7 – 24.7 0.0
Croatia 13.8 17.0 – 19.0 17.0 – 19.0 0.0
Belarus 7.3 4.1 80.6 4.1 80.6 0.0
Slovenia 3.1 21.7 – 85.6 21.7 – 85.6 0.0
Republic of Serbia 5.6 6.5 – 13.4 6.5 – 13.4 0.0
Republic of Macedonia 2.4 1.5 55.7 1.5 55.7 0.0
Corporate & other, eliminations – 0.2 – 3.9 94.5 – 3.9 94.5 0.0
Total capital expenditures 145.3 180.0 – 19.3 180.0 – 19.3 0.0 *) Additions to property, plant and equipment and intangible assets, excluding asset retirement obligations
Capital Expenditures – Tangible
in EUR million Q1 2018 reported
Q1 2017 reported % change
Austria 82.8 100.2 – 17.4
Bulgaria 7.7 11.7 – 33.7
Croatia 13.2 16.6 – 20.4
Belarus 5.4 3.8 42.2
Slovenia 2.7 3.8 – 28.3
Republic of Serbia 4.1 5.1 – 20.7
Republic of Macedonia 2.3 1.1 105.8
Corporate & other, eliminations – 0.3 – 3.9 92.0
Total capital expenditures - tangible 117.9 138.4 – 14.8

24 Results for the First Quarter 2018
Capital Expenditures – Intangible
in EUR million Q1 2018 reported
Q1 2017 reported % change
Austria 19.4 18.3 6.5
Bulgaria 3.4 3.1 9.6
Croatia 0.6 0.4 34.0
Belarus 1.9 0.2 n.m.
Slovenia 0.4 17.9 – 97.8
Republic of Serbia 1.5 1.3 15.4
Republic of Macedonia 0.1 0.4 – 75.9
Corporate & other, eliminations 0.1 0.0 n.a.
Total capital expenditures - intangible 27.4 41.6 – 34.2
Segment Croatia – First Quarter of 2018
Key performance indicators
in EUR million Q1 2018 reported
Q1 2017 reported % change
Q1 2017 proforma
% change proforma
Absolute change
(proforma - reported)
Total revenues 103.1 98.4 4.8 100.7 2.4 2.4
Service revenues 90.0 85.7 5.1 87.9 2.4 2.2
thereof mobile service revenues 59.3 57.9 2.3 57.9 2.4 0.0
thereof fixed-line service revenues 30.8 27.8 10.9 30.0 2.6 2.3
Equipment revenues 11.7 11.4 2.5 11.4 2.5 0.0
Other operating income 1.4 1.3 9.0 1.4 – 1.2 0.1
EBITDA 25.7 21.2 21.5 22.2 15.8 1.1
% of total revenues 24.9% 21.5% 22.1%
Adjusted EBITDA 25.6 n.a. n.a. 22.2 15.4 n.a.
EBIT – 3.2 0.5 n.m. 1.1 n.m. 0.6
% of total revenues – 3.1% 0.5% 1.1%
Wireline indicators Q1 2018 reported
Q1 2017 reported % change
Q1 2017 proforma
% change proforma
Absolute change
(proforma - reported)
RGUs (thousands) 655.4 662.3 – 1.1 662.3 – 1.1 0.0 The reconciliation table does not show wireless indicators as the M&A transaction in the segment only comprises the fixed-line business.

A1 Telekom Austria Group 25
Segment Belarus – First Quarter of 2018
Key performance indicators
in EUR million Q1 2018 reported
Q1 2017 reported % change
Q1 2017 proforma
% change proforma
Absolute change
(proforma - reported)
Total revenues 88.3 92.9 – 4.9 94.5 – 6.6 1.6
Service revenues 67.6 74.8 – 9.6 76.3 – 11.4 1.5
thereof mobile service revenues 59.0 67.6 – 12.7 67.6 – 12.7 0.0
thereof fixed-line service revenues 8.5 7.1 19.9 8.6 – 1.0 1.5
Equipment revenues 17.4 14.1 22.9 14.1 22.9 0.0
Other operating income 3.4 4.0 – 15.6 4.1 – 18.0 0.1
EBITDA 38.9 45.9 – 15.1 46.2 – 15.7 0.3
% of total revenues 44.1% 49.4% 48.8%
Adjusted EBITDA 45.8 n.a. n.a. 45.0 1.9 n.a.
EBIT 21.2 33.6 – 36.9 33.6 – 37.0 0.0
% of total revenues 24.0% 36.2% 35.6%
Wireline indicators Q1 2018 reported
Q1 2017 reported % change
Q1 2017 proforma
% change proforma
Absolute change
(proforma - reported)
RGUs (thousands) 475.5 283.3 67.9 439.7 8.1 156.4 The reconciliation table does not show wireless indicators as the M&A transaction in the segment only comprises the fixed-line business.

26 Results for the First Quarter 2018
Additional Information
Risks and Uncertainties
The A1 Telekom Austria Group faces various risks and uncertainties which could affect its results. For fur-
ther details about these risks and uncertainties, please refer to the A1 Telekom Austria Group Annual Re-
port 2017, pp. 72 ff.
Waiver of Review
This financial report of the A1 Telekom Austria Group contains quarterly results which have not been au-
dited or reviewed by a certified public accountant.
Other
The use of automated calculation systems may give rise to rounding differences.
The reported results include depreciation and amortisation of fair value adjustments resulting from past
business combinations and therefore may deviate from the result of the single financial statements.
n.m. – not meaningful, used for percentage changes >300% and others which are not meaningful.
n.a. – not applicable, e.g. for divisions by zero.
Disclaimer
Disclaimer for forward-looking statements: This document contains forward-looking statements. These
forward-looking statements are usually accompanied by words such as ‘believe’, ‘intend’, ‘anticipate’,
‘plan’, ‘expect’ and similar expressions. Actual events may differ materially from those anticipated in these
forward-looking statements as a result of a number of factors. Forward-looking statements involve inher-
ent risks and uncertainties. A number of important factors could cause actual results or outcomes to differ
materially from those expressed in any forward-looking statement. Neither A1 Telekom Austria Group nor
any other person accepts any liability for any such forward-looking statements. A1 Telekom Austria Group
will not update these forward-looking statements, whether due to changed factual circumstances,
changes in assumptions or expectations. This report does not constitute a recommendation or invitation
to purchase or sell securities of A1 Telekom Austria Group.
Contacts
Investor Relations
Susanne Reindl
Head of Investor Relations
Tel.: +43 (0) 50 664 39420
Email: susanne.reindl@ a1.group
Corporate Communications
Barbara Grohs
Director Group Communications & Sustainability
Tel.: +43 (0) 50 664 39693
Email: [email protected]

A1 Telekom Austria Group 27
Condensed Consolidated Financial Statements A1 Telekom Austria Group Q1 2018 is based on IFRS 15, Q1 2017 without adoption of IFRS 15 (see “Changes in accounting policies”)
Condensed Consolidated Statements of Comprehensive Income
Q1 2018 Q1 2017 in EUR million, except per share information unaudited unaudited
Service Revenues (incl. other operating income) 919.4 956.1
Equipment revenues 153.7 102.8
Total revenues (incl. other operating income - OOI) 1,073.1 1,058.9
Cost of service – 340.9 – 341.1
Cost of equipment – 140.4 – 127.7
Selling, general & administrative expenses – 240.2 – 247.7
Other expenses – 2.6 – 2.8
Total cost and expenses – 724.2 – 719.4
Earnings before interest, tax, depreciation and amortisation - EBITDA 348.9 339.5
Depreciation and amortisation – 289.8 – 213.1
Operating income - EBIT 59.1 126.4
Interest income 1.2 3.5
Interest expense on financial liabilities – 21.9 – 24.7
Interest on employee benefits and restructuring and other financial items, net – 2.7 – 4.1
Foreign currency exchange differences, net 3.2 4.5
Equity interest in net income of associated companies 0.1 – 0.1
Financial result – 20.0 – 20.9
Earnings before income tax - EBT 39.0 105.5
Income tax – 10.7 – 9.1
Net result 28.4 96.4
Attributable to:
Equity holders of the parent 26.1 90.1
Non-controlling interests 0.1 0.0
Hybrid capital owners 2.2 6.2
Basic and diluted earnings per share attributable to equity holders of the parent 0.0 0.1
Weighted-average number of ordinary shares outstanding 664,084,841 664,084,841
Other comprehensive income items:
Items that may be reclassified to profit or loss:
Effect of translation of foreign entities – 4.3 6.9
Realised result on hedging activities, net of tax 1.1 1.1
Unrealised result on securities available-for-sale, net of tax 0.0 0.2
Items that will not be reclassified to profit or loss:
Remeasurements of defined benefit obligations, net of tax – 0.9 – 0.9
Total other comprehensive income (loss) – 4.1 7.2
Total comprehensive income (loss) 24.3 103.7
Attributable to:
Equity holders of the parent 22.0 97.4
Non-controlling interests 0.1 0.0
Hybrid capital owners 2.2 6.2

28 Results for the First Quarter 2018
Condensed Consolidated Statements of Financial Position
31 March 2018 1 January 2018 31 Dec. 2017 in EUR million unaudited unaudited audited
ASSETS
Current assets
Cash and cash equivalents 56.8 202.4 202.4
Accounts receivable: Subscribers, distributors and other, net 728.0 708.3 679.3
Receivables due from related parties 1.0 0.9 0.9
Inventories, net 116.8 102.4 87.4
Income tax receivable 3.0 2.8 2.8
Other current assets, net 122.5 98.3 253.4
Contract assets 147.3 145.6 0.0
Contract costs 41.9 42.3 0.0
Total current assets 1,217.4 1,303.1 1,226.3
Non-current assets
Property, plant and equipment, net 2,609.5 2,627.9 2,627.9
Intangibles, net 1,943.3 2,075.9 2,075.9
Goodwill 1,277.4 1,276.3 1,276.3
Investments in associated companies 33.1 34.0 34.0
Long-term investments 12.2 13.4 12.9
Deferred income tax assets 302.8 325.4 327.1
Other non-current assets, net 10.8 10.1 57.9
Total non-current assets 6,189.2 6,363.0 6,412.0
TOTAL ASSETS 7,406.6 7,666.1 7,638.3
LIABILITIES AND STOCKHOLDERS’ EQUITY
Short-term debt and current portion of long-term debt – 404.0 – 0.6 – 0.6
Accounts payable – 763.3 – 784.2 – 784.2
Accrued liabilities and current provisions – 243.3 – 246.2 – 265.9
Income tax payable – 41.4 – 35.9 – 35.9
Payables due to related parties – 0.5 – 0.6 – 0.6
Contract liability – 170.2 – 161.6 0.0
Deferred revenues 0.0 0.0 – 156.6
Total current liabilities – 1,622.6 – 1,229.1 – 1,243.7
Non-current liabilities
Long-term debt – 2,534.4 – 2,533.6 – 2,533.6
Deferred income tax liabilities – 28.9 – 51.0 – 41.6
Deferred revenues and other non-current liabilities – 28.1 – 28.5 – 38.3
Asset retirement obligation and restructuring – 622.3 – 646.9 – 646.9
Employee benefits – 199.5 – 196.8 – 196.8
Total non-current liabilities – 3,413.2 – 3,456.8 – 3,457.2
Stockholders’ equity
Capital stock – 1,449.3 – 1,449.3 – 1,449.3
Treasury shares 7.8 7.8 7.8
Additional paid-in capital – 1,100.1 – 1,100.1 – 1,100.1
Hybrid capital 0.0 – 591.2 – 591.2
Retained earnings – 521.3 – 534.8 – 491.9
Other comprehensive income (loss) items 694.3 690.2 690.1
Equity attributable to equity holders of the parent – 2,368.7 – 2,977.5 – 2,934.6
Non-controlling interest – 2.2 – 2.7 – 2.7
Total stockholders’ equity – 2,370.8 – 2,980.2 – 2,937.4
TOTAL LIABILITIES AND STOCKHOLDERS' EQUITY – 7,406.6 – 7,666.1 – 7,638.3 1 January 2018 includes quantitative effects of the initial application of IFRS 15 and IFRS 9 (see “Changes in accounting policies”) 31 December 2017 without adoption of IFRS 15 and IFRS 9 (see “Changes in accounting policies”)

A1 Telekom Austria Group 29
Condensed Consolidated Statements of Cash Flows
Q1 2018 Q1 2017 in EUR million unaudited unaudited
Earnings before income tax - EBT 39.0 105.5
ltems not requiring the use of cash and other reconciliation:
Depreciation 126.2 130.9
Amortisation of intangible assets 163.6 82.2
Fair value measuremet investments 0.1 0.0
Equity interest in net income of associated companies – 0.1 0.1
Result on sale of investments 0.0 – 0.1
Result on sale of property, plant and equipment 1.4 2.3
Net period cost of labor obligations and restructuring 3.3 3.6
Foreign currency exchange differences, net – 3.2 – 4.5
Interest income – 1.2 – 3.5
Interest expense 22.5 26.8
Other adjustments – 0.5 – 5.1
Changes in working capital and other financial positions:
Accounts receivable from subscribers, distributors and other – 13.9 – 8.0
Prepaid expenses – 19.9 – 16.7
Due from related parties – 0.1 – 0.1
Inventories – 14.6 – 10.6
Other assets – 6.5 11.0
Contract assets – 1.5 0.0
Contract costs 0.5 0.0
Employee benefits and restructuring – 24.8 – 26.8
Accounts payable and accrued liabilities – 6.8 – 15.3
Due to related parties – 0.1 – 3.0
Contract liability 8.6 0.0
Deferred revenues 0.0 – 5.1
Interest received 1.2 3.5
Income taxes paid – 4.1 – 5.4
Net cash flow from operating activities 269.3 261.9
Capital expenditures paid – 187.7 – 208.9
Dividends received from associates 0.7 0.0
Proceeds from sale of plant, property and equipment 2.5 8.5
Proceeds from sale of investment 1.1 0.3
Acquisition of businesses, net of cash acquired 0.0 – 73.0
Sale of shares of associated companies 0.1 0.0
Net cash flow from investing activities – 183.4 – 273.1
Repayments of long-term debt 0.0 – 500.0
Interest paid – 1.4 – 23.9
Change in short-term debt 164.1 165.4
Dividends paid – 34.4 – 33.9
Issuance of short-term debt 240.0 0.0
Redemption of hybrid bond – 600.0 0.0
Net cash flow from financing activities – 231.6 – 392.4
Adjustment to cash flows due to exchange rate fluctuations, net 0.2 0.0
Net change in cash and cash equivalents – 145.5 – 403.7
Cash and cash equivalents beginning of period 202.4 457.5
Cash and cash equivalents end of period 56.8 53.8

30 Results for the First Quarter 2018
Capital expenditures
Q1 2018 Q1 2017 in EUR million unaudited unaudited % change
Capital expenditures paid 187.7 208.9 – 10.1%
Reconciliation of additions in accounts payable – 37.8 – 28.9 30.8%
Reconciliation of government grants – 4.6 0.0 n.a.
Total capital expenditures 145.3 180.0 – 19.3%
Thereof tangible 117.9 138.4 – 14.8%
Thereof intangible 27.4 41.6 – 34.2% Total capital expenditures are defined as additions to intangibles and to property, plant and equipment (“tangibles”), excluding additions related to asset retirement obligation and including interest capitalised. Reconciliation of additions in accounts payable include the adjustment of capital expenditures of current period not yet paid as well as capital expenditures of prior periods paid in the current period in accordance with IAS 7.43. The reconciliation of government grants contains grants not yet paid, which have already been deducted from capital expenditures.
Condensed Consolidated Statements of Changes in Stockholders’ Equity
in EUR million (unaudited) Capital
stock Treasury
shares
Additional paid-in capital
Hybrid capital
Retained earnings
Other compre-hensive
items Total
Non-controlling
interest
Total stockholders'
equity
Balance at 31 December 2017 1,449.3 – 7.8 1,100.1 591.2 491.9 – 690.1 2,934.6 2.7 2,937.4
Impact of change in accounting policy 0.0 0.0 0.0 0.0 42.9 0.0 42.8 0.0 42.8
Balance at 1 January 2018 1,449.3 – 7.8 1,100.1 591.2 534.8 – 690.2 2,977.5 2.7 2,980.2
Net Result 0.0 0.0 0.0 0.0 28.3 0.0 28.3 0.1 28.4
Other comprehensive income (loss) 0.0 0.0 0.0 0.0 0.0 – 4.1 – 4.1 0.0 – 4.1
Total comprehensive income (loss) 0.0 0.0 0.0 0.0 28.3 – 4.1 24.2 0.1 24.3
Distribution of dividends 0.0 0.0 0.0 0.0 – 33.0 0.0 – 33.0 – 0.6 – 33.6
Redemption of hybrid capital 0.0 0.0 0.0 – 591.2 – 8.8 0.0 – 600.0 0.0 – 600.0
Balance at 31 March 2018 1,449.3 – 7.8 1,100.1 0.0 521.3 – 694.3 2,368.7 2.2 2,370.8
in EUR million (unaudited) Capital
stock Treasury
shares
Additional paid-in capital
Hybrid capital
Retained earnings
Other compre-hensive
items Total
Non-controlling
interest
Total stockholders'
equity
Balance at 1 January 2017 1,449.3 – 7.8 1,100.1 591.2 306.3 – 670.4 2,768.7 2.0 2,770.7
Net Result 0.0 0.0 0.0 0.0 96.4 0.0 96.4 0.0 96.4
Other comprehensive income (loss) 0.0 0.0 0.0 0.0 0.0 7.2 7.2 0.0 7.2
Total comprehensive income (loss) 0.0 0.0 0.0 0.0 96.4 7.2 103.6 0.0 103.7
Distribution of dividends 0.0 0.0 0.0 0.0 – 31.7 0.0 – 31.7 – 0.2 – 31.9
Acquisition of non-controlling interests 0.0 0.0 0.0 0.0 0.0 0.0 0.0 0.5 0.5
Balance at 31 March 2017 1,449.3 – 7.8 1,100.1 591.2 371.0 – 663.2 2,840.7 2.3 2,843.0 For further details on the hybrid bond redemption and coupon payment and the tax benefit relating to the amount of interest attributable to hybrid bond owners, which is recognised as distribution of dividends, see “Stockholders’ Equity”. For details on the implementation of IFRS 15 and IFRS 9 see “Changes in accounting policies”
Net Debt
31 March 2018 31 Dec. 2017 in EUR million unaudited audited
Long-term debt 2,534.4 2,533.6
Short-term debt and current portion of long-term debt 404.0 0.6
Cash and cash equivalents and short-term investments – 56.8 – 202.4
Net debt 2,881.5 2,331.8
Net debt/EBITDA (last 12 months) 2.0x 1.7x

A1 Telekom Austria Group 31
Condensed Operating Segments
Q1 2018
in EUR million (unaudited) Austria Bulgaria Croatia Belarus Slovenia Serbia Macedonia
Corporate, Other &
Eliminations Consolidated
External revenues 646.2 104.8 98.3 88.1 47.7 59.1 27.5 1.3 1,073.1
Intersegmental revenues 6.2 2.2 1.2 0.3 1.1 1.4 0.5 – 12.8 0.0
Total revenues (incl. OOI) 652.4 107.0 99.5 88.4 48.8 60.4 28.0 – 11.5 1,073.1
Segment expenses – 415.2 – 76.6 – 73.5 – 49.4 – 39.7 – 47.1 – 20.9 – 1.8 – 724.2
EBITDA 237.3 30.4 26.0 39.0 9.1 13.3 7.2 – 13.3 348.9
Depreciation and amortisation – 107.4 – 109.5 – 28.9 – 17.7 – 7.2 – 11.2 – 7.5 – 0.3 – 289.8
Operating income - EBIT 129.8 – 79.2 – 2.9 21.3 1.9 2.1 – 0.4 – 13.6 59.1
Interest income 0.4 0.0 0.5 0.1 0.1 0.0 0.1 0.0 1.2
Interest expense – 6.0 – 0.1 – 2.1 – 0.7 – 0.2 – 0.4 – 0.4 – 12.0 – 21.9
Other financial result – 2.1 0.0 3.7 – 0.7 0.0 0.1 0.0 – 0.4 0.5
Equity interest in net income of
associated companies 0.1 0.0 0.0 0.0 0.0 0.0 0.0 0.0 0.1
Earnings before income tax - EBT 122.2 – 79.3 – 0.9 19.9 1.9 1.9 – 0.7 – 26.0 39.0
Income taxes – 10.7
Net result 28.4
EBITDA margin 36.4% 28.4% 26.1% 44.1% 18.6% 22.0% 25.6% n.a. 32.5%
Capital expenditures - intangible 19.4 3.4 0.6 1.9 0.4 1.5 0.1 0.1 27.4
Capital expenditures - tangible 82.8 7.7 13.2 5.4 2.7 4.1 2.3 – 0.3 117.9
Total capital expenditures 102.2 11.1 13.8 7.3 3.1 5.6 2.4 – 0.2 145.3
Q1 2017
in EUR million (unaudited) without adoption of IFRS 15 Austria Bulgaria Croatia Belarus Slovenia Serbia Macedonia
Corporate, Other &
Eliminations Consolidated
External revenues 638.4 102.2 97.0 91.7 52.1 49.5 27.0 1.2 1,058.9
Intersegmental revenues 5.0 1.3 1.4 1.2 0.8 1.5 0.3 – 11.5 0.0
Total revenues (incl. OOI) 643.3 103.5 98.4 92.9 52.9 51.0 27.3 – 10.3 1,058.9
Segment expenses – 415.0 – 75.3 – 77.2 – 47.0 – 40.8 – 43.3 – 21.4 0.5 – 719.4
EBITDA 228.3 28.2 21.2 45.9 12.1 7.7 5.9 – 9.8 339.5
Depreciation and amortisation – 119.3 – 28.9 – 20.7 – 12.3 – 8.4 – 11.1 – 11.7 – 0.8 – 213.1
Operating income - EBIT 109.0 – 0.7 0.5 33.6 3.7 – 3.3 – 5.8 – 10.6 126.4
Interest income 0.5 0.8 1.2 0.1 0.6 0.2 0.1 0.0 3.5
Interest expense – 5.4 – 0.1 – 2.4 – 0.8 – 0.3 – 0.4 – 0.2 – 15.2 – 24.7
Other financial result – 2.0 – 3.9 4.3 0.5 0.0 – 0.3 0.5 1.2 0.4
Equity interest in net income of
associated companies – 0.1 0.0 0.0 0.0 0.0 0.0 0.0 0.0 – 0.1
Earnings before income tax - EBT 102.0 – 3.9 3.7 33.5 4.1 – 3.8 – 5.5 – 24.5 105.5
Income taxes – 9.1
Net result 96.4
EBITDA margin 35.5% 27.3% 21.5% 49.4% 22.9% 15.1% 21.8% n.a. 32.1%
Capital expenditures - intangible 18.3 3.1 0.4 0.2 17.9 1.3 0.4 0.0 41.6
Capital expenditures - tangible 100.2 11.7 16.6 3.8 3.8 5.1 1.1 – 3.9 138.4
Total capital expenditures 118.5 14.7 17.0 4.1 21.7 6.5 1.5 – 3.9 180.0

32 Results for the First Quarter 2018
Selected Explanatory Notes to the Consolidated Interim Financial Statements
Basis of Presentation
The consolidated interim financial statements, in the opinion of Management, include all adjustments necessary for a fair presentation and
are not audited or reviewed and should be read in connection with the audited A1 Telekom Austria Group’s annual consolidated financial
statements according to IFRS for the year ended 31 December 2017. The consolidated results for the interim periods are not necessarily
indicative of results for the full year.
No major related party transactions, commitments and guarantees have occurred since 31 December 2017.
The preparation of the interim financial statements in close conformity with IAS 34 Interim Financial Reporting requires making estimates
and assumptions that affect the amounts reported in the financial statements and accompanying notes. Actual results could differ from
these estimates.
Compared to other economic sectors, the telecommunications industry is in general less cyclical. Within the telecommunication sector, the
seasonality of the Telekom Austria Group’s segments shows the same pattern as other European incumbents, having lower margins in the
year-end quarter due to Christmas promotions, equipment provided to customers and increases in sales commissions. However, customer
and visitor roaming revenues are above average in the third quarter due to the summer vacation season. In Austria, visitor roaming is also
above average in the first quarter due to winter sports tourism.
Changes in accounting policies
A1 Telekom Austria Group has applied the same accounting policies and methods of computation in the interim financial statements as in
the annual financial statements as of and for the year ended 31 December 2017, except the following standards which are effective from
1 January 2018 and have an impact on the condensed consolidated interim financial statements:
Impact of IFRS 15
In May 2014, the IASB issued the new standard IFRS 15 “Revenue from Contracts with Customers”. The new standard for revenue recogni-
tion aims at standardising the multitude of regulations previously included in various standards. The amount of revenue recognised and its
timing is determined based on a five-step model. The type of transaction or the sector of the entity is not relevant. IFRS 15 contains addi-
tional qualitative and quantitative disclosure obligations. These are aimed at enabling users of the financial statements to understand the
nature, amount, timing and the uncertainties of revenue and the resulting cash flows arising from contracts with customers. In April 2016,
the IASB issued clarifications to IFRS 15 relating to identifying performance obligations, principal versus agent considerations, as well as
licensing. As the standard itself, the European Union has endorsed these clarifications.
Impact as of 1 January 2018
As of 1 January 2018, A1 Telekom Austria Group initially applied IFRS 15, electing the modified retrospective approach for the initial applica-
tion in accordance with the transition guidance. Accordingly, the information presented for 2017 has not been restated – i.e. it is presented,
as previously reported, under IAS 18 and related interpretations.
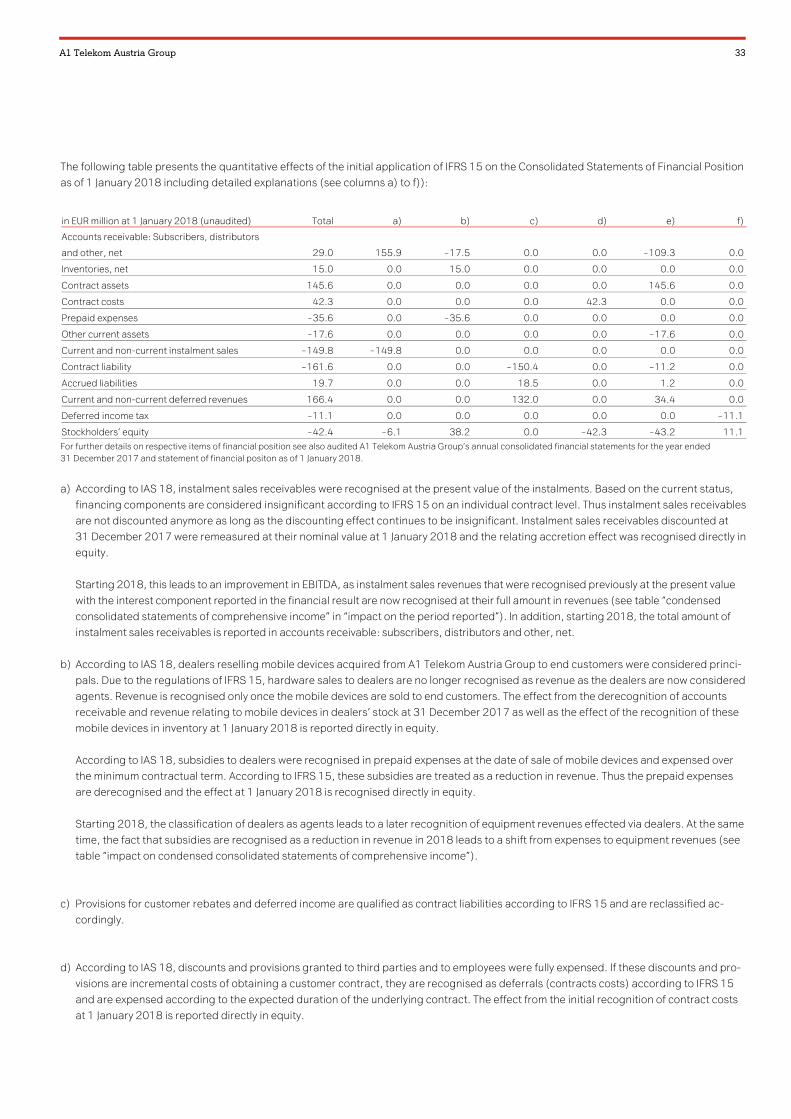
A1 Telekom Austria Group 33
The following table presents the quantitative effects of the initial application of IFRS 15 on the Consolidated Statements of Financial Position
as of 1 January 2018 including detailed explanations (see columns a) to f)):
in EUR million at 1 January 2018 (unaudited) Total a) b) c) d) e) f)
Accounts receivable: Subscribers, distributors
and other, net 29.0 155.9 – 17.5 0.0 0.0 – 109.3 0.0
Inventories, net 15.0 0.0 15.0 0.0 0.0 0.0 0.0
Contract assets 145.6 0.0 0.0 0.0 0.0 145.6 0.0
Contract costs 42.3 0.0 0.0 0.0 42.3 0.0 0.0
Prepaid expenses – 35.6 0.0 – 35.6 0.0 0.0 0.0 0.0
Other current assets – 17.6 0.0 0.0 0.0 0.0 – 17.6 0.0
Current and non-current instalment sales – 149.8 – 149.8 0.0 0.0 0.0 0.0 0.0
Contract liability – 161.6 0.0 0.0 – 150.4 0.0 – 11.2 0.0
Accrued liabilities 19.7 0.0 0.0 18.5 0.0 1.2 0.0
Current and non-current deferred revenues 166.4 0.0 0.0 132.0 0.0 34.4 0.0
Deferred income tax – 11.1 0.0 0.0 0.0 0.0 0.0 – 11.1
Stockholders’ equity – 42.4 – 6.1 38.2 0.0 – 42.3 – 43.2 11.1 For further details on respective items of financial position see also audited A1 Telekom Austria Group’s annual consolidated financial statements for the year ended 31 December 2017 and statement of financial positon as of 1 January 2018.
a) According to IAS 18, instalment sales receivables were recognised at the present value of the instalments. Based on the current status,
financing components are considered insignificant according to IFRS 15 on an individual contract level. Thus instalment sales receivables
are not discounted anymore as long as the discounting effect continues to be insignificant. Instalment sales receivables discounted at
31 December 2017 were remeasured at their nominal value at 1 January 2018 and the relating accretion effect was recognised directly in
equity.
Starting 2018, this leads to an improvement in EBITDA, as instalment sales revenues that were recognised previously at the present value
with the interest component reported in the financial result are now recognised at their full amount in revenues (see table “condensed
consolidated statements of comprehensive income” in “impact on the period reported”). In addition, starting 2018, the total amount of
instalment sales receivables is reported in accounts receivable: subscribers, distributors and other, net.
b) According to IAS 18, dealers reselling mobile devices acquired from A1 Telekom Austria Group to end customers were considered princi-
pals. Due to the regulations of IFRS 15, hardware sales to dealers are no longer recognised as revenue as the dealers are now considered
agents. Revenue is recognised only once the mobile devices are sold to end customers. The effect from the derecognition of accounts
receivable and revenue relating to mobile devices in dealers’ stock at 31 December 2017 as well as the effect of the recognition of these
mobile devices in inventory at 1 January 2018 is reported directly in equity.
According to IAS 18, subsidies to dealers were recognised in prepaid expenses at the date of sale of mobile devices and expensed over
the minimum contractual term. According to IFRS 15, these subsidies are treated as a reduction in revenue. Thus the prepaid expenses
are derecognised and the effect at 1 January 2018 is recognised directly in equity.
Starting 2018, the classification of dealers as agents leads to a later recognition of equipment revenues effected via dealers. At the same
time, the fact that subsidies are recognised as a reduction in revenue in 2018 leads to a shift from expenses to equipment revenues (see
table “impact on condensed consolidated statements of comprehensive income”).
c) Provisions for customer rebates and deferred income are qualified as contract liabilities according to IFRS 15 and are reclassified ac-
cordingly.
d) According to IAS 18, discounts and provisions granted to third parties and to employees were fully expensed. If these discounts and pro-
visions are incremental costs of obtaining a customer contract, they are recognised as deferrals (contracts costs) according to IFRS 15
and are expensed according to the expected duration of the underlying contract. The effect from the initial recognition of contract costs
at 1 January 2018 is reported directly in equity.

34 Results for the First Quarter 2018
Starting 2018, this results in a later recognition of expense, yet it has no further significant impact on EBITDA (see table “impact on con-
densed consolidated statements of comprehensive income”).
e) A1 Telekom Austria Group previously allocated the majority of transaction prices of multiple-element arrangements to goods and services
based on a determination of a separable value to the customer for each deliverable on a standalone basis. IFRS 15 requires the identifi-
cation of separate performance obligations in multiple-elements arrangements based on certain criteria as well as the allocation of
transaction prices to the performance obligations in proportion to the stand-alone selling prices of the underlying goods and services.
The application of the criteria for identifying performance obligations according to IFRS 15 resulted in a re-evaluation of performance
obligations for fixed-line services. For mobile communication services, the allocation according to IFRS 15 results in a higher transaction
price for mobile equipment and a lower transaction price for mobile services. The adjusted allocation of the transaction price has also
insignificant effects on the amount of deferrals for customer loyalty programmes. The effect of the re-evaluation of performance obliga-
tions for fixed-line services as well as, in accordance with IFRS 15, the effect of the allocation of the transaction price for multiple-ele-
ments arrangements for mobile services and on deferrals for customer loyalty programmes are recognised directly in equity at 1 January
2018.
Certain major business customers are granted, in addition to standardised multiple-element subsidies, further volume discounts on
hardware and partly on services during the term of the service contract. According to IFRS 15, these are included in the multiple-element
calculation as well.
For the majority of the contracts, A1 Telekom Austria Group applies the practical expedient according to IFRS 15 to pool similar contracts
into portfolios, based on contract characteristics and duration. Only a small number of complex contracts with major clients is calculated
on individual contract basis.
Starting 2018, the change in the allocation of transaction prices leads to a shift from service revenues to equipment revenues; the relat-
ing effect on EBITDA is not significant. For fixed-line telephone services, the application of the criteria of IFRS 15 for identifying perfor-
mance obligations results in a later revenue recognition in 2018, which is not significant (see table “impact on condensed consolidated
statements of comprehensive income”).
f) The effects on equity of the changes described above are only temporary shifts of results. Thus deferred taxes were recognised for the
effects relating to the initial application of IFRS 15.
Impact on the period reported
The following tables summarise the impacts of adopting IFRS 15 on the Condensed Consolidated Financial Statements (items without any
adjustments are summarised in “other”):

A1 Telekom Austria Group 35
Impact on Condensed Consolidated Statements of Comprehensive Income
Q1 2018 Q1 2018
in EUR million, except per share information as reported
IFRS 15 Adjustments without adoption
of IFRS 15
Service Revenues (incl. other operating income) 919.4 32.8 952.2
Equipment revenues 153.7 – 30.0 123.7
Total revenues (incl. other operating income - OOI) 1,073.1 2.8 1,075.9
Cost of service – 340.9 0.0 – 340.9
Cost of equipment – 140.4 – 0.2 – 140.6
Selling, general & administrative expenses – 240.2 – 10.0 – 250.3
Other expenses – 2.6 0.0 – 2.6
Total cost and expenses – 724.2 – 10.2 – 734.4
Earnings before interest, tax, depreciation and amortisation - EBITDA 348.9 – 7.4 341.5
Interest income 1.2 2.0 3.2
Other – 311.0 0.0 – 311.0
Earnings before income tax - EBT 39.0 – 5.4 33.6
Income tax – 10.7 1.5 – 9.2
Net result 28.4 – 3.9 24.5
Impact on Condensed Consolidated Statements of Financial Position
31 March 2018 31 March 2018
in EUR million as reported
IFRS 15 Adjustments without adoption
of IFRS 15
Accounts receivable: Subscribers, distributors and other, net 728.0 – 37.9 690.1
Inventories, net 116.8 – 15.2 101.6
Other current assets, net 122.5 155.5 278.1
Contract assets 147.3 – 147.3 0.0
Contract costs 41.9 – 41.9 0.0
Other 57.9 0.0 57.9
Total current assets 1,217.4 – 86.7 1,130.7
Deferred income tax assets 302.8 8.7 311.5
Other non-current assets, net 10.8 50.5 61.3
Other 5,875.6 0.0 5,875.6
Total non-current assets 6,189.2 59.1 6,248.3
TOTAL ASSETS 7,406.6 – 27.6 7,379.0
Accrued liabilities and current provisions – 243.3 – 18.9 – 262.2
Contract liability – 170.2 170.2 0.0
Deferred revenues 0.0 – 165.0 – 165.0
Other – 1,209.1 0.0 – 1,209.1
Total current liabilities – 1,622.6 – 13.7 – 1,636.3
Deferred income tax liabilities – 28.9 4.0 – 24.9
Deferred revenues and other non-current liabilities – 28.1 – 9.1 – 37.2
Other – 3,356.2 0.0 – 3,356.2
Total non-current liabilities – 3,413.2 – 5.2 – 3,418.4
Retained earnings – 521.3 46.4 – 474.9
Other – 2,541.6 0.0 – 2,541.6
Total stockholders’ equity – 2,370.8 46.4 – 2,324.4
TOTAL LIABILITIES AND STOCKHOLDERS' EQUITY – 7,406.6 27.6 – 7,379.0

36 Results for the First Quarter 2018
Impact on Condensed Consolidated Statements of Cash Flows
Q1 2018 Q1 2018
in EUR million as reported
IFRS 15 Adjustments without adoption
of IFRS 15
Earnings before income tax - EBT 39.0 – 5.4 33.6
ltems not requiring the use of cash and other reconciliation:
Interest income – 1.2 – 2.0 – 3.2
Other 313.4 0.0 313.4
Changes in working capital and other financial positions:
Accounts receivable from subscribers, distributors and other – 13.9 3.2 – 10.7
Prepaid expenses – 19.9 2.7 – 17.2
Inventories – 14.6 0.2 – 14.3
Other assets – 6.5 0.0 – 6.6
Contract assets – 1.5 1.5 0.0
Contract costs 0.5 – 0.5 0.0
Accounts payable and accrued liabilities – 6.8 – 0.8 – 7.6
Contract liability 8.6 – 8.6 0.0
Deferred revenues 0.0 7.7 7.7
Interest received 1.2 2.0 3.2
Other – 29.1 0.0 – 29.1
Net cash flow from operating activities 269.3 0.0 269.3 The adoption of IFRS 15 does not have an effect on cash flows from investing and financing activities.
Condensed Operating Segments without adoption of IFRS 15
Q1 2018
in EUR million (unaudited) without adoption of IFRS 15 Austria Bulgaria Croatia Belarus Slovenia Serbia Macedonia
Corporate, Other &
Eliminations Consoli-
dated
External revenues 648.4 104.8 101.9 88.0 48.2 55.6 27.6 1.3 1,075.9
Intersegmental revenues 6.2 2.2 1.2 0.3 1.1 1.4 0.5 – 12.8 0.0
Total revenues (incl. OOI) 654.6 107.0 103.1 88.3 49.3 57.0 28.1 – 11.5 1,075.9
Segment expenses – 419.8 – 75.7 – 77.4 – 49.4 – 41.9 – 47.2 – 21.1 – 1.8 – 734.4
EBITDA 234.8 31.2 25.7 38.9 7.4 9.8 7.0 – 13.3 341.5
Depreciation and amortisation – 107.4 – 109.5 – 28.9 – 17.7 – 7.2 – 11.2 – 7.5 – 0.3 – 289.8
Impairment 0.0 0.0 0.0 0.0 0.0 0.0 0.0 0.0 0.0
Reversal of impairment 0.0 0.0 0.0 0.0 0.0 0.0 0.0 0.0 0.0
Operating income - EBIT 127.3 – 78.3 – 3.2 21.2 0.2 – 1.4 – 0.5 – 13.6 51.6
Interest income 0.4 0.7 0.9 0.2 0.5 0.3 0.1 0.0 3.2
Interest expense – 6.0 – 0.1 – 2.1 – 0.7 – 0.2 – 0.4 – 0.4 – 12.0 – 21.9
Other financial result – 2.1 0.0 3.7 – 0.7 0.0 0.1 0.0 – 0.4 0.5
Equity interest in net income of
associated companies 0.1 0.0 0.0 0.0 0.0 0.0 0.0 0.0 0.1
Earnings before income tax - EBT 119.7 – 77.7 – 0.7 20.0 0.6 – 1.3 – 0.8 – 26.0 33.6
Impact of IFRS 9
In July 2014 the IASB issued IFRS 9 “Financial Instruments”, effective for periods beginning on or after 1 January 2018 and replacing IAS 39
“Financial Instruments”. IFRS 9 introduces changes regarding the classification and measurement of financial instruments, the impairment
of financial assets and hedge accounting.
A1 Telekom Austria Group initially applied IFRS 9 at 1 January 2018, electing the modified retrospective approach for initial application in accordance with the transition guidance. The initial application of IFRS 9 in A1 Telekom Austria Group has effects on the classification and measurement of financial assets which are not significant overall. The business model of A1 Telekom Austria Group is ‘hold to collect’ and

A1 Telekom Austria Group 37
‘hold to collect and sell’, respectively, and no derivative financial instruments are held. The contractual cash flows of non-derivative financial instruments mainly consist of principal and interest. A1 Telekom Austria Group elected to measure all equity instruments held as of 31 De-cember 2017 at fair value. Financial investments carried at cost are now recognised at their fair value, which lead to an increase in equity of EUR 0.5 million at 1 January 2018.
The loss allowance of accounts receivable trade is measured in accordance with the simplified approach of IFRS 9 at an amount equal to
lifetime expected losses. Due to the good credit quality of the customers, the current measurement of accounts receivable according to the
method of incurred loss only differs insignificantly from the required method of lifetime-expected credit losses, thus the adoption of IFRS 9
does not have a significant impact on the Consolidated Financial Statements. The application of lifetime-expected credit loss on contractual
assets according to IFRS 15 lead to a reduction in equity of EUR 2.3 million at 1 January 2018 (this effect is included in column (e) of the
table ”Impact as of 1 January 2018”).
A1 Telekom Austria Group only invests short-term with counterparties with investment grade rating, the requirement of IFRS 9 to recognise
expected credit losses has only an insignificant impact on the Consolidated Financial Statements for all other financial assets.
The new requirements of IFRS 9 regarding hedge accounting do not have an effect on the Consolidated Financial Statements of A1 Telekom
Austria Group, as no derivatives are held as hedging instrument.
Comprehensive Income
The following table shows disaggregated revenues from external customers for each product line by segment:
Austria Bulgaria Croatia Belarus Slovenia Serbia Macedonia
Corporate, Other &
Eliminations Consoli-
dated
in EUR million 1 Q 2018
Service revenues 231.2 59.6 52.8 59.0 28.8 42.5 17.0 – 3.3 487.7
Equipment revenues 61.7 20.7 14.2 17.5 10.0 15.7 4.6 – 0.1 144.1
Wireless revenues 292.8 80.2 67.0 76.5 38.8 58.2 21.6 – 3.4 631.8
Service revenues 338.4 24.4 30.5 8.5 8.8 1.2 6.1 – 7.1 410.9
Equipment revenues 8.1 0.8 0.6 0.0 0.1 0.0 0.1 0.0 9.6
Fixed-line and other revenues 346.4 25.2 31.1 8.5 8.8 1.2 6.3 – 7.1 420.4
Other operating income 13.1 1.6 1.4 3.4 1.1 1.1 0.2 – 1.0 20.9
Total revenues (incl. OOI) 652.4 107.0 99.5 88.4 48.8 60.4 28.0 – 11.5 1,073.1
in EUR million 1 Q 2017
Service revenues 252.7 64.8 57.9 67.6 33.1 31.0 19.2 – 2.3 524.0
Equipment revenues 27.6 15.2 11.2 14.1 10.1 17.4 1.5 – 0.4 96.6
Wireless revenues 280.3 80.0 69.1 81.8 43.2 48.4 20.6 – 2.7 620.7
Service revenues 342.2 21.9 27.8 7.1 8.6 1.3 6.4 – 6.6 408.7
Equipment revenues 5.3 0.5 0.2 0.0 0.1 0.0 0.1 0.0 6.2
Fixed-line and other revenues 347.5 22.4 28.0 7.1 8.7 1.3 6.5 – 6.6 414.9
Other operating income 15.5 1.1 1.3 4.0 1.0 1.3 0.1 – 0.9 23.4
Total revenues (incl. OOI) 643.3 103.5 98.4 92.9 52.9 51.0 27.3 – 10.3 1,058.9 Q1 2017 without adoption of IFRS 15 (see “Changes in accounting policies”)
The shift between service and equipment revenues within wireless revenues is mainly due to the implementation of IFRS 15.

38 Results for the First Quarter 2018
The following table shows the net amount of write-down (negative sign) of inventories and employee benefit expenses:
in EUR million Q1 2018 Q1 2017
Write-down/ reversals of write-down of inventories – 0.9 – 1.7
Employee benefit expenses – 212.5 – 210.1
Inventories are measured at the lower of cost or net realisable value. Net realisable value of merchandise is the estimated selling price in the
ordinary course of business less the estimated selling expense.
Non-Current and current assets
The decrease in intangibles is mainly a result of the amortisation of brand names as a result of the roll-out of the brand A1 on a group-wide
basis as well the amortisation of licences.
The increase in Other current assets, net since 1 January 2018 is mainly due to prepayments of rent, insurance and service fees.
Non-Current and Current Liabilities
In the first quarter of 2018 committed credit lines in the amount of EUR 403.6 million were drawn.
The decrease in accounts payable is mainly due to the reduction in accounts payable to suppliers due to less CAPEX in 2018 as well as the
payment of accounts payable of prior year.
Provisions and Accrued Liabilities
The provision for restructuring (employees who will no longer provide services) and social plans and for civil servants who voluntarily
changed to the Austrian government to take on administrative tasks is shown in the following table:
31 March 2018 31 Dec. 2017 in EUR million unaudited audited
Restructuring and social plans 461.6 482.9
Civil servants changed to the government 16.9 18.1
Total restructuring 478.4 501.0
The reduction of restructuring in the first quarter of 2018 is mainly due to the usage of the provision. The rates of compensation increase
applied to the calculation of the provision for restructuring and social plans as well as for employee benefit obligations are the same as those
applied as of 31 December 2017. The discount rate used for civil servants released from work and civil servants transferred to the govern-
ment was increased from 1.25% to 1.50%, leading to a reduction in the provision for restructuring in the amount of EUR 1.9 million.
Income Taxes
1-3 M 2018 1-3 M 2017
Effective tax rate 27.3% 8.6%
in EUR million 31 March 2018 31 Dec. 2017
Net deferred taxes 274.0 285.5
The increase in effective tax rate is due to the contribution of negative earnings before taxes of some segments with low statutory tax rates
as income tax expense decreases only to a smaller extent. Negative earnings before taxes are mainly a consequence of brand amortisation.

A1 Telekom Austria Group 39
Stockholders’ Equity
On 1 February 2018 the hybrid bond amounting to EUR 600.0 million was redeemed at its nominal value according to Section 5 (3) of the
terms and conditions of the bond resulting in a reduction of stockholders’ equity in the amount of EUR 600.0 million. The hybrid bond was
classified as stockholders’ equity according to IFRS. Accordingly, the related discount cost in the amount of EUR 11.8 million was recorded
net of tax benefit of EUR 2.9 million in stockholders’ equity, which lead to an increase in stockholders’ equity (“hybrid capital”) in the amount
of EUR 591.2 million at the time of issuance in 2013.
On 1 February 2018 and 2017 the annual coupon of 5.625% of the hybrid bond in the amount of EUR 33.8 million was paid. The coupon
payment, as well as the related tax benefit of the interest in the amount of EUR 0.7 million and EUR 2.1 million, which is recognised in profit
or loss under local GAAP, is recognised as distribution of dividend in equity. The net result attributable to hybrid capital holders is presented
in the allocation of the net result in the condensed consolidated statements of comprehensive income and equals the recognised interest for
the first quarter 2018 and 2017 according to local GAAP amounting to EUR 2.9 million and EUR 8.3 million, net of the related tax benefit of
EUR 0.7 million and EUR 2.1 million, which is recognised in stockholders’ equity according to IAS 12.
Other comprehensive income (loss) items in the Condensed Consolidated Statements of Changes in Stockholders’ Equity include the re-
measurement of defined benefit obligations, remeasurement of investments at fair value through other comprehensive income, the hedging
reserve and the translation reserve. The foreign currency translation adjustment in the first quarter 2018 and 2017 is mainly due to the de-
velopment of the Belarusian Rouble.
Financial Instruments
Fair values are based on a three-level fair value hierarchy. The levels of the fair value hierarchy are determined as follows:
∙ Level 1: Fair values measured using quoted prices (unadjusted) in active markets for identical instruments.
∙ Level 2: Fair values measured using inputs other than quoted prices included in Level 1 that are observable, either directly or indirectly.
∙ Level 3: Fair values measured using inputs that are not based on observable market data.
The following table shows the carrying amounts and the fair values of financial instruments per class of financial assets:
31 March 2018 31 Dec. 2017 Carrying amount Fair value Carrying amount Fair value in EUR million unaudited unaudited audited audited
Cash and cash equivalents 56.8 56.8 202.4 202.4
Accounts receivable: Subscribers, distributors and other, net 728.0 728.0 679.3 679.3
Receivables due from related parties 1.0 1.0 0.9 0.9
Other current financial assets 9.3 9.3 111.6 111.6
Other non-current financial assets 2.4 2.4 49.4 49.4
Investments at amortised cost 0.2 0.2 0.6 0.6
Financial assets at amortised cost 797.7 797.7 1,044.2 1,044.2
Equity instruments at fair value through profit and loss - designated 3.8 3.8 3.8 3.8
Debt instruments s at fair value through profit and loss - mandatorily 5.4 5.4 5.4 5.4
Debt instruments at fair value through other comprehensive income - mandatorily 2.8 2.8 3.6 3.6
Investments at fair value 12.0 12.0 12.8 12.8 At 31 December 2017 other current and non-current financial assets comprised instalment sales receivables which are included in accounts receivables starting 2018 (see changes in accounting policies - impact of IFRS 15).
The carrying amounts of cash and cash equivalents, accounts receivable, other financial assets and investments at amortised cost approxi-
mate their fair values, therefore no further information on the classification in the fair value hierarchy is provided.
Investments at fair value mainly include quoted bonds, quoted shares and investment funds and are thus classified as Level 1 of the fair
value hierarchy.
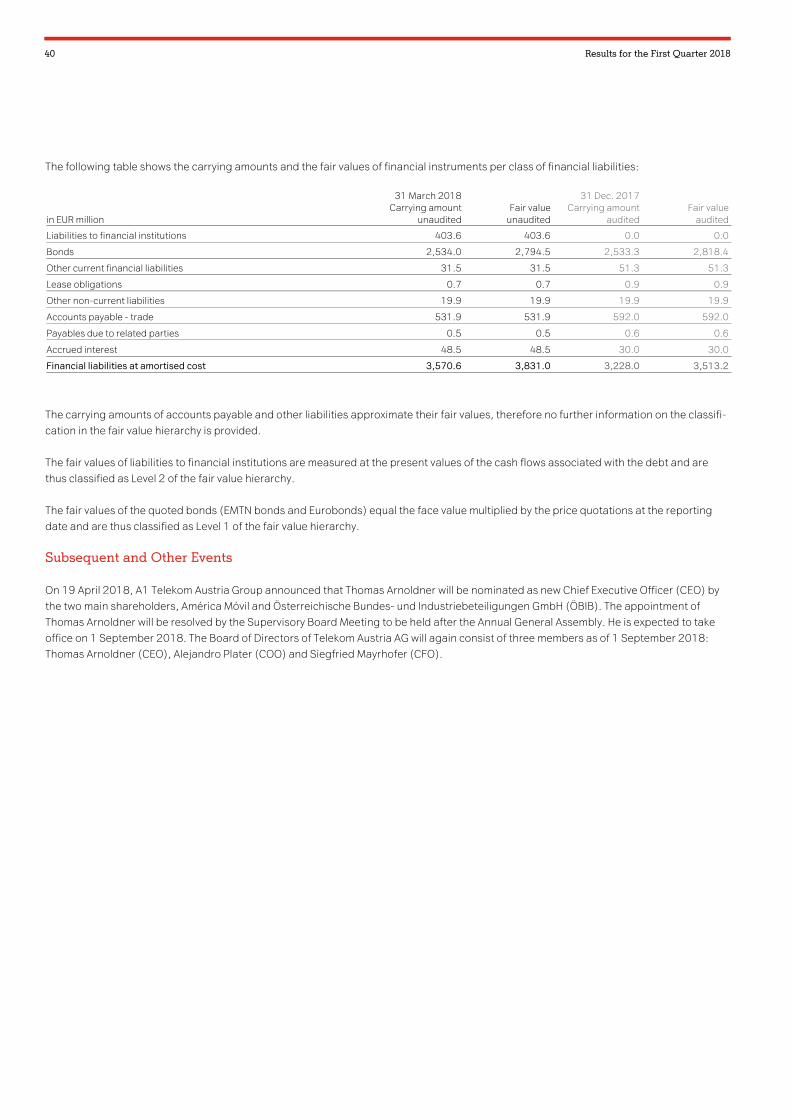
40 Results for the First Quarter 2018
The following table shows the carrying amounts and the fair values of financial instruments per class of financial liabilities:
31 March 2018 31 Dec. 2017 Carrying amount Fair value Carrying amount Fair value in EUR million unaudited unaudited audited audited
Liabilities to financial institutions 403.6 403.6 0.0 0.0
Bonds 2,534.0 2,794.5 2,533.3 2,818.4
Other current financial liabilities 31.5 31.5 51.3 51.3
Lease obligations 0.7 0.7 0.9 0.9
Other non-current liabilities 19.9 19.9 19.9 19.9
Accounts payable - trade 531.9 531.9 592.0 592.0
Payables due to related parties 0.5 0.5 0.6 0.6
Accrued interest 48.5 48.5 30.0 30.0
Financial liabilities at amortised cost 3,570.6 3,831.0 3,228.0 3,513.2
The carrying amounts of accounts payable and other liabilities approximate their fair values, therefore no further information on the classifi-
cation in the fair value hierarchy is provided.
The fair values of liabilities to financial institutions are measured at the present values of the cash flows associated with the debt and are
thus classified as Level 2 of the fair value hierarchy.
The fair values of the quoted bonds (EMTN bonds and Eurobonds) equal the face value multiplied by the price quotations at the reporting
date and are thus classified as Level 1 of the fair value hierarchy.
Subsequent and Other Events
On 19 April 2018, A1 Telekom Austria Group announced that Thomas Arnoldner will be nominated as new Chief Executive Officer (CEO) by
the two main shareholders, América Móvil and Österreichische Bundes- und Industriebeteiligungen GmbH (ÖBIB). The appointment of
Thomas Arnoldner will be resolved by the Supervisory Board Meeting to be held after the Annual General Assembly. He is expected to take
office on 1 September 2018. The Board of Directors of Telekom Austria AG will again consist of three members as of 1 September 2018:
Thomas Arnoldner (CEO), Alejandro Plater (COO) and Siegfried Mayrhofer (CFO).