riverina & murray regional organisation of councils 11 annual... · 4.3 council monitored...
TRANSCRIPT
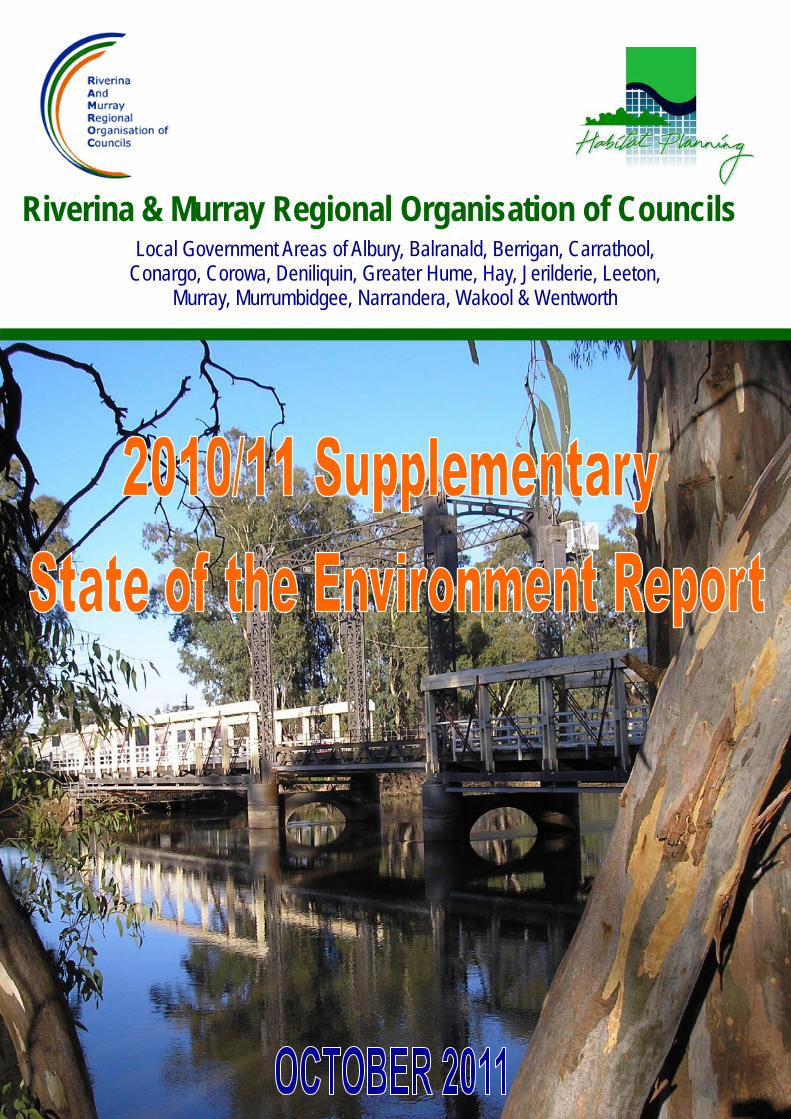
Riverina & Murray Regional Organisation of Councils Local Government Areas of Albury, Balranald, Berrigan, Carrathool,
Conargo, Corowa, Deniliquin, Greater Hume, Hay, Jerilderie, Leeton, Murray, Murrumbidgee, Narrandera, Wakool & Wentworth
Albury City
Balranald Shire
Berrigan Shire
Carrathool shire
Conargo Shire
Corowa Shire
Deniliquin
Greater Hume Shire
Hay Shire
Jerilderie Shire
Leeton Shire
Murray Shire
Murrumbidgee Shire
Narrandera Shire
Wakool Shire
Wentworth Shire
THIS REPORT HAS BEEN PREPARED BY:
Habitat Planning
Town Planning & Environmental Assessment
Suite 1 / 622 Macauley Street Albury NSW 2640
Phone: 02 6021 0662
Fax: 02 6021 0663
© 2011Habitat Planning The information contained in this document produced by Habitat Planning is solely for the use of the person or organisation for which it has been prepared and Habitat Planning undertakes no duty to or accepts any responsibility to any third party who may rely upon this document. All rights reserved. No section or element of this document may be removed from this document, reproduced, electronically stored or transmitted in any form without the written permission of Habitat Planning. Cover image; Barham-Koondrook Bridge taken by Warwick Horsfall
THIS REPORT HAS BEEN PREPARED FOR:
Riverina & Murray Regional Organisation of Councils
i
TERMS “the report” the RAMROC State of the Environment Supplementary Report 2010/11 “the area” or “region” the area addressed by the SoE Report ACRONYMS & ABBREVIATIONS ABS Australian Bureau of Statistics ANRA Australian Natural Resource Atlas BOM Australian Bureau of Meteorology CMA Catchment Management Authority DECC former Department of Environment & Climate Change (now DECCW) DECCW former Department of Environment, Climate Change & Water DLG NSW Department of Local Government DPI Department of Planning and Infrastructure DWE former Department of Water & Energy (now NSW State Water) EPA Environmental Protection Authority EPBC Act Commonwealth Environment Protection & Biodiversity Conservation Act 1999 ERP Estimated Resident Population LEP Local Environmental Plan LGA Local Government Area LHPA Livestock Health and Pest Authority (formerly RLBP) MIL Murray Irrigation Limited NOW NSW Office of Water, DECCW NSW New South Wales OEH NSW Office of Environment and Heritage RAMROC Riverina and Murray Regional Organisation of Councils RLPB former Rural Lands Protection Board (now LHPA) SLA Statistical Local Area SoE State of the Environment TSC Act NSW Threatened Species Conservation Act 1995
iii
1. Introduction 1.1 1.1 What is the purpose of an SoE Report? 1.1 1.2 Why undertake an SoE report 1.1 1.3 Why a Regional SoE report? 1.1 1.4 This SoE report 1.2 1.5 SoE Report Content 1.2 1.6 Limitations on reporting 1.2 2. The Region 2.1 2.1 RAMROC 2.1 2.2 Area in report 2.1 2.3 LGA Size 2.2 2.4 Population 2.2 2.5 Council’s Environmental Projects 2.3 2.6 Council’s Environmental Issues 2.4 3. Land 3.1 3.1 Salinity 3.1 3.2 Acid Sulphate Soils 3.1 3.3 Land Contamination 3.3 3.4 Drought 3.4 4. Atmosphere 4.1 4.1 Rainfall 4.1 4.2 Temperature 4.4 4.3 Council Monitored Emissions 4.5 5. Biodiversity 5.1 5.1 Threatened Species 5.1 5.2 Weeds 5.3 5.3 Environmental Reserves 5.4 5.4 Threatened Ecological Communities 5.5 5.5 New threatened Species 5.6 5.6 Pests & Feral Animals 5.7 5.8 Bushfires 5.8 5.8 Native Vegetation 5.9
iv
6. Water 6.1 6.1 Water Quality 6.1 6.2 Flooding 6.2 6.2 Water Consumption 6.3 6.3 Water Storages 6.4 7. Human Settlement 7.1 7.1 Human Settlement 7.1 7.2 Town Planning 7.2 7.3 Development 7.3 7.4 Waste 7.5 7.5 Energy Consumption 7.6 7.6 Effluent 7.7 7.7 Recycling 7.8 7.8 Registered vehicles & Licences 7.9 7.9 Crime 7.10 8. Cultural Heritage 8.1 8.1 Heritage Items 8.1 8.2 Aboriginal Items 8.3 8.3 Heritage Funding 8.4 9. References 9.1
v
1.1 What is the purpose of a State of Environment (SoE) report?1
The purpose of SoE reporting are to provide accurate, up-to-date and accessible information about environmental and heritage conditions, trends and pressures for the Australian continent, surrounding seas and Australia's external territories. SoE reporting is used to:
• report on major causal factors that are influencing Australia's environment and heritage;
• report on the effectiveness of responses designed to address change;
• identify the issues most relevant to the sustainability of Australia's environment and heritage;
• contribute to public understanding of the state of Australia's environment and heritage;
• identify relevant gaps in information;
• further develop and improve the SoE reporting process; and
• facilitate policy development at all levels of government.
1.2 Why undertake an SoE report? Councils must produce a principal and comprehensive SoE report every four years (follows local government elections), and at least a supplementary report every other year. There is also scope to use regional reporting to improve the quality of reporting and save on costs and resources for Councils.
1.3 Why a regional SoE report? Sixteen councils within the Riverina and Murray Regions of NSW have opted for a regional approach to SoE reporting under the umbrella of Riverina and Murray Regional Organisation of Councils (RAMROC). SoE reporting at the regional level is encouraged by the Depart-ment of Local Government and is supported by the Local Government and Shires Association and the Environmental Protection Authority because:
• many environmental issues are regional in nature (e.g. air and water pollution, wildlife corridors, threatened species recovery), requiring regional action;
• regional cooperation can reduce the time and resources involved in preparing an SoE report; and
• environmental information is often collected and held by government authorities and other bodies on a regional rather than on a local government basis.
Many councils already co-operate for SoE reporting under Regional Organisations of Councils (ROCs) or Total Catchment Management (TCM) programs. Councils increasingly have access to data on the basis of catchments, and in some cases, airsheds.
All of the councils participating with this year’s SoE report are a members of RAMROC. The council’s involved in the SoE report in the last reporting period were Albury, Balranald, Berrigan, Carrathool, Conargo, Corowa, Deniliquin, Greater Hume, Hay, Jerilderie, Leeton, Murray, Narrandera, Wakool and Wentworth. This reporting period includes these Councils as well as Murrumbidgee. The councils of Griffith and Urana are the only RAMROC member councils not participating in this SOE report. 1. Department of Local Government, 1999, Environmental Guidelines—State of the Environment Reporting by Local Government
1.1
1.4 This SOE report This is a supplementary SoE Report prepared for some member councils of the Riverina and Murray Regional Organisation of Councils (RAMROC). It is the second supplementary report to be prepared since the 2008/09 principal report.
1.5 SOE report content The content of this report has been grouped into six main categories, namely Land, Atmosphere, Biodiversity, Water, Human Settlement and Cultural Heritage. Data has been sourced from each local council, as well as publicly available data from government agencies such as the Department of Lands and the Australian Bureau of Statistics.
1.6 Limitations on reporting The following limitations to the data and information presented in the SoE report need to be acknowledged.
• Despite an exhaustive search of databases and information sources across government, non-government and community organisa-tions, there remains a lack of both qualitative and quantitative environmental data for inland areas of NSW. Data for the purposes of identifying trends (time series) is particularly difficult to source.
• A lot of data takes time to be made publicly available and as such even information released during 2010/11 can already be up to four years old. Consequently some of the data presented in the SoE may be ‘new’ but not necessarily for the 2010/11 reporting period.
• Although Council’s are provided with the same questionnaire for the purposes of collecting local data, there are gaps and inconsisten-cies in the way the data is presented in this report as Council’s unintentionally respond in different ways. Consequently caution should be exercised in making direct comparisons between Council for these data sets.
All other information contained in this section is sourced from the Department of Local Government
1.2
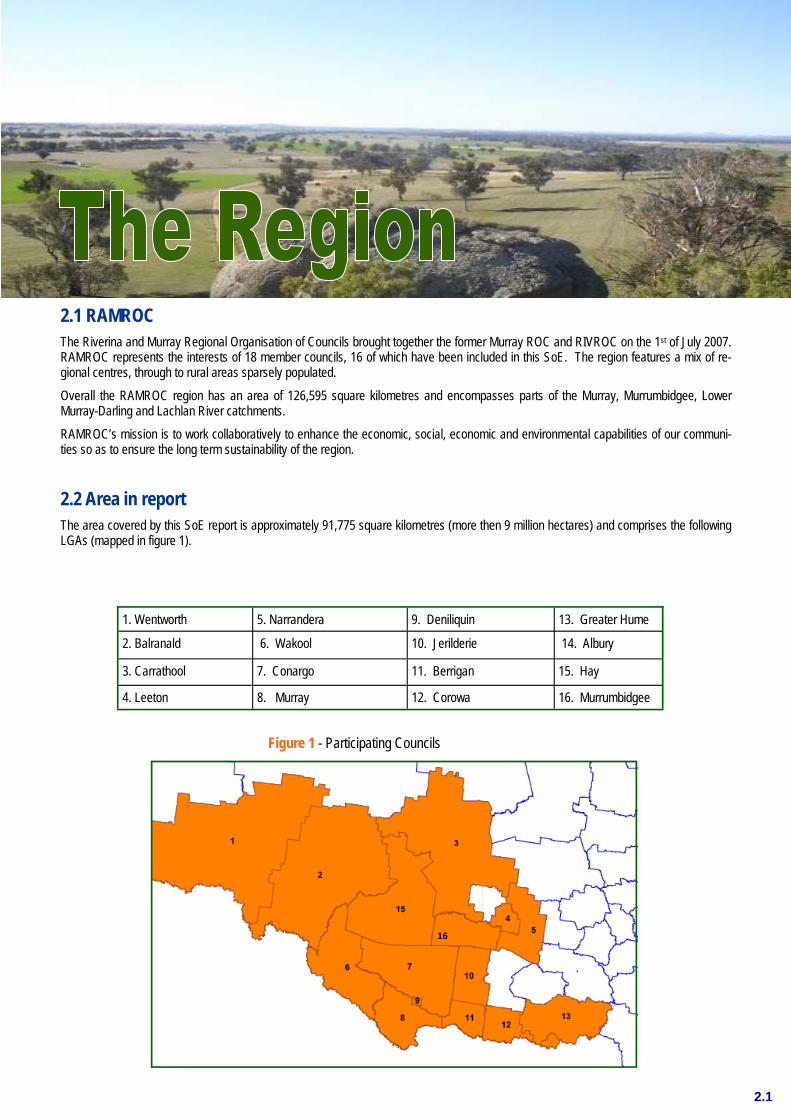
2.1 RAMROC The Riverina and Murray Regional Organisation of Councils brought together the former Murray ROC and RIVROC on the 1st of July 2007. RAMROC represents the interests of 18 member councils, 16 of which have been included in this SoE. The region features a mix of re-gional centres, through to rural areas sparsely populated.
Overall the RAMROC region has an area of 126,595 square kilometres and encompasses parts of the Murray, Murrumbidgee, Lower Murray-Darling and Lachlan River catchments. RAMROC’s mission is to work collaboratively to enhance the economic, social, economic and environmental capabilities of our communi-ties so as to ensure the long term sustainability of the region.
2.2 Area in report The area covered by this SoE report is approximately 91,775 square kilometres (more then 9 million hectares) and comprises the following LGAs (mapped in figure 1).
1. Wentworth 5. Narrandera 9. Deniliquin 13. Greater Hume
2. Balranald 6. Wakool 10. Jerilderie 14. Albury
3. Carrathool 7. Conargo 11. Berrigan 15. Hay
4. Leeton 8. Murray 12. Corowa 16. Murrumbidgee
Figure 1 - Participating Councils
2.1
16
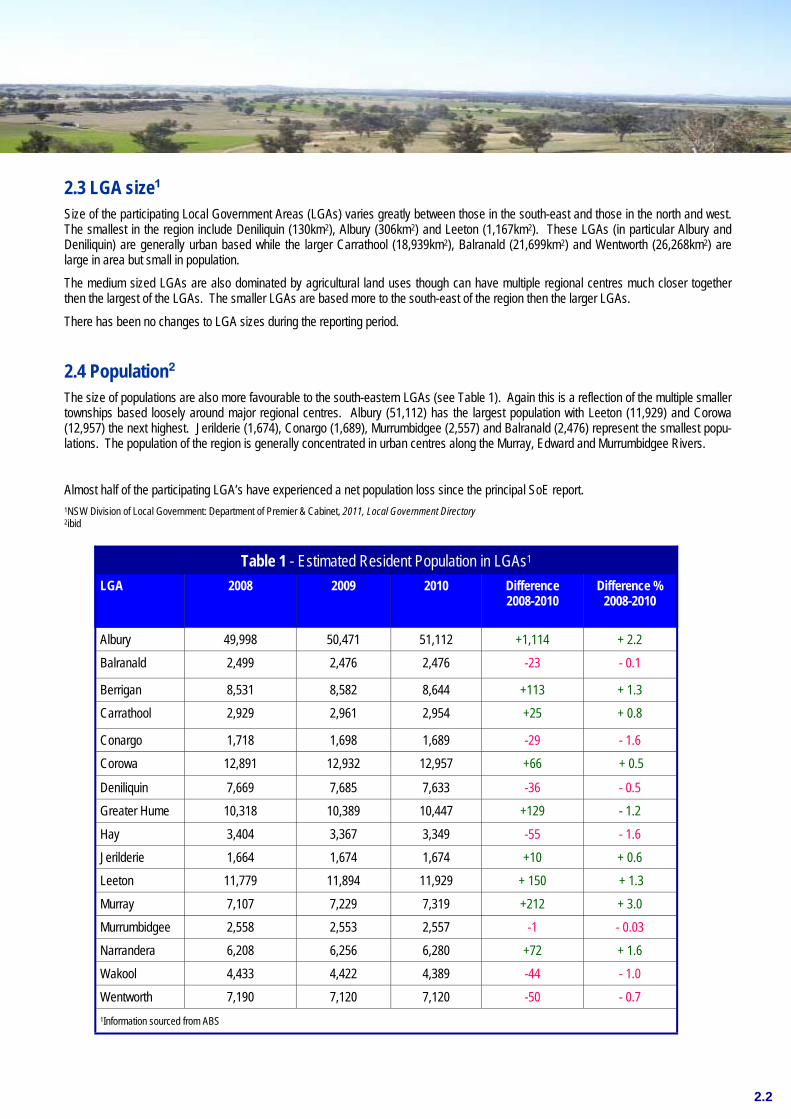
2.3 LGA size1
Size of the participating Local Government Areas (LGAs) varies greatly between those in the south-east and those in the north and west. The smallest in the region include Deniliquin (130km2), Albury (306km2) and Leeton (1,167km2). These LGAs (in particular Albury and Deniliquin) are generally urban based while the larger Carrathool (18,939km2), Balranald (21,699km2) and Wentworth (26,268km2) are large in area but small in population. The medium sized LGAs are also dominated by agricultural land uses though can have multiple regional centres much closer together then the largest of the LGAs. The smaller LGAs are based more to the south-east of the region then the larger LGAs.
There has been no changes to LGA sizes during the reporting period.
2.4 Population2
The size of populations are also more favourable to the south-eastern LGAs (see Table 1). Again this is a reflection of the multiple smaller townships based loosely around major regional centres. Albury (51,112) has the largest population with Leeton (11,929) and Corowa (12,957) the next highest. Jerilderie (1,674), Conargo (1,689), Murrumbidgee (2,557) and Balranald (2,476) represent the smallest popu-lations. The population of the region is generally concentrated in urban centres along the Murray, Edward and Murrumbidgee Rivers.
Almost half of the participating LGA’s have experienced a net population loss since the principal SoE report. 1NSW Division of Local Government: Department of Premier & Cabinet, 2011, Local Government Directory 2ibid
2.2
Table 1 - Estimated Resident Population in LGAs1 LGA 2008 2009 2010 Difference
2008-2010 Difference %
2008-2010
Albury 49,998 50,471 51,112 +1,114 + 2.2
Balranald 2,499 2,476 2,476 -23 - 0.1
Berrigan 8,531 8,582 8,644 +113 + 1.3
Carrathool 2,929 2,961 2,954 +25 + 0.8
Conargo 1,718 1,698 1,689 -29 - 1.6
Corowa 12,891 12,932 12,957 +66 + 0.5
Deniliquin 7,669 7,685 7,633 -36 - 0.5
Greater Hume 10,318 10,389 10,447 +129 - 1.2
Hay 3,404 3,367 3,349 -55 - 1.6
Jerilderie 1,664 1,674 1,674 +10 + 0.6
Leeton 11,779 11,894 11,929 + 150 + 1.3
Murray 7,107 7,229 7,319 +212 + 3.0
Murrumbidgee 2,558 2,553 2,557 -1 - 0.03
Narrandera 6,208 6,256 6,280 +72 + 1.6
Wakool 4,433 4,422 4,389 -44 - 1.0
Wentworth 7,190 7,120 7,120 -50 - 0.7 1Information sourced from ABS

2.5 Council environmental projects1
During the course of the year there have been many environmental projects undertaken by councils across the region. These are summa-rised in the following table. 1Sourced from relevant councils, 2010
New projects • Biodiversity certification was conferred on the Albury LEP 2010. The biodiversity certified LEP offers certainty for future genera-
tions through the preservation and enhancement of key environmental habitat (Albury). • Program encourage the onsite pre-treatment of liquid trade waste resulting in improved water quality of the outflows from coun-
cil’s waste water treatment works into the RAMSAR listed wetland at Fivebough Swap (Leeton). • Fully automated watering system for the Blighty Recreation Reserve to improve water efficiency and reduce water consumption
(Conargo). • Significant Environment Areas to complement the Native Vegetation Management Plan for Roadsides, Waterways and Council
Controlled Land, a Standard Operating Procedure has been developed for all Council works within a ‘Significant Environment Area’ (Albury).
• Detailed design work for water reuse project from the Sewer Treatment Plant (Deniliquin). • Established a Sustainably Advisory Committee to develop a Sustainability Strategy for Albury (Albury). • Comprehensive Strategy Documents for new LEP (Narrandera). • Greening/planting of Rail Trail wetlands (Corowa). • Wagirra Trail—construction of more than 70km of Murray River Trail linking Lake Hume with Wonga Wetlands (Albury). • Landscape Masterplan for Conargo Village (Conargo). Continuing projects • Completion of Ball Park Lagoon (Corowa). • Continued program for wastewater reuse at Wonga Wetlands, plantations and farmlands (Albury). • Koondrook Pericoota Flood Enhancement project with DECCW, Department of Commerce and Murray CMA & Central Murray
Regional Waste Management Group (Wakool). • Planet Ark; National Tree Day and School Tree Day (Albury). • Capturing of stormwater (Murray). • Ongoing program at Fivebough RAMSAR wetland (Leeton). • Subsidised tree planting—ongoing support to Landcare groups (Conargo). • AlburyCity and Parklands Albury Wodonga works on the Padman Park Management Plan to improve the vegetation in this area
and also carry out vegetation management tasks at various sites according to the service agreement (Albury). • Public Lands Biodiversity Grants from Murray CMA for the Kelly Street Reserve in Tocumwal and Ratcliffs Reserve in Berrigan
to enhance biodiversity values by undertaking pest and weed control, direct seeding and vehicular traffic restriction (Berrigan). • Albury airport upgrade: waste segregation, waterless urinals installed, and energy efficient lighting (Albury). • Continued planning for effluent reuse scheme (Deniliquin). 1Information sourced from relevant Councils
2.3

2.6 Council’s environmental issues1
In response to the question “what does council considers to be the most important environmental issue now and in the future?” the follow-ing results were revealed. A number (1) indicates the frequency at which a particular environmental issue was raised by a council.
Current issues • Water supply 5 1 • Waste management 4 4 • Murray Darling Basin Plan 4 4 • Flooding 4 4 • Climate change 2 • Sustainability 1 • Pest animals/Locusts 1 2 • Lack of irrigation allocations 1 2 • Government buyback of water for environmental flow 1 • Financial security of local business and family farms, and the
affect on land management 1 • Noxious weeds 1 • Closure of forest and red gum industry in LGA 1 1 • Summer storm events caused significant erosion 1 1 • Riparian zone management1 1 • Plaque 1 1 • Carbon Tax 1 • Illegal dumping/ fire wood collection 1 1 • Drought 0 9
1Sourced from relevant councils, 2011
Future issues • Water supply/allocations 6 2 • Murray Darling Basin Plan 3 3 • Severity of extraordinary and unseasonal weather events 2 2 • Flooding 2 2 • Weather patterns/rainfall 2 1 • Climate change 2 2 • Biodiversity/native vegetation management 1 1 • Pest animals/Locusts 1 1 • Long term sustainability of water supply 1 1 • Management of the Murray River and its environs 1 1 • Waste management 1 1 • Carbon pricing mechanism 1 1
2.4
WATER SUPPLY Is the top current and future issue concern
For councils
DROUGHT As expected, ceases to be a current issue
for councils
MURRAY DARLING BASIN PLAN This plan has become one of the most common issues for councils both now
and for the future
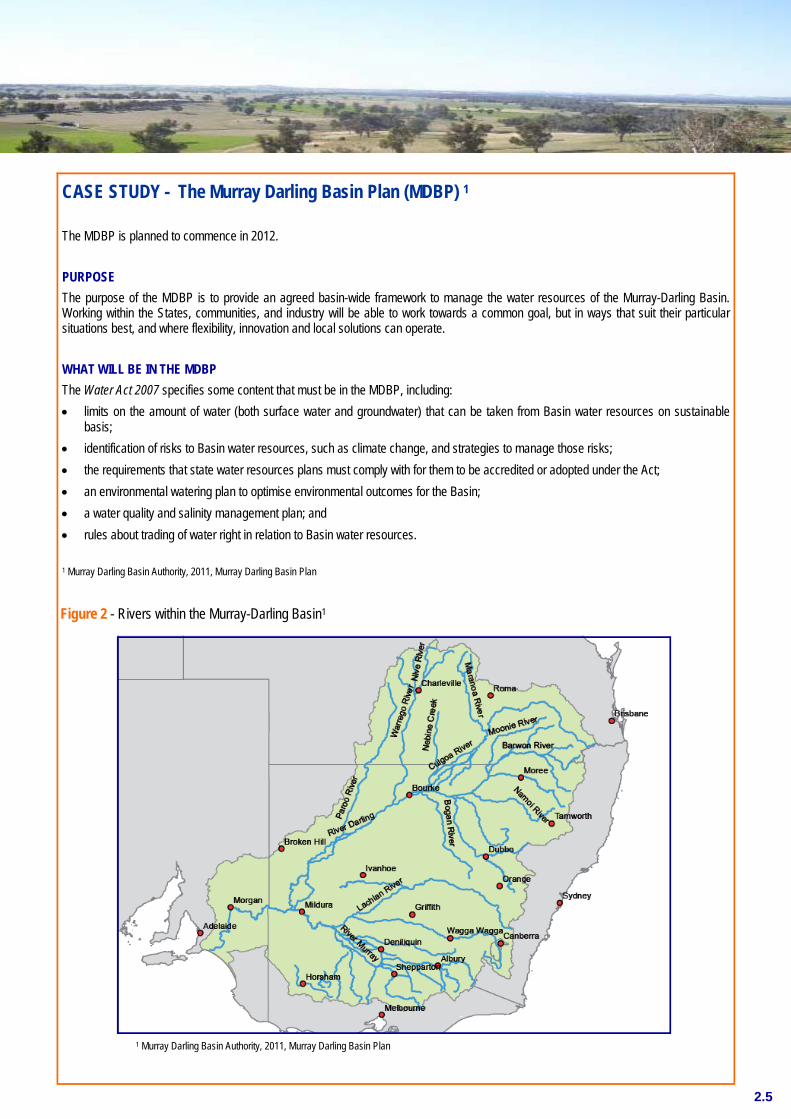
CASE STUDY - The Murray Darling Basin Plan (MDBP) 1
The MDBP is planned to commence in 2012. PURPOSE The purpose of the MDBP is to provide an agreed basin-wide framework to manage the water resources of the Murray-Darling Basin. Working within the States, communities, and industry will be able to work towards a common goal, but in ways that suit their particular situations best, and where flexibility, innovation and local solutions can operate. WHAT WILL BE IN THE MDBP The Water Act 2007 specifies some content that must be in the MDBP, including: • limits on the amount of water (both surface water and groundwater) that can be taken from Basin water resources on sustainable
basis; • identification of risks to Basin water resources, such as climate change, and strategies to manage those risks; • the requirements that state water resources plans must comply with for them to be accredited or adopted under the Act; • an environmental watering plan to optimise environmental outcomes for the Basin; • a water quality and salinity management plan; and • rules about trading of water right in relation to Basin water resources. 1 Murray Darling Basin Authority, 2011, Murray Darling Basin Plan
2.5
Figure 2 - Rivers within the Murray-Darling Basin1
1 Murray Darling Basin Authority, 2011, Murray Darling Basin Plan
3.1 Salinity1 Salinity is a dynamic process with the potential for movement and accumulation of salts over time and as a result of land use and manage-ment practices. Salt is a natural part of some landscapes, however human activities such a vegetation clearing and cropping can change the hydrology of the landscape and accelerate the process.
State The state of soil salinity in the region is summarised in Table 2.
Pressure Rising groundwater levels rise with them dissolved salts which are stored in the ground. Salinity can affect plant growth and impact on crop yields and cause serious impact on infrastructure, buildings and houses. Salinity also affects water quality which causes the health of rivers to decline.
Response The NSW government works with the Australian Government, local government and the community to manage salinity. There are several strategies in place including Catchment Action Plans, NSW Salinity Strategy, Basin Salinity Management Strategy and Caring for our Country.
3.2 Acid Sulfate Soils2 Potential acid sulfate soils occur naturally occur in soil but become actual acid sulfate soil when they are dried. They usually become dry from human activities.
State Land affected by acid sulfate soils in the region is summarised in Table 2.
Pressure Acid sulfate soils occur naturally in both coastal (tidal) and inland or upland (freshwater) settings. Left undisturbed, these soils are harm-less, but when excavated or drained, the sulfides within the soil react with the oxygen in the air, forming sulfuric acid. Impacts of acid sul-fate soil can be habitat degradation, fish kills and weed invasion. Other potential impacts include animal ill health by polluted water, de-creased productivity of agricultural land and infrastructure damage.
Response The Murray Darling Freshwater Research Centre in conjunction with the Department of Environment, Climate Change and Water and local Catchment Management Authorities are working to indentify affected or potential acid sulfate soils sites and to educate councils and resi-dents on effects, prevention and possible rehabilitation.
1 NSW Office of Environment and Heritage, 2011, Environmental Issues 2NSW Office of Environment and Heritage, 2011, Environmental Issues
3.1

Table 2 - Salinity, Acid Sulphate Soils and Land Management in LGAs1 LGA Land affected by
salinity1 Salinity
Management Plan1
Soil & Water Management
Plan1
Land affected by ASS*1
Acid Sulfate Soils Manage-
ment Plan1
Change from previous year?
Albury No No (monitors 23 sites)
Yes No No None
Balranald No No No Not known No None
Berrigan Yes, unknown ha No (MIL & CMA monitor)
No No No Yes
Carrathool No No No No No Yes
Conargo Yes, unknown ha No No None No None
Corowa Yes, unknown ha No No Yes, unknown ha No None
Deniliquin Yes .2km2 No No None No No
Greater Hume Yes, unknown ha No No Unknown No None
Hay None No No None No None
Jerilderie Yes, 5ha No No None No Yes
Leeton Yes, unknown ha Yes No None No None
Murray Yes, unknown ha No Yes No No Yes
Narrandera Yes, 10ha Yes Yes None No None
Wakool Yes, unknown ha No No None No None
Wentworth Yes, unknown ha No No Yes No Yes
1Information sourced from relevant Councils
Murrumbidgee Yes No No Unknown No N/A
3.2
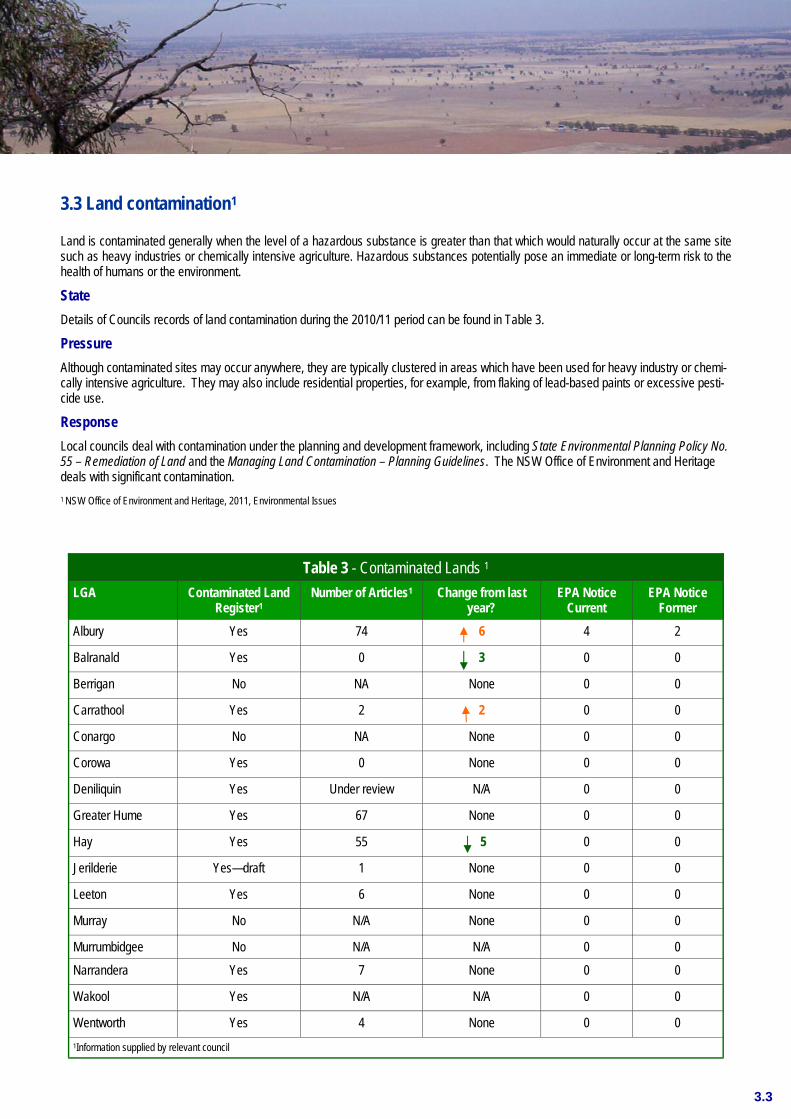
3.3 Land contamination1 Land is contaminated generally when the level of a hazardous substance is greater than that which would naturally occur at the same site such as heavy industries or chemically intensive agriculture. Hazardous substances potentially pose an immediate or long-term risk to the health of humans or the environment.
State Details of Councils records of land contamination during the 2010/11 period can be found in Table 3.
Pressure Although contaminated sites may occur anywhere, they are typically clustered in areas which have been used for heavy industry or chemi-cally intensive agriculture. They may also include residential properties, for example, from flaking of lead-based paints or excessive pesti-cide use.
Response Local councils deal with contamination under the planning and development framework, including State Environmental Planning Policy No. 55 – Remediation of Land and the Managing Land Contamination – Planning Guidelines. The NSW Office of Environment and Heritage deals with significant contamination. 1 NSW Office of Environment and Heritage, 2011, Environmental Issues
Table 3 - Contaminated Lands 1 LGA Contaminated Land
Register1 Number of Articles1 Change from last
year? EPA Notice
Current EPA Notice
Former Albury Yes 74 6 4 2
Balranald Yes 0 3 0 0
Berrigan No NA None 0 0
Carrathool Yes 2 2 0 0
Conargo No NA None 0 0
Corowa Yes 0 None 0 0
Deniliquin Yes Under review N/A 0 0
Greater Hume Yes 67 None 0 0
Hay Yes 55 5 0 0
Jerilderie Yes—draft 1 None 0 0
Leeton Yes 6 None 0 0
Murray No N/A None 0 0
Narrandera Yes 7 None 0 0
Wakool Yes N/A N/A 0 0
Wentworth Yes 4 None 0 0 1Information supplied by relevant council
Murrumbidgee No N/A N/A 0 0
3.3

3.4 Drought1
Drought classification of an area takes into account :
• a review of historic rainfall records for the area;
• pasture availability;
• climatic events such as frosts; and
• seasonal factors such as pasture growing seasons.
A updated drought map is released each month and the drought assistance eligibility status of the Livestock Health and Pest Authority districts in NSW is also updated monthly.
State Status of areas affected by drought during the reporting year can be seen in Table 4. This reporting year saw all the LGA’s move from either the drought or marginal category to satisfactory. This a significant improvement from the pervious year. Figure 3 shows the history of the drought overall of NSW since 2000. It shows the RAMROC area going into a drought in 2002 and out eight years later in 2010.
Pressure While droughts are considered part of the natural processes in Australia, it has been considered that greenhouse gases and global warm-ing have contributed to worsening drought conditions.
Response Local councils enforce water restrictions and provide information and support to those effected by drought. 1NSW Industry and Investment, 2011, Drought Maps
3.4
Table 4 - Areas in drought throughout 2010/111
Jul 10 Aug 10 Sep 10 Oct 10 Nov 10 Dec 10 Jan 11 Feb 11 Mar 11 Apr 11 May 11 Jun 11
Albury
Balranald
Berrigan
Carrathool
Conargo
Corowa
Deniliquin
Greater Hume
Hay
Jerilderie
Leeton
Murray
Murrumbidgee
Narrandera
Wakool
Wentworth
In drought Marginal Satisfactory 1NSW Industry and Investment, 2011, Drought Maps
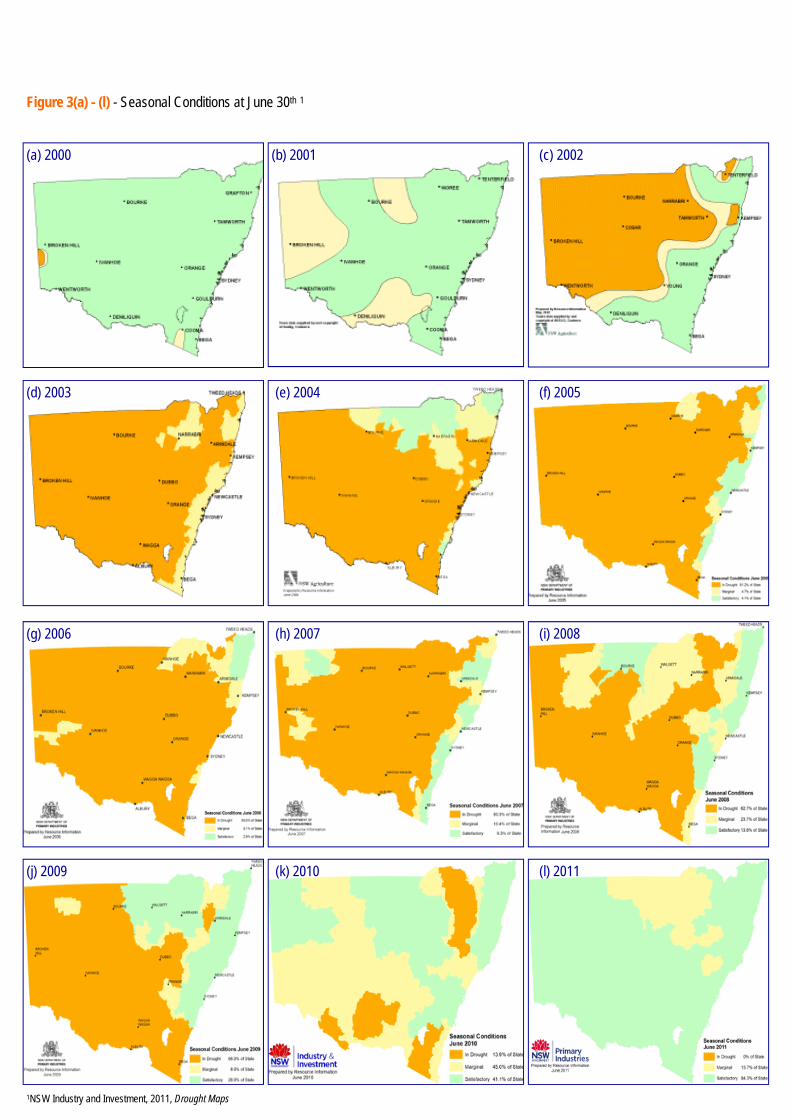
Figure 3(a) - (l) - Seasonal Conditions at June 30th 1
(a) 2000 (b) 2001 (c) 2002
(d) 2003 (e) 2004 (f) 2005
(g) 2006 (h) 2007 (i) 2008
(j) 2009 (k) 2010 (l) 2011
1NSW Industry and Investment, 2011, Drought Maps

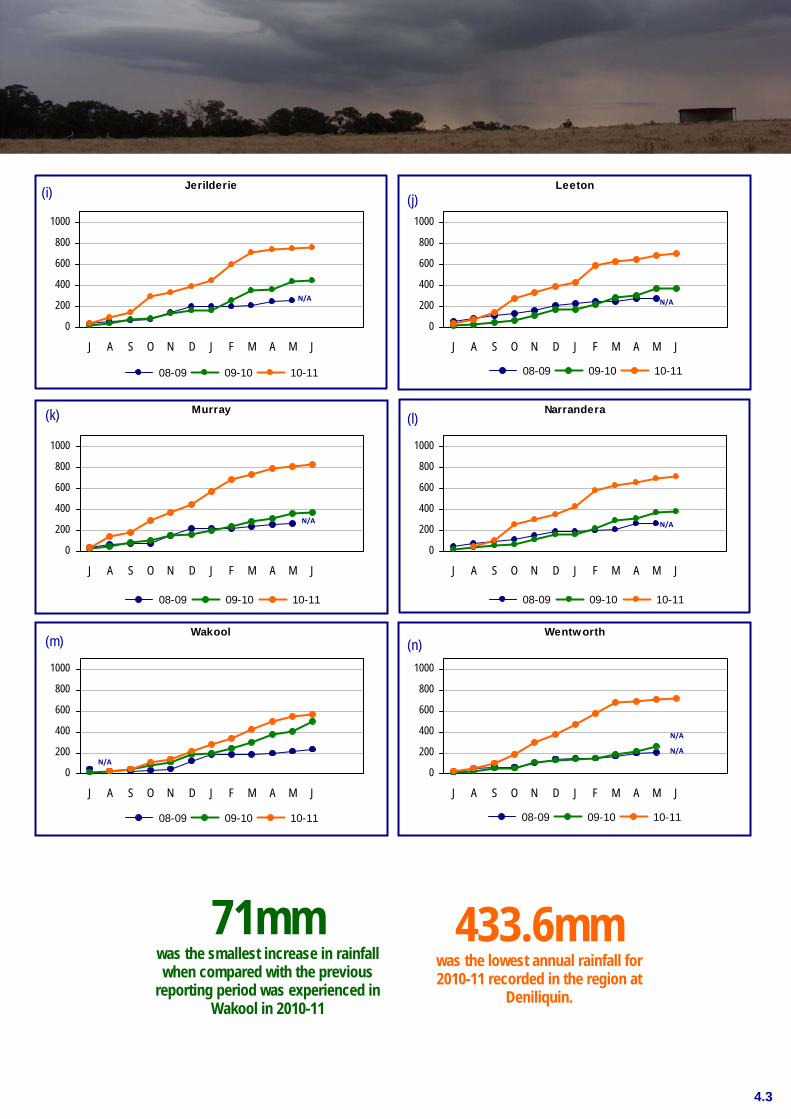
4.1 Rainfall1
The RAMROC region covers an extensive area (almost 700 kilome-tres east to west and almost 400 kilometres north to south). Climate varies across the region as can be seen by the climate graphs at Figures 4. The charts display information for the reporting year (June 2010—July 2011) and the previous reporting period (June 09—July 10). The data provides an overview of the weather in the region, only displaying the results for single stations across large LGAs of varying topography. Results may vary across LGAs and between stations, even those located in the same townships. All rainfall is measured in millimetres.
Rainfall The reporting period from June 2010 to July 2011 received high rainfall results reflecting the La Niña pattern. Areas such as Nar-randera experienced a three-fold increase in annual rainfall over the previous reporting period. November 2010 to March 2011 saw a dramatic increase in rainfall across the region, with Albury receiving 267mm in February and Corowa and Culcairn experiencing similar totals resulting in flooding in Greater Hume Shire. Wakool did not experience the same increase in rainfall as other areas in the region, receiving only 71mm more than the previous reporting period. This appears to be at odds with the other areas receiving an average of 337mm more rainfall than the pervious year.
There was no available rainfall data for the Carrathool area. April to June saw a drop in rainfall across the region compared to the large falls from November to March. Although November to March received extremely higher rainfalls than the previous years, in some parts of the region including, Berrigan and Conargo Septem-ber and October also experience higher rainfalls than the pervious years.
In Australian La Niña developed during the autumn of 2010. During an La Niña event sea surface temperatures in the western Pacific, north of Australian are often warmer than normal and sea surface temperatures across the central and eastern tropics Pacific ocean are cooler than normal. La Niña is associated with wetter than nor-mal conditions across Australia. By July typical La Niña conditions were established and most of Australia including the RAMROC region experienced significantly higher than average rainfall over the next eight months. The high rainfall peaked between late 2010 and early 2011, this included significant flooding throughout Australia. The La Niña event in 2010/2011 was one of the strongest recorded.
By mid 2011 the Bureau of Meteorology (BOM) announced that the La Niña event that dominated the Australian climate in late 2010 and early 2011 starting to slow down and show signs of weakening. Following the weakening of La Niña BOM predicated that the rainfall and temperature conditions are likely to return to the long-term aver-ages of the region. 1Australian Government: Bureau of Meteorology, 2011, Climate,
4.1
1065.2mm was the highest annual rainfall recorded in
the in region in 2010-11 (Culcairn) Compared to 607mm highest annual rainfall recorded in the region in 2009-10 (Albury)
538.8mm was the largest increase in rainfall when
compared with the previous reporting period was experienced in Narrandera
113mm was the amount of rainfall in Corowa
on the 5 February 2011
Balranald recorded the highest daily rainfall on record (132 years) for January (14th) and Feb-ruary (5th) in 2011 with 71.8 and 81.3mm re-
spectively.
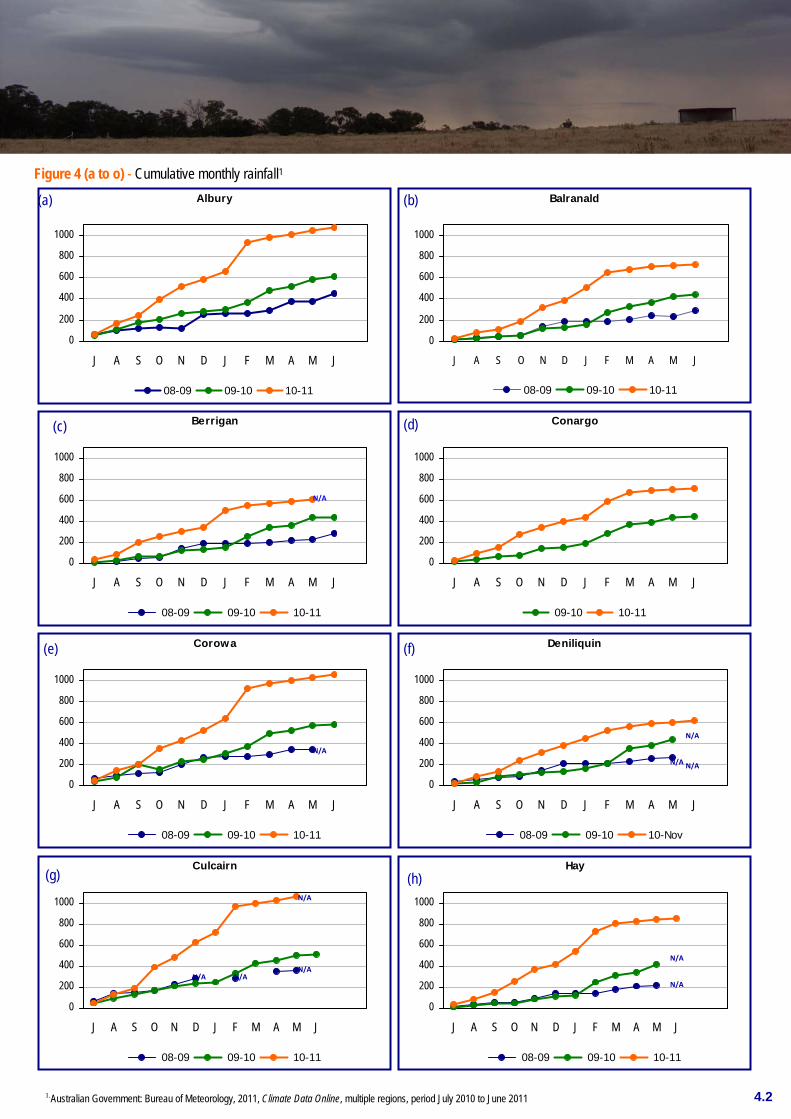
Balranald
0
200
400
600
800
1000
J A S O N D J F M A M J
08-09 09-10 10-11
Hay
0
200
400
600
800
1000
J A S O N D J F M A M J
08-09 09-10 10-11
Culcairn
0
200
400
600
800
1000
J A S O N D J F M A M J
08-09 09-10 10-11
Deniliquin
0
200
400
600
800
1000
J A S O N D J F M A M J
08-09 09-10 10-Nov
Corowa
0
200
400
600
800
1000
J A S O N D J F M A M J
08-09 09-10 10-11
Conargo
0
200
400
600
800
1000
J A S O N D J F M A M J
09-10 10-11
Berrigan
0
200
400
600
800
1000
J A S O N D J F M A M J
08-09 09-10 10-11
4.2
(a)
(c)
(b)
(d)
(e)
N/A
Figure 4 (a to o) - Cumulative monthly rainfall1 Albury
0
200
400
600
800
1000
J A S O N D J F M A M J
08-09 09-10 10-11
N/A
N/A
N/A
(f)
N/A
N/A N/A
N/A
N/A
(g) (h)
N/A N/A
1.Australian Government: Bureau of Meteorology, 2011, Climate Data Online, multiple regions, period July 2010 to June 2011
4.3
Jerilderie
0
200
400
600
800
1000
J A S O N D J F M A M J
08-09 09-10 10-11
Leeton
0
200
400
600
800
1000
J A S O N D J F M A M J
08-09 09-10 10-11
Murray
0
200
400
600
800
1000
J A S O N D J F M A M J
08-09 09-10 10-11
N/A
N/A N/A
(i) (j)
(k) Narrandera
0
200
400
600
800
1000
J A S O N D J F M A M J
08-09 09-10 10-11
Wakool
0
200
400
600
800
1000
J A S O N D J F M A M J
08-09 09-10 10-11
N/A
N/A
Wentworth
0
200
400
600
800
1000
J A S O N D J F M A M J
08-09 09-10 10-11
N/A
N/A
(l)
(m) (n)
71mm was the smallest increase in rainfall when compared with the previous
reporting period was experienced in Wakool in 2010-11
433.6mm was the lowest annual rainfall for 2010-11 recorded in the region at
Deniliquin.

Albury
05
101520253035
J A S O N D J F M A M J
Max 08-09
Min 08-09
Max 09-10
Min 09-10
Max 10-11
Min 10-11
4.4
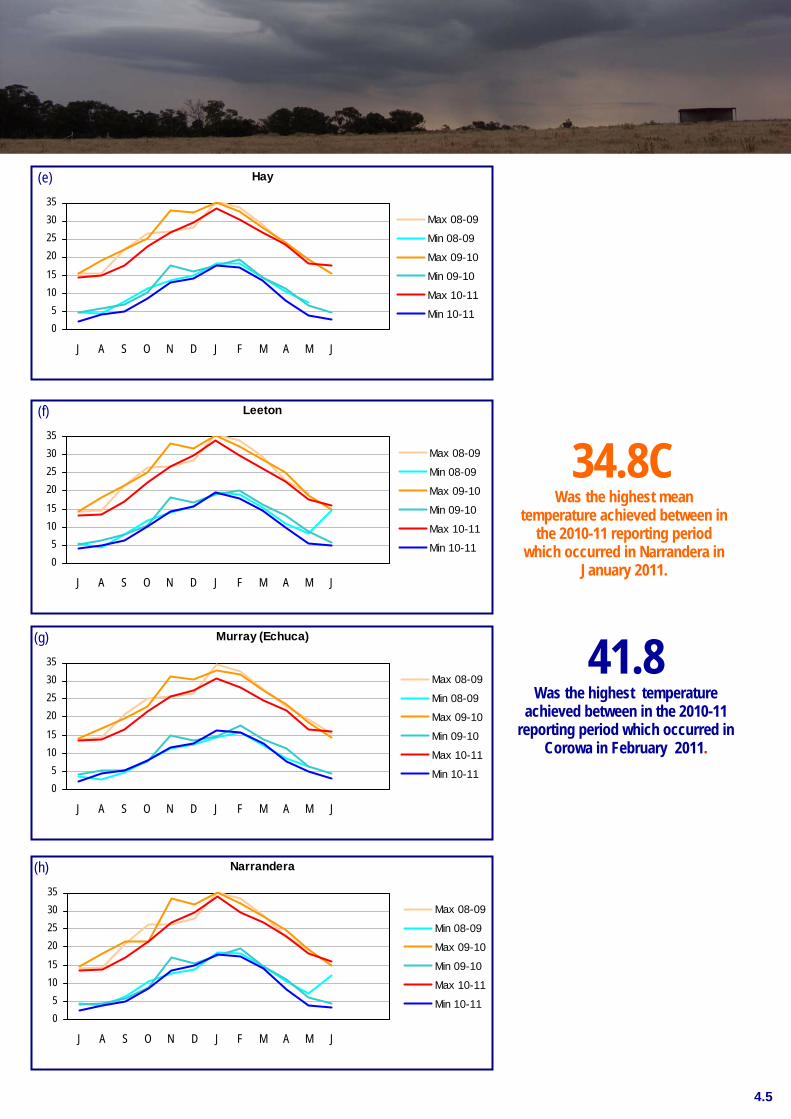
4.2 Temperature1 Information for the reporting periods 08-09, 09-10 and 10-11 is displayed in Figure 5 (a to h). Only the regional centres with a Bureau of Meteorology weather station have been in-cluded. While this data is limited to such locations, is still provides an overview of cli-mate in the region.
Temperature As can be seen in Figure 5 the average maxi-mum temperature for the year 2010-11 was generally less than the pervious two years. This is partly due to increased cloud cover across the region associated with the La Niña weather pattern2 . In February when Albury experienced above average rainfall, the average highest tem-perature was 2.2 degrees lower than in 2008-2009. This trend also occurred in Deniliquin, Corowa, Leeton, Murray and Narrandera. The graphs also indicated that from April to June the region has experienced lower aver-age minimum temperatures that the previous reporting periods. This correlates with the lower maximum temperatures across the region.
In April, Hay experience a decrease in its average minimum temperature by 3.5 de-grees. Deniliquin, Leeton and Narrandera also experienced similar decreases in the average minimum temperatures. 1Australian Government: Bureau of Meteorology, 2011, Climate
(c)
(a)
(d)
(b) Balranald
05
101520253035
J A S O N D J F M A M J
Max 08-09
Min 08-09
Max 09-10
Min 09-10
Max 10-11
Min 10-11
N/A
N/A
Corowa
05
101520253035
J A S O N D J F M A M J
Max 08-09
Min 08-09
Max 09-10
Min 09-10
Max 10-11
Min 10-11
N/A
N/A
Deniliquin
05
101520253035
J A S O N D J F M A M J
Max 08-09
Min 08-09
Max 09-10
Min 09-10
Max 10-11
Min 10-11
Figure 5 (a to h) - Minimum & maximum temperatures for selected RAMROC councils in 2010/11, 2009/10 and 2008/091
2.3°C Was the lowest mean temperature
achieved in 2010-11 reporting period
2.8°C Was the lowest mean temperature
achieved in 2008-09 reporting period
1.Australian Government: Bureau of Meteorology, 2011, Climate Data Online, multiple regions, period July 2010 to June 2011
4.5
(e)
(f)
(g)
(h)
Hay
05
101520253035
J A S O N D J F M A M J
Max 08-09
Min 08-09
Max 09-10
Min 09-10
Max 10-11
Min 10-11
Leeton
05
101520253035
J A S O N D J F M A M J
Max 08-09
Min 08-09
Max 09-10
Min 09-10
Max 10-11
Min 10-11
Murray (Echuca)
05
101520253035
J A S O N D J F M A M J
Max 08-09
Min 08-09
Max 09-10
Min 09-10
Max 10-11
Min 10-11
Narrandera
05
101520253035
J A S O N D J F M A M J
Max 08-09
Min 08-09
Max 09-10
Min 09-10
Max 10-11
Min 10-11
34.8C Was the highest mean
temperature achieved between in the 2010-11 reporting period
which occurred in Narrandera in January 2011.
41.8 Was the highest temperature
achieved between in the 2010-11 reporting period which occurred in
Corowa in February 2011.

4.3 Council monitored emissions1
Councils monitor several sources of emissions within their LGA.
State Tables 5 and 6 and the graphs on the following pages record smoke pollution, pollution complaints and usage of alternative fuels.
Pressure Some technologies and actions have a greater impact on the environment than others. As technology progresses, there are more and more sources and solutions when it comes to emissions.
In a country as large as Australia, and especially for rural or remote areas, vehicle use is quite high as the distance needed to travel is greater and public transport is not as “viable” or as available in urban centres.
Response Careful monitoring and implementation of energy saving techniques including using more efficient and environmentally friendly vehi-cles.
1 Sourced from relevant councils
Table 5 - Smoke pollution in 2010/111 LGA Stubble
permits issued1
Differ-ence
Solid fuel heater
approvals1
Differ-ence
Controlled burns by
council (ha)1
Differ-ence
Albury Nil by council = 10 2 Nil by council -
Balranald 0 = 0 = None -
Berrigan 10 = 5 5 None -
Carrathool Nil by council - 0 - Nil by council -
Conargo 82 64 0 = None -
Corowa 23 23 4 4 None -
Deniliquin Unknown - 2 = 2 -
Greater Hume Unknown - 15 6 Yes, Jindera WTS
-
Hay 115 115 0 - None -
Jerilderie Unknown - 0 - Unknown -
Leeton 0 = 0 - Yes, un-known ha
-
Murray 0 - 3 1 Yes, Un-known
-
Narrandera Unknown - N/A - N/A -
Wakool 9 1 12 3 0 -
Wentworth 3 59 1 2 2, 320ha 320 1 Sourced from relevant councils
Murrumbidgee 0 - 0 - 0 -
4.6
Table 6 - Pollution complaints & alternative fuel1
LGA Pollution com-
plaints1
Change Alternative fuel vehicles?
Change in vehi-cles?
Albury 6 2 Yes, Prius & Camry No
Balranald 0 - No 2
Berrigan 0 2 Yes gas & smaller vehicles
-
Carrathool 0 - None None
Conargo 0 - None None
Corowa 2 1 None None
Deniliquin 0 - None None
Greater Hume
2 6 None None
Hay 3 3 None None
Jerilderie 6 6 None None
Leeton 0 - None 1
Murray - 5 Yes Yes
Narrandera No register None None
Wakool 0 - None None
Wentworth 2 2 1 1
1 Sourced from relevant councils
Murrum-bidgee
N/A - No -
4.7
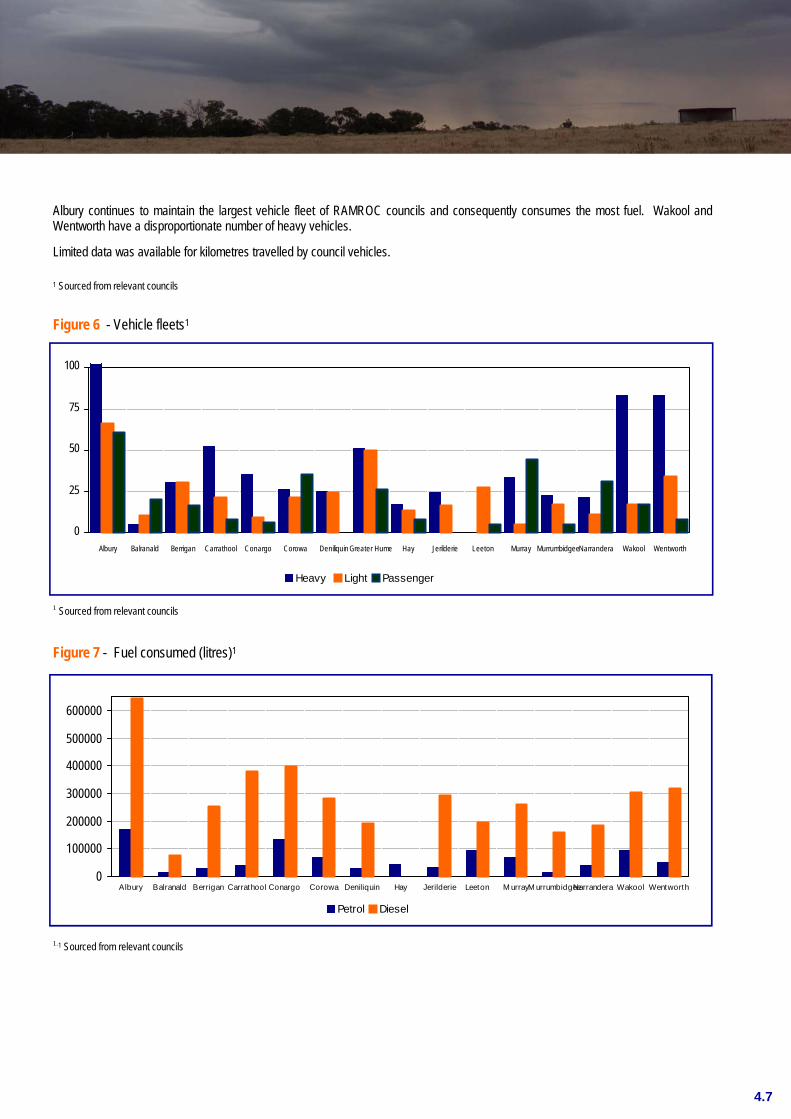
Albury continues to maintain the largest vehicle fleet of RAMROC councils and consequently consumes the most fuel. Wakool and Wentworth have a disproportionate number of heavy vehicles.
Limited data was available for kilometres travelled by council vehicles. 1 Sourced from relevant councils
0
25
50
75
100
Albury Balranald Berrigan Carrathool Conargo Corowa Deniliquin Greater Hume Hay Jerilderie Leeton Murray MurrumbidgeeNarrandera Wakool Wentworth
Heavy Light Passenger
0
100000
200000
300000
400000
500000
600000
Albury Balranald Berrigan Carrathool Conargo Corowa Deniliquin Hay Jerilderie Leeton M urrayM urrumbidgeeNarrandera Wakool Wentworth
Petrol Diesel
Figure 6 - Vehicle fleets1
Figure 7 - Fuel consumed (litres)1
1.1 Sourced from relevant councils
1 Sourced from relevant councils
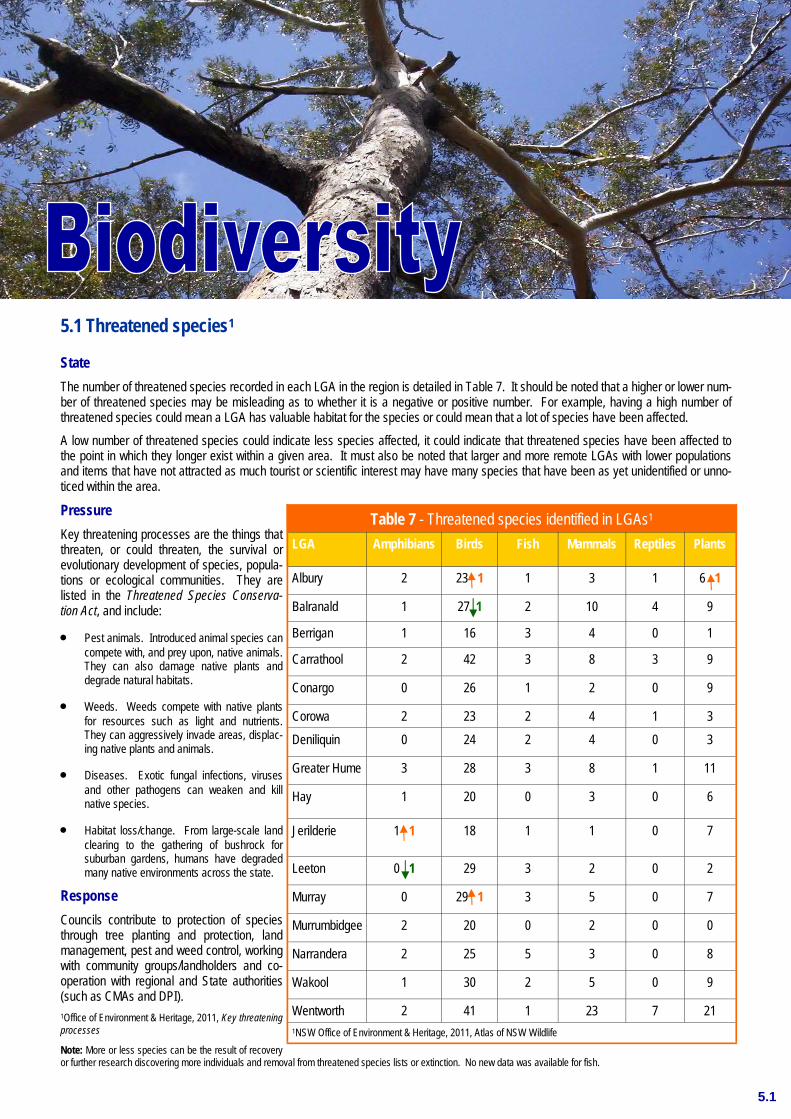
5.1 Threatened species1
State The number of threatened species recorded in each LGA in the region is detailed in Table 7. It should be noted that a higher or lower num-ber of threatened species may be misleading as to whether it is a negative or positive number. For example, having a high number of threatened species could mean a LGA has valuable habitat for the species or could mean that a lot of species have been affected. A low number of threatened species could indicate less species affected, it could indicate that threatened species have been affected to the point in which they longer exist within a given area. It must also be noted that larger and more remote LGAs with lower populations and items that have not attracted as much tourist or scientific interest may have many species that have been as yet unidentified or unno-ticed within the area.
Pressure
Key threatening processes are the things that threaten, or could threaten, the survival or evolutionary development of species, popula-tions or ecological communities. They are listed in the Threatened Species Conserva-tion Act, and include:
• Pest animals. Introduced animal species can compete with, and prey upon, native animals. They can also damage native plants and degrade natural habitats.
• Weeds. Weeds compete with native plants for resources such as light and nutrients. They can aggressively invade areas, displac-ing native plants and animals.
• Diseases. Exotic fungal infections, viruses and other pathogens can weaken and kill native species.
• Habitat loss/change. From large-scale land clearing to the gathering of bushrock for suburban gardens, humans have degraded many native environments across the state.
Response Councils contribute to protection of species through tree planting and protection, land management, pest and weed control, working with community groups/landholders and co-operation with regional and State authorities (such as CMAs and DPI). 1Office of Environment & Heritage, 2011, Key threatening processes
Note: More or less species can be the result of recovery or further research discovering more individuals and removal from threatened species lists or extinction. No new data was available for fish.
Table 7 - Threatened species identified in LGAs1
LGA Amphibians Birds Fish Mammals Reptiles Plants
Albury 2 23 1 1 3 1 6 1
Balranald 1 27 1 2 10 4 9
Berrigan 1 16 3 4 0 1
Carrathool 2 42 3 8 3 9
Conargo 0 26 1 2 0 9
Corowa 2 23 2 4 1 3
Deniliquin 0 24 2 4 0 3
Greater Hume 3 28 3 8 1 11
Hay 1 20 0 3 0 6
Jerilderie 1 1 18 1 1 0 7
Leeton 0 1 29 3 2 0 2
Murray 0 29 1 3 5 0 7
Narrandera 2 25 5 3 0 8
Wakool 1 30 2 5 0 9
Wentworth 2 41 1 23 7 21 1NSW Office of Environment & Heritage, 2011, Atlas of NSW Wildlife
Murrumbidgee 2 20 0 2 0 0
5.1
Case study— DRAFT NSW Biodiversity Strategy1 Prepared by the Department of Environment, Climate Change and Water NSW and Industry and Investment NSW for the NSW Government
A draft NSW Biodiversity Strategy 2010-2015 has been prepared by the Department of Environment, Climate Change and Water (DECCW) and Industry and Investment NSW (I&I NSW). This draft Strategy outlines actions, targets, key objectivities to direct invest-ment in diversity conservation.
The draft Strategy includes:
• ‘prioritisation of state-scale investment form terrestrial ecosystems across 6% of New South Wales to coordinate and target in-vestment and effort in biodiversity.
• an action to deliver transparent prioritisation of threatened species recovery programs between species and location to maximise return for effort.
• Greater focus on biodiversity in urban settlement planning processes to minimise impacts on biodiversity and to offset unavoid-able impacts using secure, well-targeted offsetting mechanisms
• Support for existing efforts to build connections between Aboriginal people and Country, and for cultural biodiversity-related busi-ness, employment and training opportunities for Aboriginal people.
• Support for non-government, government and catchment management authorises (CMA) conservation partnerships like the Great Eastern Ranges Initiative
• Continued focus on existing programs such as reserve expansion and management, invasive pest and weed control and a range of programs underway to ensure the health and sustainability of our rivers and wetlands.
• Ongoing support for the range of sustainability programs currently implemented by rural landholders including sustainable graz-ing, rehabilitation and riparian management and soil erosion strategies.’
The draft Strategy is divided into two parts: PART A: Framework for action—includes the overarching objectives , targets and actions PART B: State of ecosystem profiles and priorities—state-scale profiles and priorities for investment by ecosystem and threatened species profile.
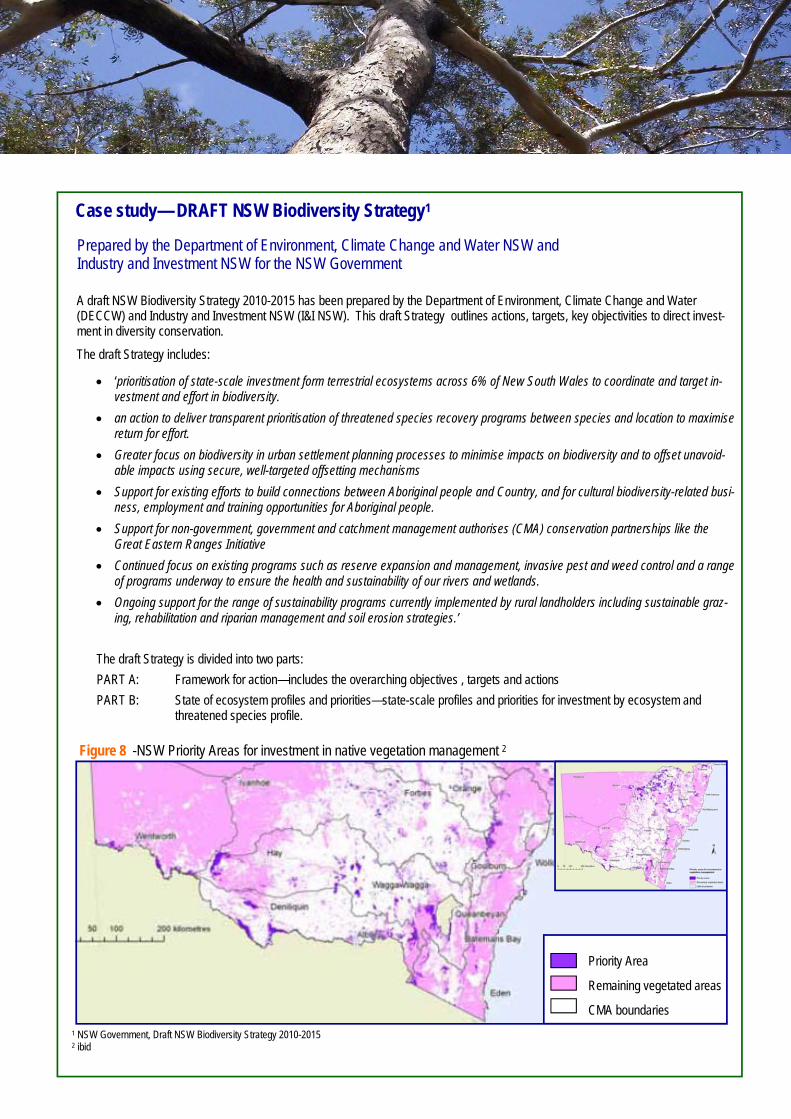
Figure 8 -NSW Priority Areas for investment in native vegetation management 2
1 NSW Government, Draft NSW Biodiversity Strategy 2010-2015 2 ibid
Priority Area
Remaining vegetated areas
CMA boundaries
5.2 Weeds1
Some weeds are required by law to be controlled by landhold-ers. These are known as noxious weeds and the law that con-trols these in NSW is the Noxious Weeds Act 1993. Weeds that are declared noxious are those weeds that have potential to cause harm to the community and individuals, can be controlled by reasonable means and most importantly, have the potential to spread within an area and to other areas.
A weed is declared noxious because its control will provide a benefit to the community over and above the cost of imple-menting control programs.
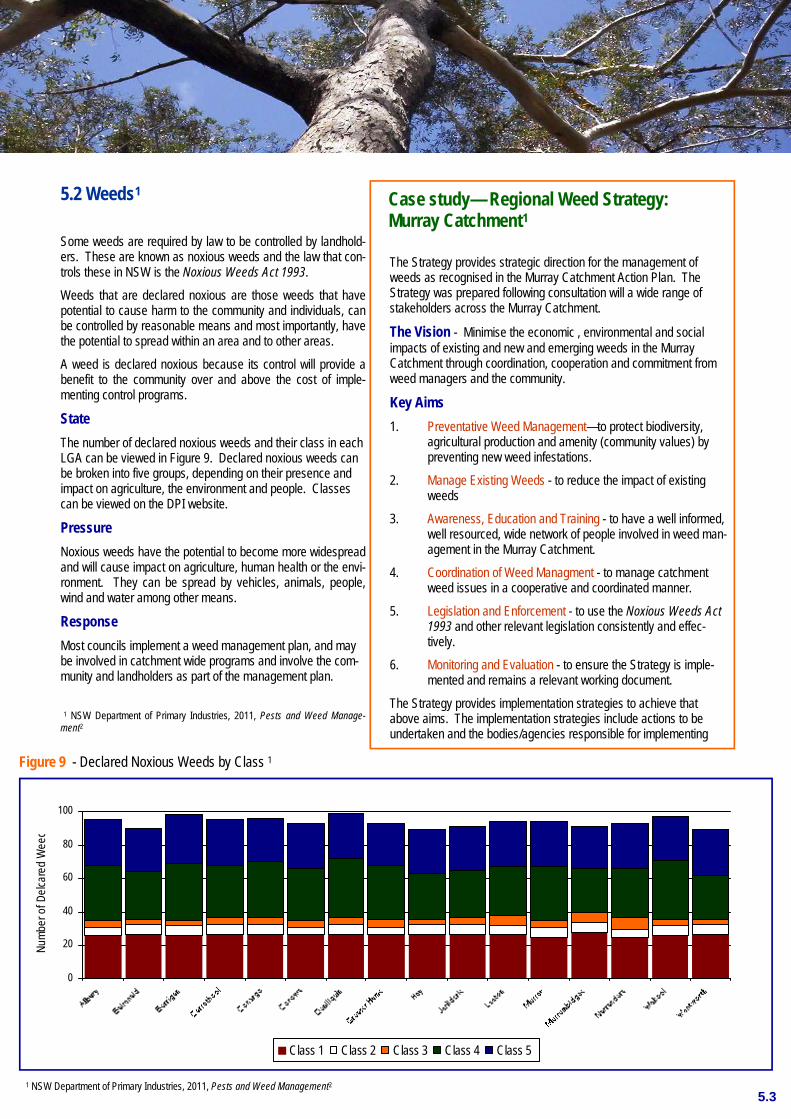
State The number of declared noxious weeds and their class in each LGA can be viewed in Figure 9. Declared noxious weeds can be broken into five groups, depending on their presence and impact on agriculture, the environment and people. Classes can be viewed on the DPI website.
Pressure Noxious weeds have the potential to become more widespread and will cause impact on agriculture, human health or the envi-ronment. They can be spread by vehicles, animals, people, wind and water among other means.
Response Most councils implement a weed management plan, and may be involved in catchment wide programs and involve the com-munity and landholders as part of the management plan.
1 NSW Department of Primary Industries, 2011, Pests and Weed Manage-ment2
5.3
0
20
40
60
80
100
Numb
er o
f Delc
ared
Wee
d
Class 1 Class 2 Class 3 Class 4 Class 5
Case study— Regional Weed Strategy: Murray Catchment1 The Strategy provides strategic direction for the management of weeds as recognised in the Murray Catchment Action Plan. The Strategy was prepared following consultation will a wide range of stakeholders across the Murray Catchment.
The Vision - Minimise the economic , environmental and social impacts of existing and new and emerging weeds in the Murray Catchment through coordination, cooperation and commitment from weed managers and the community.
Key Aims 1. Preventative Weed Management—to protect biodiversity,
agricultural production and amenity (community values) by preventing new weed infestations.
2. Manage Existing Weeds - to reduce the impact of existing weeds
3. Awareness, Education and Training - to have a well informed, well resourced, wide network of people involved in weed man-agement in the Murray Catchment.
4. Coordination of Weed Managment - to manage catchment weed issues in a cooperative and coordinated manner.
5. Legislation and Enforcement - to use the Noxious Weeds Act 1993 and other relevant legislation consistently and effec-tively.
6. Monitoring and Evaluation - to ensure the Strategy is imple-mented and remains a relevant working document.
The Strategy provides implementation strategies to achieve that above aims. The implementation strategies include actions to be undertaken and the bodies/agencies responsible for implementing
Figure 9 - Declared Noxious Weeds by Class 1
1 NSW Department of Primary Industries, 2011, Pests and Weed Management2
5.4
5.3 Environmental reserves1
Across the region a network of protected areas exist. The protected areas are the foundation for biodiversity conservation. The Riverina has 123,154 ha of managed reserves.
State A number of councils retain land for biodiversity or environmental purposes. Some LGAs contain State Forest, National Parks and/or Na-ture Reserves, though these are not usually maintained by Council.
Pressure The NPWS identifies weeds, pest animals and inappropriate fire regimes to be major contributing factors to the degradation of parks and reserves. Climate change and drought are also significant factors.
Response Some council’s reserve land for biodiversity or environmental purposes (refer to Table 8). Council’s responses to weeds and pests can be seen in this section of the report. 1 NSW Office of Environment & Heritage, Protected Areas
Table 8 - Council retained land for biodiversity LGA Council retain
land for biodiversity/
environment?2
How many hectares
(approx.)?2
Protected from
damage?2
Albury Yes 7481 Yes
Balranald Yes 5 Yes
Berrigan Yes 427 427 Yes
Carrathool No / N/A
Conargo Yes - Yes
Corowa Yes 40 Yes
Deniliquin Yes Unknown Yes
Greater Hume
Yes Unknown Yes
Hay Yes 62 62 Yes
Jerilderie No N/A N/A
Leeton Yes 8 Yes
Murray Yes - -
Narrandera Yes 500 + Yes
Wakool Yes Unknown Yes
Wentworth No 876 876 N/A 2Sourced from relevant Councils
Murrum-bidgee
No N/A N/A
5.4 Threatened Ecological Communities The RAMROC area stretches across four major catchment areas; the Lachlan, Murray, Lower Murray/Darling and the Murrumbidgee. Within this area there are twelve identified Endangered Ecological Communities. Pressure1
Response2 Priority Actions from DECCW provide ways to preserve and improve threatened ecological communities. The actions include community awareness, fencing of remnant areas, tree planting and control of introduced species. Many councils within the RAMROC region are cur-rently preparing new Local Environmental Plans. This has presented an opportunity for greater protection of natural resources such as Endangered Ecological Communities. 1 Office of Environment & Heritage, 2011, Key threatening processes 2.Department of Environment and Conservation, 2011, Priority and threat abatement—priority actions, Threatened Species homepage
• Clearing for cropping, pasture improvement or other developments. • Increased livestock grazing, trampling, stubble burning, weed inva-
sion, inappropriate fire regimes, soil disturbance and increased nutri-ent loads.
• Degradation of the landscape in which remnants occur including soil acidification, salinisation, extensive erosion scalding and loss of connectivity.
• Grazing by introduced European Rabbits and fauna predation by feral cats.
• Poor representation in isolated conservation reserves. • Harvesting of firewood (either living or standing dead, including ma-
terial on the ground) • Lack of knowledge of the ecology of the community.
• Soil disturbance caused by feral pigs, goats, deer, horses and domestic livestock
• Damage to vegetation and soils by off-road vehicles • Peat mining • Pollution and eutrophication from urban areas, cropping and improved
pastures in the catchment • Changes to water tables and surface flows caused by drainage works
or altered flows in the catchment • Erosion and sedimentation • Climate change • Herbivory by the processionary caterpillar Ochrogaster lunifer (Bag-
shelter moth)
5.5
Case study— Murray River/Corowa Wetlands Revitalisation Project Murray River/Corowa Wetlands National Green Job Corps Program in Corowa Corowa Shire Council The Personnel Group with the support of the Corowa Shire Council and Wodonga TAFE have launched the ‘Murray River/Corowa Wet-lands Revitalisation’ project. The project is funded by DEEWR and contracted by the National Green Jobs Corps program. The purpose of this project is the restoration and maintenance of riverside restoration at Ball Park in Corowa. The project also involves several secondary sites including the Wahgunyah cemetery and football oval as well as five local wetlands in areas surrounding Corowa.
5.5 New threatened species1
The Threatened Species Conservation Act 1995 (TSC Act) protects threatened and endangered species throughout NSW. The Scientific Committee determines inclusions, exclusions and alterations to the Act given applications and advice submitted for consideration. The schedules of the Act contain the species, communities and populations protected by the Act, and these are constantly changing depending upon the Committee’s decisions.
State There has been final determinations made by the Scientific Committee in the reporting period and two Preliminary Determinations which may effect the RAMROC region (see below).
Pressure Land management practices, climate change, natural resource requirements and invasion of exotic species (plant, animal and viral) are some of the many factors contributing to the decline of certain native species in Australia, and in particular the RAMROC reporting area.
Response Listing of species under the Act provides legal protection for organisms and their habitats. Listing can have lead-on benefits, such as pub-lic and scientific publicity, which can lead to funding support for research, protection and restoration.
5.6
Final Determination1 • List the Australasian Bittern Boturus poiciloptilus as a ENDAN-
GERED SPECIES in Part 1 of Schedule 1A of the Act and as consequence, to omit reference to Australasian Bittern Boturus poiciloptilus from Part 1 of Schedule 1 (Vulnerable Species) of the Act. .
• List the Grey Falcon Falco hypoleucos as a ENDANGERED SPE-CIES in Part 1 of Schedule 1A of the Act and as consequence, to omit reference to Grey Falcon Falco hypoleucos from Part 1 of Schedule 1 (Vulnerable species) of the Act.
• List the shrub Lasiopetalum behril as a CRITICALLY ENDAN-GERED SPECIES in Part 1 of Schedule 1A of the Act and as consequence, to omit reference to shrub Lasiopetalum behril from Part 1 of Schedule 1 (Endangered Species) of the Act. .
Preliminary Determination2 • To list the Curlew Sandpiper Calidris ferrunginea (Shaw, 1794) as
a ENDANGERED SPECIES in Part 1 of Schedule 1A of the Act,
• To list ‘Loss and degradation of native plant and animal habitat by invasion of escaped garden plants, including aquatic plants’ as a KEY THREATENING PROCESS in Schedule 3 of the Act.
1Office of Environment & Heritage, 2011, Final determinations by date 2Office of Environment & Heritage , 2011, Preliminary determinations by date,
Case study— Mouse plague Riverina mouse plague ABC Rural, April 2011 Farmers across New South Wales fought off locusts now they're fighting off mice. Heavy rain over the summer has caused mice num-bers to increase dramatically, causing thousands of dollars in damage to crops. Emily Boyle spoke with one farmer in the Riverina who says it's the worst mouse plague he's seen in 20 years. Nick Maynard, from Hay in the Riverina says he's lost over $100,000 in expected revenue this year because of a mouse infestation. He says he's been aerial spraying and baiting his sunflower and maize crops since February but still can't get mice numbers down. "We don't seem to be getting them under control no matter how much baiting we do. Every second day we could be baiting but there's more on their way. They're into anything, I've got probes in the paddock and they're eating all the cables off the probes, they're in the walls of the house, so yeah, they're everywhere." The building mouse plague is also keeping rural suppliers in business. While some say the bait is flying off the shelves, other businesses have ordered baits in bulk to meet farmers growing demands
5.6 Pests & feral animals1 Invasive species affect our environment, economy and social well-being. They can reduce the productivity of our land and waterways and reduce biodiversity in natural areas. Invasive species can out-compete, or prey on other species and spread disease. They can also damage buildings, roads and other structures1.
State Some of region's LGAs were affected by pests during the reporting period (refer to Table 9). Common pests throughout the region include rabbits, foxes, locusts, mice and feral dogs and cats. The area experienced significant mice and locusts outbreaks in the reporting period. The locusts outbreak was regarded as one of the worst in the past decade.
Pressure The economic downturn and poor productivity on due to the significant mice and locusts outbreak in the reporting period.
Response Councils work with local landholders, community groups and state agencies (such as the NSW Department of Primary Industries) to control pests on properties. Feral cat and dog populations can be reduced through registration, micro-chipping and desexing of domestic pets. Local councils have pest control plans and policies, and regulate domestic animals through the Companion Animals Act, which requires registration of all domestic dogs (other than specified, such as working dogs). The Council’s and State Government have brochures, work-shops and extensive advertisement to educate residents on methods to reduce the spread and impact of pests such as locusts and mice.
Table 9 - Pest and domestic animal control1 LGA Pest
problem in 2010/11 Common pests Dogs im-
pounded Cats
impounded Other animals
impounded Animals
euthanized
Albury Yes, locusts & mice Rabbits, rats, mice & locusts
816 84 430 16 8 calves, 3 sheep, 14 goats 19
439 17
Balranald Yes locusts & mice Mice/rabbits/foxes 92 61 0 0 5 2
Berrigan Yes, rabbits, foxes, mice & locusts
Rabbits, foxes, mice & locusts
85 22 15 23 0 77 5
Carrathool Yes, locusts & mice Rabbits/foxes/locusts 13 8 0 0 3 18
Conargo Yes, mice & locusts Cats, foxes & locusts
6 1 0 0 9 0
Corowa Yes, mice Rabbits/foxes 77 8 26 5 4 2 32 1 Deniliquin Yes, mice Hares & rabbits 116 4 - 6 6 40 14
Greater Hume Yes, mice Rabbits, cats, foxes & crickets
85 32 17 40 0 28 33
Hay Yes, locusts, mice & crickets
Locusts, mice & crickets 183 22 21 17 2 2 137 5
Jerilderie Yes, locusts, crickets & mice
Mice 10 5 0 0 4
Leeton Locusts & fruit flies Locusts 377 65 196 41 8 7 207 224
Murray Yes, locusts & mice Mice, locusts & rabbits 98 2 30 17 30 22 25
Murrumbidgee Yes, mice & locusts Mice & locusts 23 6 0 0
Narrandera Yes, mice & crickets Locusts/rabbits/white cedar grubs
127 11 21 26 0 1 61 4
Wakool No Rabbits/foxes/cats 15 6 0 8 5 7 3 Wentworth Yes, locusts Rabbits 178 25 64 2 0 85 27 1Sourced from relevant councils
5.7
5.7 Bushfires1
Bushfires are an intrinsic part of the Australian environment. Natural ecosystems have evolved with fire, and the landscape along with its biological diversity, has been shaped by both historic and recent fires. Many of Australia’s native plants are fire prone and very combusti-ble while numerous species depend on fire to regenerate1.Fire is both feared and harnessed. Indigenous Australians have long used fire as a land management tool and it continues to be used to clear land for agricultural purposes and to protect properties from intense, un-controlled fires.
State The number of bushfire occurrences and the number of hectares burnt through the region are summarised in Table 10. The significant rainfall may have impacted the number of bushfires which occurred in the reporting period with four Councils reporting a decline in bushfire events.
Pressure Climate change is a popular reason for an increased number and intensity of recent bushfires, as is drought and El Niño. Changes in land management practices have also contributed, changes in Aboriginal fire management, the removal of stock grazing from environmentally significant areas and agricultural land management practices (such as retaining stubble for protection against erosion) have increased fuel loads and can contribute to the intensity of a bushfire event. The La Niña weather pattern that provided significant rainfall and lower aver-age temperatures has impacted on the number of bushfires in the region.
Response Councils enforce bushfire safety standards for new dwellings, buildings and subdivisions, to ensure they meet standards of the Planning for Bushfire Protection guidelines. Some councils also manage clean up programs (such as free collection/disposal of green waste nearing fire season) and other conduct burn-offs and maintain fire vehicles for volunteer and rural brigades. 1 Geoscience Australia, 2011, Hazards
Table 10 - Bushfire datal1 LGA Bushfire events2 Hectares burnt2 Fire trucks maintained by
council2 Rural Fire
Brigades in LGA Albury Unknown Unknown 14 11 4
Balranald 0 2 0 20 2 3 2 1
Berrigan 21 7 55.74 42.24 21 5
Carrathool Unknown Unknown 50 26
Conargo 17 17 150 26 3 13
Corowa 19 10.5 28 2 12
Deniliquin Unknown Unknown Unknown 1
Greater Hume 0 Unknown 75 35
Hay 8 8 17 32
Jerilderie Unknown Unknown 17 10
Leeton Unknown Unknown 11 trucks 3 utes 4
Murray Unknown Unknown Unknown 10
Narrandera 25 2 75 29 15 1 Wakool Unknown Unknown 14 13
Wentworth 26 54 160 26 2 16 1Sourced from relevant councils
Murrumbidgee 0 Unknown Unknown Unknown
5.8
5.8 Native vegetation
Native vegetation extent and condition is an indicator of ecosystem health and the overall and health of ecosystem diversity.
State The condition of native vegetation across the region ranges from pristine to total replacement as the degree of modification varies from area to area. Modification can occur in varying degrees by land management practices and unplanned threats and disturbances such as weed invasion and fire.
Pressure The modification of native vegetation can change the structure, function and species composition of vegetation.
Response
Some councils require permit to remove native vegetation which can include conditions such as planting vegetation to offset the vegetation removed.
Table 11 - Tree removal in RAMROC LGAs1 LGA Permit re-
quired? Applications Offset required? Approvals for firewood
collection?1
Albury Yes 220 18 Yes Not allowed
Balranald Yes 0 Yes 0
Berrigan Not req’d in vil-lage/res zone
- No Allowed—Nil
Carrathool Yes 0 3 Yes Not allowed
Conargo In sandhilll area - Yes Not allowed
Corowa In urban areas Unknown Yes Permit required 25 25
Deniliquin No N/A No Not allowed
Greater Hume No NA No 250 30
Hay No NA No Allowed 250 250
Jerilderie No N/A No Allowed—Nil
Leeton No NA No Allowed—Nil
Murray No NA No Permits available
Narrandera No NA No Not allowed
Wakool No NA No Not allowed
Wentworth No NA No Not allowed 1Sourced from relevant councils
Murrumbidgee Yes 1 Yes Yes, no permit required
5.9
6.1 Water quality Water is a limited and precious resource and must be managed for immediate needs and for long-term economic and environmental sus-tainability. With the effects of climate change now a reality, and increasing demands for water, sound policies are required to ensure a sustainable supply of water for the recent drought and for future generations. This recording period experienced a different pressure on water quality with all Council’s experience flooding in their LGA.
State Most councils undertake potable water quality monitoring. Five councils have identified groundwater issues. All Councils experienced flooding, the flooding resulted in significant cost to repair infrastructure and damage to crops. Flooding increases the flow for most river systems which saw a decrease in Blue-green Algae outbreak.
Pressure Water quality and availability can be affected by drought and floods. The Greater Hume and Jerilderie Council’s issued alerts to boil water due to the potential contamination of supplies from flooding.
Response Councils monitor potable water and some councils also monitor ground water. Councils also encourage sustainable land practices and manage urban stormwater flows.
Table 12 - Water monitoring1 LGA Council
monitors water quality
Alerts issued for potable water
Blue-green algae outbreaks
Ground water issues in LGA
Albury Yes No Yes No
Balranald Yes No No No
Berrigan Yes No Yes Salinity
Carrathool Yes No No No
Conargo No No Yes No
Corowa Yes Yes (algae) Yes No
Deniliquin Yes No Yes No
Greater Hume Yes Yes Yes No
Hay Yes No No Yes
Jerilderie Yes Yes Yes No
Leeton Yes No No Salinity
Murray Yes No Yes No
Narrandera Yes No No Salinity, high water table
Wakool Yes No Yes Yes
Wentworth Yes Yes No No 1Sourced from relevant councils and Murray RACC New Alerts
Murrumbidgee Yes No No High water table in certain areas
6.1

6.2 Flooding State All LGAs within the RAMROC region experienced flooding in the reporting period. This occurred following years of drought and created a new set of environmental issues for Councils to manage.
Pressure The region experienced flood events ranging from 1 in 5 year to 1 in 50 years. A majority of the Councils recorded substantial damage to crops and infrastructure in particular road. Wakool reported $3 million damage from flooding and Carrathool reported $6.5 million on local roads alone. Although Berrigan and Deniliquin experienced flooding the did not report any damage to infrastructure.
Response Planning to ensure infrastructure is protected from potential flooding.
6.2
Case study - Strengthening Basin Communities Councils take action to combat a future with less water Corowa Shire Council AlburyCity, Corowa, Greater Hume and Urana Coun-cils have released a report outlining key infrastructure and education initiatives designed to assist the com-munity overcome a future with less water. With and $800,000 grant attracted to date as part of the Federal Governments ’Strengthening Basin Communities Pro-gram’. The next stage of the project will position each of the four Councils to seek further funding for infra-structure investment and program delivery from the $200 million available1. The councils have developed priority projects and initiatives which will assist a range of groups of sport-ing clubs and major industry. Councils will also de-velop or review their economic development strategies to ensure appropriate strategies are incorporated to enable sustainable growth in a future with less water. A Community Report and Synthesis Report provide an overall summary of the study and recommendations2. Water for the Future is preparing Australian for a fu-ture will less water. The 10 year initiative is addressing four key properties: -> Taking action on climate change -> Using water wisely -> Securing water supplies -> Supporting healthy rivers
Table 13 - Impact of flooding 1
LGA Flooding in 2010/11
Damage
Albury Yes, 1 in 50 to 1 in 10yr
$275,000
Balranald Yes, 1 in 20yr $4.6 mil
Berrigan Yes, 1 in 20yr $289,000
Carrathool Yes, 1 in 50yr Regional roads $738,850, Local roads
$6,571,475
Conargo Yes $872,000
Corowa Yes, 1 in 100yr Crop loss, damage to farming infrastructure &
$5mil of damage to roads
Deniliquin Yes, less than 1 in 5yr
Nil
Greater Hume Yes Significant
Hay Yes, 1 in 20yr $192,000
Jerilderie Yes, 1 in 20yr $2.5 mil
Leeton Yes Unknown
Murray Yes, 1 in 20yr Unknown
Narrandera Yes, 1 in 20yr $1.6 mil road damage
Wakool Yes, 1 in 20yr $3 mil
Wentworth Yes, 1 in 10yr $67,000 1Sourced from relevant councils
Murrumbidgee Yes, 1 in 10yr Roads
6.3 Water consumption
Water in Australia is a valuable resource, required for almost every industry, particularly agriculture, as well as drinking water and house-hold use.
State Water consumption for each LGA is recorded in the table below.
Pressure Large amounts of water are used in households by washing machines, dishwashers, hot water systems and showers. Garden irrigators potable, washing of cars and private swimming pools also contribute to domestic potable water use. Some businesses require large amounts of water for processing (such as food processing). Agriculture requires water for stock and irrigation of crops. Councils can use excessive amounts of water for irrigation of sporting facilities and parks as well as for cleaning of plant and other equipment.
Response Incentives for water tanks and water saving appliances in homes are available for reducing domestic water use. Some businesses (such as car washes) utilise recycled water. Councils can enforce water restrictions to limit inessential uses (such as watering lawns or pools) and often utilise recycled water for the maintenance of council owned parks and sporting facilities, and sometimes government owned school ovals.
Table 14 - Water consumption and use in the RAMROC region1 LGA Water supply1 Daily average
household water consumption1
Charges for excessive water consumption1 Land irrigated by reused water (ha)1
Megalitres of reused water
utilised1
Albury River + reservoirs 182.97kL/residence None, scale based 195.5 5.5 4920 579
Balranald Tower from river - Excess charge after 600k 5,000 5,000 Nil
Berrigan River & channel 0.77kL None, consumption based 69.3 110
Carrathool Bore N/A Excess charge after 350kL $0.85 per Kw No N/A
Conargo Bore and creek 73Lts Yes, $330 per 100kL No N/A
Corowa River 570L No, $0.90 per kL 60 110
Deniliquin River 0746kL 0-800kL $0.40, 801>$0.80 4 10
Greater Hume Groundwater & river 660L Per kL over 200kL 14 63.9
Hay River, treated and then to tower 478L per day Yes Culcairn Water Supply >200KL $1.10, Village
Water Supply >200KL $1.80 14 Nil
Jerilderie Billabong Creek 0.313kL Raw $.59per kL & filtered 0-250kL $1.25 >250kL $1.5 5 20
Leeton River, via channel & treated 1.1kL Charges for excessive water consumption - 3 step
pricing system None N/A
Murray River 289kL/year None 24 86 86 42
Narrandera Bore N/A Yes None N/A
Wakool River (potable and raw) - $1.35 per kL None N/A
Wentworth River 0.79 kL 221.2kL Raw $1per kg over 700kL & filtered $2.7 per kL over 250kL None N/A
1Sourced from relevant councils
Murrumbidgee Groundwater N/A 1-125kL 29c/kL, 126-200kL 34ckL, >200kL 40c/kL No N/A
6.3
6.4
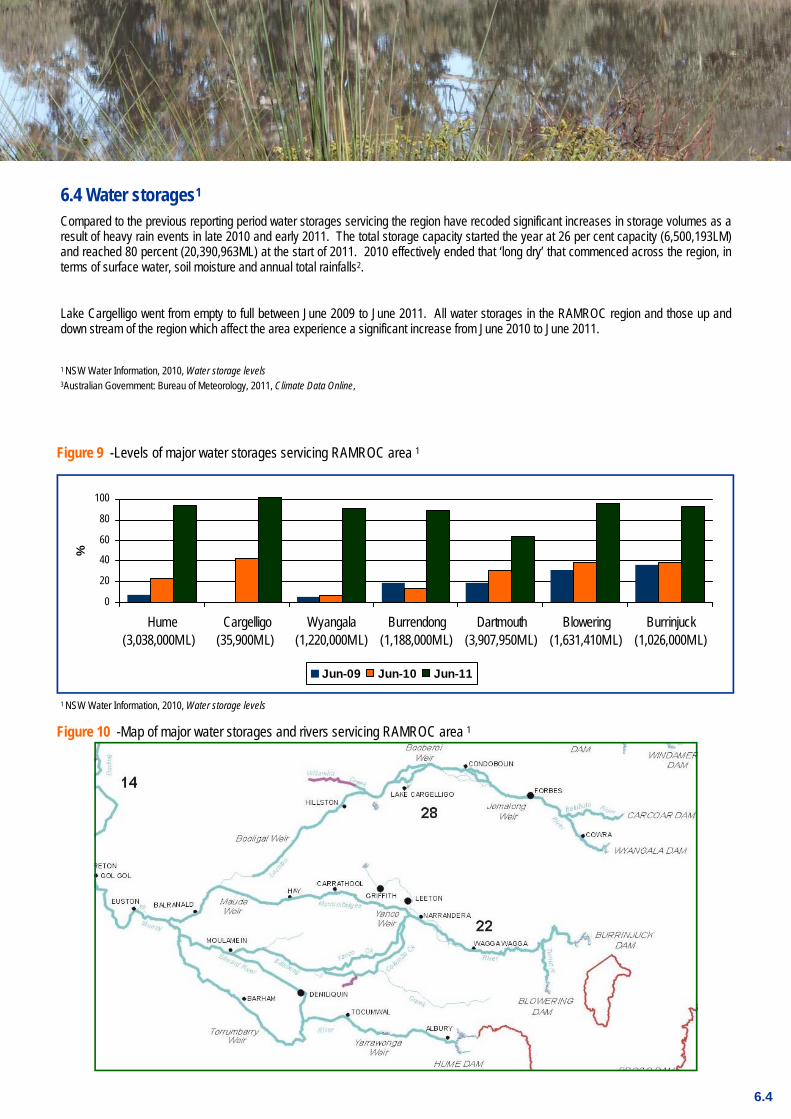
6.4 Water storages1
Compared to the previous reporting period water storages servicing the region have recoded significant increases in storage volumes as a result of heavy rain events in late 2010 and early 2011. The total storage capacity started the year at 26 per cent capacity (6,500,193LM) and reached 80 percent (20,390,963ML) at the start of 2011. 2010 effectively ended that ‘long dry’ that commenced across the region, in terms of surface water, soil moisture and annual total rainfalls2.
Lake Cargelligo went from empty to full between June 2009 to June 2011. All water storages in the RAMROC region and those up and down stream of the region which affect the area experience a significant increase from June 2010 to June 2011.
1 NSW Water Information, 2010, Water storage levels 3Australian Government: Bureau of Meteorology, 2011, Climate Data Online,
0
20
40
60
80
100
Hume(3,038,000ML)
Cargelligo(35,900ML)
Wyangala(1,220,000ML)
Burrendong(1,188,000ML)
Dartmouth(3,907,950ML)
Blowering(1,631,410ML)
Burrinjuck(1,026,000ML)
%
Jun-09 Jun-10 Jun-11
Figure 9 -Levels of major water storages servicing RAMROC area 1
1 NSW Water Information, 2010, Water storage levels
Figure 10 -Map of major water storages and rivers servicing RAMROC area 1
7.1 Human settlement
Urban settlements are where most Australians live and work. Their design, planning, construction and operation are fundamental to the productivity and competitiveness of the economy, the quality of life for residents and the ecological sustainability of the environment. Human settlement in Australia dates back at least 60,000 years to an Indigenous population engaged in hunting and gathering. With the arrival of Europeans just over 200 years ago, the first of a series of major societal, economic, technological and settlement transitions oc-curred1.
The RAMROC region contains many settlements of varying sizes, from small villages to large regional centres. Settlements in the most south-eastern parts of the region are relatively close together, while settlements to the north-west are more displaced. These characteris-tics are reflected in population numbers and service provision.
1 Australian Commonwealth Scientific and Industrial Research Organisation, 2001, Australia State of the Environment Report 2001—Theme report—Human Settlements
2 Standard Instrument Local Environmental Plans
have been gazetted (Balranald & Albury).
7.1
Case study—AlburyCity New Local Environmental Plan Albury LEP Approved 13 August 2010
NSW Government The NSW Government has approved a new Albury local environmental plan (LEP) which supports 10,000 new dwellings to sup-port the city’s future growth.
Minister for Planning, Tony Kelly, said the plan provides a unified LEP for the entire council area, replacing the separate Albury and Hume LEPs used before council boundary changes in 2004.
The plan includes new policy and planning initiatives that provide:
• potential for 10,000 new dwelling to provide sufficient supplies of residential land for between 25-40 years;
• a series of environmental and habitat corridors through new release areas;
• additional mixed zones, including apartment development, on other parts of Albury CBD; and
• protection of significant visual landscape around Albury by limiting development in higher country above 220 metres to protect Nail Can Hill, Black Range and Lake Hume to the east.
Mr Kelly said it’s understood the council will be applying to have the plan given “biodiversity certification” by the Department of Environment , Climate Change and Water.
“If this certification is granted, it will allow individual application for new subdivisions to be streamlined because environmental areas to be protected have already been identified upfront”, the Minister said.
7.2 Town planning
Local Environmental Plans (LEPs) guide planning decisions for local government areas. Through zoning and development controls, they allow Councils and other consent authorities to manage the ways in which land is used. LEPs are the primary planning tool to shape the future of communities. On 31 March 2006, the NSW Government gazetted a standard instrument for preparing new LEPs, also known the LEP template. Local plans across NSW will now use the same planning language, making it easier for communities to understand what is proposed for their local area. Councils are able to include localised planning objectives and provisions specific to their area, as well as determine zoning, additional land uses, heritage items, and development standards such as height and minimum lot sizes.
State Table 14 below indicates at which stage Council are at with their new LEPs.
Pressure Lack of resources can prevent councils from conducting their reviews. The development of the new LEP requires background strategic documents including Strategic Land Uses Studies. Following these studies LEP can be drafted followed by DCPs. This process is time and resource consuming.
Response In 2011 the Department of Planning invited Councils to apply for funding under the LEP Acceleration Fund to assist in the delivery of new LEPs. The funding package exceed $10millon and aimed to help councils deliver their new LEPs in specified timeframes. The funding will assist council in undertaking outstanding strategic and technical studies, legal and specialist planning advice and GIS resources. 1Department of Planning & Infrastructure, Local Planning
Table 15 - Planning documents in the RAMROC region 1 LGA Current LEP / IDO
Year Current SLUP1?
Preparing new LEP?
Status of new standard instrument at 30/6/11
Albury 2010 Yes No Gazetted LEP on 13 August 2010.
Balranald 2010 Yes No Gazetted LEP on 9 July 2010.
Berrigan 1992 No Yes Draft Strategic Plan / Draft LEP and Land Use Matrix almost completed.
Carrathool 1976 Yes Yes Preparing for section 65 certificate.
Conargo 1987, 1999 No Yes Rural Land Use Strategy completed. Consultation/exhibition set to com-mence.
Corowa 1989 Yes Yes Section 68 report.
Deniliquin 1997 No Yes Section 64 report to go to Council.
Greater Hume 1976, 1998 & 2001 Yes Yes Soon to be on public exhibition
Hay 1998 Yes Yes Section 65 Exhibition
Jerilderie 1993 No Yes Draft instrument prepared
Leeton 1983 Yes Yes Pre section 62
Murray 1998 Yes Yes Submitted S68 report
Narrandera 1991 Yes Yes Comprehensive strategy document and Planning proposal prepared with request for a Gateway Determination.
Wakool 1992 Yes Yes Between Land Use Strategy and pre-exhibition draft
Wentworth 1993 Yes Yes Currently with Parliamentary Counsel for determination. 1Sourced from relevant councils
Murrumbidgee 1994 N/A Yes Should go on public exhibition in November 2011
7.2
7.3 Development1
State The LGA with the greatest number of dwellings approved in 2010/11 was Albury, followed by Corowa and then Leeton. The LGAs with the least number of dwellings approved were Conargo and Jerilderie, Carrathool and Narrandera.
The LGA with the greatest number of subdivisions approved in 2010/11 was Albury, followed by Greater Hume, and then Wakool. The LGA with the least number of subdivisions approved was Jerilderie, Carrathool, Conargo and then Hay. Albury reported a significant decrease in new dwelling approved but minimal changes to the number of subdivisions approved. Wentworth and Leeton reported a significant increase in the number of new dwellings approved in their LGAs.
Pressure Additional dwellings increases the load on infrastructure and the environment. The ongoing global economic crisis and uncertainty have been identified as major contributors to a reduction in development in the report-ing period. Flooding also impacted construction in the region.
Response Councils require development applications accessing the environmental impact of developments to be submitted prior to works under-taken. Developments will not be allowed if they fail address the environmental issues. 1 Sourced from relevant councils
Table 16 - Development in 2010/111 LGA New
dwellings approved1
Subdivisions approved1
Designated dev/major projects 1
Retirement villages/aged
care dev1
Other public dev (schools,
hospitals)1
Significant events affecting development1
Albury 207 127 76 1 0 1 1 1 2 2 None
Balranald 23 4 14 3 1 1 1 1 4 3 Closure of timber harvesting industry has slowed development further.
Berrigan 41 1 7 0 0 2 6 None.
Carrathool 3 2 2 0 0 1 2 Reduction in drought conditions.
Conargo 1 1 3 1 0 0 0 None
Corowa 58 4 16 6 0 0 2 None.
Deniliquin 19 6 13 5 0 0 2 1 None,.
Greater Hume 45 2 28 11 0 0 13 7 Flooding
Hay 3 3 2 1 0 0 0 2 Seasonal conditions reducing disposable incomes
Jerilderie 1 1 1 0 0 1 Flooding
Leeton 42 12 13 3 0 0 1 1 None
Murray 46 11 10 0 1 1 1 2 2 None
Narrandera 3 2 7 2 0 0 0 Economic down turn.
Wakool 6 1 6 5 1 0 0 None
Wentworth 42 26 22 15 1 1 1 3 3 None 1Sourced from relevant councils
Murrumbidgee 3 1 0 0 0 Drought & flood
7.3
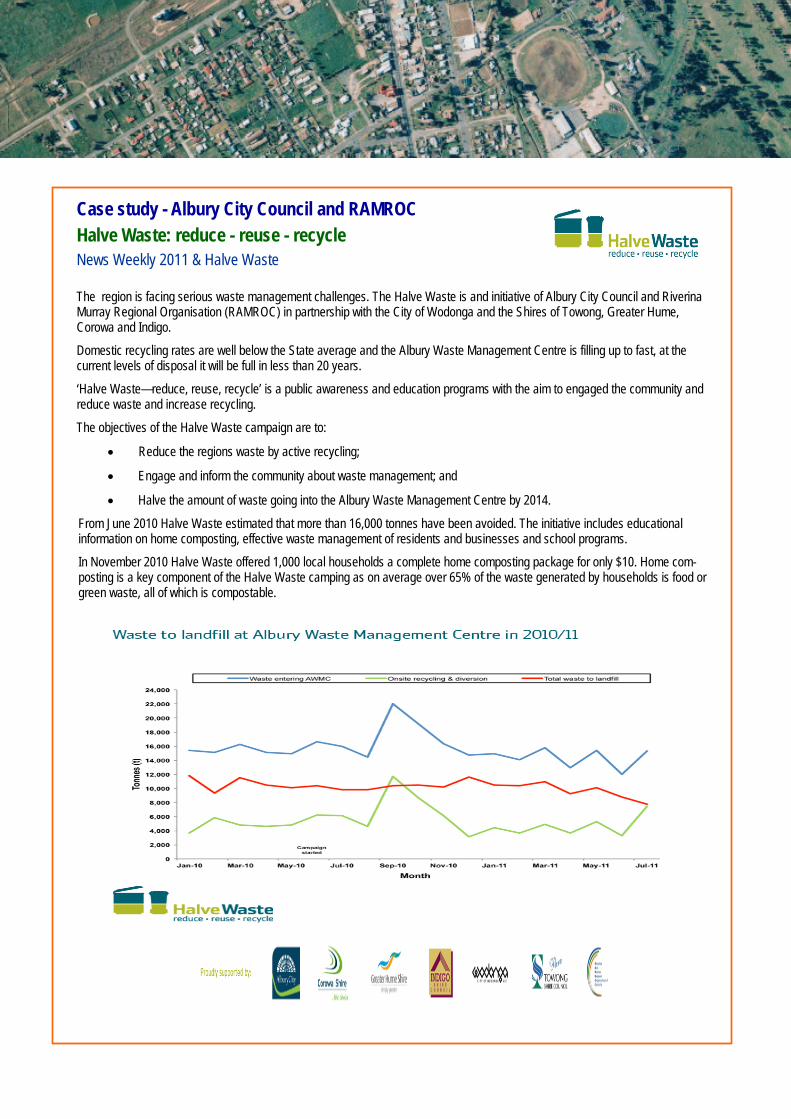
Case study - Albury City Council and RAMROC Halve Waste: reduce - reuse - recycle News Weekly 2011 & Halve Waste The region is facing serious waste management challenges. The Halve Waste is and initiative of Albury City Council and Riverina Murray Regional Organisation (RAMROC) in partnership with the City of Wodonga and the Shires of Towong, Greater Hume, Corowa and Indigo. Domestic recycling rates are well below the State average and the Albury Waste Management Centre is filling up to fast, at the current levels of disposal it will be full in less than 20 years.
‘Halve Waste—reduce, reuse, recycle’ is a public awareness and education programs with the aim to engaged the community and reduce waste and increase recycling.
The objectives of the Halve Waste campaign are to:
• Reduce the regions waste by active recycling;
• Engage and inform the community about waste management; and
• Halve the amount of waste going into the Albury Waste Management Centre by 2014.
From June 2010 Halve Waste estimated that more than 16,000 tonnes have been avoided. The initiative includes educational information on home composting, effective waste management of residents and businesses and school programs. In November 2010 Halve Waste offered 1,000 local households a complete home composting package for only $10. Home com-posting is a key component of the Halve Waste camping as on average over 65% of the waste generated by households is food or green waste, all of which is compostable.

7.4 Waste1 State Councils of varying sizes and resources run differing programs when it comes to disposal of waste (see Table 17). Some smaller councils choose to participate in regional programs, joining up with neighbouring LGAs to provide a service, while others are too remote to justify joint programs. Many councils in the RAMROC region cooperated in the ‘Halve Waste’ program to reduce the amount of waste produced by residents and Councils.
Pressure The continually growing population of the region requires more provision for waste management.
Response Councils are continually keeping track of waste and effluent and encourage the community to reduce, reuse and recycle.
Table 17 - Domestic waste management1 LGA Council
managed tip/WTS1
Tonnes to landfill 1
Change Domestic waste annual charge1
Change Illegal dumping
complaints1
Change
Albury Yes 181,622 2,110 $155 $27 74 14
Balranald Yes 800 200 $261 $15 0 -
Berrigan Yes 3,344 125 $233 $11.15 8 -
Carrathool Yes 301.76 55.74 $99 - 0 -
Conargo Yes 1,886.45 562.08 $0 - 2 -
Corowa Yes 5,872 2,842 $235 $35 2 -
Deniliquin Yes 6,700 1,216 $270 $7 1 1
Greater Hume Yes 5,000 - $185 - 25 25
Hay Yes 2,700 300 $185 $111.5 2 2
Jerilderie Yes (2) 100 900 $160 $5 0 1
Leeton Yes 5,430 830 $215.80 $5.2 3 2
Murray Yes 13,287 737 n/a - 5 1
Narrandera Yes 3,312 285 $218.4 n/a n/a -
Wakool Yes 1195 91 $207—240L $116—120L
$6 $3
0 3
Wentworth No 23,000 n/a $185 $3 6 2 1Sourced from relevant councils
Murrumbidgee Yes 87 - $88pa - 0 -
7.5
Case study—Power Saving Kits Power Saving Kits available from the libraries 9 July 2011
Berrigan Council Berrigan Council offered local residents to borrow power saving kits from the libraries. The power saving kits educated residents on the energy consumption as it measured and recorded energy use thought-out the home. The kit encourages residents to re-duce their energy consumption to save money and help the environment.
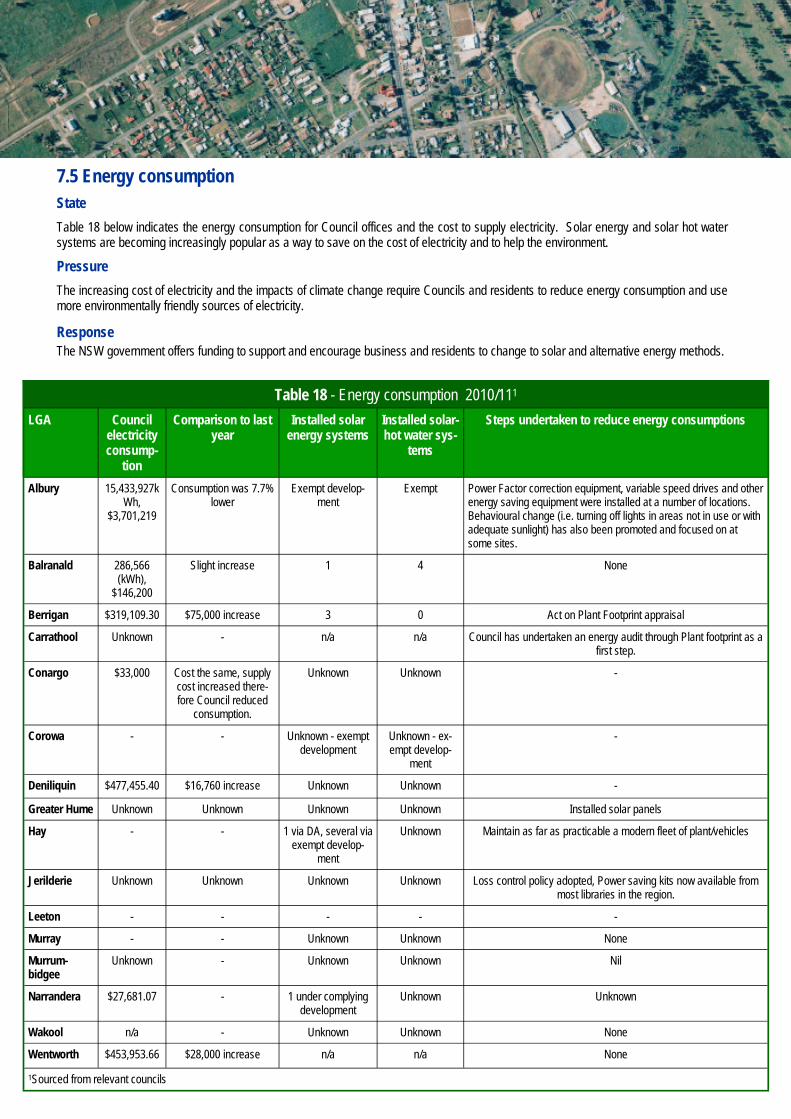
Table 18 - Energy consumption 2010/111 LGA Council
electricity consump-
tion
Comparison to last year
Installed solar energy systems
Installed solar-hot water sys-
tems
Steps undertaken to reduce energy consumptions
Albury 15,433,927kWh,
$3,701,219
Consumption was 7.7% lower
Exempt develop-ment
Exempt Power Factor correction equipment, variable speed drives and other energy saving equipment were installed at a number of locations. Behavioural change (i.e. turning off lights in areas not in use or with adequate sunlight) has also been promoted and focused on at some sites.
Balranald 286,566(kWh),
$146,200
Slight increase 1 4 None
Berrigan $319,109.30 $75,000 increase 3 0 Act on Plant Footprint appraisal
Carrathool Unknown - n/a n/a Council has undertaken an energy audit through Plant footprint as a first step.
Conargo $33,000 Cost the same, supply cost increased there-fore Council reduced
consumption.
Unknown Unknown -
Corowa - - Unknown - exempt development
Unknown - ex-empt develop-
ment
-
Deniliquin $477,455.40 $16,760 increase Unknown Unknown -
Greater Hume Unknown Unknown Unknown Unknown Installed solar panels
Hay - - 1 via DA, several via exempt develop-
ment
Unknown Maintain as far as practicable a modern fleet of plant/vehicles
Jerilderie Unknown Unknown Unknown Unknown Loss control policy adopted, Power saving kits now available from most libraries in the region.
Leeton - - - - -
Murray - - Unknown Unknown None
Narrandera $27,681.07 - 1 under complying development
Unknown Unknown
Wakool n/a - Unknown Unknown None
Wentworth $453,953.66 $28,000 increase n/a n/a None
1Sourced from relevant councils
Murrum-bidgee
Unknown - Unknown Unknown Nil
7.5 Energy consumption State Table 18 below indicates the energy consumption for Council offices and the cost to supply electricity. Solar energy and solar hot water systems are becoming increasingly popular as a way to save on the cost of electricity and to help the environment.
Pressure The increasing cost of electricity and the impacts of climate change require Councils and residents to reduce energy consumption and use more environmentally friendly sources of electricity.
Response The NSW government offers funding to support and encourage business and residents to change to solar and alternative energy methods.
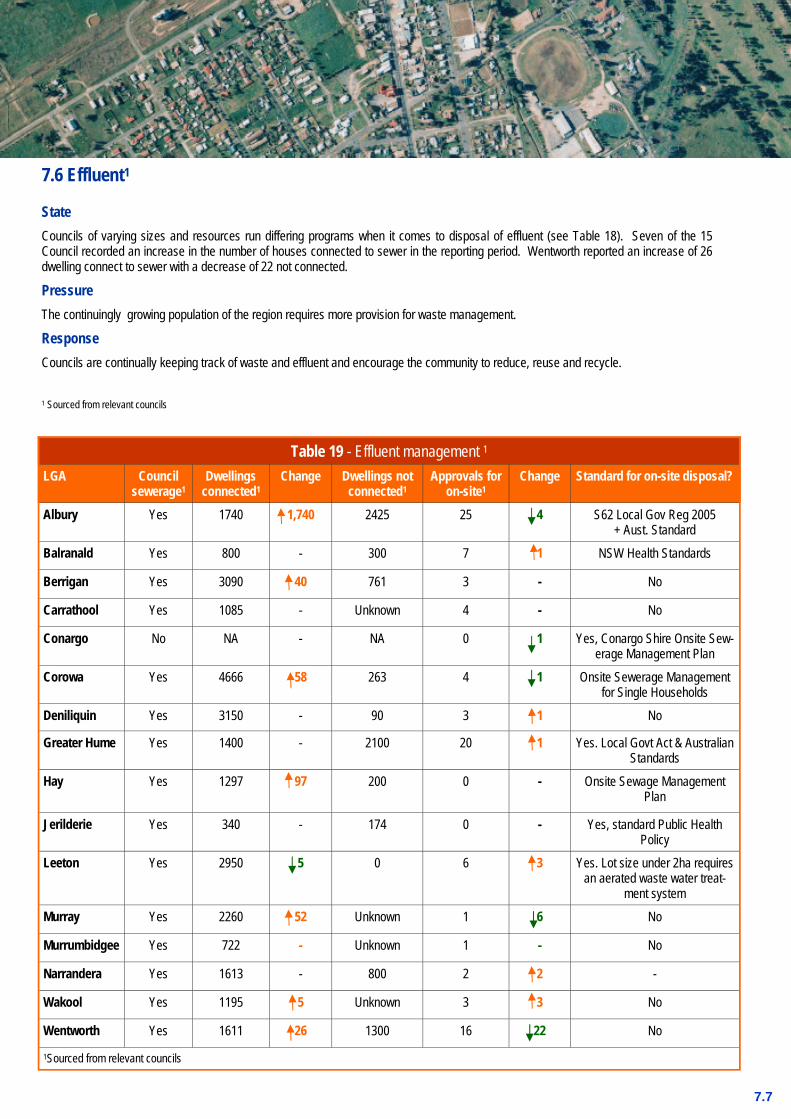
Table 19 - Effluent management 1 LGA Council
sewerage1 Dwellings
connected1 Change Dwellings not
connected1 Approvals for
on-site1 Change Standard for on-site disposal?
Albury Yes 1740 1,740 2425 25 4 S62 Local Gov Reg 2005 + Aust. Standard
Balranald Yes 800 - 300 7 1 NSW Health Standards
Berrigan Yes 3090 40 761 3 - No
Carrathool Yes 1085 - Unknown 4 - No
Conargo No NA - NA 0 1 Yes, Conargo Shire Onsite Sew-erage Management Plan
Corowa Yes 4666 58 263 4 1 Onsite Sewerage Management for Single Households
Deniliquin Yes 3150 - 90 3 1 No
Greater Hume Yes 1400 - 2100 20 1 Yes. Local Govt Act & Australian Standards
Hay Yes 1297 97 200 0 - Onsite Sewage Management Plan
Jerilderie Yes 340 - 174 0 - Yes, standard Public Health Policy
Leeton Yes 2950 5 0 6 3 Yes. Lot size under 2ha requires an aerated waste water treat-
ment system Murray Yes 2260 52 Unknown 1 6 No
Narrandera Yes 1613 - 800 2 2 -
Wakool Yes 1195 5 Unknown 3 3 No
Wentworth Yes 1611 26 1300 16 22 No
1Sourced from relevant councils
Murrumbidgee Yes 722 - Unknown 1 - No
7.7
7.6 Effluent1 State Councils of varying sizes and resources run differing programs when it comes to disposal of effluent (see Table 18). Seven of the 15 Council recorded an increase in the number of houses connected to sewer in the reporting period. Wentworth reported an increase of 26 dwelling connect to sewer with a decrease of 22 not connected.
Pressure The continuingly growing population of the region requires more provision for waste management.
Response Councils are continually keeping track of waste and effluent and encourage the community to reduce, reuse and recycle.
1 Sourced from relevant councils
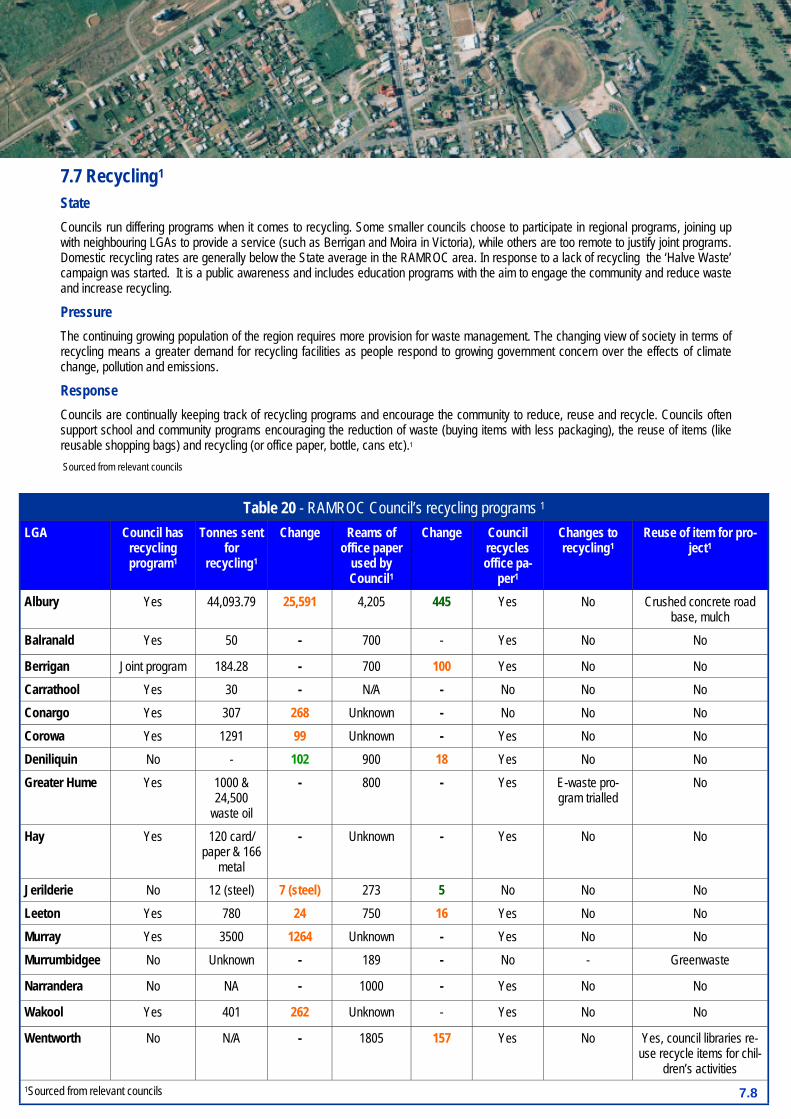
Table 20 - RAMROC Council’s recycling programs 1 LGA Council has
recycling program1
Tonnes sent for
recycling1
Change Reams of office paper
used by Council1
Change Council recycles office pa-
per1
Changes to recycling1
Reuse of item for pro-ject1
Albury Yes 44,093.79 25,591 4,205 445 Yes No Crushed concrete road base, mulch
Balranald Yes 50 - 700 - Yes No No
Berrigan Joint program 184.28 - 700 100 Yes No No Carrathool Yes 30 - N/A - No No No Conargo Yes 307 268 Unknown - No No No
Corowa Yes 1291 99 Unknown - Yes No No Deniliquin No - 102 900 18 Yes No No
Greater Hume Yes 1000 & 24,500
waste oil
- 800 - Yes E-waste pro-gram trialled
No
Hay Yes 120 card/paper & 166
metal
- Unknown - Yes No No
Jerilderie No 12 (steel) 7 (steel) 273 5 No No No
Leeton Yes 780 24 750 16 Yes No No Murray Yes 3500 1264 Unknown - Yes No No
Narrandera No NA - 1000 - Yes No No
Wakool Yes 401 262 Unknown - Yes No No
Wentworth No N/A - 1805 157 Yes No Yes, council libraries re-use recycle items for chil-
dren’s activities 1Sourced from relevant councils
Murrumbidgee No Unknown - 189 - No - Greenwaste
7.7 Recycling1 State Councils run differing programs when it comes to recycling. Some smaller councils choose to participate in regional programs, joining up with neighbouring LGAs to provide a service (such as Berrigan and Moira in Victoria), while others are too remote to justify joint programs. Domestic recycling rates are generally below the State average in the RAMROC area. In response to a lack of recycling the ‘Halve Waste’ campaign was started. It is a public awareness and includes education programs with the aim to engage the community and reduce waste and increase recycling.
Pressure The continuing growing population of the region requires more provision for waste management. The changing view of society in terms of recycling means a greater demand for recycling facilities as people respond to growing government concern over the effects of climate change, pollution and emissions.
Response Councils are continually keeping track of recycling programs and encourage the community to reduce, reuse and recycle. Councils often support school and community programs encouraging the reduction of waste (buying items with less packaging), the reuse of items (like reusable shopping bags) and recycling (or office paper, bottle, cans etc).1
Sourced from relevant councils
7.8
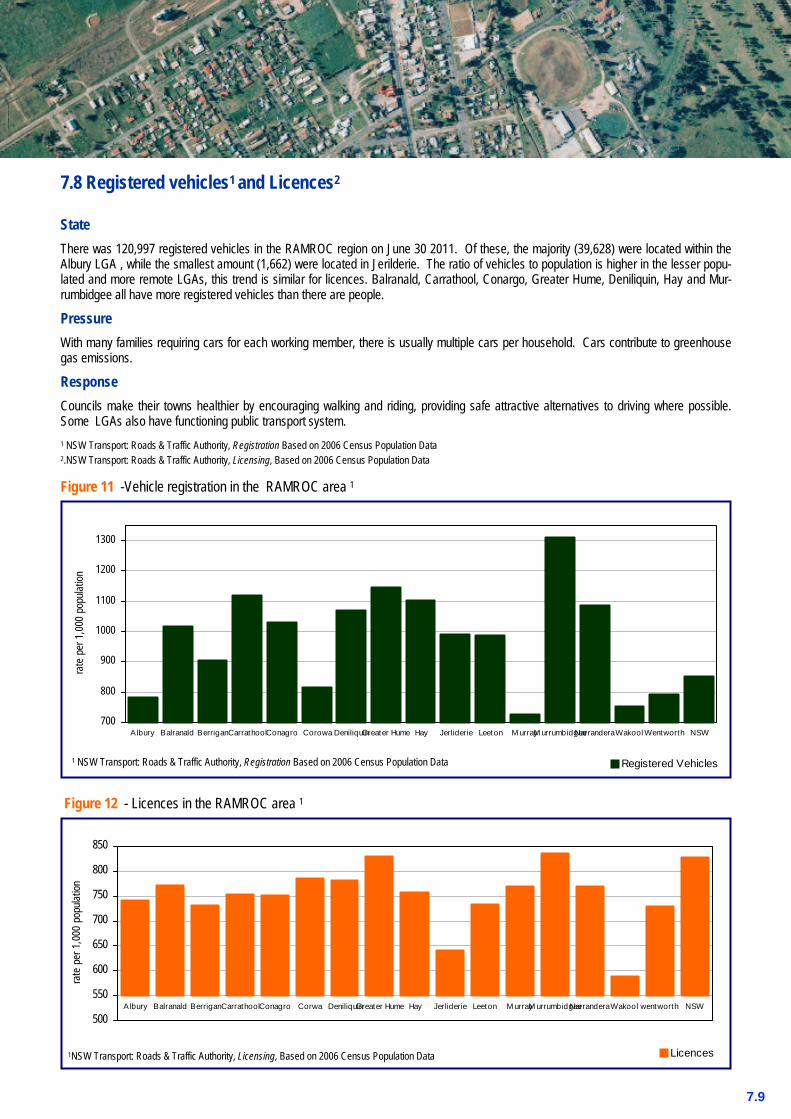
7.8 Registered vehicles1 and Licences2
State There was 120,997 registered vehicles in the RAMROC region on June 30 2011. Of these, the majority (39,628) were located within the Albury LGA , while the smallest amount (1,662) were located in Jerilderie. The ratio of vehicles to population is higher in the lesser popu-lated and more remote LGAs, this trend is similar for licences. Balranald, Carrathool, Conargo, Greater Hume, Deniliquin, Hay and Mur-rumbidgee all have more registered vehicles than there are people.
Pressure With many families requiring cars for each working member, there is usually multiple cars per household. Cars contribute to greenhouse gas emissions.
Response Councils make their towns healthier by encouraging walking and riding, providing safe attractive alternatives to driving where possible. Some LGAs also have functioning public transport system. 1 NSW Transport: Roads & Traffic Authority, Registration Based on 2006 Census Population Data 2.NSW Transport: Roads & Traffic Authority, Licensing, Based on 2006 Census Population Data
7.9
700
800
900
1000
1100
1200
1300
Albury Balranald BerriganCarrathoolConagro Corowa DeniliquinGreater Hume Hay Jerliderie Leeton M urrayM urrumbidgeeNarranderaWakool Wentworth NSW
rate
per
1,0
00 p
opula
tion
Registered Vehicles
Figure 11 -Vehicle registration in the RAMROC area 1
500
550
600
650
700
750
800
850
Albury Balranald BerriganCarrathoolConagro Corwa DeniliquinGreater Hume Hay Jerliderie Leeton M urrayM urrumbidgeeNarranderaWakool wentworth NSW
rate
per
1,0
00 p
opula
tion
Licences
Figure 12 - Licences in the RAMROC area 1
1 NSW Transport: Roads & Traffic Authority, Registration Based on 2006 Census Population Data
1NSW Transport: Roads & Traffic Authority, Licensing, Based on 2006 Census Population Data
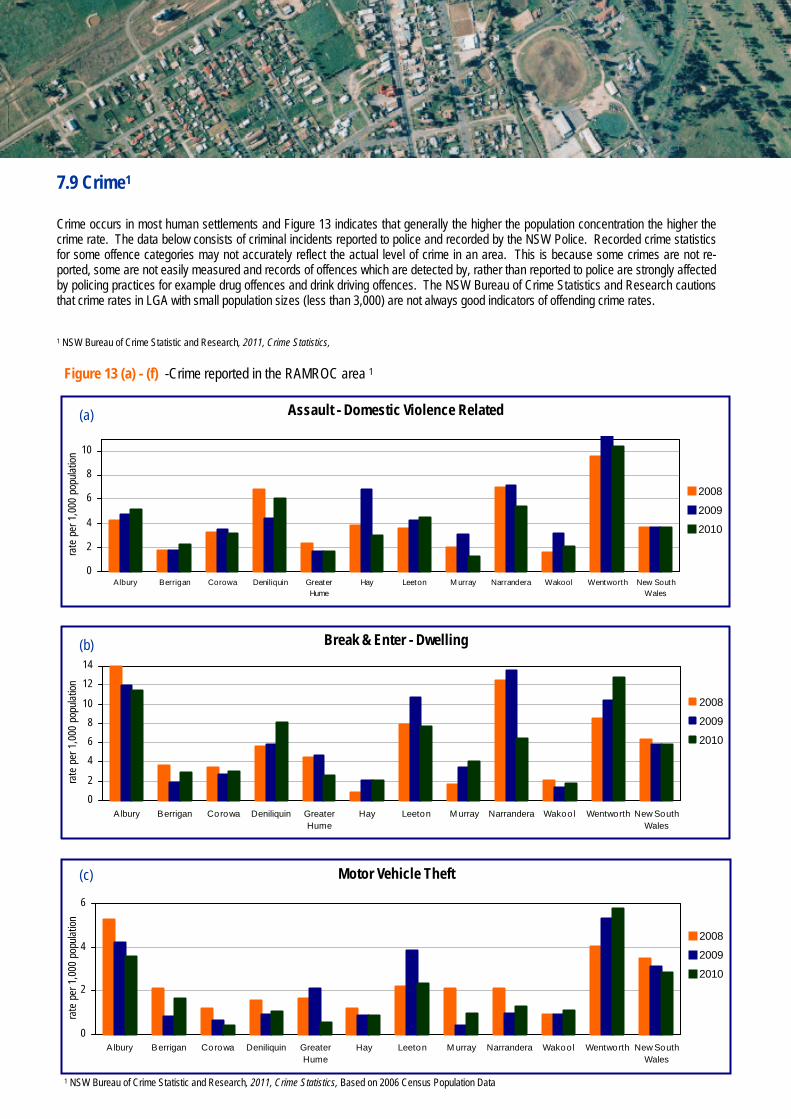
7.9 Crime1
Crime occurs in most human settlements and Figure 13 indicates that generally the higher the population concentration the higher the crime rate. The data below consists of criminal incidents reported to police and recorded by the NSW Police. Recorded crime statistics for some offence categories may not accurately reflect the actual level of crime in an area. This is because some crimes are not re-ported, some are not easily measured and records of offences which are detected by, rather than reported to police are strongly affected by policing practices for example drug offences and drink driving offences. The NSW Bureau of Crime Statistics and Research cautions that crime rates in LGA with small population sizes (less than 3,000) are not always good indicators of offending crime rates.
1 NSW Bureau of Crime Statistic and Research, 2011, Crime Statistics,
Assault - Domestic Violence Related
0
2
4
6
8
10
Albury Berrigan Corowa Deniliquin GreaterHume
Hay Leeton M urray Narrandera Wakool Wentworth New SouthWales
rate
per
1,0
00 p
opula
tion
2008
2009
2010
Break & Enter - Dwelling
02
468
10
1214
Albury Berrigan Corowa Deniliquin GreaterHume
Hay Leeton M urray Narrandera Wakool Wentworth New SouthWales
rate
per
1,0
00 p
opula
tion
2008
2009
2010
Figure 13 (a) - (f) -Crime reported in the RAMROC area 1
Motor Vehicle Theft
0
2
4
6
Albury Berrigan Corowa Deniliquin GreaterHume
Hay Leeton M urray Narrandera Wakool Wentworth New SouthWales
rate
per
1,0
00 p
opula
tion
2008
2009
2010
(a)
(b)
(c)
1 NSW Bureau of Crime Statistic and Research, 2011, Crime Statistics, Based on 2006 Census Population Data
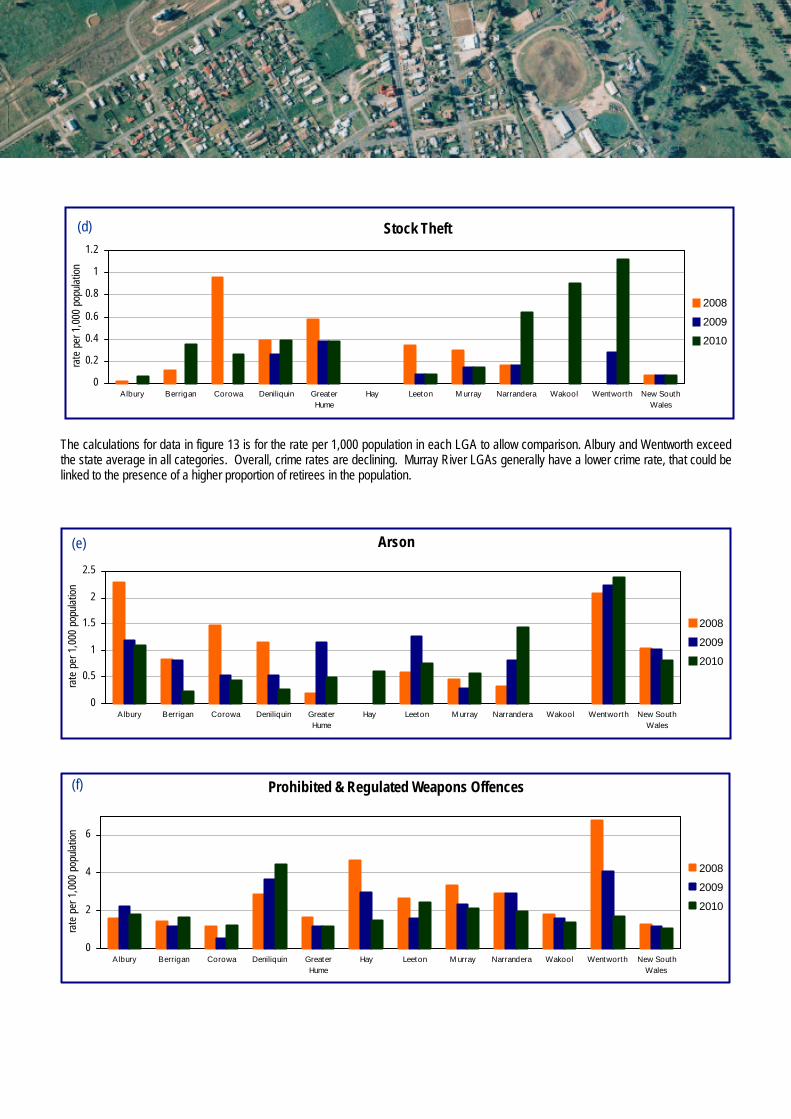
0
0.2
0.4
0.6
0.8
1
1.2
Albury Berrigan Corowa Deniliquin GreaterHume
Hay Leeton M urray Narrandera Wakool Wentworth New SouthWales
rate
per
1,0
00 p
opula
tion
2008
2009
2010
Stock Theft
Arson
0
0.5
1
1.5
2
2.5
Albury Berrigan Corowa Deniliquin GreaterHume
Hay Leeton M urray Narrandera Wakool Wentworth New SouthWales
rate
per
1,0
00 p
opula
tion
2008
2009
2010
Prohibited & Regulated Weapons Offences
0
2
4
6
Albury Berrigan Corowa Deniliquin GreaterHume
Hay Leeton M urray Narrandera Wakool Wentworth New SouthWales
rate
per
1,0
00 p
opula
tion
2008
2009
2010
The calculations for data in figure 13 is for the rate per 1,000 population in each LGA to allow comparison. Albury and Wentworth exceed the state average in all categories. Overall, crime rates are declining. Murray River LGAs generally have a lower crime rate, that could be linked to the presence of a higher proportion of retirees in the population.
(d)
(e)
(f)
8.1
8.1 Heritage items1
State The number of heritage listings for each LGA is on the following page. Note that the Heritage Branch website may not include recent list-ings, also some councils are in the process of constructing new LEPs that may include or remove some items. In some cases a substan-tial number of items have been added to heritage schedules. Local and State heritage items are not hierarchical with one being more important than the other. Instead, they are complementary and indicate the contextual relationship of the significance of the item. It is about context not rank. The significance is relative to the community of interest associated with an item.
No damage or vandalism was report to a heritage item in the RAMOC region in this reporting period.
Albury has reported 12 alterations made to heritage items during which included ten alterations and two partial demolitions. A number of LGAs do not know if there has been any alterations or demolitions, or damage to any heritage items during the reporting pe-riod.
Pressure Damage to heritage items can occur though the following ways;
Response Identification of important items through heritage studies, protection of items through legislation and funding for heritage projects/maintenance can all attribute to the ongoing protection of items of heritage significance.
1 NSW Office of Environment and Heritage, 2011, NSW Heritage
• Demolition for new development • Wear and tear • Natural hazards (flood, fire etc.) • Nearby unflattering development • Alterations/unflattering improvements
• Graffiti/vandalism • Accidental damage • Neglect • Pests/animal damage
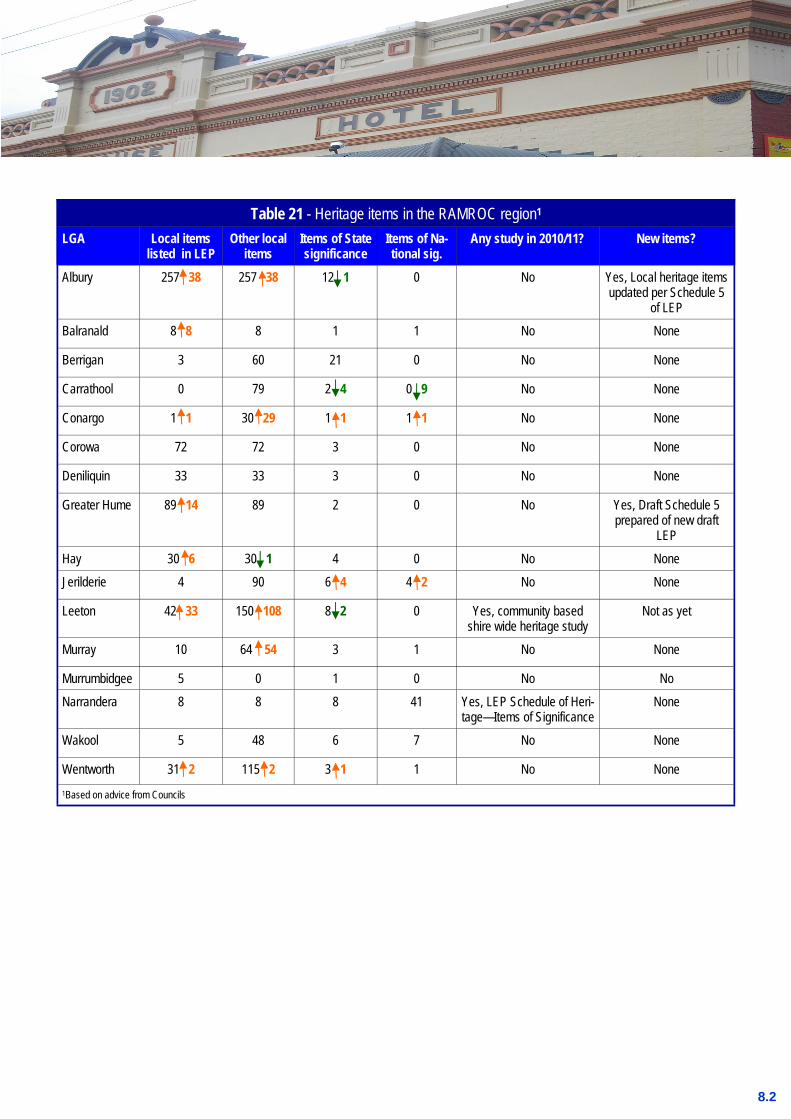
Table 21 - Heritage items in the RAMROC region1 LGA Local items
listed in LEP Other local
items Items of State significance
Items of Na-tional sig.
Any study in 2010/11? New items?
Albury 257 38 257 38 12 1 0 No Yes, Local heritage items updated per Schedule 5
of LEP Balranald 8 8 8 1 1 No None
Berrigan 3 60 21 0 No None
Carrathool 0 79 2 4 0 9 No None
Conargo 1 1 30 29 1 1 1 1 No None
Corowa 72 72 3 0 No None
Deniliquin 33 33 3 0 No None
Greater Hume 89 14 89 2 0 No Yes, Draft Schedule 5 prepared of new draft
LEP
Hay 30 6 30 1 4 0 No None
Jerilderie 4 90 6 4 4 2 No None
Leeton 42 33 150 108 8 2 0 Yes, community based shire wide heritage study
Not as yet
Murray 10 64 54 3 1 No None
Narrandera 8 8 8 41 Yes, LEP Schedule of Heri-tage—Items of Significance
None
Wakool 5 48 6 7 No None
Wentworth 31 2 115 2 3 1 1 No None 1Based on advice from Councils
Murrumbidgee 5 0 1 0 No No
8.2

8.2 Aboriginal items1
Aboriginal heritage consists of those places and objects that contribute to the story of Aboriginal people in NSW. It can help identify the links that places may have with each other and their cultural significance. Aboriginal people moved around NSW and passed on stories, information and knowledge by going to these special places.
Aboriginal heritage includes places and items that are important to the local Aboriginal community or to Aboriginal people of NSW. These are places or objects that people have a connection to, both physically and spiritually. Aboriginal heritage can include natural features such as creeks or mountains, ceremonial or story places or areas of more contemporary cultural significance such as Aboriginal missions or post contact sites.
State The details of Aboriginal heritage listings for each LGA is listed in the Table 22.
Pressure1
Damage to heritage items can occur though the following ways:
Response Identification of important items through heritage studies, protection of items through legislation and funding for heritage projects/maintenance can all attribute to the ongoing protection of items of heritage significance. 1 NSW Office of Environment and Heritage, 2011, NSW Heritage
• Demolition for new development • Wear and tear • Natural hazards (flood, fire etc.)
• Graffiti/vandalism • Nearby unflattering development • “Trophy” hunters
• Accidental damage • Neglect • Pests/animal damage
Table 22- Aboriginal heritage items within RAMROC LGAs1 LGA Known Aboriginal items New archaeological items in 2010/11? Albury Unknown Yes, due diligence assessment for the construction of the Wagirra
Trail: Horseshoe Lagoon to Waterview Rd
Balranald 108 (DECCW AHIMS database) No
Berrigan Unknown No
Carrathool 4 No
Conargo 0 No
Corowa Unknown No
Deniliquin Nil No
Greater Hume 19 Culcairn (AHIMS) 14 Henty (AHIMS)
10 Jindera (AHIMS) 1 Walla Wall (AHIMS)
6 Burrumbuttock (AHIMS)
Yes. RTA Woomargama and Holbrook by-pass study
Hay 322 (AHIMS) Yes. Riparian area study around Hay township in conjunction with Hay Town Flood Levee Project
Jerilderie Unknown No
Leeton 1 No
Murray Unknown No
Murrumbidgee 1 Darlington Inn site
Narrandera 1 No
Wakool Unknown Unknown
Wentworth 8 No 1 Sourced form relevant Councils 8.3
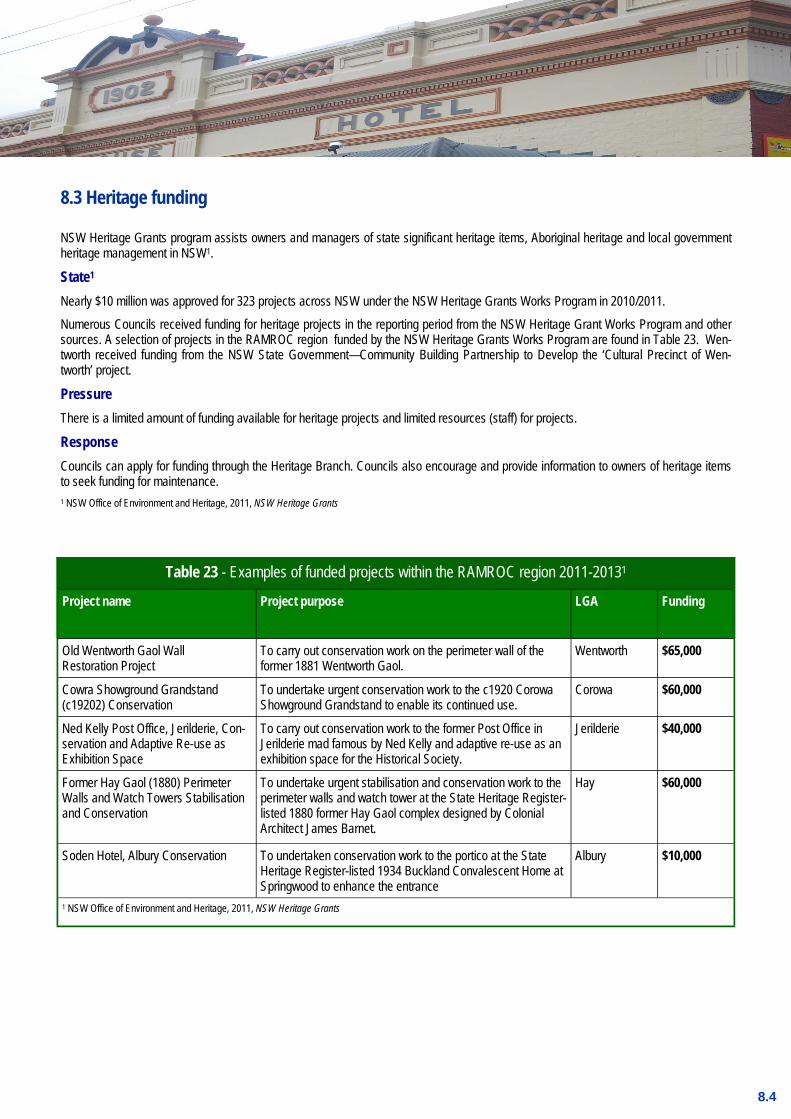
8.3 Heritage funding NSW Heritage Grants program assists owners and managers of state significant heritage items, Aboriginal heritage and local government heritage management in NSW1.
State1
Nearly $10 million was approved for 323 projects across NSW under the NSW Heritage Grants Works Program in 2010/2011. Numerous Councils received funding for heritage projects in the reporting period from the NSW Heritage Grant Works Program and other sources. A selection of projects in the RAMROC region funded by the NSW Heritage Grants Works Program are found in Table 23. Wen-tworth received funding from the NSW State Government—Community Building Partnership to Develop the ‘Cultural Precinct of Wen-tworth’ project.
Pressure There is a limited amount of funding available for heritage projects and limited resources (staff) for projects.
Response Councils can apply for funding through the Heritage Branch. Councils also encourage and provide information to owners of heritage items to seek funding for maintenance. 1 NSW Office of Environment and Heritage, 2011, NSW Heritage Grants
Table 23 - Examples of funded projects within the RAMROC region 2011-20131
Project name Project purpose LGA Funding
Old Wentworth Gaol Wall Restoration Project
To carry out conservation work on the perimeter wall of the former 1881 Wentworth Gaol.
Wentworth $65,000
Cowra Showground Grandstand (c19202) Conservation
To undertake urgent conservation work to the c1920 Corowa Showground Grandstand to enable its continued use.
Corowa $60,000
Ned Kelly Post Office, Jerilderie, Con-servation and Adaptive Re-use as Exhibition Space
To carry out conservation work to the former Post Office in Jerilderie mad famous by Ned Kelly and adaptive re-use as an exhibition space for the Historical Society.
Jerilderie $40,000
Former Hay Gaol (1880) Perimeter Walls and Watch Towers Stabilisation and Conservation
To undertake urgent stabilisation and conservation work to the perimeter walls and watch tower at the State Heritage Register-listed 1880 former Hay Gaol complex designed by Colonial Architect James Barnet.
Hay $60,000
Soden Hotel, Albury Conservation To undertaken conservation work to the portico at the State Heritage Register-listed 1934 Buckland Convalescent Home at Springwood to enhance the entrance
Albury $10,000
1 NSW Office of Environment and Heritage, 2011, NSW Heritage Grants
8.4

• Australian Bureau of Statistics, 2011, 2006 Census, dataset downloaded September 2011.
• Australian Commonwealth Scientific and Industrial Research Organisation, 2001, Australia State of the Environment Report 2001—Theme report—Human Settlements, Published by CSIRO on behalf of the Dept. of the Environment and Heritage.
• Australian Government: Bureau of Meteorology, 2011, Climate Data Online, multiple regions, period July 2010 to June 2011, viewed online September 2011.
• Australian Government: Bureau of Meteorology, 2011, Climate, viewed online September 2011.
• Blair Thomson, 2011, Waste Campaign having success, News Weekly
• Corowa Shire Council, 2011, Councils take action to combat a future with less water, viewed online September 2011
• Department of Environment and Conservation, 2011, Priority and threat abatement—priority actions, Threatened Species home-page, viewed online September 2011
• Department of Local Government, 1999, Environmental Guidelines—State of the Environment Reporting by Local Government, PDF, downloaded September 2011.
• Geoscience Australia, 2011, Hazards, viewed online September 2011
• Halve Waste, 2011, Halve Waste: Reduce, Reuse, Recycle, viewed online September 2011
• Murray Darling Basin Authority, 2011, Murray Darling Basin Plan, viewed online September 2011
• National Parks Association of NSW, 2010, Murray River/Corowa Wetland National Green Job Corps Program in Cowra
• National Parks Association of NSW, 2010, Protected at last: state’s newest national parks created in Western NSW
• NSW Bureau of Crime Statistic and Research, 2011, Crime Statistics, viewed online September 2011
• NSW Department of Primary Industries (DPI), 2011, Pests and Weed Management, viewed online September 2011
• NSW Department of Primary Industries (DPI), ERNWAG & WRNWAG, Murray Catchment Authority, 2008, Regional Weed Strat-egy—Murray Catchment,
• NSW Division of Local Government: Department of Premier & Cabinet, 2011, Local Government Directory, viewed online Septem-ber 2011
• NSW Government , 2011, Draft New South Wales Biodiversity Strategy, 2010-2015NSW Government, 2010, Media Release: Al-bury LEP Approved, viewed October 2011
• NSW Industry and Investment, 2011, Drought Maps 2000—2011, viewed online September 2011
• NSW Office of Environment & Heritage, Protected Areas, viewed online September 2011
• NSW Office of Environment & Heritage, 2011, Final determinations by date, viewed online September 2011
• NSW Office of Environment and Heritage, 2011, NSW Heritage, , viewed September 2011
• NSW Office of Environment and Heritage, 2011, NSW Heritage Grants, viewed online September 2011
i
• NSW Office of Environment and Heritage, 2011, Environmental Issues, viewed online September 2011
• NSW Office of Environment & Heritage, 2011, Key threatening processes, viewed online September 2011
• NSW Office of Environment & Heritage, 2011, Atlas of NSW Wildlife, viewed online September 2011
• NSW Office of Environment & Heritage , 2011, Preliminary determinations by date, viewed September 2011
• NSW Planning & Infrastructure, 2011, Local Planning, viewed online September 2011
• NSW Planning & Infrastructure, 2011, Fact Sheet: Removing coastal subdivision and residential commercial & retail developments from Part 3A, viewed online September 2011
• NSW Transport: Roads & Traffic Authority, Licensing, viewed online September 2011
• NSW Transport: Roads & Traffic Authority, Registration, viewed online September 2011
• NSW Water Information, 2010, Water storage levels, viewed online September 2011
• RAMROC Councils, Response to 2010/11 Supplementary SoE Questionnaire, unpublished document, Habitat Planning, Albury NSW.
ii