run better - sap
TRANSCRIPT
���������������� ����–��������������
RUN BETTER
The Best-Run Businesses Run SAP®
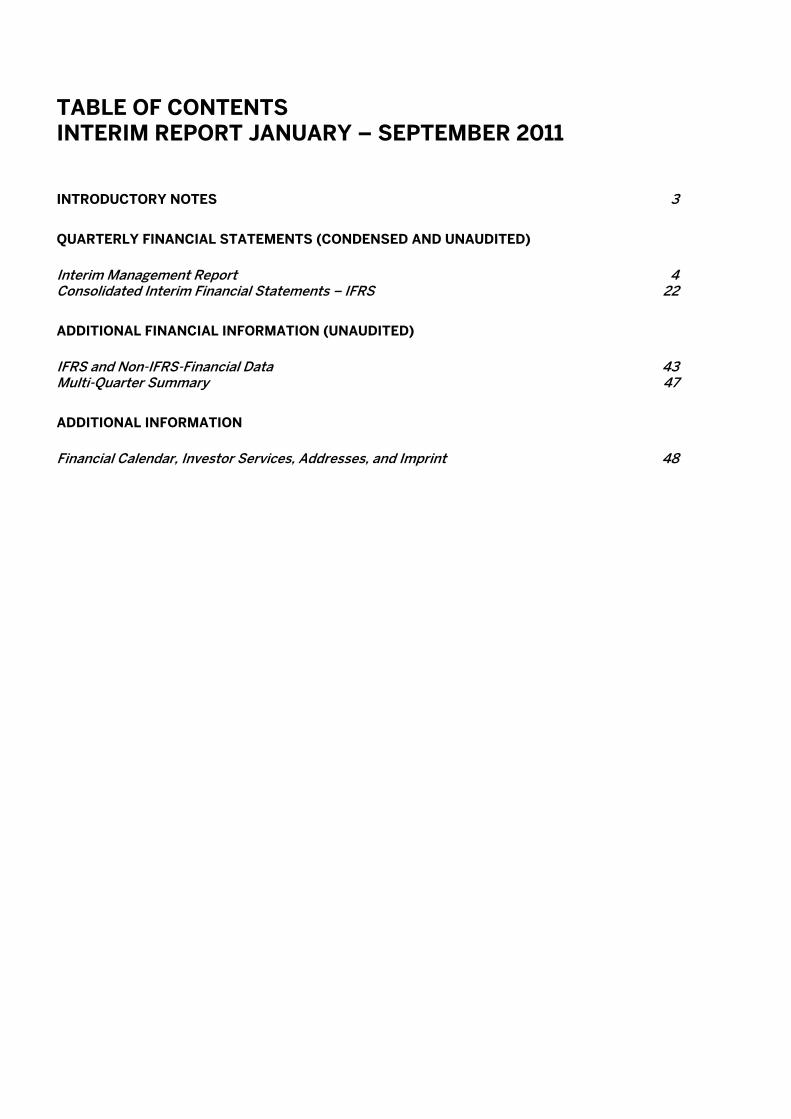
TABLE OF CONTENTS INTERIM REPORT JANUARY – SEPTEMBER 2011
INTRODUCTORY NOTES 3 QUARTERLY FINANCIAL STATEMENTS (CONDENSED AND UNAUDITED) Interim Management Report 4 Consolidated Interim Financial Statements – IFRS 22 ADDITIONAL FINANCIAL INFORMATION (UNAUDITED) IFRS and Non-IFRS-Financial Data 43 Multi-Quarter Summary 47 ADDITIONAL INFORMATION Financial Calendar, Investor Services, Addresses, and Imprint 48
3
Introductory Notes This interim group report meets the requirements of German Accounting Standard No. 16 “Zwischenberichterstattung” (DRS 16). We prepared the financial data in the “Quarterly Financial Statements (Condensed and Unaudited)” section for SAP AG and its subsidiaries in accordance with International Financial Reporting Standards (IFRSs) of the International Accounting Standards Board (IASB) and the respective interpretations by the International Financial Reporting Interpretations Committee (IFRIC) endorsed by the European Union (EU) up to September 30, 2011. For additional IFRS and non-IFRS information, see the “Additional Financial Information (Unaudited)” section. All of the information in this interim group report is unaudited. This means the information has been subject neither to any audit nor to any review by an independent auditor.
4 INTERIM REPORT JANUARY – SEPTEMBER 2011
INTERIM MANAGEMENT REPORT FORWARD-LOOKING STATEMENTS This interim financial report contains forward-looking statements and information based on the beliefs of, and assumptions made by, our management using information currently available to them. Any statements contained in this interim financial report that are not historical facts are forward-looking statements as defined in the U.S. Private Securities Litigation Reform Act of 1995. We have based these forward-looking statements on our current expectations, assumptions, and projections about future conditions and events. As a result, our forward-looking statements and information are subject to uncertainties and risks, many of which are beyond our control. If one or more of these uncertainties or risks materializes, or if management‘s underlying assumptions prove incorrect, our actual results could differ materially from those described in or inferred from our forward-looking statements and information. We describe these risks and uncertainties in the “Risk and Opportunity Management” section, respectively in the there mentioned sources. The words “aim,” “anticipate,” “assume,” “believe,” “continue,” “could,” “counting on,” “development,”“is confident,” “estimate,” “expect,” “forecast,””future trends,” “guidance,” “intend,” “may,” “outlook,” “plan,” “project,” “predict,” “seek,” “should,” “strategy,” “want,” “will,” “would,” and similar expressions as they relate to us are intended to identify such forward-looking statements. Such statements include, for example, those made in the “Operating Results” section, the “Risk and Opportunity Management” section, our “Forecast for SAP”, and other forward-looking information appearing in other parts of this interim financial report. To fully consider the factors that could affect our future financial results both our Annual Report for December 31, 2010, and Annual Report on Form 20-F for December 31, 2010, should be considered, as well as all of our other filings with the Securities and Exchange Commission (SEC). Readers are cautioned not to place undue reliance on these forward-looking statements, which speak only as of the date specified or the date of this report. Except where legally required, we undertake no obligation to publicly update or revise any forward-looking statements as a result of new information that we receive about conditions that existed upon issuance of this report, future events, or otherwise unless we are required to do so by law.
All of the information in this report relates to the situation on September 30, 2011, or the quarter ended on that date unless otherwise stated. NON-IFRS FINANCIAL INFORMATION We present and discuss the reconciliation of non-IFRS measures to IFRS measures in the “Additional Financial Information (Unaudited)” section. For more information about non-IFRS measures, see www.sap.com/corporate-en/investors/reports.
INTERIM MANAGEMENT REPORT 5
ECONOMIC CONDITIONS Global Economic Trends The global economy continued to expand in the third quarter of 2011, although at a slower pace. The slowdown was far more significant in the advanced economies than in the emerging and developing economies. That is the conclusion reached by organizations such as the European Central Bank (ECB), the Organization for Economic Co-operation and Development (OECD), and the International Monetary Fund (IMF). They ascribe this trend to continuing high levels of indebtedness and unemployment in the leading industrial nations, the worldwide effects of the natural and nuclear disasters in Japan, and the dampening impact of high commodity prices. The situation in the Europe, Middle East, and Africa (EMEA) region was characterized by the weakening economy of the euro area caused by continuous pressure on the European securities markets. In particular, talk of the Greek government’s defaulting on its debt and the possibility that Greece might withdraw from the euro area depressed the markets. In the Middle East and North Africa, political unrest also held back economic progress. In the Americas region, economic growth was slower in the third quarter than it had been at the beginning of 2011. But, the recovery in the United States continued slower as expected, Factors holding back the recovery included rising commodity prices, a decline in consumer spending, and export shipments canceled because of the earthquake in Japan. U.S. public-sector budgetary concerns led to mark down the rating of U.S. government bonds in the beginning of August, a factor that also held back recovery. With little to hold them back, emerging economies in the Asia Pacific Japan (APJ) region continued to expand during the quarter. The Japanese economy proved more resilient than the markets expected after the terrible earthquake in March. Nonetheless, growth slowed in the third consecutive quarter. The IT Market Despite the difficult business climate in some regions, global investment in all IT segments has continued to show strong growth so far in 2011, albeit not quite at the level seen last year. This is the view of International Data Corporation (IDC), a market research organization based in the United States, in its latest sector report. However, regional analysis shows noticeable differences.
In the EMEA region, the deteriorating economic situation in Europe has had a growing impact on the IT market over the course of 2011, IDC reports. Consumers and businesses have less confidence in the stability of the economy and their plans for the future, so increasingly they were holding back investments in IT. The German IT market was an exception in the first three quarters, producing growth slightly above the EMEA region average and so leading Western Europe alongside France. By contrast, according to IDC unhelpful economic conditions have had little impact on the IT market in the Americas region so far in 2011. The software segment in particular has proved resilient. Within the region, the market for IT has expanded more slowly in the United States than in the Latin American countries. The IT market in the APJ region was divided in the first three quarters of 2011: The front runners were the Asian emerging economies, above all China and India, where the IT market produced almost unbridled growth. Japan, by contrast, suffered a severe setback with the environmental disasters in March 2011, from which the Japanese IT market was unable to recover by the end of the third quarter. MISSION AND STRATEGY In the first nine months of 2011, we had no changes in our mission or our strategy. For a detailed description of our mission and strategy, see page 68 and the subsequent pages in our 2010 Annual Report and item 4 in our 2010 Annual Report on Form 20-F.
6 INTERIM REPORT JANUARY – SEPTEMBER 2011
PORTFOLIO OF SOFTWARE AND SERVICES In the first nine months of 2011, we made the following enhancements to our portfolio of software and services. For a detailed description of our portfolio of software and services, see page 72 and the subsequent pages in our 2010 Annual Report and item 4 in our 2010 Annual Report on Form 20-F. On Premise Development in the third quarter At SAP TechEd Las Vegas in September, we announced two new solutions built on the SAP HANA platform: SAP Smart Meter Analytics software powered by SAP HANA and SAP CO-PA Accelerator. Utility companies today face an exponential increase in data volume generated by smart meters. SAP Smart Meter Analytics, powered by SAP HANA, aims to help utility companies to instantly turn this “big data” into powerful insights that they can use to develop more tailored customer offerings and support our customers to design their use of energy more sustainable. SAP CO-PA Accelerator software aims to improve the speed and depth of working with large volumes of financial data. For example, the software will enable corporate finance departments to perform real-time profitability reporting on large-scale data volumes and run cost allocations at significantly faster processing time. In September we also announced the global general availability of solutions from the SAP Business Objects portfolio, including the 4.0 releases of business intelligence (BI) and enterprise information management (EIM) solutions. They are designed to provide companies with the best possible tools for analyzing large volumes of data from within and outside of their businesses to come to informed decisions. In the same month we also announced the general availability of the 10.0 release of SAP Business Objects governance, risk, and compliance (GRC) solutions. We presented this new release in the first quarter. It can be used by companies to manage, monitor, and analyze their risks in a single, unified environment. The new release integrates GRC capabilities into everyday business processes, making risk management, regulatory compliance, and safe, productive operations a standard and a consistent practice. In July we announced our collaboration with Google to help customers manage large data volumes in intuitive, visual displays and facilitate faster, more-informed decisions. SAP will enhance its business
analytics software with location-based data capabilities, allowing people to interact with real-time information via Google Maps. Development in the previous quarters In June, we announced the general availability of SAP HANA, originally presented in spring 2010, heralding a new generation of analytics, business applications, and IT simplification with SAP in-memory computing technology. At SAPPHIRE NOW in May, we announced general availability of “Innovations 2010” enhancement packages across all core SAP Business Suite 7 applications, which enable customers to switch on new software features for unique industry and line-of-business processes, without disrupting operations to undergo system upgrades. We also announced the 10.0 release of enterprise performance management (EPM) solutions – software that helps companies ensure decisions and actions are aligned with business aims. Also in the first quarter, we announced the SAP Social Services Management for Public Sector package, a new solution to help improve disbursement processes for monetary social benefits. The software is designed for government agencies at the federal, state, and local level that are tasked with administering and approving monetary benefits as they relate to social services. In January, we launched the SAP Billing for Telecommunications package, an integrated solution designed to cover the widespread demands and service portfolios of communications service providers (CSPs) globally. Building on the acquisitions of software companies Highdeal and Sybase, the solution marks a new step in enabling CSPs to launch and monetize next-generation service offerings. On Demand Development in the third quarter In August we announced the general availability of the second release of the SAP Business ByDesign solution in 2011, including extended availability for Australia and Mexico, and language support for Spanish. In July we announced general availability of the SAP Sales OnDemand solution in Austria, Canada, Germany, Ireland, Switzerland, the United Kingdom and the United States. The solution is designed from the ground up with the input of customers’ sales professionals in order to specifically support the way they work and help them sell more effectively.
INTERIM MANAGEMENT REPORT 7
Development in the previous quarters In April, SAP marked a milestone in its product road map for on-demand applications that quickly and easily add on to customers’ on-premise software installations. A cloud-based e-commerce solution from SAP partners for companies running SAP Business All-in-One sets up SMEs with an e-commerce site that is hosted in the cloud. Web orders are processed alongside traditional sales channels in the SAP back end. At CeBIT in the first quarter, we announced a new class of on-demand software solutions that include packaged integration into SAP Business Suite. They apply mobile and social networking technologies to give better support for the way people work today anytime, anywhere. As the linchpin of SAP’s cloud strategy, the SAP Business ByDesign solution is the platform on which this new line of applications is built. In February, we announced feature pack 2.6 for SAP Business ByDesign, a major update in our portfolio of on-demand solutions. The new release serves as an open platform on which a broad ecosystem of partners can further customize the software, and on which SAP will develop new on-demand offerings for various lines of business. On Device Development in the third quarter In September we announced the general availability of the SAP EAM Work Order mobile app, on which online and offline functionalities let technicians manage work orders on their devices even without network connectivity. Companies can extend the value of existing enterprise applications. Also in September, at SAP TechEd, SAP and Sybase premiered interface support for Apple’s App Store Volume Purchase Program (VPP) for Business with Afaria, the industry-leading mobile device and application management solution from Sybase. Afaria helps enterprises by providing a single administrative console from which to centrally manage and secure mobile data, applications, and devices. Afaria helps extend App Store VPP for Business, which provides businesses a way to purchase custom business-to-business apps built by third-party developers. Also in September, at SAP TechEd 2011 Las Vegas, SAP and Sybase announced the forthcoming Sybase Unwired Platform 2.1. The new version will enrich the mobile application development experience through significant enhancements to its software development kit and new developer
resources for the more than 2 million members of SAP Community Network. Development in the previous quarters In May, at SAPPHIRE NOW in Orlando, SAP and Sybase announced Sybase Unwired Platform 2.0 and the unveiling of an enhanced version of their software development kit (SDK). The releases help businesses of all sizes better respond to real-time business dynamics through simplified deployment and development of native and Web-based mobile applications on a wide array of device types. Also at SAPPHIRE NOW in May, SAP and Sybase announced a series of new mobile apps aimed at mobilizing business processes and business information across key industries including manufacturing, consumer products, utilities, high tech, oil and gas, and retail. In the first quarter, we announced the launch of the SAP Collaborative E-Care Management application, which connects patients, their families and care providers through medical monitoring software and mobile devices. The aim is to improve the management of health with individualized treatment plans and educational content. With the SAP technology, patients will be able to use mobile devices to track their health status, interact with care providers, and monitor how they are progressing on an individualized care plan developed with their care provider. Orchestration Development in the third quarter In September we announced the general availability of the 7.1 release of the SAP Solution Manager, the first major update in more than four years. The latest release is a one-stop shop for total application life-cycle management and offers control mechanisms for both SAP and non-SAP environments. Development in the previous quarters In June, SAP announced the general availability of the 7.3 release of SAP NetWeaver. The latest release helps customers adapt business processes more quickly and easily without increasing costs. At SAPPHIRE NOW in Orlando, we announced the launch of SAP NetWeaver Gateway, a forthcoming open, standards-based framework for extending the reach of our business software to an exponentially larger number of users, developers and environments.

8 INTERIM REPORT JANUARY – SEPTEMBER 2011
Rapid-Deployment Solutions Development in the third quarter Rapid-deployment solutions are pre-packaged solutions based on SAP software that enable quick time-to-value at a fixed cost. We regularly expand our portfolio of rapid-deployment solutions in quarterly innovation cycles. In the third quarter alone, we delivered 50 more rapid-deployment solutions and SAP Business All-in-One enhancement packages, focusing on core SAP Business Suite solutions and forward-looking lines such as mobile applications and SAP HANA. We shipped our first two in-memory rapid-deployment solutions to enable our customers to quickly and inexpensively add powerful SAP HANA reporting and profitability analytics to their SAP ERP solutions. In the mobility space, a rapid-deployment solution for mobile apps and infrastructure fast-tracks customers to a wealth of applications on the Sybase mobile infrastructure. Two other rapid-deployment solutions we delivered were for our strategic innovations in transportation management. We are now also delivering a spectrum of solutions based on SAP Business Suite, such as an extended version of the SAP CRM rapid-deployment solution, as well as an enhanced version of the Sybase mobile sales software, a new CRM analytics package, and rapid-deployment solutions for planning applications such as SAP SCM Demand Planning. Also in the third quarter, we shipped rapid-deployment solutions for industry software, such as for loans management in banking. To optimize the channels for our new solutions, we grew our partner ecosystem and worked hard to upskill our partners in the third quarter. Services Recent developments In October we announced the accelerated delivery of business innovations for SAP Business Suite. SAP introduced the software enhancements without disruption on a quarterly schedule in areas where customers can benefit most, including mobility, in-memory computing technology and cloud computing. As a consequence, SAP will extend mainstream maintenance for the core SAP Business Suite 7 applications by five years, from December 2015 through December 2020, giving SAP customers long-term predictability and removing the burden of upgrades across the enterprise for several years. The longer maintenance also applies to SAP NetWeaver and all current SAP enhancement packages for SAP Business Suite.
Development in the third quarter In August we announced the expansion of SAP MaxAttention services to specifically address the needs of large companies operating in the Chinese market. The premium, on-site support services, custom-tailored for business in China, offer customers there deeper, closer and long-term support. Solutions Delivered Jointly With Partners Development in the third quarter In September we announced that Capgemini is cooperating with Sybase to manage the deployment of enterprise mobility solutions, and will enter into an agreement with SAP to build differentiated mobility solutions. In September we introduced a “Build and Sell” program that enables SAP channel partners to build, market, and sell analytic applications based on technology from the SAP BusinessObjects portfolio. The program offers partners the means to more easily extend their reach by marketing and selling their intellectual property to others with similar needs throughout the SAP ecosystem. In July, less than one year following our acquisition of Sybase, we announced that SAP value-added resellers (VARs) currently authorized to sell SAP BusinessObjects solutions and SAP Business All-in-One solutions get the opportunity to sell selected Sybase-branded enterprise mobility apps and solutions for application development, device management, and security, and more. Development in the previous quarters At SAPPHIRE NOW in May, SAP and Amazon Web Services announced that a variety of SAP solutions are available on demand via Amazon Web Services. Also at SAPPHIRE NOW, SAP and Dell announced the availability of SAP applications for deployment via Dell’s VIS Next Generation Datacenter Platform, opening up new ways for customers to increase IT responsiveness and business efficiency. Dell’s PowerEdge R910 is among the hardware platforms certified by SAP for running SAP in-memory computing technology. In the first quarter, SAP and Verizon announced that we would jointly deliver the SAP Customer Relationship Management (SAP CRM) rapid-deployment solution to enterprise workers through Verizon’s flagship cloud offering, Computing as a Service. Workers will be able to access SAP CRM from their desktops or their mobile devices. In February, HSBC, SAP, and SWIFT announced that we have teamed together to create the next
INTERIM MANAGEMENT REPORT 9
generation of HSBC Connect to SAP, HSBC’s corporate-to-bank integration and treasury solution catering to HSBC’s corporate customers that use enterprise resource planning (ERP) software from SAP. At the Duet Enterprise Virtual Launch Summit in February, SAP and Microsoft released and announced general availability of Duet Enterprise software, our joint product that connects Microsoft SharePoint 2010 and SAP solutions, providing users easier access to business processes and data. In addition, the companies launched the new Unite Partner Connection program, which will help partners of both companies increase their business opportunities more effectively through a better understanding of Microsoft and SAP joint solutions and product road maps. Analyst Endorsements Development in the third quarter SAP announced in August its top position by IDC in the “Worldwide Financial Accounting Applications 2010 Vendor Share” report. SAP was recognized as a market leader for both “2008-2010 worldwide revenue” and “2010 growth and market share” for financial accounting applications. In July, we announced our positioning by Gartner in the leaders quadrant of two reports: “Magic Quadrant for Utilities Customer Information Systems (CIS)” and “Magic Quadrant for Enterprise Governance, Risk and Compliance (EGRC) Platforms.” Development in the previous quarters In June, IDC named SAP leader in the worldwide BI tools market based on software license and maintenance revenue. IDC also reported that SAP has grown faster than the worldwide market for financial performance and strategy management applications for the fifth consecutive year. SAP was the overall leader in BI worldwide, according to an April 2011 report issued by Gartner Inc. SAP ranked first with a 23% share of the worldwide BI segment based on 2010 revenue, reflecting our 16.8% revenue growth since 2009. In May we announced that we had been named a leading vendor by two independent analyst firms serving the financial services sector, Ovum and Forrester Research, Inc. SAP Transactional Banking received the top ranking of “shortlist” from Ovum and is the highest ranked vendor for functionality, while SAP software received a “strong” rating in a Forrester report that examined CRM offerings from
24 vendors with respect to their ability to meet the specific requirements for financial services firms. In the first quarter, SAP achieved a position in the leaders’ quadrant of the Magic Quadrant for Corporate Performance Management (CPM) Suites report. SAP was recognized by Gartner as a market leader for both its “ability to execute” and its “completeness of vision.” In January, Ventana Research, a leading benchmark research and advisory services firm, ranked SAP as a top software vendor in its 2011 Value Index for Product Information Management and its 2010 Value Index for Financial Performance Management. SAP earned high marks for its solutions that help organizations establish a single source of product information across the enterprise supply chain. In January, Gartner positioned SAP in the leaders’ quadrant of the Magic Quadrant for ERP for Product-Centric Midmarket Companies report. SAP was recognized as a market leader for both its “ability to execute” and its “completeness of vision.”

10 INTERIM REPORT JANUARY – SEPTEMBER 2011
CUSTOMERS In the third quarter of 2011, SAP closed major contracts in key regions. EMEA TOTAL SA, Unilever PLC, AOK, DekaBank Deutsche Girozentrale, Givaudan Suisse SA, Royal Bank of Scotland Group Plc Americas Automercados S.A. de C. V, Johnson Controls, Inc., American Railcar Industries, Inc, Waters Corporation, Bristol-Myers Squibb Company, Pacific Coast Building Products Asia Pacific/Japan Assam Power Distribution Company Ltd., Beijing Toread Outdoor Products Co., Union Steel Mfg. Co., Ltd., Maharashtra State Electricity, Transfield Services Limited, Far East Organization SAP Business ByDesign SOUPLETUBE, Markwins International Corp, INFORA GmbH, AbsolutData Research & Analytics, Wireless Advanced Communications, SolarBridge Technologies, Marsulex Environmental Technologies Corp, BIOBASE GmbH RESEARCH AND DEVELOPMENT Our total research and development expense rose by 13% to €1,402 million in the first nine months of 2011 compared to €1,243 million in the corresponding period in 2010. The amounts for 2011 include R&D expense for Sybase, but the comparative amounts for 2010 include Sybase numbers since the acquisition date July 26, 2010. On our IFRS numbers, the portion of total revenue we spent on research and development in the third quarter of 2011 was 12.8%, which is 2.3 percentage points less than the 15.1% recorded for the third quarter of 2010. This is chiefly because our third-quarter total revenue was 14% greater in 2011 than in 2010 and because we spent less on share-based compensation for our R&D staff in the third quarter of 2011 than in the comparator prior-year period. On the non-IFRS numbers, the portion of total revenue we spent on R&D in the third quarter of 2011 was 12.9 %, a 1.6 percentage point increase in comparison with the portion in the third quarter of the previous year, which was 14.5%.
On our IFRS numbers, the portion of total revenue we spent on research and development in the first nine months of 2011 was 14.4%, which is 0.4 percentage points less than the 14.8% recorded for the first nine months in 2010. This because while total revenue for the first nine months was 17% greater, R&D spending for the same period increased less steeply, at 13%. Those numbers include the greater acquisition-related expenses arising out of Sybase acquisition in 2010. On the non-IFRS numbers, the portion of our total revenue we spent on R&D in the first nine months of 2011 was 14.0%, a 0.5 percentage point decrease in comparison with the portion in the first nine months of the previous year, which was 14.5%. We had 15,807 full-time equivalent (FTE) employees working in research and development teams on September 30, 2011, which is relatively constant compared with the corresponding period in 2010 (September 30, 2010: 15,775; December 31, 2010: 15,884). In February, we announced that we would build an innovation center in Potsdam, Germany, where we will develop new software solutions in cooperation with customers. The building at the new location will have space for 150 staff. The center will eventually have over 100 permanent employees, and be used by up to 200 students and doctorate students. With the innovation center, SAP will continue to drive momentum for innovative and customer-oriented solutions. SAP plans to invest €15.8 million in the new location. ACQUISITIONS Third quarter In September 2011 SAP acquired Right Hemisphere, a leading provider of visual enterprise solutions based in San Ramon, California, and Auckland, New Zealand. The 3-D model-based visualization and communications technologies from Right Hemisphere will enhance SAP software solutions and enable visual navigation and interrogation of an entire product or asset and all its associated data in one, unified environment. In September 2011, SAP announced its intention to acquire Crossgate, a company that provides hosted business-to-business integration services. We expect that the antitrust authorities will give their clearance to the acquisition in the final quarter of 2011. Crossgate’s integration services enable companies to connect with their trading partners, customers, and suppliers, allowing them to exchange data securely regardless of their technical

INTERIM MANAGEMENT REPORT 11
capabilities. Headquartered in Munich, Germany, Crossgate helps more than 40,000 business partners across multiple industries to securely exchange important documents and data. Through this acquisition, SAP can enable networking at the enterprise level, providing an easy way for customers to collaborate and share data with their trading partners. Previous quarters In February 2011, SAP acquired security, identity and access management software, as well as assets including development and consulting resources from SECUDE, a leading vendor of application security solutions in Switzerland. SAP will include Secure Login and Enterprise Single Sign-On in its product portfolio to provide its customers with secure client-server communications for their SAP systems.
EMPLOYEES At the end of the third quarter of 2011, our employee headcount in full-time equivalents was 54.589 (September 30, 2010: 52.921; December 31, 2010: 53,513). Thereof 15.811 were based in Germany (September 30, 2010: 15.464; December 31, 2010: 15,633) and 10.340 in the United States (September 30, 2010: 10.098; December 31, 2010: 10,194). ORGANIZATION AND CHANGES IN MANAGEMENT In July, Angelika Dammann, a member of the Executive Board, left SAP for personal reasons. On a provisionary basis, SAP CFO Werner Brandt assumes the duties of Dammann’s global HR leadership and labor relations role.
12 INTERIM REPORT JANUARY – SEPTEMBER 2011
OPERATING RESULTS, FINANCES, AND ASSETS In the sections that follow, our operating results, finances and assets are discussed in detail. It must be borne in mind that the 2011 amounts include expenses and software revenue for Sybase, but the comparative amounts for 2010 do only partially. We acquired Sybase on July 26, 2010. Therefore, the Sybase numbers in 2010 are included since the acquisition date. Performance against our Outlook for 2011 (Non-IFRS) In this section, all discussion of the first nine months’ contribution to target achievement is based exclusively on non-IFRS measures. However, in the following section the discussion of results refers to IFRS figures only, so those figures are therefore not expressly identified as IFRS figures.
We present, discuss, and explain the reconciliation from IFRS measures to non-IFRS measures in the “Additional Financial Information (Unaudited)” section and online at www.sap.com/corporate-en/investors/reports. Our outlook for operating profit and the thereof resulting operating margin in 2011 and their 2010 comparative amounts are based on amended non-IFRS definitions that exclude expenses for share-based payments and restructuring compared to 2010. Our prior year figures have been adjusted accordingly. Operational Targets for 2011 (Non-IFRS) For our outlook based on non-IFRS numbers, we refer to the passage “Forecast for SAP” in this interim management report.
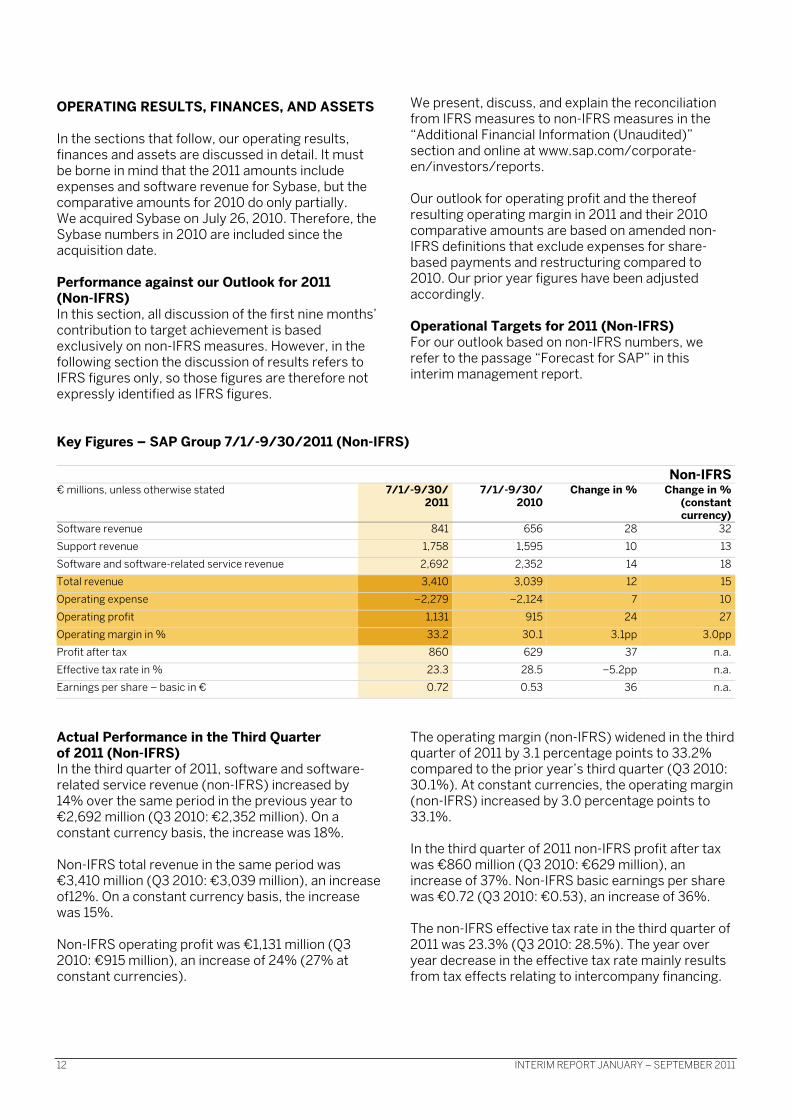
Key Figures – SAP Group 7/1/-9/30/2011 (Non-IFRS)
Non-IFRS€ millions, unless otherwise stated 7/1/-9/30/
20117/1/-9/30/
2010Change in % Change in %
(constant currency)
Software revenue 841 656 28 32
Support revenue 1,758 1,595 10 13
Software and software-related service revenue 2,692 2,352 14 18
Total revenue 3,410 3,039 12 15
Operating expense �2,279 �2,124 7 10
Operating profit 1,131 915 24 27
Operating margin in % 33.2 30.1 3.1pp 3.0pp
Profit after tax 860 629 37 n.a.
Effective tax rate in % 23.3 28.5 �5.2pp n.a.
Earnings per share – basic in € 0.72 0.53 36 n.a.
Actual Performance in the Third Quarter of 2011 (Non-IFRS) In the third quarter of 2011, software and software-related service revenue (non-IFRS) increased by 14% over the same period in the previous year to €2,692 million (Q3 2010: €2,352 million). On a constant currency basis, the increase was 18%. Non-IFRS total revenue in the same period was €3,410 million (Q3 2010: €3,039 million), an increase of12%. On a constant currency basis, the increase was 15%. Non-IFRS operating profit was €1,131 million (Q3 2010: €915 million), an increase of 24% (27% at constant currencies).
The operating margin (non-IFRS) widened in the third quarter of 2011 by 3.1 percentage points to 33.2% compared to the prior year’s third quarter (Q3 2010: 30.1%). At constant currencies, the operating margin (non-IFRS) increased by 3.0 percentage points to 33.1%. In the third quarter of 2011 non-IFRS profit after tax was €860 million (Q3 2010: €629 million), an increase of 37%. Non-IFRS basic earnings per share was €0.72 (Q3 2010: €0.53), an increase of 36%. The non-IFRS effective tax rate in the third quarter of 2011 was 23.3% (Q3 2010: 28.5%). The year over year decrease in the effective tax rate mainly results from tax effects relating to intercompany financing.
INTERIM MANAGEMENT REPORT 13
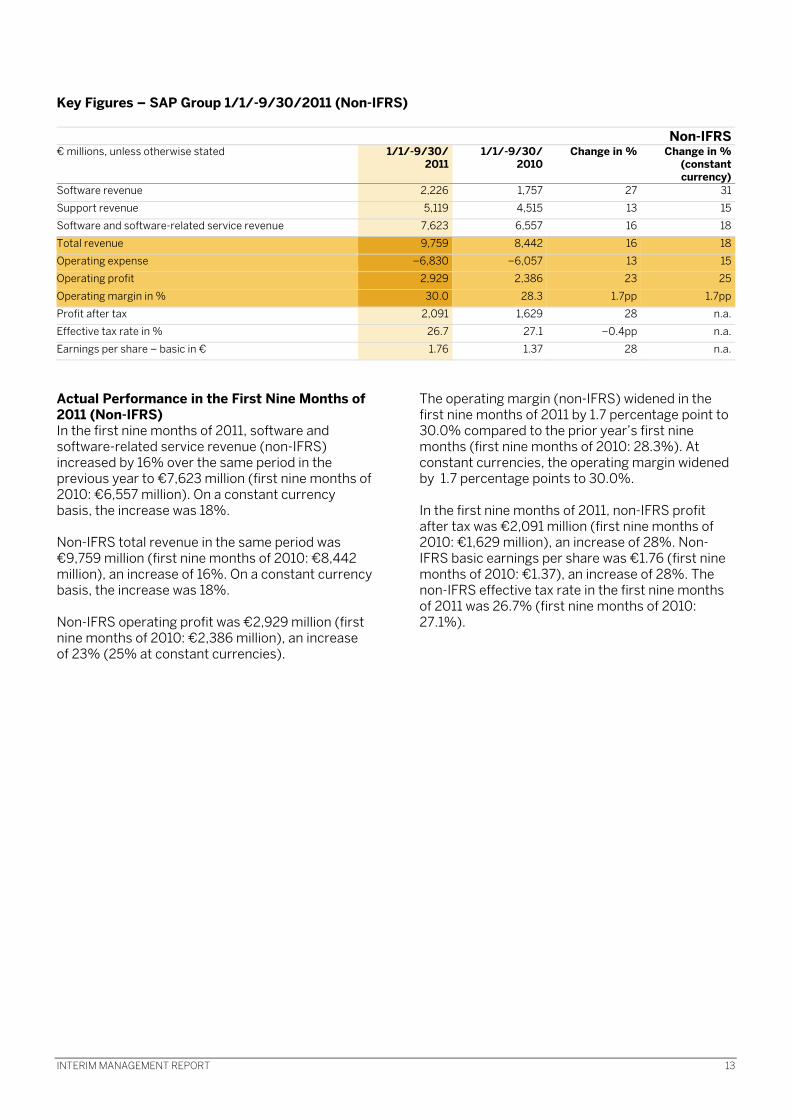
Key Figures – SAP Group 1/1/-9/30/2011 (Non-IFRS) Non-IFRS€ millions, unless otherwise stated 1/1/-9/30/
20111/1/-9/30/
2010Change in % Change in %
(constant currency)
Software revenue 2,226 1,757 27 31
Support revenue 5,119 4,515 13 15
Software and software-related service revenue 7,623 6,557 16 18
Total revenue 9,759 8,442 16 18
Operating expense �6,830 �6,057 13 15
Operating profit 2,929 2,386 23 25
Operating margin in % 30.0 28.3 1.7pp 1.7pp
Profit after tax 2,091 1,629 28 n.a.
Effective tax rate in % 26.7 27.1 �0.4pp n.a.
Earnings per share – basic in € 1.76 1.37 28 n.a.
Actual Performance in the First Nine Months of 2011 (Non-IFRS) In the first nine months of 2011, software and software-related service revenue (non-IFRS) increased by 16% over the same period in the previous year to €7,623 million (first nine months of 2010: €6,557 million). On a constant currency basis, the increase was 18%. Non-IFRS total revenue in the same period was €9,759 million (first nine months of 2010: €8,442 million), an increase of 16%. On a constant currency basis, the increase was 18%. Non-IFRS operating profit was €2,929 million (first nine months of 2010: €2,386 million), an increase of 23% (25% at constant currencies).
The operating margin (non-IFRS) widened in the first nine months of 2011 by 1.7 percentage point to 30.0% compared to the prior year’s first nine months (first nine months of 2010: 28.3%). At constant currencies, the operating margin widened by 1.7 percentage points to 30.0%. In the first nine months of 2011, non-IFRS profit after tax was €2,091 million (first nine months of 2010: €1,629 million), an increase of 28%. Non-IFRS basic earnings per share was €1.76 (first nine months of 2010: €1.37), an increase of 28%. The non-IFRS effective tax rate in the first nine months of 2011 was 26.7% (first nine months of 2010: 27.1%).

14 INTERIM REPORT JANUARY – SEPTEMBER 2011
Key Figures SAP Group in the Third Quarter of 2011
€ millions, unless otherwise stated 7/1/-9/30/2011
7/1/-9/30/2010
Change Change in %
Software revenue 841 656 185 28
Support revenue 1,757 1,559 198 13
Software and software-related service revenue 2,691 2,316 375 16
Total revenue 3,409 3,003 406 14
Operating expense �1,650 �2,287 637 �28
Operating profit 1,759 716 1,043 146
Operating margin in % 51.6 23.8 27.8pp n.a.
Profit after tax 1,251 501 750 150
Effective tax rate in % 28.7 27.3 1.4pp n.a.
Headcount in full-time equivalents (September 30) 54,589 52,921 1,668 3
Days sales outstanding in days (September 30) 62 70 �8 �11
Earnings per share – basic in € 1.05 0.42 0.63 150
OPERATING RESULTS IN THE THIRD QUARTER (IFRS) Orders The total number of new software deals we closed grew 13% in the third quarter of 2011 to 14,379 (Q3 2010: 12,728). The average value of software orders we received showed a substantial increase of 25% compared with the previous year. Revenue In the third quarter of 2011, software revenue was €841 million (Q3 2010: €656 million), an increase of 28% compared to the same period in 2010. Software revenues in the third quarter of 2011 included an amount of €34 million from HANA (Q3 2010: €0). Our software and software-related service revenue was €2,691 million (Q3 2010: €2,316 million), an increase of 16% compared to the same period in 2010. Total revenue was €3,409 million (Q3 2010: €3,003 million), an increase of 14% compared to the same period in 2010. Operating Expenses In the third quarter of 2011, our operating expenses decreased 28% to €1,650 million (Q3 2010: €2,287 million), Because the Court in the TomorrowNow litigation reduced the damages awarded against us from US$1.3 billion to US$272 million, we were able to release €723 million from the related provision that we recorded in the final quarter of 2010. This contributed to reduction in operating expenses. For more information about the TomorrowNow litigation, see the Notes to the Consolidated Interim Financial Statements section, Note (13).
Operating Profit and Margin In the third quarter of 2011, operating profit increased by 146% over the same period in the previous year to €1,759 million (Q3 2010: €716 million). Our operating margin increased 27.8 percentage points to 51.6% (Q3 2010: 23.8%). In the third quarter of 2011, effects from our discontinued TomorrowNow operation had a 21.2 percentage point positive influence on operating margin (Q3 2010: -1.5 percentage points). Profit after Tax and Earnings per Share In the third quarter of 2011 profit after tax was €1,251 million (Q3 2010: €501 million), an increase of 150%. The increase was due largely to the release of part of the provision we had recorded for the TomorrowNow litigation. Basic earnings per share was €1.05 (Q3 2010: €0.42), an increase of 150%. The effective tax rate in the third quarter of 2011 was 28.7% (Q3 2010: 27.3%). The year over year increase in the effective tax rate mainly results from a decrease in the provision recorded for the TomorrowNow litigation which was partly compensated by effects relating to intercompany financing.
INTERIM MANAGEMENT REPORT 15
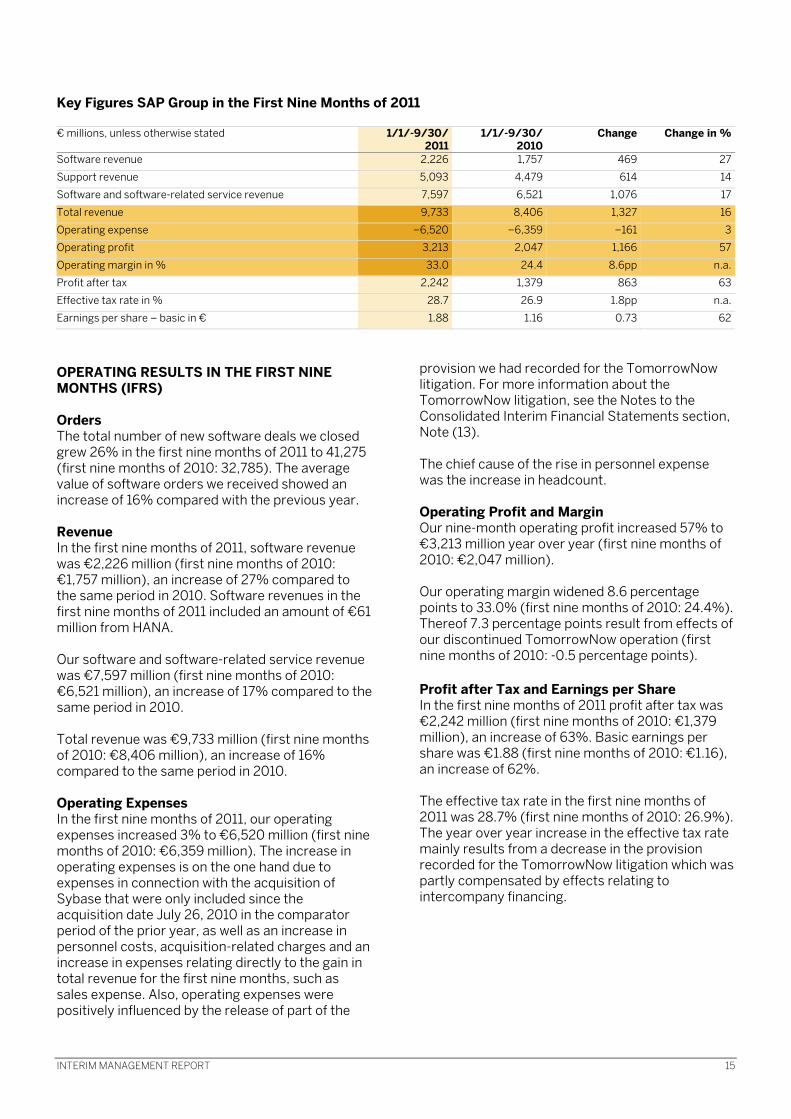
Key Figures SAP Group in the First Nine Months of 2011
€ millions, unless otherwise stated 1/1/-9/30/2011
1/1/-9/30/2010
Change Change in %
Software revenue 2,226 1,757 469 27
Support revenue 5,093 4,479 614 14
Software and software-related service revenue 7,597 6,521 1,076 17
Total revenue 9,733 8,406 1,327 16
Operating expense �6,520 �6,359 �161 3
Operating profit 3,213 2,047 1,166 57
Operating margin in % 33.0 24.4 8.6pp n.a.
Profit after tax 2,242 1,379 863 63
Effective tax rate in % 28.7 26.9 1.8pp n.a.
Earnings per share – basic in € 1.88 1.16 0.73 62
OPERATING RESULTS IN THE FIRST NINE MONTHS (IFRS) Orders The total number of new software deals we closed grew 26% in the first nine months of 2011 to 41,275 (first nine months of 2010: 32,785). The average value of software orders we received showed an increase of 16% compared with the previous year. Revenue In the first nine months of 2011, software revenue was €2,226 million (first nine months of 2010: €1,757 million), an increase of 27% compared to the same period in 2010. Software revenues in the first nine months of 2011 included an amount of €61 million from HANA. Our software and software-related service revenue was €7,597 million (first nine months of 2010: €6,521 million), an increase of 17% compared to the same period in 2010. Total revenue was €9,733 million (first nine months of 2010: €8,406 million), an increase of 16% compared to the same period in 2010. Operating Expenses In the first nine months of 2011, our operating expenses increased 3% to €6,520 million (first nine months of 2010: €6,359 million). The increase in operating expenses is on the one hand due to expenses in connection with the acquisition of Sybase that were only included since the acquisition date July 26, 2010 in the comparator period of the prior year, as well as an increase in personnel costs, acquisition-related charges and an increase in expenses relating directly to the gain in total revenue for the first nine months, such as sales expense. Also, operating expenses were positively influenced by the release of part of the
provision we had recorded for the TomorrowNow litigation. For more information about the TomorrowNow litigation, see the Notes to the Consolidated Interim Financial Statements section, Note (13). The chief cause of the rise in personnel expense was the increase in headcount. Operating Profit and Margin Our nine-month operating profit increased 57% to €3,213 million year over year (first nine months of 2010: €2,047 million). Our operating margin widened 8.6 percentage points to 33.0% (first nine months of 2010: 24.4%). Thereof 7.3 percentage points result from effects of our discontinued TomorrowNow operation (first nine months of 2010: -0.5 percentage points). �Profit after Tax and Earnings per Share In the first nine months of 2011 profit after tax was €2,242 million (first nine months of 2010: €1,379 million), an increase of 63%. Basic earnings per share was €1.88 (first nine months of 2010: €1.16), an increase of 62%. The effective tax rate in the first nine months of 2011 was 28.7% (first nine months of 2010: 26.9%). The year over year increase in the effective tax rate mainly results from a decrease in the provision recorded for the TomorrowNow litigation which was partly compensated by effects relating to intercompany financing.
16 INTERIM REPORT JANUARY – SEPTEMBER 2011
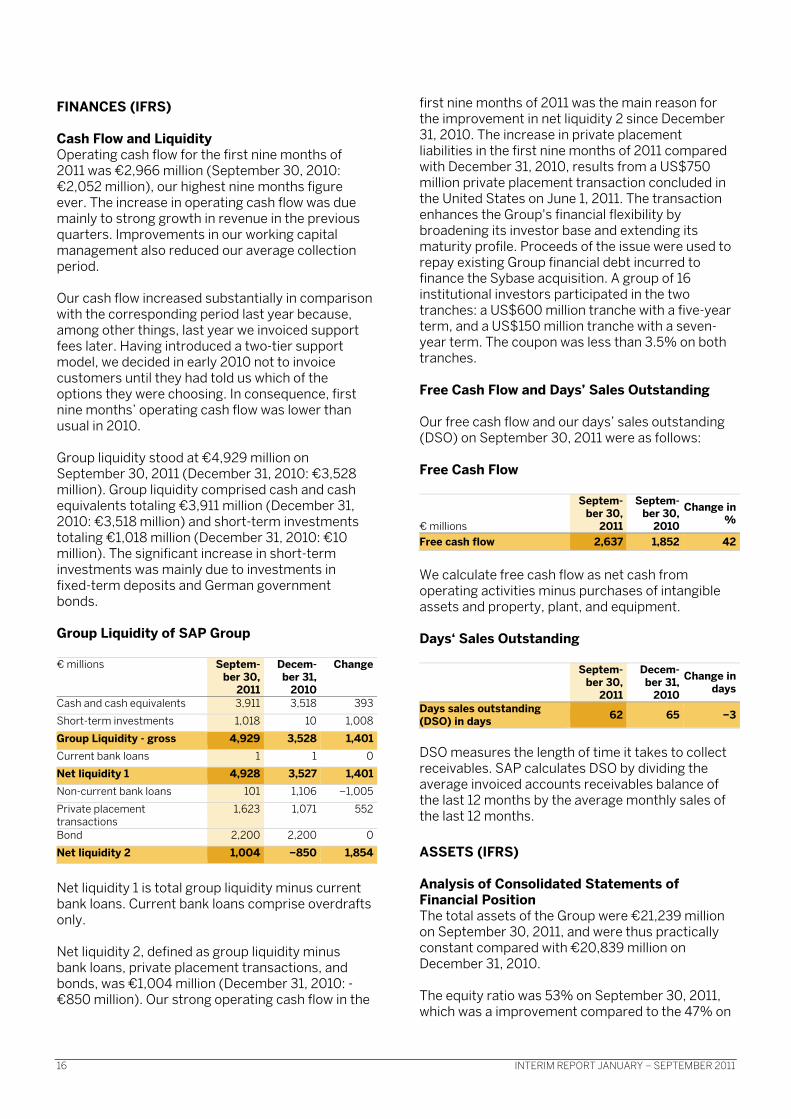
FINANCES (IFRS) Cash Flow and Liquidity Operating cash flow for the first nine months of 2011 was €2,966 million (September 30, 2010: €2,052 million), our highest nine months figure ever. The increase in operating cash flow was due mainly to strong growth in revenue in the previous quarters. Improvements in our working capital management also reduced our average collection period. Our cash flow increased substantially in comparison with the corresponding period last year because, among other things, last year we invoiced support fees later. Having introduced a two-tier support model, we decided in early 2010 not to invoice customers until they had told us which of the options they were choosing. In consequence, first nine months’ operating cash flow was lower than usual in 2010. Group liquidity stood at €4,929 million on September 30, 2011 (December 31, 2010: €3,528 million). Group liquidity comprised cash and cash equivalents totaling €3,911 million (December 31, 2010: €3,518 million) and short-term investments totaling €1,018 million (December 31, 2010: €10 million). The significant increase in short-term investments was mainly due to investments in fixed-term deposits and German government bonds. Group Liquidity of SAP Group € millions Septem-
ber 30, 2011
Decem- ber 31,
2010
Change
Cash and cash equivalents 3,911 3,518 393
Short-term investments 1,018 10 1,008
Group Liquidity - gross 4,929 3,528 1,401Current bank loans 1 1 0
Net liquidity 1 4,928 3,527 1,401Non-current bank loans 101 1,106 �1,005
Private placement transactions
1,623 1,071 552
Bond 2,200 2,200 0
Net liquidity 2 1,004 �850 1,854
Net liquidity 1 is total group liquidity minus current bank loans. Current bank loans comprise overdrafts only. Net liquidity 2, defined as group liquidity minus bank loans, private placement transactions, and bonds, was €1,004 million (December 31, 2010: -€850 million). Our strong operating cash flow in the
first nine months of 2011 was the main reason for the improvement in net liquidity 2 since December 31, 2010. The increase in private placement liabilities in the first nine months of 2011 compared with December 31, 2010, results from a US$750 million private placement transaction concluded in the United States on June 1, 2011. The transaction enhances the Group's financial flexibility by broadening its investor base and extending its maturity profile. Proceeds of the issue were used to repay existing Group financial debt incurred to finance the Sybase acquisition. A group of 16 institutional investors participated in the two tranches: a US$600 million tranche with a five-year term, and a US$150 million tranche with a seven-year term. The coupon was less than 3.5% on both tranches. Free Cash Flow and Days’ Sales Outstanding Our free cash flow and our days’ sales outstanding (DSO) on September 30, 2011 were as follows: Free Cash Flow
€ millions
Septem- ber 30,
2011
Septem- ber 30,
2010
Change in %
Free cash flow 2,637 1,852 42 We calculate free cash flow as net cash from operating activities minus purchases of intangible assets and property, plant, and equipment. Days‘ Sales Outstanding
Septem- ber 30,
2011
Decem- ber 31,
2010
Change in days
Days sales outstanding (DSO) in days 62 65 �3
DSO measures the length of time it takes to collect receivables. SAP calculates DSO by dividing the average invoiced accounts receivables balance of the last 12 months by the average monthly sales of the last 12 months. ASSETS (IFRS) Analysis of Consolidated Statements of Financial Position The total assets of the Group were €21,239 million on September 30, 2011, and were thus practically constant compared with €20,839 million on December 31, 2010. The equity ratio was 53% on September 30, 2011, which was a improvement compared to the 47% on
INTERIM MANAGEMENT REPORT 17
December 31, 2010. The reason for this are the good results in the first nine months of the current fiscal year. Investments Our capital expenditures for property, plant, and equipment and intangible assets increased to €329 million for the first nine months of 2011 (December 31, 2010: €287 million). This increase can mainly be traced back to an increase in spending on IT hardware, software, and cars. Off-Balance-Sheet Financial Instruments There are no off-balance-sheet financial instruments, such as sale-and-lease-back transactions, asset-backed securities, and liabilities related to special-purpose entities, that are not disclosed in our interim Consolidated Financial Statements. Any factoring contracts are not material in volume. Competitive Intangibles The assets that are the basis for our current and future success do not appear on the Consolidated Statements of Financial Position. This is apparent from a comparison of the market capitalization of SAP AG, which was €47.0 billion, with the equity of the SAP Group on the Consolidated Statements of Financial Position, which was €11.3 billion at the end of the third quarter of 2011 (December 31, 2010: €9.8 billion). This means that the market capitalization of our equity is 416% higher than the book value. As per the 2011 Interbrand annual survey of the Best Global Brands, SAP’s brand value has increased 14% to US $14.5 billion, adding US $1.8 billion to our brand value in the past year. Furthermore, SAP is ranked the 24th most valued brand in the world, up from 26th place in 2010 and our highest rank to date. This puts SAP among the best, placing us ahead of Nike, Amazon.com, and just behind Pepsi and American Express. Customer capital, our employees and their knowledge and skills, our ecosystem of partners, the SAP brand, and our past investments in research and development are some of the most important competitive intangibles that influence our market value. SUSTAINABILITY Building on our commitment to sustainability, we released our unaudited quarterly sustainability update for the third quarter of 2011 in October.
Our greenhouse gas (GHG) emissions for the quarter ended September 30, 2011, totaled 112 kilotonnes (not including Sybase), a 2% increase compared to the third quarter of 2010. While our employee base increased in size, our emissions per employee (in full-time equivalents) decreased by 2% since the third quarter of 2010 and 3% since the second quarter of 2011. While air travel continues to contribute heavily to our overall GHG emissions, the number of business flights decreased by 6% compared to the second quarter of 2011. Our company cars are another example of efficiency: year over year the number of cars increased by 10% but emissions only went up by 5%. From the start of 2008 to today, SAP has realized approximately €195 million in cost avoidance, in comparison with a “business as usual” extrapolation. We are still on track to meet our year-end emissions target of 460 kilotons — in line with our long-term target of reducing GHG emissions to year-2000 levels by 2020. This quarter, we have become one of the first companies in the world to start adhering to the corporate value chain emissions standard (Scope 3), which was recently launched by the Greenhouse Gas Protocol. It was developed in a multi-stakeholder process by the World Resources Institute (WRI) and the World Business Council for Sustainable Development (WBCSD). It is our goal to have women in 25% of our leadership positions by 2017. For the third quarter of 2011, 18.6% of those in leadership positions were women, up from 18.2% at the end of the second quarter of 2011. In the third quarter of 2011, we held our SAP Global Diversity Days, which brought together 8,000 employees across 30 offices in 20 countries to drive diversity awareness and education.
18 INTERIM REPORT JANUARY – SEPTEMBER 2011
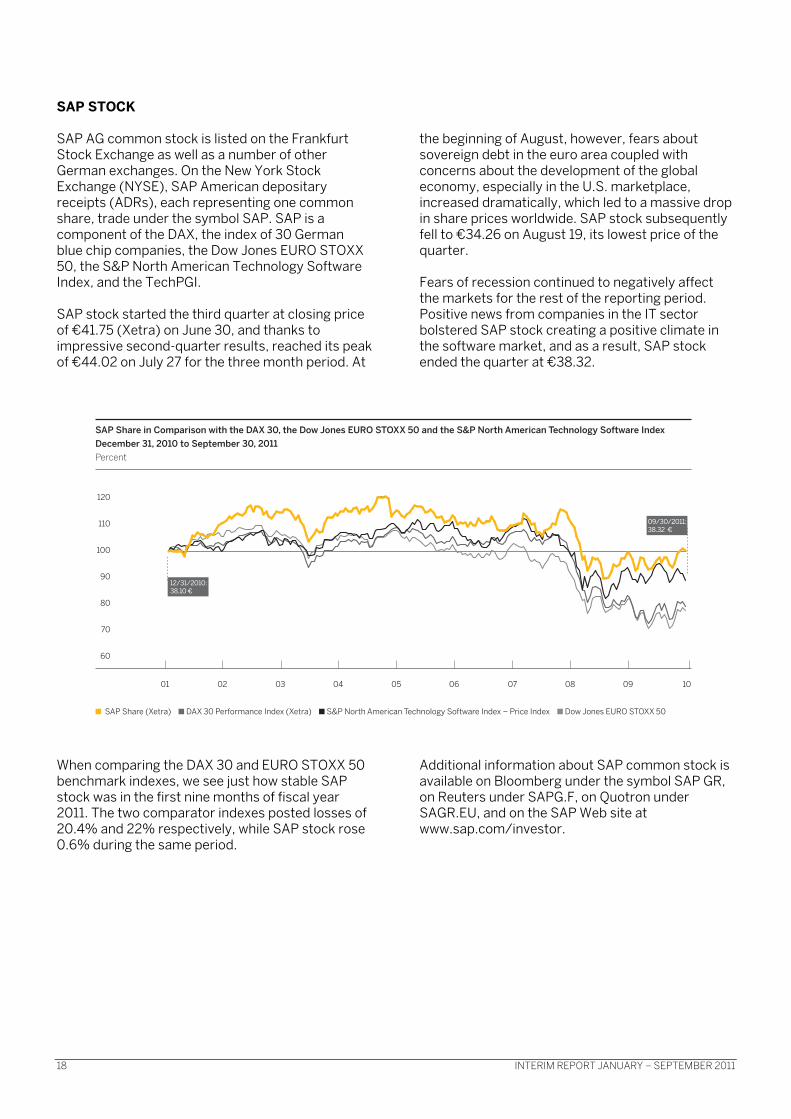
SAP STOCK SAP AG common stock is listed on the Frankfurt Stock Exchange as well as a number of other German exchanges. On the New York Stock Exchange (NYSE), SAP American depositary receipts (ADRs), each representing one common share, trade under the symbol SAP. SAP is a component of the DAX, the index of 30 German blue chip companies, the Dow Jones EURO STOXX 50, the S&P North American Technology Software Index, and the TechPGI. SAP stock started the third quarter at closing price of €41.75 (Xetra) on June 30, and thanks to impressive second-quarter results, reached its peak of €44.02 on July 27 for the three month period. At
the beginning of August, however, fears about sovereign debt in the euro area coupled with concerns about the development of the global economy, especially in the U.S. marketplace, increased dramatically, which led to a massive drop in share prices worldwide. SAP stock subsequently fell to €34.26 on August 19, its lowest price of the quarter. Fears of recession continued to negatively affect the markets for the rest of the reporting period. Positive news from companies in the IT sector bolstered SAP stock creating a positive climate in the software market, and as a result, SAP stock ended the quarter at €38.32.
09/30/2011: 38.32 €
12/31/2010: 38.10 €
SAP Share in Comparison with the DAX 30, the Dow Jones EURO STOXX 50 and the S&P North American Technology Software IndexDecember 31, 2010 to September 30, 2011Percent
01 02 03 04 05 06 07 08 09 10
■ SAP Share (Xetra) ■ DAX 30 Performance Index (Xetra) ■ S&P North American Technology Software Index – Price Index ■ Dow Jones EURO STOXX 50
120
110
100
90
80
70
60
When comparing the DAX 30 and EURO STOXX 50 benchmark indexes, we see just how stable SAP stock was in the first nine months of fiscal year 2011. The two comparator indexes posted losses of 20.4% and 22% respectively, while SAP stock rose 0.6% during the same period.
Additional information about SAP common stock is available on Bloomberg under the symbol SAP GR, on Reuters under SAPG.F, on Quotron under SAGR.EU, and on the SAP Web site at www.sap.com/investor.
INTERIM MANAGEMENT REPORT 19
RISK AND OPPORTUNITY MANAGEMENT We have comprehensive risk management structures in place, which are intended to enable us to recognize and analyze risks early and to take the appropriate action. Economic instability in the euro area and civil and political unrest in the Middle East and North Africa have so far had only minor negative impact on our business. However, it is very difficult to judge how the situation will develop and we cannot make any reliable judgments at this stage about the possible effects of events on our business. We cannot exclude the possibility that they may negatively impact our financial position, cash flows, profit, or stock price. We believe that risks in relation to earthquakes in Japan and subsequent events have slightly decreased. The economic consequences of such events cannot be foreseen with complete accuracy. For changes in our legal liability risks since our last annual report, see note (13) in the Notes to the Interim Financial Statements. The other risk factors remain largely unchanged since 2010, and are discussed more fully in our 2010 Annual Report and our Annual Report on Form 20-F for 2010. We do not believe the risks we have identified jeopardize our ability to continue as a going concern. OUTLOOK Future Trends in the Global Economy The global economy is now expected to grow only a little in 2011 – and less than was forecast earlier in the year – according to organizations such as the European Central Bank (ECB), the Organization for Economic Co-operation and Development (OECD), and the International Monetary Fund (IMF). This mostly follows a change of mood on the international financial markets in the third quarter. Those organizations have revised their predictions for growth in the EMEA region. For example, they now expect the economy of the euro area to grow only by a percentage in the low single digits in 2011. Their explanation is that volatility on the financial markets and the sovereign debt crises in Greece and some other countries that use the euro are undermining the entire European economy. In the Middle East and North Africa, continuing political unrest is expected to hold back economic progress. Economic recovery is also expected to slow in the coming months in the Americas region. Unhelpful
financial market conditions are restraining U.S. economic growth in particular. Currently, consumer demand cannot compensate for the demand of government stimulus packages, which are drying up. On the brighter side, shipments to Japan are expected gradually to return to normal as the disruption caused by the earthquake comes to an end. This is expected to afford more economic stability. Divergent economic trends are expected to continue into the future within the APJ region. Whereas the emerging economies in Asia are expected to continue to growing vigorously – if not quite so vigorously as earlier in the year – the Japanese economy is not expected to grow at all year over year. Gradually, Japan is recovering from the earthquake in March. Reconstruction work is strengthening the economy; supply bottlenecks are being cleared. How the global economy as a whole performs will depend very much on how quickly the financial sector recovers and how quickly the advanced economies regain control of sovereign debt. The IT Market The market for information technology will grow twice as fast as the global economy over 2011, according to IDC’s latest projections for the industry. As three months ago, IDC still expects worldwide IT sales growth in the higher single-digit percentages for the full year. It foresees growth in the middle of the single-digit range in the software and services segments, and double-digit growth in the hardware segment. IDC has now dampened expectations for 2011 EMEA region growth in the IT market to a medium single-digit percentage. This is because of the sluggish growth in European IT markets reflecting equally listless economic recovery in Europe. IDC believes the market will remain healthier in Germany than elsewhere in Western Europe. From the Americas region, IDC reports that U.S. companies are keeping a sharp eye on the world economy. Should the situation worsen, they would revise plans to invest in IT in the fourth quarter of 2011, it says. In contrast, in Latin America IDC sees a positive outlook for IT sales. A divergent IT market in the Asia Pacific Japan (APJ) region will continue to move in two directions at once for the rest of this year, IDC predicts. Although Japan is recovering from the March earthquake and reconstruction work is benefiting the economy, IDC does not expect anything more

20 INTERIM REPORT JANUARY – SEPTEMBER 2011
encouraging than low single-digit IT market growth there for the year. On the other hand, it expects IT sales to increase by double-digit percentages in the emerging Asian economies. In the months to come, the debt crisis, high levels of unemployment, and inflation could hamper growth in global IT markets. However, it is also possible that global recovery will encourage the market for IT to drive forward, IDC says. Forecast for SAP Operational Targets for 2011 (Non-IFRS) Business Outlook SAP’s pipeline continues to remain very strong and companies continue to invest in IT, in particular in innovative software solutions. During the last few months, uncertainty has risen from a macroeconomic pespektive. The primary reasons for this are the lingering negotiations to find a solution for the crisis in Greece and the increasing discussions about the financial situation of other European countries, such as Italy, Spain and Portugal. Furthermore, there are fears about the possible implications of sovereign insolvency on the world wide banking system and the increasing pessimism from various economic research institutes. The high national debt of the United States and Japan are also causing some problems. Due to the ongoing uncertain macroeconomic environment, the Company’s outlook for the full year 2011 remains unchanged from its previous guidance reported on July 26th, 2011 (except for the IFRS effective tax rate). The Company expects full-year 2011 non-IFRS software and software-related service revenue to increase in a range of 10% – 14% at constant currencies (2010: €9.87 billion), but expects to reach the high end of the range. The Company expects full-year 2011 non-IFRS operating profit to be in a range of €4.45 billion – €4.65 billion at constant currencies (2010: €4.01 billion), but expects to reach the high end of the range, resulting in 2011 non-IFRS operating margin increasing in a range of 0.5 - 1.0 percentage points at constant currencies (2010: 32.0%). The Company projects a full-year 2011 IFRS effective tax rate of 28.5% – 29.5% (2010: 22.5%) and a non-IFRS effective tax rate of 27.5% - 28.5% (2010: 27.3%).
Differences Between IFRS and Non-IFRS Measures As noted above, our guidance is based on Non-IFRS measures at constant currencies. The following provides additional insight into the impact of the constant currency notion and the items by which our IFRS measures and non-IFRS measures differ: The following table shows the differences between IFRS and Non-IFRS measures in our operating profit: Non-IFRS Measures (in € million)
Actual Amounts
from 2010
Estimated amounts for
20111)
Deferred support revenue write-down
74 between 20 and 30
Discontinued activities2) 983 -700
Stock-based compensation expenses3),4)
58 between 80 and 120
Acquisition-related charges5) 300 between 430 and 460
Restructuring 3 less than 10
1) All adjusting items are partly incurred in currencies other than the euro. Consequently, the amounts are subject to currency volatility. All estimates for 2011 provided in the table are at actual currency and are calculated based on certain assumptions regarding the developments of the different currency exchange rates. Depending on the future development of these exchange rates the total amounts for 2011 may differ significantly from the estimates provided in the table above. Please remember that SAP’s financial market outlook is based on constant currency. 2) We will consider all new information that emerges from further developments of the TomorrowNow lawsuit to determine if the provision should be adjusted in the future furthermore, which could result in a change to the estimate provided in the table above. 3) Our share-based payment expenses are subject, among other factors, to share price volatility, volatility in SAP’s performance against the Tech PGI index and fluctuations in SAP’s workforce. The estimates in the table above are based on certain assumptions regarding these factors. Depending on the future development of these factors the total expense for 2011 may differ significantly from these estimates. 4) The estimates provided above for share-based payment expenses are based on the share-based payment plans in place on the day of this document and grants under these plans in 2011 as currently planned by management. New share-based payment plans or changes to the existing plans may make the total amounts for 2011 differ significantly from these estimates. 5) The estimates provided above for acquisition-related charges/restructuring are based on the acquisitions performed by SAP until the day of this document. Further acquisitions may make the total amounts for 2011 differ significantly from these estimates. Historically, every 1% impact on total revenue resulting from foreign currency movements has

INTERIM MANAGEMENT REPORT 21
resulted in a 10-15 basis point movement in the operating margin. If exchange rates remained unchanged at the September 2011 level for the remainder of the year, our 2011 total year Non-IFRS SSRS revenues at actual currencies as well as our Non-IFRS total revenues at actual currencies would both be approximately 1% lower than the respective constant currency numbers, and our Non-IFRS operating margin at actual currencies would be on the same level than the respective constant currency margin. Goals for Liquidity, Finance, Investments and Dividends Our goals for liquidity, finance, investments and dividends as discussed in our Annual Report 2010 are unchanged: We have been in positive net liquidity since the end of the first quarter of 2011 and we seek to remain in that position at the end of the year. We will reduce our current financial debt level according to the given maturity profile. We will consider issuing new debt, such as bonds or U.S. private placements, only if market conditions are advantageous. Given SAP’s strong free cash flow generation over the first nine months of 2011, the Company plans to further evaluate buying back shares in the future. Excepting acquisitions, our planned capital expenditures for 2011 will be covered in full by operating cash flow. We have not changed our objective of returning about 30% of our net income to our shareholders through dividend payments. Premises on Which our Outlook is Based In preparing our outlook guidance, we have taken into account all events known to us at the time we prepared these interim financial statements that could influence SAP’s business going forward. Among the premises on which this outlook is based are those presented concerning economic development and our expectation there will not be any effects in 2011 from a major acquisition.
Medium-Term Prospects Our medium-term prospects as discussed in our 2010 Annual Report and our 2010 annual report on Form 20 F did not change in the first nine months of 2011. We still aim to increase our annual total revenue to at least €20 billion by the middle of the present decade. Over the same period, we aim to widen our non-IFRS operating margin to 35% by average annual increments of up to 100 basis points. To achieve these objectives, we are planning to realign our organizational structure to further drive growth, innovation, and simplicity.
22 INTERIM REPORT JANUARY – SEPTEMBER 2011
CONSOLIDATED INTERIM FINANCIAL STATEMENTS - IFRS (Unaudited) Consolidated Income Statements of SAP Group – Quarter 23 Consolidated Statements of Comprehensive Income of SAP Group – Quarter 24 Consolidated Income Statements of SAP Group – First Nine Months 25 Consolidated Statements of Comprehensive Income of SAP Group – First Nine Months 26 Consolidated Statements of Financial Position of SAP Group 27 Consolidated Statements of Changes in Equity of SAP Group 29 Consolidated Statements of Cash Flows of SAP Group 30 NOTES TO THE CONSOLIDATED INTERIM FINANCIAL STATEMENTS (1) General Information about the Consolidated Financial Statements 31 (2) Scope of Consolidation 31 (3) Summary of Significant Accounting Policies 31 (4) Business Combinations 32 (5) Employee Benefits Expense and Headcount 33 (6) Income Tax 34 (7) Earnings per Share 34 (8) Other Financial Assets 35 (9) Trade and Other Receivables 35 (10) Financial Liabilities 36 (11) Total Equity 36 (12) Contingent Liabilities 36 (13) Litigation and Claims 36 (14) Share-Based Payment Plans 38 (15) Other Financial Instruments 39 (16) Segment and Geographic Information 39 (17) Related Party Transactions 42
CONSOLIDATED INTERIM FINANCIAL STATEMENTS - IFRS 23
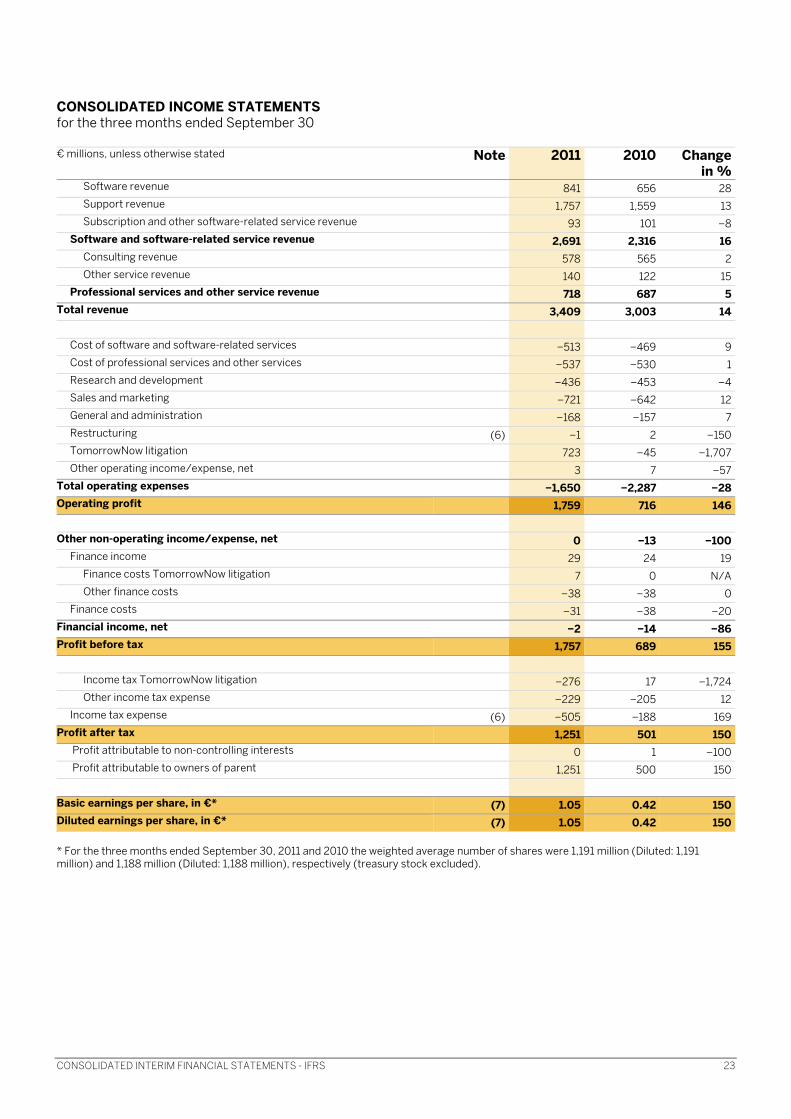
CONSOLIDATED INCOME STATEMENTS for the three months ended September 30 € millions, unless otherwise stated Note 2011 2010 Change
in %Software revenue 841 656 28Support revenue 1,757 1,559 13Subscription and other software-related service revenue 93 101 �8
Software and software-related service revenue 2,691 2,316 16Consulting revenue 578 565 2Other service revenue 140 122 15
Professional services and other service revenue 718 687 5Total revenue 3,409 3,003 14
Cost of software and software-related services �513 �469 9Cost of professional services and other services �537 �530 1Research and development �436 �453 �4Sales and marketing �721 �642 12General and administration �168 �157 7Restructuring (6) �1 2 �150TomorrowNow litigation 723 �45 �1,707Other operating income/expense, net 3 7 �57
Total operating expenses �1,650 �2,287 �28Operating profit 1,759 716 146
Other non-operating income/expense, net 0 �13 �100Finance income 29 24 19
Finance costs TomorrowNow litigation 7 0 N/AOther finance costs �38 �38 0
Finance costs �31 �38 �20Financial income, net �2 �14 �86Profit before tax 1,757 689 155
Income tax TomorrowNow litigation �276 17 �1,724Other income tax expense �229 �205 12
Income tax expense (6) �505 �188 169Profit after tax 1,251 501 150
Profit attributable to non-controlling interests 0 1 �100 Profit attributable to owners of parent 1,251 500 150
Basic earnings per share, in €* (7) 1.05 0.42 150Diluted earnings per share, in €* (7) 1.05 0.42 150 * For the three months ended September 30, 2011 and 2010 the weighted average number of shares were 1,191 million (Diluted: 1,191 million) and 1,188 million (Diluted: 1,188 million), respectively (treasury stock excluded).

24 INTERIM REPORT JANUARY – SEPTEMBER 2011
CONSOLIDATED STATEMENTS OF COMPREHENSIVE INCOME for the three months ended September 30
€ millions 2011 2010Profit after tax 1,251 501
Gains (losses) on exchange differences on translation, before tax 97 �270
Reclassification adjustments on exchange differences on translation, before tax 0 11
Exchange differences on translation 97 �259Gains (losses) on remeasuring available-for-sale financial assets, before tax �8 6
Reclassification adjustments on available-for-sale financial assets, before tax 0 0
Available-for-sale financial assets �8 6Gains (losses) on cash flow hedges, before tax �18 6
Reclassification adjustments on cash flow hedges, before tax 5 31
Cash flow hedges �13 37Actuarial gains (losses) on defined benefit plans, before tax �6 7Other comprehensive income before tax 70 �209Income tax relating to components of other comprehensive income 19 �13Other comprehensive income after tax 89 �222
Total comprehensive income 1,340 279 – attributable to non-controlling interests 0 1
– attributable to owners of parent 1,340 278
CONSOLIDATED INTERIM FINANCIAL STATEMENTS - IFRS 25
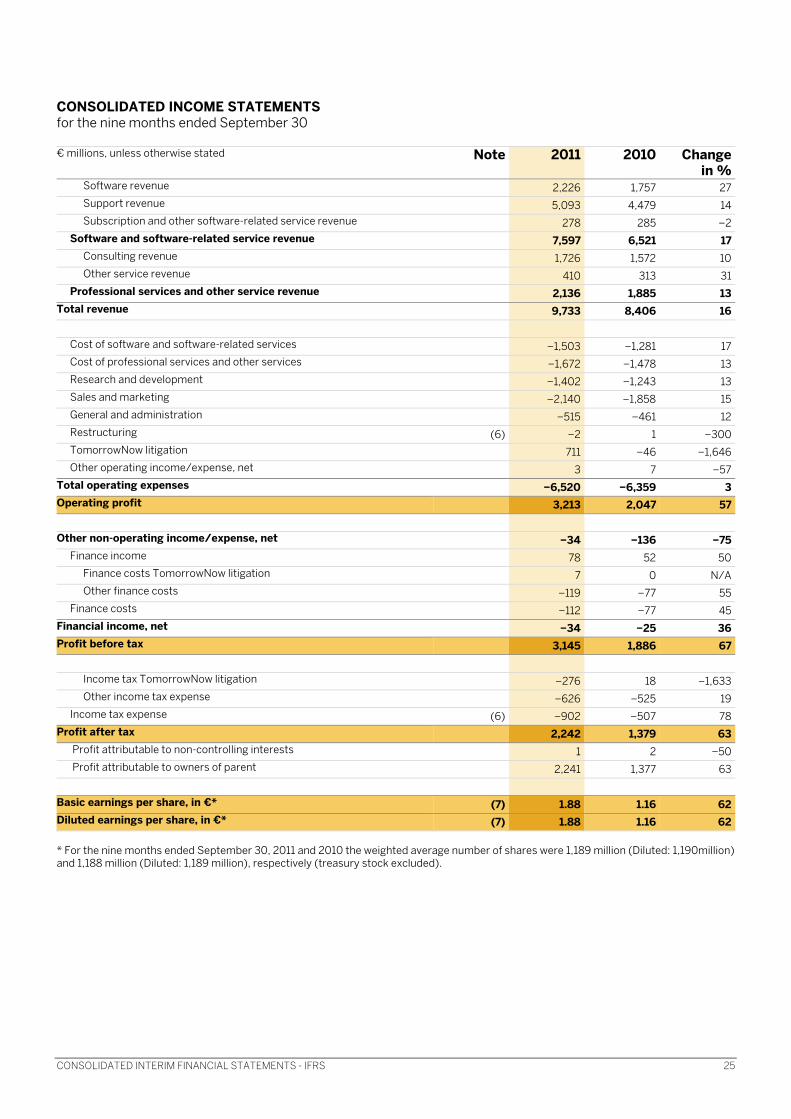
CONSOLIDATED INCOME STATEMENTS for the nine months ended September 30
€ millions, unless otherwise stated Note 2011 2010 Change in %
Software revenue 2,226 1,757 27Support revenue 5,093 4,479 14Subscription and other software-related service revenue 278 285 �2
Software and software-related service revenue 7,597 6,521 17Consulting revenue 1,726 1,572 10Other service revenue 410 313 31
Professional services and other service revenue 2,136 1,885 13Total revenue 9,733 8,406 16
Cost of software and software-related services �1,503 �1,281 17Cost of professional services and other services �1,672 �1,478 13Research and development �1,402 �1,243 13Sales and marketing �2,140 �1,858 15General and administration �515 �461 12Restructuring (6) �2 1 �300TomorrowNow litigation 711 �46 �1,646Other operating income/expense, net 3 7 �57
Total operating expenses �6,520 �6,359 3Operating profit 3,213 2,047 57
Other non-operating income/expense, net �34 �136 �75Finance income 78 52 50
Finance costs TomorrowNow litigation 7 0 N/AOther finance costs �119 �77 55
Finance costs �112 �77 45Financial income, net �34 �25 36Profit before tax 3,145 1,886 67
Income tax TomorrowNow litigation �276 18 �1,633Other income tax expense �626 �525 19
Income tax expense (6) �902 �507 78Profit after tax 2,242 1,379 63
Profit attributable to non-controlling interests 1 2 �50 Profit attributable to owners of parent 2,241 1,377 63
Basic earnings per share, in €* (7) 1.88 1.16 62Diluted earnings per share, in €* (7) 1.88 1.16 62 * For the nine months ended September 30, 2011 and 2010 the weighted average number of shares were 1,189 million (Diluted: 1,190million) and 1,188 million (Diluted: 1,189 million), respectively (treasury stock excluded).

26 INTERIM REPORT JANUARY – SEPTEMBER 2011
CONSOLIDATED STATEMENTS OF COMPREHENSIVE INCOME for the nine months ended September 30
€ millions 2011 2010Profit after tax 2,242 1,379
Gains (losses) on exchange differences on translation, before tax �71 2
Reclassification adjustments on exchange differences on translation, before tax 0 �6
Exchange differences on translation �71 �4Gains (losses) on remeasuring available-for-sale financial assets, before tax 3 5
Reclassification adjustments on available-for-sale financial assets, before tax 0 0
Available-for-sale financial assets 3 5Gains (losses) on cash flow hedges, before tax 1 �66
Reclassification adjustments on cash flow hedges, before tax 14 47
Cash flow hedges 15 �19Actuarial gains (losses) on defined benefit plans, before tax 1 �3Other comprehensive income before tax �52 �21Income tax relating to components of other comprehensive income �7 9Other comprehensive income after tax �59 �12
Total comprehensive income 2,183 1,367 – attributable to non-controlling interests 1 2
– attributable to owners of parent 2,182 1,365
CONSOLIDATED INTERIM FINANCIAL STATEMENTS - IFRS 27
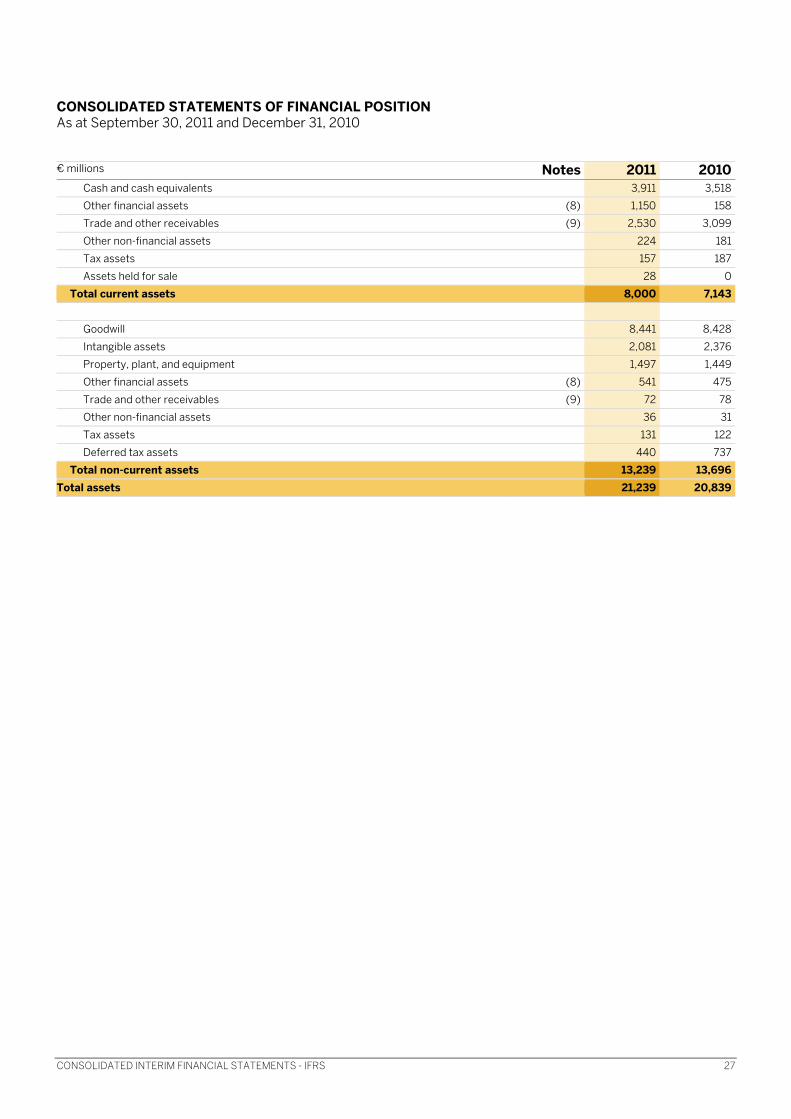
CONSOLIDATED STATEMENTS OF FINANCIAL POSITION As at September 30, 2011 and December 31, 2010
€ millions Notes 2011 2010Cash and cash equivalents 3,911 3,518
Other financial assets (8) 1,150 158
Trade and other receivables (9) 2,530 3,099
Other non-financial assets 224 181
Tax assets 157 187
Assets held for sale 28 0
Total current assets 8,000 7,143
Goodwill 8,441 8,428
Intangible assets 2,081 2,376
Property, plant, and equipment 1,497 1,449
Other financial assets (8) 541 475
Trade and other receivables (9) 72 78
Other non-financial assets 36 31
Tax assets 131 122
Deferred tax assets 440 737
Total non-current assets 13,239 13,696Total assets 21,239 20,839
28 INTERIM REPORT JANUARY – SEPTEMBER 2011
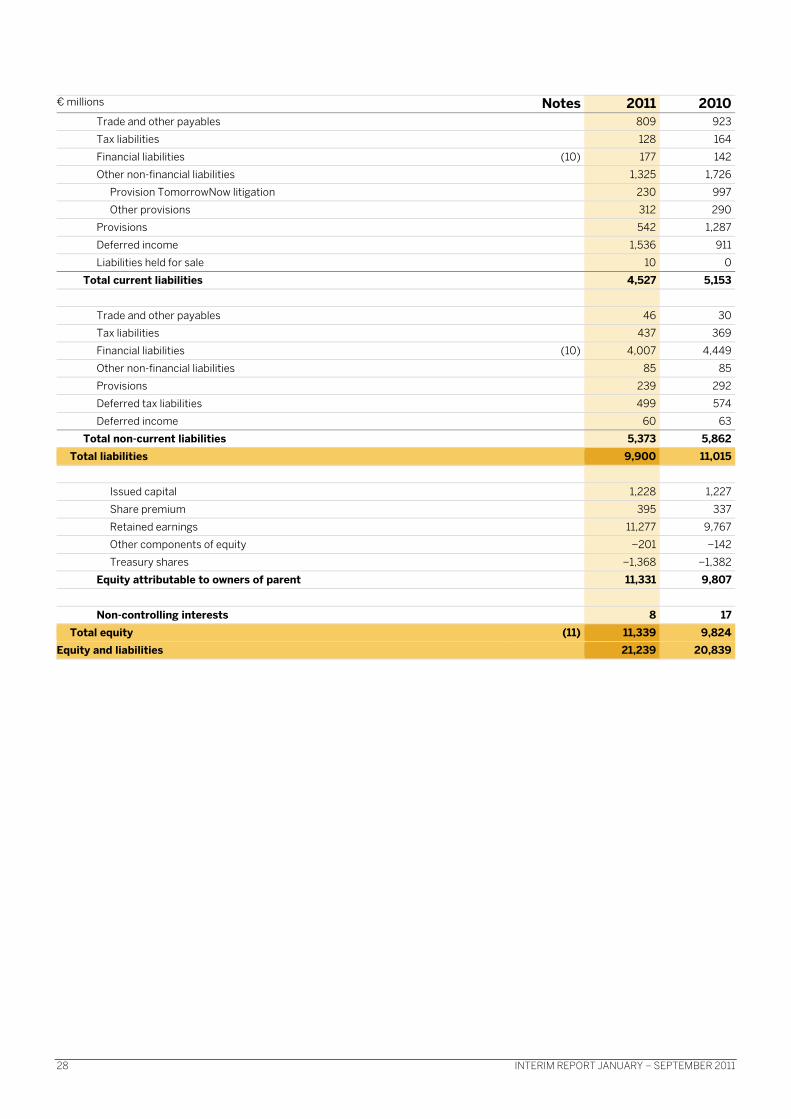
€ millions Notes 2011 2010Trade and other payables 809 923
Tax liabilities 128 164
Financial liabilities (10) 177 142
Other non-financial liabilities 1,325 1,726
Provision TomorrowNow litigation 230 997
Other provisions 312 290
Provisions 542 1,287
Deferred income 1,536 911
Liabilities held for sale 10 0
Total current liabilities 4,527 5,153
Trade and other payables 46 30
Tax liabilities 437 369
Financial liabilities (10) 4,007 4,449
Other non-financial liabilities 85 85
Provisions 239 292
Deferred tax liabilities 499 574
Deferred income 60 63
Total non-current liabilities 5,373 5,862Total liabilities 9,900 11,015
Issued capital 1,228 1,227
Share premium 395 337
Retained earnings 11,277 9,767
Other components of equity �201 �142
Treasury shares �1,368 �1,382
Equity attributable to owners of parent 11,331 9,807
Non-controlling interests 8 17Total equity (11) 11,339 9,824
Equity and liabilities 21,239 20,839
CONSOLIDATED INTERIM FINANCIAL STATEMENTS - IFRS 29
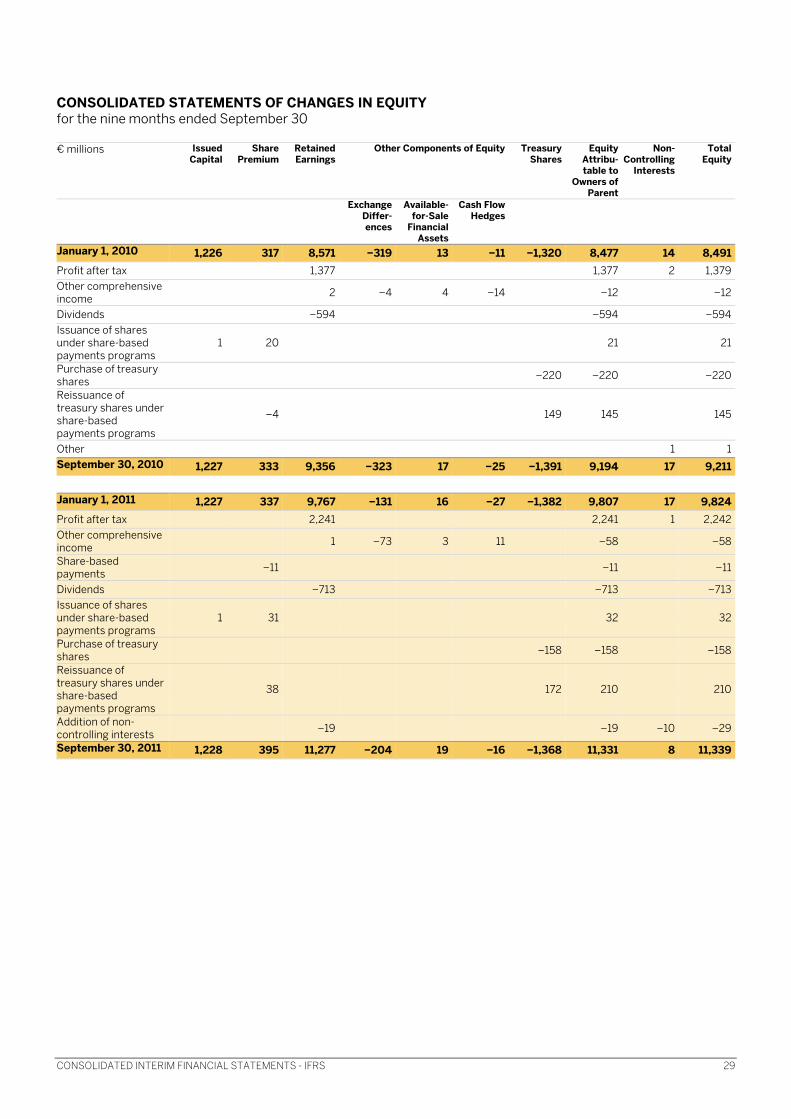
CONSOLIDATED STATEMENTS OF CHANGES IN EQUITY for the nine months ended September 30
€ millions Issued Capital
Share Premium
Retained Earnings
Other Components of Equity Treasury Shares
Equity Attribu- table to
Owners of Parent
Non-Controlling
Interests
Total Equity
Exchange Differ-ences
Available-for-Sale
Financial Assets
Cash Flow Hedges
January 1, 2010 1,226 317 8,571 �319 13 �11 �1,320 8,477 14 8,491Profit after tax 1,377 1,377 2 1,379Other comprehensive income 2 �4 4 �14 �12 �12
Dividends �594 �594 �594Issuance of shares under share-based payments programs
1 20 21 21
Purchase of treasury shares �220 �220 �220
Reissuance of treasury shares under share-based payments programs
�4 149 145 145
Other 1 1September 30, 2010 1,227 333 9,356 �323 17 �25 �1,391 9,194 17 9,211 January 1, 2011 1,227 337 9,767 �131 16 �27 �1,382 9,807 17 9,824Profit after tax 2,241 2,241 1 2,242Other comprehensive income 1 �73 3 11 �58 �58
Share-based payments �11 �11 �11
Dividends �713 �713 �713Issuance of shares under share-based payments programs
1 31 32 32
Purchase of treasury shares �158 �158 �158
Reissuance of treasury shares under share-based payments programs
38 172 210 210
Addition of non-controlling interests �19 �19 �10 �29
September 30, 2011 1,228 395 11,277 �204 19 �16 �1,368 11,331 8 11,339

30 INTERIM REPORT JANUARY – SEPTEMBER 2011
CONSOLIDATED STATEMENTS OF CASH FLOWS for the nine months ended September 30 € millions 2011 2010Profit after tax 2,242 1,379Adjustments to reconcile profit after taxes to net cash provided by operating activities:
Depreciation and amortization 536 370
Income tax expense 902 507
Finance income and finance costs, net 34 25
Gains/losses on disposals of non-current assets 2 2
Decrease/increase in sales and bad debt allowances on trade receivables 0 �9
Other adjustments for non-cash items 30 36
Decrease/increase in trade receivables 473 515
Decrease/increase in other assets �58 �371
Decrease/increase in trade payables, provisions and other liabilities �1,184 �328
Decrease/increase in deferred income 667 553
Cash flows due to TomorrowNow litigation �32 �3
Interest paid �109 �48
Interest received 65 49
Income taxes paid, net of refunds �602 �625
Net cash flows from operating activities 2,966 2,052
Business combinations, net of cash and cash equivalents acquired �66 �4,184
Purchase of intangible assets and property, plant and equipment �329 �200
Proceeds from sales of intangible assets or property, plant, and equipment 26 23
Purchase of equity or debt instruments of other entities �1,560 �687
Proceeds from sales of equity or debt instruments of other entities 518 1,248
Net cash flows from investing activities �1,411 �3,800
Purchase of non-controlling interests �24 0
Dividends paid �713 �594
Purchase of treasury shares �158 �220
Proceeds from reissuance of treasury shares 170 109
Proceeds from issuing shares (share-based compensation) 34 26
Proceeds from borrowings 519 5,019
Repayments of borrowings �1,005 �1,721
Net cash flows from financing activities �1,177 2,619
Effect of foreign exchange rates on cash and cash equivalents 15 73Net decrease/increase in cash and cash equivalents 393 944Cash and cash equivalents at the beginning of the period 3,518 1,884Cash and cash equivalents at the end of the period 3,911 2,828
CONSOLIDATED INTERIM FINANCIAL STATEMENTS - IFRS 31
NOTES TO THE CONSOLIDATED INTERIM FINANCIAL STATEMENTS (1) General Information About Consolidated Interim Financial Statements The accompanying Consolidated Interim Financial Statements of SAP AG and its subsidiaries (collectively, “we,” “us,” “our,” “SAP,” “Group,” and “Company”) have been prepared in accordance with the International Financial Reporting Standards (IFRSs). The designation IFRS includes all standards issued by the International Accounting Standards Board (IASB) and related interpretations issued by the International Financial Reporting Interpretations Committee (IFRIC). The variances between the applicable IFRS standards as issued by the IASB and the standards as used by the European Union are not relevant to these financial statements. The Consolidated Interim Financial Statements for the period ended September 30, 2011 are in compliance with International Accounting Standard (IAS) 34. Certain information and disclosures normally included in the notes to annual financial statements prepared in accordance with IFRS have been condensed or omitted. We believe that the disclosures made are adequate and that the information is not misleading. Our business activities are influenced by certain seasonal effects. Historically, our overall revenue tends to be highest in the fourth quarter. Interim results are therefore not necessarily indicative of results for a full year. The Consolidated Financial Statements for 2010 are included in our 2010 Annual Report and our Annual Report 2010 on Form 20-F. Amounts reported in previous years have been reclassified as appropriate to conform to the current presentation. The adjustment of the allocation of the acquisition price also results in non-material changes to some of the amounts reported in previous years. These unaudited condensed Consolidated Interim Financial Statements should be read in conjunction with SAP’s audited consolidated IFRS Financial Statements and notes thereto as of December 31, 2010. Due to rounding, numbers presented throughout this document may not add up precisely to the totals we provide and percentages may not precisely reflect the absolute figures.
(2) Scope of Consolidation The following table summarizes the change in the number of legal entities included in the Consolidated Financial Statements. Number of Legal Entities Consolidated in the Financial Statements
German Foreign TotalJanuary 1, 2010 19 144 163Additions 4 58 62
Disposals -2 -20 -22
December 31, 2010
21 182 203
Additions 2 5 7
Disposals 0 -12 -12
September 30, 2011
23 175 198
The additions during the first three quarters of 2011 relate to legal entities added in connection with foundations and acquisitions. The disposals are due to mergers and to liquidations of non-operating acquired legal entities. The changes in the scope of companies in 2010 had an impact on the comparability with prior years and prior quarters. This is due to our acquisition of Sybase Inc. in the third quarter of 2010, which is significant to some items in the Consolidated Financial Statements. For additional information on our business combinations and the effect on our Consolidated Financial Statements, see Note (4) or our Consolidated Financial Statements for 2010. (3) Summary of Significant Accounting Policies The interim financial statements were prepared based on the same accounting policies as those applied and described in the Consolidated Financial Statements as at December 31, 2010. Our significant accounting policies are summarized in the notes to the Consolidated Financial Statements. For further information, see Note (3) in our Consolidated Financial Statements for 2010. Newly Adopted Accounting Standards The new accounting standards adopted in the first nine months of 2011 did not have a material impact on our Consolidated Financial Statements.

32 INTERIM REPORT JANUARY – SEPTEMBER 2011
New Accounting Standards Not Yet Adopted In May 2011, the IASB issued IFRS 10 Consolidated Financial Statements, IFRS 11 Joint Arrangements, IFRS 12 Disclosure of Interests in Other Entities, a revised version of IAS 27 Separate Financial Statements, which has been amended for the issuance of IFRS 10 but retains the current guidance for separate financial statements, and a revised version of IAS 28 Investment in Associates and Joint Ventures which has been amended to conform with changes based on the issuance of IFRS 10 and IFRS 11. IFRS 10 provides a single consolidation model that identifies control as the basis for consolidation for all types of entities and replaces IAS 27 Consolidated and Separate Financial Statements and SIC-12 Consolidation — Special Purpose Entities. IFRS 11 establishes principles for the financial reporting by parties to a joint arrangement and supersedes IAS 31 Interests in Joint Ventures and SIC-13 Jointly Controlled Entities – Non-monetary Contributions by Venturers. IFRS 12 combines, enhances and replaces the disclosure requirements for subsidiaries, joint arrangements, associates, and unconsolidated structured entities. The new requirements are effective for annual periods beginning on or after January 1, 2013, with earlier application permitted. The European Union has not yet endorsed these new standards. We are currently determining the impact the new standards will have on our Consolidated Financial Statements. In May 2011, the IASB issued IFRS 13 Fair Value Measurement. IFRS 13 defines fair value, sets out in a single IFRS a framework for measuring fair value, and requires disclosures about fair value measurements. IFRS 13 applies when other IFRSs require or permit fair value measurements but it does not introduce any new requirements to measure an asset or a liability at fair value, change what is measured at fair value in IFRSs, or address how to present changes in fair value. The new requirements are effective for annual periods beginning on or after January 1, 2013, with earlier application permitted. The European Union has not yet endorsed the new standard. The application of the standard will not have a significant impact on our Consolidated Financial Statements. In June 2011, the IASB issued amendments to IAS 1 Presentation of Financial Statements (effective for annual periods beginning on or after July 1, 2012, with earlier application permitted) and IAS 19 Employee Benefits (effective for annual periods beginning on or after January 1, 2013, with earlier
application permitted). The amendments to IAS 1 aim to improve and align the presentation of items of other comprehensive income in financial statements prepared in accordance with IFRS and US GAAP and will impact the presentation of items within the Consolidated Statements of Comprehensive Income. The amendments to IAS 19 aim to improve the understanding of how defined benefit plans affect an entity’s financial position, financial performance and cash flows; we are currently determining the impact the amended standard will have on our Consolidated Financial Statements. The European Union has not yet endorsed the amended standards. For additional information about new accounting standards not yet adopted, see Note (3) in our Consolidated Financial Statements for 2010. (4) Business Combinations We acquired the following businesses during the first three quarters in 2011: Acquired Businesses Business Acquired
Sector Acquisi-tion Type
Acquired Voting Interest
Acquisi-tion Date
SECUDE AG, Emmetten, Switzerland
SECUDE is a privately held entity engaged in IT security software products and solutions
Asset Purchase
n/a February 1, 2011
Right Hemisphere Inc., San Ramon, CA, USA
Right Hemis- phere is a privately held entity focusing on visual enterprise solutions
Share Purchase
100% September 16, 2011
We acquire businesses in specific areas of strategic interest to us. The acquisitions during the first three quarters of 2011 were not material to SAP. Our acquisition in the third quarter is recorded with provisional estimates. In addition, deferred taxes for our acquisition in the first quarter are still under review. Acquisitions of the prior year are described in the Consolidated Financial Statements for 2010 in our 2010 Annual Report.
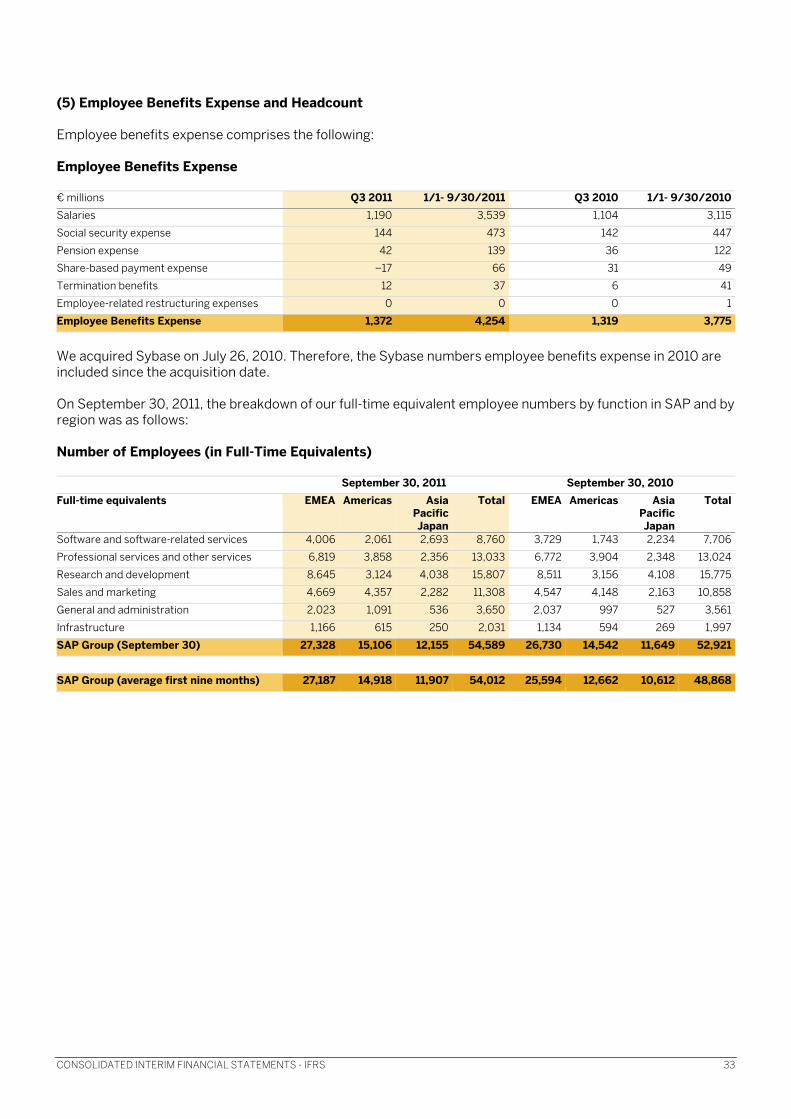
CONSOLIDATED INTERIM FINANCIAL STATEMENTS - IFRS 33
(5) Employee Benefits Expense and Headcount Employee benefits expense comprises the following: Employee Benefits Expense € millions Q3 2011 1/1- 9/30/2011 Q3 2010 1/1- 9/30/2010Salaries 1,190 3,539 1,104 3,115
Social security expense 144 473 142 447
Pension expense 42 139 36 122
Share-based payment expense �17 66 31 49
Termination benefits 12 37 6 41
Employee-related restructuring expenses 0 0 0 1
Employee Benefits Expense 1,372 4,254 1,319 3,775
We acquired Sybase on July 26, 2010. Therefore, the Sybase numbers employee benefits expense in 2010 are included since the acquisition date. On September 30, 2011, the breakdown of our full-time equivalent employee numbers by function in SAP and by region was as follows: Number of Employees (in Full-Time Equivalents) September 30, 2011 September 30, 2010Full-time equivalents EMEA Americas Asia
Pacific Japan
Total EMEA Americas Asia Pacific Japan
Total
Software and software-related services 4,006 2,061 2,693 8,760 3,729 1,743 2,234 7,706
Professional services and other services 6,819 3,858 2,356 13,033 6,772 3,904 2,348 13,024
Research and development 8,645 3,124 4,038 15,807 8,511 3,156 4,108 15,775
Sales and marketing 4,669 4,357 2,282 11,308 4,547 4,148 2,163 10,858
General and administration 2,023 1,091 536 3,650 2,037 997 527 3,561
Infrastructure 1,166 615 250 2,031 1,134 594 269 1,997
SAP Group (September 30) 27,328 15,106 12,155 54,589 26,730 14,542 11,649 52,921 SAP Group (average first nine months) 27,187 14,918 11,907 54,012 25,594 12,662 10,612 48,868

34 INTERIM REPORT JANUARY – SEPTEMBER 2011
The allocations of expenses for share-based payments to the various expense items are as follows: Share-Based Payments
€ millions Q3 2011
1/1- 9/30/
2011
Q3 2010
1/1- 9/30/
2010Cost of software and software-related services
2 �5 �4 �4
Cost of professional services and other services
2 �12 �8 �9
Research and development 9 �16 �10 �19
Sales and marketing 6 �14 �6 �10
General and administration �2 �19 �3 �7
Total share-based payments 17 �66 �31 �49
(6) Income Tax In the third quarter and the first nine months of 2011, income taxes and the effective tax rate, each compared with the third quarter and the first nine months of 2010, developed as follows:
Income Taxes € millions, unless stated otherwise
Q32011
1/1 - 9/30/
2011
Q32010
1/1 -9/30/
2010Profit before income tax 1,757 3,145 689 1,886
Income tax expense �505 �902 �188 �507
Effective tax rate in % 28.7 28.7 27.3 26.9
As a result of the tax audit of SAP AG and its German subsidiaries for the years 2003 through 2006, we are in dispute with the German tax authorities in respect of intercompany financing matters. We strongly disagree with the tax authorities’ position and intend to vigorously contest it. Currently, we expect that we will need to initiate litigation to prevail. We have not recorded a provision for this matter, as we believe, supported by external professional advice, that this claim has no merit and that no adjustment is warranted. If, contrary to our view, the German tax authorities were to prevail in their arguments before the court, we would expect to have an additional tax expense (including related interest expense) for the tax audit period 2003-2006 and for the unaudited period 2007-2011 of approximately €130 million in total.
(7) Earnings per Share Starting in the third quarter of 2010, diluted EPS includes the dilutive effect of bonus shares granted under the Share Matching Plan. Earnings per Share € millions, unless otherwise stated Q3 2011 1/1- 9/30/2011 Q3 2010 1/1- 9/30/2010Profit attributable to owners of parent 1,251 2,241 500 1,377
Issued ordinary shares 1,228 1,227 1,227 1,226
Effect of treasury shares �38 �38 �39 �38
Weighted average number of shares in millions – basic
1,190 1,189 1,188 1,188
Dilutive effect of convertible bonds in millions 0 1 0 0
Dilutive effect of stock options in millions 0 0 0 1
Weighted average number of shares in millions – diluted
1,190 1,190 1,188 1,189
Basic earnings per share in €, attributable to owners of parent
1.05 1.88 0.42 1.16
Diluted earnings per share in €, attributable to owners of parent
1.05 1.88 0.42 1.16
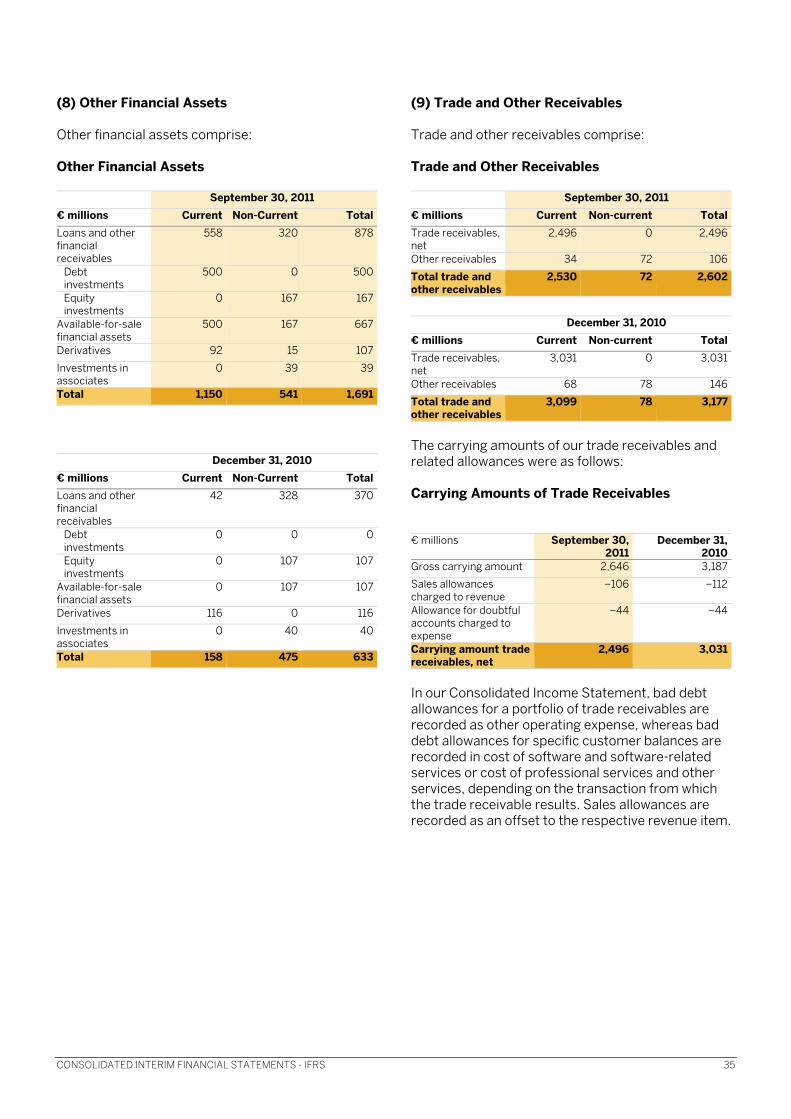
CONSOLIDATED INTERIM FINANCIAL STATEMENTS - IFRS 35
(8) Other Financial Assets Other financial assets comprise: Other Financial Assets September 30, 2011 € millions Current Non-Current TotalLoans and other financial receivables
558 320 878
Debt investments
500 0 500
Equity investments
0 167 167
Available-for-sale financial assets
500 167 667
Derivatives 92 15 107
Investments in associates
0 39 39
Total 1,150 541 1,691
December 31, 2010 € millions Current Non-Current TotalLoans and other financial receivables
42 328 370
Debt investments
0 0 0
Equity investments
0 107 107
Available-for-sale financial assets
0 107 107
Derivatives 116 0 116
Investments in associates
0 40 40
Total 158 475 633
(9) Trade and Other Receivables Trade and other receivables comprise: Trade and Other Receivables
September 30, 2011€ millions Current Non-current TotalTrade receivables, net
2,496 0 2,496
Other receivables 34 72 106
Total trade and other receivables
2,530 72 2,602
December 31, 2010
€ millions Current Non-current TotalTrade receivables, net
3,031 0 3,031
Other receivables 68 78 146
Total trade and other receivables
3,099 78 3,177
The carrying amounts of our trade receivables and related allowances were as follows: Carrying Amounts of Trade Receivables € millions September 30,
2011 December 31,
2010Gross carrying amount 2,646 3,187
Sales allowances charged to revenue
�106 �112
Allowance for doubtful accounts charged to expense
�44 �44
Carrying amount trade receivables, net
2,496 3,031
In our Consolidated Income Statement, bad debt allowances for a portfolio of trade receivables are recorded as other operating expense, whereas bad debt allowances for specific customer balances are recorded in cost of software and software-related services or cost of professional services and other services, depending on the transaction from which the trade receivable results. Sales allowances are recorded as an offset to the respective revenue item.
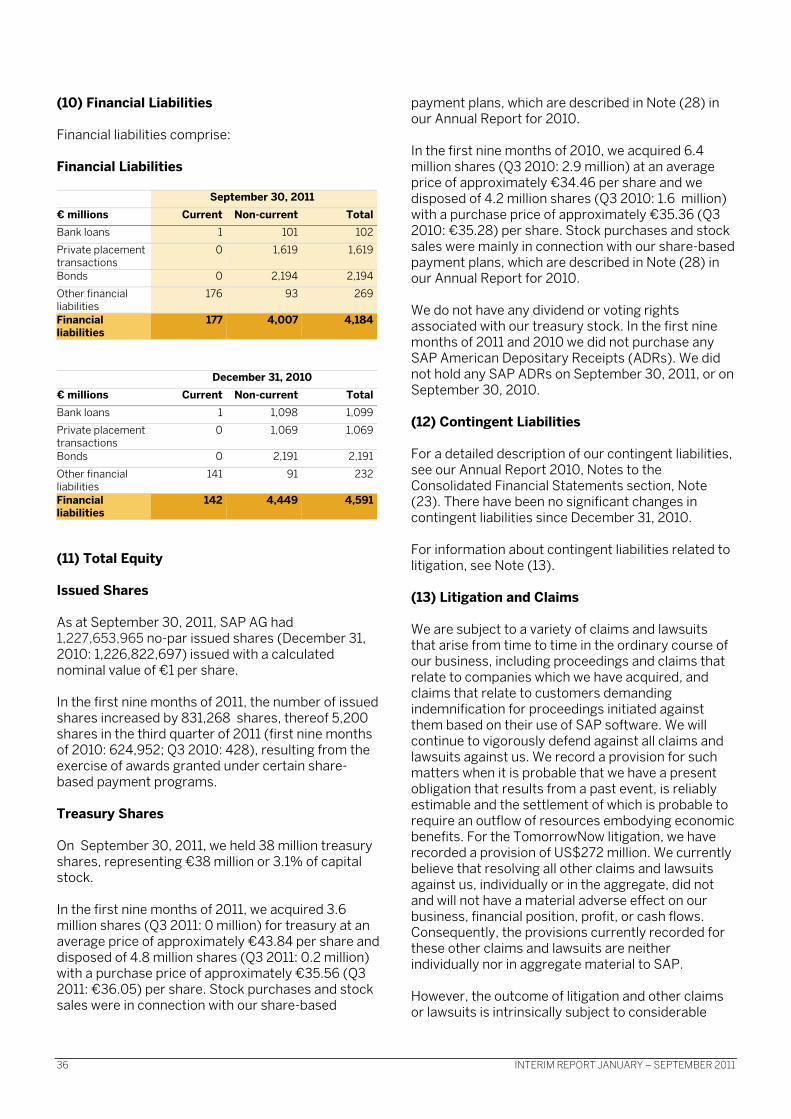
36 INTERIM REPORT JANUARY – SEPTEMBER 2011
(10) Financial Liabilities Financial liabilities comprise: Financial Liabilities
September 30, 2011 € millions Current Non-current TotalBank loans 1 101 102
Private placement transactions
0 1,619 1,619
Bonds 0 2,194 2,194
Other financial liabilities
176 93 269
Financial liabilities
177 4,007 4,184
December 31, 2010 € millions Current Non-current TotalBank loans 1 1,098 1,099
Private placement transactions
0 1,069 1,069
Bonds 0 2,191 2,191
Other financial liabilities
141 91 232
Financial liabilities
142 4,449 4,591
(11) Total Equity Issued Shares As at September 30, 2011, SAP AG had 1,227,653,965 no-par issued shares (December 31, 2010: 1,226,822,697) issued with a calculated nominal value of €1 per share. In the first nine months of 2011, the number of issued shares increased by 831,268 �shares, thereof 5,200 shares in the third quarter of 2011 (first nine months of 2010: 624,952; Q3 2010: 428), resulting from the exercise of awards granted under certain share-based payment programs. Treasury Shares On September 30, 2011, we held 38 million treasury shares, representing €38 million or 3.1% of capital stock. In the first nine months of 2011, we acquired 3.6 million shares (Q3 2011: 0 million) for treasury at an average price of approximately €43.84 per share and disposed of 4.8 million shares (Q3 2011: 0.2 million) with a purchase price of approximately €35.56 (Q3 2011: €36.05) per share. Stock purchases and stock sales were in connection with our share-based
payment plans, which are described in Note (28) in our Annual Report for 2010. In the first nine months of 2010, we acquired 6.4 million shares (Q3 2010: 2.9 million) at an average price of approximately €34.46 per share and we disposed of 4.2 million shares (Q3 2010: 1.6 million) with a purchase price of approximately €35.36 (Q3 2010: €35.28) per share. Stock purchases and stock sales were mainly in connection with our share-based payment plans, which are described in Note (28) in our Annual Report for 2010. We do not have any dividend or voting rights associated with our treasury stock. In the first nine months of 2011 and 2010 we did not purchase any SAP American Depositary Receipts (ADRs). We did not hold any SAP ADRs on September 30, 2011, or on September 30, 2010. (12) Contingent Liabilities For a detailed description of our contingent liabilities, see our Annual Report 2010, Notes to the Consolidated Financial Statements section, Note (23). There have been no significant changes in contingent liabilities since December 31, 2010. For information about contingent liabilities related to litigation, see Note (13). (13) Litigation and Claims We are subject to a variety of claims and lawsuits that arise from time to time in the ordinary course of our business, including proceedings and claims that relate to companies which we have acquired, and claims that relate to customers demanding indemnification for proceedings initiated against them based on their use of SAP software. We will continue to vigorously defend against all claims and lawsuits against us. We record a provision for such matters when it is probable that we have a present obligation that results from a past event, is reliably estimable and the settlement of which is probable to require an outflow of resources embodying economic benefits. For the TomorrowNow litigation, we have recorded a provision of US$272 million. We currently believe that resolving all other claims and lawsuits against us, individually or in the aggregate, did not and will not have a material adverse effect on our business, financial position, profit, or cash flows. Consequently, the provisions currently recorded for these other claims and lawsuits are neither individually nor in aggregate material to SAP. However, the outcome of litigation and other claims or lawsuits is intrinsically subject to considerable
CONSOLIDATED INTERIM FINANCIAL STATEMENTS - IFRS 37
uncertainty. Management’s view of the litigation may also change in the future. Actual outcomes of litigation and other claims or lawsuits may differ from the assessments made by management in prior periods, which could result in a material impact on our business, financial position, profit, cash flows, or reputation. We cannot reliably estimate the maximum possible loss in case of an unfavorable outcome. For a description of the development of the provisions recorded for litigation, see Note (19b) in our Annual Report 2010. Among the claims and lawsuits are the following: Intellectual Property Litigation In January 2007, German-based CSB-Systems AG (CSB) instituted legal proceedings in Germany against SAP. CSB alleges that SAP’s products infringe one or more of the claims of a German patent and a German utility model held by CSB. In its complaint, CSB has set the amount in dispute at €1 million and is seeking permanent injunctive relief. Within these proceedings CSB is not precluded from requesting damages in excess of the amount in dispute. In July 2007, SAP filed its response in the legal proceedings including a nullity action and cancellation proceeding against the patent and utility model, respectively. The nullity hearing on the German patent was held in January 2009 and the German court determined that the patent is invalid. On appeal in June 2011, the Federal Supreme Court also concluded the patent was invalid. The cancellation hearing for the utility model was held in May 2009 and the court determined that the utility model was invalid. CSB is appealing the invalidity determination of the utility model, however, the infringement hearing has been stayed pending the appeals. In May 2010, CSB-Systems International, Inc. (CSB) instituted legal proceedings in the United States against SAP. CSB alleges that SAP’s products infringe one or more of the claims in one patent held by CSB. In its complaint, CSB seeks unspecified monetary damages and permanent injunctive relief. The Markman hearing was held in June 2011. The trial is scheduled for March 2012. In March 2007, United States-based Oracle Corporation and certain of its subsidiaries (Oracle) instituted legal proceedings in the United States against TomorrowNow, Inc., its parent company SAP America, Inc. and SAP America’s parent company SAP AG (SAP). Oracle filed several amended complaints between 2007 and 2009. As amended,
the lawsuit alleges copyright infringement, violations of the Federal Computer Fraud and Abuse Act and the California Computer Data Access and Fraud Act, unfair competition, intentional and negligent interference with prospective economic advantage, and civil conspiracy. The lawsuit alleges that SAP unlawfully copied and misappropriated proprietary, copyrighted software products and other confidential materials developed by Oracle to service its own customers. The lawsuit seeks injunctive relief and monetary damages, including punitive damages, alleged by Oracle to be in the billions of U.S. dollars. The trial was held in November 2010. Prior to trial, SAP AG, SAP America and TomorrowNow stipulated to liability for certain claims, and SAP agreed to pay Oracle US$120 million for attorneys‘ fees. After the trial, the jury returned a damages verdict of US$1.3 billion. The judgment which was issued on February 3, 2011, additionally provided for prejudgment interest of US$15 million. The judgment amount is also subject to post-judgment interest, which accrues from the time judgment is entered. We believed both before and during the trial and continue to believe that the hypothetical license theory is not an appropriate basis for calculating the damages. Instead, we believe that damages should be based on lost profits and infringer’s profits. As such, SAP filed post-trial motions asking the judge to overturn the judgment. A hearing on the post-trial motions was held in July 2011. On September 1, 2011, the trial judge issued an order which set aside the jury verdict and vacated that part of the judgment awarding US $1.3 billion in damages. The trial judge also gave Oracle the choice of electing to accept reduced damages of US $272 million or having a new trial on damages based on lost profits and infringer's profits. Oracle has filed a motion seeking an early appeal from the ruling vacating the jury's damages award; that motion is pending. Oracle's deadline to accept the reduced damages of US$272 million will not run until after the trial judge rules on that motion, and potentially after an early appeal, depending on the outcome of the motion. Additionally, in June 2007, SAP became aware that the United States Department of Justice (U.S. DOJ) had opened an investigation concerning related issues and had issued subpoenas to SAP and TomorrowNow. The DOJ investigation has been resolved by way of a plea agreement which includes TomorrowNow pleading guilty to 11 counts of violations of the Computer Fraud and Abuse Act, 1 count of criminal copyright infringement, the payment of a US $20 million fine and 3 years probation. No charges were brought against SAP.
38 INTERIM REPORT JANUARY – SEPTEMBER 2011
In April 2007, United States-based Versata Software, Inc. (formerly Trilogy Software, Inc.) (Versata) instituted legal proceedings in the United States against SAP. Versata alleges that SAP’s products infringe one or more of the claims in each of five patents held by Versata. In its complaint, Versata seeks unspecified monetary damages and permanent injunctive relief. The trial was held in August 2009. The jury returned a verdict in favor of Versata and awarded Versata US$138.6 million for past damages. In January 2011, the court vacated the jury’s damages award and ordered a new trial on damages in May 2011. The re-trial was held in May 2011. The jury returned a verdict in favor of Versata and awarded Versata US$345 million for past damages. Versata is seeking an injunction and an injunction hearing was held in June 2011. SAP has filed post-trial motions in July 2011. In September 2011, the judge denied SAP’s post-trial motions with the exception of reducing the damages verdict by US$16 million to approximately US$329 million. The judge also ordered approximately US$60 million in pre-judgment interest. Additionally, the judge granted Versata’s request for a broad injunction which prohibits SAP from 1) selling products in the U.S. with the infringing functionality, 2) providing maintenance or accepting maintenance revenue from existing customers in the U.S. until such customers disable the infringing functionality and verify such disablement, and 3) licensing additional users to existing customers in the U.S. until such customers disable the infringing functionality and verify such disablement. Finally, the judge stayed the injunction, however, pending the outcome of an appeal. SAP intends to appeal. In August 2007, United States-based elcommerce.com, Inc. (elcommerce) instituted legal proceedings in the United States against SAP. elcommerce alleges that SAP’s products infringe one or more of the claims in one patent held by elcommerce. In its complaint, elcommerce seeks unspecified monetary damages and permanent injunctive relief. The court in East Texas granted SAP’s request to transfer the litigation from East Texas to Pennsylvania. Subsequent to the Markman ruling by the court, the parties agreed to the entry of final judgment regarding non-infringement by SAP. elcommerce has appealed the court's Markman ruling. In February 2010, United States-based TecSec, Inc. (TecSec) instituted legal proceedings in the United States against SAP, Sybase, IBM and many other defendants. TecSec alleges that SAP’s products infringe one or more of the claims in five patents held by TecSec. In its complaint, TecSec seeks unspecified monetary damages and permanent
injunctive relief. The trial has not yet been scheduled. The legal proceedings have been stayed against all defendants pending the outcome of an appeal by TecSec regarding the court's determination that IBM does not infringe the patents. In April 2010, SAP instituted legal proceedings (a Declaratory Judgment action) in the United States against Wellogix, Inc. and Wellogix Technology Licensing, LLC (Wellogix). The lawsuit seeks a declaratory judgment that five patents owned by Wellogix are invalid and/or not infringed by SAP. The trial has not yet been scheduled. The legal proceedings have been stayed pending the outcome of re-examinations filed with the U.S. Patent and Trademark Office. Other Litigation In April 2008, South African-based Systems Applications Consultants (PTY) Limited (Securinfo) instituted legal proceedings in South Africa against SAP. Securinfo alleges that SAP has caused one of its subsidiaries to breach a software distribution agreement with Securinfo. In its complaint, Securinfo seeks damages of approximately €610 million plus interest. In September 2009, SAP filed a motion to dismiss. A trial date which was scheduled for June 2011 has been postponed. No new trial date has been scheduled yet. For tax-related litigations please refer to Note (6). (14) Share-Based Payment Plans For a detailed description of our share-based payment plans, see the SAP Annual Report 2010, Notes to the Consolidated Financial Statements section, Note (28), or our Annual Report 2010 on Form 20-F. In June 2011, we issued the following share-based payment plans to our employees and the members of the Executive Board: Under the Share Matching Plan 2011 (SMP 2011), SAP offered its employees the opportunity to purchase SAP AG shares at a discount of 40%. The number of SAP shares an eligible employee was able to purchase was limited to a percentage of the employee’s annual base salary. After a holding period of three years, the employees receive one SAP share free of charge for every three shares held. The terms for the members of the senior leadership team (SLT) are different. Instead of receiving a discount, they are granted two bonus shares for every three shares acquired and held during the three-year vesting period. The participants purchased 1.3 million SAP
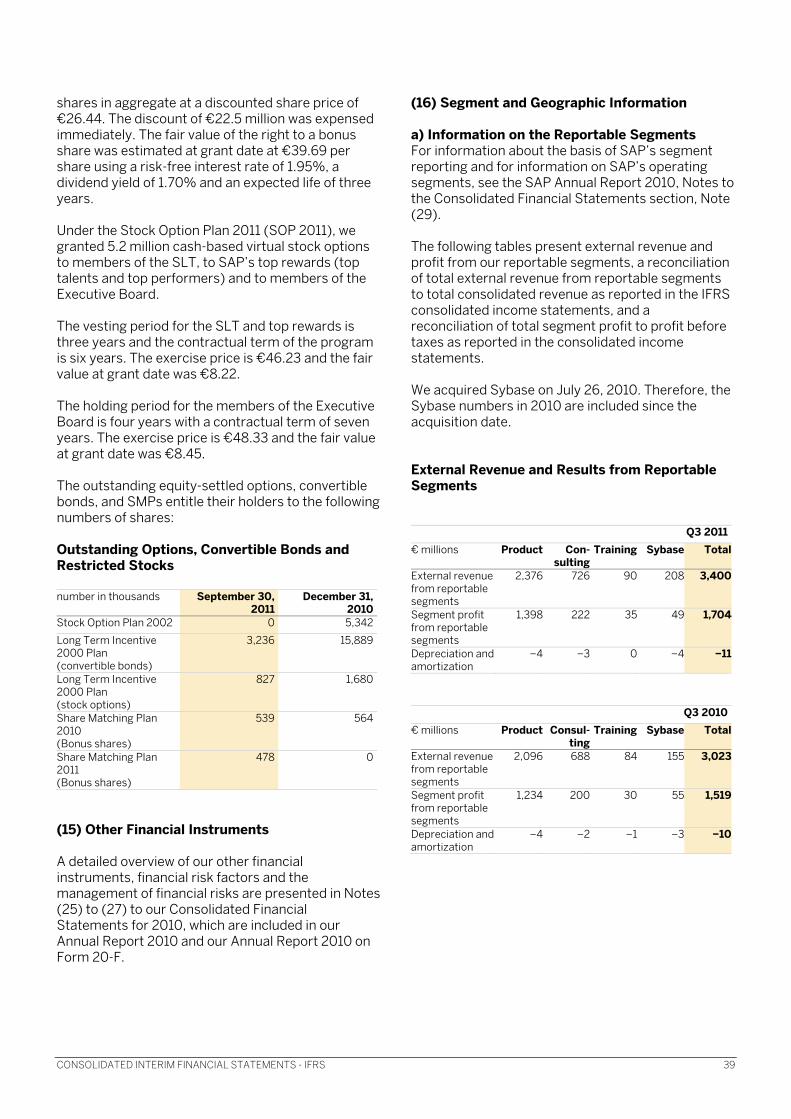
CONSOLIDATED INTERIM FINANCIAL STATEMENTS - IFRS 39
shares in aggregate at a discounted share price of €26.44. The discount of €22.5 million was expensed immediately. The fair value of the right to a bonus share was estimated at grant date at €39.69 per share using a risk-free interest rate of 1.95%, a dividend yield of 1.70% and an expected life of three years. Under the Stock Option Plan 2011 (SOP 2011), we granted 5.2 million cash-based virtual stock options to members of the SLT, to SAP’s top rewards (top talents and top performers) and to members of the Executive Board. The vesting period for the SLT and top rewards is three years and the contractual term of the program is six years. The exercise price is €46.23 and the fair value at grant date was €8.22. The holding period for the members of the Executive Board is four years with a contractual term of seven years. The exercise price is €48.33 and the fair value at grant date was €8.45. The outstanding equity-settled options, convertible bonds, and SMPs entitle their holders to the following numbers of shares: Outstanding Options, Convertible Bonds and Restricted Stocks number in thousands September 30,
2011 December 31,
2010Stock Option Plan 2002 0 5,342
Long Term Incentive 2000 Plan (convertible bonds)
3,236 15,889
Long Term Incentive 2000 Plan (stock options)
827 1,680
Share Matching Plan 2010 (Bonus shares)
539 564
Share Matching Plan 2011 (Bonus shares)
478 0
(15) Other Financial Instruments A detailed overview of our other financial instruments, financial risk factors and the management of financial risks are presented in Notes (25) to (27) to our Consolidated Financial Statements for 2010, which are included in our Annual Report 2010 and our Annual Report 2010 on Form 20-F.
(16) Segment and Geographic Information a) Information on the Reportable Segments For information about the basis of SAP’s segment reporting and for information on SAP’s operating segments, see the SAP Annual Report 2010, Notes to the Consolidated Financial Statements section, Note (29). The following tables present external revenue and profit from our reportable segments, a reconciliation of total external revenue from reportable segments to total consolidated revenue as reported in the IFRS consolidated income statements, and a reconciliation of total segment profit to profit before taxes as reported in the consolidated income statements. We acquired Sybase on July 26, 2010. Therefore, the Sybase numbers in 2010 are included since the acquisition date. External Revenue and Results from Reportable Segments
Q3 2011
€ millions Product Con-sulting
Training Sybase Total
External revenue from reportable segments
2,376 726 90 208 3,400
Segment profit from reportable segments
1,398 222 35 49 1,704
Depreciation and amortization
�4 �3 0 �4 �11
Q3 2010€ millions Product Consul-
tingTraining Sybase Total
External revenue from reportable segments
2,096 688 84 155 3,023
Segment profit from reportable segments
1,234 200 30 55 1,519
Depreciation and amortization
�4 �2 �1 �3 �10
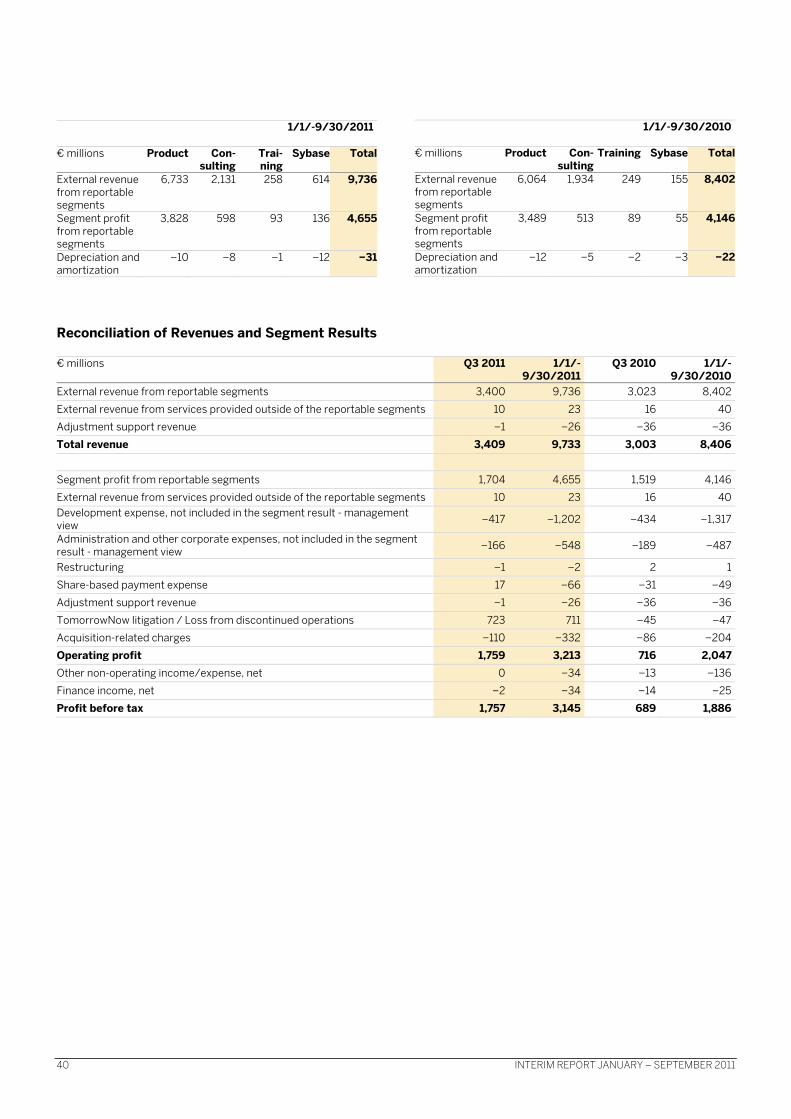
40 INTERIM REPORT JANUARY – SEPTEMBER 2011
1/1/-9/30/2011
€ millions Product Con-sulting
Trai-ning
Sybase Total
External revenue from reportable segments
6,733 2,131 258 614 9,736
Segment profit from reportable segments
3,828 598 93 136 4,655
Depreciation and amortization
�10 �8 �1 �12 �31
Reconciliation of Revenues and Segment Results
€ millions Q3 2011 1/1/-9/30/2011
Q3 2010 1/1/-9/30/2010
External revenue from reportable segments 3,400 9,736 3,023 8,402
External revenue from services provided outside of the reportable segments 10 23 16 40
Adjustment support revenue �1 �26 �36 �36
Total revenue 3,409 9,733 3,003 8,406
Segment profit from reportable segments 1,704 4,655 1,519 4,146
External revenue from services provided outside of the reportable segments 10 23 16 40Development expense, not included in the segment result - management view �417 �1,202 �434 �1,317
Administration and other corporate expenses, not included in the segment result - management view �166 �548 �189 �487
Restructuring �1 �2 2 1
Share-based payment expense 17 �66 �31 �49
Adjustment support revenue �1 �26 �36 �36
TomorrowNow litigation / Loss from discontinued operations 723 711 �45 �47
Acquisition-related charges �110 �332 �86 �204
Operating profit 1,759 3,213 716 2,047Other non-operating income/expense, net 0 �34 �13 �136
Finance income, net �2 �34 �14 �25
Profit before tax 1,757 3,145 689 1,886
1/1/-9/30/2010
€ millions Product Con-sulting
Training Sybase Total
External revenue from reportable segments
6,064 1,934 249 155 8,402
Segment profit from reportable segments
3,489 513 89 55 4,146
Depreciation and amortization
�12 �5 �2 �3 �22
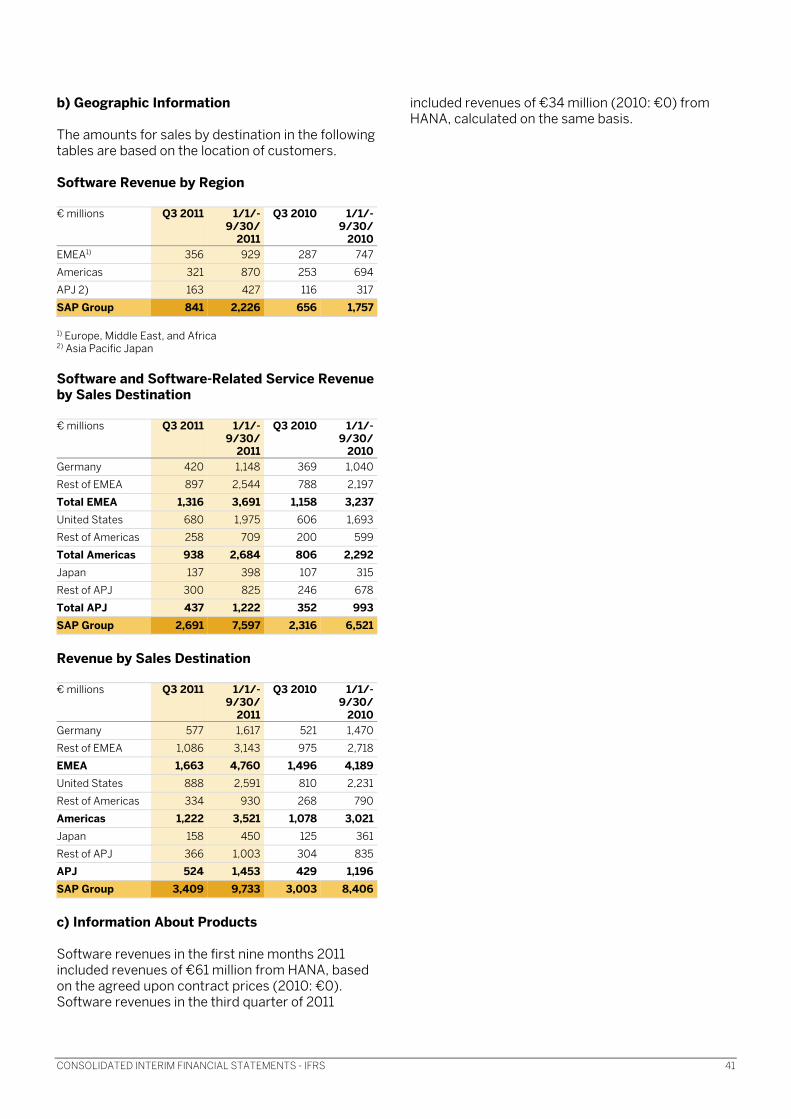
CONSOLIDATED INTERIM FINANCIAL STATEMENTS - IFRS 41
b) Geographic Information The amounts for sales by destination in the following tables are based on the location of customers. Software Revenue by Region € millions Q3 2011 1/1/-
9/30/ 2011
Q3 2010 1/1/-9/30/
2010EMEA1) 356 929 287 747
Americas 321 870 253 694
APJ 2) 163 427 116 317
SAP Group 841 2,226 656 1,757
1) Europe, Middle East, and Africa 2) Asia Pacific Japan Software and Software-Related Service Revenue by Sales Destination € millions Q3 2011 1/1/-
9/30/ 2011
Q3 2010 1/1/-9/30/
2010Germany 420 1,148 369 1,040
Rest of EMEA 897 2,544 788 2,197
Total EMEA 1,316 3,691 1,158 3,237United States 680 1,975 606 1,693
Rest of Americas 258 709 200 599
Total Americas 938 2,684 806 2,292Japan 137 398 107 315
Rest of APJ 300 825 246 678
Total APJ 437 1,222 352 993SAP Group 2,691 7,597 2,316 6,521 Revenue by Sales Destination € millions Q3 2011 1/1/-
9/30/ 2011
Q3 2010 1/1/-9/30/
2010Germany 577 1,617 521 1,470
Rest of EMEA 1,086 3,143 975 2,718
EMEA 1,663 4,760 1,496 4,189United States 888 2,591 810 2,231
Rest of Americas 334 930 268 790
Americas 1,222 3,521 1,078 3,021Japan 158 450 125 361
Rest of APJ 366 1,003 304 835
APJ 524 1,453 429 1,196SAP Group 3,409 9,733 3,003 8,406 c) Information About Products Software revenues in the first nine months 2011 included revenues of €61 million from HANA, based on the agreed upon contract prices (2010: €0). Software revenues in the third quarter of 2011
included revenues of €34 million (2010: €0) from HANA, calculated on the same basis.
42 INTERIM REPORT JANUARY – SEPTEMBER 2011
(17) Related Party Transactions Certain Executive Board and Supervisory Board members of SAP AG currently hold (or have held within the last year) positions of significant responsibility with other entities (see the SAP Annual Report 2010, Notes to the Consolidated Financial Statements section, Note (30)). We have relationships with certain of these entities in the ordinary course of business whereby we buy and sell a wide variety of services and products at prices believed to be consistent with those negotiated at arm’s length between unrelated parties. During the reporting period we had no related party transactions that had a material effect on our business, financial position, or results in the reporting period. For further information on related party transactions, see the SAP Annual Report 2010, Notes to the Consolidated Financial Statements section, Note (31). Release of the Interim Financial Statements The SAP Chief Financial Officer on behalf of the Executive Board approved these Consolidated Interim Financial Statements for the third quarter of 2011 on October 25, 2011, for submission to the Audit Committee of the Supervisory Board and for subsequent issuance.

ADDITIONAL FINANCIAL INFORMATION 43
ADDITIONAL FINANCIAL INFORMATION (UNAUDITED) IFRS AND NON-IFRS FINANCIAL DATA RECONCILIATION FROM NON-IFRS NUMBERS TO IFRS NUMBERS The following tables present a reconciliation from our non-IFRS numbers (including our non-IFRS at constant currency numbers) to the respective most comparable IFRS numbers. Note: Our non-IFRS numbers are not prepared under a comprehensive set of accounting rules or principles.
Three months ended September 30
€ millions, unless otherwise stated 2011 2010 Change in %
IFRS Adj.* Non-IFRS*
Currencyimpact**
Non-IFRSconstant
currency**
IFRS Adj.* Non-IFRS*
IFRS Non-IFRS*
Non-IFRSconstant
currency**Non-IFRS Revenue Numbers
Software revenue 841 0 841 26 867 656 0 656 28 28 32Support revenue 1,757 1 1,758 47 1,805 1,559 36 1,595 13 10 13Subscription and other software-related service revenue
93 0 93 1 94 101 0 101 �8 �8 �7
Software and software-related service revenue
2,691 1 2,692 74 2,766 2,316 36 2,352 16 14 18
Consulting revenue 578 0 578 19 597 565 0 565 2 2 6Other service revenue 140 0 140 4 144 122 0 122 15 15 18
Professional services and other service revenue
718 0 718 23 741 687 0 687 5 5 8
Total revenue 3,409 1 3,410 97 3,507 3,003 36 3,039 14 12 15 Non-IFRS Operating Expense Numbers
Cost of software and software-related services
�513 70 �443 �469 59 �410 9 8
Cost of professional services and other services
�537 3 �534 �530 10 �520 1 3
Research and development �436 �4 �440 �453 12 �441 �4 0Sales and marketing �721 19 �702 �642 30 �612 12 15General and administration �168 5 �163 �157 9 �148 7 10Restructuring �1 1 0 2 �2 0 �150 0TomorrowNow litigation 723 �723 0 �45 45 0 �1,707 0Other operating income/expense, net 3 0 3 7 0 7 �57 �57
Total operating expenses �1,650 �629 �2,279 �68 �2,347 �2,287 163 �2,124 �28 7 10 Non-IFRS Profit Numbers
Operating profit 1,759 �628 1,131 29 1,160 716 199 915 146 24 27Other non-operating income/expense, net
0 0 0 �13 �8 �21 �100 �100
Finance income 29 0 29 24 0 24 19 19Finance Cost TomorrowNow litigation
7 �7 0 0 0 0 N/A 0
Other finance costs �38 0 �38 �38 0 �38 0 0Finance costs �31 �7 �38 �38 0 �38 �20 0
Financial income, net �2 �7 �9 �14 0 �14 �86 �36 �86Profit before tax 1,757 �635 1,122 689 191 880 155 28
Income tax TomorrowNow litigation
�276 276 0 17 �17 0 �1,724 0
Other income tax expense �229 �32 �261 �205 �46 �251 12 4Income tax expense �505 244 �261 �188 �63 �251 169 4
Profit after tax 1,251 �391 860 501 128 629 150 37Profit attributable to non-controlling interests
0 0 0 1 0 1 �100 �100
Profit attributable to owners of parent
1,251 �391 860 500 128 628 150 37
Non-IFRS Key Ratios
Operating margin in % 51.6 33.2 33.1 23.8 30.1 27.8pp 3.1pp 3.0ppEffective tax rate in % 28.7 23.3 27.3 28.5 1.4pp �5.2ppBasic earnings per share, in €* 1.05 0.72 0.42 0.53 150 36
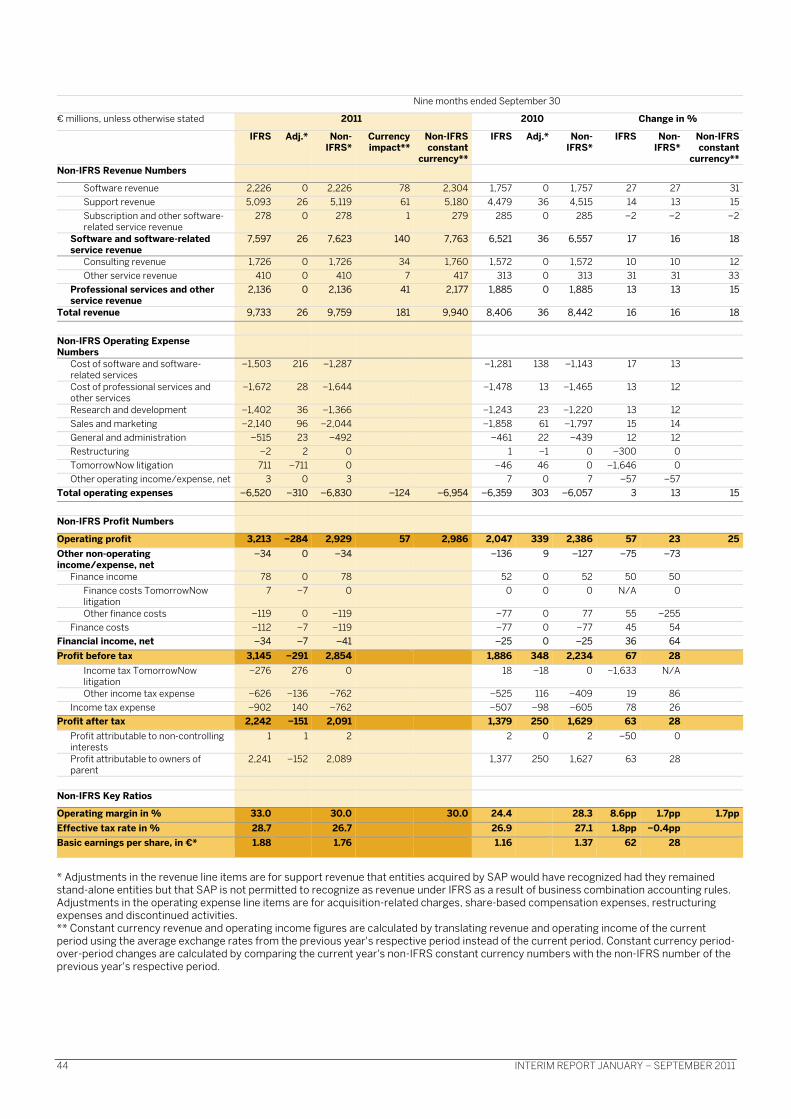
44 INTERIM REPORT JANUARY – SEPTEMBER 2011
* Adjustments in the revenue line items are for support revenue that entities acquired by SAP would have recognized had they remained stand-alone entities but that SAP is not permitted to recognize as revenue under IFRS as a result of business combination accounting rules. Adjustments in the operating expense line items are for acquisition-related charges, share-based compensation expenses, restructuring expenses and discontinued activities. ** Constant currency revenue and operating income figures are calculated by translating revenue and operating income of the current period using the average exchange rates from the previous year's respective period instead of the current period. Constant currency period-over-period changes are calculated by comparing the current year's non-IFRS constant currency numbers with the non-IFRS number of the previous year's respective period.
Nine months ended September 30
€ millions, unless otherwise stated 2011 2010 Change in %
IFRS Adj.* Non-IFRS*
Currencyimpact**
Non-IFRSconstant
currency**
IFRS Adj.* Non-IFRS*
IFRS Non-IFRS*
Non-IFRSconstant
currency**Non-IFRS Revenue Numbers
Software revenue 2,226 0 2,226 78 2,304 1,757 0 1,757 27 27 31Support revenue 5,093 26 5,119 61 5,180 4,479 36 4,515 14 13 15Subscription and other software-related service revenue
278 0 278 1 279 285 0 285 �2 �2 �2
Software and software-related service revenue
7,597 26 7,623 140 7,763 6,521 36 6,557 17 16 18
Consulting revenue 1,726 0 1,726 34 1,760 1,572 0 1,572 10 10 12Other service revenue 410 0 410 7 417 313 0 313 31 31 33
Professional services and other service revenue
2,136 0 2,136 41 2,177 1,885 0 1,885 13 13 15
Total revenue 9,733 26 9,759 181 9,940 8,406 36 8,442 16 16 18 Non-IFRS Operating Expense Numbers
Cost of software and software-related services
�1,503 216 �1,287 �1,281 138 �1,143 17 13
Cost of professional services and other services
�1,672 28 �1,644 �1,478 13 �1,465 13 12
Research and development �1,402 36 �1,366 �1,243 23 �1,220 13 12Sales and marketing �2,140 96 �2,044 �1,858 61 �1,797 15 14General and administration �515 23 �492 �461 22 �439 12 12Restructuring �2 2 0 1 �1 0 �300 0TomorrowNow litigation 711 �711 0 �46 46 0 �1,646 0Other operating income/expense, net 3 0 3 7 0 7 �57 �57
Total operating expenses �6,520 �310 �6,830 �124 �6,954 �6,359 303 �6,057 3 13 15 Non-IFRS Profit Numbers
Operating profit 3,213 �284 2,929 57 2,986 2,047 339 2,386 57 23 25Other non-operating income/expense, net
�34 0 �34 �136 9 �127 �75 �73
Finance income 78 0 78 52 0 52 50 50Finance costs TomorrowNow litigation
7 �7 0 0 0 0 N/A 0
Other finance costs �119 0 �119 �77 0 77 55 �255Finance costs �112 �7 �119 �77 0 �77 45 54
Financial income, net �34 �7 �41 �25 0 �25 36 64Profit before tax 3,145 �291 2,854 1,886 348 2,234 67 28
Income tax TomorrowNow litigation
�276 276 0 18 �18 0 �1,633 N/A
Other income tax expense �626 �136 �762 �525 116 �409 19 86Income tax expense �902 140 �762 �507 �98 �605 78 26
Profit after tax 2,242 �151 2,091 1,379 250 1,629 63 28Profit attributable to non-controlling interests
1 1 2 2 0 2 �50 0
Profit attributable to owners of parent
2,241 �152 2,089 1,377 250 1,627 63 28
Non-IFRS Key Ratios
Operating margin in % 33.0 30.0 30.0 24.4 28.3 8.6pp 1.7pp 1.7ppEffective tax rate in % 28.7 26.7 26.9 27.1 1.8pp �0.4ppBasic earnings per share, in €* 1.88 1.76 1.16 1.37 62 28
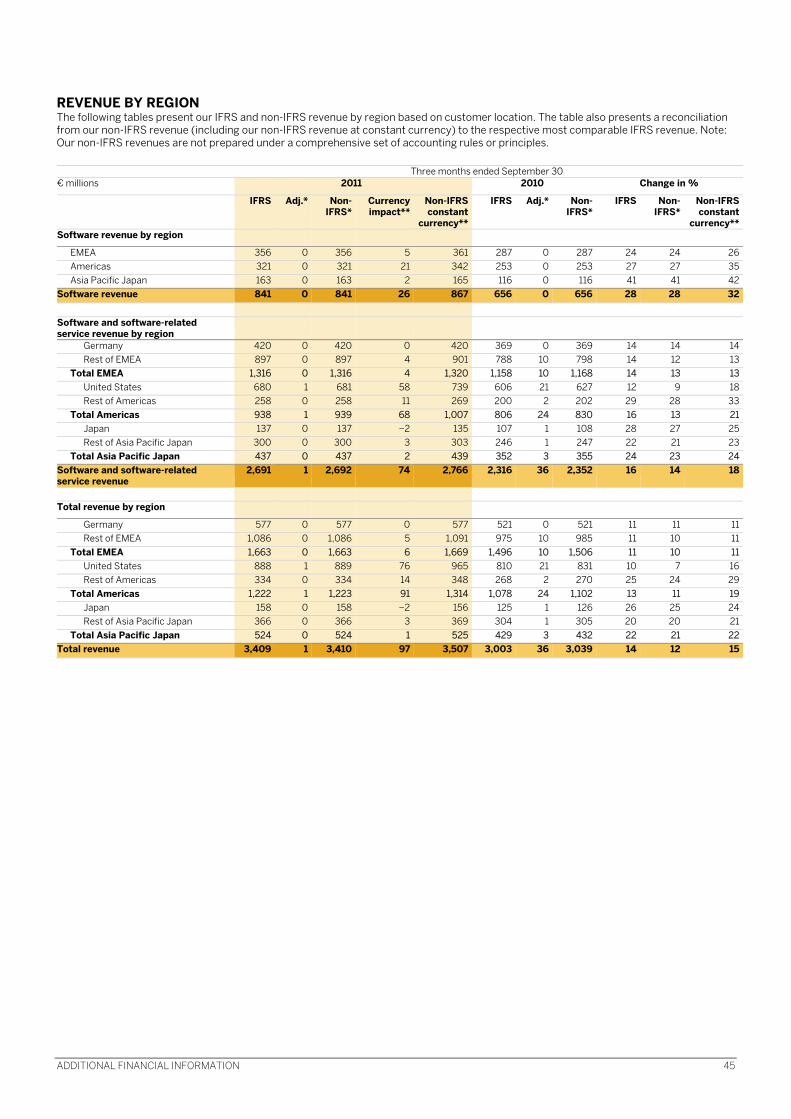
ADDITIONAL FINANCIAL INFORMATION 45
REVENUE BY REGION The following tables present our IFRS and non-IFRS revenue by region based on customer location. The table also presents a reconciliation from our non-IFRS revenue (including our non-IFRS revenue at constant currency) to the respective most comparable IFRS revenue. Note: Our non-IFRS revenues are not prepared under a comprehensive set of accounting rules or principles.
Three months ended September 30 € millions 2011 2010 Change in %
IFRS Adj.* Non-IFRS*
Currencyimpact**
Non-IFRSconstant
currency**
IFRS Adj.* Non-IFRS*
IFRS Non-IFRS*
Non-IFRSconstant
currency**Software revenue by region
EMEA 356 0 356 5 361 287 0 287 24 24 26Americas 321 0 321 21 342 253 0 253 27 27 35Asia Pacific Japan 163 0 163 2 165 116 0 116 41 41 42
Software revenue 841 0 841 26 867 656 0 656 28 28 32 Software and software-related service revenue by region
Germany 420 0 420 0 420 369 0 369 14 14 14Rest of EMEA 897 0 897 4 901 788 10 798 14 12 13
Total EMEA 1,316 0 1,316 4 1,320 1,158 10 1,168 14 13 13United States 680 1 681 58 739 606 21 627 12 9 18Rest of Americas 258 0 258 11 269 200 2 202 29 28 33
Total Americas 938 1 939 68 1,007 806 24 830 16 13 21Japan 137 0 137 �2 135 107 1 108 28 27 25Rest of Asia Pacific Japan 300 0 300 3 303 246 1 247 22 21 23
Total Asia Pacific Japan 437 0 437 2 439 352 3 355 24 23 24Software and software-related service revenue
2,691 1 2,692 74 2,766 2,316 36 2,352 16 14 18
Total revenue by region
Germany 577 0 577 0 577 521 0 521 11 11 11Rest of EMEA 1,086 0 1,086 5 1,091 975 10 985 11 10 11
Total EMEA 1,663 0 1,663 6 1,669 1,496 10 1,506 11 10 11United States 888 1 889 76 965 810 21 831 10 7 16Rest of Americas 334 0 334 14 348 268 2 270 25 24 29
Total Americas 1,222 1 1,223 91 1,314 1,078 24 1,102 13 11 19Japan 158 0 158 �2 156 125 1 126 26 25 24Rest of Asia Pacific Japan 366 0 366 3 369 304 1 305 20 20 21
Total Asia Pacific Japan 524 0 524 1 525 429 3 432 22 21 22Total revenue 3,409 1 3,410 97 3,507 3,003 36 3,039 14 12 15
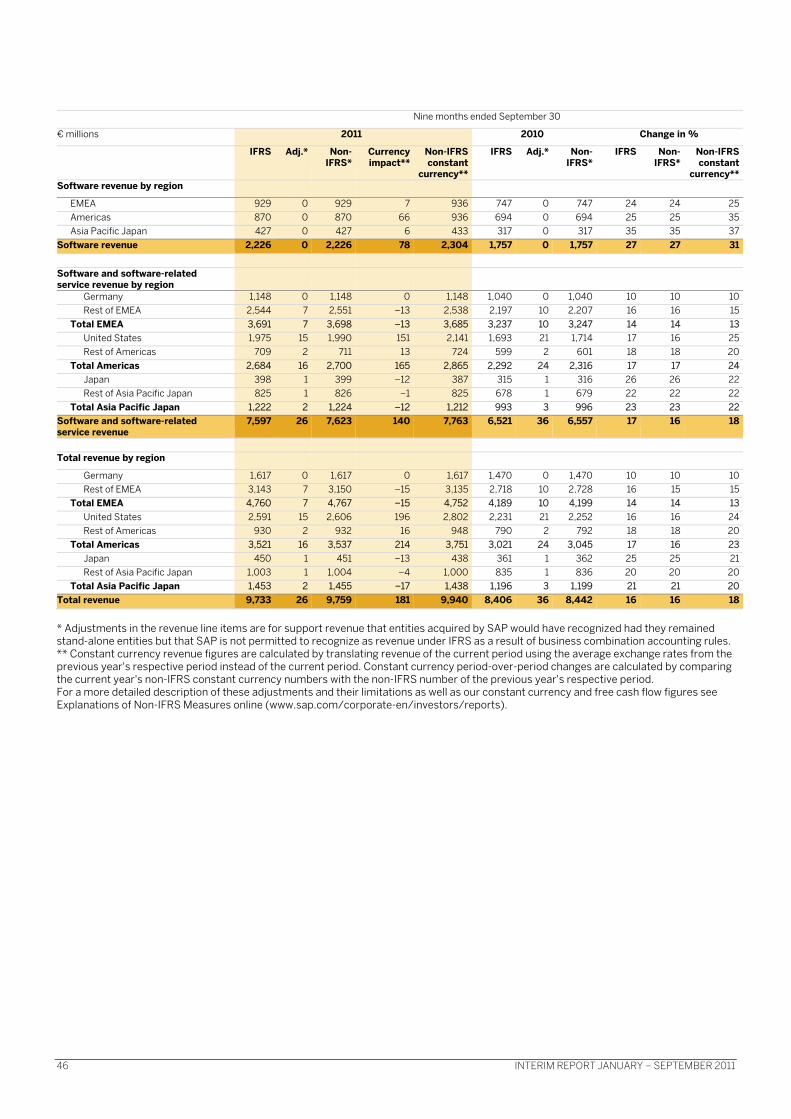
46 INTERIM REPORT JANUARY – SEPTEMBER 2011
* Adjustments in the revenue line items are for support revenue that entities acquired by SAP would have recognized had they remained stand-alone entities but that SAP is not permitted to recognize as revenue under IFRS as a result of business combination accounting rules. ** Constant currency revenue figures are calculated by translating revenue of the current period using the average exchange rates from the previous year's respective period instead of the current period. Constant currency period-over-period changes are calculated by comparing the current year's non-IFRS constant currency numbers with the non-IFRS number of the previous year's respective period. For a more detailed description of these adjustments and their limitations as well as our constant currency and free cash flow figures see Explanations of Non-IFRS Measures online (www.sap.com/corporate-en/investors/reports).
Nine months ended September 30
€ millions 2011 2010 Change in %
IFRS Adj.* Non-IFRS*
Currencyimpact**
Non-IFRSconstant
currency**
IFRS Adj.* Non-IFRS*
IFRS Non-IFRS*
Non-IFRSconstant
currency**Software revenue by region
EMEA 929 0 929 7 936 747 0 747 24 24 25Americas 870 0 870 66 936 694 0 694 25 25 35Asia Pacific Japan 427 0 427 6 433 317 0 317 35 35 37
Software revenue 2,226 0 2,226 78 2,304 1,757 0 1,757 27 27 31 Software and software-related service revenue by region
Germany 1,148 0 1,148 0 1,148 1,040 0 1,040 10 10 10Rest of EMEA 2,544 7 2,551 �13 2,538 2,197 10 2,207 16 16 15
Total EMEA 3,691 7 3,698 �13 3,685 3,237 10 3,247 14 14 13United States 1,975 15 1,990 151 2,141 1,693 21 1,714 17 16 25Rest of Americas 709 2 711 13 724 599 2 601 18 18 20
Total Americas 2,684 16 2,700 165 2,865 2,292 24 2,316 17 17 24Japan 398 1 399 �12 387 315 1 316 26 26 22Rest of Asia Pacific Japan 825 1 826 �1 825 678 1 679 22 22 22
Total Asia Pacific Japan 1,222 2 1,224 �12 1,212 993 3 996 23 23 22Software and software-related service revenue
7,597 26 7,623 140 7,763 6,521 36 6,557 17 16 18
Total revenue by region
Germany 1,617 0 1,617 0 1,617 1,470 0 1,470 10 10 10Rest of EMEA 3,143 7 3,150 �15 3,135 2,718 10 2,728 16 15 15
Total EMEA 4,760 7 4,767 �15 4,752 4,189 10 4,199 14 14 13United States 2,591 15 2,606 196 2,802 2,231 21 2,252 16 16 24Rest of Americas 930 2 932 16 948 790 2 792 18 18 20
Total Americas 3,521 16 3,537 214 3,751 3,021 24 3,045 17 16 23Japan 450 1 451 �13 438 361 1 362 25 25 21Rest of Asia Pacific Japan 1,003 1 1,004 �4 1,000 835 1 836 20 20 20
Total Asia Pacific Japan 1,453 2 1,455 �17 1,438 1,196 3 1,199 21 21 20Total revenue 9,733 26 9,759 181 9,940 8,406 36 8,442 16 16 18
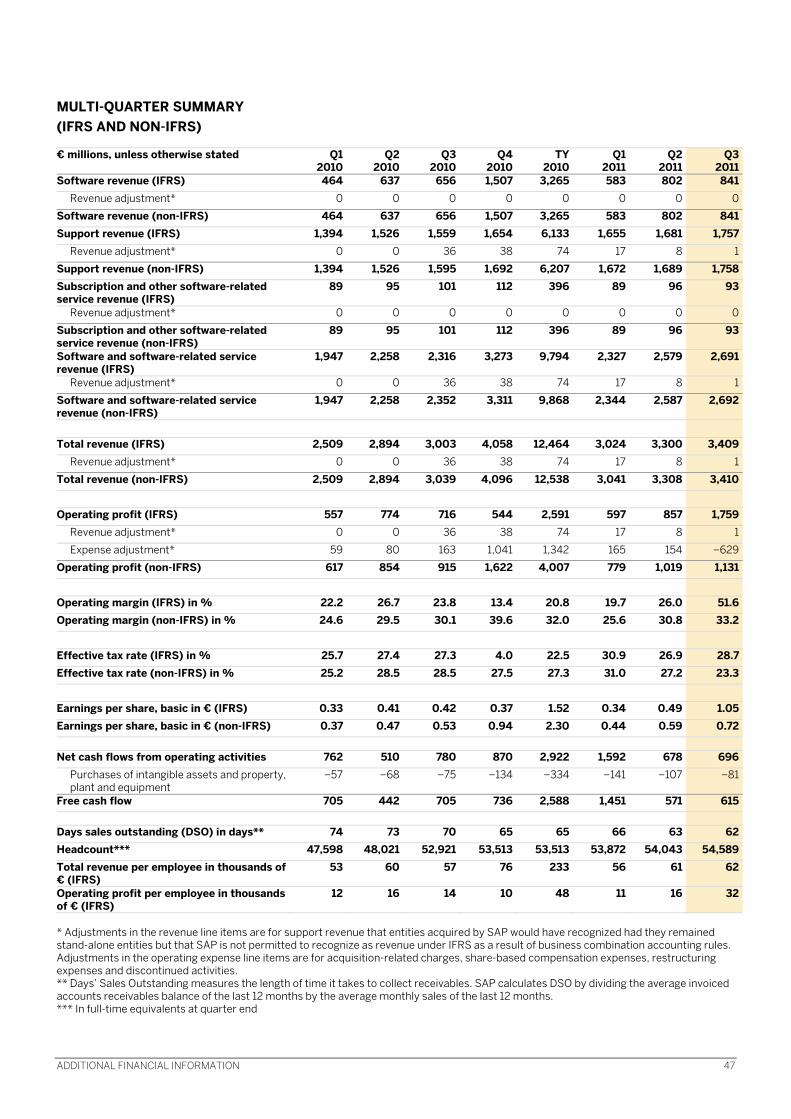
ADDITIONAL FINANCIAL INFORMATION 47
MULTI-QUARTER SUMMARY (IFRS AND NON-IFRS) € millions, unless otherwise stated Q1
2010Q2
2010Q3
2010Q4
2010TY
2010 Q1
2011 Q2
2011Q3
2011Software revenue (IFRS) 464 637 656 1,507 3,265 583 802 841
Revenue adjustment* 0 0 0 0 0 0 0 0
Software revenue (non-IFRS) 464 637 656 1,507 3,265 583 802 841Support revenue (IFRS) 1,394 1,526 1,559 1,654 6,133 1,655 1,681 1,757
Revenue adjustment* 0 0 36 38 74 17 8 1
Support revenue (non-IFRS) 1,394 1,526 1,595 1,692 6,207 1,672 1,689 1,758Subscription and other software-related service revenue (IFRS)
89 95 101 112 396 89 96 93
Revenue adjustment* 0 0 0 0 0 0 0 0
Subscription and other software-related service revenue (non-IFRS)
89 95 101 112 396 89 96 93
Software and software-related service revenue (IFRS)
1,947 2,258 2,316 3,273 9,794 2,327 2,579 2,691
Revenue adjustment* 0 0 36 38 74 17 8 1
Software and software-related service revenue (non-IFRS)
1,947 2,258 2,352 3,311 9,868 2,344 2,587 2,692
Total revenue (IFRS) 2,509 2,894 3,003 4,058 12,464 3,024 3,300 3,409Revenue adjustment* 0 0 36 38 74 17 8 1
Total revenue (non-IFRS) 2,509 2,894 3,039 4,096 12,538 3,041 3,308 3,410
Operating profit (IFRS) 557 774 716 544 2,591 597 857 1,759Revenue adjustment* 0 0 36 38 74 17 8 1
Expense adjustment* 59 80 163 1,041 1,342 165 154 �629
Operating profit (non-IFRS) 617 854 915 1,622 4,007 779 1,019 1,131
Operating margin (IFRS) in % 22.2 26.7 23.8 13.4 20.8 19.7 26.0 51.6Operating margin (non-IFRS) in % 24.6 29.5 30.1 39.6 32.0 25.6 30.8 33.2
Effective tax rate (IFRS) in % 25.7 27.4 27.3 4.0 22.5 30.9 26.9 28.7Effective tax rate (non-IFRS) in % 25.2 28.5 28.5 27.5 27.3 31.0 27.2 23.3
Earnings per share, basic in € (IFRS) 0.33 0.41 0.42 0.37 1.52 0.34 0.49 1.05Earnings per share, basic in € (non-IFRS) 0.37 0.47 0.53 0.94 2.30 0.44 0.59 0.72 Net cash flows from operating activities 762 510 780 870 2,922 1,592 678 696
Purchases of intangible assets and property, plant and equipment
�57 �68 �75 �134 �334 �141 �107 �81
Free cash flow 705 442 705 736 2,588 1,451 571 615 Days sales outstanding (DSO) in days** 74 73 70 65 65 66 63 62Headcount*** 47,598 48,021 52,921 53,513 53,513 53,872 54,043 54,589Total revenue per employee in thousands of € (IFRS)
53 60 57 76 233 56 61 62
Operating profit per employee in thousands of € (IFRS)
12 16 14 10 48 11 16 32
* Adjustments in the revenue line items are for support revenue that entities acquired by SAP would have recognized had they remained stand-alone entities but that SAP is not permitted to recognize as revenue under IFRS as a result of business combination accounting rules. Adjustments in the operating expense line items are for acquisition-related charges, share-based compensation expenses, restructuring expenses and discontinued activities. ** Days’ Sales Outstanding measures the length of time it takes to collect receivables. SAP calculates DSO by dividing the average invoiced accounts receivables balance of the last 12 months by the average monthly sales of the last 12 months. *** In full-time equivalents at quarter end
48 INTERIM REPORT JANUARY – SEPTEMBER 2011
ADDITIONAL INFORMATION Financial Calendar January 25, 2012 Fourth-quarter and preliminary full year 2011 earnings release, analyst conference April 25, 2012 First-quarter 2012 earnings release, telephone conference May 23, 2012 Annual General Meeting of Shareholders, Mannheim, Germany July 25, 2012 Second-quarter 2012 earnings release, telephone conference Investor Services SAP offers additional services and resources at our investor relations Web site, www.sap.com/investor, to help investors learn more about SAP stock including, for example, our e-mail newsletter and text message services. The interactive online version of our Annual Report is available at www.sapannualreport.com. Our 2010 Annual Report and our 2010 Annual Report on Form 20-F as PDF files are at www.sap.com/investor. Follow the link to Financial Reports and then to the period you are interested in. SAP‘s interactive online Sustainability Report is also available under www.sapsustainabilityreport.com. If you would like to order a printed copy of the Annual Report or subscribe to SAP INVESTOR shareholder magazine, you can do so on our site or by e-mail to [email protected]. If you prefer to order by phone or fax, you can reach us at the following investor services numbers: Europe, Asia Pacific Japan, Africa Tel. +49 6227 7-67336 Fax +49 6227 7-40805 Americas Tel. +1 877 727 7862 Fax +1 212 653 9602
Addresses SAP AG Dietmar-Hopp-Allee 16 69190 Walldorf Germany Tel. +49 6227 7-47474 Fax +49 6227 7-57575 Internet www.sap.com E-mail [email protected] All international subsidiaries are listed on: www.sap.com/contactsap/directory Information about Content: Investor Relations: Tel. +49 6227 7-67336 Fax +49 6227 7-40805 E-mail [email protected] Twitter @SAPinvestor Internet www.sap.com/investor Press: Tel. +49 6227 7-46311 Fax +49 6227 7-46331 E-mail [email protected] Imprint Overall Responsibility: SAP AG Corporate Financial Reporting Published on October 26, 2011
©2011 SAP AG. All rights reserved.
SAP, R/3, SAP NetWeaver, Duet, PartnerEdge, ByDesign, SAP BusinessObjects Explorer, StreamWork, and other SAP products and services mentioned herein as well as their respective logos are trademarks or registered trademarks of SAP AG in Germany and other countries.
Business Objects and the Business Objects logo, BusinessObjects, Crystal Reports, Crystal Decisions, Web Intelligence, Xcelsius, and other Business Objects products and services mentioned herein as well as their respective logos are trademarks or registered trademarks of Business Objects Software Ltd. Business Objects is an SAP company.
Sybase and Adaptive Server, iAnywhere, Sybase 365, SQL Anywhere, and other Sybase products and services mentioned herein as well as their respective logos are trademarks or registered trademarks of Sybase, Inc. Sybase is an SAP company.
All other product and service names mentioned are the trademarks of their respective companies. Data contained in this document serves informational purposes only. National product specifications may vary.
These materials are subject to change without notice. These materials are provided by SAP AG and its affiliated companies (“SAP Group”) for informational purposes only, without representation or warranty of any kind, and SAP Group shall not be liable for errors or omissions with respect to the materials. The only warranties for SAP Group products and services are those that are set forth in the express warranty statements accompanying such products and services, if any. Nothing herein should be construed as constituting an additional warranty.
www.sap.com