sas roadshow 2016
TRANSCRIPT

GRUPPO TELECOM ITALIA
SAS ROADSHOW 2016Network Data Analytics: la piattaforma SOC di TIM
Rome - March 3rd, 2016
Technology.Network
Ferruccio Antonelli

Agenda
From Network Centric to Customer Centric Approach
SOC Online and Offline
Overview
Architecture
Tools
Some examples
SOC/CEM Challenges and lessons learned
What’s next?
My Big Data
3SAS ROADSHOW 2016
O.N
TE
LE
CO
M I
TA
LIA
-U
SO
IN
TE
RN
O
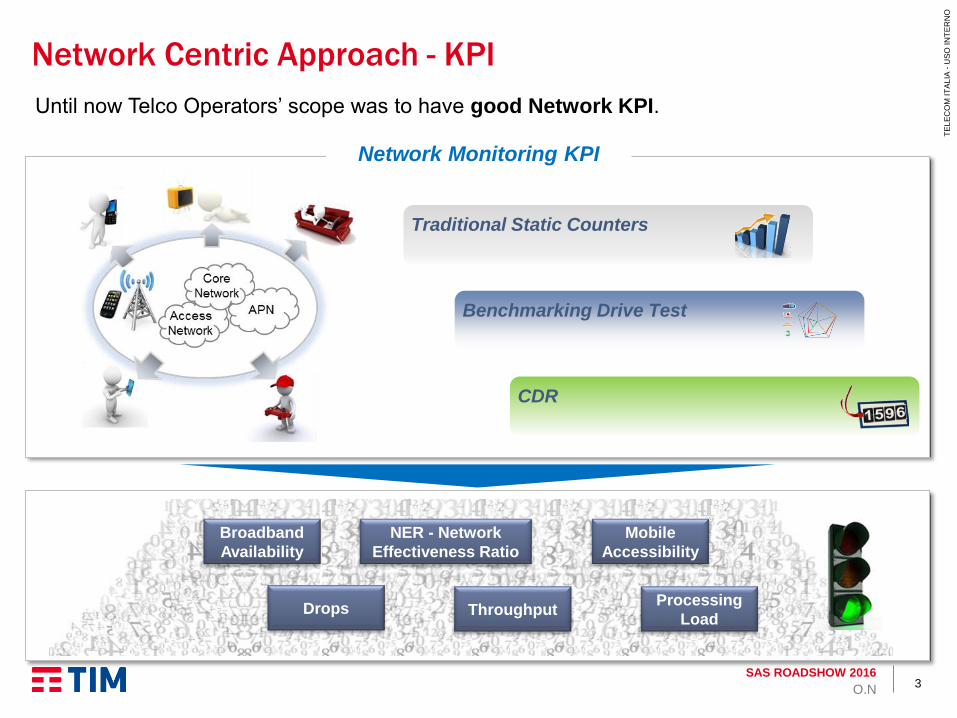
Network Monitoring KPI
Network Centric Approach - KPI
Traditional Static Counters
Benchmarking Drive Test
CDR
Until now Telco Operators’ scope was to have good Network KPI.
Broadband
Availability
Drops
NER - Network
Effectiveness Ratio
Mobile
Accessibility
ThroughputProcessing
Load

4SAS ROADSHOW 2016
O.N
TE
LE
CO
M I
TA
LIA
-U
SO
IN
TE
RN
O
Network Centric Approach - Tools
► Availability of just vertical tools to monitor specific network or service domain
► No E2E Service view
MOM(claims trend)
SANS(SMS KPIs monitoring)
STAT VAS(BB KPIs monitoring)
CHECK SUITE(BB/voice KPIs monitoring)
Quantiqa(Roaming KPIs monitoring)
VASco(Wifitrain service monitoring)
INPAS(Fault Management)
SMOP(Radio Access KPIs monitoring)
Performance Monitoring & Alarms Management Tools
This Network Centric Approach is mainly based on a reactive mode
(as a consequence of an alarm raising)
... what about customers?

5SAS ROADSHOW 2016
O.N
TE
LE
CO
M I
TA
LIA
-U
SO
IN
TE
RN
O
Smartphone flooding changes Telcos’ Point of View …
… From a Static and Predictable Scenario … … To a Complex and Changing Scenario …
Network KPI and monitoring tools are not suitable for evolved data services
Need of KPI review according to customer experience and services evolution
Good
Call
Customer Experience Management is
the way to deep monitor E2E Quality of
Experience
Bad
Caring
No
Access
Good Web
Browsing
Bad
Video
Customer Experience Management (CEM)
“View the world through customer’s eyes”

6SAS ROADSHOW 2016
O.N
TE
LE
CO
M I
TA
LIA
-U
SO
IN
TE
RN
O
… in a Customer Centric Approach
► Different views of services usage and customers behavior
► Troubleshooting on data services,
► Correlation of information coming from different domains (i.e. OTT services,
customer survey, …)
► New approach for network optimization, design and sizing
► UBB Monetization (correlation between band usage and tariff plans)
► Churn reduction due to advanced caring tool
Expected benefits
Network Centric
Approach
Access
Network
Core
Network
Network
Quality
Management
Service Centric
Approach
Service Quality
Management
Customer Centric
Approach
Customer
Experience
Management
7SAS ROADSHOW 2016
O.N
TE
LE
CO
M I
TA
LIA
-U
SO
IN
TE
RN
O
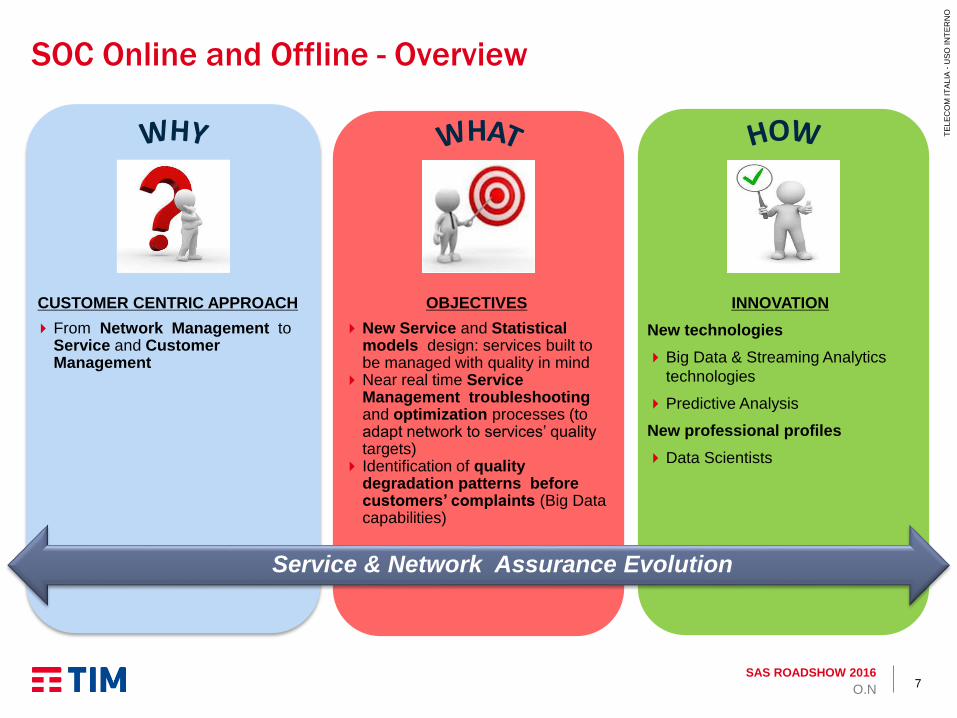
SOC Online and Offline - Overview
Service & Network Assurance Evolution
INNOVATION
New technologies
Big Data & Streaming Analytics
technologies
Predictive Analysis
New professional profiles
Data Scientists
OBJECTIVES
New Service and Statisticalmodels design: services built to be managed with quality in mind
Near real time Service Management troubleshooting and optimization processes (to adapt network to services’ quality targets)
Identification of quality degradation patterns before customers’ complaints (Big Data capabilities)
CUSTOMER CENTRIC APPROACH
From Network Management toService and Customer Management

8SAS ROADSHOW 2016
O.N
TE
LE
CO
M I
TA
LIA
-U
SO
IN
TE
RN
O
SOC – Architecture and Results
Data Sources
Online Offline
CoreNetwork
TransportNetwork
Clients and Terminals
Topology Alarms Counters xDR Probes CDRTroubleTicket
CustomerCare Calls
Access Network
IntelligentNetwork
Integration LayerIBM InfoSphere Streams
EBI EGVASQM SAI
Appliance DB BigData
In memory Analytics – discoveryReporting
Data Repository 0,5 PB
(13 months)
Service quality and customer experience monitoring
CEM3
2013(July - December)1.080 managed TT
2014(January - December)
4.799 managed TT
Managed Service
Trouble Tickets
Customer and Service
outages detection
#153 Service outages before customer’s complaint)
#5 Customer TT not proactively managed
96,73%
CTT early detected

9SAS ROADSHOW 2016
O.N
TE
LE
CO
M I
TA
LIA
-U
SO
IN
TE
RN
O
Tools: SOC - Some figures
►Accessibility violation for GSM Voice
►Call Drop violation for UMTS Voice
►Downtime violation for Broadband
►…
700 monitoring rules
and
300 service alarms
100 KPIs for NRT Service
monitoring, over 700
analysis models for
network monitoring
11 implemented service
models
BB
MVNO SMS
MVNO BB
SMS
TAV BBTAV FONIA
FONIA
ROAMING SMS
ROAMING BB
ROAMING
FON.
MVNO FONIA
Reporting Data Discovery
SOC Platform is currently up & running and it manages billions of data every day in order to feed Service Monitoring views.
30 report:• Usage Voice, BB and SMS• Quality&Performance
(Accessibility, Drop Calls, BAD Cells)
1,1 Billion of CDR records per day
1,7 Billion of PM counters records per day
1.000 alarms per day
20 interfaces + 30 parsing modules
PM Network Counters Network Alarms TopologyCDR
30.000 managed Network Elements
130.000 cells
0,5PB, 13 months raw data retention
~2 Billions records per day (to be
increased with per user transactions)
Probing
~700 users
Users & Process:Network Planning (forecasting & planning); Network and Service Engineering (ntw engineering and service testing); Network and Service Quality & Traffic (service and Ntw optimization, capacity planning); Network Maintenance (preventive maintenance); Network Deployment (provisioning; post roll out optimization); Regional Network Maintenance, Quality & Traffic (ntw optimization, trend analysis)
• Full database inquiry• 90 pre-defined queries• 4 Use Case CEM
~600 users

10SAS ROADSHOW 2016
O.N
TE
LE
CO
M I
TA
LIA
-U
SO
IN
TE
RN
O
SOC: Usage and performance on EXPO Area
Data Monitoring for EXPO Area

11SAS ROADSHOW 2016
O.N
TE
LE
CO
M I
TA
LIA
-U
SO
IN
TE
RN
O
SOC: Usage and performance on EXPO Area
Data Monitoring for EXPO Area

12SAS ROADSHOW 2016
O.N
TE
LE
CO
M I
TA
LIA
-U
SO
IN
TE
RN
O
SOC: Usage and performance on EXPO Area
Data Monitoring for EXPO Area

13SAS ROADSHOW 2016
O.N
TE
LE
CO
M I
TA
LIA
-U
SO
IN
TE
RN
O
SOC/CEM Challenges and lessons learned
Deeper integration between BSS and OSS to enable enriched customer profiling analysis and real time offering
Needs of new process implementation for Network Operations Areas
Meet Data quality dimensions (Completeness, Conformity, Consistency, Accuracy, Duplication, Integrity) though Data Flow
Paradigm shift: adding a Data Driven approach to the existing Process Driven one
E2E System Consolidation E2E data quality analysis & metrics definition
Use Cases & PoCImplementation and cross department analysis
New role definition and review of decision making process accordingly
Ad-hoc task force definition to improve process and activities
Technological turnaorundbased on BIG Data and Open Source technologies
Existing skill (network technicians) update due to new processes
AC
TIO
NA
CTI
ON
New skill profiles (statisticians, data scientists, Open Source) mixed with Network technologies experts
Training on the job and workshop
Training & Recruiting
Ongoing
Addressed
Open
User resistance to change in using new sistems and interfaces
Ad-hoc task force definition to improve process and activities
14SAS ROADSHOW 2016
O.N
TE
LE
CO
M I
TA
LIA
-U
SO
IN
TE
RN
O
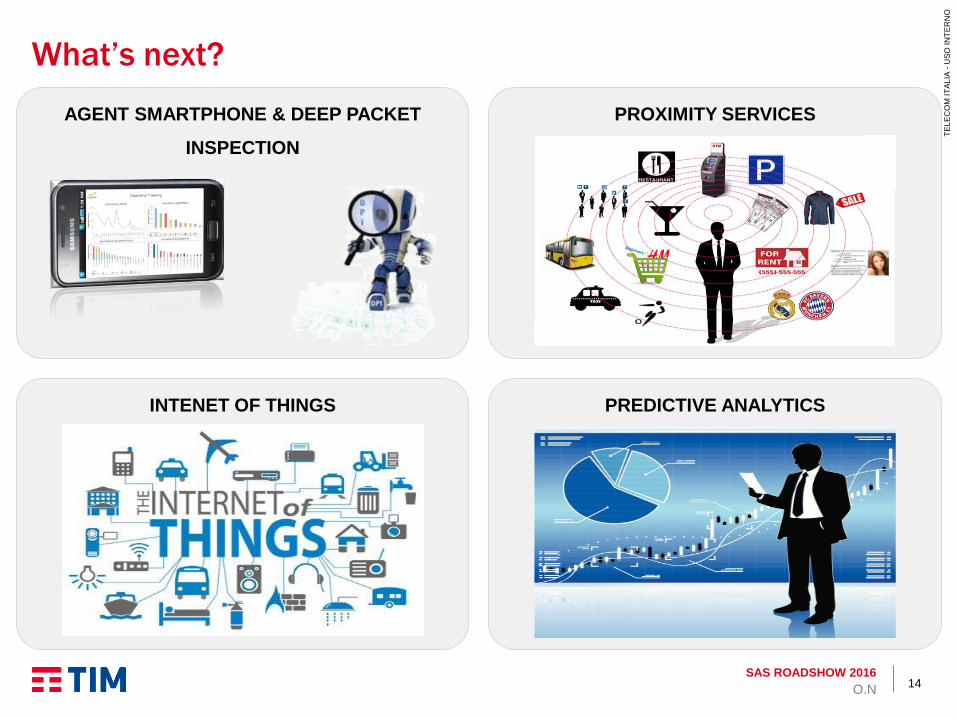
What’s next?
AGENT SMARTPHONE & DEEP PACKET
INSPECTION
PROXIMITY SERVICES
INTENET OF THINGS PREDICTIVE ANALYTICS

15SAS ROADSHOW 2016
O.N
TE
LE
CO
M I
TA
LIA
-U
SO
IN
TE
RN
O
My Big Data
FITBIT – MY SLEEPING CYCLES GOOGLE – LOCATION HISTORY
… but what about Big Data & Ethics?

16SAS ROADSHOW 2016
O.N
TE
LE
CO
M I
TA
LIA
-U
SO
IN
TE
RN
O
GrazieThanks!