school of technology and society - diva portal2457/fulltext01.pdf · school of technology and...
TRANSCRIPT

School of Technology and Society
MA
ST
ER
DE
GR
EE
PR
OJE
CT
THE IMPACT OF THE INTENSITY OF FIRM’S INTANGIBLE
ASSETS ON THE VOLATILITY OF THEIR STOCK PRICES
Master Degree Project in Finance
Presented By
Takoeta Fred Tambong TERM: Spring 2008 D-Level 15 ECTS
Supervisor: Dr. Max Zamanian Examiner: Dr. Yinghong Chen

2
DEPARTEMENT OF TECHNOLOGY AND SOCIETY
___________________________________________________
Master thesis in Finance / Financial Economics
Date: 2008-06-03
Project name: The Impact of the intensity of firm’s intangible assets on the volatility of their stock prices.
Author: Takoeta Fred Tambong
Supervisor: Dr. Max Zamanian
Examiner: Dr. Yinghong Chen
Comprising: 15 points ___________________________________________________

3
TABLE OF CONTENTS
1. INTRODUCTION…………………………………………………6
1.1 Background of study…………………………………………..6
1.2 Statement of the problem ……………………………………..7
1.3 Purpose of the study …………………………………………..7
1.4 Significance of the study ……………………………...............7
1.5 Limitation of the study ………………………………………..8
1.6 Layout of the study …………………………………................8
2. OVERVIEW OF INTANGIBLE ASSETS ………………………...9
2.1 Definition of intangible assets ………………………………...9
2.2 Classification of intangible assets ……………………………..9
3. REVIEW OF PREVIOUS RESEARCH & RESEARCH DESIGN 11
3.1 Review of previous research …………………………………11
3.2 Research Design ……………………………………………..14
4. SAMPLE DATA & EMPERICAL RESULTS …………………...16
4.1 Sample Data ………………………………………………….16
4.2 Empirical Results …………………………………………….18
5. SUMMARY AND CONCLUSIONS ……………………………..21
REFERENCES ……………………………………………………...22
APPENDIX………………………………………………………......25

4
ACKNOWLEDGMENT
I would like to thank my supervisor Dr. Max Zamanian for his academic and
professional advice in helping me bring this work to a higher academic level.
My special thanks go to all the lecturers in the Economic and Finance program
whose inspiration have been of great support to me.
I want to specially thank my entire family (especially Mummy Clara) for their
continuous support, love and encouragement; this thesis couldn’t have been
accomplished without them. I would extend my appreciation to all my friends
especially Roland Lundahl, Susanna Schild, Takang Felix, Brafi Paul, Onose
Salifu Abukari, Lobilo Ngongalah, Kynaston and Mrs. Ntui Claudine for all
their help.
Special thanks go to the Almighty God for everything He’s done in my life.
Skövde, June 2008.
5
ABSTRACT
The volatility of share prices is an important variable in most asset
pricing models and option pricing formulas.Valuation of volatility of
share prices have become a major challenge with the development of the
knowledge-driven economy as evidence suggest that not all elements of
company wealth are physical in nature.
The purpose of this project entitled “The intensity of the firm’s intangible
asset on the volatility of their stock price” is to check if the intensity of
intangible assets in a firm’s balance sheet affects the volatility of their
stock price. A brief overview of intangible assets is also included in this
study.
An OLS regression was run and the results of the entire data set gives a
negative correlation between intensity of intangible assets and volatility
of stock prices probably due to the fact that the volatility of the firm share
prices are driven by uncertainty and expectation of future growth. An
industry-grouping regression was carried out, the results shows that for
basic pharmaceuticals there is a positive correlation between the intensity
of intangible assets and their price volatility while the other three industry
groups produce a negative correlation.
The study relies on secondary data of randomly selected fourty (40)
publicly traded companies in Europe from four different industry
groupings namely: manufacture of basic pharmaceuticals, manufacture of
food products and beverages, information technology and manufacture of
basic metals.
Keywords: intangible assets, volatility, stock prices
6
CHAPTER ONE
INTRODUCTION
1.1 Background of study
The rise of intangible assets size and the contribution to corporate growth
over the last two decades posed an interesting topic for analysis. The
increasing importance of intangible assets and the absence of explicit
information about the contribution of intangible to earnings imply strong
market incentives for analyst to provide value-added information for
high-intangible firms. Goldfinger [1974] suggest that the source of
economic value and wealth is no longer the production of material goods
but the creation and manipulation of intangible assets.1
The increase in information complexity of intangible assets increases the
difficulty of forecasting earnings of intangibles-intensive firms.
Chan, Louis K.C., Lakonishok, Josef and Sougiannis, Theodore [1999]
suggested that companies engaged in high R&D intensity have a
distinctive effect on returns using two groups of stocks. Within the set of
growth stocks, R&D-intensive stocks tend to out-perform stocks with
little or no R&D. Their tentative investigation of the effects of advertising
on returns yields similar results. They provided evidence that R&D
intensity is positively associated with return volatility. 2
The pharmaceutical industry expends billions of dollars yearly on
intangibles, all in the pursuit of greater profits. Thus, investors are
naturally interested in whether intangible assets and expenditures truly
create shareholder value. In a paper by Heiens, Richard A; McGrath,
1 Journal of Accounting Literature, Vol. 19, 2000, pp. 102-130 2 Chan, Louis K.C., Lakonishok, Josef and Sougiannis, Theodore , "The Stock Market Valuation of Research and Development (June 1999)

7
Leanne C; Leach, Robert T [2008], four intangibles, namely advertising,
research and development (R&D), goodwill and other intangibles, are
investigated to establish their effects on market-adjusted holding period
returns (HPR). Their results seem to indicate that of these variables,
advertising does in fact seem to have a significant and positive impact on
HPR. 3
There are observations that the stock market behaviour of the so called
‘knowledge companies’ frequently deviates from that of basic industries.
There also exists some evidence supporting a positive correlation
between a firm’s intangibles and its share market value [Amir and Lev
1996, Lev 1997, Lev and Zarowin 1998]
The increasing importance of intangible assets to investors, analyst and
shareholders has increased investment community’s needs to understand
how companies create and manage their intangible assets, and to know
how companies share prices are affected by intangible assets.
1.2 Statement of the problem
The centre of attention of this thesis is to answer the following question:
What is the impact of the intensity of firm’s intangible assets on the
volatility of their stock prices?
1.3 Purpose of the study
This study aims at
• A brief overview of issues of intangible assets.
• After providing an overview, different type and definitions of
intangible asset, testing the impact of the intensity of intangible
3 Heiens, Richard A; McGrath, Leanne C; Leach, Robert T [2008], Journal of Medical Marketing (2008) 8, 151-158. doi:10.1057/palgrave.jmm.5050131

8
assets in a firm on the volatility of the firm’s share prices will be
performed.
1.4 Significance of the study
The growing and importance of intangible assets to firm value growth in
recent years goes to length to support the significance and importance of
additional research work on intangible assets.
The study will prove useful to investors, analysts or shareholders who are
interested to know how the size of intangible asset in a firm affects the
volatility of the firm’s stock price.
This study will also serve as a basis for further research and discussions
on intangible asset intensity on stock prices.
1.5 Limitation of the study
Data for this study is randomly selected from listed companies of four
industry groups (manufacture of basic pharmaceuticals, manufacture of
food products and beverages, information technology and manufacture of
basic metals) having between eight (8) and ten (10) years of consolidated
balance sheet. Thus the results we get are based solely on the data used
for this study.
1.6 Layout of the study
The study is divided into five chapters. The first chapter concentrates on
the background of the study, statement of the problem, purpose of the
study, significance of the study and the limitation of the study. Chapter
two gives an overview of intangible assets. That is definition,
classification and valuation method. Chapter three includes a review of
previous research in this area and the research design. Chapter four, the
data sample and the empirical results are stated and chapter five gives a
summary and conclusions to the findings.
9
CHAPTER TWO
OVERVIEW OF INTANGIBLE ASSETS
Intangible assets have been extensively analysed in the economic
literature within the frame work of innovation4. There is generally no
agreement on the economic nature, definition and classification of
intangible assets.
2.1 Definition of intangible asset
For simplicity, we define an intangible asset as an asset (something of
value) that is non-physical in nature5. Corporate intellectual property
(items such as patents, trademarks, copyrights, business methodologies),
goodwill and brand recognition are all common intangible assets.
In brief, intangible assets are assets that are used in the operation of the
business but that have no physical substance and are noncurrent.
It should be noted that the basic for valuation of intangible assets is cost;
these assets will appear on the balance sheet at their cost and will only be
listed if significant costs are incurred in their acquisition or development.
2.2 Classification of intangible assets
There is no generally accepted classification of intangible assets.
However, the six most common categories of intangible assets are
suggested accordingly:
• General, which means goodwill and others, e.g. advantageous
relationships with the government.
4 Cohen and Levin (1989) provided an extensive review of economic literature published in this area of research until the end of the 1980’s. 5 http://financial-dictionary.thefreedictionary.com/intangible+asset
10
• Brand Equity meaning the capacity of brands to sustain and
encourage economic demand and other market capabilities, such as
advertising.
• Intellectual Capital including trade secrets, internally developed
computer software, drawings and other proprietary technology as
well as intellectual property (patents, trade names, trademarks,
copyrights) which exist because of a complex body of law.
• Structural Capital including assembled workforce (the relationship
between the business and its employees, training and employee
contracts), leadership, organisational capacity for sellable
innovation, organisational learning capacity, leaseholds, franchises,
licenses and mineral rights.
• Customer Equity, which means customer lists and other customer-
based intangibles, customer loyalty and satisfaction as well as
distribution relationships and agreement.
• Supplier Relations including equity interest in suppliers, contracts
and supplier reliability
11
CHAPTER THREE
REVIEW OF PREVIOUS RESEARCH AND RESAERCH DESIGN
3.1 Review of previous research
Intangible assets that are accounted for are mostly those whose costs are
expensive when incurred such as R&D and advertising.
Lev and Sougiannis (1996) speculated that the excess returns reflect
either stock market mispricing, or represent compensation for the extra
risk associated with R&D intensive firms. A follow-up study by Lev and
Sougiannis (1999) after conducting a series of tests, they conclude that
the excess returns are more likely a consequence of additional risk.
Later studies (Lev, Sarath and Sougiannis, 2000; and Penman and Zhang,
2002), however, switch their focus from R&D intensity defined based on
the estimated amount of R&D assets to change in R&D assets because
observations suggest that it’s not the absolute levels of R&D assets that
affect the persistence of earnings. These papers document evidence
consistent with the hypothesis that the market is, to some extent, fixated
on earnings and does not fully understand the impact of R&D accounting
on earnings quality.
The conference paper by Chambers, Jennings and Thompson provides
more compelling evidence supporting the risk explanation and they show
that earnings volatility of R&D intensive firms is high, which is
consistent with prior findings (see Chan, Lakonishok and Sougiannis,
2000)
Recent finance literature highlights the role of technological change in
increasing firm specific and total stock price volatility (Campbell et al.
2001, Shiller 2000, Pastor and Veronesi 2005).
The productivity literature on market value and innovation has already
established a positive relationship between a firm’s market value, its
12
R&D intensity and its citation weighted patents (Griliches 1981; Pakes
1985; Hall 1993, Hall, Jaffe and Trajtenberg 2005).
The analysis builds on the empirical work by Mazzucato (2002; 2003)
where it is found that stock price volatility is highest during periods in the
industry life-cycle when innovation (measured at the industry level) is the
most ‘competence-destroying’.
Comments have often been made that intangible assets are an important
contributor to economic well being; academic research has still a long
way to go to quantify their impact (Griliches 1998). One problem is that
intangible asset such as R&D outlays, advertising, marketing and human
capital, are quite difficult to measure. Academic research has generally
employed either company accounts or industry data. Previous work using
the former tended to concentrate on research activities alone, due to the
lack of data on other forms of intangible investment.
There have been increased attentions in stock price volatility after the
“New Economy” period when many high-tech stocks that were
considered overvalued experienced a large drop in their share price. This
persistent idea of ‘knowledge economy’ has resulted in even greater stock
price volatility although there have been no trend increase in total stock
price volatility (Schwert 1989; 2002).
Shiller’s work (2000) has shown that ‘excess volatility’ is highest in
periods of technological revolutions when uncertainty is greatest due to
increased uncertainty regarding both technology and demand causing
investors to be less confident about their own judgments. He claims that
the efficient market model greatly underestimates stock price volatility
due to the fact that it does not incorporate the social mechanism by which
expectations are formed (i.e. animal spirits, herd behaviour, bandwagon
effects).

13
Uncertainty in finance models refers to how expectations about a firm’s
future growth affect its market valuation (Campbell, Lo and McKinley
19973)6. Knight (1921) and Keynes (1973) highlight that technological
changes is an example of true uncertainty which cannot be calculated
using probabilities like risk but it’s a key determinant of a firm’s possible
future growth.
The work of Pastor and Veronesi (2005) provides interesting insights on
the relationship between innovation, uncertainty and volatility of stock
prices. They claim that if one includes the effect of uncertainty about a
firm’s average future profitability into market valuation models, then
bubbles can be understood as emerging from rational, not irrational,
behaviour about future expected growth. It thus follows from the result in
Pastor and Veronesi (2004) that uncertainty about average productivity
increases market value. They extend the model to explain why
technological revolutions cause the stock prices of innovative firms to be
more volatile and experience bubble like patterns. The basic idea is that
when a firm introduces a new technology, its stock price rises due to the
expectations regarding the positive impact of the new technology on its
productivity. Volatility also rises because risk is idiosyncratic when
technology is used on a small scale. When the new technology gets
adopted throughout the economy, the risk becomes systematic causing the
stock price to fall and volatility to decrease. This bubble like behaviour is
strongest for those technologies that are the most uncertain.
The study of Mazzucato and Tancioni (2005) reveal that it is not true that
more innovative industries are on average more volatile than less
innovative ones, at the firm level a positive and significant relationship is
found between idiosyncratic risk and R&D intensity.
6 “The starting point for any financial model is the uncertainty facing investors, and the substance of every financial model involves the impact of uncertainty on the behaviour of investors, and ultimately, on market prices.” (Campbell, Lo and MacKinlay, 1997)
14
My aim is to see whether the degree of excess volatility stock prices are
positively correlated with more intangible assets (innovations) as is
implied in the works cited above.
3.2 Research Design
Prior research finds that firms invest in intangible assets with two
purposes: to develop new knowledge and to lean about and benefit from
the innovation of others (Mowery, 1983; and Cohen and Levinthal, 1989)
Accordingly, we predict that firms (Industry group) with higher
intangible assets will have higher volatility of their stock prices.
Our hypothesis (in alternate form):
Firms (industry group) with higher intangible assets have higher
volatility of their stock prices.
We study intangible assets recognized on the firm’s balance sheet (BI)
and the volatility of stock prices of the firms (S). To examine the intensity
of firm’s intangible assets and volatility of stock prices, we estimate using
the following regression model:
St = α + βBI t + εt
Where St is the volatility of stock prices. It should be noted that we
assumed that the price volatility was constant over the ten year period so
we calculated the price volatility using price changes for the year 2006.
BI t represents the intensity of annual average of booked value of
intangible assets on the firm’s balance sheet.

15
From the regression model, a more precise form of the hypothesis is thus
stated as;
H1: β > 0
The coefficient estimate β of the intangible variable BI inform whether
the volatility of the stock prices are related to firm’s intangible intensity.

16
CHAPTER FOUR
SAMPLE DATA AND EMPERICAL RESULTS
4.1 Sample Data
The test of this study requires sample firms (industry group) to have at
least ten (10) years of consolidated balance sheet data and the firm should
be listed in at least one stock exchange.
The analysis covers a period from 1996 to 2006 and includes a total of 40
firms from four different industry group that have the required financial
data available from two secondary sources namely; BVDEP - Amadeus
database7 for consolidated balance sheet and ECOWin database from
different stock markets for stock prices. Later in the analysis, data from
two firms were dropped due to lack of stock prices data.
Sample firms in this study are taken from the following industry groups:
manufacture of basic pharmaceuticals, manufacture of food products and
beverages, information technology and manufacture of basic metals.
The data set and descriptive statistics of the variables of interest are
shown in Table 1 and Table 2 below. The mean values of BI and stock
price volatility are all higher than their medians indicating substantial
concentration in a subset of firms with higher intangible assets.
7 www.bvdep.com/en/amadeus.html

17
Table 1: Data Set of Project Company Intangible Asset Total Asset Intangible/Total Asset Price Volatility StockExchangeTradedAstrazeneca Plc (Basic Pharmaceutical) 1522 11764 0.129377763 0.013150493 LSE(SETS)Bayer Aktiengeselleschaft 7245 37127 0.195141003 0.014604562 XETRAFresinius Aktiengeselleschaft 3306 8136 0.406342183 0.013048314 XETRASmith & Nephew PLC 221 1212 0.182343234 0.015282613 LSE(SETS)Bayer Shering Pharma Aktiengeselleschaft 504400 5409140 0.093249574 0.016665435 XETRAEvotec AG 137821 250159 0.550933606 0.033456488 XETRAAntisoma PLC 6594 30515 0.216090447 0.039003569 LSE(SETS)Skyepharma PLC 64247 150131 0.427939599 0.026191733 LSE(SETS)Merck Kommanditgeselleschaft Auf Aktien 1383344 7284900 0.189891968 0.017488666 XETRASinclair Pharma PLC 26102 35332 0.738763727 0.0258407 LSE(SETS)Unilever NV (Food products and beverage) 14107753 39100178 0.360810455 0.009810544 Euronext AmsterdamHeineken NV 775200 8386097 0.092438711 0.011056146 Euronext AmsterdamSabmiller PLC 3179 6867 0.462938692 0.014646351 LSE(SETS)Associated British Food PLC 607 4880 0.124385246 0.009123591 LSE(SETS)Cadbury Schwepper PLC 3857 7760 0.497036082 0.010524944 LSE(SETS)Greene King PLC 187620 1322650 0.141851586 0.014953568 LSE(SETS)HKSCAN OYJ 33060290 373128782 0.088602894 0.018400051 Helsinki Stock ExchangeDiageo PLC 4779 15725 0.30391097 0.008531435 LSE(SETS)ORKLA ASA 7604400 46956800 0.161944596 0.016537767 Oslo Stock ExchangeCompofrio Alimentacion SA 110551 891797 0.12396431 Madrid Stock ExchangeDeutsche Telekom AG (IT) 44567 119178 0.373953246 0.012280593 XETRAIndustrial and Financial System(IFS) AB 738970 2037580 0.362670423 0.021274515 OMXOrdina N.V 52604 181929 0.289145766 0.017694054 Euronext AmsterdamTarsus Group PLC 24789 35999 0.688602461 0.020529135 LSE(SETS)Stone Soft OYJ 3820409 39839573 0.095894828 0.025021914 Helsinki Stock ExchangeAND International Publishers N.V 7824 18883 0.414340942 0.02656043 Euronext AmsterdamQurius N.V 5282 24181 0.218435962 0.025709186 Euronext AmsterdamSimac Techniek N.V 10543 90456 0.116553905 0.024717355 Euronext AmsterdamPhoenix IT Group PLC 20708 47932 0.432028707 0.019780102 LSE(SETS)Aldata Solution OYJ 7012254 37766078 0.185675992 0.027663995 Helsinki Stock ExchangeOutokumpu OYJ (Basic Metals) 271179 4942664 0.054864947 0.021644641 Helsinki Stock ExchangeNorddeutsche Affinerie AG 25097 888187 0.028256437 0.021488886 Frankfurt SXRautaruukki OYJ 86657 2567490 0.033751641 0.026361283 Helsinki Stock ExchangeHöganäs AB 154600 3986200 0.038783804 0.02076389 OMXSidenor S.A 2072905 352145846 0.005886496 0.0366327 Athens Stock ExchangePoujoulat 731 57168 0.012786874 Euronrxt ParisEtem S.A 1069998 96983742 0.011032756 0.037103958 Athens Stock ExchangeZwahlen et Mayr S.A 445 76222 0.005838209 0.058314386 Swiss ExchangeOglesby & Butler Group PLC 313843 6339531 0.049505713 0.038744086 Irish Stock ExchangeAcerinox S.A 23548 2578625 0.009131999 0.013219172 Madrid Stock Exchange
Table 2: Descriptive Statistics of Sample Data IA / TA Stock Price Volatility
Mean 0.23100912 0.021679507Standard Error 0.031700579 0.001685175Median 0.184009613 0.020154619Mode #N/A #N/AStandard Deviation 0.195415496 0.010388118Sample Variance 0.038187216 0.000107913Kurtosis 0.085494659 2.86273831Skewness 0.884435395 1.419778016Range 0.732925517 0.049782951Minimum 0.005838209 0.008531435Maximum 0.738763727 0.058314386Sum 8.778346571 0.82382125Count 38 38
*BI = IA / TA

18
4.2 Empirical Results
The regression analysis was done using both Microsoft excel and SPSS
software. Both software give identical results which is shown on Table 3
below.
The coefficient of intangible assets to total asset, BI (-.011, p=0.221)
seems to be unrelated to volatility of stock prices which is also indicated
by the standardized beta (β= -0.203). That is, the results show that the
coefficient for the Intangible intensity is not statistically significant
The R-squared is 0.041; meaning that approximately 4.1% of the
variability of stock price volatility (St) is accounted for by the variables in
the model.
Table3: Statistics summary of OLS regression. Regression result of St on BIt
Dependent variable: St Coeff Std
Error Standardized Beta
t Stat Sig F-value
R Square
Adj R2
α .024 .003 9.261 .000 1.551 .041 .015
BI t -.011 .009 -.203 -1.246 .221
The negative correlation established between intensity of intangible assets and
volatility of stock prices obtained in this result counter works prior research on
non-booked degree of intangible assets. The negative sign of the coefficient of
beta (β) at the first sight seems to be the opposite direction to what we would
expect. This negative association may be due to the fact that;
• There seem to be little or no significant impact of booked intangible
asset on the volatility of the firm share prices which are driven by
uncertainty and expectation of future growth.
• One could also argue that it is costs on R&D and marketing
(advertising) which eventually will be generating intangible asset, but
19
they are not booked as such to have a positive impact on the volatility of
share prices, not when these costs are recognized as intangible asset,
some times with quite conservative/ precautious application of
accounting principles. Thus the book value of intangible assets is always
lower that the actual value of the intangible asset.
Following the results obtained above, an industry-wise regression is run on the
same data and the results are shown on table 4, table 5, table 6 and table 7
below.
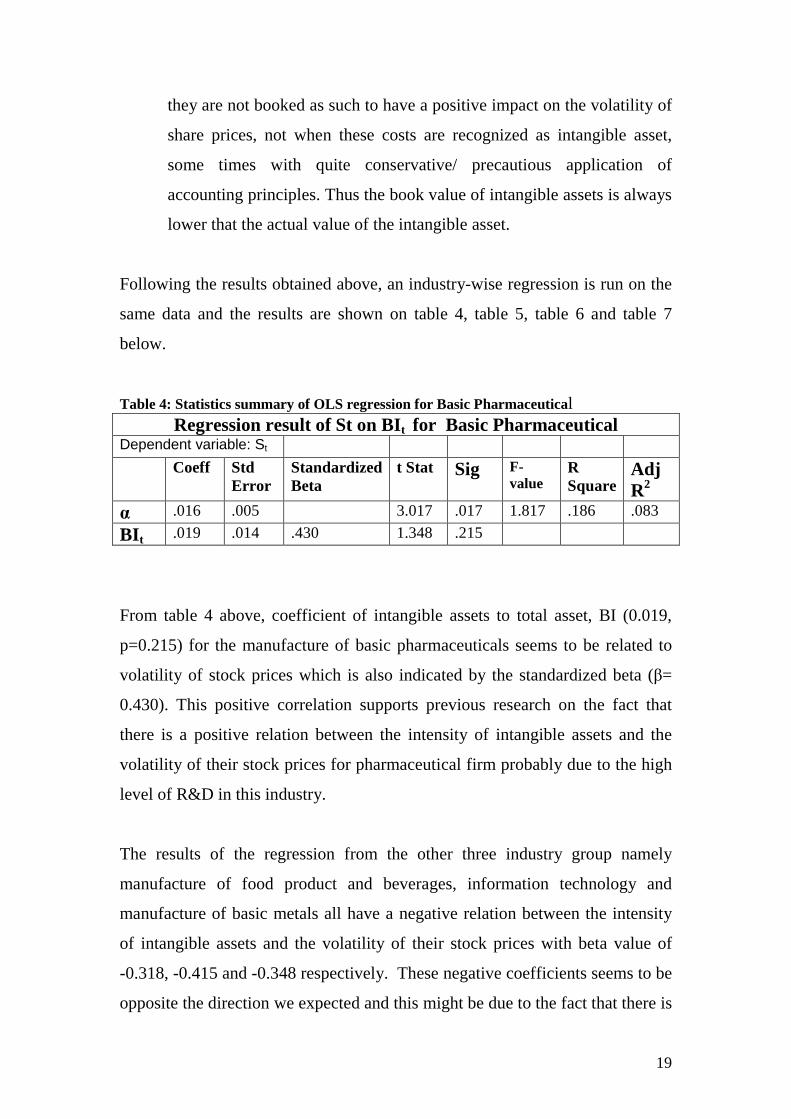
Table 4: Statistics summary of OLS regression for Basic Pharmaceutical Regression result of St on BIt for Basic Pharmaceutical
Dependent variable: St Coeff Std
Error Standardized Beta
t Stat Sig F-value
R Square
Adj R2
α .016 .005 3.017 .017 1.817 .186 .083
BI t .019 .014 .430 1.348 .215
From table 4 above, coefficient of intangible assets to total asset, BI (0.019,
p=0.215) for the manufacture of basic pharmaceuticals seems to be related to
volatility of stock prices which is also indicated by the standardized beta (β=
0.430). This positive correlation supports previous research on the fact that
there is a positive relation between the intensity of intangible assets and the
volatility of their stock prices for pharmaceutical firm probably due to the high
level of R&D in this industry.
The results of the regression from the other three industry group namely
manufacture of food product and beverages, information technology and
manufacture of basic metals all have a negative relation between the intensity
of intangible assets and the volatility of their stock prices with beta value of
-0.318, -0.415 and -0.348 respectively. These negative coefficients seems to be
opposite the direction we expected and this might be due to the fact that there is
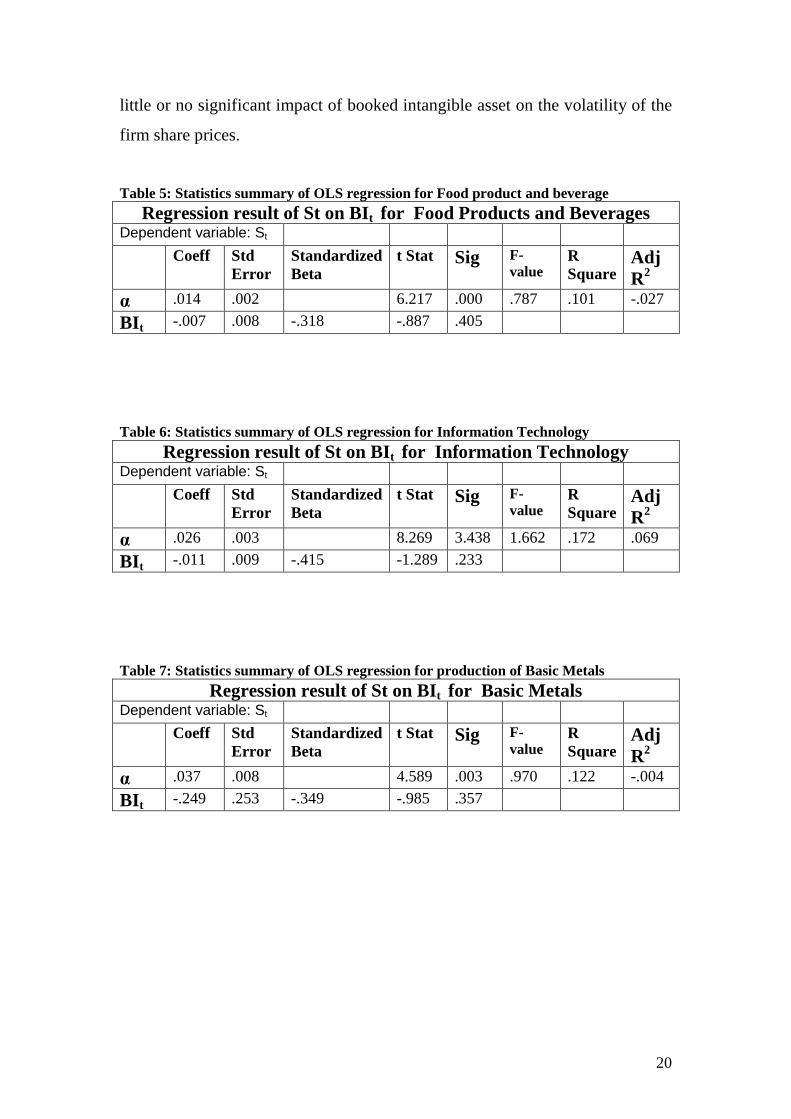
20
little or no significant impact of booked intangible asset on the volatility of the
firm share prices.
Table 5: Statistics summary of OLS regression for Food product and beverage Regression result of St on BIt for Food Products and Beverages
Dependent variable: St Coeff Std
Error Standardized Beta
t Stat Sig F-value
R Square
Adj R2
α .014 .002 6.217 .000 .787 .101 -.027
BI t -.007 .008 -.318 -.887 .405
Table 6: Statistics summary of OLS regression for Information Technology Regression result of St on BIt for Information Technology
Dependent variable: St Coeff Std
Error Standardized Beta
t Stat Sig F-value
R Square
Adj R2
α .026 .003 8.269 3.438 1.662 .172 .069
BI t -.011 .009 -.415 -1.289 .233
Table 7: Statistics summary of OLS regression for production of Basic Metals Regression result of St on BIt for Basic Metals
Dependent variable: St Coeff Std
Error Standardized Beta
t Stat Sig F-value
R Square
Adj R2
α .037 .008 4.589 .003 .970 .122 -.004
BI t -.249 .253 -.349 -.985 .357

21
CHAPTER FIVE
SUMMARY AND CONCLUSIONS
In this study, I have given an overview of intangible assets and I examine the
relation between the intensity of book value intangible assets of 38 firms and
the volatility of their stock prices.
The study shows a negative correlation between the intensity on firm’s
intangible assets and the volatility of their stock prices which opposes my
initial prediction and previous studies in this area. This negative association is
probably due to that fact that the data for intangible assets used in this study are
book values which are lower than the actual value and additionally, averaging
over a period between 8 and 10 years might have contributed to the counter
intuitive results.
Based on industry groups, I examine the relation between the intensity of book
value of intangible assets of four industry groups and the volatility of their
stock prices. Consistent with this prediction, I find a positive correlation
between the pharmaceutical industry book value of intangible assets and the
volatility of their stock prices which is supported by previous studies in this
area. The impact of uncertainty and expectation on the behaviour of investors
in this industry due to the high level of R&D going on in this industry also
contribute to this result.
The other three industry groups did not give any different results from the main
result of this study.
The study can be a first step towards a more broad understanding of the effect
of book value of intangible assets on the volatility of share prices.
Future studies should consider all intangible assets and should not only focus
on R&D and advertising. It should also look at the behaviour of investors with
respect to general intangible assets as investor’s behaviour is a major factor of
stock price volatility.

22
REFERENCES
• Campbell, J.Y., Lettau, M., Malkiel, B.G., and Yexiao, X. (2001).
“Have Individual Stocks Become More Volatile? An Empirical Exploration of Idiosyncratic Risk,” Journal of Finance, 56: 1-43.
• Chambers, D, Jennings, R. and Thompson II, R. B., (2002),
Managerial direction and accounting for research and development costs, Working paper and forthcoming Journal of Accounting, Auditing and Finance
• Chan, Louis K.C., Lakonishok, Josef and Sougiannis, Theodore ,
(1999) "The Stock Market Valuation of Research and Development
• Chan, L. K. C., J. Lakonishok and T. Sougiannis. (2000). “The
Stock Market Valuation of Research and Development Expenditures.” Working Paper, University of Illinois at Urbana-Champaign.
• Griliches, Z., Hall. B., and Pakes, A. (1991). R&D, Patents and
Market Value Revisited: Is There ad Second (Technological Opportunity) Factor?,” Economics, Innovation and New Technology, Vol. 1: 1983-201.
• Griliches, Z. (1998), R&D and productivity. The econometric
evidence. Chicago: The University of Chicago Press. • Hall, B., A. Jaffe, and M. Trajtenberg (2005). “Market value and
patent citations,” Rand Journal of Economics, Vol. 36(5)
• Heiens, Richard A; McGrath, Leanne C; Leach, Robert T (2008), Journal of Medical Marketing (2008) 8, 151-158. doi:10.1057/palgrave.jmm.5050131
• Journal of Accounting Literature, (2000), Vol. 19, pp. 102-130
• Knight, F.H. (1921). Risk, Uncertainty and Profit, Boston:
Houghton Mifflin.

23
• Lev, B., B. Sarath and T. Sougiannis. (2000). “R&D-Related Reporting Biases and Their Consequences.” Working Paper, New York University.
• Lev, B. and T. Sougiannis. (1996). “The Capitalization
Amortization and Value-Relevance of R&D.” Journal of Accounting and Economics 21, 107–138.
• Lev, B. and T. Sougiannis. (1999). “Penetrating the Book-to-
Market Black Box: The R&D Effect.” Journal of Business, Finance and Accounting 26(3–4), 419–449.
• Mary O’Mahony and Michela Vecchi, Do intangible investments
affect companies’ productivity performance? Working paper. National Institute of Economic and Social Research, London
• Mazzucato, M. (2002). “The PC Industry: New Economy or Early
Life-Cycle,” Review of Economic Dynamics, 5: pp. 318-345.
• Mazzucato, M. (2003). “Risk, Variety and Volatility: Innovation,
Growth and Stock Prices in Old and New Industries,” Journal of Evolutionary Economics, Vol. 13 (5), 2003: pp.491-512.
• Mazzucato, M. and Tancioni, M. (2005). “Idiosyncratic Risk and
Innovation,” Open University Discussion Paper 2005-50.
• John Hull,(2003), Option, Futures & Other Derivatives, fifth edition
• Pakes, A. (1985). “On Patents, R&D, and the Stock Market Rate of
Return,” Journal of Political Economy, Vol. 93(2): 390-409.
• Pastor, L. and Veronesi, P. (2005). “Technological Revolutions and Stock Prices,” National Bureau of Economic Research w11876.
• Pastor, L. and Veronesi, P. (2004). “Was There a Nasdaq Bubble in
the Late 1990’s,”Journal of Financial Economics, 81 (1): 61-100.
• Schwert, G.W. (1989). “Why Does Stock Market Volatility Change Over Time? Journal of Finance, 54: 1115-1153.

24
• Schwert, G.W. (2002). “Stock Market Volatility in the New Millenium: How Wacky is Nasdaq?”, Journal of Monetary Economics, 49: 3-26.
• Shiller, R.J. (2000). Irrational Exuberance Princeton University
Press, Princeton.
• Xiao-Jun Zhang, (2000), Discussion of “Excess Returns to R&D-Intensive Firms”. The Accounting Review, Volume 7, No 2-3.

25
APPENDIX Table 6: Data set sorted by Intensity of Intangible assets Company Intangible Asset Total Asset Intangible/Total Asset StockExchangeTradedSinclair Pharma PLC 26102 35332 0.738763727 LSE(SETS)Tarsus Group PLC 24789 35999 0.688602461 LSE(SETS)Evotec AG 137821 250159 0.550933606 XETRACadbury Schwepper PLC 3857 7760 0.497036082 LSE(SETS)Sabmiller PLC 3179 6867 0.462938692 LSE(SETS)Phoenix IT Group PLC 20708 47932 0.432028707 LSE(SETS)Skyepharma PLC 64247 150131 0.427939599 XETRAAND International Publishers N.V 7824 18883 0.414340942 Euronext AmsterdamFresinius Aktiengeselleschaft 3306 8136 0.406342183 XETRADeutsche Telekom AG (IT) 44567 119178 0.373953246 XETRAIndustrial and Financial System(IFS) AB 738970 2037580 0.362670423 OMXUnilever NV (Food products and beverage 14107753 39100178 0.360810455 Euronext AmsterdamDiageo PLC 4779 15725 0.30391097 LSE(SETS)Ordina N.V 52604 181929 0.289145766 Euronext AmsterdamQurius N.V 5282 24181 0.218435962 Euronext AmsterdamAntisoma PLC 6594 30515 0.216090447 LSE(SETS)Bayer Aktiengeselleschaft 7245 37127 0.195141003 XETRAMerck Kommanditgeselleschaft Auf Aktien 1383344 7284900 0.189891968 XETRAAldata Solution OYJ 7012254 37766078 0.185675992 Helsinki Stock ExchangeSmith & Nephew PLC 221 1212 0.182343234 LSE(SETS)ORKLA ASA 7604400 46956800 0.161944596 Oslo Stock ExchangeGreene King PLC 187620 1322650 0.141851586 LSE(SETS)Astrazeneca Plc (Basic Pharmaceutical 1522 11764 0.129377763 LSE(SETS)Associated British Food PLC 607 4880 0.124385246 LSE(SETS)Compofrio Alimentacion SA 110551 891797 0.12396431 Madrid Stock ExchangeSimac Techniek N.V 10543 90456 0.116553905 Euronext AmsterdamStone Soft OYJ 3820409 39839573 0.095894828 Helsinki Stock ExchangeBayer Shering Pharma Aktiengeselleschaft 504400 5409140 0.093249574 XETRAHeineken NV 775200 8386097 0.092438711 Euronext AmsterdamHKSCAN OYJ 33060290 373128782 0.088602894 Helsinki Stock ExchangeOutokumpu OYJ (Basic Metals) 271179 4942664 0.054864947 Helsinki Stock ExchangeOglesby & Butler Group PLC 313843 6339531 0.049505713 Irish Stock ExchangeHöganäs AB 154600 3986200 0.038783804 OMXRautaruukki OYJ 86657 2567490 0.033751641 Helsinki Stock ExchangeNorddeutsche Affinerie AG 25097 888187 0.028256437 Frankfurt SXPoujoulat 731 57168 0.012786874 Euronrxt ParisEtem S.A 1069998 96983742 0.011032756 Athens Stock ExchangeAcerinox S.A 23548 2578625 0.009131999 Madrid Stock ExchangeSidenor S.A 2072905 352145846 0.005886496 Athens Stock ExchangeZwahlen et Mayr S.A 445 76222 0.005838209 Swiss Exchange Figure 1: Graph of sorted data set by intensity of intangible assets
0
0.1
0.2
0.3
0.4
0.5
0.6
0.7
0.8
1 3 5 7 9 11 13 15 17 19 21 23 25 27 29 31 33 35 37 39
Series1