school vouchers and academic performance: results from...
TRANSCRIPT

School Vouchers and Academic Performance / 191
William G. HowellPatrick J. WolfDavid E. CampbellPaul E. Peterson
School Vouchers andAcademic Performance:Results from ThreeRandomized Field Trials
Journal of Policy Analysis and Management, Vol. 21, No. 2, 191–217 (2002)© 2002 by the Association for Public Policy Analysis and ManagementPublished by Wiley Periodicals, Inc.Published online in Wiley InterScience (www.interscience.wiley.com). DOI: 10.1002/pam.10023
Manuscript received February 2001; revised July 2001; accepted August 2001.
Abstract
This article examines the effects of school vouchers on student test scores in NewYork, New York, Dayton, Ohio, and Washington, DC. The evaluations in all threecities are designed as randomized field trials. The findings, therefore, are not con-founded by the self-selection problems that pervade most observational data. After2 years, African Americans who switched from public to private school gained,relative to their public-school peers, an average of 6.3 National Percentile Rankingpoints in the three cities on the Iowa Test of Basic Skills. The gains by city were 4.2points in New York, 6.5 points in Dayton, and 9.2 points in Washington. Effectsfor African Americans are statistically significant in all three cities. In no city arestatistically significant effects observed for other ethnic groups, after either 1 or 2years. © 2002 by the Association for Policy Analysis and Management.
INTRODUCTION
School vouchers represent one of the most controversial public policies in educationtoday. Choice-based reforms, which give students and families additional public andprivate schooling options, raise profound questions about educational markets,government regulation, public accountability, and the ability of parents (especiallypoor parents) to make informed educational decisions on behalf of their children.Until recently, however, little hard evidence on these matters was available. The promiseof vouchers remained largely speculative, deriving primarily from a theory of marketsand a modest empirical literature on school sector effects.
In the last decade scholars have collected a wealth of new evidence on theprogrammatic effects of school vouchers. Since the establishment of the first majorvoucher program in Milwaukee in 1990, dozens of publicly and privately funded choiceprograms have sprouted up nationwide, yielding copious research opportunities.Unfortunately, when trying to assess the effect of vouchers on student achievement,evaluators of these programs have confronted a common problem. Because studiesusually rely upon observational data, uncertainties linger about whether observeddifferences in test scores reflect actual differences between public and private schools,or simply the kinds of students who attend them.
This article reports new empirical evidence from privately financed voucherprograms in New York City, Dayton, Ohio, and Washington, DC. Because all threeprograms were over-subscribed and vouchers were randomly awarded to treatment

192 / School Vouchers and Academic Performance
and control groups, these evaluations exploit the advantages of experimentalresearch. At baseline, the two groups, on average, are identical to one another.Therefore, subsequent differences observed between the groups can be attributedto the effect of a school voucher.
After 2 years, African American students who switched from public to private schoolsscored between four and nine National Percentile Rankings (NPR) higher than theirpublic school counterparts on combined reading and math standardized tests in thethree cities; by contrast, no evidence indicates that school vouchers had an appreciableeffect on the test scores of students from other ethnic backgrounds. Although surveydata lend some insight into the underlying causes of these test score findings, definitiveanswers to why vouchers boosted the achievement of only African American studentsremain outstanding.
This research is designed to test the effects of targeted school voucher programs onthe achievement level of students who participate in them. Given the relatively smallsize of these programs, other important aspects of the school choice debate cannotbe investigated—e.g., the systemic effects vouchers may have on public and privateschool systems, the effect vouchers may have on the achievement level of studentswho did not participate in these programs, or the ways vouchers might alter thekinds of students enrolled in the two sectors.
PRIOR RESEARCH
Since Coleman, Hoffer, and Kilgore’s (1982) seminal work on Catholic schools, aconsensus has emerged that students attending private school enjoy significantlyhigher graduation rates; and while more mixed, the evidence on achievement suggeststhat private school students, especially those of African American descent, score higherthan their public-school peers (Chubb and Moe, 1990; Coleman and Hoffer, 1987;Evans and Schwab, 1993; Greeley, 1982; Hoffer, Greeley, and Coleman, 1985; Neal,1997, 1998; Witte, 1996).1 The basis for such conclusions is a literature on schoolsector effects that relies almost exclusively on observational data. As a consequence,questions regarding causality remain. Parents who choose to send their children toprivate school demonstrate considerable dedication, financial and otherwise, to theirchildren’s education. It remains unclear whether observed achievement differencesbetween public and private school students are due to the quality of private schoolsor characteristics of the students who attend them.
In the last decade, scholars have begun to study the effects of school vouchers onstudent achievement. Their work confronts the same selection problems that pervadethe literature on school sector effects (Metcalf et al., 1998; Moe, 1995; Witte, 1997).In his summary of the literature, Henry Levin (1998, pp. 374–375) makes preciselythis point:
It should be noted that controls for self-selection pose problems in that even whencontrolling for race and indicators of social class of students, families that chooseprivate schools and make a financial effort to pay for them are likely to be moreeducationally motivated than those that do not. Therefore, we would expect stu-dents from such families to have higher achievement than similar students who donot make the efforts to switch from a public to a private school. Whether one cancontrol statistically for this self-selection effect is questionable.
1 Some scholars have dissented from this consensus, pointing to flaws in the data collected on studentachievement and the procedures used to evaluate them (Goldberger and Cain, 1982; Wilms, 1985).

School Vouchers and Academic Performance / 193
Consequently, one should cautiously interpret comparisons between voucher recipientsand public school students, even those that attempt to account for differences inmeasured family background characteristics.
The best way to overcome problems of self-selection is to randomly assign studentsto treatment and control groups. Only then can one be confident that observeddifferences between the two groups involve differences in the ways public and privateschools operate and not simply the selection mechanisms that direct different kindsof students into the two educational sectors. Unfortunately, most voucher programshave not allowed for such comparisons. Privately funded programs in Indianapolisand San Antonio admitted students on a first-come, first-served basis. While Cleveland’sstate-funded program initially selected recipients randomly, eventually administratorsawarded vouchers to all applicants.
In Milwaukee, the original researchers collected test-score information for boththose offered a voucher and those who applied but did not receive a voucher. Sincethe law required that a lottery be used to allocate the vouchers, the conditions for arandomized field trial obtained, and the two secondary studies of Milwaukee exploitedthis fact (Greene, Peterson, and Du, 1997, 1998; Rouse, 1998). However, thegeneralizability of their findings is limited by the fact that the early Milwaukee programdid not include religious schools, and the number of participants who remained inthe evaluation for three years or more was quite small. Moreover, schooladministrators, rather than independent educators, conducted the lottery (Witte, 1999).Though there is no sign that administrators misused their authority, it is still unknownwhether the lottery actually worked as intended.
While randomized experiments in theory provide the perfect opportunity foridentifying the effects of public policy intervention, in practice they almost alwaysencounter limitations. Low response rate and nonconformist behavior (e.g.,treatment group members who refuse the programmatic intervention, or controlgroup members who find alternative ways to obtain it) are among the most commonchallenges facing policy experiments. As we examine the voucher programs in NewYork, Dayton, and DC, we will highlight these problems as they arise and spell outhow we have addressed them.
INTERNAL AND EXTERNAL VALIDITY FOR RANDOMIZED EXPERIMENTS
The strength of a research design rests primarily upon its internal and externalvalidity. Regarding the former, randomized experiments are superb. With successfulrandom assignment to test and control conditions, researchers can be confidentthat differences observed are due to treatment and not to confounding factors. Whilemany questions in the social sciences are not suited to an experimental design,where scholars have been able to utilize such experiments they have generated anabundance of new findings.
A number of policy researchers have studied the effects of a randomized field trialof the U.S. Housing and Urban Development’s Moving to Opportunity (MTO) program.The MTO program provides housing vouchers to interested families who wished tomove out of poor neighborhoods to more affluent communities. Because housingvouchers were awarded by lottery, the researchers were able to evaluate the program’seffects in the context of a randomized experiment. Katz, Kling, and Liebman (2001)found that Boston families who were offered the treatment of the MTO programrealized improved outcomes relative to the control group on a number of measuresof quality of life, including safety, health, and juvenile delinquency among boys.Ludwig, Duncan, and Hirschfield (2001) uncovered similar positive effects of the

194 / School Vouchers and Academic Performance
MTO on reducing juvenile arrests in Baltimore. In a related study, Ludwig, Ladd, andDuncan (2001) examined the effect of the MTO housing voucher program on studentachievement. These researchers found (p. 149), “elementary school children assignedto the experimental group achieved scores in both reading and math that exceededthose of the control group children by about one quarter of a standard deviation.”Their research design, response rates, analytic methods, and findings are quite similarto those in our study of school vouchers.
Steven Barnett (1991) reports the results of an evaluation of the Perry Preschoolremediation program, designed as a randomized field trial. His study confirms previousfindings that the IQ gains participants experience in such programs dissipate overtime. However, Barnett also demonstrates that overall academic achievement andlife success measures remain significantly higher for participants in pre-schoolprograms than for their non-program peers.
Even more closely related, the Tennessee STAR study tested the effects of class sizeon academic performance (Krueger 1999). Also designed as a randomized field trial,students were assigned by lot to classes of varying size and then tested at variousintervals over time. Again using analytic methods similar to those under discussion,this study shows that smaller classes lead to higher student achievement.
The school voucher experiments examined in this article share many of the strengthsof these well-regarded randomized field trials. Rather than award vouchers on a first-come, first-served basis, program operators in the three cities conducted lotteries sothat all applicants had an equal chance of receiving a voucher. Thus, at baseline thetreatment and control groups are similar, meaning that “commitment to education,”as well as every other characteristic save the offer of a voucher, is randomly distributedacross the treatment and control conditions.
PROGRAM DESCRIPTIONS
The designs of the voucher programs in New York City, Dayton, and Washingtonwere similar in key respects. All three programs were privately funded. Voucherswere offered only to students from low-income families, most of whom lived withinthe central city. They provided partial private school tuition, which the family wasexpected to supplement from other resources. All students included in the evaluationhad previously been attending public school. However, the programs differed in size,timing, and certain administrative details. Table 1 summarizes the most importantcharacteristics of the three programs.
The New York City program began 1 year (1997–1998) before the programs in Daytonand Washington (1998–1999).2 To receive a voucher in New York, the family’s incomehad to be low enough for their children to qualify for the federal school lunchprogram—$21,320 for a family of four. In Dayton and Washington, a family had tohave an income less than 2 and 2.7 times the federal poverty line, respectively ($35,985and $44,982).
In DC and Dayton, vouchers were awarded on a sliding scale—the larger a family’sincome, the lower the voucher its members received. Further, families were neverawarded vouchers that covered the full amount of private school tuition. In NewYork, the maximum amount of the voucher was $1400.3 In Dayton, the ceiling was$1200 or 60 percent of tuition, whichever was less. In Washington, it was $1700 or 60
2 The Washington Scholarship Fund actually began offering scholarships in 1993. However, it operated ona small scale until it greatly expanded in 1998.3 There was no cap on the percentage of tuition a voucher in New York could cover. Given their modestmonetary value, however, the vouchers almost never covered the full cost of attending a private school.

School Vouchers and Academic Performance / 195
percent of tuition. Given that the vast majority of voucher recipients in all 3 citiesattended a parochial school that charged a relatively modest tuition, even these smallvouchers went a long way toward covering their private schooling cost. In New York,Dayton, and Washington, the average tuition at a private school that voucher recipientsattended was $2100, $2600, and $3100 respectively.
In New York City, students in grades 1–4 were eligible for a voucher. In Washington,the range was K–8, while in Dayton it was K–12. In the latter two cities, however, theanalysis focuses on students who at baseline were in grades 1–7. While some vouchersin each city went to students who had previously been attending private schools, thisevaluation only includes students who were in public school at the time of the lottery.At baseline, 1,300 vouchers were offered to public-school students in New York City,809 in Washington, and 515 in Dayton.4
To qualify for a voucher, families were required to attend income verification, survey,and testing sessions. As a consequence, baseline data were collected on every subjectin the study, a standard rarely met in education research. In Washington and Dayton,all families who did not win the initial lottery became the control group. Because the
Name of program
First year of program
Max. amount of scholarship
Eligible grades in first year
Income eligibility
Num. students from publicschools that were testedat baseline
Response rate in 1st year
Response rate in 2nd year
Table 1. Description of the voucher programs.
New York, NY
School ChoiceScholarshipsFoundation
1997–1998
$1400
1–4
Eligible forfederal free
lunch program
1,960
82%
66%
Dayton andMontgomeryCounty, OH
ParentsAdvancingChoice inEducation
1998–1999
$1200
K–12
Up to 2�federal
poverty line
803
56%
49%
Washington, DC
WashingtonScholarship
Fund
1998–1999
$1700
K–8
Up to 2.5�federal poverty
line
1,582
63%
50%
4 These are public-school number of public-school students who were offered vouchers and were includedin the study. A handful of additional families were offered vouchers, but were not included in the evalua-tion for lack of baseline information. Several hundred private school families received vouchers but werenot included in the studies.
196 / School Vouchers and Academic Performance
New York City program received far more applicants than scholarships available, thecontrol group consisted of 960 families chosen at random from the non-winners.5
Baseline data collection was conducted in local private schools when classes werenot meeting (usually on Saturday). Students took the Iowa Test of Basic Skills (ITBS)M-Series Survey in reading and math.5a Testing sessions were held in February,March, and April. Each session lasted roughly one hour, with teachers andadministrators serving as proctors, under the supervision of program evaluators.The firm that publishes the ITBS graded the tests. Students in grades 4 and higheralso completed a short questionnaire inquiring about their school experience. Whilechildren were being tested, adults waited in another room and filled out a surveyabout their satisfaction with their children’s school, their involvement in theirchildren’s education, and their demographic characteristics. Results of these surveysare reported elsewhere.6
All students in both the treatment and control groups—including those who wereoffered a voucher, but declined to use it—were invited back to follow-up testing sessionsafter 1 and 2 years. Identical procedures for administering surveys and tests werefollowed at baseline, year 1, and year 2.
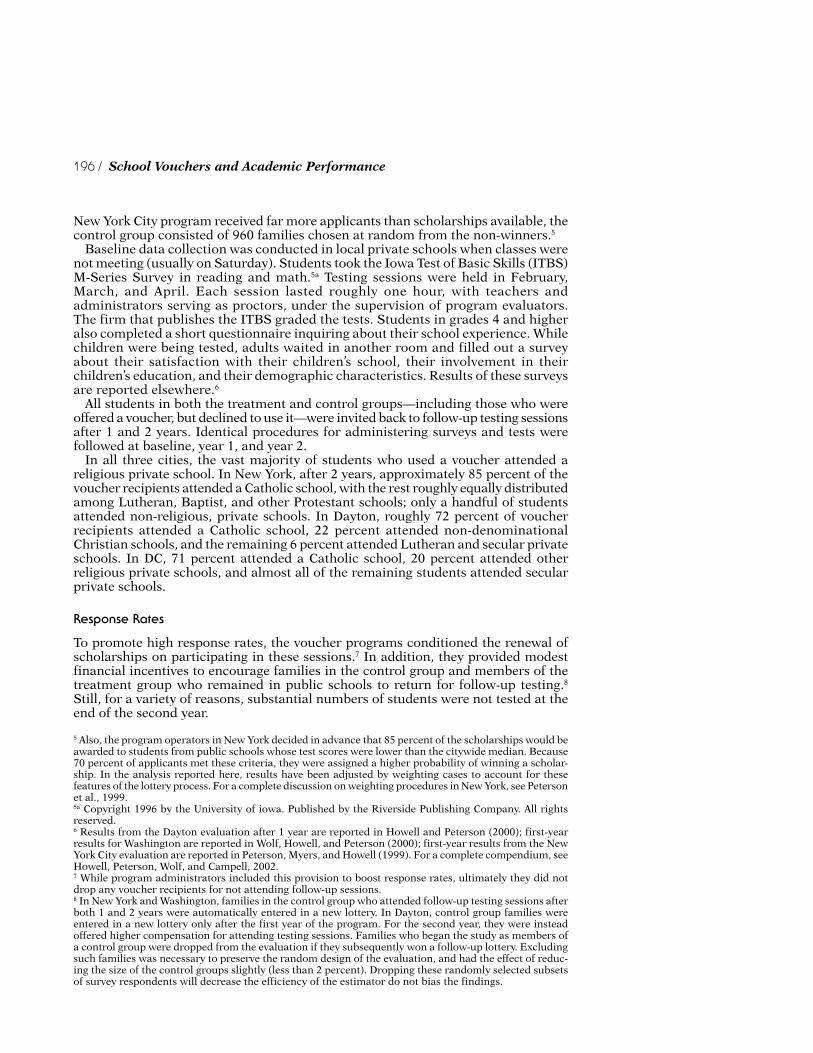
In all three cities, the vast majority of students who used a voucher attended areligious private school. In New York, after 2 years, approximately 85 percent of thevoucher recipients attended a Catholic school, with the rest roughly equally distributedamong Lutheran, Baptist, and other Protestant schools; only a handful of studentsattended non-religious, private schools. In Dayton, roughly 72 percent of voucherrecipients attended a Catholic school, 22 percent attended non-denominationalChristian schools, and the remaining 6 percent attended Lutheran and secular privateschools. In DC, 71 percent attended a Catholic school, 20 percent attended otherreligious private schools, and almost all of the remaining students attended secularprivate schools.
Response Rates
To promote high response rates, the voucher programs conditioned the renewal ofscholarships on participating in these sessions.7 In addition, they provided modestfinancial incentives to encourage families in the control group and members of thetreatment group who remained in public schools to return for follow-up testing.8Still, for a variety of reasons, substantial numbers of students were not tested at theend of the second year.
5 Also, the program operators in New York decided in advance that 85 percent of the scholarships would beawarded to students from public schools whose test scores were lower than the citywide median. Because70 percent of applicants met these criteria, they were assigned a higher probability of winning a scholar-ship. In the analysis reported here, results have been adjusted by weighting cases to account for thesefeatures of the lottery process. For a complete discussion on weighting procedures in New York, see Petersonet al., 1999.5a Copyright 1996 by the University of iowa. Published by the Riverside Publishing Company. All rightsreserved.6 Results from the Dayton evaluation after 1 year are reported in Howell and Peterson (2000); first-yearresults for Washington are reported in Wolf, Howell, and Peterson (2000); first-year results from the NewYork City evaluation are reported in Peterson, Myers, and Howell (1999). For a complete compendium, seeHowell, Peterson, Wolf, and Campell, 2002.7 While program administrators included this provision to boost response rates, ultimately they did notdrop any voucher recipients for not attending follow-up sessions.8 In New York and Washington, families in the control group who attended follow-up testing sessions afterboth 1 and 2 years were automatically entered in a new lottery. In Dayton, control group families wereentered in a new lottery only after the first year of the program. For the second year, they were insteadoffered higher compensation for attending testing sessions. Families who began the study as members ofa control group were dropped from the evaluation if they subsequently won a follow-up lottery. Excludingsuch families was necessary to preserve the random design of the evaluation, and had the effect of reduc-ing the size of the control groups slightly (less than 2 percent). Dropping these randomly selected subsetsof survey respondents will decrease the efficiency of the estimator do not bias the findings.

School Vouchers and Academic Performance / 197
Response rates after 1 and 2 years are shown in Table 1. Roughly 60 percent of thetreatment and control samples returned for testing after 1 year in Dayton andWashington; roughly 50 percent returned after 2 years. In New York, the responserates are somewhat higher: 82 percent for year 1, and 66 percent for year 2. Responserates were virtually identical for treatment and control groups after 1 and 2 years inall three cities.9 Had response rates differed noticeably between the two groups, thenperceived treatment effects might be spurious, assuming that the likelihood ofattending follow-up sessions was correlated with test scores.
Comparisons of baseline test scores and background characteristics reveal onlyminor differences between the second-year respondents and non-respondents in allthree cities. Table 2 presents baseline data on respondents and non-respondents after
9 The one exception here concerns the year 2 evaluation in New York where the treatment group’s responserate was seven points higher than the control group’s.
Table 2. Characteristics of respondents and non-respondents in treatmentand control groups.
Note: Averages refer to the unweighted, mean scores of responses on the parental surveys. Mother’seducation was scaled slightly differently in New York than in Dayton, and DC, making inter-city compari-sons on this item inappropriate.
New York City% African American% welfare recipients% Catholic% ProtestantAve. overall test scoresAve. family sizeAve. residential mobilityAve. church attendanceAve. mother’s education
Dayton% African American% welfare recipients% Catholic% ProtestantAve. overall test scoresAve. family sizeAve. residential mobilityAve. church attendanceAve. mother’s education
DC% African American% welfare recipients% Catholic% ProtestantAve. overall test scoresAve. family sizeAve. residential mobilityAve. church attendanceAve. mother’s education
Attended Y2
42.446.854.734.320.12.63.73.62.4
74.016.75.8
65.226.33.93.43.45.6
90.438.015.572.726.53.13.43.75.4
Treatment Control
Didn’t attend Y2
48.335.546.439.419.52.63.63.32.4
65.213.814.058.126.33.63.33.35.4
92.134.112.669.926.43.13.53.55.0
Attended Y2
41.440.653.735.022.82.43.73.42.4
71.916.213.464.627.23.03.33.65.3
90.932.116.065.626.93.33.53.75.3
Didn’t attend Y2
47.237.343.238.822.6
2.93.73.52.5
69.316.718.156.926.2
3.13.63.75.6
92.130.313.870.626.7
3.03.43.75.2

198 / School Vouchers and Academic Performance
2 years in the treatment and control groups in the three cities. Some differences aredetectable regarding race, welfare, and religious orientation, but they point in differentdirections in different cities and do not appear to systematically produce moreadvantaged treatment group respondents, nor particularly disadvantaged controlgroup respondants. In all three cities, differences involving test scores, religiousidentification, residential mobility rates, church attendance, and family size areessentially nonexistent.
To account for the minor differences between respondents and non-respondents,weights were generated based upon the probability that each student, according tohis or her baseline demographic characteristics, would attend follow-up sessions.Because only slight differences existed between the groups of respondents and non-respondents, the weights had little effect on the results of the analysis. Appendix Aprovides a full discussion of the weighting procedure.
To generate these weights only observable characteristics were used as recorded inparental surveys; to the extent that there are unmeasured, or unobservable,characteristics that encourage some families, but not others, to attend follow-upsessions, these weights may not completely eliminate the bias associated with less-than-perfect response rates. However, for response bias to explain the findings, threeconditions would have to hold. First, respondents would have to differ from non-respondents on an unmeasured factor that influences test performance. Second, thedifference would have to be larger for one testing group (treatment or control) thanfor the other. And third, the difference would have to hold for black students but notfor students of other ethnic groups.
PROGRAMMATIC EFFECTS ON STUDENT TEST SCORES
It is useful to distinguish between the effects of the offer of a voucher from the effectsof actually switching to a private school. Estimating the effects of an offer providesan indication of the policy effects of small voucher programs serving poor central-city residents at the specific usage or take-up rate observed in the pilot programsunder investigation. The estimate of the effect of an offer of a voucher does not comparestudents who attended private schools with those who attended public schools. Rather,it compares those students who were offered a voucher, to those who were not,regardless of whether students in either group actually attended a private school.Analysts typically refer to this comparison as the “intent-to-treat” effect because itcompares subjects who program sponsors attempted to help with those subjects inthe control group.
To estimate the effect of a voucher offer, we run the following ordinary least squares(OLS) model:
Yt = � + B
1V + B
2Y
0R + B
3Y
0M + � (1)
Yt is each student’s total achievement score on the Iowa Test of Basic Skills expressed
in NPR points,10 where the subscript t denotes the year the student completed thefollow-up test (either 1 or 2). The total achievement score is a simple average of themath and reading components.11 V is an indicator variable for whether or not an
10 For ease of interpretation, we report effects in terms of NPR points. The results do not change substan-tively in any city when using National Curve Equivalents or raw test scores.11 Because it is based upon a larger number of test items, the total achievement score is likely to generatemore stable estimates than are reading and math scores estimated separately (see Krueger, 1999).

School Vouchers and Academic Performance / 199
individual was offered a voucher. Y0R
and Y0M
are the baseline reading and math scores.Baseline test scores are included to adjust for minor differences between the treatmentand control groups on achievement on the baseline tests, and to increase the precisionof the estimated effects. The B
1 coefficient therefore represents the estimated effect
of being offered a voucher on student test scores. Students in all three cities scoredquite low relative to the national norm, typically between the 20th and 30th NPR (outof 100). Table 3 presents summary test-score statistics, both for all students and forAfrican Americans separately.
Table 3. Descriptive statistics for test scores in three cities over two years.
Note: Figures represent students’ baseline reading and math score and their year-one and year-two totalachievement scores on the Iowa Test of Basic Skills expressed in terms of NPR points. Figures in year oneand two are weighted to account for non-response.
Test Scores
All Students
New York, NYBaseline MathBaseline ReadingYear One Total AchievementYear Two Total Achievement
Dayton, OHBaseline MathBaseline ReadingYear One Total AchievementYear Two Total Achievement
Washington, DCBaseline MathBaseline ReadingYear One Total AchievementYear Two Total Achievement
African Americans
New York, NYBaseline MathBaseline ReadingYear One Total AchievementYear Two Total Achievement
Dayton, OHBaseline MathBaseline ReadingYear One Total AchievementYear Two Total Achievement
Washington, DCBaseline MathBaseline ReadingYear One Total AchievementYear Two Total Achievement
Mean
18.525.025.025.3
25.028.135.330.2
23.230.125.322.4
16.726.325.021.5
21.025.432.027.1
22.729.824.821.5
Standard Deviation
20.823.120.620.2
25.827.323.523.1
21.727.019.319.3
18.723.320.618.0
22.925.221.120.1
21.326.818.918.6
N
1852185214561199
725725409382
15821582933725
806806624497
473473296273
14771477891668

200 / School Vouchers and Academic Performance
This model does not include many of the controls that are commonplace inthe sector-effects literature. Given random assignment, however, any omittedvariables should be orthogonal to the voucher offer, and thus should not biasthe results. (Nonetheless, later in this article we estimate models that includedemographic controls).
The regression results for New York, Dayton, and Washington after 1 and 2 yearsare exhibited in Table 4. After 1 year, none of the cities post significant effects for theentire group of students who were offered a voucher. After 2 years, only the DC programdemonstrates clear overall voucher gains. Averaging across the three cities (weightingeach estimate by the inverse of its variance) generates a year 1 average effect of avoucher offer of 0.7 NPR points and a year 2 effect of 1.8, neither of which is statisticallysignificant. At first blush, then, the voucher programs do not appear to have had aconsistent, substantive effect on student test scores, at least after 2 years.
These general findings, however, mask important differences in voucher effectsamong subgroups of the population. Table 5 re-estimates the effect of a voucher offerafter 1 and 2 years, this time breaking out the samples into African Americans andother ethnic groups. After 1 year, African Americans in New York who were offered avoucher scored, on average, 4.5 NPR points higher than members of the control group;in Dayton and Washington, effects for African Americans after 1 year are
Note: OLS regressions performed with weighted data. Standard errors reported in parentheses. Year-1results for all students are reported in columns 1, 3, and 5; year-2 results are reported in columns 2, 4, and6. * significant at 0.10 level, two-tailed test; ** significant at 0.05 level; *** significant at 0.01 level. Testscores at years 1 and 2 represent the combined math and reading scores on the Iowa Test of Basic Skillsexpressed in terms of NPR points. New York models also include indicator variables for the differentlotteries conducted (see Peterson et al., 1999). The DC model includes an indicator variable for the pilottreatment session. This control is prudent, as difficulties were encountered in the administration of thefirst-year test at the initial pilot session. Test booklets were not available at the testing site for scholarshipstudents in grades 3–8. Copies of the test arrived eventually, but the amount of time available for testingmay have been foreshortened (see Wolf, Howell, and Peterson, 2000).
Table 4. Effect of a voucher offer on the test scores of all students in three cities after 1 and2 years.
New York, NY Dayton, OH Washington, DC
Year 1(1)
1.23(0.98)
0.40***(0.02)
0.35***(0.02)
3.740.46
1456
Offered Voucher
Baseline ScoresMath
Reading
ConstantAdjusted R2
(N)
Year 2(2)
0.46(1.08)
0.40***(0.03)
0.35***(0.02)
5.670.43
1199
Year 1(3)
1.29(1.82)
0.30***(0.04)
0.30***(0.04)
17.28***0.39
409
Year 2(4)
2.11(1.77)
0.31***(0.04)
0.38***(0.03)
11.73***0.43
382
Year 1(5)
–0.11(1.08)
0.41***(0.03)
0.18***(0.02)
10.91***0.42
933
Year 2(6)
3.04***(1.14)
0.44***(0.03)
0.13***(0.02)
6.87***.36
725

School Vouchers and Academic Performance / 201
Table 5. Effect of a voucher offer on the test scores of African Americans and other ethnicgroups in three cities after 1 and 2 years.
Note: OLS regressions performed with weighted data. Standard errors reported in parentheses. Resultsfor African Americans are reported in columns 1, 3, and 5; results for other ethnic groups are reported incolumns 2, 4, and 6. * significant at .10 level, two–tailed test; ** significant at .05 level; *** significant at .01level. Test scores at years 1 and 2 represent the combined math and reading scores on the Iowa Test ofBasic Skills expressed in terms of NPR points. New York models also include indicator variables for thedifferent lotteries conducted; the Year-one DC model includes an indicator variable for the pilot treatmentsession.
1 88 percent of non–African Americans in New York at baseline consisted of Latinos; 5 percent consistedof whites; and 7 percent consisted of other ethnic groups.
2 2 percent of non–African Americans in Dayton at baseline consisted of Latinos; 91 percent consisted ofwhites; and 7 percent consisted of other ethnic groups.
3 61 percent of non–African Americans in DC at baseline consisted of Latinos; 20 percent consisted ofwhites; and 19 percent consisted of other ethnic groups.
New York, NY Dayton, OH Washington, DC
Af. Am.(1)
4.47***(1.28)
0.36***(0.04)
0.38***(0.03)
–4.90.52
624
3.27**(1.50)
0.37***(0.04)
0.29***(0.03)
0.79.43
497
First YearOffered Voucher
Baseline ScoresMath
Reading
ConstantAdjusted R2
(N)
Second YearOffered Voucher
Baseline ScoresMath
Reading
ConstantAdjusted R2
(N)
Oth. Ethn.1
(2)
–1.18(1.43)
0.38***(0.03)
0.32***(0.03)
–1.18.43
817
–1.04(1.50)
0.37***(0.03)
0.40***(0.03)
10.94.47
699
Af. Am.(3)
1.88(1.99)
0.25***(0.05)
0.39***(0.04)
16.01***.35
296
3.46*(1.98)
0.22***(0.05)
0.37***(0.04)
11.52***.34
273
Oth. Ethn.2
(4)
0.66(4.10)
0.33***(0.08)
0.33***(0.07)
22.20***.38
108
–0.08(3.96)
0.39***(0.07)
0.36***(0.07)
15.47***0.50
96
Af. Am.(5)
–0.34(1.10)
0.39***(0.03)
0.19***(0.02)
10.74***.41
891
3.80***(1.16)
0.40***(0.03)
0.14***(0.02)
6.49***.34
668
Oth. Ethn.3
(6)
4.74(5.63)
0.57***(0.15)
0.02(0.14)
13.41***.49
39
–0.08(0.42)
0.42***(0.18)
0.24(0.15)
11.77**.45
42

202 / School Vouchers and Academic Performance
indistinguishable from 0.12 In no city did members of other ethnic groups postsignificant effects, positive or negative. In New York, the vast majority of non-AfricanAmericans consist of Latinos; in Dayton, non-African Americans primarily arewhites; and in Washington, because there are so few non-African Americans,comparisons between ethnic groups are not informative. Things change somewhatwhen moving to the second year. In all three cities, African Americans who wereoffered a voucher scored significantly higher than African American members ofthe control group. After 2 years, the effects for African Americans in the three citiesrange from 3.3 to 3.6 NPR points, with a weighted average effect of 3.5 NPR points.13
As in year 1, no statistically significant effects, positive or negative, were observedfor other ethnic groups.
It is unlikely that peculiarities of data collection or program operations generatedthese differential effects for African Americans and other ethnic groups. The responserates of African Americans and other ethnic groups are roughly comparable in allthree cities. In addition, African Americans were just as likely as other ethnic groups(and, in Dayton, more likely) to use a voucher when one was offered to them. Whilewhite members of the control group in Dayton were 9 percentage points more likelyto attend a private school than were African Americans in the control group, AfricanAmericans who were in the control groups in New York and Washington were nomore likely to attend a private school than control-group members of other ethnicbackgrounds. The estimated effects for African Americans and other ethnic groupslikely reflect the true effects of the offer of a school voucher in these three cities after2 years.14
Estimating the effect of a voucher offer has obvious advantages. For one, theanalytical strategy used to estimate programmatic effects is straightforward. OLSregression will do. In addition, the estimated effects provide a basis on which toassess the public policy implications of a voucher program targeted at poor residentsin major U.S. cities. Using the results in Tables 4 and 5 to draw conclusions aboutvoucher programs that utilize different marketing strategies, or operate in cities withfewer private schools, may present problems. The rates at which students actuallyused the vouchers that were offered to them (i.e., take-up rates) are likely to dependupon the monetary value of the voucher and the demand for and supply of privateschools in a given city. The effects estimated here are for specific take-up rates. A newprogram that places higher or lower percentages of their treatment group in localprivate schools may have different effects than those reported above.
In addition to estimating the average effect of a voucher offer, the effect of actuallyswitching from a public to a private school is isolated. Do students who move from
12 In DC, African American students in grades 6-8 who were offered a voucher scored significantly lowerthan members of the control group. By contrast, younger African Americans who were offered a voucherscored somewhat higher than members of the control group. As Table 5 shows, in the aggregate theseeffects cancel out one another. No such Cohort effects were observed in Dayton.13 Each city’s average effect is weighted inversely to its variance.14 The change from year-1 effects to year-2 effects is largest in Washington. It is possible that the observedturnaround (which was most pronounced among older African Americans) is simply an artifact of theresponse rates: while under-performing students in the treatment group attended year-1 testing sessions,they may have skipped the following year’s sessions. To investigate this possibility, we re-estimated themodels looking only at students who attended both follow-up sessions. If the dramatic change in effectsfor African American students who were offered a voucher in year 1 and year 2 was merely the result ofdifferent groups of students re-testing at the two periods, then these models ought to generate very differ-ent results than those presented in Tables 4 and 5. Virtually identical results, however, are recovered atyear 1 and year 2 using this stable sample approach.

School Vouchers and Academic Performance / 203
public to private school score higher, lower, or about the same as comparable studentswho remain in public schools?
Given that the randomization process applied to the offer of a voucher, and not theactual attendance at public and private schools, a private-school indicator variableshould not be substituted for the voucher-offer indicator variable included in equation1. The private school indicator variable, in this instance, is endogenous. The samekinds of causal factors that affect the likelihood that each child will attend a privateschool (income, mother’s education, parental involvement) presumably also affectstudent test score performance.
Therefore, to estimate the effect of switching school sectors, a two-stage least squaresmodel (2SLS) was performed using the voucher offer V as an instrument to predictwhether a student attended a private school (Angrist, Imbens, and Rubin, 1996). Vfulfills the two requirements for an instrument to be a consistent estimator. First, itdoes a good job of predicting whether a student attends a private school; being offereda voucher, on average, increases the likelihood that a student will attend a privateschool in the first year by 77 percent in New York, 60 percent in Dayton, and 57percent in Washington.15 (Table 6 summarizes the percentage of members of thetreatment and control group who attended private schools after 1 and 2 years.) Second,because vouchers were offered randomly, V is uncorrelated with the error term in theequation explaining year 1 and year 2 test scores.
Using the voucher offer as an instrument effectively recovers the randomized designof the experiment. The fact that not every student who was offered a voucher used it,and not every student in the control group remained in public school, does not, initself, pose a problem. From a statistical point of view, it does not matter that thosewho actually used vouchers offered to them differed in some respects from thosewho did not; nor that those members of the control group who found alternativeways to attend a private school differed from those who remained in public schools.The 2SLS model effectively adjusts for such differences.
Using the frequency of noncompliance in the two groups (control members whoswitch to private school; treatment members who remain in public school), theinstrument builds off the effects obtained in equation 1 to estimate the actual effectof changing school sectors. Relative to the intent-to-treat effect, the estimated effectof actually attending a private school increases as the percentage of control groupmembers who attend private schools increases (see the odd rows in Table 6) and thepercentage of treatment group members who attend private schools decreases (seethe even rows). Thus, if no students in the control group attend a private school, andevery student who is offered a voucher attends a private school, the estimated effectof the OLS and 2SLS models will be identical. If no students in the control groupattend a private school, but only half the students in the treatment group attend aprivate school, then the estimated effect in the 2SLS models will be twice the estimatedeffect in the simple OLS model.
As before, the effects of switching from a public to a private school on student testscores for African Americans and other ethnic groups are estimated separately:
15 In future work, we plan on further examining the differential take-up rates in the three cities. Of particu-lar interest is the relatively modest difference in the number of treatment versus control group membersattending private schools in Washington. We suspect that the higher incidence of program attrition in DCmay be due, in part, to the greater availability of charter schools. One year into the program, when pro-gram attrition was still modest and charter schooling was new to the District, about 3 percent of thestudents in the treatment group had enrolled in a public charter school, declining to use the scholarship.By the second year of the evaluation, when program attrition increased significantly, almost 13 percent ofthe students in the treatment group were enrolled in the burgeoning collection of public charter schools.

204 / School Vouchers and Academic Performance
P = �1 + �
1V + �
2Y
0R + �
3Y
0M + �
1(2)
Yt = �2 + �4P + �5Y0R
+ �6Y0M + �2
P is an indicator variable for attendance at a private school.16 The �4 coefficient
represents the estimated effect of switching from a public to a private school onstudent test scores.17 The other elements of equation 2 are defined in equation 1. Insum, this model compares the test scores of those students who used a voucher toswitch from a public to a private school with those students in the control group whowould have made the switch had they been offered a voucher. The results cannot begeneralized to all those offered a voucher, had they made use of it, unless those whoattended a private school represent a random draw from all those offered vouchers.
Note: Private school attendance rates reported for treatment and control group members who attendedyear–one and year–two follow–up testing sessions. Rates for the entire populations are somewhat lower.
Table 6. Attendance patterns among treatment and control groups.
All Students
Individuals offered a voucher whoattended a private school in 1st year
Individuals not offered a voucher whoattended a private school in 1st year
Individuals offered a voucher whoattended a private school both years
Individuals not offered a voucher whoattended a private school both years
African Americans
Individuals offered a voucher whoattended a private school in 1st year
Individuals not offered a voucher whoattended a private school in 1st year
Individuals offered a voucher whoattended a private school both years
Individuals not offered a voucher whoattended a private school both years
New York
%
82
5
79
3
85
4
82
1
Dayton
%
78
18
60
10
74
15
61
7
Washington
%
68
11
47
8
68
11
46
6
16 For the first year’s analysis, P denotes whether an individual attended a private school for the entirety ofthe school year. For the second year’s assessment, P denotes whether an individual attended a privateschool for both years.17 This model treats the private school variable in the first of these two equations as continuous, when in factit is dichotomous. We are following convention here (see, for example, Ludwig, Ladd, and Duncan, 2001).Randomized field trials that use treatment status as an instrument commonly assume as much. Nonetheless,we have estimated the first equation in a maximum likelihood framework, and then plugged in the predictedvalues into the second equation. The recovered point estimates were very similar to what is reported below.The difficulty with this approach, however, concerns estimating appropriate standard errors.

School Vouchers and Academic Performance / 205
Table 7 reports the estimated effects for all three cities 1 and 2 years after the voucherprograms began. With this instrument, the pattern of effects of a voucher offer carryover fully to the patterns of effects of switching from a public to a private school; allthat changes are the magnitude and the variances of the estimated effects. In NewYork, after 1 year, African Americans who switched to a private school gained, onaverage, 5.8 NPR points relative to their public school peers. Significant effects after1 year were not observed for either African Americans in Dayton or DC, or for non-African Americans in any of the three cities.
After 2 years, African Americans who switched school sectors posted positive andsignificant gains in all three cities. Given differences in the percentage of the treatmentgroups in the three cities that actually attended private schools (New York was highest,DC lowest), as well as differences in the percentage of control-group students who
Note: 2SLS regressions performed with weighted data. Treatment status used as instrument for privateschool attendance. Standard errors reported in parentheses. Results for African Americans are reported incolumns 1, 3, and 5; results for other ethnic groups are reported in columns 2, 4, and 6. * significant at 0.10level, two–tailed test; ** significant at 0.05 level; *** significant at 0.01 level. Test scores at years 1 and 2represent the combined math and reading scores on the Iowa Test of Basic Skills expressed in terms ofNPR points. New York models also include indicator variables for the different lotteries conducted; theYear-one DC model includes an indicator variable for the pilot treatment session.
Table 7. Effect of switching from a public to a private school on the test scores of AfricanAmericans and other ethnic groups in three cities after 1 and 2 years.
New York, NY Dayton, OH Washington, DC
Af. Am.(1)
5.83***(1.68)
0.37***(0.04)
0.38***(0.03)
–4.790.51
624
4.41**(2.03)
0.37***(0.04)
0.29***(0.03)
0.440.42
497
First YearPrivate School
Baseline ScoresMath
Reading
ConstantAdjusted R2
(N)
Second YearPrivate School
Baseline ScoresMath
Reading
ConstantAdjusted R2
(N)
Oth. Ethn.(2)
–1.70(2.07)
0.38***(0.03)
0.32***(0.03)
18.65**0.43
817
–1.54(2.23)
0.37***(0.03)
0.40***(0.03)
11.110.47
699
Af. Am.(3)
3.26(3.45)
0.25***(0.05)
0.39***(0.04)
15.41***0.35
296
6.45*(3.66)
0.23***(0.05)
0.37***(0.04)
10.77***0.35
273
Oth. Ethn.(4)
1.04(6.42)
0.33***(0.08)
0.33***(0.08)
21.96***0.38
108
–0.19(8.96)
0.39***(0.08)
0.36***(0.08)
15.52***0.50
96
Af. Am.(5)
–0.90(2.76)
0.39***(0.03)
0.19***(0.02)
10.78***0.41
891
9.22***(2.86)
0.39***(0.03)
0.13***(0.02)
6.49***0.33
668
Oth. Ethn.(6)
7.39(8.71)
0.57***(0.15)
0.01(0.14)
13.46***0.50
39
–0.14(9.77)
0.42**(0.19)
0.24(0.15)
11.76*0.45
42

206 / School Vouchers and Academic Performance
attended public school, the recovered estimates of the two-stage models varysignificantly more than the intent-to-treat estimates that are reported in Table 5. InNew York, the effect of switching from a public to a private school for AfricanAmericans was 4.4 NPR points, a slight drop from the year-1 effect; in Dayton, theeffect was 6.3 NPR points, roughly twice the estimated effect after 1 year; and inWashington, the effect was 9.0 NPR points, a dramatic increase from year 1. Thethree-city average effect of switching to a private school for 2 years for AfricanAmericans was a statistically significant 6.3 NPR points, or roughly one third of astandard deviation. Once again, in all three cities members of other ethnic groupsdid not appear to suffer any test-score losses, or reap any gains, when they switchedfrom a public to a private school.
The estimated voucher effect on African American students is comparable to theone found in an evaluation of a class-size reduction intervention conducted inTennessee, the only other major education reform to be studied with a randomizedfield trial. According to a recent reanalysis of data from Tennessee (Krueger, 1999),the class-size reduction effect for African Americans after 2 years was on average, 7to 8 percentile points, slightly larger than the 6.3-point effect associated with switchingto a private school.
Re-Examining Year-2 Programmatic Effects
Given that vouchers were randomly offered at baseline, family backgroundcharacteristics need not be controlled for to generate unbiased estimates ofprogrammatic effects. Including such covariates should not substantively affect theestimated effects reported above. In fact, the principal effect of including additionalcontrol variables should be to lower the standard errors of the coefficient estimates.To verify this, the intention to treat model (1) was re-estimated but four familybackground covariates collected from baseline surveys were added to the right-handside of the equation: mother’s education, employment status, whether the familyreceived welfare benefits, and family size.18
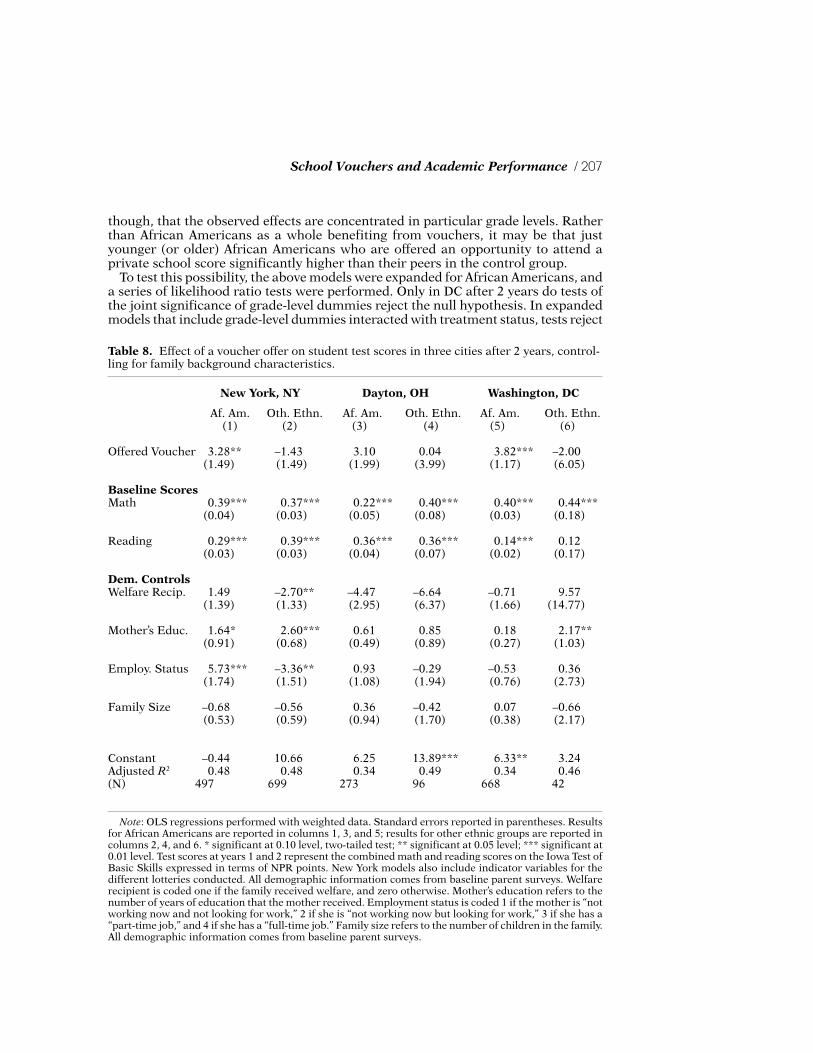
Table 8 reports the findings. By including demographic controls, the estimatedeffects of a voucher offer do not change substantively. In New York and Washington,the estimated effects with background controls are virtually identical to those withoutsuch controls. In Dayton, the estimate of the voucher offer effect drops from 3.5 to3.1, and is no longer significant at the 0.10 level (the new p value is 0.12). The three-city average remains a statistically significant 3.5 NPR points. Had the initial lotteryfailed and treatment and control groups differed in important respects, then theestimated effect of a voucher offer would differ considerably depending upon whetheror not background controls were included. The robustness of the findings, particularlyin New York and Washington, are encouraging.19
These findings strongly suggest that after 2 years African Americans who were offereda voucher scored significantly higher than those who were not. Differences for allother ethnic groups, meanwhile, remain statistically insignificant. It is possible,
18 Missing values for school covariates inputed by best-subset regresssion=. Models also run using GaryKing’s multiple imputation program AMELIA generated virtually identical results. See Honaker et al. (2000);King et al. (2000).19 In these models, most control variables do not have a significant effect on year-2 test scores. In part, this isbecause baseline test scores that explain a significant portion of the variance in follow-up test scores werealready included. Where significant effects for background controls are observed, however, they tend topoint in the expected direction. Students from families on welfare score slightly lower than students fromfamilies who are not on welfare; and the more educated a mother is, the better her child tends to perform onstandardized tests. A mother’s employment status in New York has a significant effect on test scores for bothAfrican Americans and Latinos; the effect, however, has the opposite sign for the two groups.
School Vouchers and Academic Performance / 207
though, that the observed effects are concentrated in particular grade levels. Ratherthan African Americans as a whole benefiting from vouchers, it may be that justyounger (or older) African Americans who are offered an opportunity to attend aprivate school score significantly higher than their peers in the control group.
To test this possibility, the above models were expanded for African Americans, anda series of likelihood ratio tests were performed. Only in DC after 2 years do tests ofthe joint significance of grade-level dummies reject the null hypothesis. In expandedmodels that include grade-level dummies interacted with treatment status, tests reject
Table 8. Effect of a voucher offer on student test scores in three cities after 2 years, control-ling for family background characteristics.
Note: OLS regressions performed with weighted data. Standard errors reported in parentheses. Resultsfor African Americans are reported in columns 1, 3, and 5; results for other ethnic groups are reported incolumns 2, 4, and 6. * significant at 0.10 level, two-tailed test; ** significant at 0.05 level; *** significant at0.01 level. Test scores at years 1 and 2 represent the combined math and reading scores on the Iowa Test ofBasic Skills expressed in terms of NPR points. New York models also include indicator variables for thedifferent lotteries conducted. All demographic information comes from baseline parent surveys. Welfarerecipient is coded one if the family received welfare, and zero otherwise. Mother’s education refers to thenumber of years of education that the mother received. Employment status is coded 1 if the mother is “notworking now and not looking for work,” 2 if she is “not working now but looking for work,” 3 if she has a“part-time job,” and 4 if she has a “full-time job.” Family size refers to the number of children in the family.All demographic information comes from baseline parent surveys.
New York, NY Dayton, OH Washington, DC
Offered Voucher
Baseline ScoresMath
Reading
Dem. ControlsWelfare Recip.
Mother’s Educ.
Employ. Status
Family Size
ConstantAdjusted R2
(N)
Af. Am.(1)
3.28**(1.49)
0.39***(0.04)
0.29***(0.03)
1.49(1.39)
1.64*(0.91)
5.73***(1.74)
–0.68(0.53)
–0.440.48
497
Oth. Ethn.(2)
–1.43(1.49)
0.37***(0.03)
0.39***(0.03)
–2.70**(1.33)
2.60***(0.68)
–3.36**(1.51)
–0.56(0.59)
10.660.48
699
Af. Am.(3)
3.10(1.99)
0.22***(0.05)
0.36***(0.04)
–4.47(2.95)
0.61(0.49)
0.93(1.08)
0.36(0.94)
6.250.34
273
Oth. Ethn.(4)
0.04(3.99)
0.40***(0.08)
0.36***(0.07)
–6.64(6.37)
0.85(0.89)
–0.29(1.94)
–0.42(1.70)
13.89***0.49
96
Af. Am.(5)
3.82***(1.17)
0.40***(0.03)
0.14***(0.02)
–0.71(1.66)
0.18(0.27)
–0.53(0.76)
0.07(0.38)
6.33**0.34
668
Oth. Ethn.(6)
–2.00(6.05)
0.44***(0.18)
0.12(0.17)
9.57(14.77)
2.17**(1.03)
0.36(2.73)
–0.66(2.17)
3.240.46
42

208 / School Vouchers and Academic Performance
the null in both years in New York, in neither year in Dayton, and in the first year inDC. In New York, effects tend to be concentrated among fourth and fifth gradersafter 1 year, and only sixth graders after 2 years. In DC, after the first year, AfricanAmerican students in grades 6–8 who were offered a voucher scored significantlylower than members of the control group. By contrast, younger African Americanswho were offered a voucher scored somewhat higher than members of the controlgroup. While the estimates do appear to vary somewhat by grade level, at least inNew York during both years and DC after the first year, the pattern of grade-leveleffects are different in each city.20
Perhaps, though, the observed findings have less to do with race, and more to dowith how a student scores at baseline. Lower-performing students may have more togain by being offered a voucher than students whose initial scores are relatively high.Conversely, it may be that only higher-performing students have the talent needed tobenefit from a private school education. Such non-linearities were tested by estimatinga model that divided baseline academic performance into quartiles. Then interactionterms were created for each quartile and a voucher offer, along with the quartile fixedeffects. As with the grade-level effects discussed above, there is no consistent patternacross the three cities. In New York, gains are concentrated among those studentsfrom the lowest quartile at baseline. In Dayton, significant and positive effects arerestricted to students in the third quartile; and in DC, in the fourth quartile.21
Given the relatively small sample sizes in these subgroups, as well as the error builtinto the instruments used to measure student achievement, care must be taken not toparse the findings in ways the data simply do not support and then assign meaning toeach of the observed fluctuations. It may be that differences observed when breakingout the data by grade level or student ability (or any number of other characteristics)indicate important lessons about the varied effects of school vouchers on student testscores. In the future, larger voucher experiments may well generate more stableestimates of subpopulations among different ethnic groups. Given the lack ofsystematic variation across the three cities, however, the differences observed heremay just as likely reflect idiosyncratic aspects of individual programs, or simply noisein the data.
WHY DO AFRICAN AMERICANS APPEAR TO BENEFIT FROM VOUCHERS,BUT NOT WHITES OR LATINOS?
These are not the first private-school effects found to concentrate among AfricanAmericans. In an analysis of the National Longitudinal Survey of Youth, Derek Nealfinds that students who attend Catholic school are more likely to graduate from highschool and college, and subsequently enjoy higher earnings (Grogger and Neal, 2000;Neal, 1997). The effects, Neal notes, are largest among urban minorities. In separatestudies, David Figlio and Joseph Stone and William Evans and Robert Schwab generate
20 The year–2 effects of being offered a voucher in New York for African American students in grades 3–6were 1.9, –1.9, 0.9, and 7.9 respectively; only the sixth grade effect is statistically significant. The year 2effects in DC for students in grades 3–8 were 3.5, 3.8, 1.6, 3.9, 5.0, and 1.2, respectively; effects in grades 3and 7 are statistically significant. Year–2 effects in Dayton were 9.3, –1.4, 7.5, –1.2, 9.6, and –2.3, effects ingrades 3 and 7 were statistically significant. In New York, grade–level sample sizes after 2 years rangedfrom 104 (grade 6) to 153 (grade 4); in DC, from 76 (grade 8) to 142 (grade 3); and in Dayton, from 33(grade 8) to 55 (grade 4).21 The New York treatment estimates after 2 years for the four quartiles, from lowest to highest, are 3.6,1.9, –1.3, and –1.9; none are statistically significant. In Dayton, they are 4.4, 0.4, 9.3, and –4.2, with onlythe third quartile estimate being statistically significant. And in Washington, the estimates are 0.6, 2.5, 1.8,and 6.6, with only the fourth quartile estimate being statistically significant.

School Vouchers and Academic Performance / 209
consistent educational attainment findings for African Americans (Evans and Schwab,1993; Figlio and Stone, 1977). While overall effects remain highly contested, thosefor urban minorities appear robust.
To date, however, no one has offered a definitive explanation for why AfricanAmericans might benefit from attending private schools, while students of otherethnic groups may not. Speculations abound: It could be that African Americanscome from particularly poor public schools, or gain access to particularly goodprivate schools; there may be something about the composition of African Americanfamilies, or the neighborhoods they live in, which makes them particularly responsiveto vouchers; alternatively, private schools may be ill equipped to deal with thelanguage needs of many Latinos. Which explanation is correct, however, remainsan open question.
To address these questions, data are more appropriate from New York City, whichyielded roughly the same number of observations for African Americans and forLatinos. As poor, minority residents of inner cities, both groups presumably face acommon set of educational obstacles. Therefore, an intervention that successfullyimproves the test scores of one group might be expected to have a similar effect onthe other. To explore why vouchers do not have such consistent effects by race,information is drawn upon that was collected from parent and student surveys atbaseline and then after 1 and 2 years.
Language Needs
Private schools may be poorly equipped to deal with students who do not speak Englishas their primary language; public schools, meanwhile, often have well-establishedESL programs and specially trained personnel to deal with the particular culturaland linguistic needs of minority populations. It is possible that the gains associatedwith a private education may be transferred only to those students who can functionin all-English classrooms.
To test this hypothesis, the effects of offering a voucher for Latino studentswhose primary language (according to their parents) was English were comparedwith the effects of offering a voucher to those for whom English was a secondarylanguage. The results, if anything, run directly contrary to expectation (Table 9).The test-score effects of vouchers for Latinos who speak English as a secondarylanguage are slightly positive, while the effects of vouchers on Latinos who speakEnglish as their primary language are slightly negative. None of the effects arestatistically significant, nor are the differences in the effects for the twosubpopulations of Latinos.
These findings do not provide a basis on which to judge the ways in which publicand private schools deal with students with language needs. They do rule out language,however, as an explanation for why African Americans appear to benefit from vouchers,while Latinos do not.
Parental Perceptions of Public and Private Schools
Parental surveys were culled to see whether school vouchers had a noticeably differenteffect on the educational experiences of African Americans than Latinos. Four aspectsof school life stood out. In both years, vouchers had a smaller effect on the size of theprivate schools and classrooms attended by Latino students than they did on thoseattended by African Americans. Also, while vouchers had a large and positive effecton the school communication levels of African Americans, they had a relatively smalleffect on those of Latinos. And perhaps most strikingly, the magnitude of the effects

210 / School Vouchers and Academic Performance
of attending private school on school disruptions (fighting, truancy, racial conflict,etc.) varied dramatically for Latinos and African Americans. While vouchers noticeablydecreased the number of disruptions in African Americans’ schools, they had littleeffect for Latinos. These four factors, as such, are prime suspects for explaining thedifferential race effects of vouchers on test scores.
To examine their effect on student test scores, and their mediating effect ontreatment, school disruptions, school size, class size, and communications were addedto the right hand side of equation 1.22 To assess their effects on both African Americansand Latinos in a single regression, we ran a fully interacted model.23 If class size,school disruptions, school size, or school communications are the primary reasonswhy African Americans appear to benefit from vouchers, but Latinos do not, thenpresumably including them in the model should reduce, or eliminate, the observedeffect of treatment for African Americans.
The regression results are reported in Table 10. Columns one and three replicatethe estimated effects for Latinos and African Americans after 1 and 2 years withoutthe additional parental survey items. For Latinos after 1 year, the estimated effect ofa voucher offer is –1.0 percentile point; after 2 years, –0.6. For African Americans, theeffects are 4.6 and 3.3 percentile points for the 2 years.
In columns two and four, controls for parental reports on school disruptions, schoolcommunications, class size, and school size were added. For Latinos, schooldisruptions have a significant and negative direct effect on test scores in year one,while communication levels have a significant and positive effect. Class size, at leastfor Latinos, has a perverse relationship; students in larger classes tend to score higher
Table 9. Effect of a voucher offer on test scores in New York for Latinos who speak Englishas a primary and secondary language.
Note: OLS regressions performed with weighted data. Standard errors reported in parentheses. * sig-nificant at .10 level, 2-tailed test; ** .05 level; *** .01 level. All models control for baseline test scores andlottery indicators. In no year are the estimated effects for the two groups of Latinos statistically signifi-cantly different from one another.
English Primary
–1.85 [1.85]–1.12 [2.21]
(N)
402342
English Secondary
1.75 [2.10]2.05 [2.20]
(N)
307270
Year 1 EffectYear 2 Effect
22 As noted elsewhere, because we are using the New York City data, the model includes lottery indicatorsand their associated interaction terms. The following items were used to construct the added indices.School disruptions: “How serious are the following problems at this child’s school? Very serious, some-what serious, or not serious?” Kids destroying property; kids being late for schools; kids missing class;fighting; cheating; racial conflict; guns or other weapons; drugs or alcohol. Class size: “Approximatelyhow many students are in this child’s class?” School Size, “Approximately how large is the school this childattends?” School communication with parents: “Do the following practices exist in this child’s school?”Parents informed about student grades halfway through the grading period; parents notified when stu-dent sent to the office the first time for disruptive behavior; parents speak to classes about their jobs;parents participate in instruction; parent open-house or back-to-school night held at school; regular par-ent/teacher conferences held; parents receive notes about this student from this child’s teacher; parentsreceive a newsletter about what’s going on in this child’s school/classroom. The indices for school disrup-tions and school communications are the sum of the available responses to the individual items listedabove.23 Alternatively, we might have estimated a random-effects model that would allow us to compare theeffects for African Americans and Latinos attending the same school. Unfortunately, though, we simplyhave far too many schools, and not enough subjects, to support such an analysis.

School Vouchers and Academic Performance / 211
in both year 1 and year 2. For African Americans, meanwhile, only school disruptions(in year 2) had an appreciable independent effect on student test scores.24
More importantly, at least for the sake of this study, adding these controls did notchange the estimated treatment effect of school vouchers for either Latinos or African
Table 10: Effect of a voucher offer on test scores in New York: controlling for likely probableexplanatory variables.
Note: * significant at .10 level, 2-tailed test; ** .05 level; *** .01 level. Weighted least squares regressionsperformed. Impacts expressed in terms of national percentile rankings. All models control for baselinetest scores, lottery indicators, and their associated interactions. Only Latinos and African Americans areincluded in the models. Means imputed for missing data on covariates drawn from survey.
(1)
–0.97(1.29)
5.53***(1.86)
–23.41*(13.37)
—
—
—
—
—
—
—
—
20.041333
.48
Year 1 Year 2
Offered Voucher
Offered*African American
African American
School Disruptions
Communication
School Size
Class Size
Disruptions*Af. Am.
Communicate*Af. Am.
School Size*Af. Am.
Class Size*Af. Am.
Constant(N)Adjusted R2
(2)
–1.13(1.30)
5.75***(1.92)
–13.10(13.98)
–2.29***(0.63)
1.38*(0.75)
0.92(0.84)
1.25*(0.69)
2.02**(0.92)
–1.84*(0.98)
–1.63(1.19)
–0.84(0.98)
11.641333
.49
(3)
–0.60(1.57)
3.87*(2.19)
–10.68(11.02)
—
—
—
—
—
—
—
—
11.471109
.45
(4)
–0.69(1.58)
4.22*(2.25)
0.83(11.96)
–0.86(0.70)
–0.28(0.73)
1.04(0.88)
2.80***(0.76)
–1.08(1.02)
–0.46(0.99)
–0.62(1.21)
–2.90***(1.05)
3.281109
.46
24 While neither the main effect nor the interaction is statistically significant, the sum of the two effects issignificant. This is immediately apparent when running separate regressions for African Americans andLatinos, which produce the exact same point estimates as the fully interacted models presented here.

212 / School Vouchers and Academic Performance
Americans. Either separately or combined, these four measures do not explain whyAfrican Americans perform better on tests when given an opportunity to attend aprivate school—the estimated treatment effect remains as strong as ever.
Parental perceptions are not always as precise as desired, and so these schoolcharacteristics need not be ruled out prematurely as possible explanations for thedifferential race effects. Further, it is possible that the voucher effects derive not fromthese items considered separately or additively, but through some complex interactionamong them for which this model does not account.
It is also possible that private-school effects are due to instructional factors thatnone of the items in our parental surveys adequately measure. Recent research hasshown that teacher effectiveness can have a large effect on student test-scoreperformance (Rivkin, Hanushek, and Kain, 2000). The surveys, however, do not includeany measures of curriculum, teaching techniques, the expectations that teachers placeon their students, or teacher quality. Such factors might be the key to understandingwhy African Americans benefit from vouchers, but Latinos do not.
Perhaps it is the religious affiliation of private schools that explains the test-scoregains of African American students. Almost all of the private schools in these studieshad a religious connection, and those attending such schools became more religiouslyobservant than the control group remaining in public school (see Howell, Peterson,Wolf, and Campell 2000). Perhaps faith-based institutions do a better job of accumulatingthe social capital necessary to create a supportive environment for inner-city, single-parent families whose children are subjected daily to a countervailing peer-group culture.Further research is needed to determine whether or not religion constitutes a vitalcomponent of an effective urban school serving African American communities.
Finally, the observed effects may have little to do with the characteristics of publicand private schools that African Americans and Latinos attend. Instead, AfricanAmericans’ peer groups may differ significantly from those of Latinos, causing theformer to benefit from switching into private schools in ways the latter do not (Zimmerand Toma, 1999). If observed test-score gains are due to differences in the peers AfricanAmericans have in public and private schools, then programmatic effects of anexpanded voucher program may be less than those observed here.
As yet, why vouchers appear to improve only African Americans’ test scores remainsunknown. Sorting through the confluence of competing explanations extends wellbeyond the scope of this particular article. At a minimum, though, we know thatthere are no obvious answers. Neither class size by itself, nor school disruptions, norany other single measured school characteristic explains the source of the private-school advantage that African Americans alone demonstrate.
DISCUSSION
Policymakers would undoubtedly like definitive conclusions about school choice—whether vouchers “work” or not. The research reported here, however, is far toopreliminary, and the findings far too nuanced, for that. These evaluations examinevouchers’ effects only on the students who participate in the programs; very little canbe said about “systemic effects” that play such prominent roles in most theories ofmarket reforms. While African Americans who switched from public to private schoolsposted significant and positive test-score gains, no evidence indicates that any otherethnic group benefited from vouchers.
Results to date cannot speak to the longer term and larger scale effects of vouchers.Would similar effects be seen in a large-scale voucher program that reaches a broadercross-section of the urban poor? Do these effects on academic performance represent

School Vouchers and Academic Performance / 213
short-term gains, or will they grow the longer students are in private schools? Fornow, these remain open questions.
Scholars have devised numerous explanations for why vouchers, and theopportunities they afford, should improve student test scores: private schools have asense of institutional mission not found in their public counterparts; private schoolshave more rigorous curricula; or perhaps simply the act of choosing a school leads toimproved academic performance. An explanation for the findings, however, has agreater burden of proof: it must account for the fact that African Americans appearto benefit from vouchers, but members of other ethnic groups do not. Unless AfricanAmericans are particularly attuned to private schools’ sense of mission, or the act ofchoosing evokes a renewed commitment to education among African Americans butnot members of other ethnic groups, then these explanations are insufficient.
Several alternatives were examined, but ultimately, none adequately explained theseresults. Preliminary analyses suggest that language needs of Latinos, at least in NewYork, do not explain these differential race effects. And while class size, school size,school communication levels, and disruptions may contribute to the gains that onlyAfrican Americans appeared to reap, precisely how they did so, either jointly orindependently, remains uncertain.
APPENDIX
Not all parents who participated in the baseline study attended follow-up sessionsafter one or 2 years. After 1 year, response rates in the three cities ranged between 56and 82 percent; after 2 years, response rates dropped to between 49 and 66 percent.Because those families that showed up differed somewhat from those that did not,concerns about bias arise. To adjust for the bias associated with non-response, wegenerated weights for parents and students in the treatment and control groups in allthree cities after one and 2 years. Because those invited to participate in the follow-up studies had provided information about their family characteristics at baseline, itwas possible to calculate the probability that each participant in the baseline surveywould attend a follow-up session. To do so, we estimate a simple logit model:
Pr(yj = 1|X
i) = exp(X�) / 1 + exp(X�)
where yj indicates whether student j attended the year-one follow-up session and X is
a vector of covariates assembled from baseline surveys. Items include mother’seducation, employment status, marital status, and religious affiliation, the familysize, whether or not the family receives welfare benefits, an indicator variable forAfrican Americans, the student’s baseline math score, whether or not the student hasa learning disability, and whether the student has experienced disciplinary problems.25
To allow for as much flexibility as possible, separate logits were run for treatmentand control group members. Table A1 reports the results in D.C. after 2 years.26 Forthe most part, the family and student characteristics have the same effect for bothtreatment and control group members. Catholics were less likely to attend follow-upsessions, as were mothers who were employed full-time or were married. Largerfamilies were more likely to attend follow-up sessions, as were African Americansand students with disciplinary problems. Mother’s education, welfare, and math scoreshad small or insignificant effects for both treatment and control group members.
25 When baseline information was missing, means were imputed.26 Analogous results for other cities and other years are available upon request.

214 / School Vouchers and Academic Performance
The most striking difference between the two models, however, concerned studentswith learning disabilities. While learning disabled students in the treatment groupwere significantly more likely to attend follow-up sessions, such students in the controlgroup were significantly less likely to attend follow-up sessions.
The models generate a set of predicted values. These values represent the probabilitythat each individual, given her baseline characteristics, would attend the follow-upsession. The weights are simply the inverse of these predicted values, i.e.,
Wj = 1 / F(x�)
where F( ) is the model’s normal cumulative distribution function. The range of possiblevalues for W
j was then capped so that the highest score was four times the value of
the minimum weight. (This restriction affected only a handful of observations.) Theweights were then rescaled so that the sum of the weights equaled the sum of thetotal number of actual observations.
Table A1. Logit estimates used to construct weights for treatment and control groups inWashington, DC, in the second year of study.
Treatment Group
–0.51*(0.28)
0.17**(0.07)
–0.55**(0.24)
–0.58***(0.23)
0.03(0.06)
–0.30(0.29)
0.83***(0.21)
0.67**(0.32)
0.70**(0.35)
–0.00(0.00)
Family CharacteristicsCatholic
Family size
Employment Status
Married
Mother’s Education
Welfare
African American
Student CharacteristicsLearning Disabled
Disciplinary Problems
Math
Control Group
–0.80***(0.25)
0.17**(0.07)
–0.06(0.21)
–0.26(0.19)
–0.12**(0.05)
0.24(0.26)
0.62***(0.17)
–0.99**(0.41)
0.69**(0.34)
–0.01**(0.00)

School Vouchers and Academic Performance / 215
We thank the following foundations who have supported the research effort: AchelisFoundation, BASIC fund Foundation, Bodman Foundation, Lynde and Harry BradleyFoundation, William Donner Foundation, Thomas B. Fordham Foundation, Milton andRose D. Friedman Foundation, Gordon Gund Foundation, John M. Olin Foundation, Davidand Lucile Packard Foundation, Smith-Richardson Foundation, Spencer Foundation, andWalton Family Foundation. The methodology, analyses of data, reported findings, andinterpretations of findings are the sole responsibility of the authors of this book and arenot subject to the approval of any of the program operators or of any foundation providingsupport for this research. We gratefully acknowledge the advice and assistance of manyscholars, teachers, and administrators. For a full set of acknowledgements, see Howell et al.,2002.
WILLIAM G. HOWELL is Assistant Professor, Department of Political Science, at theUniversity of Wisconsin-Madison.
PATRICK J. WOLF is Assistant Professor at Georgetown University Public Policy Institute,Washington, DC.
DAVID E. CAMPBELL is a visiting fellow at Princeton University’s Woodrow WilsonSchool of Public and International Affairs.
PAUL E. PETERSON is Professor of Government and Director of the Program onEducation Policy and Governance at J.F.K. School of Government, Harvard University,Cambridge, MA.
REFERENCES
Angrist, J.D., Imbens, G.W., & Rubin, D.B. (1996). Identification of causal effects using instru-mental variables. Journal of the American Statistical Association, 91, 444–462.
Barnett, W.S. (1991). Benefits of compensatory preschool education. The Journal of HumanResources, 27(2), 279–312.
Bryk, A. (1998). Academic productivity of Chicago public elementary schools: A technical re-port sponsored by the consortium on Chicago school research.
Chubb, J., & Moe, T. (1990). Politics, markets, & America’s schools. Washington, DC: BrookingsInstitution Press.
Coleman, J., & Hoffer, T. (1987). Public and private high schools: The effects of communities.New York: Basic Books.
Note: The dependent variable is coded 1 if the student attended the year-2 follow-up session in Washing-ton, and 0 otherwise. Treatment group consists of all students who were offered a voucher and partici-pated in the baseline study; the control group consists of all students who were not offered vouchers.Standard errors reported in parentheses. * significant at 0.10 level, two-tailed test; ** significant at 0.05level; *** significant at 0.01 level.
Table A1. continued
ConstantPseudo R2
Log likelihood(N)
–1.10**.07
–353.11580
Treatment Group Control Group
–0.60.07
–479.83866

216 / School Vouchers and Academic Performance
Coleman, J.S., Hoffer,, T.B., & Kilgore, S. (1982). High school achievement: Public, Catholic,and private schools compared. New York: Basic Books.
Evans, W.N., & Schwab, R.M. (1993). Who benefits from private education? Evidence fromquantile regressions. College Park, MD: Department of Economics, University of Maryland.
Figlio, D, & Stone, J. (1977). School choice and student performance: Are private schoolsreally better? Madison, WI: University of Wisconsin Institute for Research on Poverty
Garet, M., Chan, T., Isaacs, J., & Sherman, J. (1997). The determinants of per-pupil expendi-tures in private elementary and secondary schools: An exploratory analysis. U.S Departmentof Education, National Center for Education Statistics.
Goldberger, A.S., & Cain, G.G. (1982). The causal analysis of cognitive outcomes in the Coleman,Hoffer, and Kilgore report. Sociology of Education 55, 103–122.
Greeley, A.M. (1982). Catholic high schools and minority students. New Brunswick, NJ: Trans-action.
Greene, J.P., Peterson, P.E., & Du, J. (1997). Effectiveness of school choice: The MilwaukeeExperiment, occasional paper (March). Program on Education Policy and Governance,Harvard University.
Greene, J.P., Peterson, P.E., & Du, J. (1998). School choice in Milwaukee: A randomized ex-periment. In P.E. Peterson & B.C. Hassel, (Eds.) Learning from school choice, (pp. 335–356).Washington, DC: Brookings Institution Press.
Grogger, J., & Neal, D. (2000). Further evidence on the effects of catholic secondary schooling.Brookings, Wharton Papers on Urban Affairs.
Hoffer, T., Greeley, A., & Coleman, J. (1985, April). Achievement growth in public and Catholicschools, Sociology of Education, 58, 74–97.
Honaker, J., Joseph, A., King, G., Scheve, K., & Singh, N. (2000). Amelia: A program for miss-ing data (Windows version) Cambridge, MA: Harvard University.
Howell, W., & Peterson, P. (2000). School choice in Dayton, Ohio: An evaluation after 1 year.Paper prepared for the conference on charters, vouchers and public education sponsored bythe program on education policy and governance, Kennedy School of Government, HarvardUniversity.
Howell, W., Peterson, P., Wolf, P., & Campbell, D. (2002). The education gap: Vouchers andurban schools. Washington, DC: Brookings Institution Press.
Jencks, C. (1985, April). How much do high school students learn? Sociology of Education 5,128–135.
Katz, L.F., Kling, J.R., & Liebman, J.B. (2001, May). Moving to opportunity in Boston: Earlyresults of a randomized mobility experiment. Quarterly Journal of Economics, 116, 607–654.
King, G., Honaker, J., Joseph, A., & Scheve, K. (2001). Analyzing incomplete political sciencedata: An alternative algorithm for multiple imputation. American Political Science Review,95(1), 46–69.
Krueger, A.B. (1999, May). Experimental estimates of education production functions. Quar-terly Journal of Economics, 114, 497–533.
Levin, H. (1998). Educational vouchers: Effectiveness, choice, and costs. Journal of PolicyAnalysis & Management, 17(3), 373–392.
Ludwig, J., Duncan, G.J., & Hirschfield, P. (2001, May). Urban poverty and juvenile crime:Evidence from a randomized housing-mobility experiment. Quarterly Journal of Econom-ics, 116, 655–679.
Ludwig, J., Ladd, H.F., & Duncan, G.J. (2001). Urban poverty and educational outcomes.Brookings-Wharton Papers on Urban Affairs 2, 147–188.
Metcalf, K.K., Boone, W.J., Stage, F.K., Chilton, T.L., Muller, P., & Tait, P. (1998). A compara-
School Vouchers and Academic Performance / 217
tive evaluation of the Cleveland scholarship and tutoring grant program. School of Educa-tion, Smith Research Center, Indiana University.
Moe, T. (1995). Private vouchers. Stanford, CA: Hoover Institution Press.
Neal, D. (1997). The effects of Catholic secondary schooling on educational achievement. Jour-nal of Labor Economics, 15(1), 98–123.
Neal, D. (1998). What have we learned about the benefits of private schooling? EconomicPolicy Review, 4(1), 79–86.
Peterson, P., Myers, D., & Howell, W. (1999). An evaluation of the New York City school choicescholarships program: The first year. Program on Education Policy & Governance, HarvardUniversity.
Peterson, P., Myers, D., Howell, W., & Mayer, D. (1999). The effects of school choice in NewYork City. In earning and learning: How schools matter. Washington, DC: Brookings Institu-tion Press.
Rivkin, S., Hanushek, E.A., & Kain, J.F. (2000). Teachers, schools and academic achievement.April (manuscript).
Rouse, C. (1998). Private school vouchers and students achievement: An evaluation of theMilwaukee parental choice program. Quarterly Journal of Economics, 113, 555–602.
Wilms, D.J. (1985). Catholic school effects on academic achievement: New evidence from theHigh School and Beyond follow-up study. Sociology of Education 58, 98–114.
Witte, J.F. (1996). School choice and student performance. In H.F. Ladd, (Ed.), Holding schoolsaccountable: Performance-based reform in education. Washington, DC: Brookings.
Witte, J.F. (1997). Achievement effects of the Milwaukee voucher program. Paper presented atthe 1997 Annual Meeting of the American Economic Association.
Witte, J.F. (1999). The market approach to education. Princeton, NJ: Princeton University Press.
Wolf, P., Howell, W., & Peterson, P. (2000). School choice in Washington, DC: An evaluationafter 1 year. Paper prepared for the Conference on Charters, Vouchers and Public Educationsponsored by the Program on Education Policy and Governance, Kennedy School of Gov-ernment, Harvard University.
Zimmer, R.W., & Toma, E. (1999). Peer effects in private and public schools across countries.Journal of Policy Analysis and Management, 19(1), 75–92.