seasonal transmission model of dengue virus infection in ...textroad.com/pdf/jbasr/j. basic. appl....
TRANSCRIPT
J. Basic. Appl. Sci. Res., 1(10)1372-1379, 2011
© 2011, TextRoad Publication
ISSN 2090-424X Journal of Basic and Applied
Scientific Research www.textroad.com
*Corresponding Author: Puntani Pongsumpun, Department of Mathematics, Faculty of Science, King Mongkut’s Institute of Technology Ladkrabang, Chalongkrung road, Ladkrabang ,Bangkok 10520, Thailand.
Seasonal Transmission Model of Dengue Virus Infection in Thailand
Puntani Pongsumpun*
Department of Mathematics, Faculty of Science, King Mongkut’s Institute of Technology Ladkrabang, Chalongkrung road, Ladkrabang ,Bangkok 10520, Thailand
ABSTRACT
The transmission of dengue virus is occurred by biting of the infected Aedes mosquitoes. Dengue virus is separated into 4 serotypes; DEN-1, DEN-2, DEN-3 and DEN-4. The characteristic of dengue patient is divided into 3 characteristic types; Dengue fever (DF), Dengue hemorrhagic fever (DHF) and Dengue shock syndrome (DSS). The symptom of each dengue patient is depending on the type of dengue disease that each person is infected. In this research, we studied the monthly distribution of dengue disease in the highest epidemic year between 2001 and 2009 and then we found the corresponding fitted curves. The basic reproductive number by season of this disease was analyzed to point the way for decreasing the outbreak of this disease. KEY WORDS: Dengue, transmission model, the basic reproductive number, season, local stability
INTRODUCTION
Dengue fever, also called dengue, is a potentially serious disease caused by a virus. There are four serotypes of dengue virus: DEN-1, DEN-2, DEN-3 and DEN-4. Dengue is the most common mosquito-borne viral disease. Recently, this disease has become a major international public health concern. Globally, 2.5 billion people live in areas where dengue virus can be transmitted. Dengue virus is transmitted between the human by biting of an infected Aedes mosquito [1,2,3]. When the mosquitoes bite, they will spread the disease to human. The incubation period of dengue virus is about 2-7 days. If the mosquito bites the human, they will get the virus then spread it to the others. Usually, the mosquitoes bite the susceptible people during the day time. Dengue fever is the most common disease in urban areas. The outbreaks commonly occur during the rainy season when the mosquitoes heavily breed in standing water. The dengue fever cases are increasing worldwide. The complications of the disease are leading cause of serious illness and most death in children. The incidence of dengue disease is found on the worldwide and in some areas of Asia. Mosquitoes pick up a dengue virus when they bite a human who is already infected with the virus. The mosquito then carries it in its own blood and spreads the disease when it bites the other human. After a dengue virus enters the human bloodstream, it spreads throughout the body. Symptoms appear about eight to ten days after a bite from an infected mosquito. Symptoms are flu-like illness and can include high fever, nausea, vomiting, body aches, and headache [4,5,6,7]. The infection in humans, first infection produces life-long immunity to the infected serotype but only temporary and partial protection against the other three serotypes, and secondary or sequentially infections are possible after a short time. Transmission of dengue virus from an infected human to a mosquito is determined by the magnitude and duration of viremia in the human host. Person with high viremia provides a higher infectious dose of virus for feeding mosquitoes. This normally leads to a greater percentage of feeding mosquitoes becoming infected. Some mosquito vectors may however become infectious when there is only a very low level of virus in the blood [8]. In this paper, we study the monthly distribution of dengue disease in Thailand in year 2001 (which give the highest peak during 1997-2009) by finding the analytical approximated equations. The dynamical equations for the transmission of dengue disease by season are analyzed by using the standard dynamical modeling method.
THE ANALYTICAL APPROXIMATED EQUATIONS
The region of Thailand is separated into 5 regions, Northern Thailand, Northeastern Thailand, Eastern Thailand , Central Thailand, and Southern Thailand. From the data of dengue cases in Thailand [9]. We found that year 2001 was the year which give the highest dengue cases number during year 1997-2009. Nakorn Sawan, Buriram, Chonburi, Prachinburi and Songkla were the provinces which give the highest cases number in Northern Thailand, Northeastern Thailand, Eastern Thailand, Central Thailand and Southern Thailand, respectively. We
1372

Pongsumpun, 2011
denote ix as the month and )f(x i as the number of dengue cases. Here, we use the Polynomial curve fitting to
find the best analytical approximated equations. Consider the general form of Polynomial order j
ki
j
1kk
jij
3i3
2i2i1i xbaxb...xbxbxbaxf
(1)
where j21 b,...,b,ba, are any coefficients; i = 1,2,3,…, n and n is the total data sets.Error-Least squares
approach is the method to find the general form of the error in least square approach. We define 2n
1ii )(derr
(2)
where )f(xyd iii ; i = 1,2,3,…,n; iy is the real data of dengue patients in each month and )f(x i is the approximated number of dengue patients from the fitting curve. Thus, we can write (2) as
2n
1iii ))f(x(yerr
(3)
We substitute (1) into (3), then we obtain:
2n
1i
ki
j
1kki ))xb(a(yerr
(4)
To have the minimum error, we differentiate (4) with respect to each coefficient and set them equal to 0, then we obtain
0xbay2a
err n
1i
j
1k
kiki
0xxbay2berr
in
1i
j
1k
kiki
1
0xxbay2berr 2
in
1i
j
1k
kiki
2
(5)
0xxbay2berr j
in
1i
j
1k
kiki
j
From the above equations, we can write in the matrix form as follows: BAX
where
n
1i
jji
n
1i
2ji
n
1i
1ji
n
1i
ji
n
1i
2ji
n
1i
4i
n
1i
3i
n
1i
2i
n
1i
1ji
n
1i
3i
n
1i
2i
n
1ii
n
1i
ji
n
1i
2i
n
1ii
xxxx:
xxxx
xxxx
xxxn
A
,
n
1ii
ji
n
1ii
2i
n
1iii
n
1ii
)y(x
)y(x
)y(x
y
B
and
j
2
1
b
bba
X
.
(6)
1373
J. Basic. Appl. Sci. Res., 1(10)1372-1379, 2011
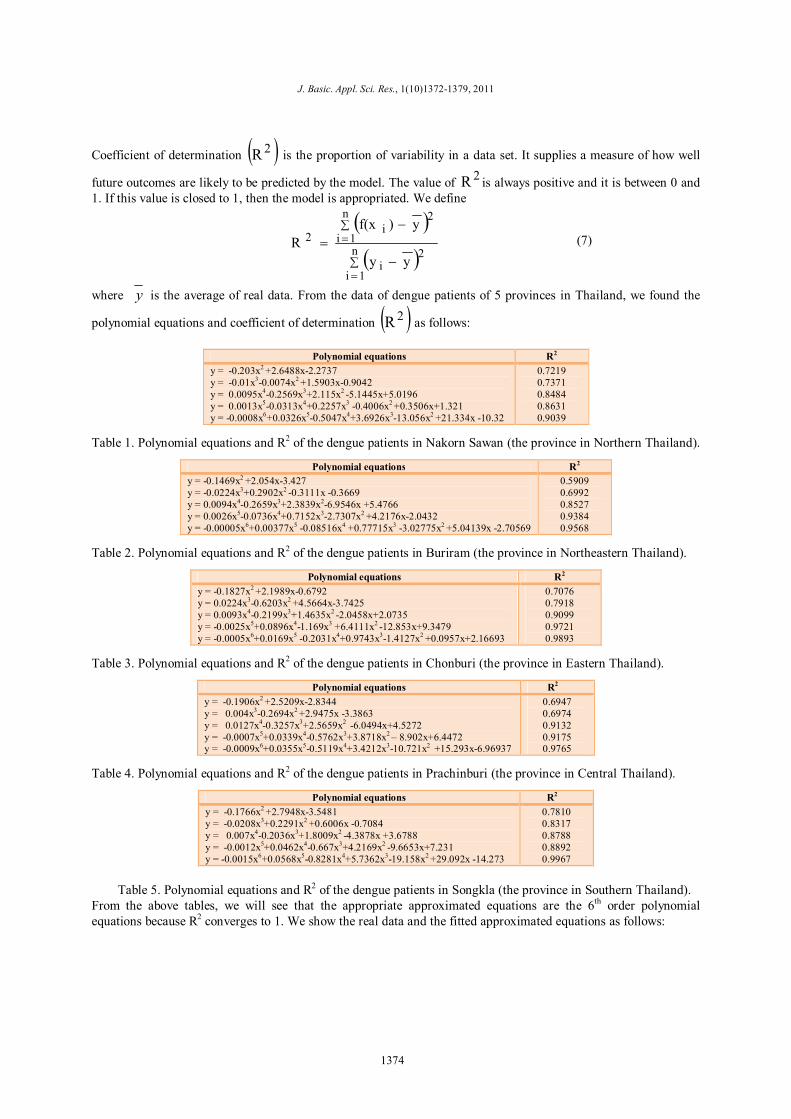
Coefficient of determination 2R is the proportion of variability in a data set. It supplies a measure of how well
future outcomes are likely to be predicted by the model. The value of 2R is always positive and it is between 0 and 1. If this value is closed to 1, then the model is appropriated. We define
n
1i
2i
n
1i
2i
2
yy
y)f(xR (7)
where y is the average of real data. From the data of dengue patients of 5 provinces in Thailand, we found the
polynomial equations and coefficient of determination 2R as follows:
Polynomial equations R2
y = -0.203x2 +2.6488x-2.2737 y = -0.01x3-0.0074x2 +1.5903x-0.9042 y = 0.0095x4-0.2569x3+2.115x2 -5.1445x+5.0196 y = 0.0013x5-0.0313x4+0.2257x3 -0.4006x2 +0.3506x+1.321 y = -0.0008x6+0.0326x5-0.5047x4+3.6926x3-13.056x2 +21.334x -10.32
0.7219 0.7371 0.8484 0.8631 0.9039
Table 1. Polynomial equations and R2 of the dengue patients in Nakorn Sawan (the province in Northern Thailand).
Polynomial equations R2
y = -0.1469x2 +2.054x-3.427 y = -0.0224x3+0.2902x2 -0.3111x -0.3669 y = 0.0094x4-0.2659x3+2.3839x2-6.9546x +5.4766
y = 0.0026x5-0.0736x4+0.7152x3-2.7307x2 +4.2176x-2.0432 y = -0.00005x6+0.00377x5 -0.08516x4 +0.77715x3 -3.02775x2 +5.04139x -2.70569
0.5909 0.6992 0.8527 0.9384 0.9568
Table 2. Polynomial equations and R2 of the dengue patients in Buriram (the province in Northeastern Thailand).
Polynomial equations R2
y = -0.1827x2 +2.1989x-0.6792 y = 0.0224x3-0.6203x2 +4.5664x-3.7425 y = 0.0093x4-0.2199x3+1.4635x2 -2.0458x+2.0735 y = -0.0025x5+0.0896x4-1.169x3 +6.4111x2 -12.853x+9.3479 y = -0.0005x6+0.0169x5 -0.2031x4+0.9743x3-1.4127x2 +0.0957x+2.16693
0.7076 0.7918 0.9099 0.9721 0.9893
Table 3. Polynomial equations and R2 of the dengue patients in Chonburi (the province in Eastern Thailand).
Polynomial equations R2
y = -0.1906x2 +2.5209x-2.8344 y = 0.004x3-0.2694x2 +2.9475x -3.3863 y = 0.0127x4-0.3257x3+2.5659x2 -6.0494x+4.5272 y = -0.0007x5+0.0339x4-0.5762x3+3.8718x2 – 8.902x+6.4472 y = -0.0009x6+0.0355x5-0.5119x4+3.4212x3-10.721x2 +15.293x-6.96937
0.6947 0.6974 0.9132 0.9175 0.9765
Table 4. Polynomial equations and R2 of the dengue patients in Prachinburi (the province in Central Thailand).
Polynomial equations R2
y = -0.1766x2 +2.7948x-3.5481 y = -0.0208x3+0.2291x2 +0.6006x -0.7084 y = 0.007x4-0.2036x3+1.8009x2 -4.3878x +3.6788
y = -0.0012x5+0.0462x4-0.667x3+4.2169x2 -9.6653x+7.231 y = -0.0015x6+0.0568x5-0.8281x4+5.7362x3-19.158x2 +29.092x -14.273
0.7810 0.8317 0.8788 0.8892 0.9967
Table 5. Polynomial equations and R2 of the dengue patients in Songkla (the province in Southern Thailand).
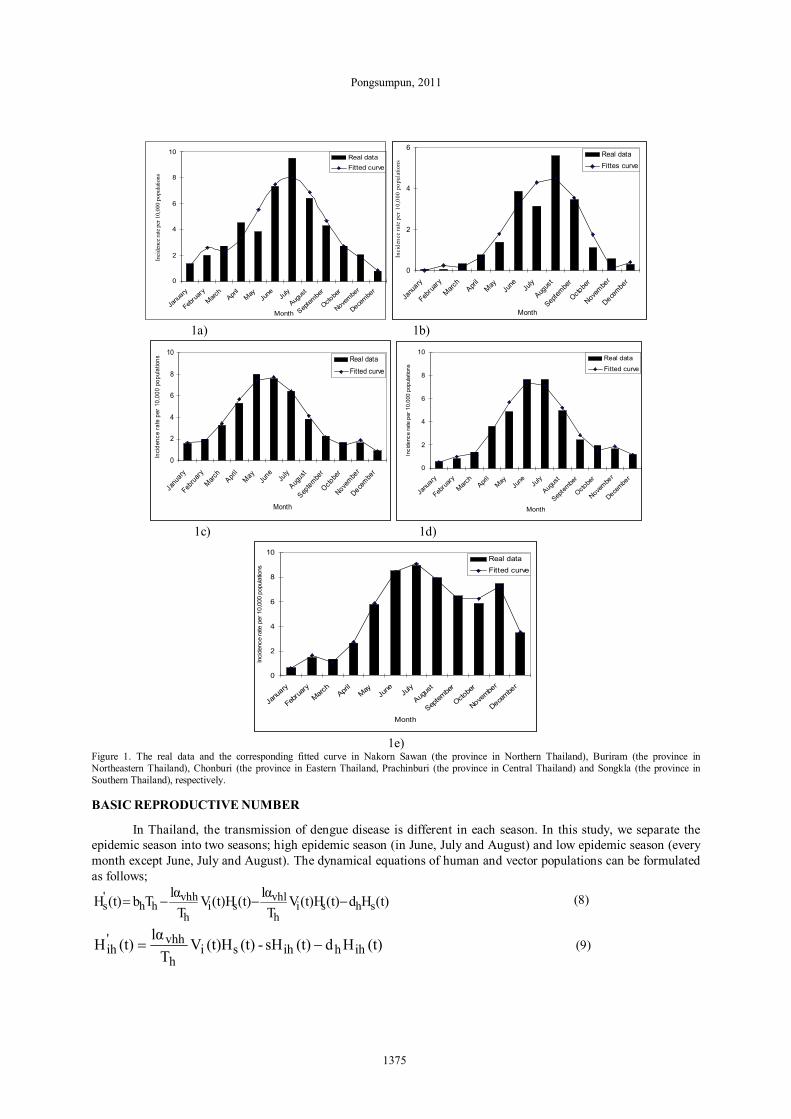
From the above tables, we will see that the appropriate approximated equations are the 6th order polynomial equations because R2 converges to 1. We show the real data and the fitted approximated equations as follows:
1374
Pongsumpun, 2011
0
2
4
6
8
10
Janu
ary
Febru
ary
March
April
MayJu
ne July
Augus
t
Septem
ber
Octobe
r
Novembe
r
Decembe
r
Month
Inci
denc
e rat
e per
10,
000
popu
latio
nsReal dataFitted curve
0
2
4
6
Janu
aryFeb
ruary
March
April
MayJu
ne July
Augus
tSep
tembe
rOcto
ber
Novembe
rDece
mber
Month
Inci
denc
e ra
te p
er 1
0,00
0 po
pula
tions
Real dataFittes curve
1a) 1b)
0
2
4
6
8
10
Janu
aryFeb
ruary
March
April
May June July
Augus
tSep
tembe
rOcto
ber
Novembe
rDece
mber
Month
Inci
denc
e ra
te p
er 1
0,00
0 po
pula
tions Real data
Fitted curve
0
2
4
6
8
10
Janu
ary
Febru
aryMarc
hApri
lMay
June Ju
ly
Augus
t
Septem
ber
Octobe
r
Novembe
r
Decembe
r
Month
Inci
denc
e ra
te p
er 1
0,00
0 po
pula
tions
Real dataFitted curve
1c) 1d)
0
2
4
6
8
10
Janu
ary
Februa
ryMarc
hApri
lMay
June Ju
ly
Augus
t
Septem
ber
Octobe
r
Novembe
r
Decembe
r
Month
Inci
denc
e ra
te p
er 1
0,00
0 po
pula
tions
Real dataFitted curve
1e)
Figure 1. The real data and the corresponding fitted curve in Nakorn Sawan (the province in Northern Thailand), Buriram (the province in Northeastern Thailand), Chonburi (the province in Eastern Thailand, Prachinburi (the province in Central Thailand) and Songkla (the province in Southern Thailand), respectively.
BASIC REPRODUCTIVE NUMBER
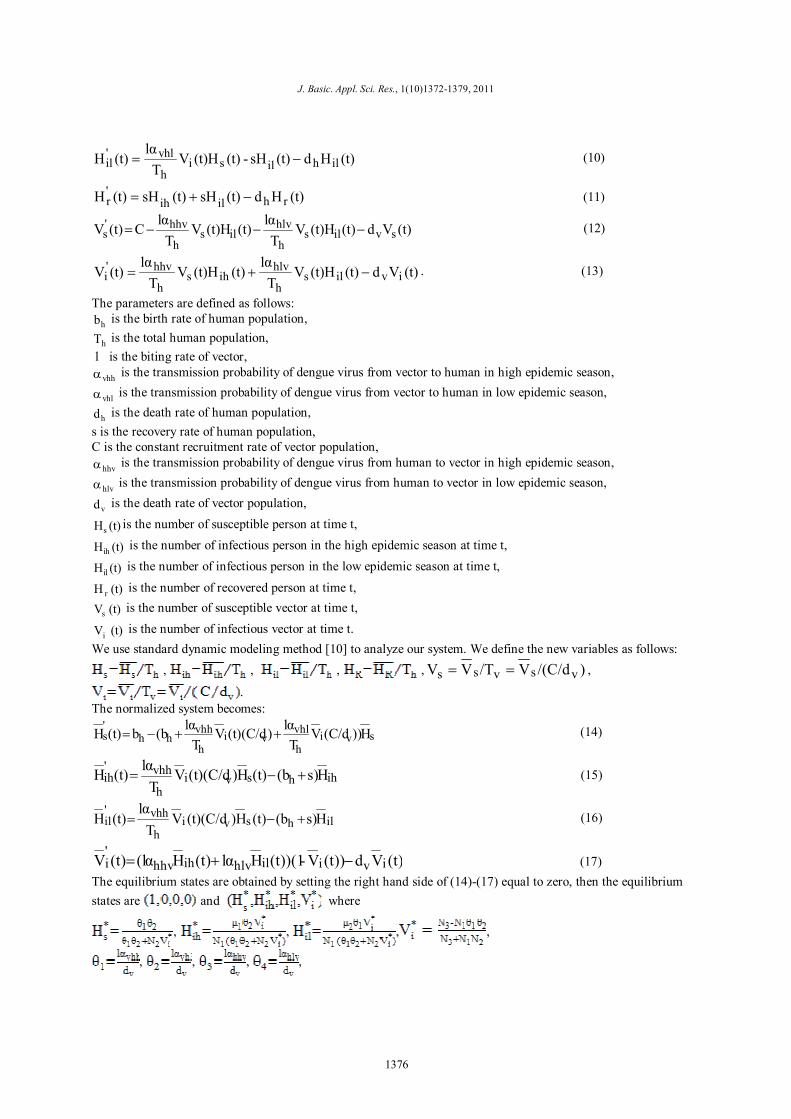
In Thailand, the transmission of dengue disease is different in each season. In this study, we separate the epidemic season into two seasons; high epidemic season (in June, July and August) and low epidemic season (every month except June, July and August). The dynamical equations of human and vector populations can be formulated as follows;
(t)Hd(t)(t)HVT
lα(t)(t)HVT
lαTb(t)H shsih
vhlsi
h
vhhhh
's (8)
(t)Hd(t)sH-(t)(t)HVT
lα(t)H ihhihsi
h
vhh'ih (9)
1375
J. Basic. Appl. Sci. Res., 1(10)1372-1379, 2011
(t)Hd(t)sH-(t)(t)HVT
lα(t)H ilhilsi
h
vhl'il (10)
(t)Hd(t)sH(t)sH(t)H rhilih'r (11)
(t)Vd(t)(t)HVT
lα(t)(t)HV
Tlα
C(t)V svilsh
hlvils
h
hhv's (12)
(t)Vd(t)(t)HVT
lα(t)(t)HV
Tlα
(t)V ivilsh
hlvihs
h
hhv'i . (13)
The parameters are defined as follows: hb is the birth rate of human population,
hT is the total human population, l is the biting rate of vector,
vhh is the transmission probability of dengue virus from vector to human in high epidemic season,
vhl is the transmission probability of dengue virus from vector to human in low epidemic season,
hd is the death rate of human population, s is the recovery rate of human population, C is the constant recruitment rate of vector population,
hhv is the transmission probability of dengue virus from human to vector in high epidemic season,
hlv is the transmission probability of dengue virus from human to vector in low epidemic season,
vd is the death rate of vector population,
(t)Hs is the number of susceptible person at time t,
(t)Hih is the number of infectious person in the high epidemic season at time t,
(t)Hil is the number of infectious person in the low epidemic season at time t,
(t)H r is the number of recovered person at time t, (t)Vs is the number of susceptible vector at time t,
(t)Vi is the number of infectious vector at time t. We use standard dynamic modeling method [10] to analyze our system. We define the new variables as follows:
, , , , )/(C/dV/TVV vsvss ,
. The normalized system becomes:
svih
vhlvi
h
vhhhh
's H))(C/dV
Tlα)(t)(C/dV
Tlα(bb(t)H (14)
ihhsvih
vhh'ih Hs)(b(t)H)(t)(C/dV
Tlα(t)H (15)
ilhsvih
vhh'il Hs)(b(t)H)(t)(C/dV
Tlα
(t)H (16)
(t)Vd(t))V-(t))(1Hlα(t)H(lα(t)V iviilhlvihhhv'i (17)
The equilibrium states are obtained by setting the right hand side of (14)-(17) equal to zero, then the equilibrium states are and where
, , , ,
, , , ,
1376
Pongsumpun, 2011
, , , and .
The local asymptotical stable is determined from the signs of eigenvalues for each equilibrium state. The eigenvalues are derived from solving the characteristic equation
. If the signs of all eigenvalues are negative, then the equilibrium state is local asymptotical stable. From our analysis, we found that the equilibrium state is local stable for . The equilibrium state
is local stable for ;
s)(dTdCTααl
s)(dTdCTlR
h2h
2v
hhlvvhl2
h2h
2v
hhhvvhh2
0
.
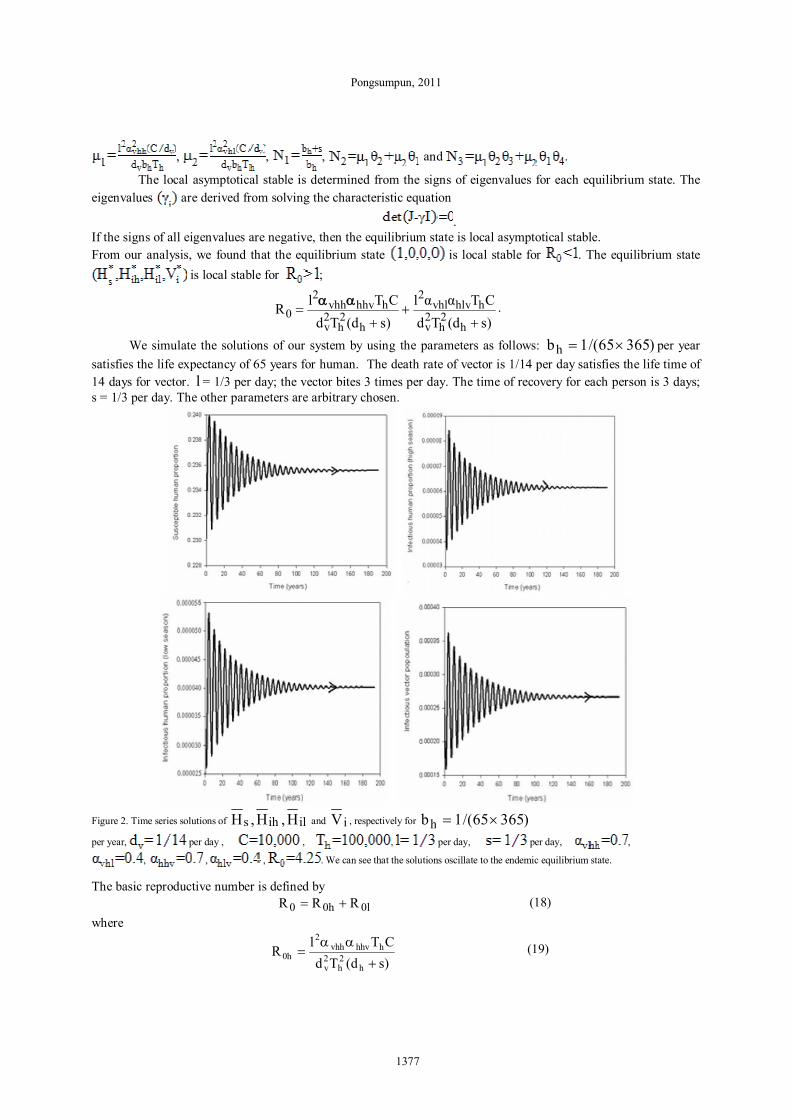
We simulate the solutions of our system by using the parameters as follows: )36565/(1bh per year satisfies the life expectancy of 65 years for human. The death rate of vector is 1/14 per day satisfies the life time of 14 days for vector. l = 1/3 per day; the vector bites 3 times per day. The time of recovery for each person is 3 days; s = 1/3 per day. The other parameters are arbitrary chosen.
Figure 2. Time series solutions of ilihs H,H,H and iV , respectively for )36565/(1bh
per year, per day , , , per day, per day, ,
, , , . We can see that the solutions oscillate to the endemic equilibrium state. The basic reproductive number is defined by 0l0h0 RRR (18) where
s)(dTdCTl
Rh
2h
2v
hhhvvhh2
0h
(19)
1377
J. Basic. Appl. Sci. Res., 1(10)1372-1379, 2011
and s)(dTd
CTααlR
h2h
2v
hhlvvhl2
0l
(20)
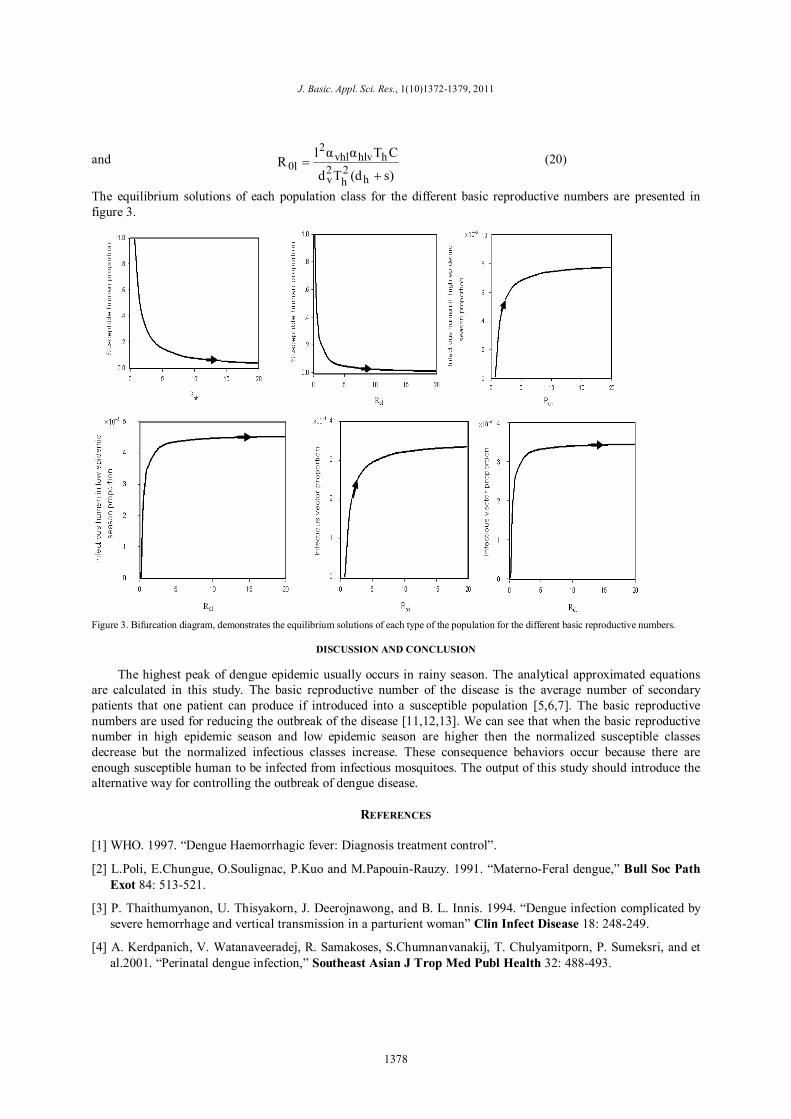
The equilibrium solutions of each population class for the different basic reproductive numbers are presented in figure 3.
Figure 3. Bifurcation diagram, demonstrates the equilibrium solutions of each type of the population for the different basic reproductive numbers.
DISCUSSION AND CONCLUSION The highest peak of dengue epidemic usually occurs in rainy season. The analytical approximated equations are calculated in this study. The basic reproductive number of the disease is the average number of secondary patients that one patient can produce if introduced into a susceptible population [5,6,7]. The basic reproductive numbers are used for reducing the outbreak of the disease [11,12,13]. We can see that when the basic reproductive number in high epidemic season and low epidemic season are higher then the normalized susceptible classes decrease but the normalized infectious classes increase. These consequence behaviors occur because there are enough susceptible human to be infected from infectious mosquitoes. The output of this study should introduce the alternative way for controlling the outbreak of dengue disease.
REFERENCES [1] WHO. 1997. “Dengue Haemorrhagic fever: Diagnosis treatment control”.
[2] L.Poli, E.Chungue, O.Soulignac, P.Kuo and M.Papouin-Rauzy. 1991. “Materno-Feral dengue,” Bull Soc Path Exot 84: 513-521.
[3] P. Thaithumyanon, U. Thisyakorn, J. Deerojnawong, and B. L. Innis. 1994. “Dengue infection complicated by severe hemorrhage and vertical transmission in a parturient woman” Clin Infect Disease 18: 248-249.
[4] A. Kerdpanich, V. Watanaveeradej, R. Samakoses, S.Chumnanvanakij, T. Chulyamitporn, P. Sumeksri, and et al.2001. “Perinatal dengue infection,” Southeast Asian J Trop Med Publ Health 32: 488-493.
1378
Pongsumpun, 2011
[5] L. Kabilan, S. Balasubramanian, S. M. Keshava, V. Thenmozhi, G.Sehar, S. C. Tewari , and et al. 2003. “Dengue disease spectrum among infants in the 2001 dengue epidemic in Chennai, Tamil Nadu, India,” J.clin Microbiol 41: 3919-3921.
[6] N. Malhotra, C. Chanana, and S. Kumar. 2006. “Dengue infection in pregnancy,” Int J Gynecol Obstet 94: 131-132.
[7]V. Wiwanitkit. 2006. “Dengue haemorrhagic fever in pregnancy:appraisal on Thai cases,” J Vector Borne Disease 43: 203-205.
[8] Prevention and Control of Dengue and Dengue Haemorrhagic Fever : Comprehensive Guidelines, WHO Regional Publication, SEARO, No.29.
[9] Annual Epidemiological Surveillance Report, 1997-2009,Division of Epidemiology, Ministry of Public Health, Royal Thai Government.
[10] R.M.Anderson and R.M.May. 1991. “Infectious Disease of Humans, Dynamics and Control.Oxford U.Press”, Oxford.
[11] A.Kammanee, N.Kanyamee and I.M.Tang. 2001.“Basic Reproduction Number for the Transmission of Plasmodium Vivax Malaria,” Southeast Asian J Trop Med and Pub Health 32: 702-706.
[12] L.Esteva and C.Vargas. 1998. “Analysis of a dengue disease transmission model,” Math Bio Sci 150: 131-151.
[13] P.Pongsumpun and I.M.Tang. 2009. “The Transmission Model of P. falciparum and P. Vivax Malaria between
Thai and Burmese,” International J of Math Models and Methods in Applied Sciences 3: 19-26.
1379