seminar jsd - ii
TRANSCRIPT
PhysisorptionPhysisorptionMethods and TechniquesMethods and Techniques
QuantachromeI N S T R U M E N T S
Pore Size by Gas
Sorption
Micro and Mesopore Size Determination by Gas Sorption
First: Quantitative estimation of micropore volume and area…
T-plot and DR methods.
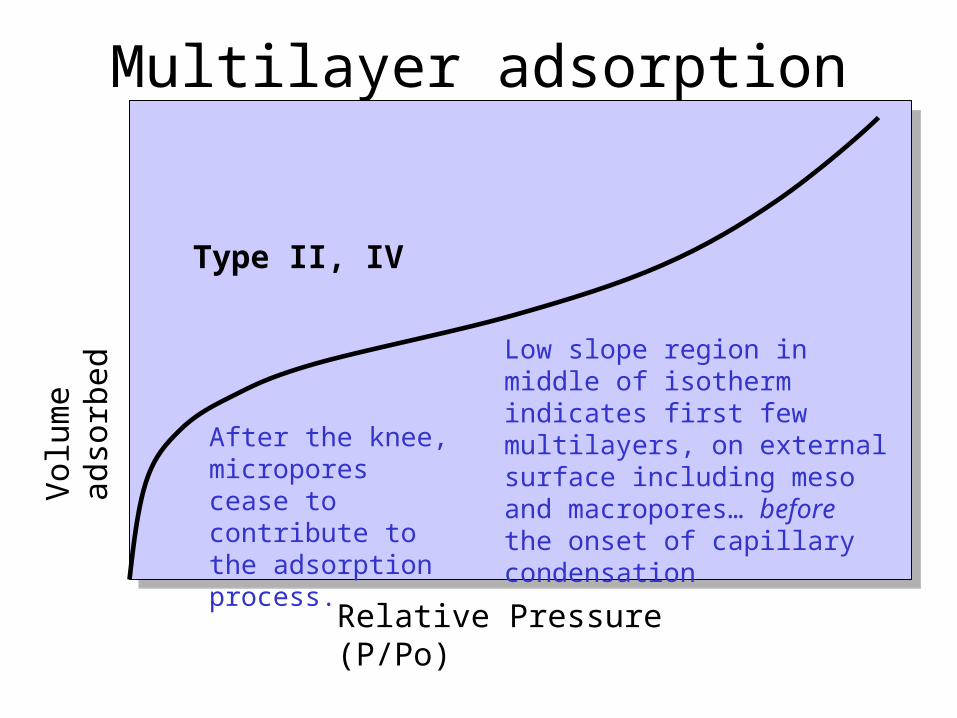
Multilayer adsorption
Type II, IV
Relative Pressure (P/Po)
Vol
ume
adso
rbed
After the knee, micropores cease to contribute to the adsorption process.
Low slope region in middle of isotherm indicates first few multilayers, on external surface including meso and macropores… before the onset of capillary condensation
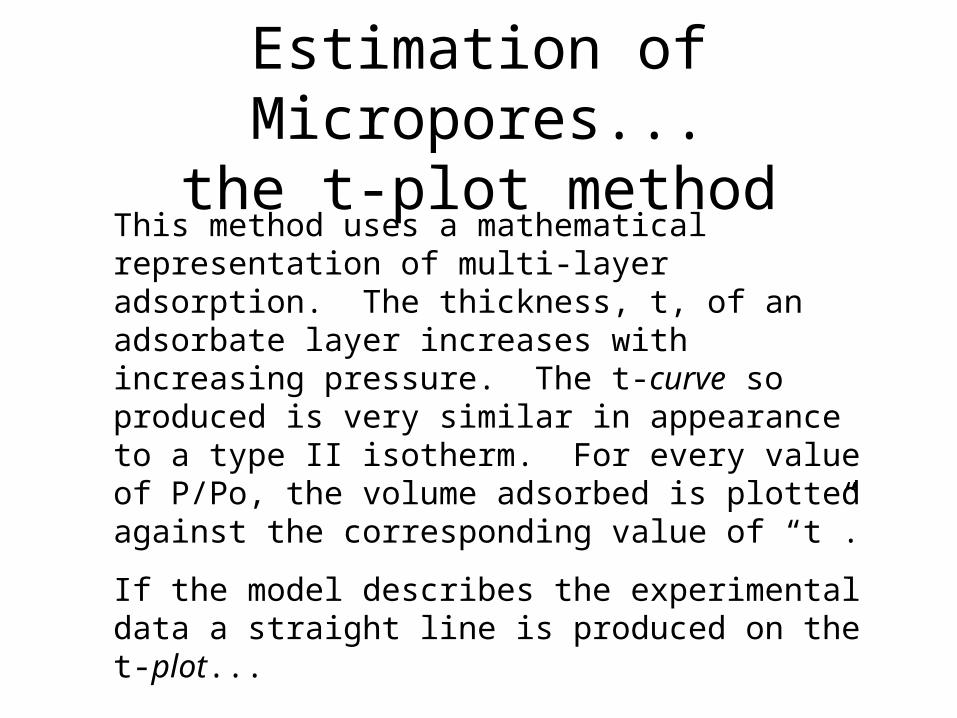
Estimation of Micropores...the t-plot method
This method uses a mathematical representation of multi-layer adsorption. The thickness, t, of an adsorbate layer increases with increasing pressure. The t-curve so produced is very similar in appearance to a type II isotherm. For every value of P/Po, the volume adsorbed is plotted against the corresponding value of “t”.
If the model describes the experimental data a straight line is produced on the t-plot...
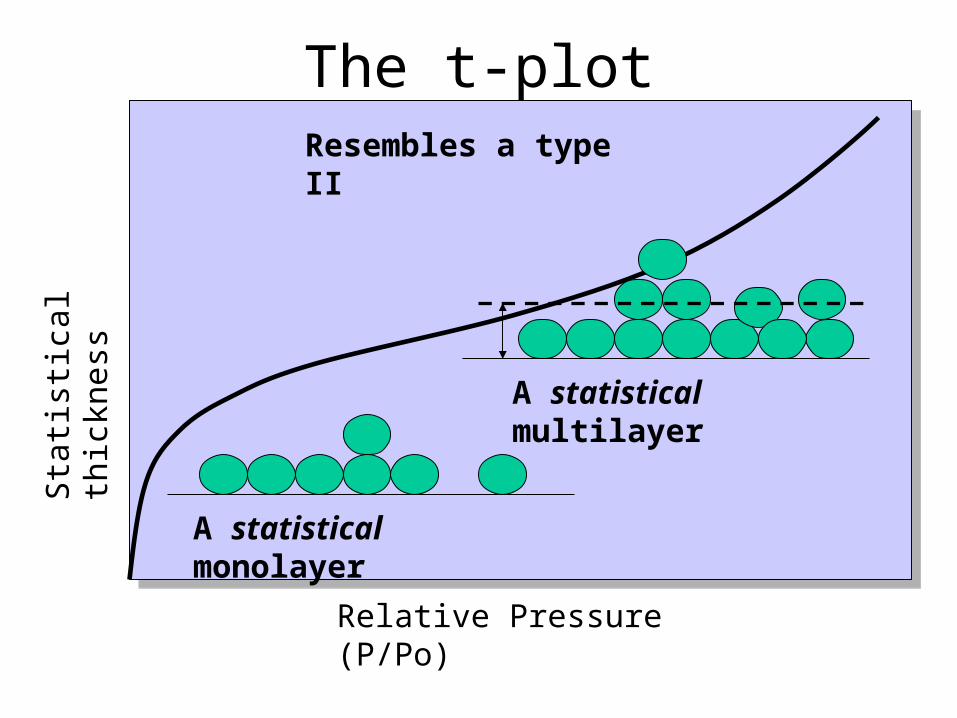
The t-plotResembles a type II
Relative Pressure (P/Po)
Sta
tistic
al t
hick
ness
A statistical monolayer
A statistical multilayer
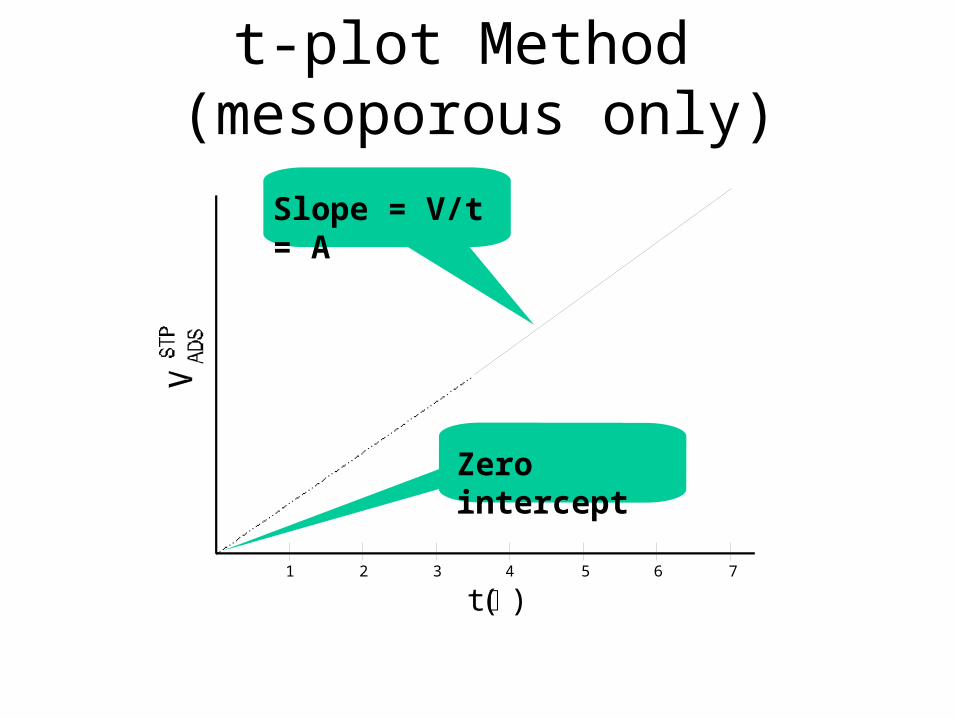
t-plot Method (mesoporous only)
1 2 3 4 5 6 7
t ( )
Slope = V/t = A
Zero intercept
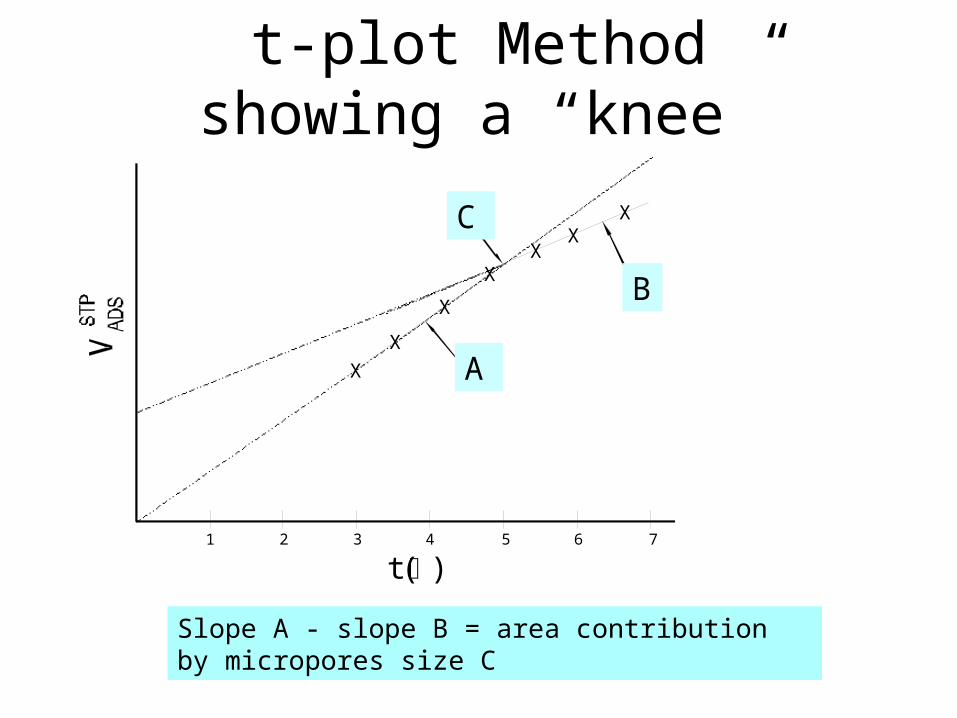
t-plot Methodshowing a “knee”
Slope A - slope B = area contribution by micropores size C
1 2 3 4 5 6 7
t ( )
X
X
X
XX
XXC
A
B
A
C
B

What is an s plot?
s (for Ken Sing) is a comparison plot like the t-plot but its slope does not give area directly.
A
?? ?
?
?
?
??
?
??Quiz
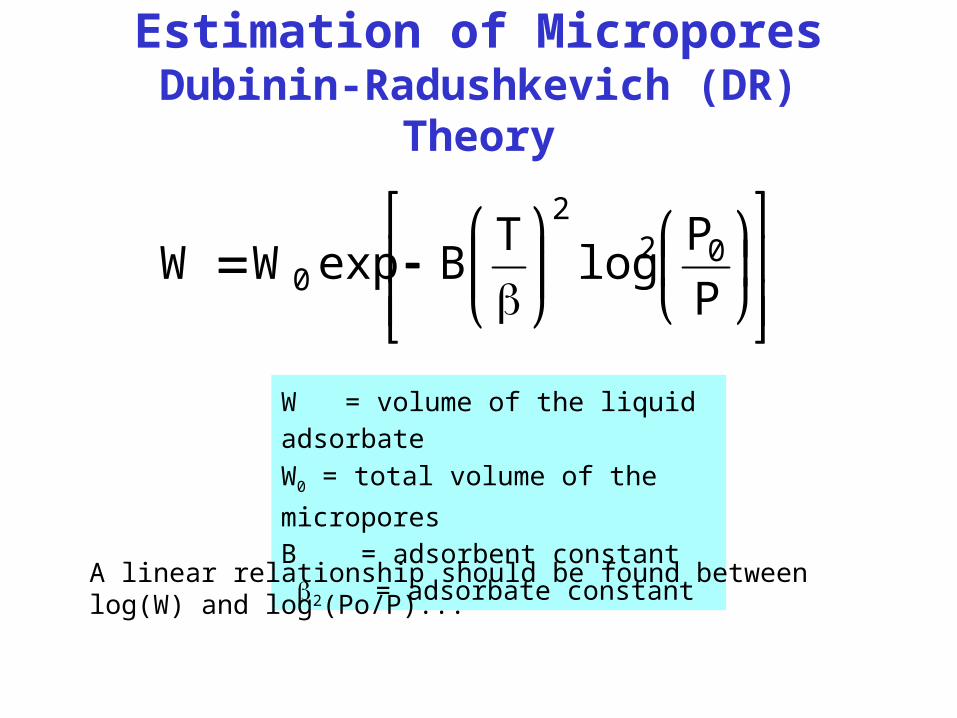
Estimation of MicroporesDubinin-Radushkevich (DR) Theory
P
Plog
TBexpWW 02
2
0
W = volume of the liquid adsorbate
W0 = total volume of the micropores
B = adsorbent constant = adsorbate constant
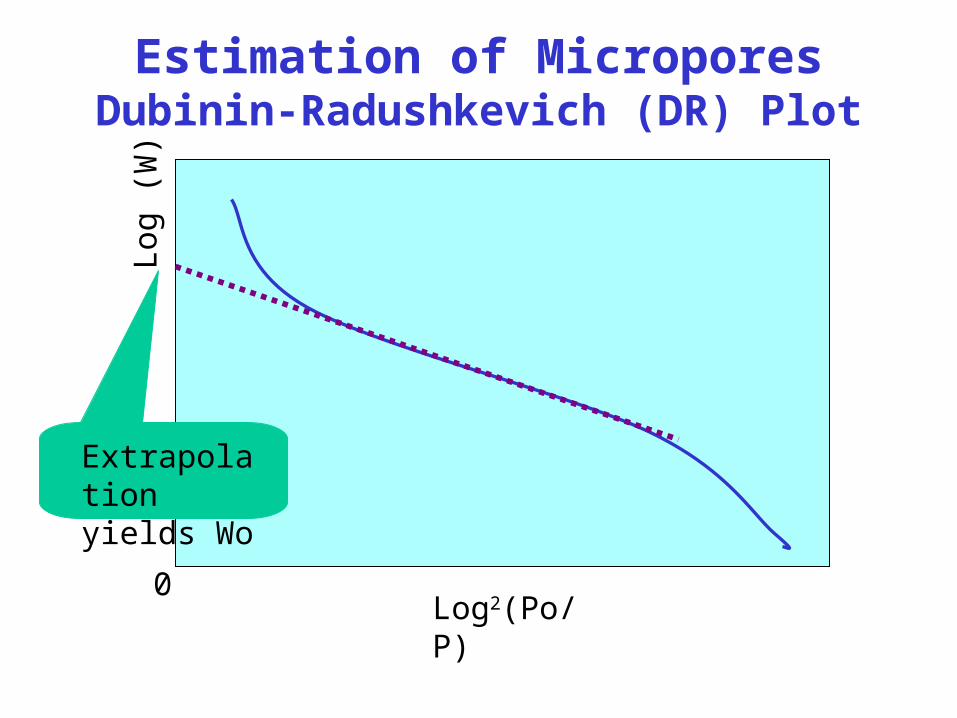
A linear relationship should be found between log(W) and log2(Po/P)...
Log2(Po/P)
Log
(W
)
Extrapolation yields Wo
Estimation of MicroporesDubinin-Radushkevich (DR) Plot
0
Pore Size Determination
Requires a recognition and understanding of different basic
isotherm types.
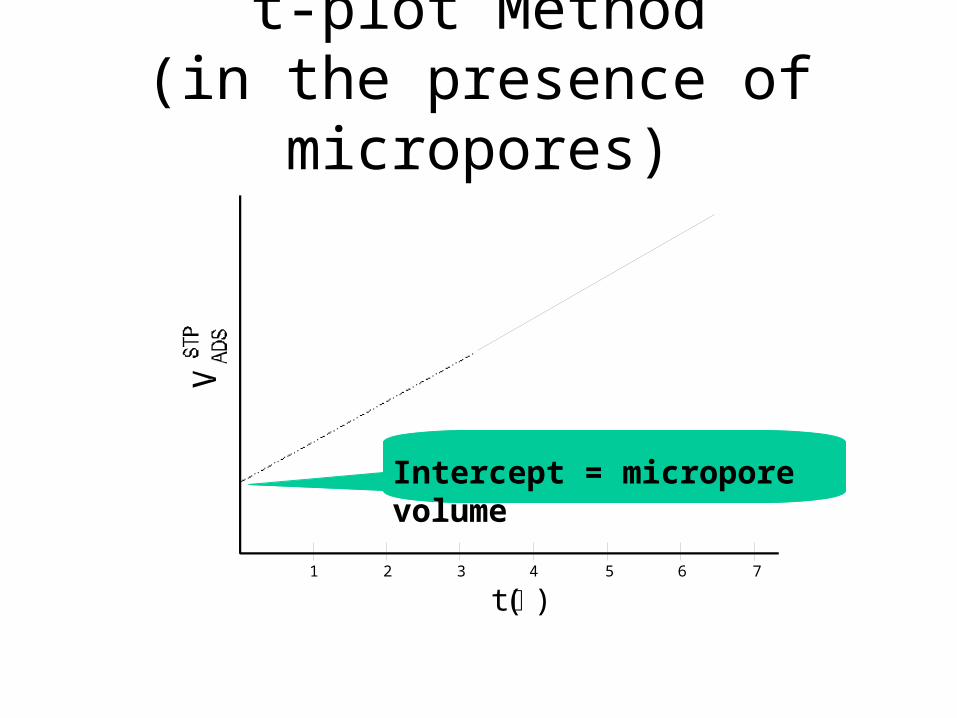
t-plot Method(in the presence of micropores)
1 2 3 4 5 6 7
t ( )
Intercept = micropore volume
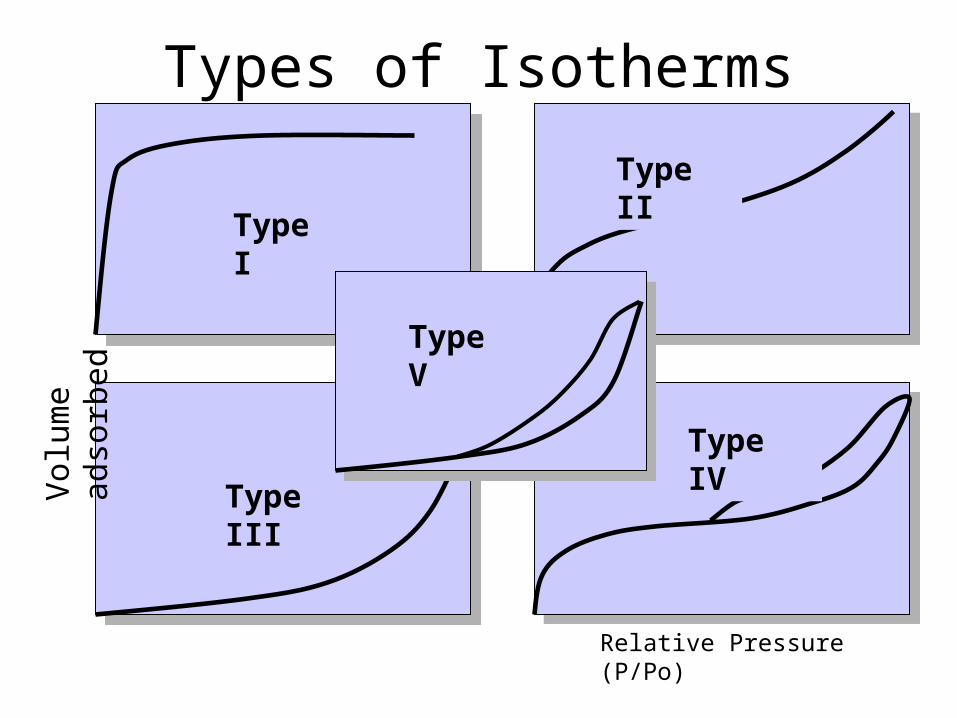
Types of Isotherms
Type I
Type II
Type III
Type IV
Relative Pressure (P/Po)
Vol
ume
adso
rbed
Type V
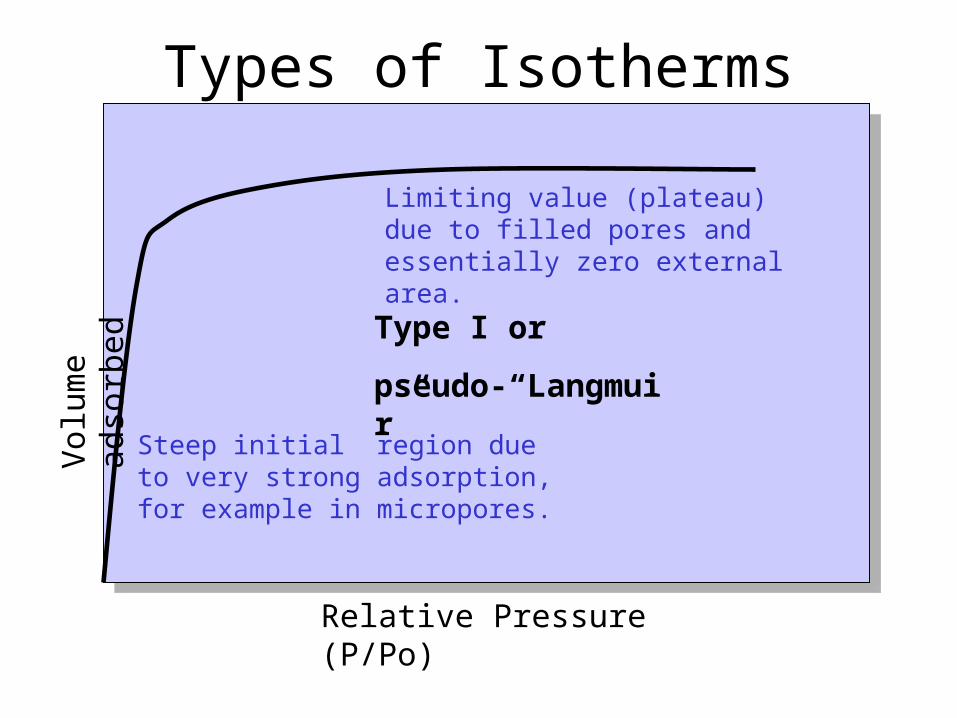
Types of Isotherms
Type I or
pseudo-“Langmuir”
Relative Pressure (P/Po)
Vol
ume
adso
rbed
Steep initial region due to very strong adsorption, for example in micropores.
Limiting value (plateau) due to filled pores and essentially zero external area.
Why pseudo Langmuir?
Langmuir applies to monolayer limit, not volume filling limit.
A
?? ?
?
?
?
??
?
??Quiz
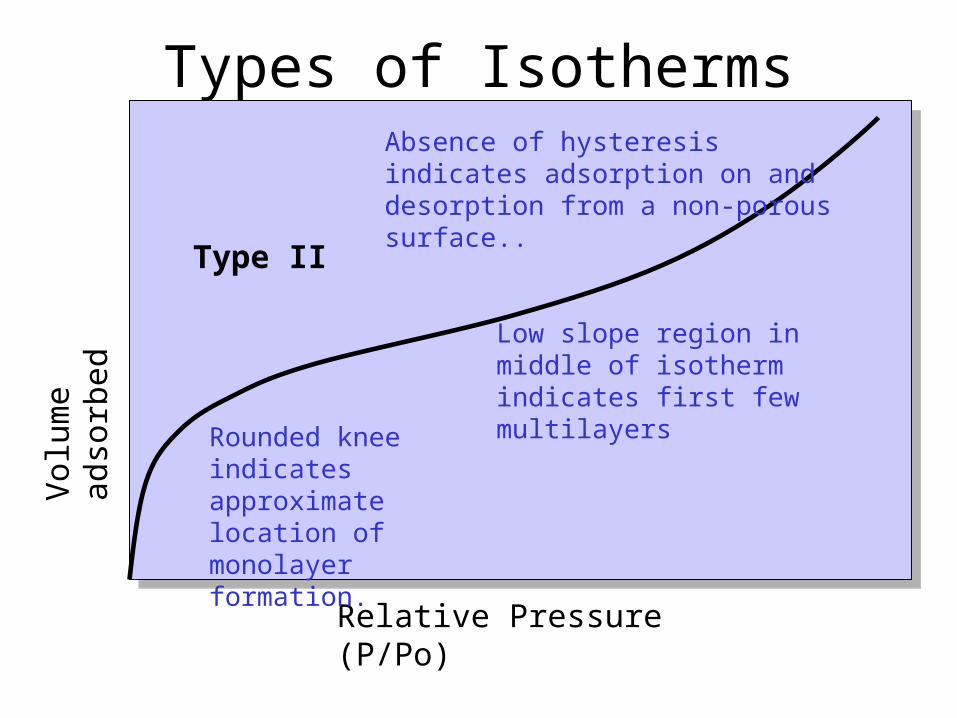
Types of Isotherms
Type II
Relative Pressure (P/Po)
Vol
ume
adso
rbed
Rounded knee indicates approximate location of monolayer formation.
Absence of hysteresis indicates adsorption on and desorption from a non-porous surface..
Low slope region in middle of isotherm indicates first few multilayers
Types of Isotherms
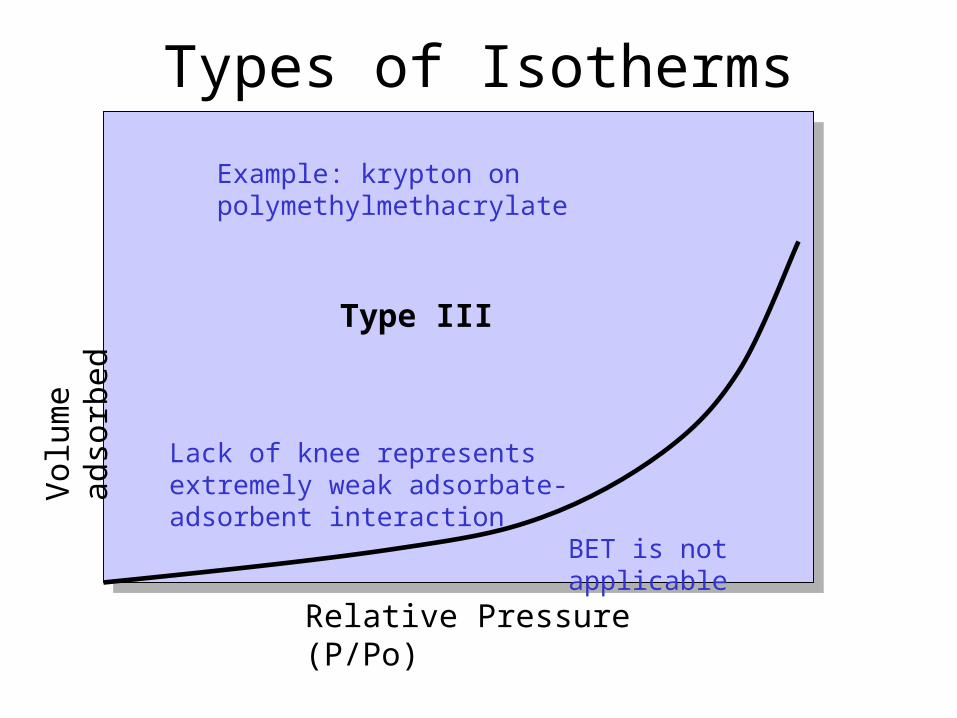
Type III
Relative Pressure (P/Po)
Vol
ume
adso
rbed
Lack of knee represents extremely weak adsorbate-adsorbent interaction
BET is not applicable
Example: krypton on polymethylmethacrylate
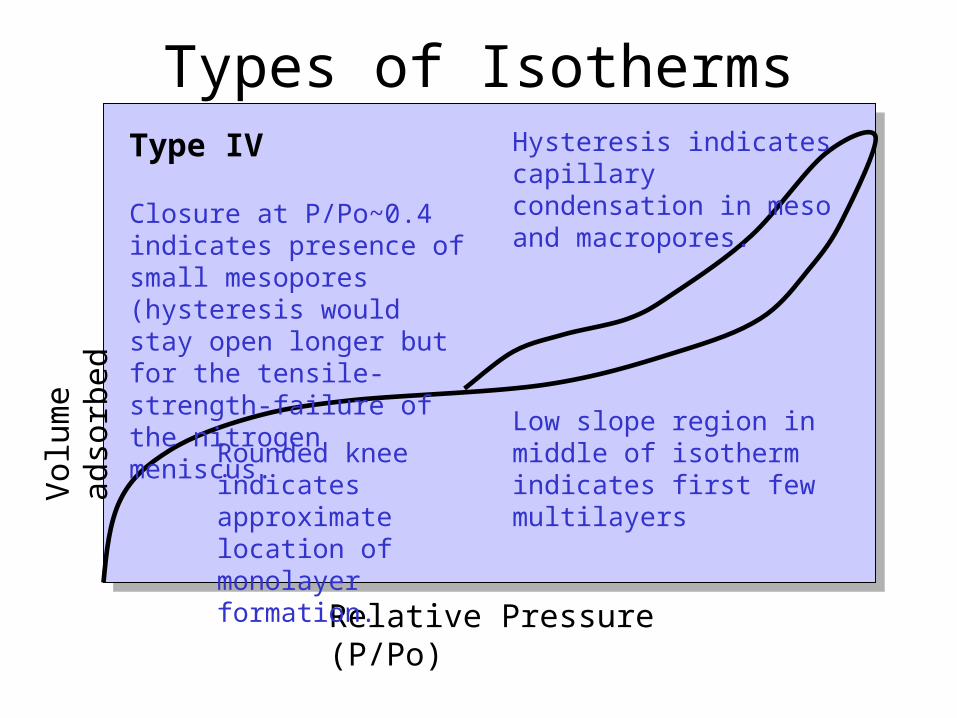
Types of IsothermsType IV
Relative Pressure (P/Po)
Vol
ume
adso
rbed
Rounded knee indicates approximate location of monolayer formation.
Low slope region in middle of isotherm indicates first few multilayers
Hysteresis indicates capillary condensation in meso and macropores.Closure at P/Po~0.4 indicates
presence of small mesopores (hysteresis would stay open longer but for the tensile-strength-failure of the nitrogen meniscus.
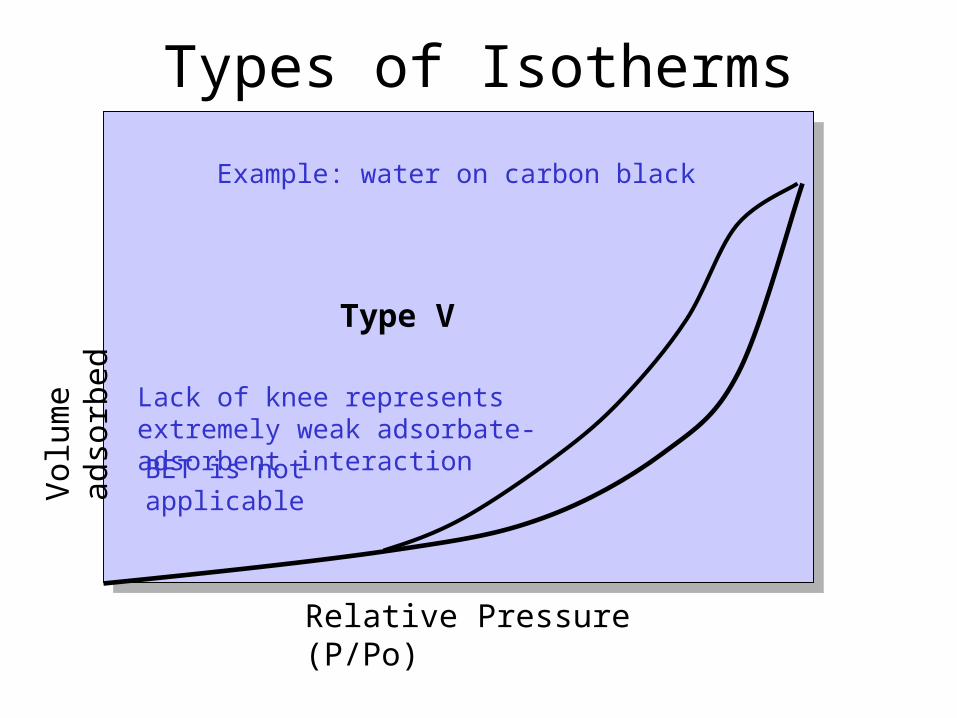
Types of Isotherms
Type V
Relative Pressure (P/Po)
Vol
ume
adso
rbed
Lack of knee represents extremely weak adsorbate-adsorbent interaction
BET is not applicable
Example: water on carbon black
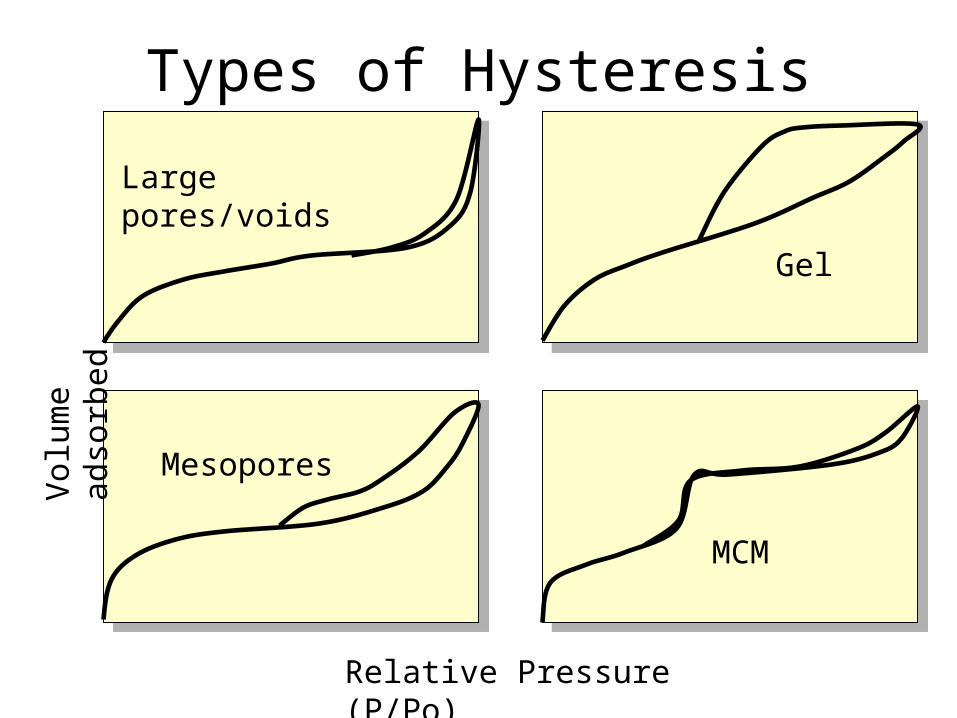
Types of Hysteresis
Large pores/voids
Gel
Mesopores
MCM
Vol
ume
adso
rbed
Relative Pressure (P/Po)
MesoPore Size by Gas
Sorption(BJH)
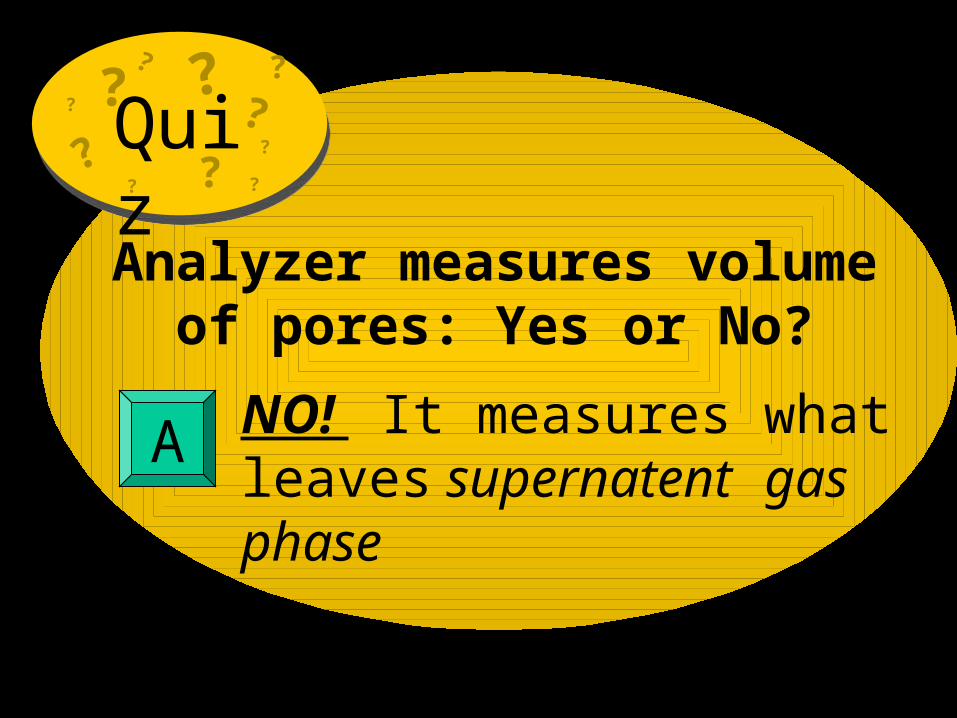
Analyzer measures volume of pores: Yes or No?
NO! It measures what leaves supernatent gas phase
A
?? ?
?
?
?
??
?
??Quiz
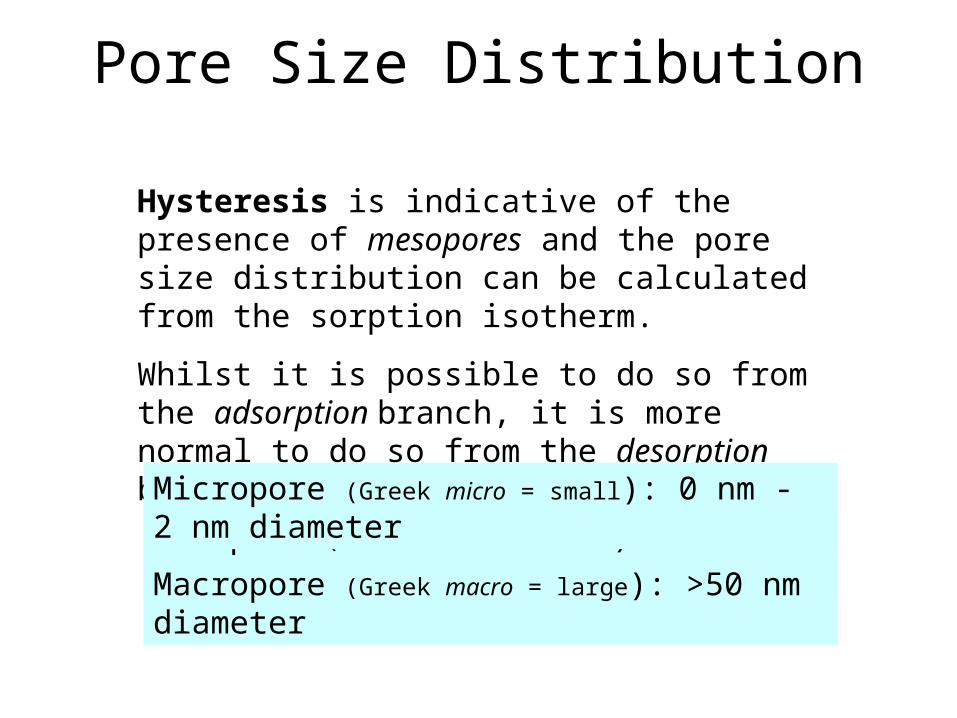
Pore Size Distribution
Hysteresis is indicative of the presence of mesopores and the pore size distribution can be calculated from the sorption isotherm.
Whilst it is possible to do so from the adsorption branch, it is more normal to do so from the desorption branch...
Mesopore (Greek meso = middle): 2nm - 50 nm diameter
Macropore (Greek macro = large): >50 nm diameter
Micropore (Greek micro = small): 0 nm - 2 nm diameter
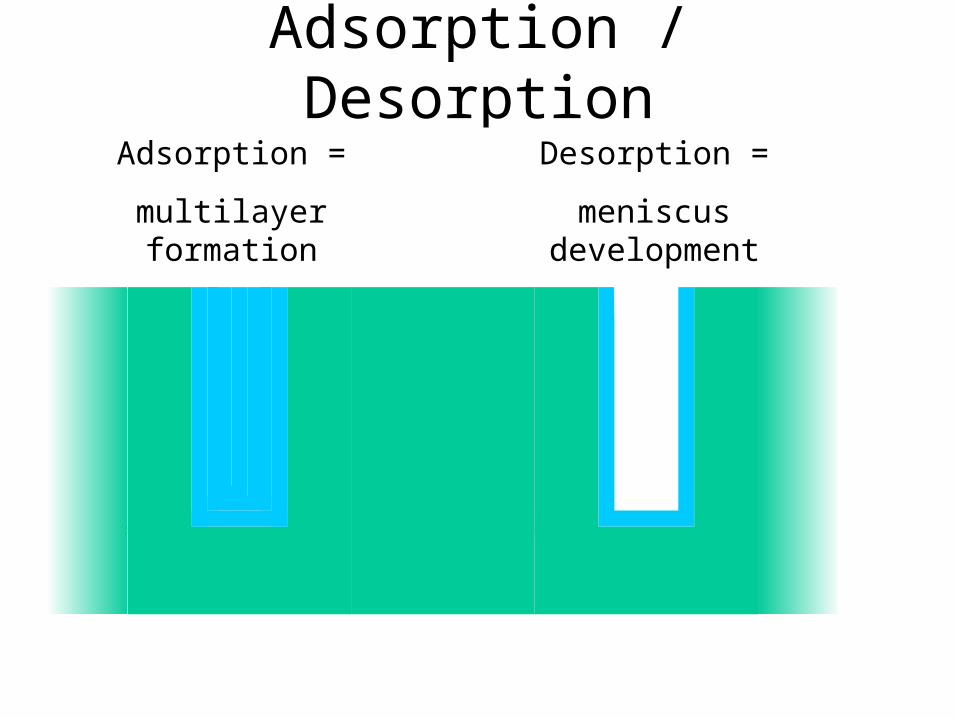
Adsorption / Desorption
Adsorption =
multilayer formation
Desorption =
meniscus development
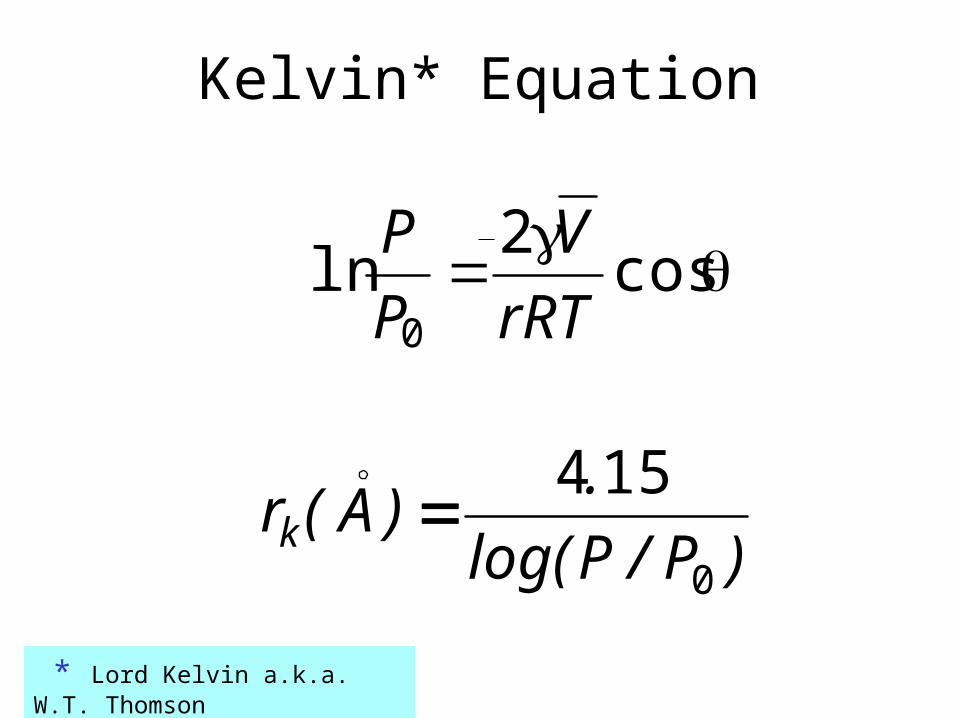
Kelvin* Equation
)P/Plog(
.)A(rk
0
154
* Lord Kelvin a.k.a. W.T. Thomson
cos2
ln0 rRT
V
P
P
Pore Size
trr kp
rp = actual radius of the pore
rk = Kelvin radius of the pore
t = thickness of the adsorbed film
Statistical Thickness, t
• Halsey equation
• Generalized Halsey
• deBoer equation
• Carbon Black STSA
BJH Method (Barrett-Joyner-Halenda)
trr Kelvinpore
Pore volume requires assumption of liquid density!
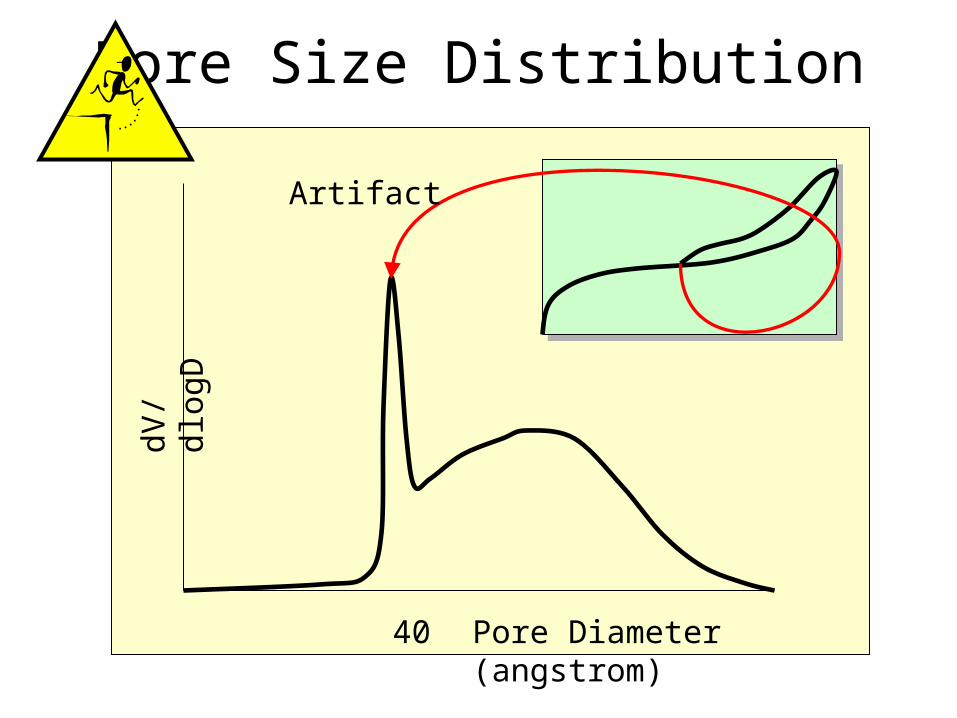
Pore Size Distribution
40 Pore Diameter (angstrom)
dV/d
logD
Artifact
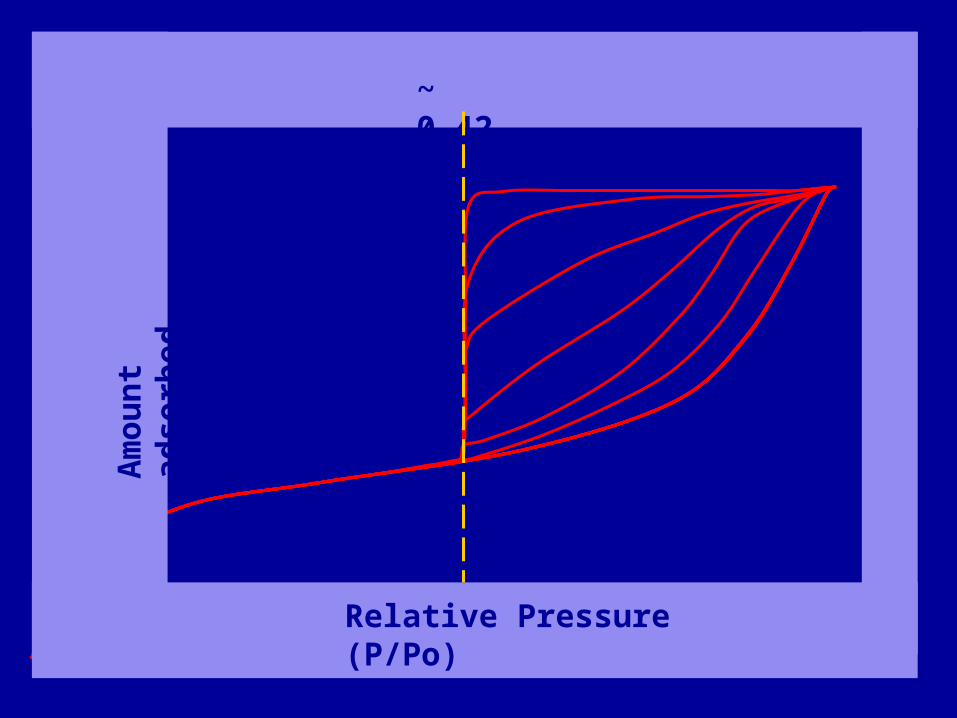
Relative Pressure (P/Po)
Am
ou
nt
adso
rbed
~ 0.42
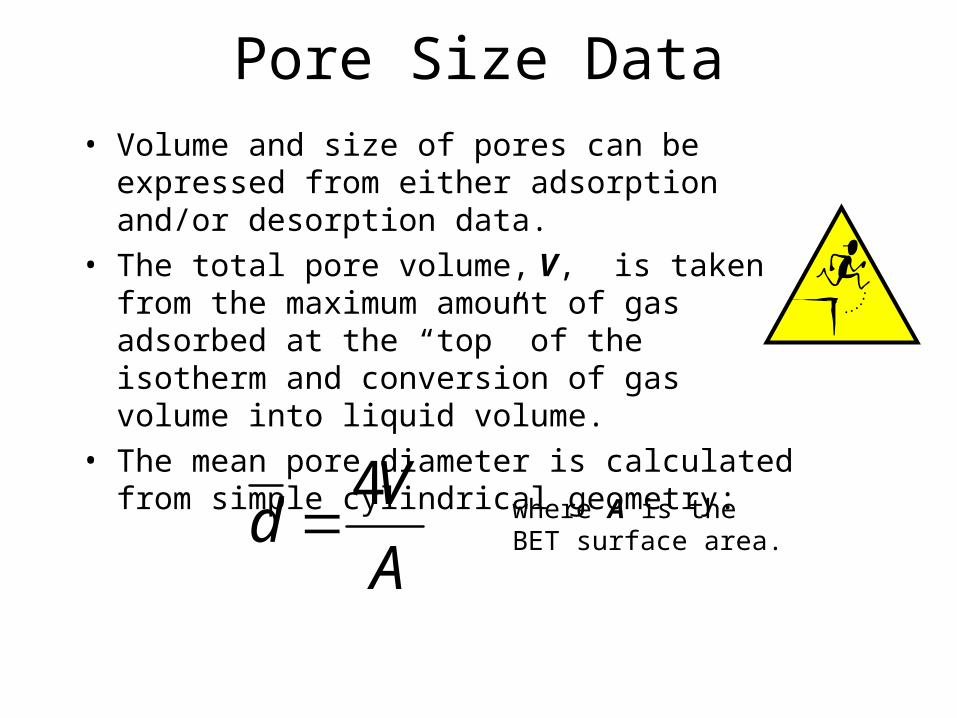
Pore Size Data• Volume and size of pores can be expressed from
either adsorption and/or desorption data.
• The total pore volume, V, is taken from the maximum amount of gas adsorbed at the “top” of the isotherm and conversion of gas volume into liquid volume.
• The mean pore diameter is calculated from simple cylindrical geometry:
A
Vd
4 where A is the BET
surface area.
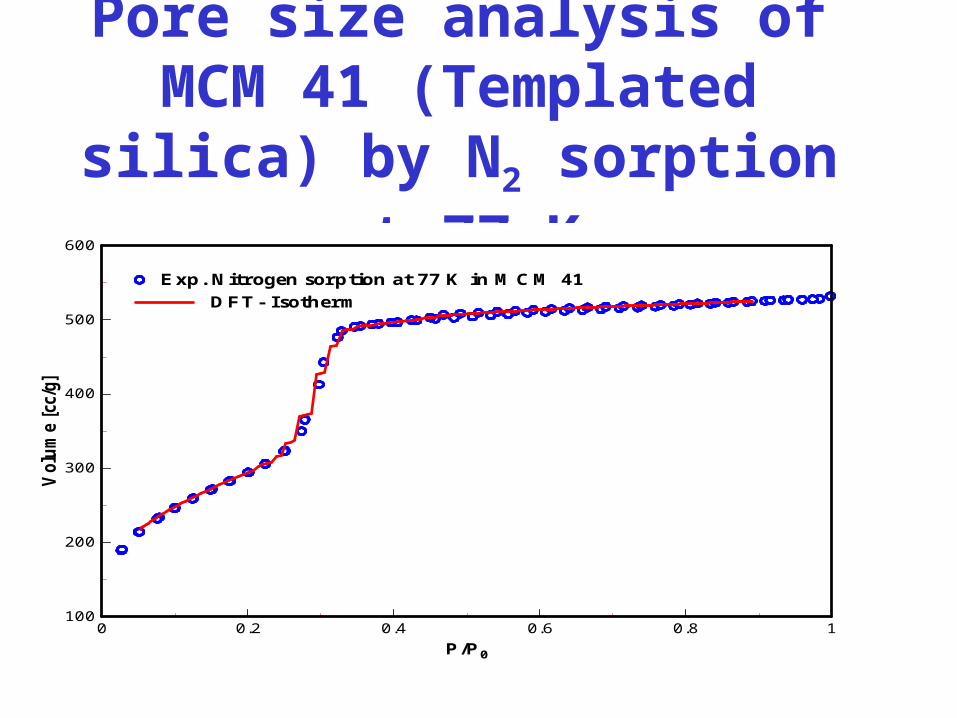
Pore size analysis of MCM 41 (Templated silica) by N2 sorption
at 77 K
0 0.2 0.4 0.6 0.8 1P/P0
100
200
300
400
500
600
Vol
ume
[cc/
g]
Exp. Nitrogen sorption at 77 K in MCM 41Exp. Nitrogen sorption at 77 K in MCM 41DFT- IsothermDFT- Isotherm
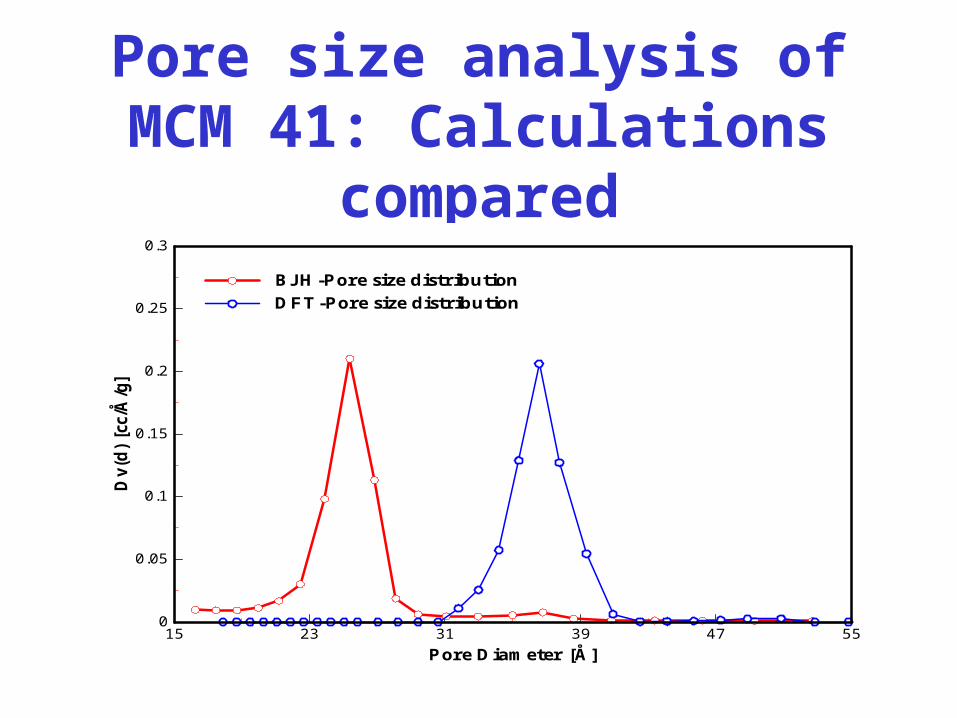
Pore size analysis of MCM 41: Calculations compared
15 23 31 39 47 55Pore Diameter [Å]
0
0.05
0.1
0.15
0.2
0.25
0.3
Dv(
d) [cc
/Å/g
]
BJH-Pore size distribution BJH-Pore size distribution DFT-Pore size distributionDFT-Pore size distribution
Calculation Models
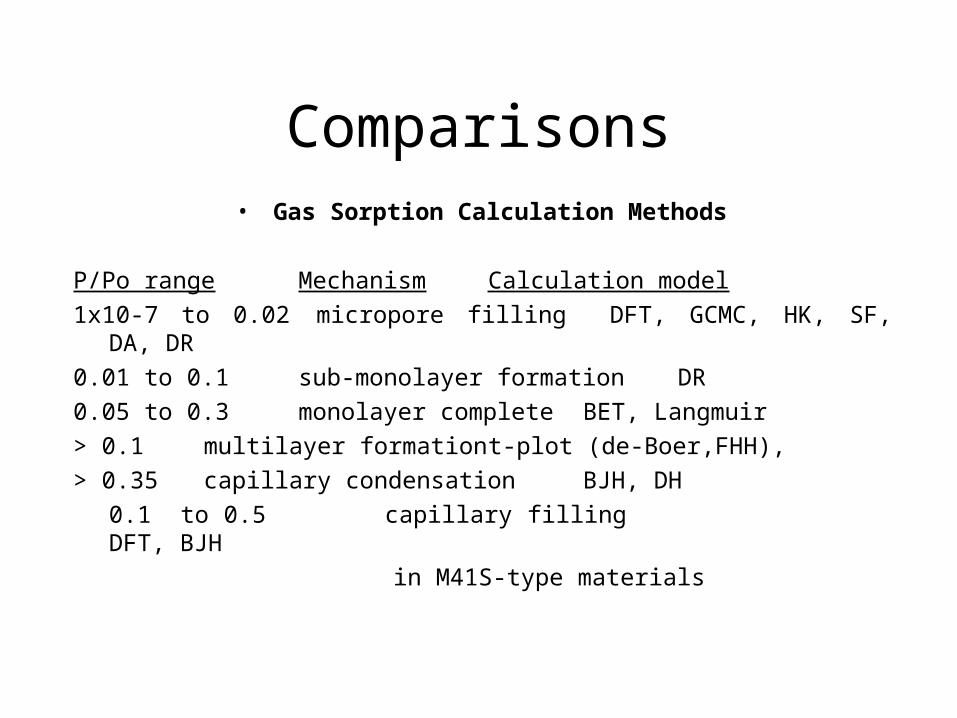
Comparisons• Gas Sorption Calculation Methods
P/Po range Mechanism Calculation model
1x10⁻⁷ to 0.02 micropore filling DFT, GCMC, HK, SF, DA, DR
0.01 to 0.1 sub-monolayer formation DR
0.05 to 0.3 monolayer complete BET, Langmuir
> 0.1 multilayer formation t-plot (de-Boer,FHH),
> 0.35 capillary condensation BJH, DH
0.1 to 0.5 capillary filling DFT, BJH
in M41S-type materials
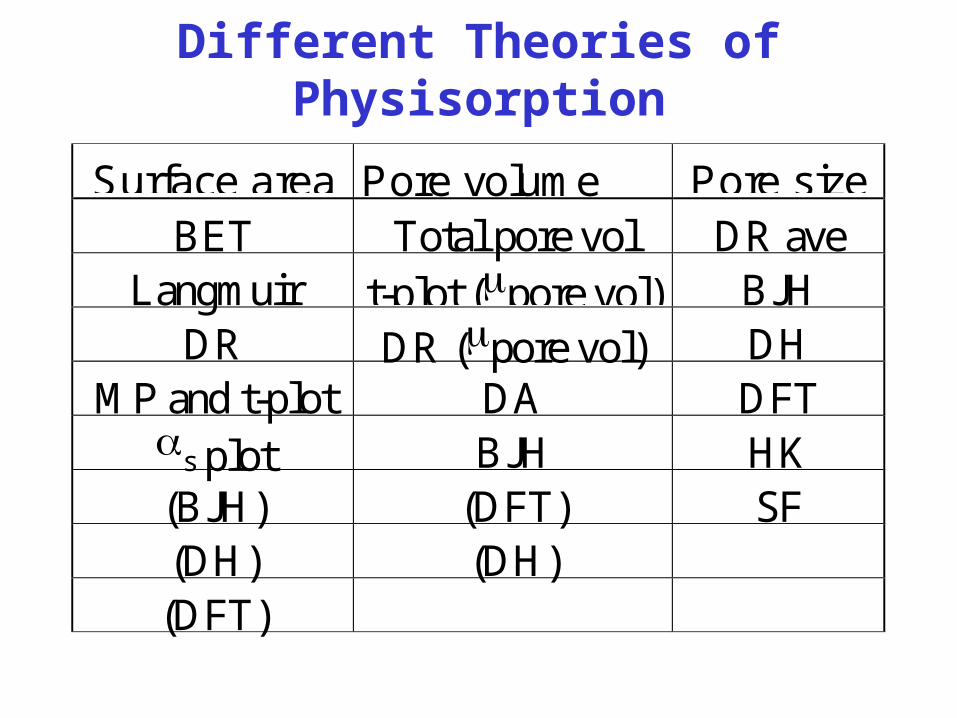
Different Theories of Physisorption
Surface area Pore volume Pore sizeBET Total pore vol DR ave
Langmuir t-plot (pore vol) BJHDR DR (pore vol) DH
MP and t-plot DA DFTs plot BJH HK(BJH) (DFT) SF(DH) (DH)(DFT)
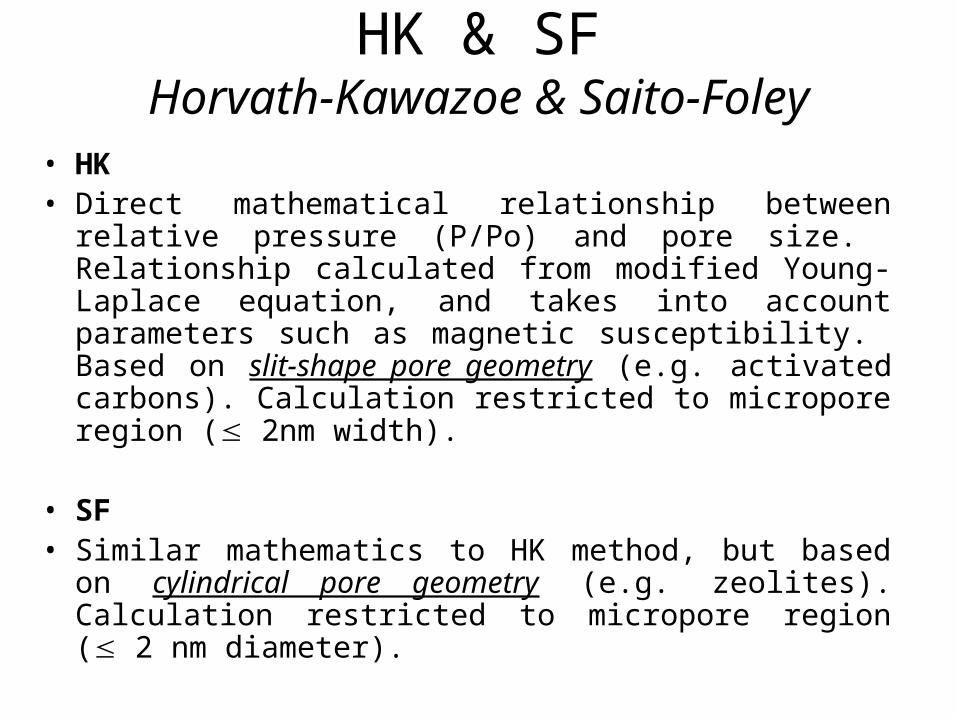
HK & SFHorvath-Kawazoe & Saito-Foley
• HK• Direct mathematical relationship between relative
pressure (P/Po) and pore size. Relationship calculated from modified Young-Laplace equation, and takes into account parameters such as magnetic susceptibility. Based on slit-shape pore geometry (e.g. activated carbons). Calculation restricted to micropore region ( 2nm width).
• SF• Similar mathematics to HK method, but based on
cylindrical pore geometry (e.g. zeolites). Calculation restricted to micropore region ( 2 nm diameter).
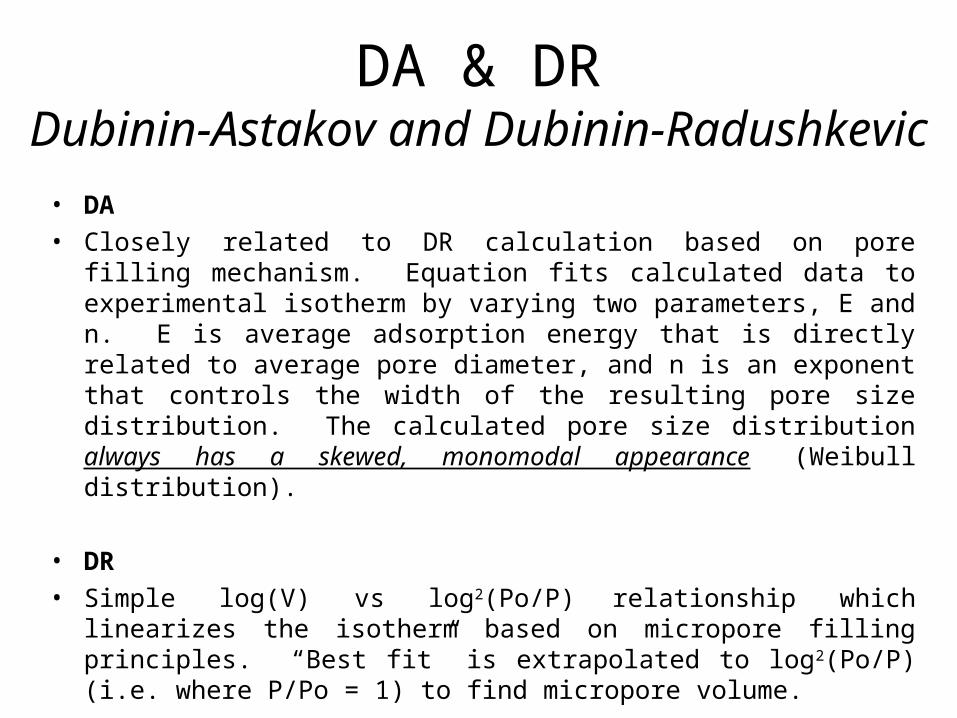
DA & DRDubinin-Astakov and Dubinin-Radushkevic
• DA• Closely related to DR calculation based on pore filling mechanism.
Equation fits calculated data to experimental isotherm by varying two parameters, E and n. E is average adsorption energy that is directly related to average pore diameter, and n is an exponent that controls the width of the resulting pore size distribution. The calculated pore size distribution always has a skewed, monomodal appearance (Weibull distribution).
• DR• Simple log(V) vs log2(Po/P) relationship which linearizes the isotherm
based on micropore filling principles. “Best fit” is extrapolated to log2(Po/P) (i.e. where P/Po = 1) to find micropore volume.
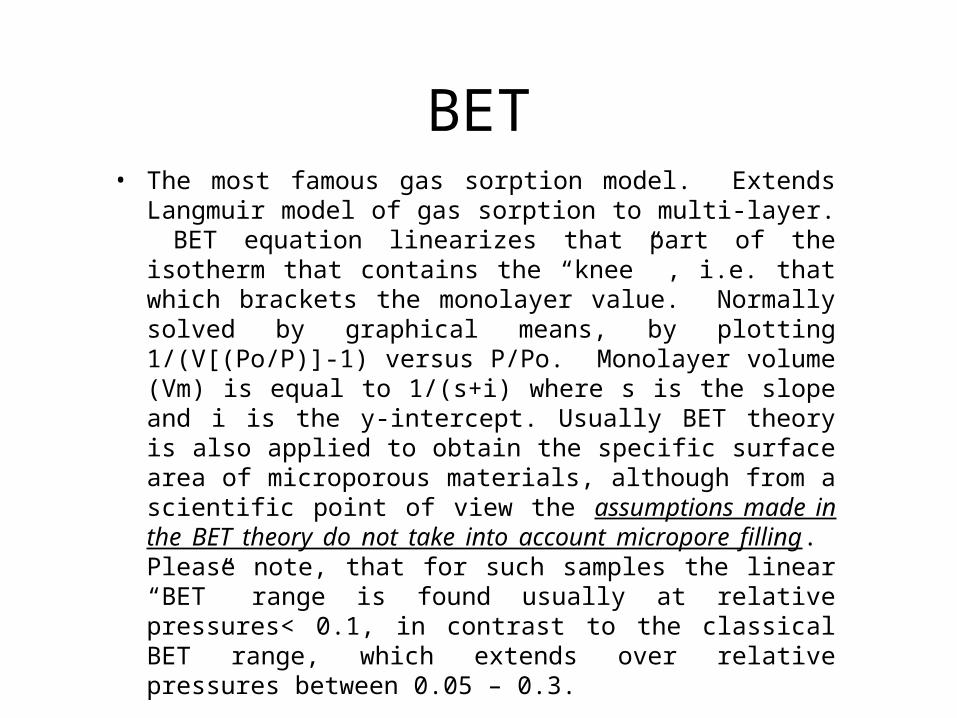
BET• The most famous gas sorption model. Extends Langmuir
model of gas sorption to multi-layer. BET equation linearizes that part of the isotherm that contains the “knee” , i.e. that which brackets the monolayer value. Normally solved by graphical means, by plotting 1/(V[(Po/P)]-1) versus P/Po. Monolayer volume (Vm) is equal to 1/(s+i) where s is the slope and i is the y-intercept. Usually BET theory is also applied to obtain the specific surface area of microporous materials, although from a scientific point of view the assumptions made in the BET theory do not take into account micropore filling. Please note, that for such samples the linear “BET” range is found usually at relative pressures< 0.1, in contrast to the classical BET range, which extends over relative pressures between 0.05 – 0.3.
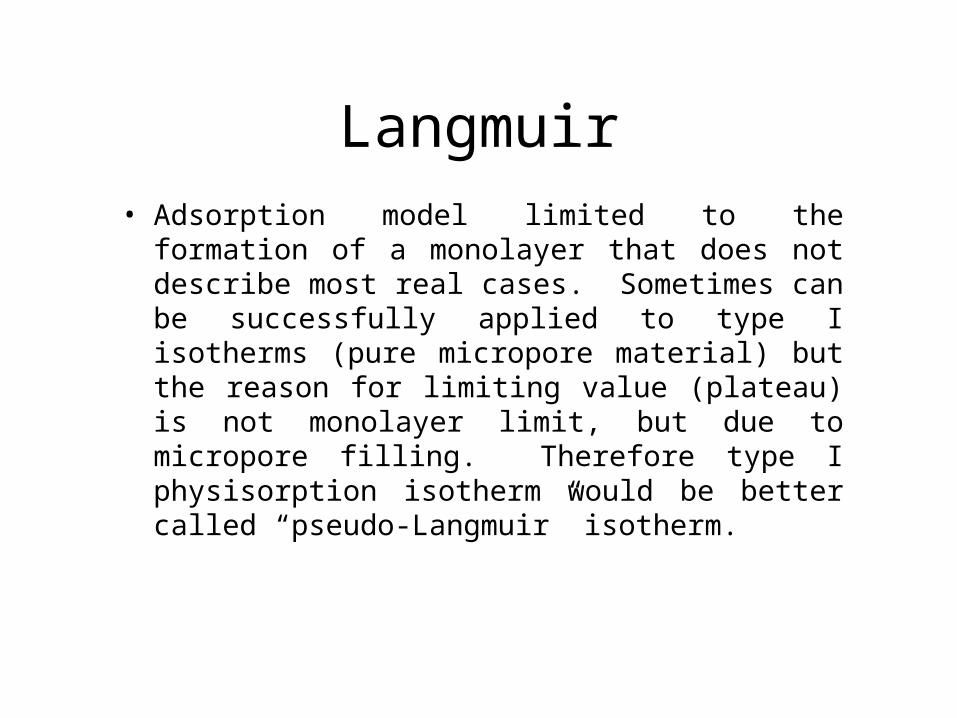
Langmuir• Adsorption model limited to the formation of a
monolayer that does not describe most real cases. Sometimes can be successfully applied to type I isotherms (pure micropore material) but the reason for limiting value (plateau) is not monolayer limit, but due to micropore filling. Therefore type I physisorption isotherm would be better called “pseudo-Langmuir” isotherm.
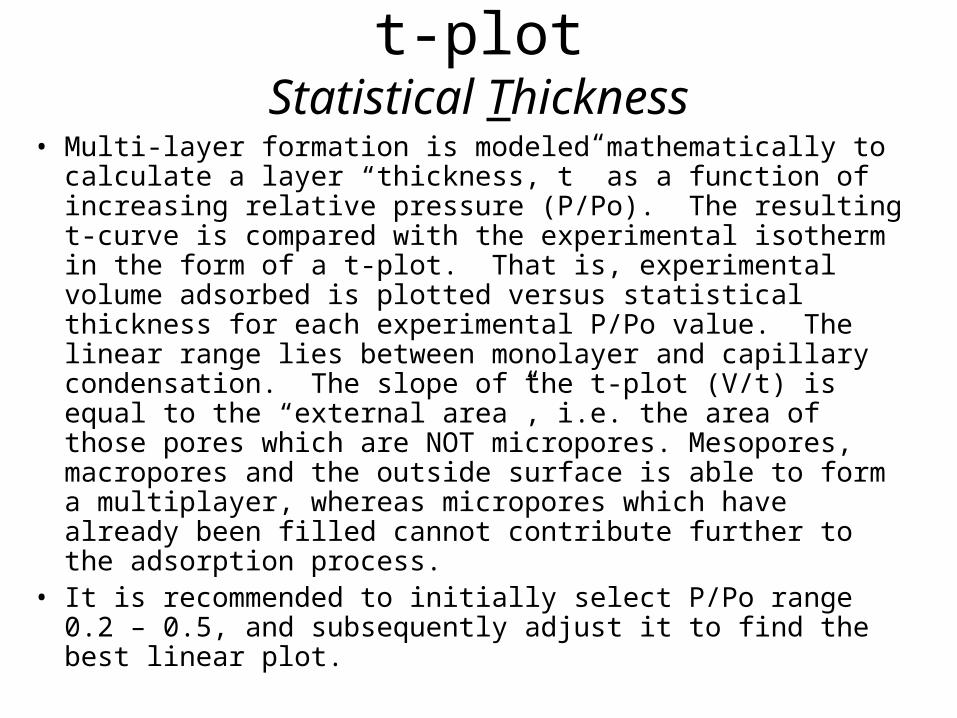
t-plotStatistical Thickness
• Multi-layer formation is modeled mathematically to calculate a layer “thickness, t” as a function of increasing relative pressure (P/Po). The resulting t-curve is compared with the experimental isotherm in the form of a t-plot. That is, experimental volume adsorbed is plotted versus statistical thickness for each experimental P/Po value. The linear range lies between monolayer and capillary condensation. The slope of the t-plot (V/t) is equal to the “external area”, i.e. the area of those pores which are NOT micropores. Mesopores, macropores and the outside surface is able to form a multiplayer, whereas micropores which have already been filled cannot contribute further to the adsorption process.
• It is recommended to initially select P/Po range 0.2 – 0.5, and subsequently adjust it to find the best linear plot.

BJH & DHBarrett, Joyner, Halenda and Dollimore-Heal
• BJH• Modified Kelvin equation. Kelvin equation predicts pressure at
which adsorptive will spontaneously condense (and evaporate) in a cylindrical pore of a given size. Condensation occurs in pores that already have some multilayers on the walls. Therefore, the pore size is calculated from the Kelvin equation and the selected statistical thickness (t-curve) equation.
• DH• Extremely similar calculation to BJH, which gives very similar
results. Essentially differs only in minor mathematical details.
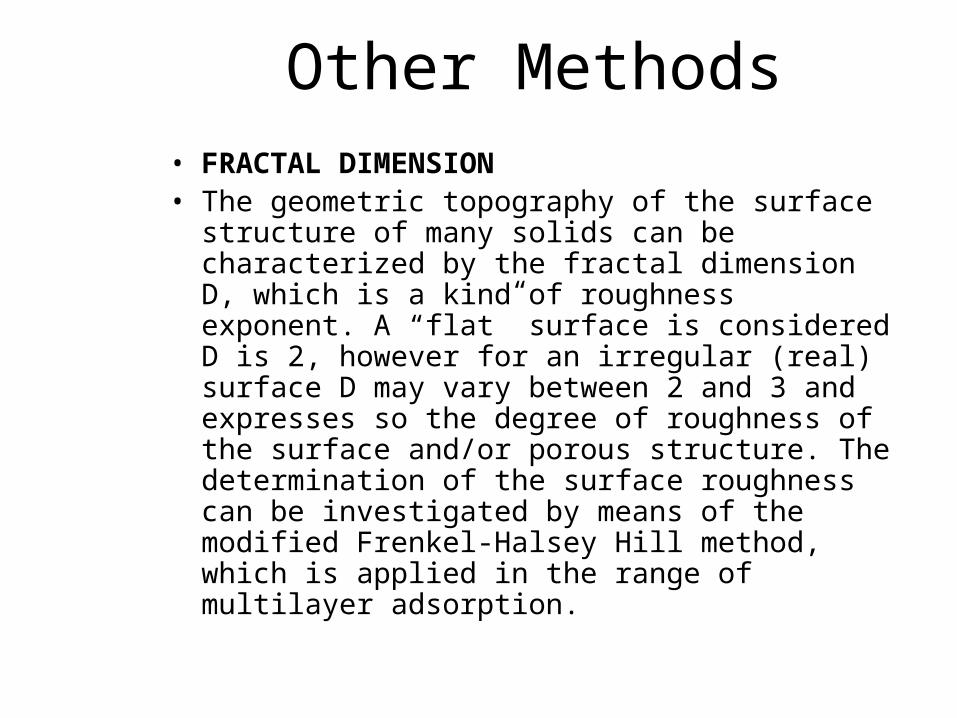
Other Methods• FRACTAL DIMENSION• The geometric topography of the surface
structure of many solids can be characterized by the fractal dimension D, which is a kind of roughness exponent. A “flat” surface is considered D is 2, however for an irregular (real) surface D may vary between 2 and 3 and expresses so the degree of roughness of the surface and/or porous structure. The determination of the surface roughness can be investigated by means of the modified Frenkel-Halsey Hill method, which is applied in the range of multilayer adsorption.

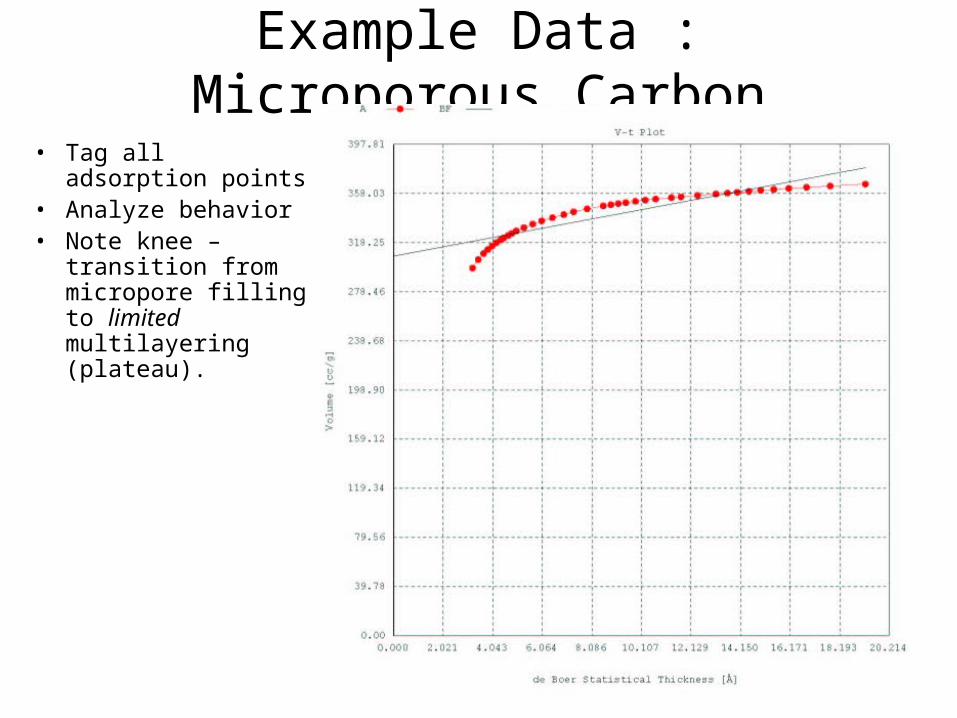
Example Data : Microporous Carbon
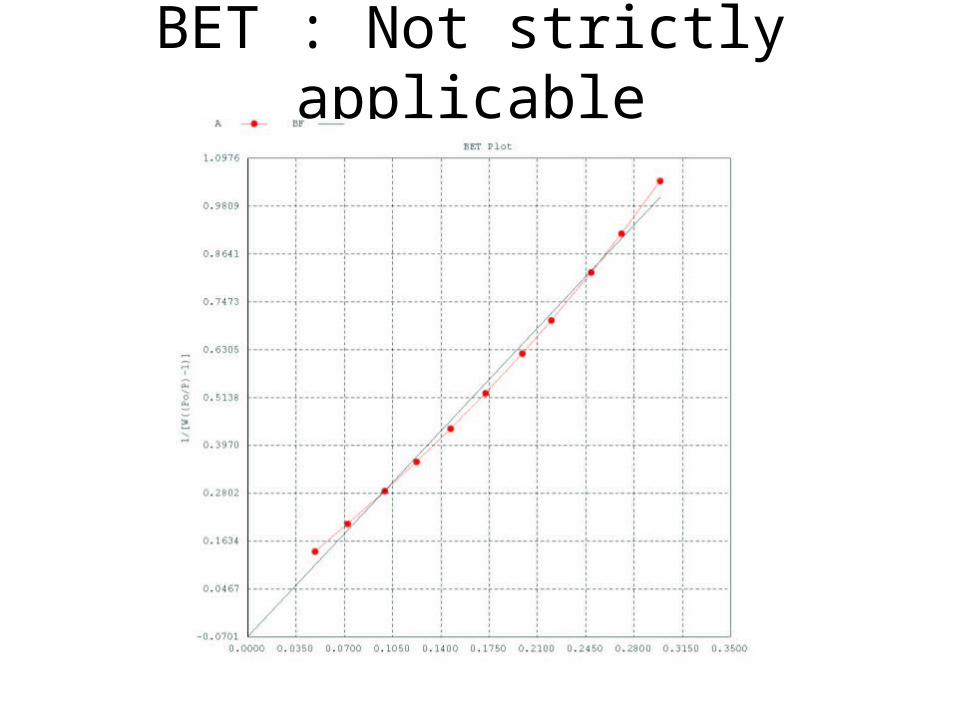
BET : Not strictly applicable
Example Data : Microporous Carbon
• Tag all adsorption points
• Analyze behavior• Note knee – transition
from micropore filling to limited multilayering (plateau).
Example Data : Microporous Carbon
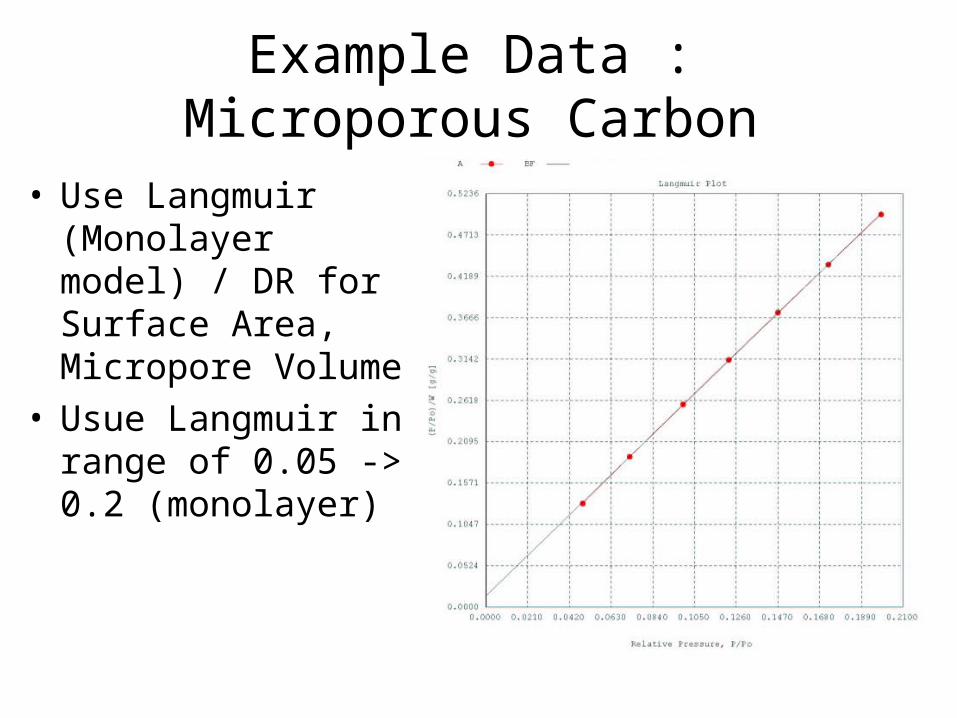
• Use Langmuir (Monolayer model) / DR for Surface Area, Micropore Volume
• Usue Langmuir in range of 0.05 -> 0.2 (monolayer)
Example Data : Microporous Carbon
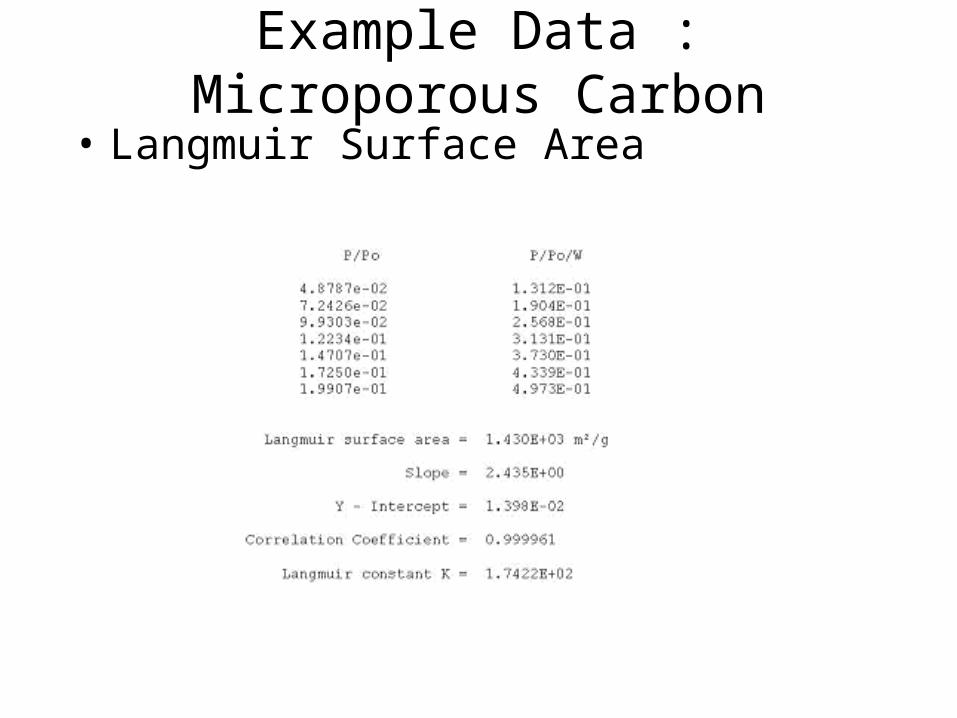
• Langmuir Surface Area
Example Data : Microporous Carbon
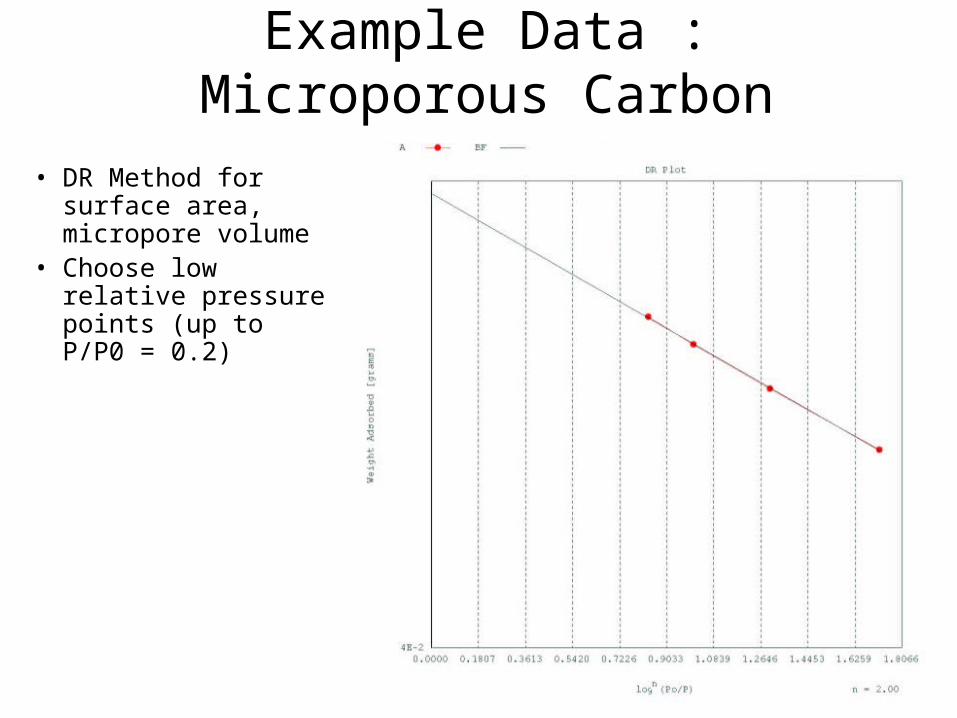
• DR Method for surface area, micropore volume
• Choose low relative pressure points (up to P/P0 = 0.2)
Example Data : Microporous Carbon
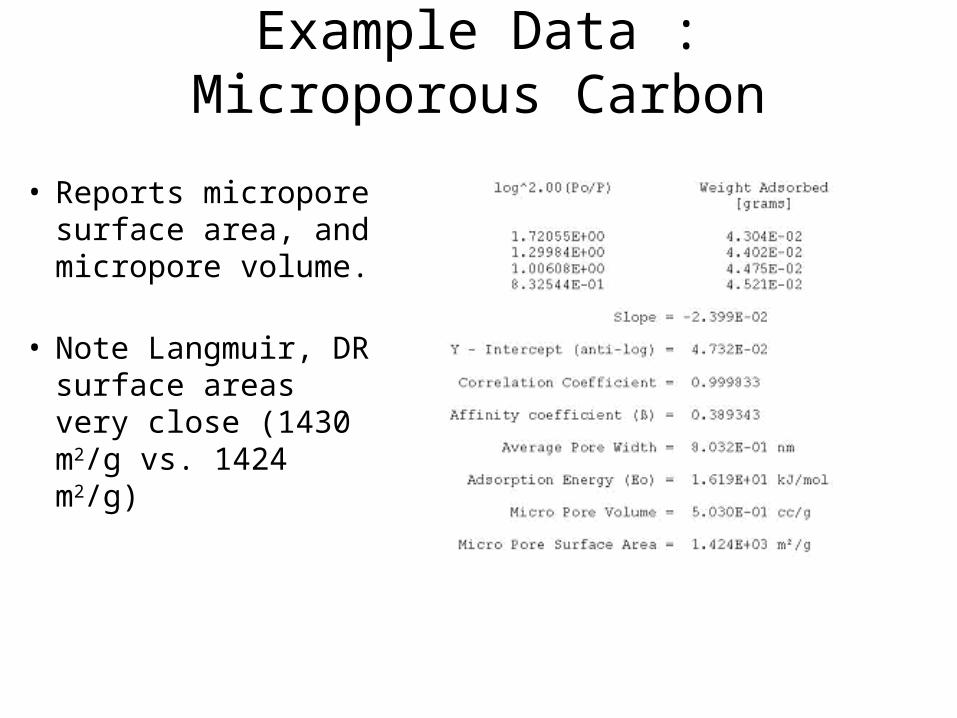
• Reports micropore surface area, and micropore volume.
• Note Langmuir, DR surface areas very close (1430 m2/g vs. 1424 m2/g)
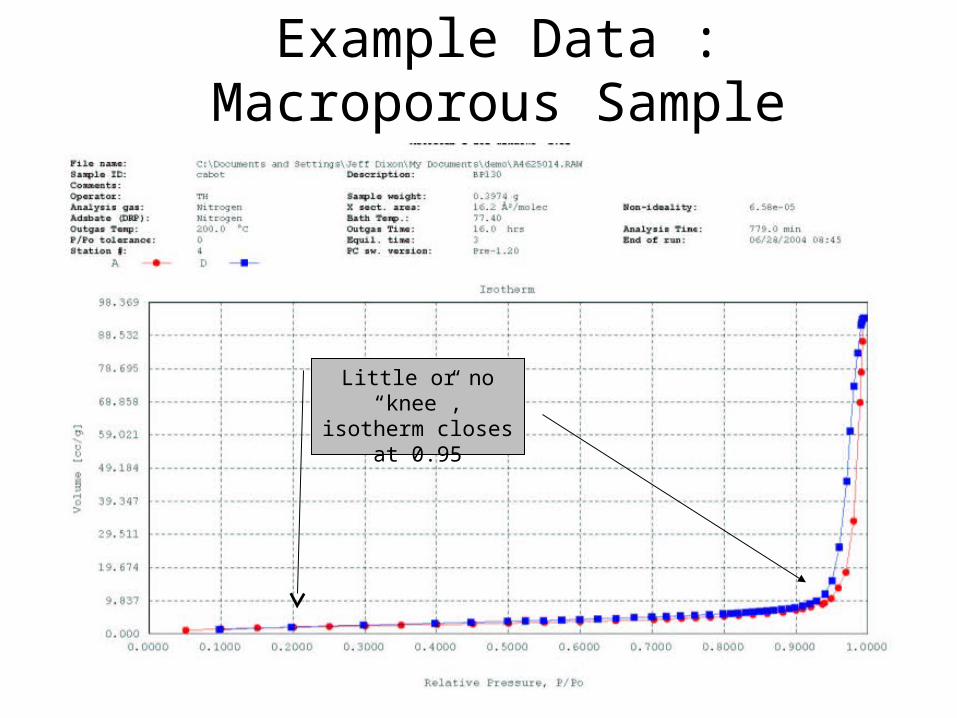
Example Data : Macroporous Sample
Little or no “knee”, isotherm closes at
0.95
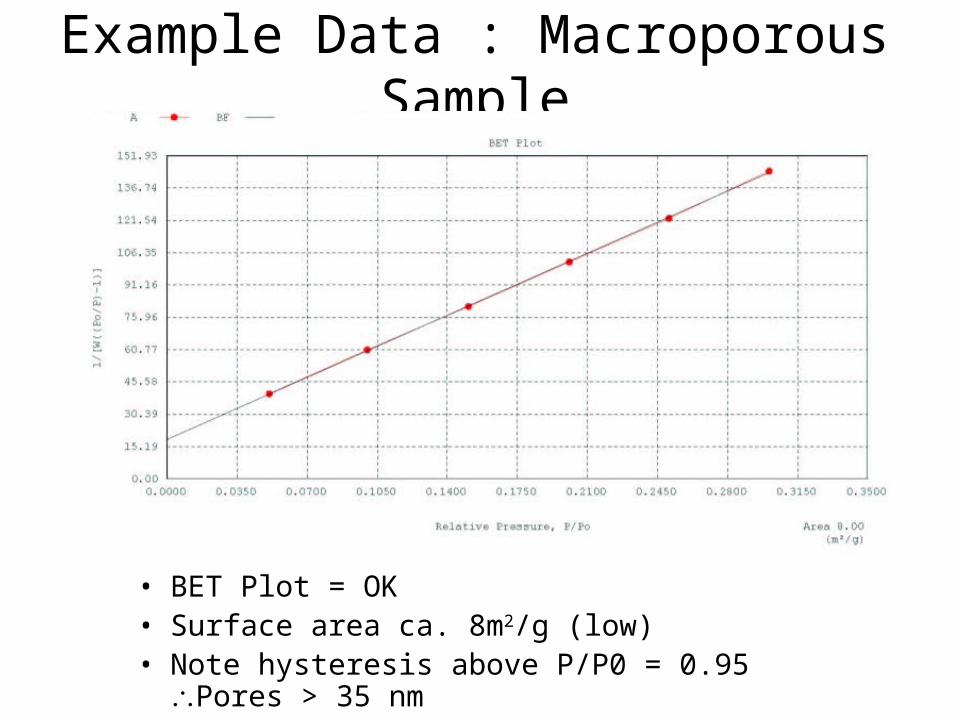
Example Data : Macroporous Sample
• BET Plot = OK• Surface area ca. 8m2/g (low)• Note hysteresis above P/P0 = 0.95 Pores > 35 nm
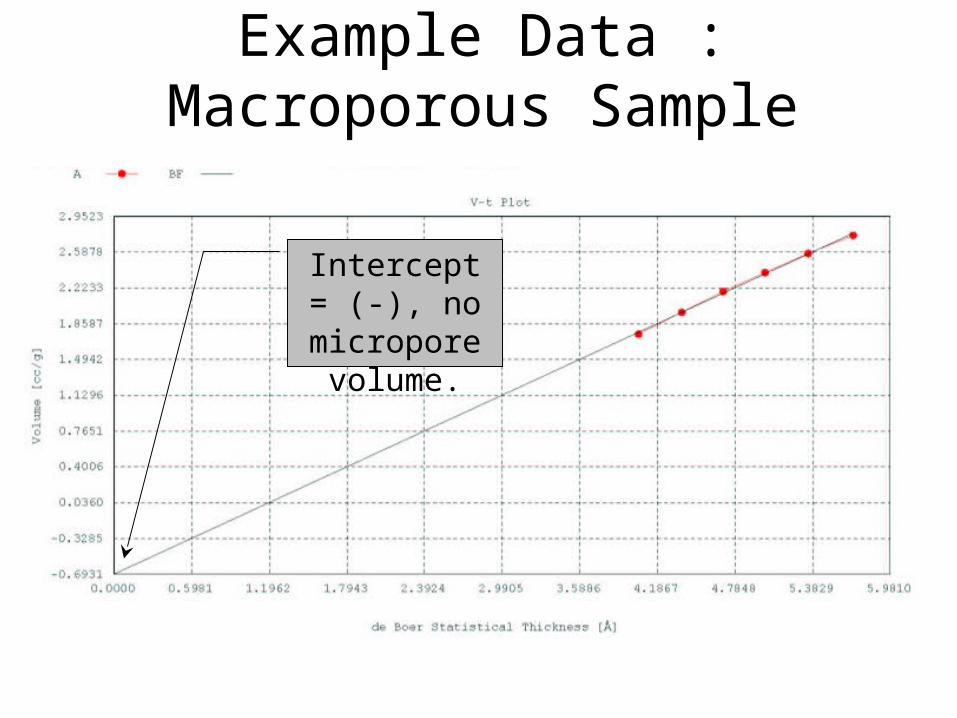
Example Data : Macroporous Sample
Intercept = (-), no micropore
volume.
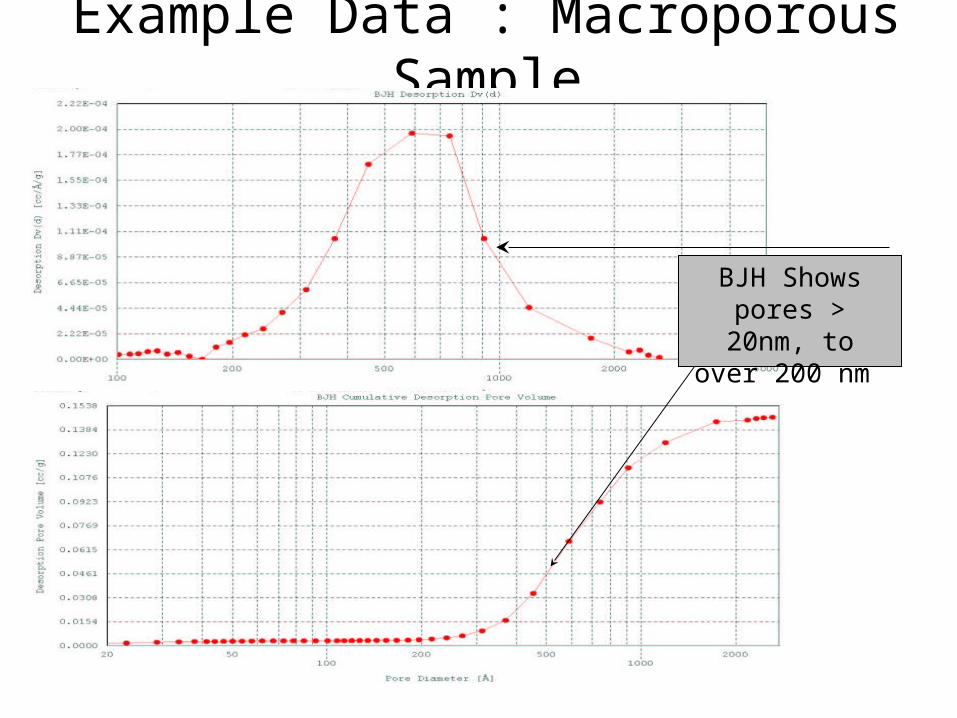
Example Data : Macroporous Sample
BJH Shows pores > 20nm, to over
200 nm
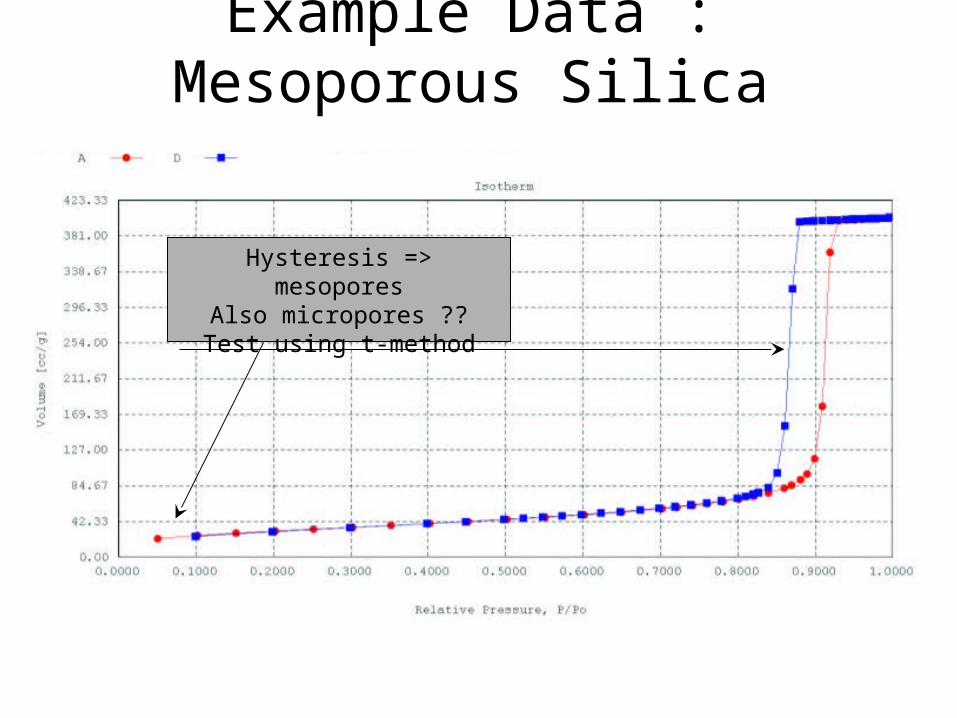
Example Data : Mesoporous Silica
Hysteresis => mesoporesAlso micropores ?? Test using t-
method
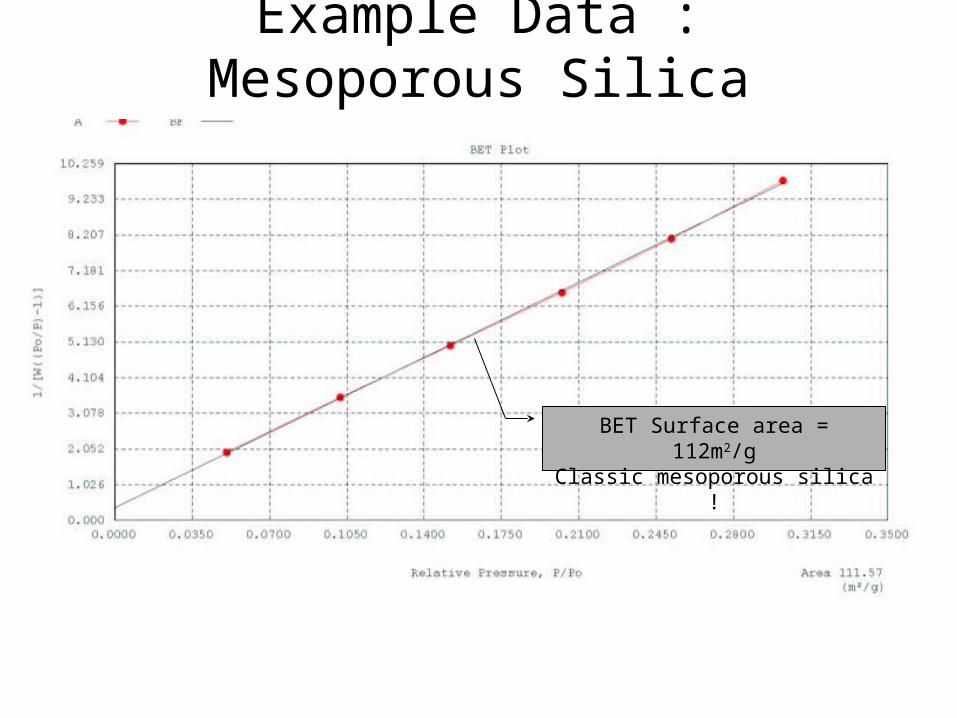
Example Data : Mesoporous Silica
BET Surface area = 112m2/gClassic mesoporous silica !
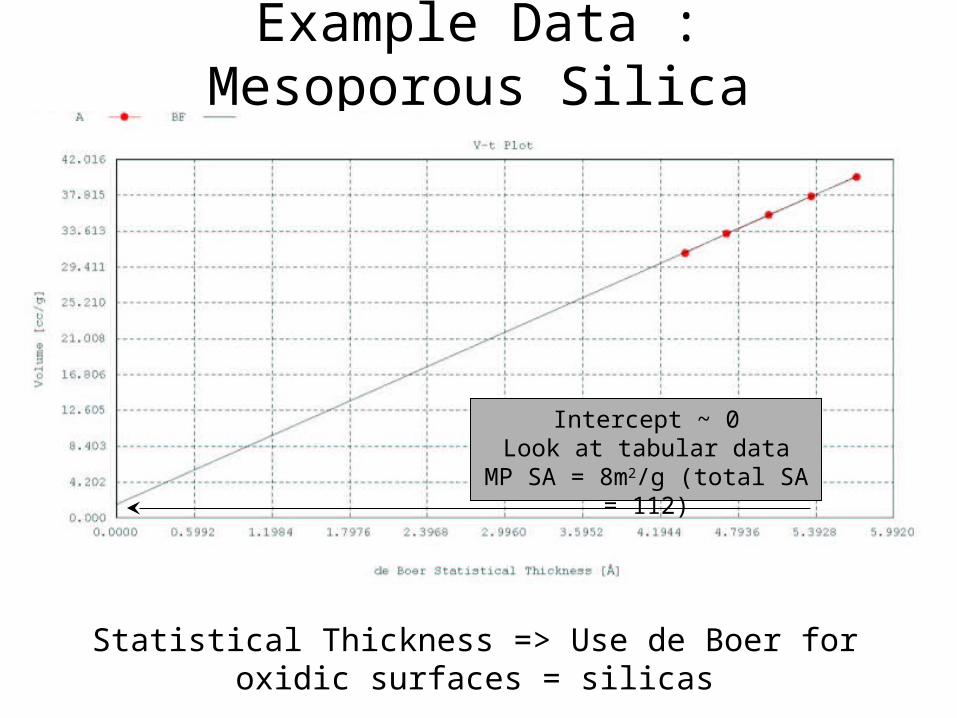
Example Data : Mesoporous Silica
Statistical Thickness => Use de Boer for oxidic surfaces = silicas
Intercept ~ 0Look at tabular data
MP SA = 8m2/g (total SA = 112)
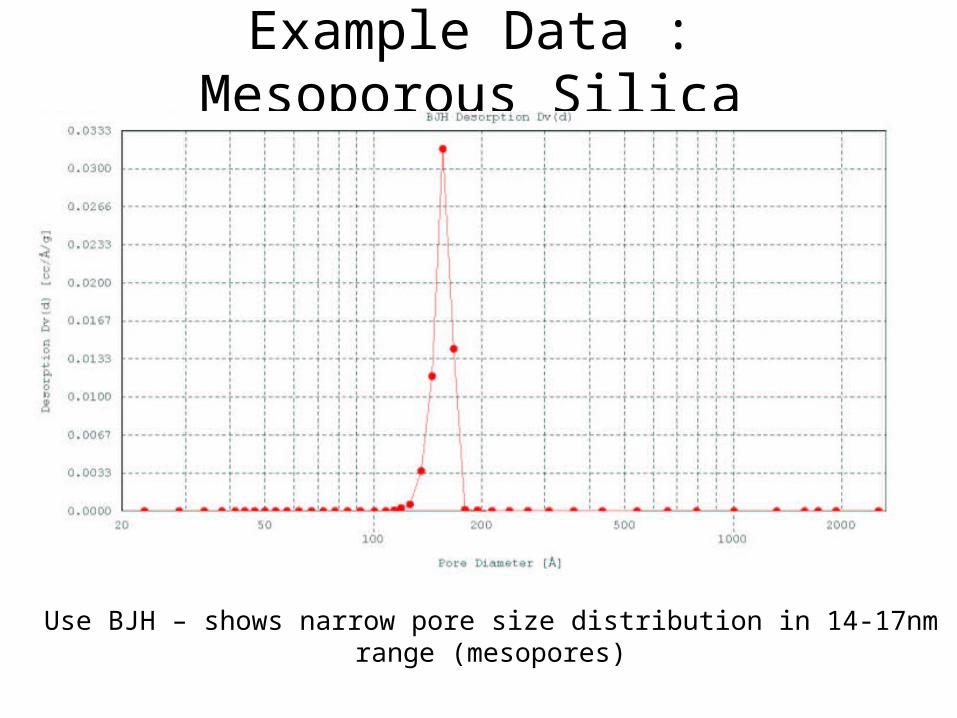
Example Data : Mesoporous Silica
Use BJH – shows narrow pore size distribution in 14-17nm range (mesopores)
MicroPore Size by Gas
Sorption

Available Calculation
Models
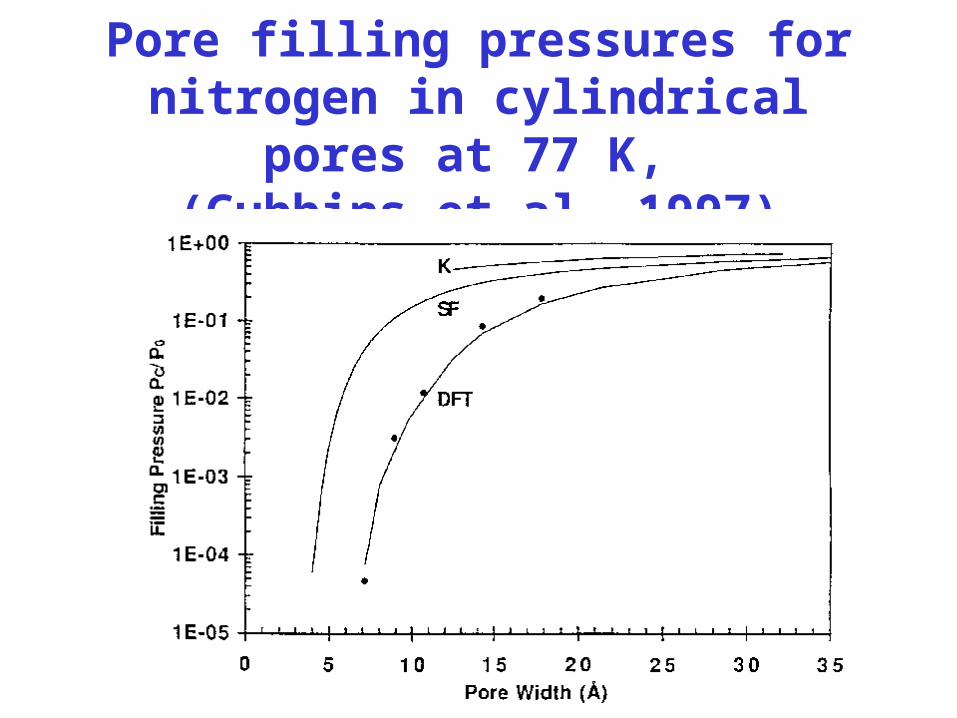
Pore filling pressures for nitrogen in cylindrical pores at 77 K,
(Gubbins et al. 1997)
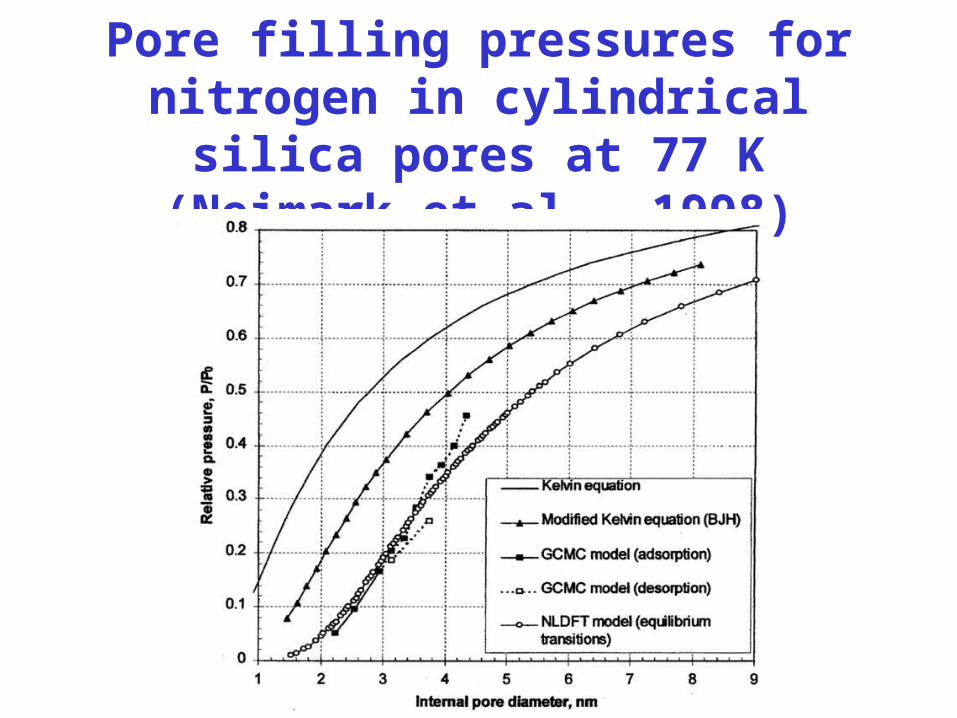
Pore filling pressures for nitrogen in cylindrical silica pores at 77 K
(Neimark et al., 1998)
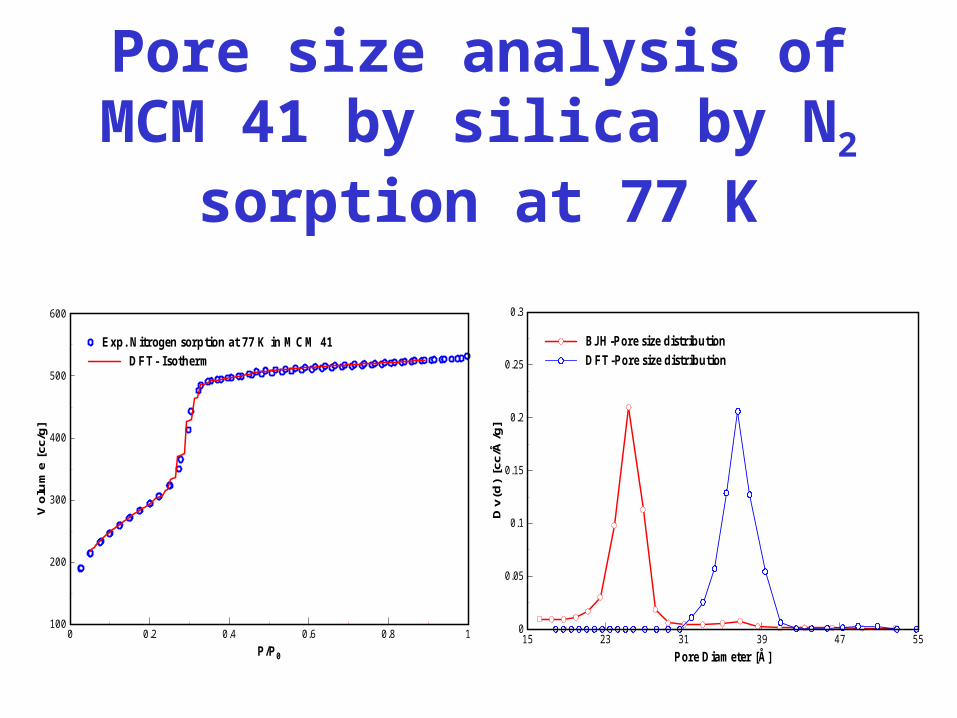
Pore size analysis of MCM 41 by silica by N2 sorption at 77 K
0 0.2 0.4 0.6 0.8 1P/P0
100
200
300
400
500
600
Vol
ume
[cc/
g]
Exp. Nitrogen sorption at 77 K in MCM 41Exp. Nitrogen sorption at 77 K in MCM 41DFT- IsothermDFT- Isotherm
15 23 31 39 47 55Pore Diameter [Å]
0
0.05
0.1
0.15
0.2
0.25
0.3
Dv(
d) [
cc/Å
/g]
BJH-Pore size distribution BJH-Pore size distribution DFT-Pore size distributionDFT-Pore size distribution
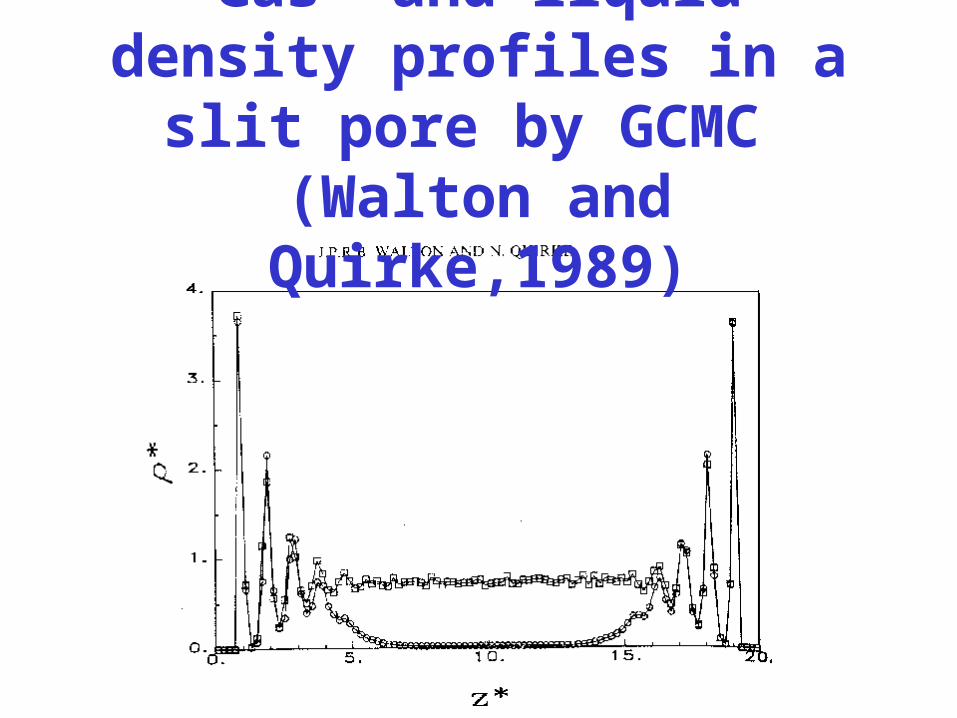
Gas- and liquid density profiles in a slit pore by GCMC
(Walton and Quirke,1989)
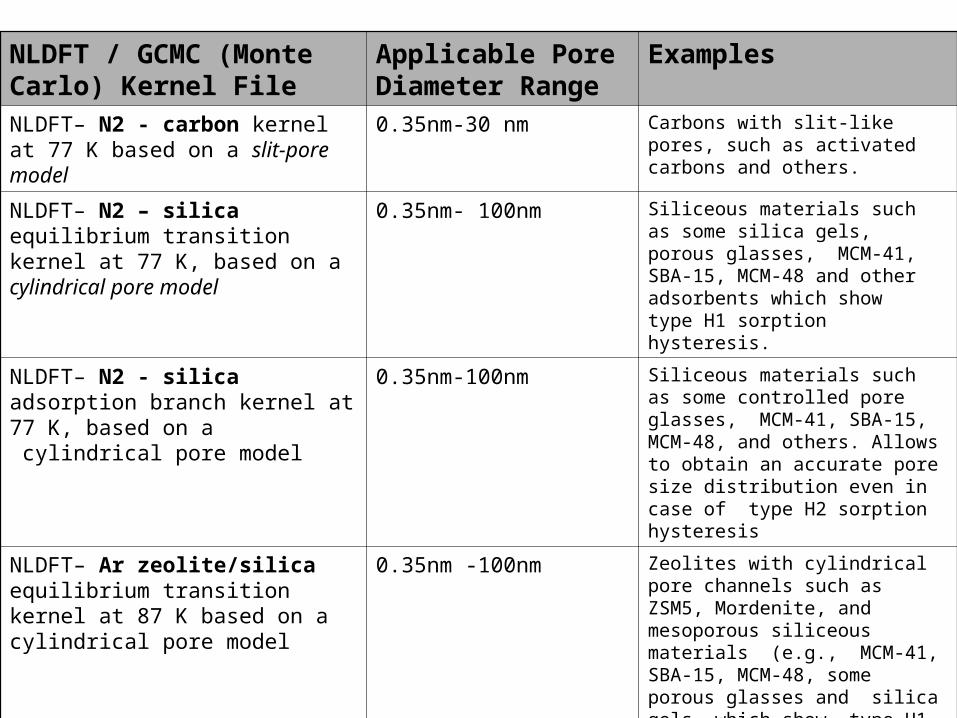
NLDFT / GCMC (Monte Carlo) Kernel File
Applicable Pore Diameter Range
Examples
NLDFT– N2 - carbon kernel at 77 K based on a slit-pore model
0.35nm-30 nm Carbons with slit-like pores, such as activated carbons and others.
NLDFT– N2 – silica equilibrium transition kernel at 77 K, based on a cylindrical pore model
0.35nm- 100nm Siliceous materials such as some silica gels, porous glasses, MCM-41, SBA-15, MCM-48 and other adsorbents which show type H1 sorption hysteresis.
NLDFT– N2 - silica adsorption branch kernel at 77 K, based on a cylindrical pore model
0.35nm-100nm Siliceous materials such as some controlled pore glasses, MCM-41, SBA-15, MCM-48, and others. Allows to obtain an accurate pore size distribution even in case of type H2 sorption hysteresis
NLDFT– Ar zeolite/silica equilibrium transition kernel at 87 K based on a cylindrical pore model
0.35nm -100nm Zeolites with cylindrical pore channels such as ZSM5, Mordenite, and mesoporous siliceous materials (e.g., MCM-41, SBA-15, MCM-48, some porous glasses and silica gels which show type H1 sorption hysteresis).
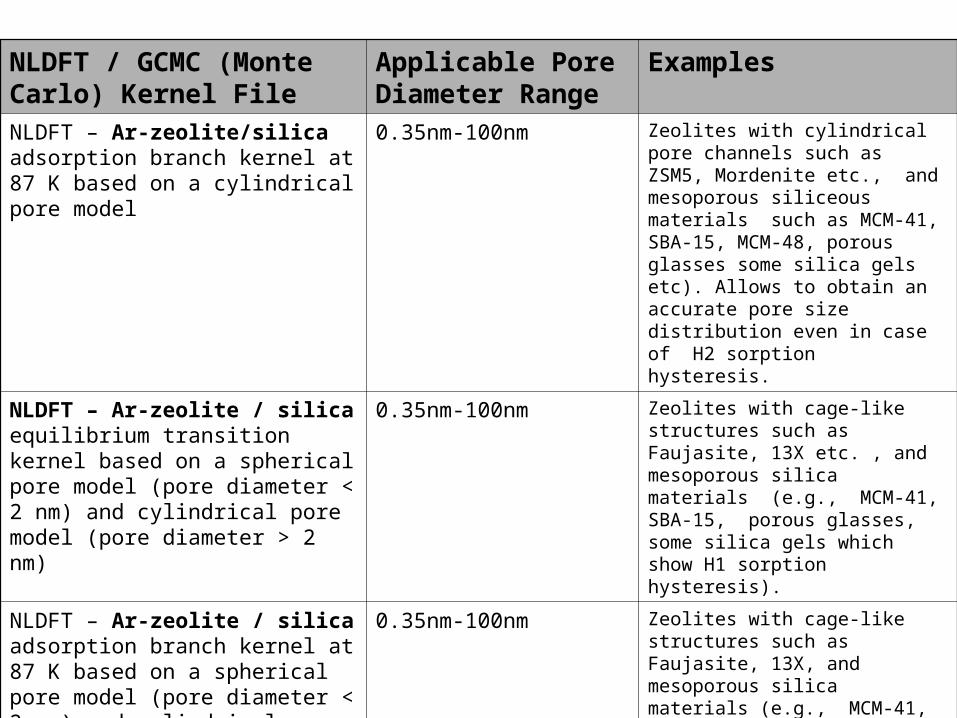
NLDFT / GCMC (Monte Carlo) Kernel File
Applicable Pore Diameter Range
Examples
NLDFT – Ar-zeolite/silica adsorption branch kernel at 87 K based on a cylindrical pore model
0.35nm-100nm Zeolites with cylindrical pore channels such as ZSM5, Mordenite etc., and mesoporous siliceous materials such as MCM-41, SBA-15, MCM-48, porous glasses some silica gels etc). Allows to obtain an accurate pore size distribution even in case of H2 sorption hysteresis.
NLDFT – Ar-zeolite / silica equilibrium transition kernel based on a spherical pore model (pore diameter < 2 nm) and cylindrical pore model (pore diameter > 2 nm)
0.35nm-100nm Zeolites with cage-like structures such as Faujasite, 13X etc. , and mesoporous silica materials (e.g., MCM-41, SBA-15, porous glasses, some silica gels which show H1 sorption hysteresis).
NLDFT – Ar-zeolite / silica adsorption branch kernel at 87 K based on a spherical pore model (pore diameter < 2 nm) and cylindrical pore model (pore diameter > 2 nm)
0.35nm-100nm Zeolites with cage-like structures such as Faujasite, 13X, and mesoporous silica materials (e.g., MCM-41, SBA-15, controlled-pore glasses and others). Allows to obtain an accurate pore size distribution even in case of H2 sorption hysteresis.
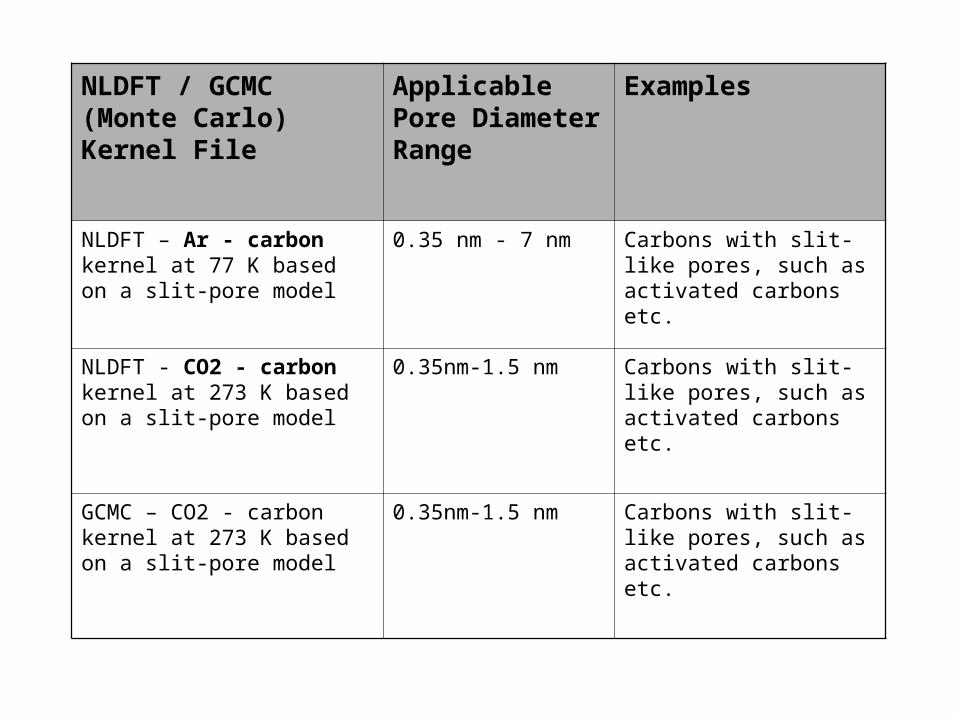
NLDFT / GCMC (Monte Carlo) Kernel File
Applicable Pore Diameter Range
Examples
NLDFT – Ar - carbon kernel at 77 K based on a slit-pore model
0.35 nm - 7 nm Carbons with slit-like pores, such as activated carbons etc.
NLDFT - CO2 - carbon kernel at 273 K based on a slit-pore model
0.35nm-1.5 nm Carbons with slit-like pores, such as activated carbons etc.
GCMC – CO2 - carbon kernel at 273 K based on a slit-pore model
0.35nm-1.5 nm Carbons with slit-like pores, such as activated carbons etc.
RECENT ADVANCES IN THE PORE SIZE ANALYSIS OF MICRO- AND
MESOPOROUS MOLECULAR SIEVES BY ARGON GAS
ADSORPTION
Micropore Size Characterization
• Physical adsorption in micropores, e.g. zeolites occurs at relative pressures substantially lower than in case of adsorption in mesopores.
• Adsorption measurements using nitrogen at 77.4 K is difficult, because the filling of 0.5 - 1 nm pores occurs at P/Po of 10-7 to 10-5
, where the rate of diffusion and
adsorption equilibration is very slow.
Advantages of Using Argon
• Advantage to analyze such narrow micropores by using argon at liquid argon temperature (87.3 K).
• Argon fills these micropores (0.5 – 1nm) at much higher relative pressures (i.e., at relative pressures 10-5 to 10-3) compared to nitrogen.
Advantages of Higher Temperature & Pressure
• Accelerated diffusion.
• Accelerated equilibration processes.
• Reduction in analysis time.
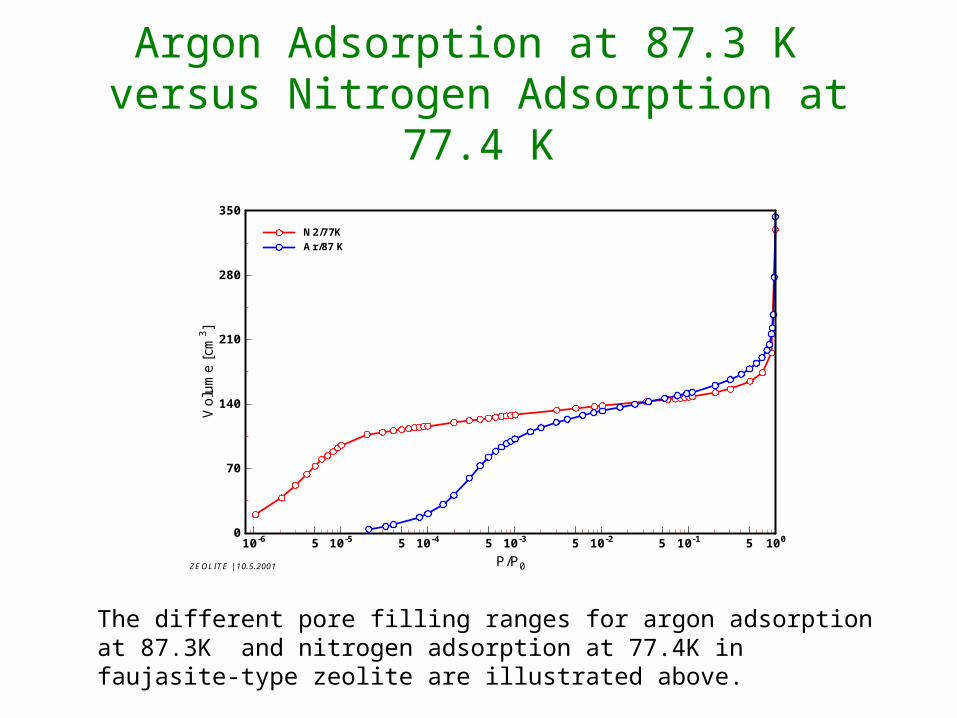
Argon Adsorption at 87.3 K versus Nitrogen Adsorption at 77.4 K
10-6 5 10-5 5 10-4 5 10-3 5 10-2 5 10-1 5 100
P/P0
0
70
140
210
280
350V
olum
e [c
m3 ]
N2/77KN2/77KAr/87 KAr/87 K
ZEOLITE | 10.5.2001
The different pore filling ranges for argon adsorption at 87.3K and nitrogen adsorption at 77.4K in faujasite-type zeolite are illustrated above.
Micropore Size Calculation
• Difficulties are associated with regard to the analysis of micropore adsorption data.
• Classical, macroscopic, theories [1] like DR and semiempirical treatments such those of HK and SF do not give a realistic description of micropore filling
• This leads to an underestimation of pore sizes for micropores and even smaller mesopores [2].
[1] F. Rouquerol, J. Rouquerol & K. Sing, Adsorption by Powders & Porous Solids, Academic Press, 1999
[ 2 ] P. I Ravikovitch, G.L. Haller, A.V. Neimark, Advcances in Colloid and Interface Science 76-77 , 203 (1998)
New Calculation
• To overcome the above mentioned problems we introduce a new method for micropore analysis based on a Non-local Density Functional Theory (NLDFT) model by Neimark and Co-workers [3-5].
• The new DFT-method is designed for micro-mesopore size characterization of zeolitic materials ranging in size from 0.44 to 20 nm using high-resolution low-pressure argon adsorption isotherms at 87.3 K.
[3] P.I. Ravikovitch, G.L. Haller, A.V. Neimark, Advances in Colloid and Interface Science, 76 – 77 (1998), 203 -207
[4] A.V. Neimark, P.I Ravikovitch, M. Gruen, F. Schueth, and K.K. Unger, J. Coll. Interface Sci., 207, (1998) 159
[5] A.V. Neimark, P.I. Ravikovitch, Microporous and Mesoporous Materials (2001) 44-45, 697
Systematic, Experimental Study
• To evaluate the application of argon sorption for micro- and mesopore size analysis of zeolites and mesoporous silica materials including novel mesoporous molecular sieves of type MCM-41 and MCM-48.
• The sorption isotherms were determined using a static volumetric technique
• Samples were outgassed for 12 h under vacuum (turbomolecular pump) at elevated temperatures (573 K for the zeolites and 393 K for MCM-41/MCM-48).
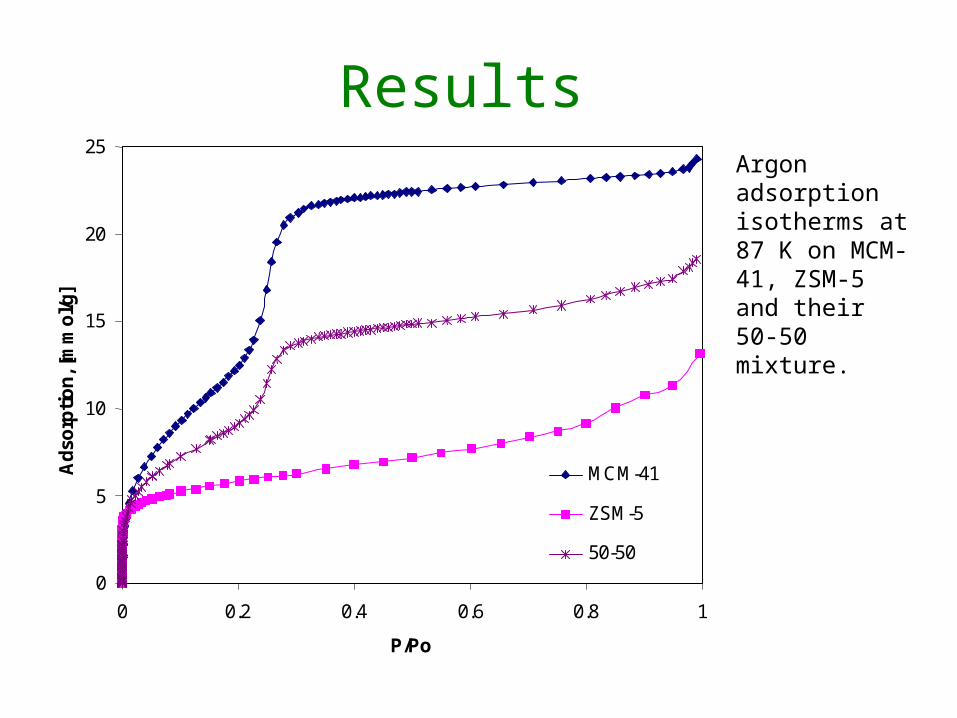
Results
0
5
10
15
20
25
0 0.2 0.4 0.6 0.8 1 P/Po
Ad
sorp
tio
n, [
mm
ol/g
]
MCM-41
ZSM-5
50-50
Argon adsorption isotherms at 87 K on MCM-41, ZSM-5 and their 50-50 mixture.
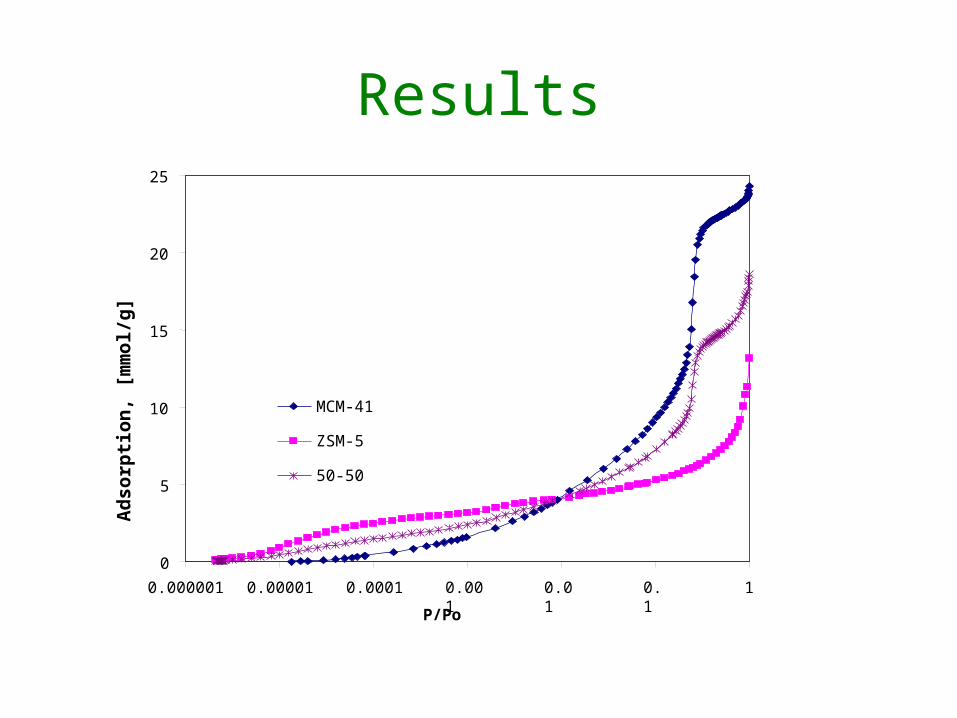
Results
0
5
10
15
20
25
0.000001 0.00001 0.0001 0.001 0.01 0.1 1
P/Po
Ad
sorp
tio
n,
[mm
ol/
g]
MCM-41
ZSM-5
50-50
0
0.02
0.04
0.06
0.08
0.1
0.12
1 10 100 1000D, [Å]
dV/dD [cm3/g
-0.05
0
0.05
0.1
0.15
0.2
0.25
0.3
0.35
0.4
Vcum, [cm3/g]
histogram
integral
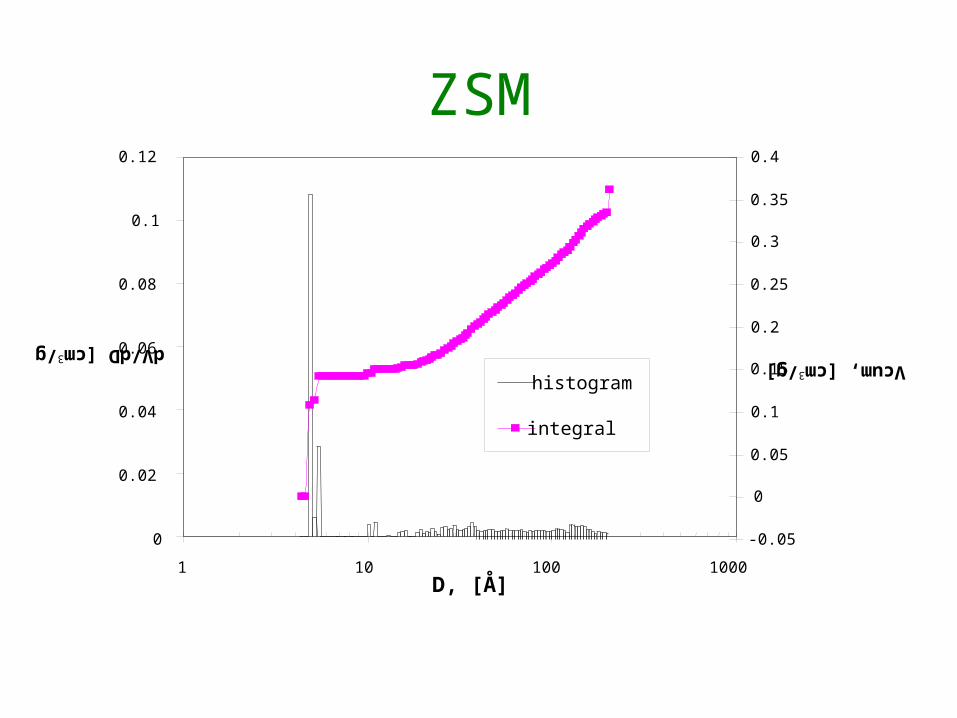
ZSM
0
0.02
0.04
0.06
0.08
0.1
0.12
0.14
0.16
0.18
0.2
1 10 100 1000
D, [Å]
dV/dD [cm3/g]/g]
0
0.1
0.2
0.3
0.4
0.5
0.6
0.7
Vcum, [cm3/g]
histogram
integral
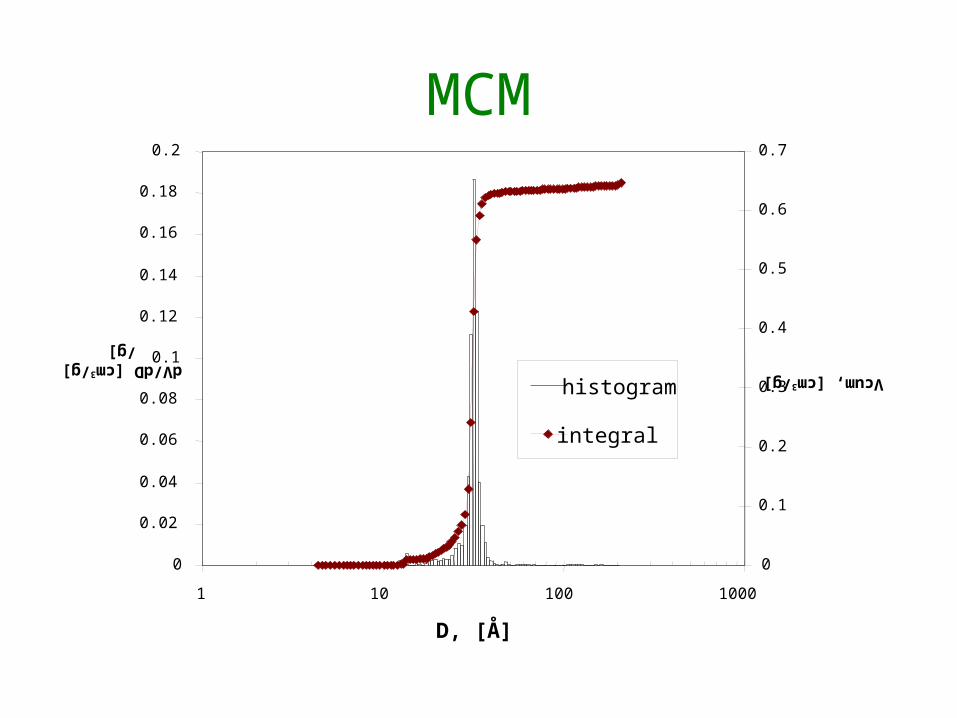
MCM
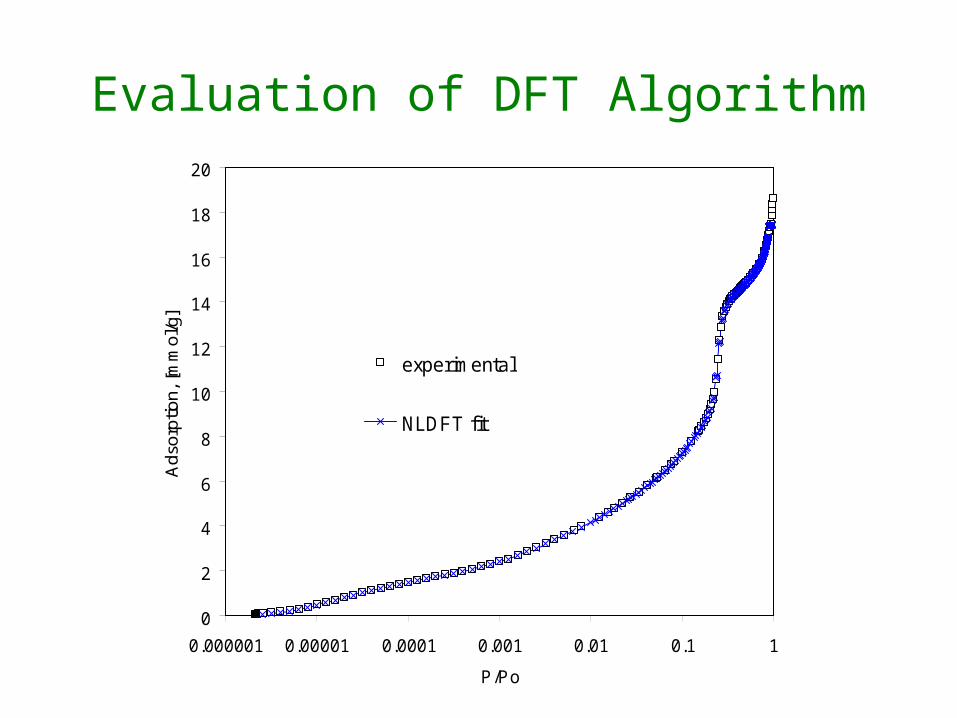
Evaluation of DFT Algorithm
0
2
4
6
8
10
12
14
16
18
20
0.000001 0.00001 0.0001 0.001 0.01 0.1 1
P/Po
Ads
orpt
ion,
[mm
ol/g
]
experimental
NLDFT fit
0
0.01
0.02
0.03
0.04
0.05
0.06
0.07
0.08
0.09
0.1
1 10 100 1000
D, [Å]
dV/dD [cm3/g]
0
0.1
0.2
0.3
0.4
0.5
0.6
Vcum [cm3/g]
histogram
integral
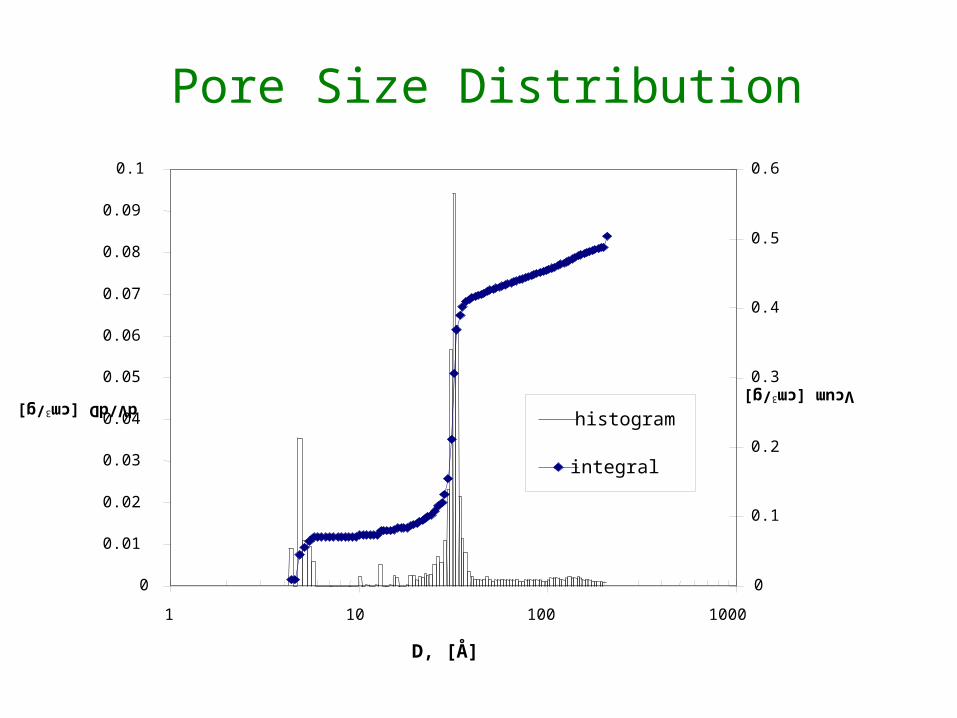
Pore Size Distribution
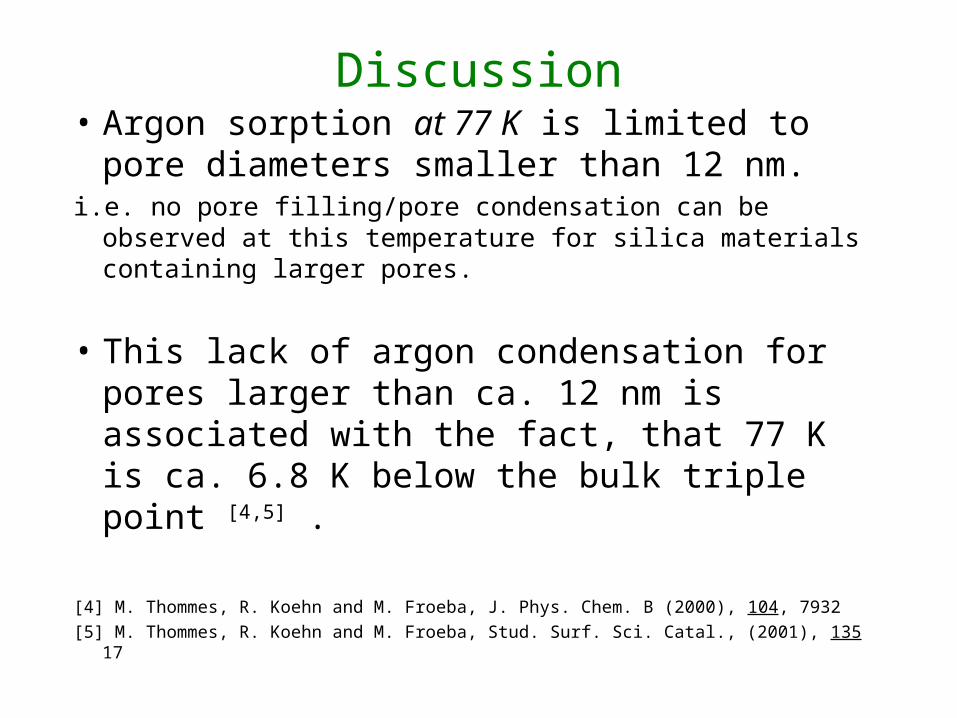
Discussion• Argon sorption at 77 K is limited to pore
diameters smaller than 12 nm.i.e. no pore filling/pore condensation can be observed at this
temperature for silica materials containing larger pores.
• This lack of argon condensation for pores larger than ca. 12 nm is associated with the fact, that 77 K is ca. 6.8 K below the bulk triple point [4,5] .
[4] M. Thommes, R. Koehn and M. Froeba, J. Phys. Chem. B (2000), 104, 7932
[5] M. Thommes, R. Koehn and M. Froeba, Stud. Surf. Sci. Catal., (2001), 135 17
Discussion
• These limitation do not exist for argon sorption at its’ boiling temperature, i.e. ca. 87 K.
• Pore filling and pore condensation can be observed over the complete micro- and mesopore size range .
Discussion
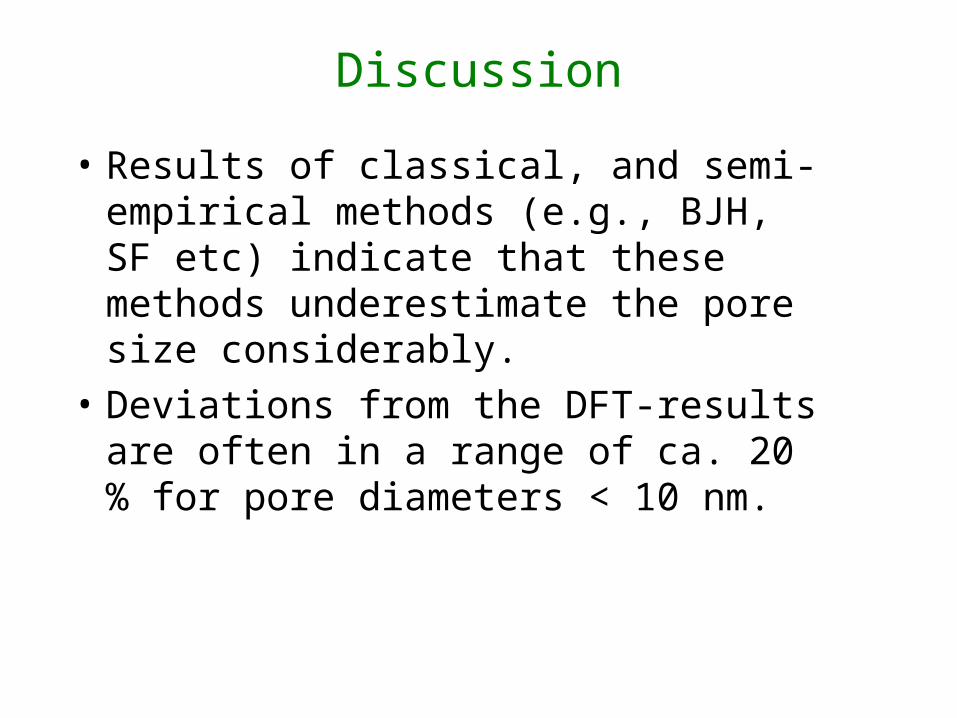
• Results of classical, and semi-empirical methods (e.g., BJH, SF etc) indicate that these methods underestimate the pore size considerably.
• Deviations from the DFT-results are often in a range of ca. 20 % for pore diameters < 10 nm.
Summary
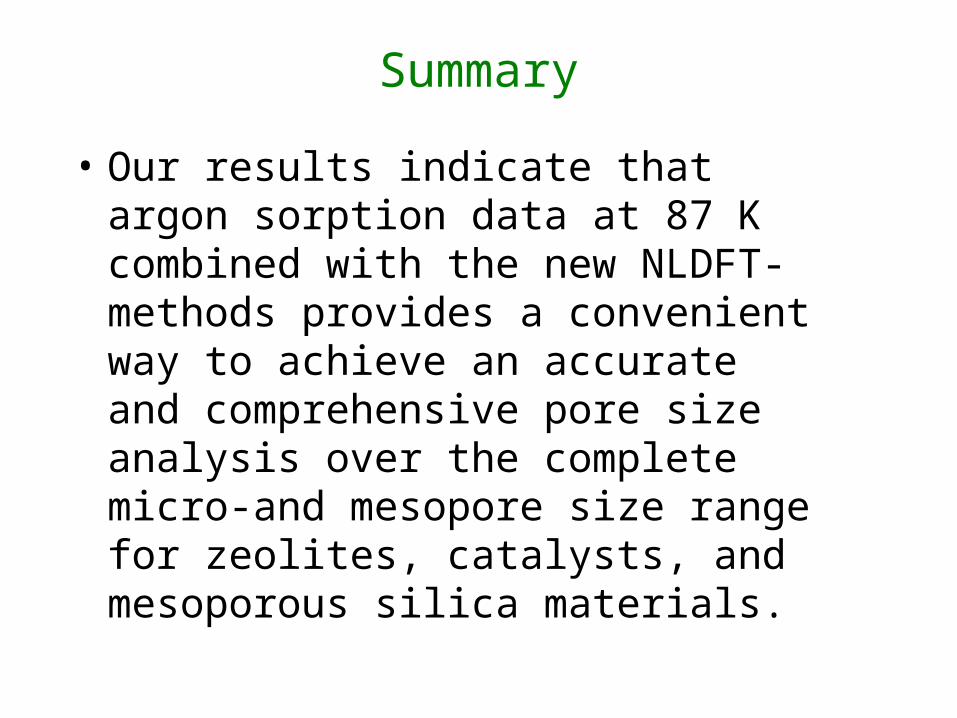
• Our results indicate that argon sorption data at 87 K combined with the new NLDFT-methods provides a convenient way to achieve an accurate and comprehensive pore size analysis over the complete micro-and mesopore size range for zeolites, catalysts, and mesoporous silica materials.

Acknowledgements
• Special thanks go to Alex Neimark and Peter Ravikovitch at TRI Princeton, New Jersey, USA.
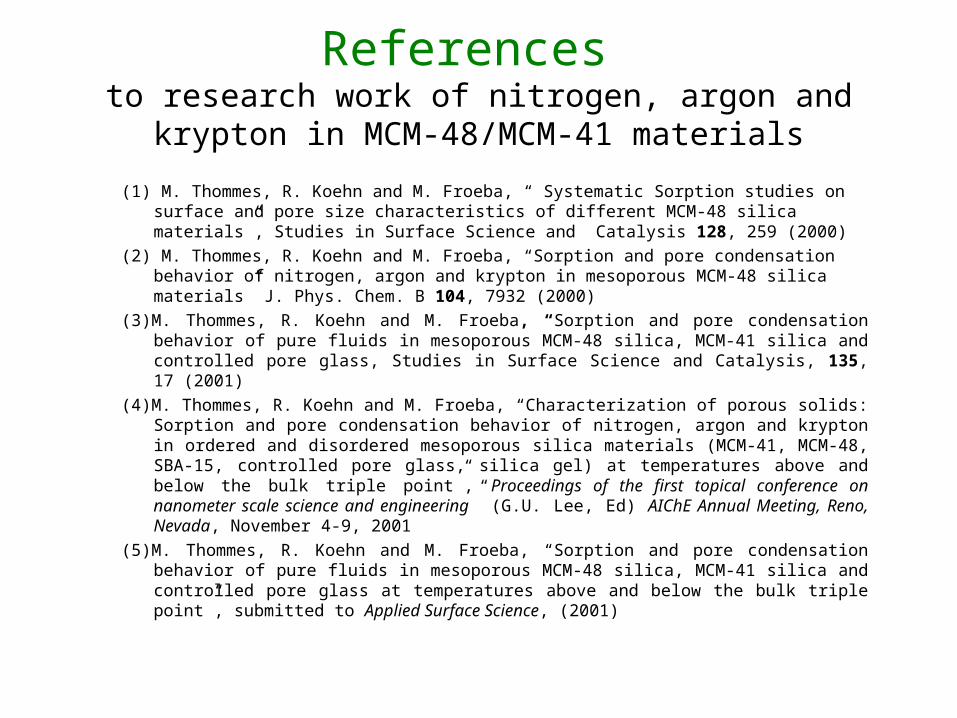
References to research work of nitrogen, argon and krypton
in MCM-48/MCM-41 materials
(1) M. Thommes, R. Koehn and M. Froeba, “ Systematic Sorption studies on surface and pore size characteristics of different MCM-48 silica materials”, Studies in Surface Science and Catalysis 128, 259 (2000)
(2) M. Thommes, R. Koehn and M. Froeba, “Sorption and pore condensation behavior of nitrogen, argon and krypton in mesoporous MCM-48 silica materials” J. Phys. Chem. B 104, 7932 (2000)
(3)M. Thommes, R. Koehn and M. Froeba, “Sorption and pore condensation behavior of pure fluids in mesoporous MCM‑48 silica, MCM-41 silica and controlled pore glass, Studies in Surface Science and Catalysis, 135, 17 (2001)
(4)M. Thommes, R. Koehn and M. Froeba, “Characterization of porous solids: Sorption and pore condensation behavior of nitrogen, argon and krypton in ordered and disordered mesoporous silica materials (MCM-41, MCM-48, SBA-15, controlled pore glass, silica gel) at temperatures above and below the bulk triple point”, Proceedings of the first topical conference on nanometer scale science and engineering” (G.U. Lee, Ed) AIChE Annual Meeting, Reno, Nevada, November 4-9, 2001
(5)M. Thommes, R. Koehn and M. Froeba, “Sorption and pore condensation behavior of pure fluids in mesoporous MCM-48 silica, MCM-41 silica and controlled pore glass at temperatures above and below the bulk triple point”, submitted to Applied Surface Science, (2001)
Rapid Micropore Size Analysis by CO2
Adsorption
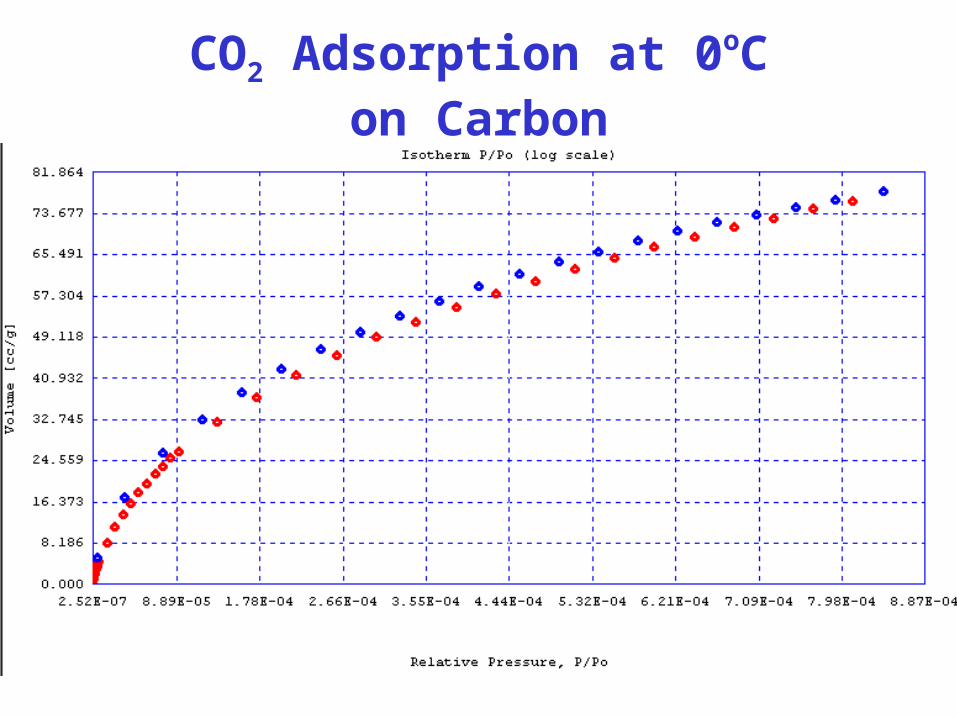
CO2 Adsorption at 0oCon Carbon
RAPID MICROPORE ANALYSIS
• The advantages of micropore analysis with Quantachrome’s Density Functional Theory (DFT) and CO2 include:
• Speed of analysis; with the higher diffusion rate at 273.15K, analysis times are reduced as much as 90%.
• Carbon dioxide at 273.15K permits probing pores from about 2 angstroms (0.2 nm).
DFT ADVANTAGE
DFT has recently been applied to describe the behavior of fluids that are confined in small pores. The current popular gas sorption models, e.g. BJH, HK, SF, DA, etc., assume that the density of the adsorbed phase remains constant, regardless of the size of the pores that are being filled. Packing considerations suggest that these models are less than satisfactory for analyses of pores less than 2 nm.
DFT “Fitting”
• For a given adsorbate-adsorbent system, DFT calculates the most likely summation of "ideal isotherms“ calculated from "ideal pores" of fixed sizes needed to match the experimental results.
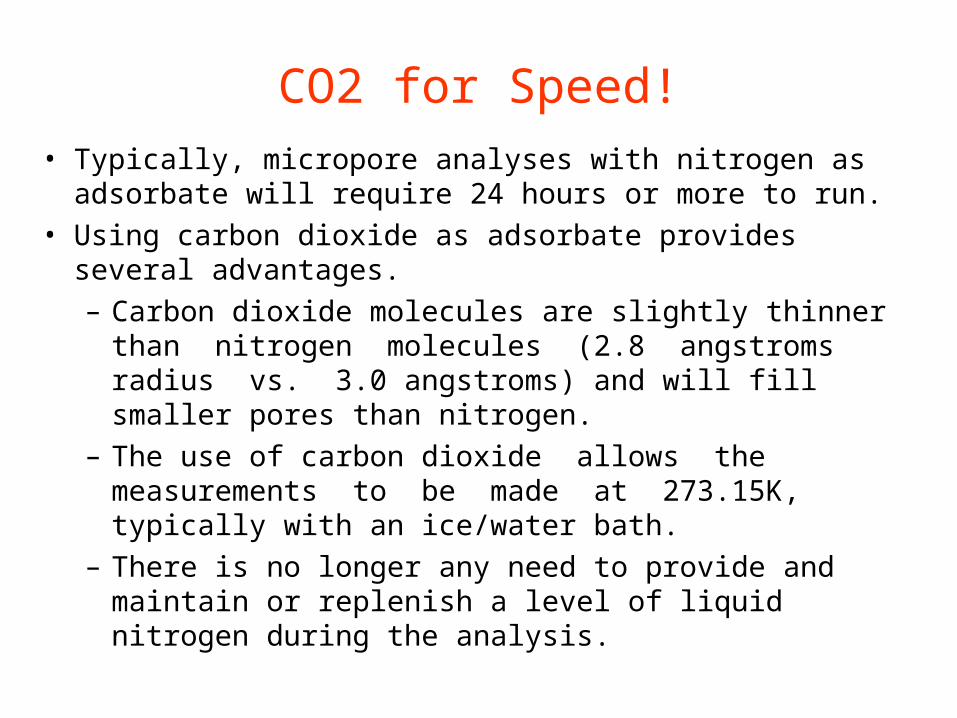
CO2 for Speed!• Typically, micropore analyses with nitrogen as adsorbate
will require 24 hours or more to run. • Using carbon dioxide as adsorbate provides several
advantages. – Carbon dioxide molecules are slightly thinner than
nitrogen molecules (2.8 angstroms radius vs. 3.0 angstroms) and will fill smaller pores than nitrogen.
– The use of carbon dioxide allows the measurements to be made at 273.15K, typically with an ice/water bath.
– There is no longer any need to provide and maintain or replenish a level of liquid nitrogen during the analysis.
CO2 Benefits
• At this temperature, the diffusion rate of molecules moving through small and tortuous micropores is much higher than at 77.35K. This so-called "activated adsorption" effect led to the popularization of the use of carbon dioxide to characterize carbonaceous material since the early 1960s.
CO2 Benefits
• This higher diffusion rate is responsible for reducing the analysis time to a few hours for a complete adsorption experiment. The faster rate also provides for the possibility of using larger samples than with nitrogen adsorption, thus reducing sample weighing errors.
• Pore size distributions thus obtained are comparable to those from a 24-hour nitrogen/77.35K analysis.
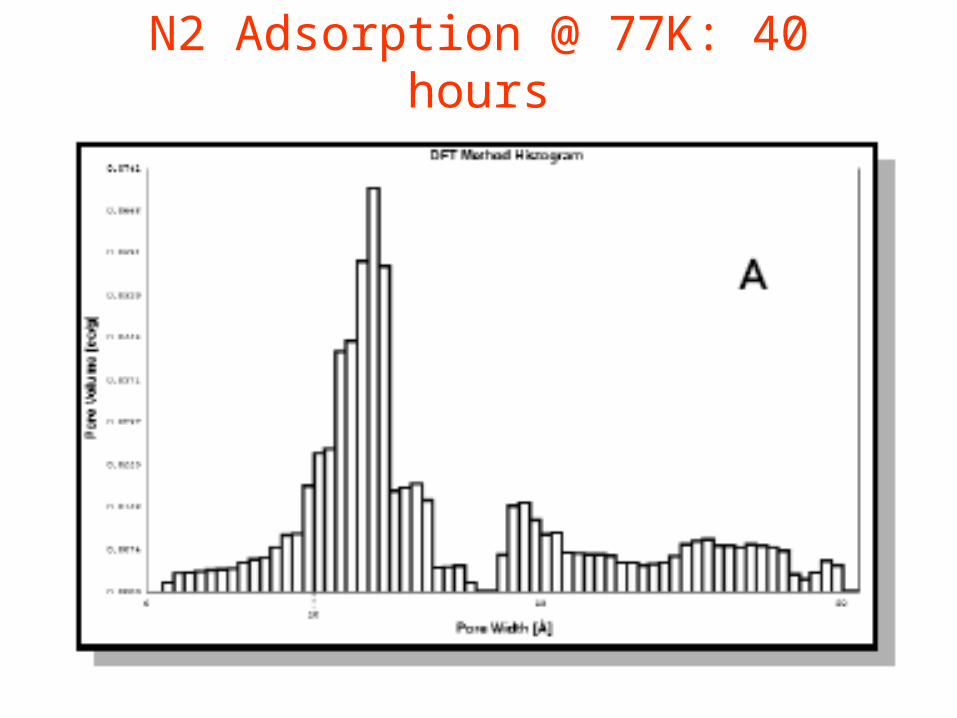
N2 Adsorption @ 77K: 40 hours
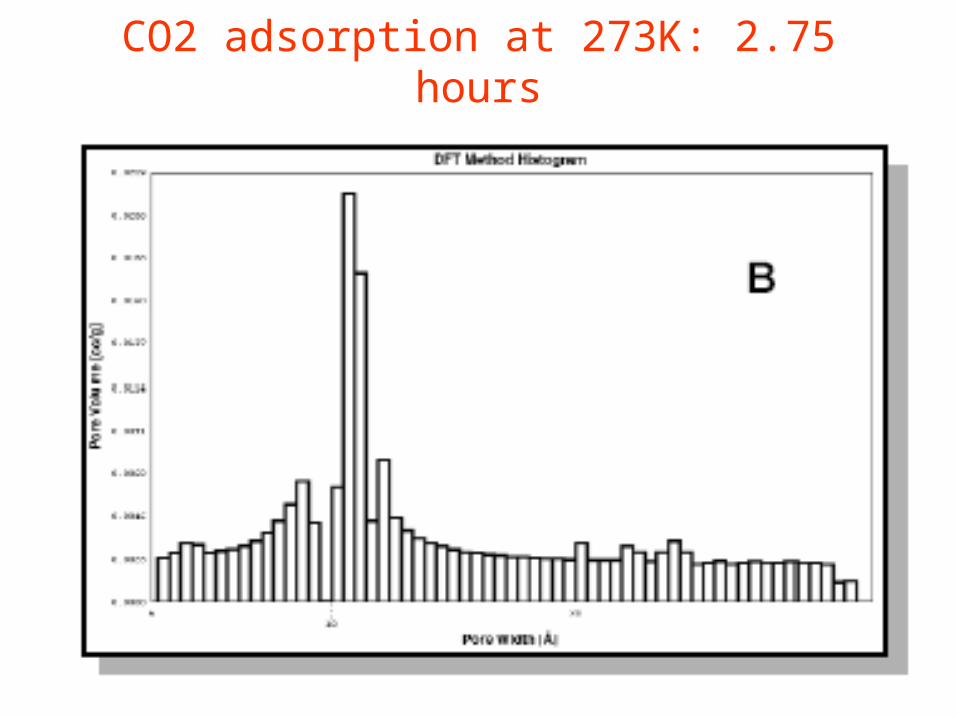
CO2 adsorption at 273K: 2.75 hours
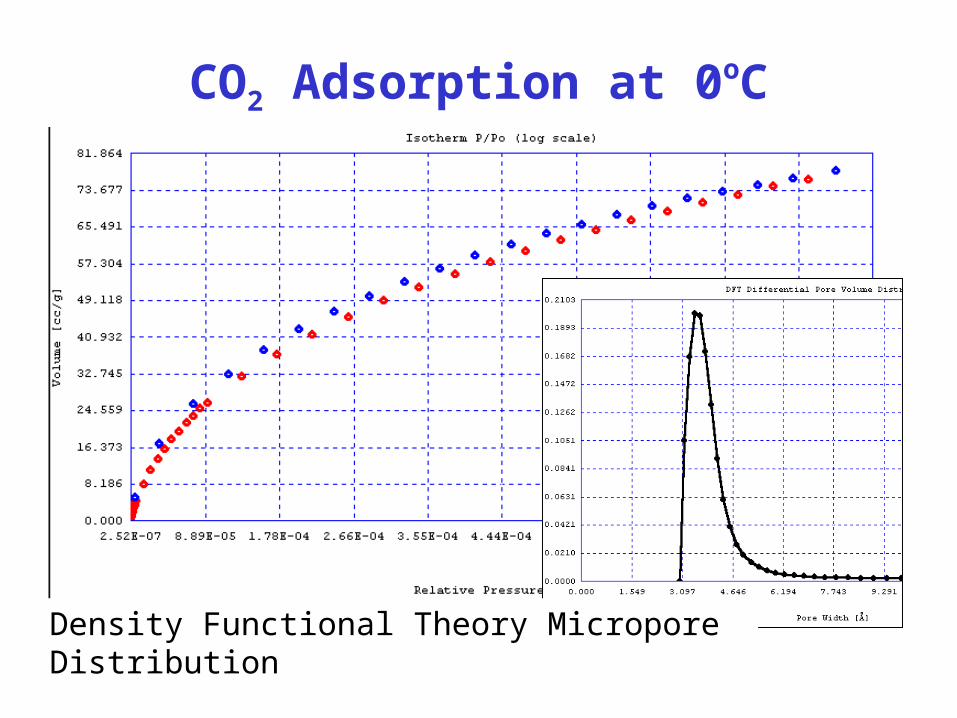
CO2 Adsorption at 0oC
Density Functional Theory Micropore Distribution
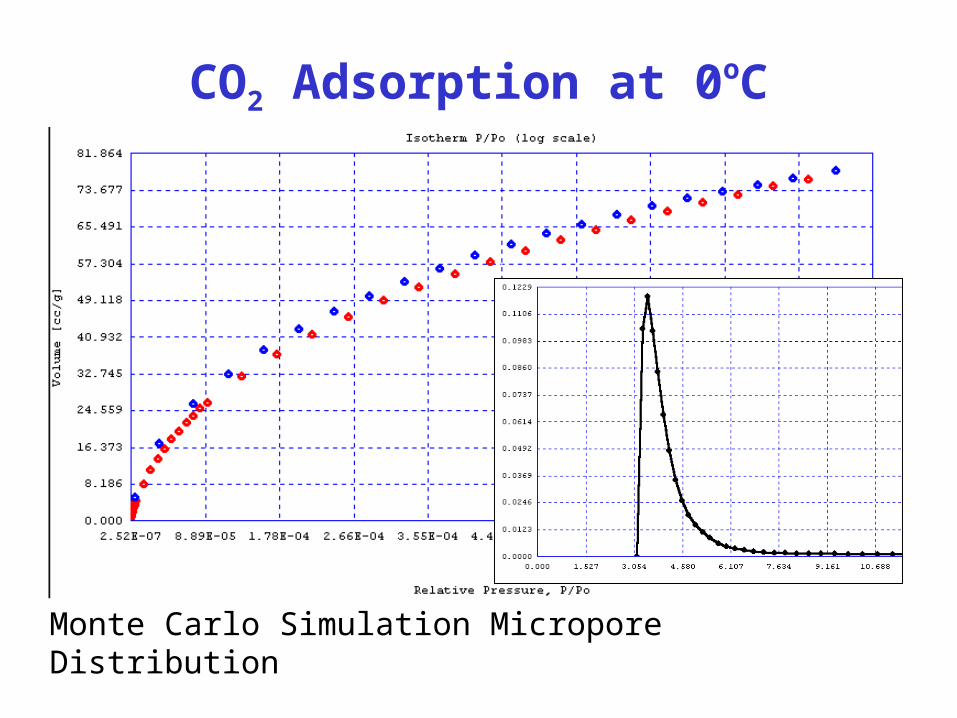
CO2 Adsorption at 0oC
Monte Carlo Simulation Micropore Distribution
How to do it?• Hardware requirements for this new method are
minimal: – a wide- mouth dewar and – a water-level sensor.
• The proprietary Quantachrome Autosorb® software provides the DFT data reduction capabilities to do the rest. Pore size distributions from about 2 angstroms can be determined from the data taken at 273.15K.
• Currently, calculation parameters are optimized for studies on carbon surfaces.
BIBLIOGRAPHY for Rapid Micropore Size Analysis by CO2 Adsorption
1. J. Garrido, A. Linares-Solano, J.M. Martin-Martinez, M. Molina-Sabio, F. Rodriguez-Reinoso, R. Torregosa Langmuir, 3, 76, (1987)
2. F. Carrasco-Martin, M.V. López-Ramón, C. Moreno-Castilla. Langmuir, 9, 2758 (1993)
3. P. Tarazona. Phys.Rev.A 31, 2672 (1985)
4. N.A. Seaton, J.P.R.B. Walton, N. Quirke. Carbon, 27, 853 (1989)
5. C. Lastoskie, K.E. Gubbins, N. Quirke. J.Phys.Chem., 97, 4786 (1993)
6. J.J. Olivier. Porous Materials 2, 9 (1995)
7. P.I. Ravikovitch, S.C. Ó Domhnaill, A.V. Neimark, F. Schüth, K.K. Unger. Langmuir, 11, 4765 (1995)
8. A.V. Neimark, P.I. Ravikovitch, M. Grün, F. Schüth, K.K. Unger. COPS-IV, 1997 (in press)
9. P.I. Ravikovitch P.I., D. Wei, W.T. Chuen, G.L. Haller,A.V. Neimark. J.Phys.Chem., May 1997
10. E.J. Bottani, V. Bakaev, W.A. Steele. Chem.Eng.Sci. 49, 293 (1994)
11. M.M. Dubinin. Carbon 27, 457 (1989)