sg finans as€¦ · finans the right to use internal models to assess risk, exposures, losses and...
TRANSCRIPT

SG FINANS AS
CAPITAL AND RISK REPORT 2018

CONTENTS
1. INTRODUCTION ............................................................................................................................... 4
1.1. ABOUT SG FINANS ................................................................................................................... 4
1.2. HIGHLIGHTS OF 2018 ............................................................................................................... 4
2. GOVERNANCE AND INTERNAL CONTROL ........................................................................................ 5
2.1. INTERNAL GOVERNANCE, SUPERVISORY AND CONTROL FUNCTIONS .................................... 5
3. RISK MANAGEMENT AND CONTROL ............................................................................................... 8
3.1. BASIS FOR RISK MANAGEMENT AND CONTROL ...................................................................... 8
3.2. RISK MANAGEMENT PRINCIPLES ............................................................................................. 8
3.3. COLLATERAL POLICY ................................................................................................................ 8
4. CAPITAL MANAGEMENT ................................................................................................................ 10
4.1. CAPITAL ADEQUACY ASSESSMENT ........................................................................................ 10
4.2. STRESS TESTING ..................................................................................................................... 10
4.3. REGULATORY REQUIREMENTS .............................................................................................. 11
4.4. CORE CAPITAL AND MINIMUM CAPITAL REQUIREMENT ...................................................... 12
4.5. RISK-WEIGHTED VOLUME (RWA) .......................................................................................... 13
5. CREDIT RISK ................................................................................................................................... 23
5.1. MANAGEMENT OF CREDIT RISK ............................................................................................ 23
5.2. CREDIT RISK APPROACH AND THE IRB SYSTEM ..................................................................... 23
5.3. VALIDATION AND DEFINITIONS ACCORDING TO THE IRB SYSTEM ....................................... 23
5.4. RISK CLASSIFICATION ............................................................................................................. 24
5.5. IRB QUANTITATIVE VALIDATION RESULTS ............................................................................ 25
5.6. EXPOSURES FOR THE IRBA PORTFOLIO ................................................................................. 27
5.7. CREDIT RISK APPROACH – STANDARD METHOD ................................................................... 28
6. FINANCIAL RISK.............................................................................................................................. 29
6.1. FINANCIAL RISK MANAGEMENT ............................................................................................ 29
6.2. INTEREST RATE RISK .............................................................................................................. 29
6.3. CURRENCY RISK ..................................................................................................................... 29
6.4. LIQUIDITY RISK ....................................................................................................................... 29
7. OPERATIONAL RISK ........................................................................................................................ 31
7.1. DEVELOPMENTS IN OPERATIONAL RISK ................................................................................ 31
7.2. OPERATIONAL RISK MANAGEMENT ...................................................................................... 31

TABLES
Table 1 - Overview of own funds and capital adequacy ....................................................................... 12
Table 2 - Reporting methods for credit risk in capital adequacy calculations ...................................... 14
Table 3 - Capital requirements and RWA .............................................................................................. 14
Table 4 - Mapping of own funds ............................................................................................................ 15
Table 5 - Geographical distribution of credit exposures relevant for the calculation of the
countercyclical capital buffer ................................................................................................................ 15
Table 6 - Amount of institution-specific countercyclical capital buffer ................................................ 16
Table 7 - Transitional own funds ........................................................................................................... 16
Table 8 - Capital instruments main features ......................................................................................... 22
Table 9 - Relationship between risk class and probability of default.................................................... 25
Table 10 - Validation results, PD models, LGD model and EAD model ................................................. 26
Table 11 - Validation results, Expected loss .......................................................................................... 26
Table 12 - Exposure for the IRBA-approved portfolio split by industry ................................................ 27
Table 13 - Exposure for the IRBA-approved portfolio split by risk class ............................................... 28

4 INTRODUCTION
1. INTRODUCTION
This report contains information about risk management, risk measurement and capital adequacy
based on the requirements stated in the capital adequacy regulations (“Kapitalforskriften”),
implementing parts of the Capital Requirements Regulation (CRR), part Eight. This report is published
annually, with the exception of information about capital regulations and minimum requirements
and the capital position, which are also reported on a quarterly basis to Finanstilsynet in the form of
the common reporting. It is made available on the company’s website and a printed copy will be
delivered on request.
1.1. ABOUT SG FINANS
SG Finans AS is Norway's leading finance company within equipment leasing and factoring. The
company's products are marketed under the trade marks Société Générale Equipment Finance and
Société Générale Factoring. SG Finans AS is represented in Norway, Sweden and Denmark and is part
of Société Générale Equipment Finance in the Société Générale Group. The purpose of the company
is to cover the needs of Nordic trade and industry for high-capital equipment, liquidity and
administrative services through flexible financial solutions.
1.2. HIGHLIGHTS OF 2018
A key milestone was reached early 2014, when the French and the Norwegian regulators confirmed
their validation on the use of internal models for calculation of regulatory capital requirements for
our main portfolios. The approved portfolios are, for equipment loan and leasing, Large Corporates
and SMEs in Sweden and Norway, representing approximately 60 per cent of the total portfolio. The
regulators validated models for rating of clients and assessment of financed assets, thus giving SG
Finans the right to use internal models to assess risk, exposures, losses and capital requirements
according to the advanced method. For SG Finans, this is a recognition of the robustness and
maturity of our strategies, policies, organisation and procedures to assess and manage the risks we
take.
SG Finans has during 2016 sent applications for permission to use the advanced IRB approach on the
Danish portfolio consisting of leasing contracts and the Norwegian factoring portfolio (i.e. financing
of receivables). In addition SG Finans has requested validation from the regulator for the use of
revised PD models for the Norwegian and Swedish leasing portfolios in the calculation of capital
requirements.
With the new law on financial companies entering into force in Norway from 1 January 2016, SG
Finans has aligned its governance structure with the new legal requirements. This has led to changes
to the company Articles of Association (“vedtekter”), with among others the removal of the
Committee of Representatives and the Control Committee further to the Shareholders’ meeting in
March 2016. Pt. 3 below is updated in accordance with these changes.

5 GOVERNANCE AND INTERNAL CONTROL
2. GOVERNANCE AND INTERNAL CONTROL
This section of the report addresses SG Finans’ internal governance model and the governing bodies.
2.1. INTERNAL GOVERNANCE, SUPERVISORY AND CONTROL
FUNCTIONS
SG Finans monitors aggregated risks via dedicated committees and through reporting and
supervision at Group level. Below is an illustration of governing bodies in SG Finans.
SUPERVISORY FUNCTIONS
SHAREHOLDERS’ MEETING
BOARD OF DIRECTORS
COMMITTEES OF THE BOARD
- AUDIT COMMITTEE - RISK COMMITTEE - COMPENSATION COMMITTEE
MANAGEMENT COMMITTEE
OPERATIONAL RISK CREDIT RISK FINANCIAL / STRUCTURAL RISK
HUMAN RESOURCES
- OPERATIONAL RISK
AND COMPLIANCE COMMITTEE (ORCC)
- ANTI MONEY LAUNDERING COMMITTEE (AML)
- NEW PRODUCT COMMITTEE
- RISK
MANAGEMENT COMMITTEE (RMC)
- CREDIT COMMITTEE (DSK)
- ASSET AND
LIABILITY COMMITTEE (ALCO)
- REMUNERATION
AND RECRUITMENT COMMITTEE (LAR)
RISK CONTROL
INTERNAL AUDIT
EXTERNAL AUDIT
SG Finans’ control and management model is intended to ensure independence in relation to
decisions and reporting. Below we present briefly the main governing bodies in SG Finans.

6 GOVERNANCE AND INTERNAL CONTROL
Board of Directors The Board of Directors has the ultimate responsibility for monitoring the risk exposure as well as for
deciding the risk appetite for SG Finans. The Board of Directors also approves the company’s
strategy, business plans, budgets and monitors development of the company’s activities. The role
and functions of the Board of Directors are defined in the Financial Institutions Act and the Limited
Liability Companies Act. The Board meets regularly and at least quarterly.
Committees of the Board The Board has established three different sub-committees to support the Board with advice
regarding all aspects of the company; Audit-, Risk- and the Compensation Committee.
The purpose of the Audit Committee is to be an advisory committee for the Board in all matters
related to the oversight and monitoring of financial reporting, control activities performed by
external (statutory) and internal audit functions, the relationship between the Board and the
company’s auditors, in particular internal audit, and in the assessment of internal control in the
company.
The purpose of the Risk Committee is to be an advisory committee to the Board in all matters
relating to the company's overall current and future risk appetite and strategy. It shall assist the
Board in overseeing the implementation of such a strategy by senior management and it shall also
review the appropriateness of pricing of products in relation to the company's business model and
risk strategy.
The Compensation Committee is responsible for the preparation and implementation of a
compensation policy in compliance with the CRDIV directive and the Norwegian statutory provisions
on remuneration schemes in financial institutions.
Management Committee The Management Committee is composed of the relevant managers of SG Finans AS, and monitors
development of the company’s operations against agreed strategy, business plan and targets.
Credit Committee (DSK) DSK is the central credit committee. DSK, or staff in the central credit department, reviews and
decides on credit cases above locally delegated credit authorisations, within credit authorisations
delegated to the committee. DSK also decides on credit cases of principal nature. The members are
the Managing Director, Credit Director and Deputy Director Credit.
Risk Management Committee (RMC) RMC monitors development in the economy / market, the portfolio, main credit risks, including main
clients, watch list, defaults, provisions and repossessed assets. The members are Managing Director,
Deputy Managing Director / CFO, Risk Director, Head of Risk Management, Head of Internal Audit
and business managers.
Asset & Liability Management Committee (ALCO) ALCO is responsible for monitoring the entity’s financial risks (interest rate, currency and liquidity
risk), balance sheet management and stress-testing and monitoring of the capital situation of the

7 GOVERNANCE AND INTERNAL CONTROL
company. Members are Managing Director, Deputy Managing Director / CFO, Risk Director, Head of
Treasury, Head of Risk Management, Financial Risk Controller and business managers Equipment and
Factoring.
Operational Risk and Compliance Committee (ORCC) ORCC is responsible for the monitoring of the entity’s operational risk situation, including compliance
to Group operational risk management principles and methodology and monitor compliance to
internal and external requirements. Members are Managing Director, Deputy Managing Director /
CFO, Risk Director, Head of Compliance, Head of Internal Audit and Head of Risk Management.
Anti-Money Laundering Committee (AML): AML committee is responsible for the monitoring of controls and procedures related to prevention
and detection of anti-money laundering acts and/or transactions. Members include representatives
from management, Head of Compliance, AMLO (Deputy Managing Directory), risk organisation and
the business.
8 RISK MANAGEMENT AND CONTROL
3. RISK MANAGEMENT AND CONTROL
Risk management is governed by principles and guidelines stated in policies, guidelines and
instructions in effect throughout the organisation.
3.1. BASIS FOR RISK MANAGEMENT AND CONTROL
The key principle for the management of risks in SG Finans is the three lines of defence.
▪ The first line of defence is represented by the Business Area functions responsible for their
own daily risk management, in accordance with the respective policies, and for operating
their business within applicable limits and in accordance with the framework for internal
control.
▪ The second line of the defence is independent control functions responsible for activities
such as independently monitoring, controlling and reporting of issues related to key risks,
including compliance with internal and external regulations. The second line of defence is
also responsible for the coordination across units and setting the premises for risk
management.
▪ Internal Audit, representing the third line of defence, performs audits and provides
assurance on governance, risk management and internal control.
As part of the Société Générale Group, SG Finans has continued the development of its principles and
framework for internal control and risk management to the standards of the group. The primary
purpose of risk management is to optimize the balance between the risk of losses and the potential
earnings, thereby securing that the firm is not undertaking unintentional risks.
3.2. RISK MANAGEMENT PRINCIPLES
The company’s principles for risk management are presented in more detail in the notes to the
financial statements, cf in particular the note 18 on Risk Management. SG Finans has a policy of
prudent risk taking, where the fundamental principle is that the company shall earn money on credit
and / or object risk, while other risks are managed, hedged or limited within defined limits, or in case
no limits are defined, to the extent practicable. In the business of financing assets (equipment
leasing) and receivables (factoring) credit risk is the most important risk for the company. Effectively
managing credit risk is fundamental. The company has implemented credit policies, organising
procedures and regulations as well as models which address this need. SG Finans has developed
classification models for risk assessment and management of credits, which provide a good view of
the risk profile of the portfolio. The classification builds on debtor solidity and market value
assessments of the assets.
3.3. COLLATERAL POLICY
As an asset financing company, the main collateral for SG Finans is the financed asset, where SG
Finans typically has ownership (leasing) or pledge in the asset (loan, hire purchase). There are
however one significant difference related to realization regarding type of product. For a leasing
contract, SG Finans has ownership over the financed asset, and can end with realising a gain further
to repossession and sale of an asset from a defaulted contract if the realisation of the financed object

9 RISK MANAGEMENT AND CONTROL
exceeds the outstanding exposure. This is not the case for a loan exposure where the counterpart
will receive any potential profit.
To ensure sufficient collateral SG Finans may require additional collateral security than the financed
object(s) in order to reduce credit risk. Accepted forms of collateral include vendor buyback
guarantees, third party guarantees and bank guarantees. Furthermore, SG Finans may take collateral
in equities, machinery and plant, real estate, factoring claims etc.
Other collateral as mentioned above is indirectly inherent in the LGD (Loss given default) model, due
to the fact that recovery estimates total recovery including recovery beyond the realization of the
financed object(s). Estimated PD (Probability of default) does not depend on the financed collateral
or other collateral.
For credit risk, only eligible providers of guarantees and credit derivatives can be recognised under
the standard and IRB approach. SG Finans currently does not take into account providers of
guarantees and this will therefore not have an impact on risk-weighted asset (RWA) calculation.

10 CAPITAL MANAGEMENT
4. CAPITAL MANAGEMENT
The company’s policy for capital management defines the applicable principles and guidelines for
capital planning and management. Moreover, the company is subject to the group’s guidelines for
capital management. The internal guidelines compel the company always to comply with the internal
requirements which are stricter than the local regulatory minimum requirements.
4.1. CAPITAL ADEQUACY ASSESSMENT
All financial institutions subject to regulation of capital (“Kapitalkravsforskriften”) must at all times
keep a sufficient capital based on the extent of the company’s activities and the risk related to these
activities. SG Finans therefore strive to improve the monitoring of relevant business and risk aspects
in order to be efficient in its use of capital. SG Finans’ strategic vision and policy for capital
management are approved by the Board of Directors and well incorporated in the business strategy.
The policy is reviewed at least annually and aims to secure that the internal targets for capital
adequacy is well above local regulatory requirements.
Each year, the Internal Capital Adequacy Assessment Process (ICAAP) is conducted to assess and
stress test all relevant risks and capital requirements under stressed scenarios for the entity. The
ICAAP report is prepared in accordance with the capital adequacy regulations. With effect from 2016,
the stress testing of liquidity risk and measurement of capital requirements to cover liquidity risk, is
analysed and presented in a separate report, Internal Liquidity Assessment Process (ILAAP). Both
ICAAP and ILAAP reports are presented to ALCO and to the Board for validation. Internal audit
performs an independent review of the ICAAP and ILAAP processes, stress testing and reporting.
Finanstilsynet receives a copy of the validated reports. The reports are reviewed and updated
whenever required, and at least annually, to take into account the evolution of external and internal
parameters.
4.2. STRESS TESTING
Stress testing is an important management tool in SG Finans for assessing the risk of losses on credit
exposures in connection with severe changes in macroeconomic conditions. The stress tests are also
used to quantify changes in capital adequacy ratios as a result of these effects. SG Finans’ portfolios
are stress tested annually in line with Finanstilsynet’s regulations in order to identify factors that may
impact developments in credit risk and capital adequacy. The stress tests are incorporated in the
ICAAP and the capital planning process in order to determine how severe changes in the macro-
environment may affect the need for capital. The outcome of the tests will depend on scenarios
published by the Norwegian Central Bank, internal assessment of probable scenarios in which SG
Finans may experience increased risk and the quality and the composition of the current portfolio.
The turbulence in international capital markets since end of 2008, the financial crisis, as well as the
subsequent changes in pricing of capital and risk, are fully taken into consideration in the stress
testing of risks, and in particular in the assessment of liquidity risk in the ILAAP report, risk of access
to further capital and mid-/long-term effects on credit risk.

11 CAPITAL MANAGEMENT
The results of the stress tests confirm SG Finans’ strong position, as the performance stood well
above the set thresholds, showing that SG Finans’ internal capital buffer target for the company is
sufficient to cover the aggregate stress test for the ICAAP and ILAAP, where all scenarios occur at the
same time.
4.3. REGULATORY REQUIREMENTS
The Basel Committee proposed a new international regulatory framework for capital and liquidity for
banks in 2010 (Basel III). The EU has implemented the regulations in its new capital requirements
directive, CRD IV, and capital requirements regulation, CRR. The new regulations entered into force
as from 1 January 2014. Finanstilsynet has adjusted the capital adequacy regulations in line with the
new parts of the CRD IV. The new regulation was approved in August 2014 and entered into force
30th of September 2014. The capital adequacy figures presented in this report follow the CRD
definitions.
The company should hold minimum common equity capital of 4.5% of the calculation basis. The
minimum level of core capital (so-called “tier 1” capital) should be 6% of the calculation basis. The
total capital, including tier 2 capital, should be kept at minimum 8% of calculation basis. In addition
to these minimum requirements, the company should hold capital buffers in the form of core capital,
with at least 2.5% conservation buffer and 3% system risk buffer, and, with effect from 31 December
2017, a countercyclical capital buffer of 2.0%. The countercyclical capital buffer requirement was
increased in 2017 from 1.5 % to 2.0%, whereby Finanstilsynet accepts that the institution applies the
countercyclical capital buffer requirement for portfolios of exposures in other EU countries. For SG
Finans, having a part of our business in the branches in Denmark and Sweden, the effective
countercyclical capital buffer requirement may therefore differ from the Norwegian 2.0%
requirement. The combination of minimum capital requirements and capital buffer requirements
leads to total core capital requirement of 13.5% of calculation basis and total capital adequacy
requirement of 15.5%.
The leverage ratio intends to be a simple ratio that aims to limit the size of banks’ balance sheets.
The leverage ratio compares the Tier 1 prudential capital with the accounting balance sheet/off-
balance sheet, after restatements of certain items. At the end of 2018 SG Finans’ leverage ratio was
13.5 % - well above the regulatory requirement of 3.0 % applied from 30 June 2017.
The overall large exposure limit for SG Finans to a single counterparty or to a group of connected
counterparties is 25% of the total capital at all times.
At the end of 2016, Finanstilsynet informed SG Finans AS about the results of the supervisory review
process for SG Finans (so-called “pillar 2” requirement). Further to Finanstilsynet’s assessment, the
regulator has issued prudential requirements which require that SG Finans “maintain … a TSCR of
9,5% … [which] … includes the minimum own funds requirement of 8% …[and]… an own funds
requirement of 1.5% required to be held in excess of the minimum own funds
requirement…consisting of 100% of Common Equity Tier 1 Capital”. The own funds requirement
applies from 1 January 2017.

12 CAPITAL MANAGEMENT
4.4. CORE CAPITAL AND MINIMUM CAPITAL REQUIREMENT
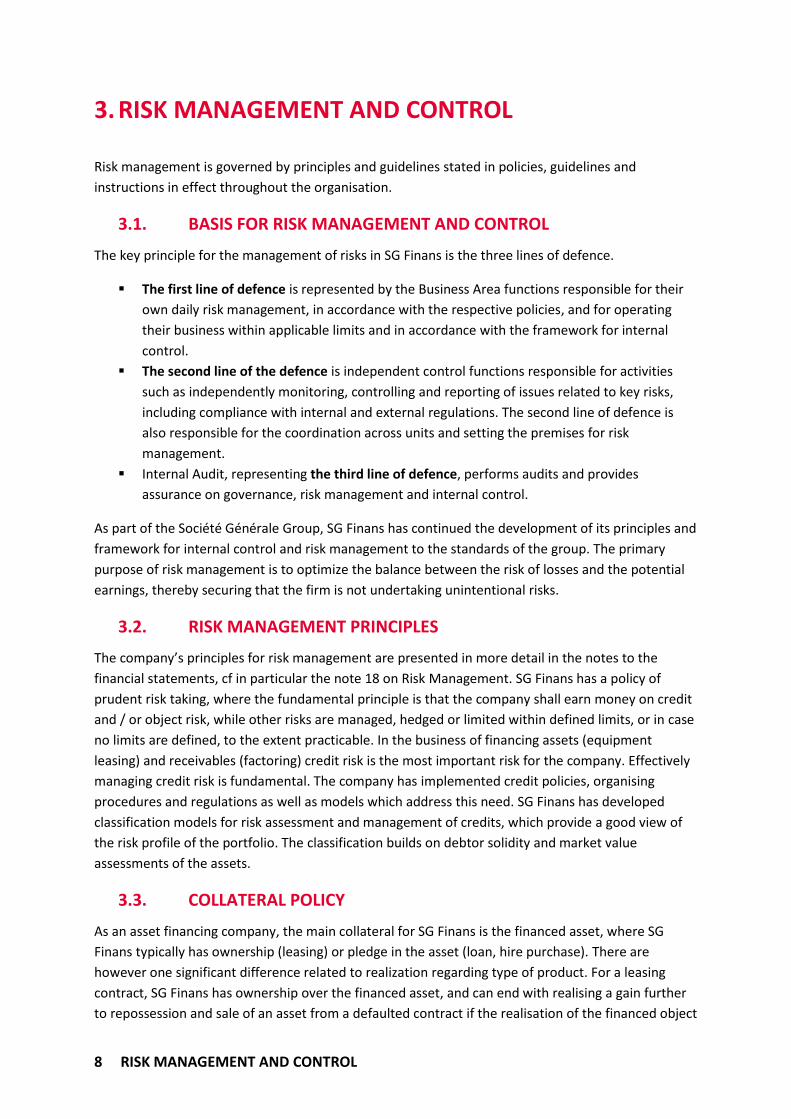
At year-end 2018, SG Finans had a common equity Tier 1 capital ratio of 17.2% and a total capital
adequacy ratio of 18.9%, compared with 17.5% and 21.4%, respectively, a year earlier. These
calculations are based on the Basel II transitional rules. SG Finans’ capital position continues to
improve and SG Finans is well prepared to meet the uncertain economic developments and stricter
capitalisation requirements from the market and the local authority.
Table 1 - Overview of own funds and capital adequacy
13 CAPITAL MANAGEMENT
4.5. RISK-WEIGHTED VOLUME (RWA)
SG Finans is approved by the financial supervisory authority in Norway and France for the use of the
advanced IRB approach when calculating the capital requirements for the main part of the portfolio.
The share of A-IRB approved portfolios represented approximately, as of 31 December 2018, 67.5%
of EAD.
The table below shows the different reporting methods for credit risk used for capital adequacy
calculations divided by portfolio.

14 CAPITAL MANAGEMENT
Table 2 - Reporting methods for credit risk in capital adequacy calculations
Portfolios 31.12.2018 Central governments and central banks Standardised Regional governments and local authorities Standardised Institutions Standardised Corporates Loan/Leasing Norway Advanced IRB Sweden Advanced IRB Denmark Standardised Factoring Norway Standardised
SG Finans uses the advanced IRB approach to calculate capital adequacy for approximately all
loan/leasing exposures in the corporate and SME portfolio. The use of this approach implies that the
bank’s models for expected default rate, loss given default, exposure and maturity are used for both
internal management purposes and capital calculations.
The table below shows exposure at default, average risk weight, RWA and the capital requirements,
distributed by exposure class as of 31 December 2018.
Table 3 - Capital requirements and RWA
1) Due to transitional rules, the minimum capital adequacy requirements cannot be reduced below 80
per cent relative to the Basel standard method requirements.SG Finans is approved by Finanstilsynet
to use Basel II-SA approach when calculating the floor.
EAD Risk weight Risk weighted assets Capital requirement
(in NOK thousand) 31.12.2018 31.12.2018 31.12.2018 31.12.2018
IRBA-method
Corporates 27 083 830 59,4 % 16 093 783 1 287 503
- of which large corporates 7 215 028 62,4 % 4 501 339 360 107
- of which SME 19 868 801 58,3 % 11 592 444 927 396
Sum credit risk, IRBA-method 27 083 830 59,4 % 16 093 783 1 287 503
Standard method
Central governments and central banks 91 854 0,0 % - -
Regional governments and local authorities 1 207 167 18,3 % 220 696 17 656
Institutions 306 295 19,9 % 61 075 4 886
Corporates 11 450 167 89,9 % 10 291 396 823 312
- of which large corporates 4 480 605 93,0 % 4 167 682 333 415
- of which SME 6 969 562 87,9 % 6 123 714 489 897
Sum credit risk, Standard method 13 055 484 81,0 % 10 573 167 845 853
Sum credit risk 40 139 313 66,4 % 26 666 951 2 133 356
Operational risk 2 596 490 207 719
Sub total 29 263 441 2 341 075
Additional capital requirement according to transition rule 1 983 912 158 713
Total 31 247 352 2 499 788

15 CAPITAL MANAGEMENT
Table 4 - Mapping of own funds
Disclosure date 31.12.18
(in NOK thousand)
Assets Balance sheet, as in published annual report
Additional specification
Reference to row in Transitional own funds disclosure
Cash and deposits with central banks 10
Hedging derivative assets 146 466
Due from banks 288 797
Customer loans 37 606 693
Revaluation differences 58 631
Repossessed assets 22 268
Deferred tax assets 16 559
75
Shares and primary capital certificates 0
Tangible and intangible fixed assets 25 112
8
Other assets 104 470
Total assets 38 269 006
Liabilities
Financial liabilities at fair value through profit and loss
507
Hedging derivative liabilities 77 339
Due to banks 31 162 541
Customer deposits 234 642
Other liabilities 537 371
Pension liabilities 85 748
Current tax liabilities 180 162
Subordinated debt 550 216
46
Total liabilities 32 828 526
Equity
Share capital 945 436
1
Share premium account 240 639
1
Other equity including profit for the year 4 254 405
2
Total equity 5 440 480
Total liabilities and equity 38 269 006 Table 5 - Geographical distribution of credit exposures relevant for the calculation of the countercyclical capital buffer
Exposure
value for
standardised
approach
Exposure
value IRB
Sum of long
and short
position of
trading book
Value of
trading book
exposure
for internal
models
Exposure
value for
standardised
approach
Exposure
value
for IRB
Of which:
General
credit
exposures
Of which:
Trading
book
exposures
Of which:
Securitisation
exposures Total
Breakdown
by country
Denmark 6 212 290 922 955 515 685 515 685 0,24 0,00 %
Finland 98 610 2 187 7 976 7 976 0,00 0,00 %
Germany 467 0 37 37 0,00 0,00 %
Norway 5 918 154 21 085 578 1 382 689 1 382 689 0,65 2,00 %
Sweden 818 773 5 064 422 226 181 226 181 0,11 2,00 %
United Kingdom 269 8 687 234 234 0,00 1,00 %
Faroe Islands 989 0 79 79 0,00 2,00 %
Island 5 933 0 475 475 0,00 1,25 %
13 055 484 27 083 830 0 0 0 0 2 133 356 0 0 2 133 356
Own funds
requirement
weights
Counter-
cyclical
capital
buffer rate
31.12.18
(in NOK thousand)
General credit exposures Trading book exposure Securitisation exposure Own funds requirements
16 CAPITAL MANAGEMENT
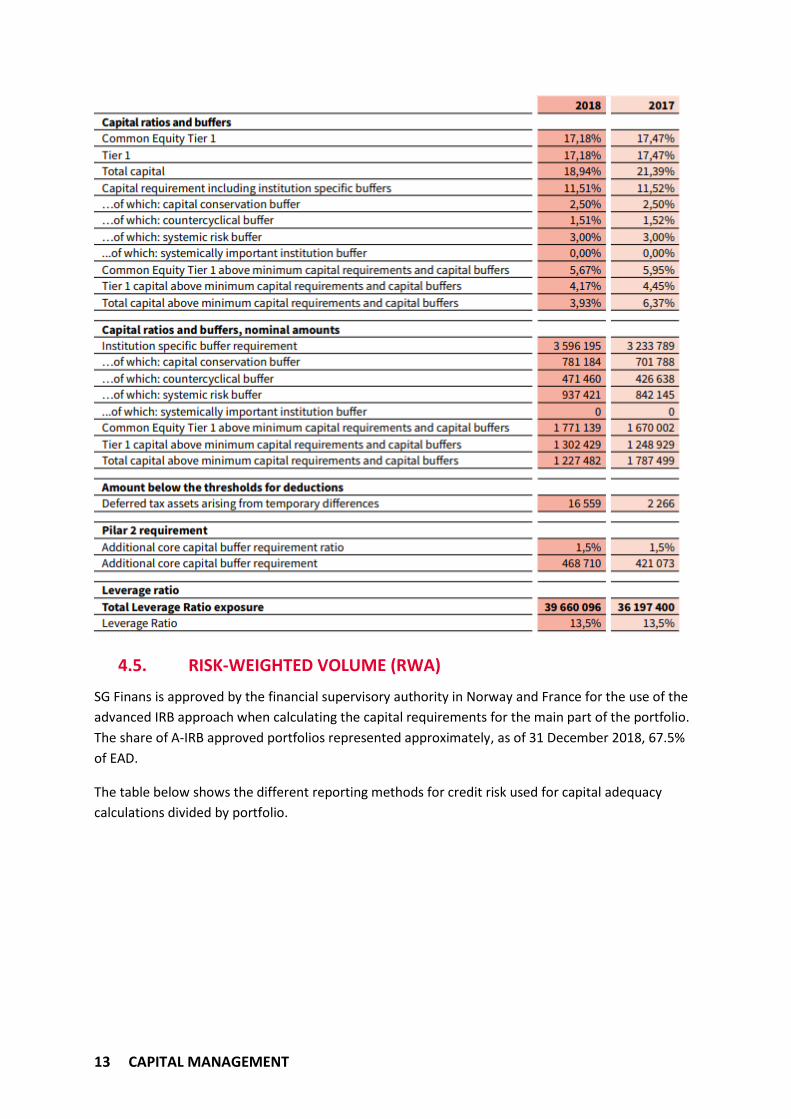
Table 6 - Amount of institution-specific countercyclical capital buffer
Table 7 - Transitional own funds
Disclosure date 31.12.18
Amounts in NOK thousand
Common Equity Tier 1 capital: instruments and reserves Amount at disclosure date (A)
Regulation (EU) No 575/2013 article reference (B)
Amounts subject to pre-regulation (EU) No 575/2013 treatment or prescribed residual amount of Regulation (EU) 575/2013 (C)
1 Capital instruments and the related share premium accounts
1 186 075 26 (1), 27, 28, 29, EBA list 26 (3)
N/A
of which: Instrument type 1 1 186 075 EBA list 26 (3) N/A
of which: Instrument type 2
EBA list 26 (3) N/A
of which: Instrument type 3
EBA list 26 (3) N/A
2 Retained earnings 4 254 405 26 (1) (c) N/A
3 Accumulated other comprehensive income and any other reserves
26 (1) N/A
3a Funds for general banking risk
26 (1) (f) N/A
4 Amount of qualifying items referred to in Article 484 (3) and the related share premium accounts subject to phase out from CET1
486 (2) N/A
Public sector capital injections grandfathered until 1 January 2018
483 (2) N/A
5 Minority interests (amount allowed in consolidated CET1)
84, 479, 480 N/A
5a Independently reviewed interim profits net of any foreseeable charge or dividend
26 (2) N/A
6 Common Equity Tier 1 (CET1) capital before regulatory adjustments
5 440 480
N/A
Common Equity Tier 1 (CET1) capital: regulatory adjustments
7 Additional value adjustments (negative amount) -119 34, 105 N/A
8 Intangible assets (net of related tax liability) (negative amount)
-4 468 36 (1) (b), 37, 472 (4)
N/A
9 Empty set in the EU
N/A
10 Deferred tax assets that rely on future profitability excluding those arising from temporary difference (net of related tax liability where the conditions in Article 38 (3) are met) (negative amount)
36 (1) (c), 38, 472 (5)
N/A
11 Fair value reserves related to gains or losses on cash flow hedges
33 (a) N/A
12 Negative amounts resulting from the calculation of expected loss amounts
-68 558 36 (1) (d), 40, 159, 472 (6)
N/A
13 Any increase in equity that results from securitised assets (negative amount)
32 (1) N/A
14 Gains or losses on liabilities valued at fair value resulting from changes in own credit standing
33 (1) (b) (c) N/A
15 Defined-benefit pension fund assets (negative amount)
36 (1) (e), 41, 472 (7)
N/A
1,51 %
471 448
Total risk exposure amount
Institution-specific countercyclical buffer rate
Institution-specific countercyclical buffer requirement
31 247 352

17 CAPITAL MANAGEMENT
16 Direct and indirect holdings by an institution of own CET1 instruments (negative amount)
36 (1) (f), 42, 472 (8)
N/A
17 Holdings of the CET1 instruments of financial sector entities where those entities have reciprocal cross holdings with the institution designed to inflate artificially the own funds of the institution (negative amount)
36 (1) (g), 44, 472 (9)
N/A
18 Direct, indirect and synthetic holdings of the CET1 instruments of financial sector entities where the institution does not have a significant investment in those entities (amount above 10% threshold and net of eligible short positions) (negative amount)
36 (1) (h), 43, 45, 46, 49 (2) (3), 79, 472 (10)
N/A
19 Direct, indirect and synthetic holdings of the CET1 instruments of financial sector entities where the institution has a significant investment in those entities (amount above 10% threshold and net of eligible short positions) (negative amount)
36 (1) (i), 43, 45, 47, 48 (1) (b), 49 (1) to (3), 79, 470, 472 (11)
N/A
20 Empty set in the EU
N/A
20a
Exposure amount of the following items which qualify for a RW of 1250%, where the institution opts for the deduction alternative
36 (1) (k) N/A
20b
of which: qualifying holdings outside the financial sector (negative amount)
36 (1) (k) (i), 89 to 91
N/A
20c
of which: securitisation positions (negative amount)
36 (1) (k) (ii), 243 (1) (b), 244 (1) (b), 258
N/A
20d
of which: free deliveries (negative amount)
36 (1) (k) (iii), 379 (3)
N/A
21 Deferred tax assets arising from temporary difference (amount above 10% threshold, net of related tax liability where the conditions in Article 38 (3) are met) (negative amount)
36 (1) (c), 38, 48 (1) (a), 470, 472 (5)
N/A
22 Amount exceeding the 17,65 % threshold (negative amount)
48 (1) N/A
23 of which: direct and indirect holdings by the institution of the CET1 instruments of financial sector entities where the institution has a significant investment in those entities
36 (1) (i), 48 (1) (b), 470, 472 (11)
N/A
24 Empty set in the EU
N/A
25 of which: deferred tax assets arising from temporary difference
36 (1) (c), 38, 48 (1) (a), 470, 472 (5)
N/A
25a
Losses for the current financial year (negative amount)
36 (1) (a), 472 (3) N/A
25b
Foreseeable tax charges relating to CET1 items (negative amount)
36 (1) (l) N/A
26 Regulatory adjustments applied to Common Equity Tier 1 in respect of amounts subject to pre-CRR treatment
N/A
26a
Regulatory adjustments relating to unrealised gains and losses pursuant to Articles 467 and 468
467 N/A
Of which: filter for unrealised loss 1
467 N/A
Of which: filter for unrealised loss 2
467 N/A
Of which: filter for unrealised gain 1
468 N/A
Of which: filter for unrealised gain 2
468 N/A
26b
Amount to be deducted from or added to Common Equity Tier 1 capital with regard to additional filters and deductions required pre-CRR
481 N/A
Of which:
481 N/A
27 Qualifying AT1 deductions that exceed the AT1 capital of the institution (negative amount)
36 (1) (j) N/A

18 CAPITAL MANAGEMENT
28 Total regulatory adjustments to Common Equity Tier 1 (CET1)
-73 145
N/A
29 Common Equity Tier 1 (CET1) capital 5 367 334
N/A
Additional Tier 1 (AT1) capital: instruments
30 Capital instruments and the related share premium accounts
51, 52 N/A
31 of which: classified as equity under applicable accounting standards
N/A
32 of which: classified as liabilities under applicable accounting standards
N/A
33 Amount of qualifying items referred to in Article 484 (4) and the related share premium accounts subject to phase out from AT1
486 (3) N/A
Public sector capital injections grandfathered until 1 January 2018
483 (3) N/A
34 Qualifying Tier 1 capital included in consolidated AT1 capital (including minority interest not included in row 5) issued by subsidiaries and held by third parties
85, 86, 480 N/A
35 of which: instruments issued by subsidiaries subject to phase-out
486 (3) N/A
36 Additional Tier 1 (AT1) capital before regulatory adjustments
N/A
Additional Tier 1 (AT1) capital: regulatory adjustments
37 Direct and indirect holdings by an institution of own AT1 instruments (negative amount)
52 (1) (b), 56 (a), 57, 475 (2)
N/A
38 Holdings of the AT1 instruments of financial sector entities where those entities have reciprocal cross holdings with the institution designed to artificially inflate the own funds of the institution (negative amount)
56 (b), 58, 475 (3) N/A
39 Direct, indirect and synthetic holdings of the AT1 instruments of financial sector entities where the institution does not have a significant investment in those entities (amount above 10% threshold and net of eligible short positions) (negative amount)
56 (c), 59, 60, 79, 475 (4)
N/A
40 Direct, indirect and synthetic holdings of the AT1 instruments of financial sector entities where the institution has a significant investment in those entities (amount above 10% threshold and net of eligible short positions) (negative amount)
56 (d), 59, 79, 475 (4)
N/A
41 Regulatory adjustments applied to Additional Tier 1 capital in respect of amounts subject to pre-CRR treatment and transitional treatments subject to phase-out as prescribed in Regulation (EU) No 575/2013 (i.e. CRR residual amounts)
N/A
41a
Residual amounts deducted from Additional Tier 1 capital with regard to deduction from Common Equity Tier 1 capital during the transitional period pursuant to article 472 of Regulation (EU) No 575/2013
472, 473(3)(a), 472 (4), 472 (6), 472 (8), 472 (9), 472 (10) (a), 472 (11) (a)
N/A
Of which: items to be detailed line by line, e.g. Material net interim losses, intangibles, shortfall of provisions to expected losses etc
N/A
41b
Residual amounts deducted from Additional Tier 1 capital with regard to deduction from Tier 2 capital during the transitional period pursuant to article 475 of Regulation (EU) No 575/2013
477, 477 (3), 477 (4) (a)
N/A

19 CAPITAL MANAGEMENT
Of which: items to be detailed line by line, e.g. Reciprocal cross holdings in Tier 2 instruments, direct holdings of non-significant investments in the capital of other financial sector entities, etc
N/A
41c
Amounts to be deducted from added to Additional Tier 1 capital with regard to additional filters and deductions required pre-CRR
467, 468, 481 N/A
Of which: possible filter for unrealised losses
467 N/A
Of which: possible filter for unrealised gains
468 N/A
Of which: …
481 N/A
42 Qualifying T2 deductions that exceed the T2 capital of the institution (negative amount)
56 (e) N/A
43 Total regulatory adjustments to Additional Tier 1 (AT1) capital
N/A
44 Additional Tier 1 (AT1) capital
N/A
45 Tier 1 capital (T1 = CET1 + AT1) 5 367 334
N/A
Tier 2 (T2) capital: instruments and provisions
46 Capital instruments and the related share premium accounts
550 000 62, 63 N/A
47 Amount of qualifying items referred to in Article 484 (5) and the related share premium accounts subject to phase out from T2
486 (4) N/A
Public sector capital injections grandfathered until 1 January 2018
483 (4) N/A
48 Qualifying own funds instruments included in consolidated T2 capital (including minority interest and AT1 instruments not included in rows 5 or 34) issued by subsidiaries and held by third party
87, 88, 480 N/A
49 of which: instruments issued by subsidiaries subject to phase-out
486 (4) N/A
50 Credit risk adjustments
62 (c) & (d) N/A
51 Tier 2 (T2) capital before regulatory adjustments 550 000
N/A
Tier 2 (T2) capital: regulatory adjustments
52 Direct and indirect holdings by an institution of own T2 instruments and subordinated loans (negative amount)
63 (b) (i), 66 (a), 67, 477 (2)
N/A
53 Holdings of the T2 instruments and subordinated loans of financial sector entities where those entities have reciprocal cross holdings with the institutions designed to artificially inflate the own funds of the institution (negative amount)
66 (b), 68, 477 (3) N/A
54 Direct, indirect and synthetic holdings of the T2 instruments and subordinated loans of financial sector entities where the institution does not have a significant investment in those entities (amount above 10% threshold and net of eligible short positions) (negative amount)
66 (c), 69, 70, 79, 477 (4)
N/A
54a
Of which: new holdings not subject to transitional arrangements
N/A
54b
Of which: holdings existing before 1 January 2013 and subject to transitional arrangements
N/A
55 Direct, indirect and synthetic holdings of the T2 instruments and subordinated loans of financial sector entities where the institution has a significant investment in those entities (net of eligible short positions) (negative amounts)
66 (d), 69, 79, 477 (4)
N/A
56 Regulatory adjustments applied to Tier 2 in respect of amounts subject to pre-CRR treatment and transitional treatments subject to phase out as prescribed in Regulation (EU) No 575/2013 (i.e. CRR residual amounts)
N/A

20 CAPITAL MANAGEMENT
56a
Residual amounts deducted from Tier 2 capital with regard to deduction from Common Equity Tier 1 capital during the transitional period pursuant to article 472 of Regulation (EU) No 575/2013
472, 472(3)(a), 472 (4), 472 (6), 472 (8), 472 (9), 472 (10) (a), 472 (11) (a)
N/A
Of which items to be detailed line by line, e.g. Material net interim losses, intangibles, shortfall of provisions to expected losses etc
N/A
56b
Residual amounts deducted from Tier 2 capital with regard to deduction from Additional Tier 1 capital during the transitional period pursuant to article 475 of Regulation (EU) No 575/2013
475, 475 (2) (a), 475 (3), 475 (4) (a)
N/A
Of which items to be detailed line by line, e.g. reciprocal cross holdings in at1 instruments, direct holdings of non significant investments in the capital of other financial sector entities, etc
N/A
56c
Amounts to be deducted from or added to Tier 2 capital with regard to additional filters and deductions required pre-CRR
467, 468, 481 N/A
Of which: possible filter for unrealised losses
N/A
Of which: possible filter for unrealised gains
N/A
Of which: …
N/A
57 Total regulatory adjustments to Tier 2 (T2) capital
N/A
58 Tier 2 (T2) capital 550 000
N/A
59 Total capital (TC = T1 + T2) 5 917 334
N/A
59a
Risk-weighted assets in respect of amounts subject to pre-CRR treatment and transitional treatments subject to phase out as prescribed in Regulation (EU) No 575/2013 (i.e. CRR residual amount)
N/A
Of which: items not deducted from CET1 (Regulation (EU) No 575/2013 residual amounts) (items to be detailed line by line, e.g. Deferred tax assets that rely on future profitability net of related tax liability, indirect holdings of own CET1, etc.)
472, 472 (5), 472 (8) (b), 472 (10) (b), 472 (11) (b)
N/A
Of which: items not deducted from AT1 items (Regulation (EU) No 575/2013 residual amounts) (items to be detailed line by line, e.g. Reciprocal cross holdings in T2 instruments, direct holdings of non-significant investments in the capital of other financial sector entities, etc.)
475, 475 (2) (b), 475 (2) ©, 475 (4) (b)
N/A
Items not deducted from T2 items (Regulation (EU) No 575/2013 residual amounts) (items to be detailed line by line, e.g. Indirect holdings of own T2 instruments, indirect holdings of non-significant investments in the capital of other financial sector entities, indirect holdings of significant investments in the capital of other financial sector entities, etc.)
477, 477 (2) (b), 477 (2) (c), 477 (4) (b)
N/A
60 Total risk-weighted assets 31 247 353
N/A
Capital ratios and buffers
61 Common Equity Tier 1 (as a percentage of total risk exposure amount)
17,18 % 92 (2) (a), 465
62 Tier 1 (as a percentage of total risk exposure amount) 17,18 % 92 (2) (b), 465
63 Total capital (as a percentage of total risk exposure amount)
19,94 % 92 (2) (c)
64 Institution-specific buffer requirement (CET1 requirement in accordance with article 92 (1) (a) plus capital conservation and countercyclical buffer requirements plus systemic risk buffer, plus the systemically important institution buffer expressed as a percentage of total risk exposure amount)
7,01 % CRD 128, 129, 140

21 CAPITAL MANAGEMENT
65 of which: capital conservation buffer requirement 2,50 %
66 of which: countercyclical buffer requirement 1,51 %
67 of which: systemic risk buffer requirement 3,00 %
67a
of which: Global Systemically Important Institution (G-SII) or Other Systemically Important Institution (O-SII) buffer
0,00 % CRD 131
68 Common Equity Tier 1 available to meet buffers (as a percentage of risk exposure amount)
11,18 % CRD 128
69 non-relevant in EU regulation
70 non-relevant in EU regulation
71 non-relevant in EU regulation
Amounts below the thresholds for deduction (before risk-weighting)
72 Direct and indirect holdings of the capital of financial sector entities where the institution does not have a significant investment in those entities (amount below 10% threshold and net of eligible short positions)
36 (1) (h), 45, 46, 472 (10), 56 (c), 59, 60, 475 (4), 66 (c), 69, 70, 477 (4)
N/A
73 Direct and indirect holdings of the CET1 instruments of financial sector entities where the institution has a significant investment in those entities (amount below 10% threshold and net of eligible short positions)
36 (1) (i), 45, 48, 470, 472 (11)
N/A
74 Empty set in the EU
N/A
75 Deferred tax assets arising from temporary difference (amount below 10 % threshold, net of related tax liability where the conditions in Article 38 (3) are met)
16 559 36 (1) (c), 38, 48, 470, 472 (5)
N/A
Applicable caps on the inclusion of provisions in Tier 2
76 Credit risk adjustments included in T2 in respect of exposures subject to standardised approach (prior to the application of the cap)
62 N/A
77 Cap on inclusion of credit risk adjustments in T2 under standardised approach
62 N/A
78 Credit risk adjustments included in T2 in respect of exposures subject to internal ratings-based approach (prior to the application of the cap)
62 N/A
79 Cap for inclusion of credit risk adjustments in T2 under internal ratings-based approach
62 N/A
Capital instruments subject to phase-out arrangements (only applicable between 1 Jan 2013 and 1 Jan 2022)
80 Current cap on CET1 instruments subject to phase-out arrangements
484 (3), 486 (2) & (5)
N/A
81 Amount excluded from CET1 due to cap (excess over cap after redemptions and maturities)
484 (3), 486 (2) & (5)
N/A
82 Current cap on AT1 instruments subject to phase-out arrangements
484 (4), 486 (3) & (5)
N/A
83 Amount excluded from AT1 due to cap (excess over cap after redemptions and maturities)
484 (4), 486 (3) & (5)
N/A
84 Current cap on T2 instruments subject to phase-out arrangements
484 (5), 486 (4) & (5)
N/A
85 Amount excluded from T2 due to cap (excess over cap after redemptions and maturities)
484 (5), 486 (4) & (5)
N/A
'N/A' if the question is not applicable

22 CAPITAL MANAGEMENT
Table 8 - Capital instruments main features
Disclosure date: 31.12.18 Common Equity Tier 1 Additional Tier 2 capital
1 Issuer SG Finans AS SG Finans AS
2 Unique identifier (e.g. CUSIP, ISIN or Bloomberg identifier for private placement)
N/A N/A
3 Governing law(s) of the instrument Norwegian Norwegian
Regulatory treatment
4 Transitional CRR rules Common Equity Tier 1 Additional Tier 2
5 Post-transitional CRR rules Common Equity Tier 1 Additional Tier 2
6 Eligible at solo/(sub-)consolidated/solo & (sub-)consolidated Solo Solo
7 Instrument type (types to be specified by each jurisdiction) Share capital Additional Tier 2
8 Amount recognised in regulatory capital (currency in million, as of most recent reporting date)
MNOK 1.186 MNOK 550
9 Nominal amount of instrument NOK 945.435.750 NOK 550.000.000
9a Issue price N/A NOK 550.000.000
9b Redemption price N/A NOK 550.000.000
10 Accounting classification Share capital Liability – amortised cost
11 Original date of issuance N/A 28 June 2018
12 Perpetual or dated Perpetual Dated
13 Original maturity date No maturity 28 June 2028
14 Issuer call subject to prior supervisory approval No Yes
15 Optional call date, contingent call dates, and redemption amount
N/A 28 June 2023, if changes in criteria for Tier 2 capital, 100 %
16 Subsequent call dates, if applicable N/A N/A
Coupons / dividends
17 Fixed or floating dividend/coupon N/A Floating
18 Coupon rate and any related index N/A NIBOR 3 months plus 2.26 % p.a.
19 Existence of a dividend stopper N/A No
20a Fully discretionary, partially discretionary or mandatory (in terms of timing)
Fully discretionary Mandatory
20b Fully discretionary, partially discretionary or mandatory (in terms of amount)
Fully discretionary Mandatory
21 Existence of step up or other incentive to redeem N/A No
22 Non-cumulative or cumulative N/A Non-cumulative
23 Convertible or non-convertible N/A Non-convertible
24 If convertible, conversion trigger(s) N/A N/A
25 If convertible, fully or partially N/A N/A
26 If convertible, conversion rate N/A N/A
27 If convertible, mandatory or optional conversion N/A N/A
28 If convertible, specify instrument type convertible into N/A N/A
29 If convertible, specify issuer of instrument it converts into N/A N/A
30 Write-down features N/A No
31 If write-down, write-down trigger(s) N/A N/A
32 If write-down, full or partial N/A N/A
33 If write-down, permanent or temporary N/A N/A
34 If temporary write-down, description of write-up mechanism N/A N/A
35 Position in subordination hierarchy in liquidation (specify instrument type immediately senior to instrument)
Additional Tier 1 Senior debt
36 Non-compliant transitioned features No No
37 If yes, specify non-compliant features N/A N/A
'N/A' if the question is not applicable

23 CREDIT RISK
5. CREDIT RISK
Credit risk is defined as the risk of losses due to customers which fail to fulfil their agreed obligations
towards SG Finans and the pledged collateral does not cover existing claims. It includes counterparty
risk, transfer risk, country risk and settlement risk. The credit portfolio includes leasing, loan and
factoring.
5.1. MANAGEMENT OF CREDIT RISK
Credit risk constitutes SG Finans' largest risk exposure, has the highest loss potential, and is the risk
demanding the largest loss absorbing capital buffer. SG Finans has outlined the fundamental
principles in the credit risk strategy, ensuring that credit approvals are based on the same strategic
principles.
SG Finans shall exercise careful consideration and have a limited exposure towards customers who
are considerably exposed to particularly cyclical industries or industries subject to substantial
structural change. In addition, the counterparty shall have an acceptable debt-servicing ability as a
first-line defence, i.e. the customer shall have the relevant competencies, experience and a
management that we trust, and document financial results underlining a sufficient profitability,
solidity and liquidity.
SG Finans is assessing the risk profile of the leasing, loan and factoring portfolios, through the Risk
Management Committee (RMC). The RMC reviews the risk profile of the portfolio through a
combination of standard indicators such as concentration risk, exposure by product, credit quality,
open residual values and close monitoring of default rates.
5.2. CREDIT RISK APPROACH AND THE IRB SYSTEM
SG Finans is approved by the financial supervisory authority in Norway and France to use the
advanced IRB approach when calculating the capital requirements for the main part of the
loan/leasing portfolio.
The IRB system is a comprehensive framework which makes considerable demands on risk models,
decision-making processes, management and reporting and control mechanisms. It aims to ensure
that all capital adequacy requirements are fulfilled and that quality and transparency are secured
throughout the entire organization. Validation is a major part in securing a satisfactory quality in the
IRB system, where an assessment has to be made to ensure that all internal and external
requirements are met. The introduction of the IRB system in SG Finans has taken several years, a
period contributed to a better understanding of internal processes and a better credit management
through improved and new follow-up-systems. Following the A-IRB approval, both a quantitative and
qualitative analysis of the system must be conducted annually.
5.3. VALIDATION AND DEFINITIONS ACCORDING TO THE IRB SYSTEM
SG Finans uses specific credit risk models based on the characteristics of the counterpart and later,
with the A-IRB application for factoring, also conditioned on product type. The models are subject to
continuous improvements and testing, ensuring the best basis for credit decisions. The classification

24 CREDIT RISK
system provides a basis for statistically based calculations of expected losses in a long-term
perspective and risk-adjusted capital in a portfolio perspective. The risk parameters estimated by
models are:
▪ Probability of default (PD) is used to measure the counterparts’ ability to meet its obligation
towards SG Finans. Counterparts are ranked based on the probability of default.
▪ Loss given default (LGD) indicates how much SG Finans expects to lose if the counterpart fails
to meet its obligations, taking the value of the financial asset provided by the customer and
other relevant factors into consideration.
▪ Exposure at default (EAD) includes amounts drawn under credit limits or loans in addition to
committed, undrawn lines. SG Finans has set the credit conversion factor, the percentage
share of committed, undrawn credit lines to be equal to 100 per cent for equipment
financing.
The definition of default set by the financial supervisory authority in Norway has been adapted by SG
Finans. A credit should be defined as non-performing if the claim is more than 90 days overdue or
has a provision, given the overdue amount exceeds NOK/SEK/DKK 1000 (NOK/SEK/DKK 4000 for
factoring agreements with recourse) and that the overdue is not caused by the credit management
of SG Finans. A weakening of the counterparts’ ability to meet its obligation resulting in a not
insignificant loss should also lead to a default classification, e.g. a restructuring of a contract or
bankruptcy of client.
SG Finans’ models are calibrated to reflect a full business cycle, taking into account the Norwegian
banking crisis in 1988-1993.
Validation is, as mentioned, a key element in ensuring the quality of the IRB system. The qualitative
validation assesses the design of the IRB system and the underlying processes. Data quality,
classification methods, internal and external reporting, stability of the systems and the use of IRB
parameters are all important elements in this validation.
The quantitative validation includes tests of the models’ ranking power/discriminatory power, ability
to determine the correct level (calibration) of risk parameters and the stability of the risk parameters.
The model validation is centrally coordinated by RISQ/MRM/MIR at Société Générale, which is in
charge of the quantitative audit and the secretary of the Expert Committee (validation committee).
RISQ/MRM/MIR is independent from the local department of Risk Modelling. The validation report
follows the same governance i.e. reviewed by RISQ/MRM/MIR and validated by the Expert
Committee. The Expert Committee is composed by members from both the central and local Risk and
Business side.
5.4. RISK CLASSIFICATION
The company uses a risk classification system for customers and exposures. The classification is
based on objective criteria and consists of two parameters, the customer’s creditworthiness and the
object’s security coverage. The combination of these parameters determines how the exposure is
classified. Exposures are classified in categories in accordance with capital adequacy regulations for
banks and finance houses. Based on the combination of counterparty classification (probability of
default (1-10)) and object classification (loss given default (A-E)) the exposure is classified in a credit

25 CREDIT RISK
matrix based on debtor class and asset classes. The financed assets are classified according to value
curves, expressing expected evolution of the market value of the financed asset, based on historical
observations.
Below is the relationship between risk class and probability of default used for credit granting in SG
Finans. This is compared to risk classification used in a selection of rating bureaus.
Table 9 - Relationship between risk class and probability of default
5.5. IRB QUANTITATIVE VALIDATION RESULTS
The most important feature of the models estimating risk parameters used for capital adequacy
calculations is the ability to predict the outcome of each parameter. The first table below shows the
predicted default rate versus the observed default rate for each of the four PD models for all healthy
counterparts at the start of the year.
The estimated loss for defaulted counterparts is plotted against the actual loss in the second table.
The predicted values are based on the non-performing portfolio and the observed loss is the actual

26 CREDIT RISK
LGD for defaults occurring in the course of the year. The LGD estimate is downturn calibrated with
respect to the Norwegian banking crisis of 1988-1993.
The third table shows the conversion factor versus the actual outcome. The EAD is calculated based
on the outstanding amount and the committed, undrawn credit lines. The CCF is calibrated to a level
assuming that 100 per cent of the undrawn credit lines are drawn up until the time of default,
resulting in a predicted estimate equal to 1. The actual drawn amount is plotted against the
predicted estimate for the previous 5 years.
Table 10 - Validation results, PD models, LGD model and EAD model
The validated risk parameters above are used for estimating the loss occurring during the year. It is
calculated as PD times LGD, multiplied with the EAD. The table below shows a comparison between
expected losses in the healthy portfolio at the beginning of the year and new impairment losses
recorded for the approved IRB portfolio during the year. Note that the predicted loss is a best-
estimate calculation and thus not calibrated.
Table 11 - Validation results, Expected loss
PD Models 2009 2010 2011 2012 2013 2014 2015 2016 2017
(per cent)
Application Limited
- Predicted 16,8 15,9 14,5 15,0 15,9 13,4 12,7 11,8 11,8
- Observed 7,3 5,7 7,4 4,4 4,0 3,7 3,9 3,6 2,8
Application Unlimited
- Predicted 23,3 21,8 23,5 19,9 21,1 19,0 16,5 15,8 16,73
- Observed 10,5 9,0 16,7 8,0 8,8 6,6 4,3 4,5 5,3
Behaviour Limited
- Predicted 12,7 13,3 12,5 11,6 11,6 10,9 9,9 9,2 8,7
- Observed 8,4 6,6 5,6 4,5 5,2 4,0 3,5 3,5 3,1
Behaviour Unlimited
- Predicted 14,2 15,6 14,9 14,5 15,8 14,9 13,1 8,8 10,9
- Observed 8,8 7,6 7,4 6,5 7,1 5,9 5,7 5,1 4,9
LGD model 2009 2010 2011 2012 2013 2014 2015 2016 2017
(per cent)
Loss Given Default
- Predicted 27,0 26,9 20,3 20,5 19,5 20,6 17,8 16,3 18,0
- Observed 15,3 17,2 5,7 -1,5 -2,9 -4,7 -4,9 -6,2 -2,7
PD Models 2009 2010 2011 2012 2013 2014 2015 2016 2017
(per cent)
CCF
- Predicted 100,0 100,0 100,0 100,0 100,0 100,0 100,0 100,0 100,0
- Observed 98,9 99,3 99,5 99,5 99,8 99,8 99,8 99,7 99,1
Expected and actual value adjustments according to risk parameters 2009 2010 2011 2012 2013 2014 2015 2016 2017
Expected loss(EL), healthy portfolio, year-start (per cent)
- Predicted 1,00 % 1,11 % 0,92 % 0,84 % 0,73 % 0,68 % 0,60 % 0,54 % 0,52 %
- Observed 0,93 % 0,81 % 0,39 % 0,21 % 0,32 % 0,12 % 0,09 % -0,02 % 0,01 %
Expected loss(EL), healthy portfolio, year-start (MNOK)
- Predicted 157 178 144 134 106 94 81 78 82
- Observed 146 130 62 33 46 17 12 -2 2

27 CREDIT RISK
5.6. EXPOSURES FOR THE IRBA PORTFOLIO
The first table below shows the exposure for the IRBA-approved portfolio split by industry. In
addition, RWA, risk weight and the average calibrated PD and LGD are included in the overview. The
breakdown is based on standardised sector and industry categories defined by Statistics Norway. The
counterpart defines the industry code for its activities at the time of registration/establishment in
the company register of Norway. The second table below gives same overview of the portfolio split
by risk class.
Table 12 - Exposure for the IRBA-approved portfolio split by industry
EAD
Risk weight
(%)
Risk weighted
assets PD (%) LGD (%)
(in NOK thousand) 31.12.2018 31.12.2018 31.12.2018 31.12.2018 31.12.2018
Construction 7 889 657 54,7 % 4 313 405 15,0 % 17,5 %
Transportation and storage 4 338 101 61,3 % 2 659 217 12,0 % 19,0 %
Manufacturing 2 379 169 73,4 % 1 746 267 9,0 % 24,2 %
Administrative and support service activities 2 712 027 62,7 % 1 699 649 11,9 % 19,0 %
Wholesale and retail trade; repair of motor vehicles and motorcycles 2 253 053 69,2 % 1 558 833 8,6 % 25,3 %
Agriculture, forestry and fishing 3 486 350 42,9 % 1 495 969 16,6 % 10,7 %
Information and communication 738 372 62,4 % 460 587 9,9 % 27,6 %
Mining and quarrying 747 760 57,5 % 429 847 17,2 % 17,8 %
Professional, scientific and technical activities 489 574 74,7 % 365 588 8,2 % 27,4 %
Real estate activities 506 737 66,7 % 338 048 11,2 % 22,7 %
Human health and social work activities 528 521 55,6 % 293 810 8,5 % 29,6 %
Water supply; sewerage, waste management and remediation activities 441 095 66,2 % 291 847 13,7 % 22,9 %
Accommodation and food service activities 164 874 80,5 % 132 762 15,5 % 27,7 %
Arts, entertainment and recreation 146 869 66,0 % 97 005 13,5 % 23,3 %
Financial and insurance activities 70 490 77,9 % 54 902 7,1 % 29,8 %
Other service activities 57 290 89,9 % 51 484 10,9 % 30,0 %
Education 64 757 74,6 % 48 298 12,0 % 27,7 %
Electricity, gas, steam and air conditioning supply 38 333 93,0 % 35 652 9,1 % 28,8 %
Unknown 30 637 66,6 % 20 392 14,3 % 22,5 %
Public administration and defence; compulsory social security 159 138,7 % 220 8,5 % 33,3 %
Activities of extraterritorial organisations and bodies 5 38,6 % 2 3,3 % 14,4 %
Grand Total 27 083 830 59,4 % 16 093 783 12,4 % 20,4 %

28 CREDIT RISK
Table 13 - Exposure for the IRBA-approved portfolio split by risk class
5.7. CREDIT RISK APPROACH – STANDARD METHOD
Estimated risk-weighted volume and capital requirements for the portfolios reported according to
the standard approach are shown in chapter 4.2. SG Finans is approved for the advanced IRB-
approach for parts of the loan/leasing portfolio. The rest is reported according to the standard
approach. This also includes credits which originally are approved for IRBA, but due to missing data
are calculated according to the standard approach. The loan and leasing portfolio of Denmark and
the Factoring portfolio is on the roll out plan and will be included in the IRBA portfolio when
validated by the regulators. Central banks, governments, regional authorities and institutions are
granted permanent exception of the IRBA approach and will be reported under the standard
approach.
EAD Risk weight (%)
Risk weighted
assets PD (%) LGD (%)
(in NOK thousand) 31.12.2018 31.12.2018 31.12.2018 31.12.2018 31.12.2018
3+ 1 714 8,2 % 141 0,0 % 27,0 %
3 102 6,8 % 7 0,0 % 32,7 %
3- 173 233 9,4 % 16 246 0,1 % 28,4 %
4+ 313 092 15,7 % 49 196 0,1 % 23,4 %
4 123 675 36,2 % 44 802 0,3 % 21,6 %
4- 1 434 968 36,9 % 529 702 0,5 % 23,0 %
5+ 1 829 221 53,4 % 976 551 1,1 % 23,7 %
5 2 911 259 42,9 % 1 249 771 2,0 % 21,9 %
5- 2 371 614 54,5 % 1 292 451 3,3 % 21,0 %
6+ 8 518 933 55,4 % 4 723 094 4,5 % 19,5 %
6 2 282 407 64,1 % 1 462 533 7,3 % 20,6 %
6- 1 948 071 80,1 % 1 560 187 10,9 % 21,1 %
7+ 1 376 662 84,9 % 1 168 645 14,3 % 18,7 %
7 880 264 89,0 % 783 273 19,5 % 19,1 %
7- 2 298 416 79,9 % 1 836 673 49,6 % 18,1 %
9 620 199 64,6 % 400 512 100,0 % 24,2 %
Grand total 27 083 830 59,4 % 16 093 783 12,4 % 20,4 %

29 FINANCIAL RISK
6. FINANCIAL RISK
The company has implemented the group’s guidelines for financial risk management (defined as
interest rate, currency, liquidity and funding) as well as guidelines from the Board incorporated into
the company’s finance policy and liquidity policy.
6.1. FINANCIAL RISK MANAGEMENT
Management and control of financial risk are carried out centrally in the Risk Management
department, the Treasury and asset-liability management function at the company’s headquarters.
Treasury attends to the needs for financing, financial risk management, balance-sheet management,
operations in all three countries. Treasury is organised as a service centre whose main purpose is to
ensure financing and manage financial risk within defined limits. The limits for financial risk are
relatively limited and adjusted to the size and needs of the operation.
6.2. INTEREST RATE RISK
Treasury services are restricted to funding and coverage of financial risks, including structural risks
and liquidity. SG Finans has no trading activity. We have continued the company policy to macro
hedge fixed interest rate contracts, with the objective of ensuring that the economic and accounting
effects of changes in interest rate markets are held at a limited level. Our economic risk at the end of
the year was almost fully hedged against changes in interest rates and loans outstanding matches the
funding. Due to small differences in the maturity profile between fixed interest rate contracts and
the hedging swap, one interest rate swap does not meet the hedge accounting requirements. The
interest rate swap is classified as for trading purposes and the change in market value is posted
directly to the income statement. The efficiency of new hedges is tested prospectively prior to
entering new hedging contracts and thereafter on a quarterly basis for existing hedging relationships.
The efficiency is measured based on accumulated changes in the market value for hedging
instruments and hedged contracts using the “dollar-offset” method. Please refer to the notes for a
closer description of accounting effects and interest rate sensitivity.
6.3. CURRENCY RISK
Currency risk is managed by borrowing in the same currency and with the same maturity as assets in
the foreign currency. The net result from contracts in foreign currencies is exchanged into NOK or
other local currency on realisation. Moreover, the result from the branches in Sweden and Denmark
is exchanged into Norwegian Kroner. To some extent the company borrow in a different currency
and then use cross currency swap. Such swaps allow SG Finans to switch its loan and interest
repayments in e.g. EUR into local currencies as NOK, DKK and SEK. The efficiency of new hedges is
tested prospectively prior to entering new hedging contracts and thereafter on a quarterly basis for
existing hedging relationships. The efficiency is measured based on accumulated changes in the
market value for hedging instruments and hedged contracts using the “dollar-offset” method.
6.4. LIQUIDITY RISK
The company’s funding is mainly provided by the Société Générale group. Funding from the group is
based on a bilateral agreement for funding as well as funding limits according to our funding needs

30 FINANCIAL RISK
over time, based on budgeted and expected growth. Planning and managing liquidity and funding
thus occur in close collaboration with the group unit for financing of subsidiaries and operating
businesses. SG Finans has been working on diversifying its sources of funding, and to attract new
lenders to finance the activities. This initiative is linked to the Société Générale Group strategy to
diversify funding sources for its operating entities. As per end 2018, SG Finans received funding from
Nordic Investment Bank (NIB) and European Investment Bank (EIB).

31 OPERATIONAL RISK
7. OPERATIONAL RISK
Operational risk is the risk of loss resulting from inadequate or failed internal processes, people and
systems or from external events, including legal risk. Operational risk includes risks related to events
with a low probability of occurrence but a high impact, the risks of internal and external fraud and
the risks related to the model.
7.1. DEVELOPMENTS IN OPERATIONAL RISK
SG Finans calculates the regulatory capital requirement for operational risk according to Pillar I (Basic
Indicator Approach) which was KNOK 195 208 for 2017 and 207 719 for 2018. With effect from Q1
2019, the regulatory capital requirement for operational risk is KNOK 213 794. The capital reserved
for operational risk in 2019 is 19 times the sum of operational risk losses occurred during the
previous year.
7.2. OPERATIONAL RISK MANAGEMENT
SG Finans has implemented Société Générale Group’s procedure for identification, assessment and
reporting of losses caused by operational risk events. Reported events are used in calculating and
allocating capital requirements by the Group. The illustration below gives an overall perspective of
SG Finans’ management of operational risk.

32 OPERATIONAL RISK
Independent risk control is ensured by the dedicated risk management function, covering control of
credit, operational and financial risks, permanent supervision, outsourcing, crisis management and
contingency planning. The Operational Risk and Compliance Committee (ORCC) is held twice a year
or more frequently if necessary, to monitor operational risk, permanent supervision (internal control
monitoring and certification) and compliance in SG Finans. In addition, the Risk Committee of the
Board / Committee of Coordination of Internal Control (CCCI) also meets twice a year. The risk
management function is responsible for the reporting of operational risk losses as well as other
standardised reports to both the local management, ORCC, CCCI and to the Group. The reports are
the following:
▪ Key Risk Indicators (KRI)
▪ Event/Loss Reporting
▪ Risk Control and Self-Assessment (RCSA)
▪ Scenario Analysis
The KRI report measured in 2018 6 indicators that are updated and reported to Société Générale on a
quarterly basis.
Event/Loss reporting is an on-going internal procedure evaluating whether a loss linked to
operational risk has been identified. To ensure consistent reporting, there is a quarterly
exhaustiveness report with reconciliation of information from operational risk correspondents in
each major location / department, whose task it is to monitor and report operational loss incidents.
The consistency is also ensured through reconciliation with accounting every quarter and with
Collections/Trading once a month. In the event/loss reporting routine, it is stated that severe losses
(losses larger than, or expected larger than EUR 200.000) are reported immediately to Management,
as well as to Société Générale’s centralised operational risk department. The Group has a goal that
operational risk losses should not exceed 1% of total NBI. This goal is transferred to all entities. SG
Finans AS also monitors the amount of staff dedicated to permanent control.
Through the RSCA we assess the risk exposure, risk control and the residual risk in the main
processes of the organisation. This is reviewed annually and action plans are made based on the
internal evaluation, in the areas identified as needing improvement and/or follow-up.
The fourth element of analysis regarding operational risk is the scenario analysis. The purpose of the
scenario analysis is to assess the effect of an extreme scenario impacting SG Finans AS. The
assessment covers the impact in terms of business activity, staff and costs. Our Business Continuity
Plan (BCP) is a central document that becomes operative in such crisis situations. The scenario can
also involve other events where the BCP does not become operative, such as internal fraud.
Having implemented the above-mentioned methodology, procedures and reports, SG Finans AS is in
line with Société Générale Group’s internal requirements for AMA (Advanced Measurement
Approach) entities. Finanstilsynet rejected the company's application to use the AMA method for
calculation of operational risk in May 2013. The calculation of the capital requirement in this
document, and in all other reporting, is therefore based on BIA (Basic Indicator Approach).