sgm p.r. shukla. second generation model top-down economic models project baseline carbon emissions...
Post on 21-Dec-2015
217 views
TRANSCRIPT

SGM
P.R. Shukla

Second Generation Model

Top-Down Economic Models
Project baseline carbon emissions over time for a country or group of countries
Find the least-cost way to meet any particular emissions constraint
Provide a measure of the carbon price, in dollars per metric ton
Provide some measure of the overall cost of meeting an emissions target

Key SGM Characteristics
Computable General Equilibrium 12 Global Regions (Developed in
International Collaborations) Multiple Greenhouse Gases Internally Generated Demographics Vintaged Capital Stocks Explicit Energy Technology Land Resource Constraints

SGM 2000: Structure and Sectors
AGRICULTUREgrains and oil seeds
animal productsforestry
food processingother agricultural services
HOUSEHOLDSdemographics
labor supplyENERGY land supply
oil production household savingsPRIMARY FACTORS gas production final product demands
OF PRODUCTION petroleum refiningland surface gas distribution
subsurface resources coke and coal productslabor biomass production
capital uranium productionhydro and solar electric power GOVERNMENT
electricity production general governmentnational defense
education
EVERYTHING ELSEpaper and pulp manufacture
chemical manufacturecement manufacture
primary iron and steelprimary non-ferrous metals
other manufacturingpassenger transport
freight stransportother services

Computable General Equilibrium
Based on Economic Principles. All economic activities are included in
some sector of the model. Market equilibrium -- ALL markets must
clear simultaneously. Maximization Behavior -- consumers,
utility; producers, net worth.

SGM Regions
Annex IUnited StatesCanadaWestern EuropeJapanAustraliaFormer Soviet UnionEastern Europe
Non Annex IChinaIndiaMiddle EastMexicoSouth KoreaRest of World
Multiple Greenhouse Gases
CO2
CH4
CO N2O
NOx SOx NMHC

Internal Demographics
Age structure & gender of the population is developed internally using: fertility rates survival rates net migration rates
Labor force participation rates can be age & gender specific.

SGM Inputs & Outputs
Factors of Production Capital, Labor, Land,
Agriculture, Energy, & Materials.
Model Outputs Agriculture,
Energy, Materials,
Savings, Consumption &
GDP.
Energy Focus
8 Energy Sectors Resources and Reserves of Energy Resources
Vintaged Energy Using Technologies
SGM Is Part of GCAM
SGM is part of the Global Change Assessment Modeling (GCAM) System, an integrated assessment model computes concentrations of greenhouse bases
such as CO2,
can compute T and sea level rise.

Production Decisions
Production occurs out of existing capacity and its vintage limited by previous investments, & then current technologies
Retirement of old capacity occurs when Cannot cover operating expenses Old age -- fixed life, or Policy -- forced retirement
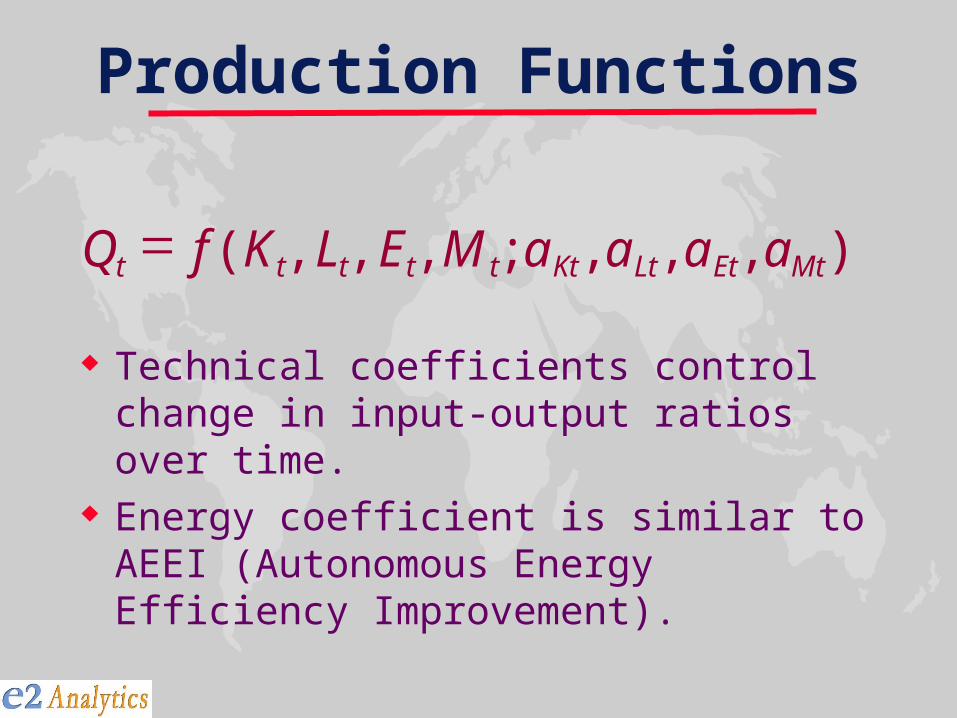
Production Functions
Technical coefficients control change in input-output ratios over time.
Energy coefficient is similar to AEEI (Autonomous Energy Efficiency Improvement).
),,,;,,,( MtEtLtKtttttt aaaaMELKfQ

New Capacity
Investment is based on expected profitability. available technology price expectations, & policy expectations
Price & Policy Expectations can be either forward or backward looking.

Investment
Capital market balances supply and demand of loanable funds.
Investment resources distributed among investments with positive expected net profitability no resources flow to expected losers the higher the expected rate of return, the greater
the share of the investment pool

Energy Production
Energy production out of reserves. Additions to reserves from the resource
base. additions depend on expected profitability resource availability.

Energy Technology
Hierarchical model. sectors, sub-sectors, & technologies.
Explicit energy technologies can be introduced into the model. e.g. natural gas combined cycle turbines
for power generation.

Issues the SGM Can Address
Assessing impacts of greenhouse gas emissions mitigation policies on GDP, consumption and energy.
Value of emissions rights trading. Value of “when” flexibility. Relative costs and benefits to regions of the
world of alternative protocol formulations.

SGM Strengths Built specifically for climate policy analysis. Multiple greenhouse gases. Part of an Integrated Assessment model --
e.g. can compute CO2 concentrations or T.
General equilibrium -- all markets clear. Detailed energy supply sector. Can be run in alternative foresight modes. Internal demographics. International Collaborations.

SGM Limitations
Not a business cycle model -- does not estimate inflation or unemployment policy impacts.
Limited energy end-use detail. Provides no sub-national
disaggregation for the United States.

SGM Data Requirements
Original Data Derived Data for SGM
1990 Input-Output Table
1990 Energy Balances
Hybrid Input-Output Table
Annual Investment Data by Sector Capital Stocks by Sector
Data on Fossil Fuel Resources Resource Grades
Electricity Supply: generation, installed
capacity, energy consumption, capital costs,
operating costs
Input-output representation of
electricity generation by fuel
National Income Accounts tax rates, savings rates

international trade
Bottom-UpEnergy Technology
EcosystemImpacts
Top-Down Economic Model (integration tool)
Region A Region B
Climate Scenarios
Model Integration

India Results

Real GNP and components
0
1000
2000
3000
4000
5000
6000
1990 1995 2000 2005 2010 2015 2020 2025 2030
Rs
. Th
ou
sa
nd
Cr.
(1
99
0 P
ric
es
)
Real GNP C I G
Reference Scenario

Energy Consumption
0
5
10
15
20
25
30
35
40
45
1990 1995 2000 2005 2010 2015 2020 2025 2030
Ex
ajo
ule
s
C.Oil N.Gas Coal Nuclear Hydro Solar
Reference Scenario

Electricity by sub-sector
0
1
2
3
4
5
6
1990 1995 2000 2005 2010 2015 2020 2025 2030
Ex
ajo
ule
s
Coal Gas Oil Nuclear Hydro Solar
Reference Scenario
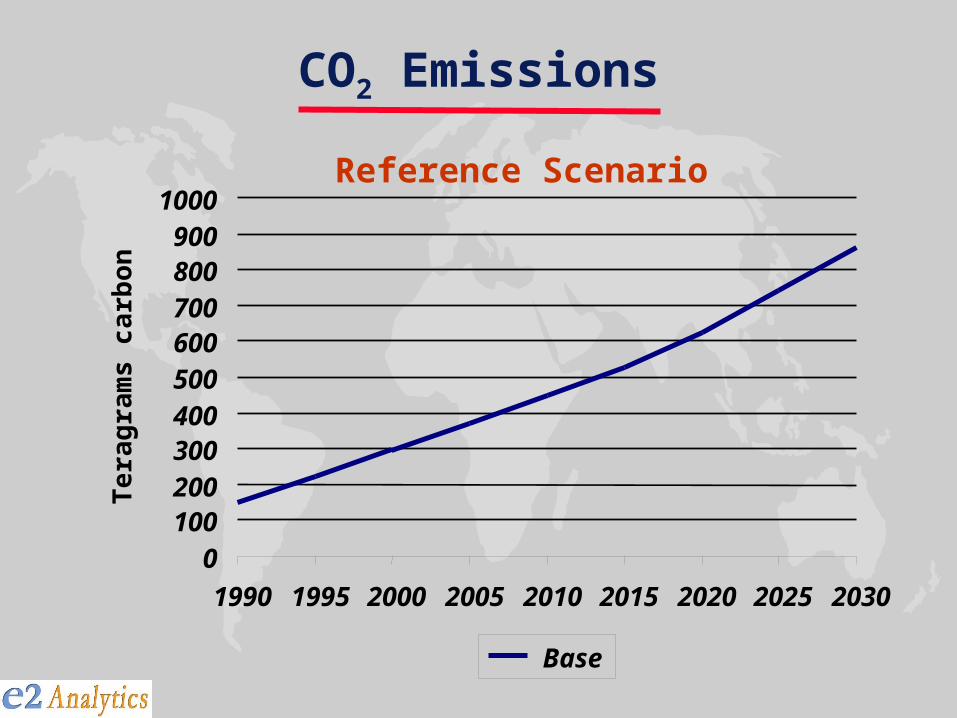
CO2 Emissions
Reference Scenario
0100200300400500600700800900
1000
1990 1995 2000 2005 2010 2015 2020 2025 2030
Te
rag
ram
s c
arb
on
Base

Policy scenarios
Alternate growth scenariosLow 5%High 7%
Alternate tax scenariosFixed tax: $25, $50, $100 per tCIncreasing tax

Policy scenarios
Advanced technology scenariosHigh SolarMedium Solar with $5 taxMedium Solar with $25 tax

Real GNP
0
1000
2000
3000
4000
5000
6000
7000
8000
1990 1995 2000 2005 2010 2015 2020 2025 2030
Rs.
Tho
usa
nd C
rore
(19
90 p
rice
s)
Base High Growth Low Growth
0
1000
2000
3000
4000
5000
6000
7000
8000
1990 1995 2000 2005 2010 2015 2020 2025 2030
Rs.
Tho
usa
nd C
rore
(19
90 p
rice
s)
Base High Growth Low Growth

Energy consumption
0
10
20
30
40
50
1990 1995 2000 2005 2010 2015 2020 2025 2030
Exa
jou
les
Base High Growth Low Growth
0
10
20
30
40
50
1990 1995 2000 2005 2010 2015 2020 2025 2030
Exa
jou
les
Base High Growth Low Growth

Energy Mix: Low Growth
0
5
10
15
20
25
30
35
40
1990 1995 2000 2005 2010 2015 2020 2025 2030
Exa
jou
les
C.Oil N.Gas Coal Nuclear Hydro Solar
0
5
10
15
20
25
30
35
40
1990 1995 2000 2005 2010 2015 2020 2025 2030
Exa
jou
les
C.Oil N.Gas Coal Nuclear Hydro Solar

Energy Mix: High Growth
0
10
20
30
40
50
1990 1995 2000 2005 2010 2015 2020 2025 2030
Exa
jou
les
C.Oil N.Gas Coal Nuclear Hydro Solar
0
10
20
30
40
50
1990 1995 2000 2005 2010 2015 2020 2025 2030
Exa
jou
les
C.Oil N.Gas Coal Nuclear Hydro Solar
ResultsTax Scenarios
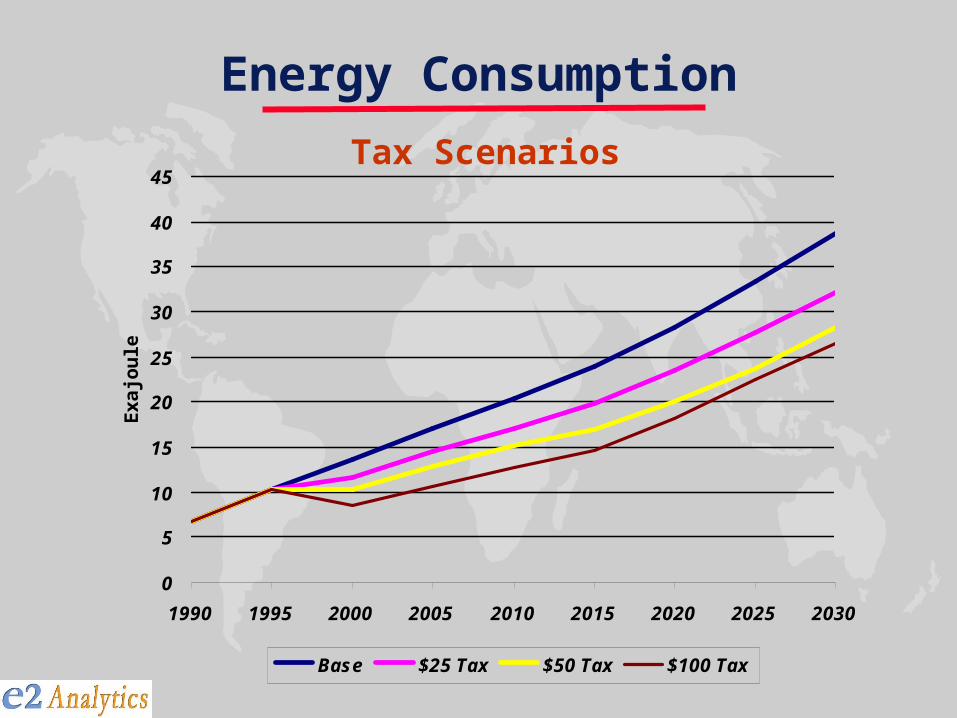
Energy Consumption
0
5
10
15
20
25
30
35
40
45
1990 1995 2000 2005 2010 2015 2020 2025 2030
Ex
ajo
ule
s
Base $25 Tax $50 Tax $100 Tax
Tax Scenarios

Energy Consumption: Fuel-wise
OIL
0
2
4
6
8
10
12
14
16
1990 1995 2000 2005 2010 2015 2020 2025 2030
GAS
0
1
2
3
4
5
6
7
1990 1995 2000 2005 2010 2015 2020 2025 2030
COAL
0
2
4
6
8
10
12
14
16
18
20
1990 1995 2000 2005 2010 2015 2020 2025 2030
NUCLEAR
0
0.2
0.4
0.6
0.8
1
1.2
1.4
1.6
1.8
2
1990 1995 2000 2005 2010 2015 2020 2025 2030
HYDRO
0
0.5
1
1.5
2
2.5
1990 1995 2000 2005 2010 2015 2020 2025 2030
Base $25 Tax $50 Tax $100 Tax
SOLAR
0
0.1
0.2
0.3
0.4
0.5
0.6
1990 1995 2000 2005 2010 2015 2020 2025 2030
Tax Scenarios

Compare Ref.
Energy Consumption: $100 Tax
0
5
10
15
20
25
30
1990 1995 2000 2005 2010 2015 2020 2025 2030
C.Oil N.Gas Coal Nuclear Hydro Solar

0
100200300400500600700800900
1000
1990 1995 2000 2005 2010 2015 2020 2025 2030
Terg
ram
s ca
rbo
n
Base $25 Tax $50 Tax $100 Tax
CO2 Emissions
Tax Scenarios

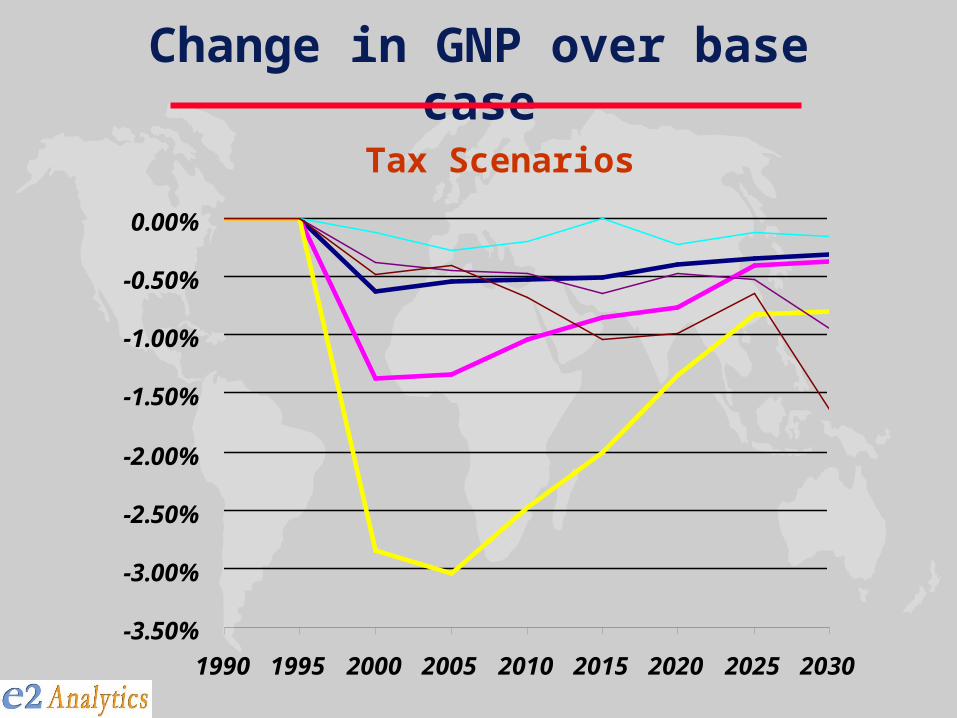
Change in GNP over base case
-3.50%
-3.00%
-2.50%
-2.00%
-1.50%
-1.00%
-0.50%
0.00%
1990 1995 2000 2005 2010 2015 2020 2025 2030
Tax Scenarios
-3.50%
-3.00%
-2.50%
-2.00%
-1.50%
-1.00%
-0.50%
0.00%
1990 1995 2000 2005 2010 2015 2020 2025 2030
Change in GNP over base case
Tax Scenarios

0
5
10
15
20
25
Base $25 Tax $50 Tax $100 Tax
BtC
CO2 Emissions: Cumulative
Tax Scenarios

ResultsAdvance Technology Scenarios

0100200300400500600700800900
1000
1990 1995 2000 2005 2010 2015 2020 2025 2030
Terg
ram
s ca
rbo
n
Base $25 Tax High SolarMed Solar + $5 Tax Med Solar + $25 Tax
CO2 Emissions

0
5
10
15
20
25
Base High Solar Med Solar + $5Tax
Med Solar +$25 Tax
BtCCO2 Emissions

Solar in Electricity
0%
2%
4%
6%
8%
10%
12%
14%
16%
18%
1990 1995 2000 2005 2010 2015 2020 2025 2030
Base High Solar$25 Tax Med Solar + $5 TaxMed Solar + $25 Tax

Change in GNP over base case
-0.8%
-0.6%
-0.4%
-0.2%
0.0%
0.2%
0.4%
0.6%
0.8%
1990 1995 2000 2005 2010 2015 2020 2025 2030
High Solar $25 Tax
Med Solar + $5 Tax Med Solar + $25 Tax

-20
-15
-10
-5
0
5
10
15
20
25
30
35
1990 1995 2000 2005 2010 2015 2020 2025 2030Rs.
Th
ou
san
d C
r.
High Solar $25 Tax
Med Solar + $5 Tax Med Solar + $25 Tax
Change in GNP over base case