shizuoka bank group · 3 to our shareholders the various policies introduced under the abenomics...
TRANSCRIPT

Shizuoka Bank GroupAnnual Report 2014
1
Economic Overview of Shizuoka Prefecture
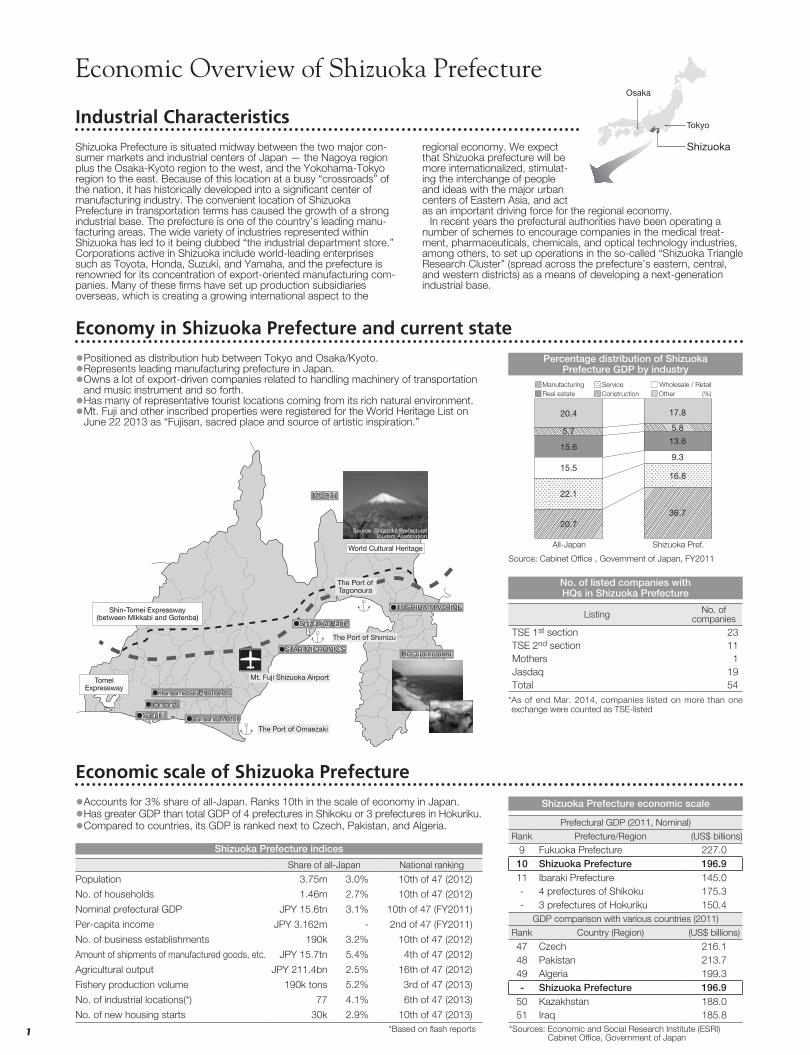
Economic scale of Shizuoka Prefecture●�Accounts for 3% share of all-Japan. Ranks 10th in the scale of economy in Japan.●�Has greater GDP than total GDP of 4 prefectures in Shikoku or 3 prefectures in Hokuriku.●�Compared to countries, its GDP is ranked next to Czech, Pakistan, and Algeria.
Share of all-Japan National ranking
Population 3.75m 3.0% 10th of 47 (2012)
No. of households 1.46m 2.7% 10th of 47 (2012)
Nominal prefectural GDP JPY 15.6tn 3.1% 10th of 47 (FY2011)
Per-capita income JPY 3.162m - 2nd of 47 (FY2011)
No. of business establishments 190k 3.2% 10th of 47 (2012)
Amount of shipments of manufactured goods, etc. JPY 15.7tn 5.4% 4th of 47 (2012)
Agricultural output JPY 211.4bn 2.5% 16th of 47 (2012)
Fishery production volume 190k tons 5.2% 3rd of 47 (2013)
No. of industrial locations(*) 77 4.1% 6th of 47 (2013)
No. of new housing starts 30k 2.9% 10th of 47 (2013)
Prefectural GDP (2011, Nominal)
Rank Prefecture/Region (US$ billions)
9 Fukuoka Prefecture 227.010 Shizuoka Prefecture 196.911 Ibaraki Prefecture 145.0- 4 prefectures of Shikoku 175.3- 3 prefectures of Hokuriku 150.4
GDP comparison with various countries (2011)
Rank Country (Region) (US$ billions)
47 Czech 216.148 Pakistan 213.749 Algeria 199.3- Shizuoka Prefecture 196.9
50 Kazakhstan 188.051 Iraq 185.8
Shizuoka Prefecture indices
Shizuoka Prefecture economic scale
Industrial CharacteristicsShizuoka Prefecture is situated midway between the two major con-sumer markets and industrial centers of Japan — the Nagoya region plus the Osaka-Kyoto region to the west, and the Yokohama-Tokyo region to the east. Because of this location at a busy “crossroads” of the nation, it has historically developed into a significant center of manufacturing industry. The convenient location of Shizuoka Prefecture in transportation terms has caused the growth of a strong industrial base. The prefecture is one of the country’s leading manu-facturing areas. The wide variety of industries represented within Shizuoka has led to it being dubbed “the industrial department store.” Corporations active in Shizuoka include world-leading enterprises such as Toyota, Honda, Suzuki, and Yamaha, and the prefecture is renowned for its concentration of export-oriented manufacturing com-panies. Many of these firms have set up production subsidiaries overseas, which is creating a growing international aspect to the
regional economy. We expect that Shizuoka prefecture will be more internationalized, stimulat-ing the interchange of people and ideas with the major urban centers of Eastern Asia, and act as an important driving force for the regional economy.
In recent years the prefectural authorities have been operating a number of schemes to encourage companies in the medical treat-ment, pharmaceuticals, chemicals, and optical technology industries, among others, to set up operations in the so-called “Shizuoka Triangle Research Cluster” (spread across the prefecture’s eastern, central, and western districts) as a means of developing a next-generation industrial base.
Tokyo
Shizuoka
Osaka
Economy in Shizuoka Prefecture and current state●�Positioned as distribution hub between Tokyo and Osaka/Kyoto.●�Represents leading manufacturing prefecture in Japan.●�Owns a lot of export-driven companies related to handling machinery of transportation
and music instrument and so forth.●�Has many of representative tourist locations coming from its rich natural environment.●�Mt. Fuji and other inscribed properties were registered for the World Heritage List on
June 22 2013 as “Fujisan, sacred place and source of artistic inspiration.”
* As of end Mar. 2014, companies listed on more than one exchange were counted as TSE-listed
Listing No. of companies
TSE 1st section 23TSE 2nd section 11Mothers 1Jasdaq 19Total 54
No. of listed companies with HQs in Shizuoka Prefecture
Mt. FujiMt. Fuji
The Port of TagonouraThe Port of Tagonoura
●TOSHIBA MACHINE●TOSHIBA MACHINE
●Shizuoka Bank●Shizuoka Bank
●STAR MICRONICS●STAR MICRONICS
The Port of ShimizuThe Port of Shimizu
Hot-spring areaHot-spring area
Mt. Fuji Shizuoka AirportMt. Fuji Shizuoka Airport
●Hamamatsu Photonics●Hamamatsu Photonics
●Yamaha●Yamaha
●Suzuki●Suzuki ●Yamaha Motor●Yamaha Motor
Tomei Expressway
Tomei Expressway
Shin-Tomei Expressway(between Mikkabi and Gotenba)
Shin-Tomei Expressway(between Mikkabi and Gotenba)
Source :Shizuoka PrefecturalTourism Association
The Port of OmaezakiThe Port of Omaezaki
World Cultural HeritageWorld Cultural Heritage
*Based on flash reports *Sources: Economic and Social Research Institute (ESRI) Cabinet Office, Government of Japan
Source: Cabinet Office , Government of Japan, FY2011
Percentage distribution of Shizuoka Prefecture GDP by industry
20.4
5.7
15.6
15.5
22.1
20.7
17.8
5.8
13.6
9.3
16.8
36.7
(%)OtherManufacturing Service Wholesale / Retail
All-Japan Shizuoka Pref.
Real estate Construction

New York, Los Angeles
Shizuoka Bank (Europe) S.A.
Hong Kong
Shanghai, Singapore
The Shizuoka Bank, Ltd.
Americas
Domestic
Head Office and Branches 174
Sub-branches 26
Subsidiaries 11
Consolidated Subsidiaries
Equity-method Affiliate
Branches 2
Subsidiary 1
Branch 1Representative Offices 2
Europe
Asia
Shizugin Management Consulting Co., Ltd.
Shizugin Lease Co., Ltd.
Shizuoka Computer Service Co., Ltd.
Shizugin Lease Co., Ltd.Shizugin Lease Co., Ltd.Shizugin Lease Co., Ltd.Shizugin TM Securities Co., Ltd.
Shizugin General Service Co., Ltd.
Shizugin Mortgage Service Co., Ltd.
Shizugin Business Create Co., Ltd.
Shizugin Saison Card Co., Ltd.
Shizugin Credit Guaranty Co., Ltd.
Shizugin DC Card Co., Ltd.
Shizuoka Capital Co., Ltd.
2
Shizuoka Bank Group at a Glance
Contents
NURTURING THE VISION OF A PROSPEROUS COMMUNITY
True to a corporate philosophy which aims to “expand dreams and affluence with our community,” the Shizuoka Bank Group makes an ongoing contribution to the development of the region around Shizuoka Prefecture, which forms the core of its business base. This corporate philosophy incorporates not only an economic dimension but also a cultural one: living in harmony with the local communities and the people we serve, sharing prosperity with them as a home-grown local banking group and a member of the regional community, and also helping local people to live more fulfilling lives.
A FIRST-CLASS REGIONAL BANK GROUP
The Shizuoka Bank Group comprises Shizuoka Bank and twelve Group companies, and is one of the largest regional banking groups in Japan. Centered on Shizuoka Bank with the Head Office, 173 branches and 26 sub-branches, the Group serves the needs of customers not only within Shizuoka Prefecture, its home region, but also three major economic centers in Japan, namely Tokyo, Osaka, and Nagoya, all of which are comparatively nearby. For overseas operation, the Bank operates in New York, Los Angeles, Brussels, Hong Kong, Shanghai, and Singapore.
The Structure of the Shizuoka Bank Group (As of July 1, 2014)
Economic Overview of Shizuoka Prefecture . . . . . . . . . . . . . . . . . . . . . . . . . . . . . . 1
Shizuoka Bank Group at a Glance . . . . . . . . . . . . . . . . . . . . . . . . . . . . . . . . . . . . . . . 2
To Our Shareholders . . . . . . . . . . . . . . . . . . . . . . . . . . . . . . . . . . . . . . . . . . . . . . . . . . . . 3
Message from the President . . . . . . . . . . . . . . . . . . . . . . . . . . . . . . . . . . . . . . . . . . . . 4
12th Medium-term Business Plan TOBIRA — Open a Gate for the Next . . 5
Financial Highlights . . . . . . . . . . . . . . . . . . . . . . . . . . . . . . . . . . . . . . . . . . . . . . . . . . . . . . 7
Sound Financial Condition . . . . . . . . . . . . . . . . . . . . . . . . . . . . . . . . . . . . . . . . . . . . . . . 8
Results of Initiatives in Fiscal 2013 . . . . . . . . . . . . . . . . . . . . . . . . . . . . . . . . . . . . . . . 9
Corporate Governance Structure . . . . . . . . . . . . . . . . . . . . . . . . . . . . . . . . . . . . . . . 11
Risk Management System . . . . . . . . . . . . . . . . . . . . . . . . . . . . . . . . . . . . . . . . . . . . . . 13
Region-based Relationship Banking . . . . . . . . . . . . . . . . . . . . . . . . . . . . . . . . . . . . 15
Support for Business Start-ups and Entry to New Business Fields and
Initiatives in Growth Fields . . . . . . . . . . . . . . . . . . . . . . . . . . . . . . . . . . . . . . . . . . . . . . 16
Support for Overseas Business Development . . . . . . . . . . . . . . . . . . . . . . . . . . . 17
Independent Auditor’s Report . . . . . . . . . . . . . . . . . . . . . . . . . . . . . . . . . . . . . . . . . 18
Consolidated Balance Sheet . . . . . . . . . . . . . . . . . . . . . . . . . . . . . . . . . . . . . . . . . . . 19
Consolidated Statement of Income . . . . . . . . . . . . . . . . . . . . . . . . . . . . . . . . . . . . . 20
Consolidated Statement of Comprehensive Income . . . . . . . . . . . . . . . . . . . . . 20
Consolidated Statement of Changes in Equity . . . . . . . . . . . . . . . . . . . . . . . . . . 21
Consolidated Statement of Cash Flows . . . . . . . . . . . . . . . . . . . . . . . . . . . . . . . . . 22
Notes to Consolidated Financial Statements . . . . . . . . . . . . . . . . . . . . . . . . . . . . 23
Key Consolidated Financial Indicators . . . . . . . . . . . . . . . . . . . . . . . . . . . . . . . . . . 41
The Shizuoka Bank . . . . . . . . . . . . . . . . . . . . . . . . . . . . . . . . . . . . . . . . . . . . . . . . . . . . 44
* Other than the above mentioned Group companies, Monex Group, Inc. is an equity-method affiliate of Shizuoka Bank.
010_0254585842609.indd 2 2014/08/13 14:46:32
3
To Our Shareholders
The various policies introduced under the Abenomics
have begun to yield concrete benefits and there are
signs that the Japanese economy is breaking free from
the prolonged period of economic stagnation. However,
turning to the situation in Shizuoka Prefecture, its indus-
trial structure keeps changing, and there is a concern
that this may act as a drag on economic recovery.
In this business environment, in April 2014 the Shi-
zuoka Bank Group launched its 12th Medium-term
Business Plan, “TOBIRA—Open a Gate for the Next.”
Through implementation of this new business plan, we
will fulfill our mission as a financial institution rooted in
the region by redoubling our commitment to region-
based relationship banking. For that purpose, we will
support a stable regional economy through the smooth
supply of funds and help invigorate economic activity
by facilitating the creation of new industries.
We request all of you—our shareholders and other
stakeholders—to offer us your continued support and
encouragement far into the future.
July 2014
Katsunori Nakanishi
President & Chief Executive Officer
Katsunori Nakanishi President & Chief Executive Officer
010_0254585842609.indd 3 2014/08/13 14:46:32

4
Message from the President“TOBIRA — Open a Gate for the Next”
Exploring new possibilities through the 12th Medium-term Business PlanAs the effects of the government’s monetary and fiscal policies become manifest, there is growing optimism about the prospects for the Japanese economy and a feeling of renewed confidence is evident in the country. For Japan to confirm its commitment to a vigorous new economic course, it is crucially important that private-sector compa-nies, which are at the heart of the nation’s growth strategy, grasp changes in the business environment, demonstrate the creativity and dynamism to open up the future and the resolve to lead economic regeneration, and explore all possibilities.
Based on this recognition, in April 2014 the Shizuoka Bank Group launched “TOBIRA—Open a Gate for the Next,” its 12th Medium-term Business Plan, and embarked on new challenges. Today, Japan is about to face structural change on an unprecedented scale affecting every aspect of society. In the new medium-term business plan, we have clearly indicated what actions we should take to fulfill the obliga-tion of a regional financial institution to contribute to the development of local communities in an era of drastic change. At the same time, adopt-ing “Breakthrough” as our watchword, we have also declared our resolve to explore new possibilities with bold ideas and approaches that are not relying on our previous experiences or successes.
The basic strategies in the plan are “Refine region-based relation-ship banking,” “Challenge on the new business fields and profitable opportunities,” “Build the flexible and robust operating structure,” and “Add more value to “Shizugin” brand.” Adhering to my creed of “Altruistic management,” we will open up a new and bold path to the future as a comprehensive financial group trusted and needed by local communities by implementing these four strategies.
Fulfilling our mission as a regional financial institutionIn the three-year period from fiscal 2011 to fiscal 2013, the term of “MIRAI”, our 11th Medium-term Business Plan, the Bank faced an adverse business environment characterized by a downward trend in interest on loans, the principal revenue stream for financial institutions, in a continuing low-interest-rate environment. Nevertheless, we were able to accomplish steady growth as a result of a united effort by our Group companies to reinforce our solutions-offering approach and further raise productivity. For instance, the balances of total deposits and total loans surpassed the ¥8,000 billion and ¥7,000 billion mile-stones, respectively.
Let me summarize the key initiatives in fiscal 2013. In corporate banking, we actively engaged in region-based relationship banking to continue to fulfill our mission as a regional financial institution. In particular, we utilized the comprehensive financial capabilities and dense information networks of our Group companies to create busi-ness matching opportunities to help companies in the region expand their sales channels. We also conducted the Shizuginship workshop to foster next-generation business leaders who will shape the future of the regional economy. In addition, we actively supported management improvement and business rehabilitation for a stable regional econ-omy by collaboration with external partners and the establishment of a loan system that flexibly responds to the need for funding for manage-ment reconstruction.
Furthermore, we made a concerted effort to resolve the diversify-ing management issues facing companies in the region through nurturing of entrepreneurs who inject new vitality into the regional economy, projects to support companies in growth fields such as
healthcare and nursing care, the environment, and agriculture, and support for overseas expansion and business succession.
In retail banking, we actively promoted housing loans offering enhanced security in the event of illness. We also increased loan limits on loans for education expenses and car purchases and began offer-ing unsecured loans that customers can use for any purpose. In addition, in the marketing of personal pension insurance and other investment products that help asset building, we rigorously adhered to user protection, the fundamental principle of the Financial Instruments and Exchange Act, strove to propose products suited to customers’ life plans and enhance after-service, and promoted utiliza-tion of Nippon Individual Savings Account (NISA). We consider deposit operations to be the foundation of banking services and are making efforts to obtain salary and pension remittance accounts and expand the customer base using our Internet branches.
As a result, in fiscal 2013, the final year of the 11th Medium-term Business Plan, we recorded record-high ordinary profit and net income and were able to achieve the three-year management targets in the business plan. To express our gratitude to our shareholders for the support that made these results possible, we increased the year-end dividend per share by ¥0.5 and paid the annual dividend of ¥15.5 per share.
Applying a global perspective to open up a bright future for the region
In terms of declining birthrates and population aging, Japan is defi-nitely a pacesetter. Viewed from a positive perspective, Japan will become a global pioneer in addressing the issues that other mature societies will increasingly encounter. It will be important for us to grasp the essence of matters and pursue world-class added value as well as demonstrate creativity and effectively utilize limited resources. Above all, I think that the accumulation of such efforts will be the key to achieving sustained growth of the Japanese economy. In the 12th Medium-term Business Plan, I have urged all our employ-ees to aspire to make the Shizuoka Bank the best regional bank in the world. This is because I am convinced that if we go about our daily work with world-class awareness and pride, this will result in contribu-tions to the communities we serve and lead to the growth of the Shizuoka Bank Group.
If we trace back the history of Shizuoka Prefecture, we find that Shizuoka has created a series of innovations attuned to the changing times and led the Japanese economy as a prefecture that excels in manufacturing. For instance, the emergence of the textile industry led to the development of automatic looms, and the technologies created in that process spawned new industries. If we look at the natural surround-ings, we find that Shizuoka offers a mild climate and beautiful views of a long coastline and Mt. Fuji. I believe that if Shizuoka can propose a comfortable way of life appropriate for an aging society, a new path to the future will be illuminated. Thus, I am convinced that if local communities join together and pool their wisdom, are aware of Shizuoka’s role as a pioneering prefecture in coping with structural change, and commit themselves to creative and original initiatives grounded in a global perspective, we will be able to open up limitless possibilities.
Sharing the issues and risks confronting the regional economy, the Shizuoka Bank Group will continue to embrace the challenges posed by the changing times. We are committed to making a concerted effort to “open a gate for the next” so that the region we serve can advance to a bright future.
I look forward to your continued support in the years ahead.
010_0254585842609.indd 4 2014/08/13 14:46:33

5
Realize the Group Vision, “Shizugin” that ventures on the new possibilities
12th Medium-term Business PlanTOBIRA — Open a Gate for the Next
In April 2014, the Shizuoka Bank Group launched its 12th Medium-term Business Plan, “TOBIRA—Open a Gate for the Next.” Through implementation of the plan, we will build a foundation for the sustainable growth of the Shizuoka Bank Group far into the future by emphasizing innovation and speed in the bold exploration of new possibilities while further advancing the initiatives for region-based relationship banking and productivity improvement implemented under the 11th Medium-term Business Plan.
In view of remaining issues subsequent to the completion of the 11th medium-term business plan and changes in the industrial structure, the 12th Medium-term Business Plan is formulated based on the four key concepts described below.
With the 12th Medium-term Business Plan, we are implement-ing two strategies for top-line growth, a strategy for the operational system, and a branding strategy in a well-balanced manner with the aim of realizing the Group Vision—“Shizugin” that ventures on the new possibilities.
Enhance presence and competitiveness
• Implement strategies emphasizing innovation and speed• Secure competitiveness inside and outside Shizuoka Prefecture
Open up a window of new profitable opportunities and rebuild business structure with fresh ideas
• Create new profitable opportunities by thinking outside the box• Offer products and services attuned to diversifying customer
needs• Offer comprehensive solutions through utilization of Group
companies
Take over and reinforce the initiatives of the 11th Medium-term Business Plan
• Step up initiatives of the 11th Medium-term Business Plan for region-based relationship banking and productivity improvement
Increase stakeholders’ satisfaction
• Increase satisfaction of all stakeholders (shareholders, com-munity, customers, and employees)
Aspirations articulated by the Group Vision and Guideline for action
• We view the change in the environment as an opportunity. As a financial institution rooted in the region, we aspire to contribute to regional development by reinforcing the initiatives implemented so far and by embracing new challenges through out-of-the-box thinking and process.
• Every one of our employees aspires to develop and improve, for which purpose they continually review their performance. Based on our combined efforts, we aim to be the banking group of choice for all our stakeholders.
Fiscal 2016 targets Fiscal 2013 results
Profit targetsConsolidated ordinary profit
¥80.0 billion or more
¥74.7 billion
Consolidated net income¥50.0 billion or
more ¥46.7 billion
Efficiency indicatorsConsolidated ROE (Consolidated Common Equity Tier I Basis)
6% level 6.51%
Consolidated OHR around 55% 54.71%Financial soundness indicator
Consolidated Common Equity Tier I Ratio
around 14% 15.43%
Indicator for investors Shareholder return ratio50% or more over the medium term
75.73%
Period Covered Three years from FY2014 to FY2016
Key Concepts
Group Vision
Basic Strategies
Target performance indicators“Shizugin” that ventures on the new possibilities
Guideline for action We aim to be the best regional bank in the world with taking “Breakthrough” to heart
1
2
3
4
5
Basic Strategy 1
Basic Strategy 3
Basic Strategy 2
Basic Strategy 4
Refine region-based relationship banking
Build the flexible and robust operating structure
Operating Structure
Top-line Growth
Significance of “TOBIRA”“TOBIRA” means gate in Japanese. We liken the 12th Medium-term Business Plan to opening a gate to the future. This expresses our resolution to open a gate to the next through thinking and approaches unconstrained by conventional ways, the Shizuoka Bank Group can create a new style of regional financial institution.
Branding
Challenge on the new business fields and profitable opportunities
Add more value to “Shizugin” brand
12th Medium-term Business Plan (FY2014-FY2016)
TOBIRA—Open a Gate for the NextRealize a new style of regional
financial institution
11th Medium-term Business Plan (FY2011-FY2013)
MIRAI—FutureReinforced solution-based approach
Boosted further productivity
Positioning of the 12th Medium-term Business Plan
10th Medium-term Business Plan (FY2008-FY2010)
“Dream Ten—New Challenges”Established the earnings model
Improved productivity
010_0254585842609.indd 5 2014/08/13 14:46:33

6
Strategic investment in the 12th medium-term business plan
12th Medium-term Business PlanBasic Strategies
Impact of investment and goals
Build next-generation systems
Upgrade marketing approach• Use EBM and other advanced marketing
techniques, and offer tailored products and services
Link up outlet channels• Shift to an omni-channel marketing approach
well-tuned to customer needs and lifestyles
Capitalize on new ventures• Offer new financial services• Move into new business domains
Sophisticate risk management• Apply a wider range of information to risk
management
Increase business efficiency and improve productivity
• Reform work styles, promote paperless operation
IT investment
Investment in new businesses
Construction of new HQ building
Upgrade information infrastructure
Build infrastructure for channel integration
Corporate Banking Retail Banking
• Strengthen solution sales in unison with Group companies • Fully utilize Group functions to help our customers resolve issues
• Increase housing-related loan balance and cultivate new markets• Offer a greater range of products and services attuned to needs• Promote labor saving and expedite credit screening through BPR• Promote asset-building loans• Strengthen commitment to consumer finance
• Promote solution-based approach for individual customers • Strengthen collaboration with Shizugin TM Securities Co., Ltd.• Launch wealth management service, including solution offering for asset management, support for
business succession, and descent-related matters
• Expand the retail customer base for deposit operations• Attract customers who will open main accounts, such as pension and salary remittance accounts• Encourage customers to start foreign currency deposits by utilizing direct channels
• Upgrade marketing approach and apply mass marketing to individuals through effective utilization of non-face-to-face channels• Expand sales of unsecured loan products through non-face-to-face channels• Enhance efficiency of sales & marketing using CRM and EBM
• Strengthen initiatives for management improvement and business rehabilitation support services• Enrich management improvement support measures by expanding collaboration with external organizations• Utilize corporate rehabilitation financing
• Improve productivity• Develop IT-based efficient sales force structure• Establish a PDCA cycle promoting autonomous kaizen by personnel in charge of customer relations
• Increase customers’ satisfaction• Establish PDCA cycle for increasing
customers’ satisfaction• Improve loyalty corresponding to each
customer segment• Position as the most attractive bank in
its locality
• Increase employees’ satisfaction• Achieve work-life balance• Promote mental and physical health
of employees
• Earn higher evaluation and confidence in the region• Contribute to the region economically, socially, and environmentally• Encourage employees to voluntarily participate in activities
contributing to the region
• Earn higher evaluation from shareholders and the market• Enhance corporate value by maintaining the appro-
priate capital adequacy ratio, improving shareholder returns, and promoting proactive disclosure
• Strengthen compliance systems• Put in place a system for sales of financial products from the customers’ viewpoint• Enhance employee ethics
• Upgrade sales & marketing channels• Strengthen functions of each channel and enhance integration of channels (information sharing)• Establish a marketing method responding to customers’ behavior and needs
• Sophisticate risk management• Put in place an integrated risk management system responding to new risks • Enhance credit portfolio control functions• Strengthen management of systems risk responding to increasingly sophisticated systems
• IT strategy• Upgrade IT infrastructure to achieve each divisional strategy (corporate banking, retail banking, operating structure)
• Increase transactions in growth fields and markets• Enhance expertise in growth fields (healthcare and welfare, business succession, environment, and
agriculture); strengthen collaboration with other industries• Strengthen capabilities to address needs of customers before and after their entry to overseas markets
• Promote sales & marketing for top-line growth• Increase loans to small businesses• Upgrade the system for supporting business startups through collaboration with Group companies and
external partners
• Aim to be No.1 bank for supporting regional development projects• Exercise leadership in regional development projects• Vigorously engage in industrial cluster development, infrastructure improvement projects, etc.
Basic Strategy 1 Refine region-based relationship banking Basic Strategy 2 Challenge on the new business fields and profitable opportunities
We aim to achieve sustained growth in tandem with the region by strengthening relationships with the region and customers through addressing the customers’ issues and offering value-added services.
Capitalizing on the Bank’s credibility as a top-tier regional bank and our robust financial posi-tion, we will venture into new growth fields beyond conventional business fields through vigor-ous investment and by shouldering risk to achieve medium- to long-term growth.
Basic Strategy 3 Build the flexible and robust operating structure
We will promote strategic investment in infrastructure to strengthen earnings power and press on business process reengineering (BPR) for productivity improvement. We aim to build a robust oper-ating structure capable of flexibly and swiftly responding to changes in the business environment and supporting our growth strategy.
Basic Strategy 4 Add more value to “Shizugin” brand
In addition to activities contributing to the region and initiatives enhancing customer and employee satisfaction, we endeavor to enhance the satisfaction of all stakeholders by maintaining the capital adequacy ratio at an appropriate level to ensure soundness of the capital structure and by consistently offering attractive shareholder returns. Through these endeavors, we aim to further enhance the value of the Shizugin brand and become the banking group of choice for all customers.
Strategic investment towards realization of basic strategyTopics Capital and business alliance
with Monex Group, Inc.
The Shizuoka Bank, Ltd. and Monex Group, Inc. entered into a capital and busi-ness alliance on April 2, 2014.
Combining the respective resources, we aim to create a unique and improved financial experience for our retail customers, through actively implementing leading edge technology and ideas in the online space. Shizuoka Bank acquired 20.0% (57,536,100 shares) of Monex Group following the conclusion of the agreement. Monex Group is an equity-method affiliate of Shizuoka Bank from fiscal 2014.
Outline of Monex GroupMonex Group, with its affiliates, is the only online securities group in the world that has a retail customer base in Japan, the United States, and China (Hong Kong) and provide online financial services for individual investors as its principal business.Date of Incorporation : August 2004Capital : ¥10,394 million Total assets : ¥929,431 millionEmployees : 992 (of which, 305 in Japan, 616 in the U.S., and 71 in China)Headquarters : Kojimachi, Chiyoda-ku, TokyoOverseas Branches : Florida, Beijing, Hong Kong, Sidney, London, Costa RicaRating : BBB (JCR)
(as of March 31, 2014)
Next-generation systemsOffering of tailored products and services
Infrastructure for channel integrationResponding to customer needs
Information infrastructureUpgraded marketing approach and
utilization of information
Information sharing through linkage of systems
010_0254585842609.indd 6 2014/08/13 14:46:33

7
Financial Highlights
Business PerformanceConsolidated Financial Summary
Billions of Yen
2011 2012 2013YoY
changeOrdinary income 205.1 203.1 220.9 +17.8Ordinary profit 68.8 71.3 74.7 +3.4Net income 37.2 57.0 *1 46.7 (10.3)Capital adequacy ratio (%) 17.49 17.46 *2 16.85 *2 (0.61)Tier I ratio (%) 16.06 15.55 *3 15.43 *3 (0.12)*1 Gains on negative goodwill by increasing equity stakes in Group
companies : ¥12.9 billion*2 Based on Basel III standard*3 Common Equity Tier I Ratio (based on Basel III standard)* Year-on-year change is a simple subtraction of the figures in the table.
Nonconsolidated Financial SummaryBillions of Yen
2011 2012 2013YoY
changeOrdinary income 174.8 171.0 186.1 +15.1Gross operating profit 148.3 146.3 144.5 (1.8)Net operating profit 67.2 67.6 64.7 (2.9)Actual net operating profit 67.2 67.6 64.7 (2.9)Core net operating profit 59.7 57.9 62.8 +4.9Ordinary profit 62.3 65.2 67.2 +2.0Net income 34.7 40.9 42.8 +1.9Loans 6,694.9 6,994.0 7,240.8 +246.8Deposits 7,674.1 7,932.5 8,234.3 +301.8Net assets 720.1 781.4 790.8 +9.4Total assets 9,632.4 10,250.2 10,616.6 +366.4* Actual net operating profit = Net operating profit + Provision for general
allowance for loan losses* Core net operating profit = Net operating profit + Provision for general
allowance for loan losses – Bond-related income* Deposits do not include negotiable certificates of deposit.* Year-on-year change is a simple subtraction of the figures in the table.
Operational Efficiency (Nonconsolidated Basis)
2011 2012 2013YoY
changeReturn on equity (ROE) 5.70 6.52 6.73 +0.21Return on assets (ROA) 0.38 0.43 0.42 (0.01)Overhead ratio (OHR) 54.69 53.79 55.19 +1.40Net income per share (yen) 52.44 62.79 67.83 +5.04Net assets per share (yen) 1,097.55 1,204.31 1,257.62 +53.31ROE = Net income / Shareholders’ equity
ROE indicates a company’s efficiency in generating profits using shareholders’ equity (efficiency of capital). The higher the ROE, the higher the efficiency.ROA = Net income / Total assets
ROA indicates a company’s efficiency in generating profits using total assets (efficiency of assets).The higher the ROE, the higher the efficiency.OHR = Operating expenses / Gross operating profit
OHR indicates the ratio of operating expenses to gross operating profit.The lower the OHR, the higher the efficiency.
Shareholder Returns
Share Buyback
Cash DividendsThe Shizuoka Bank determines dividend payment taking into consideration the market trend and the Bank’s financial performance.
Emphasizing returning profit to shareholders, the Bank increased the dividend per share (full year) for fiscal 2013 by ¥0.5 to ¥15.5 per share and the payout ratio was 22.78%.
Maintaining its emphasis on shareholder returns, the Bank intends to pay a dividend of ¥16 per share for the full year of fiscal 2014.
Cash dividendsFY 2012 FY 2013 FY2014 Forecast
Dividend per share (full year) (yen) * 15.00 15.50 16.00
Dividend yield (dividend / share price at year-end) (%) 1.42 1.53 -
* Including a commemorative dividend of ¥1 per share.
Shareholder returns
FY 2012 FY 2013FY2004-FY2013
(10 years)
Annual dividend (billion yen) a 9.7 9.7 86.7(accumulated total)
Purchase of treasury stock (billion yen)
b 8.2 22.7 77.1(accumulated total)
Shareholder returns(billion yen)
c=a+b 18.0 32.4 163.8(accumulated total)
Net income (billion yen) d 40.9 42.8 336.5(accumulated total)
Payout ratio (%) a/du100 23.78 22.78 25.76(average)
Shareholder return ratio (%) c/du100 43.93 75.73 48.66(average)
Since fiscal 1997 when the procedures for share buyback were relaxed, the Shizuoka Bank has been repurchasing its own stock. The Bank had repurchased 181 million shares by the end of fiscal 2013. We believe increasing the efficiency of capital and enhancing shareholder returns will lead to higher corporate value.
The 12th Medium-term Business Plan launched in April 2014 sets a target for shareholder returns comprising both dividends and stock repurchases. The target shareholder return ratio is 50% or higher for the medium term.
What is share buyback?Repurchase by a company of its own stock.
As stock repurchase and retirement decrease the number of shares issued and outstanding, book-value per share (BPS) and earnings per share (EPS) will increase, leading to higher share value.
010_0254585842609.indd 7 2014/08/13 14:46:34

8
Sound Financial Condition
High Credit RatingsThe Shizuoka Bank has ratings from two international rating agencies and one Japanese agency.
At the date of this annual report, the Bank has long-term and short-term ratings of Aa3 and P-1, respectively, from Moody’s, and A+ and A-1 from Standard & Poor’s. These credit ratings are among the highest received by any Japanese financial institution.
The Shizuoka Bank’s credit ratings (as of July 1, 2014)Long-term
ratingShort-term
ratingFinancial strength
ratingMoody’s Aa3 P−1 C+Standard & Poor’s A+ A−1 a+*Rating and Investment Information, Inc. AA - -
* Stand-alone credit profile (Credit profile of a financial institution excluding the government support factor in the event of emergency)
Sound AssetsIn addition to minimizing the occurrence of non-performing loans by helping loan customers improve their management, the Shizuoka Bank promotes business turnaround and clear-ing of non-performing loans off its balance sheet. As a result, as of March 31, 2014, risk-monitored loans totaled ¥165.5 billion and the ratio of risk-monitored loans to total loans was 2.28%. In the case of the application of partial direct write-off, net risk-monitored loans, which exclude loans guaranteed by Credit Guarantee Corporations and the amount covered by collateral or allowance for loan losses from risk-monitored loans, totaled ¥19.2 billion and the ratio of net risk-monitored loans to total loans was 0.26%.
Credit costs decreased because of lower disposal of non-performing loans and reversal of allowance for loan losses. As a result, the ratio of net credit costs to average loan balance was 0.007%.* Partial direct write-off is an accounting treatment. With partial direct write-off, the
amount deemed collectible through the disposal of collateral and execution of guarantees is deducted from the amount of loans to legally bankrupt borrowers or virtually bankrupt borrowers, and the remaining amount is directly written off from the amount of loans. The Shizuoka Bank does not apply partial direct write-off.
Risk-monitored loans (nonconsolidated basis) (¥billion)As of March 31,
2012As of March 31,
2013As of March 31,
2014Risk-monitored loans 228.5 203.6 165.5Ratio of risk-monitored loans *1 3.41% 2.91% 2.28%Ratio of net risk-monitored loans *2 0.31% 0.34% 0.26%*1 Ratio of risk-monitored loans = Risk monitored loans / Total loans*2 Ratio of net risk-monitored loans = (Risk-monitored loans – Partial direct write-off –
Loans guaranteed by Credit Guarantee Corporations – Collateral and allowance for loan losses) / Total loans
Credit-related costs (nonconsolidated basis) (¥billion)FY 2011 FY 2012 FY 2013
Disposal of non-performing loans *3 1.0 0.5 1.0Transfer to specific allowance for loan losses − − −
Transfer to general allowance for loan losses − − −Reversal of allowance for loan losses 0.7 0.4 0.5Recoveries of written-off claims − − −
Net credit-related costs 0.3 0.1 0.5Net credit cost ratio *5 0.004% 0.002% 0.007%
*3 Disposal of non-performing loans = Provision for to specific allowance for loan losses + Written-off amount of loans + Losses on sales of non-performing loans
*4 For fiscal 2011, 2012 and 2013, the sum of provision for general allowance for loan losses and provision for specific allowance for loan losses was negative, and therefore recorded as reversal of allowance for loan losses. Reversal of general allowance for loan losses amounted to ¥3.8 billion in FY 2011, ¥4.5 billion in FY 2012, and ¥4.6 billion in FY 2013, and provision for specific allowance for loan losses amounted to ¥3.1 billion, ¥4.1 billion and ¥4.1 billion, respectively.
*5 Net credit cost ratio = Net credit cost / Average loan balance
High Capital AdequacyThe capital adequacy ratio based on the formula specified by the Basel Committee on Banking Supervision (capital adequacy ratio based on the standard set by the Bank for International Settlements (BIS)) is an important indicator of soundness and credibility of banks. Banks with international operations, which include the Shizuoka Bank, are required to have a capital adequacy ratio of at least 8%.
With Basel II, a regulatory standard on capital adequacy introduced in March 2007, banks can choose a method of calculating the capital ratio in accordance with the banks’ risk profile and management methodologies. Furthermore, the Bank adopts Basel III, a new standard for regulatory capital adequacy ratio which requires higher capital standards both in quality and volume from fiscal 2012. The Shizuoka Bank has taken steps to upgrade its risk management in response to diversification of operations and transactions and is improving internal systems with the aim of adopting a more sophisticated method of calculation.
BIS Capital Adequacy RatioThe capital adequacy ratio (consolidated basis) based on Basel III as of March 31, 2014 was 16.85%, and the consoli-dated Common Equity Tier I ratio was 15.43%, well above the 8% standard for banks with international operations.
BIS capital adequacy ratio (consolidated basis)
(%)
8
10
12
14
18
1616.06
15.55
17.49 17.46
14.40
15.30
As of March 31, 2013
As of March 31, 2011
As of March 31, 2012
BIS capital adequacy ratio Tier I ratio Common Equity Tier I ratio
Basel II Basel III
15.43
16.85
As of March 31, 2014
*4
010_0254585842609.indd 8 2014/08/13 14:46:34

9
Results of Initiatives in Fiscal 2013
Loans (Nonconsolidated)Total loans (average balance)
The average balance of total loans in fiscal 2013 increased ¥342.1 billion or at an annual rate of 5.1% to ¥7,011.5 billion. Of this amount, the average balance of loans in Shizuoka Prefecture increased ¥130.8 billion to ¥4,576.6 billion. The Bank’s share of loans in Shizuoka Prefecture was 30.2% as of March 31, 2014.
Retail loans (average balance)
The average balance of retail loans in fiscal 2013 increased ¥99.2 billion from fiscal 2012 to ¥2,400.8 billion. Of this amount, the average balance of retail loans in Shizuoka Prefecture increased ¥63.5 billion to ¥1,937.1 billion.
SME loans (average balance)
The average balance of loans to small and medium-sized enterprises (SMEs) in fiscal 2013 increased ¥48.2 billion from fiscal 2012 to ¥2,726.2 billion. Of this amount, the average balance of loans to SMEs in Shizuoka Prefecture decreased ¥2.8 billion to ¥2,047.3 billion.
Consumer loans (year-end balance)
The balance of consumer loans at the end of fiscal 2013 was ¥2,490.1 billion, having increased ¥134.6 billion from the end of fiscal 2012, centering on housing loans.
Bank as a whole In Shizuoka PrefectureShare of total loans provided by all types of financial institutions in Shizuoka Prefecture (year-end balance)
6,517.7 6,669.4
FY11 FY12 FY13
3,000
4,000
5,000
6,000
7,000
8,000(%)(¥ billion)
4,411.9 4,445.8
7,011.5
4,576.6
30.2 30.2 30.2
Compared with FY2012+¥342.1 billion
2,240.0
1,830.1
2,301.6
1,873.6
FY11 FY12
(¥ billion)
1,500
2,000
2,500
Bank as a whole In Shizuoka Prefecture
2,400.8
1,937.1
FY13
Compared with FY2012+¥99.2 billion
2,291.7
1,863.8
2,490.1
1,993.5
2,355.5
1,905.7
Housing loans
1,700
1,900
2,100
2,300
2,500
2,700(¥ billion)
In Shizuoka Prefecture
Unsecured loansOther loans
Housing loansUnsecured loansOther loans
As of March 31, 2012
As of March 31, 2013
As of March 31, 2014
Bank as a whole
Compared with March 31, 2013+¥134.6 billion
* Housing loans include loans for condominiums.* Unsecured loans include loans for car purchases, and educational expenses and
loans taken out using bank cards. Other loans include capital loans.
2,047.3
2,636.2
2,027.4
2,678.0
2,050.1
FY11 FY12 FY13
(¥ billion)
1,600
2,000
2,400
2,800 2,726.2
Bank as a whole In Shizuoka Prefecture Compared with FY2012+¥48.2 billion
* Local public corporations are excluded.
010_0254585842609.indd 9 2014/08/13 14:46:34
10
Assets under CustodyRetail customers’ assets under custody (year-end balance)
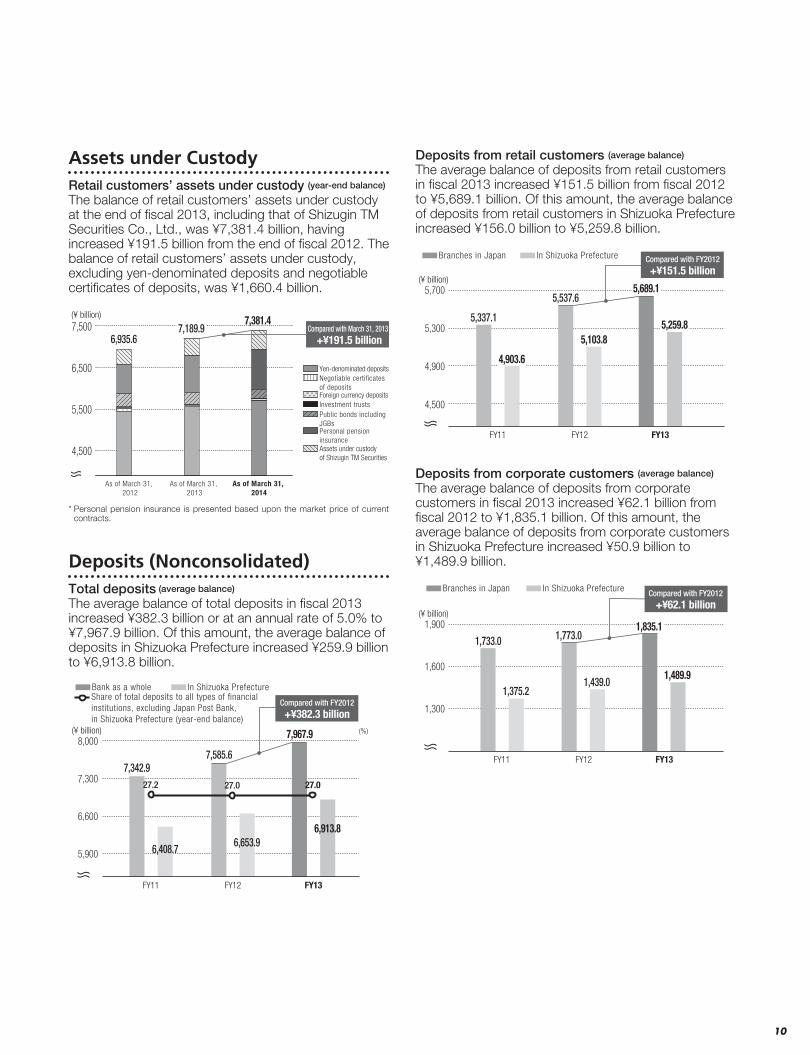
The balance of retail customers’ assets under custody at the end of fiscal 2013, including that of Shizugin TM Securities Co., Ltd., was ¥7,381.4 billion, having increased ¥191.5 billion from the end of fiscal 2012. The balance of retail customers’ assets under custody, excluding yen-denominated deposits and negotiable certificates of deposits, was ¥1,660.4 billion.
Deposits (Nonconsolidated)Total deposits (average balance)
The average balance of total deposits in fiscal 2013 increased ¥382.3 billion or at an annual rate of 5.0% to ¥7,967.9 billion. Of this amount, the average balance of deposits in Shizuoka Prefecture increased ¥259.9 billion to ¥6,913.8 billion.
Deposits from retail customers (average balance)
The average balance of deposits from retail customers in fiscal 2013 increased ¥151.5 billion from fiscal 2012 to ¥5,689.1 billion. Of this amount, the average balance of deposits from retail customers in Shizuoka Prefecture increased ¥156.0 billion to ¥5,259.8 billion.
Deposits from corporate customers (average balance)
The average balance of deposits from corporate customers in fiscal 2013 increased ¥62.1 billion from fiscal 2012 to ¥1,835.1 billion. Of this amount, the average balance of deposits from corporate customers in Shizuoka Prefecture increased ¥50.9 billion to ¥1,489.9 billion.
5,259.8
FY13
5,337.1
4,903.6
5,537.65,689.1
5,103.8
FY11 FY12
4,500
4,900
5,300
5,700
Branches in Japan In Shizuoka Prefecture
(¥ billion)
Compared with FY2012+¥151.5 billion
FY13
27.0
6,913.8
7,967.9
FY11 FY12
5,900
6,600
7,300
8,000
Bank as a whole In Shizuoka PrefectureShare of total deposits to all types of financial institutions, excluding Japan Post Bank, in Shizuoka Prefecture (year-end balance)
(%)(¥ billion)
27.2 27.0
6,408.7 6,653.9
7,342.97,585.6
Compared with FY2012+¥382.3 billion
FY13
1,835.1
1,489.9
1,300
1,600
1,900
FY11 FY12
Branches in Japan In Shizuoka Prefecture
(¥ billion)
1,375.2
1,773.01,733.0
1,439.0
Compared with FY2012+¥62.1 billion
4,500
5,500
6,500
7,5006,935.6
7,381.47,189.9
(¥ billion)
Yen-denominated depositsNegotiable certificates of depositsForeign currency deposits
Public bonds including JGBsPersonal pension insuranceAssets under custody of Shizugin TM Securities
Investment trusts
As of March 31, 2012
As of March 31, 2013
As of March 31, 2014
Compared with March 31, 2013+¥191.5 billion
* Personal pension insurance is presented based upon the market price of current contracts.
010_0254585842609.indd 10 2014/08/13 14:46:34

11
Corporate Governance StructureFoundation for fulfilling corporate social responsibilityThe Shizuoka Bank Group is strengthening its management systems to enhance corporate value.
FrameworkThe Board of Directors consisting of ten directors is responsible for management-level decision-making and supervision based on the corporate philosophy and the Ethical Charter. The Board of Directors decides on important management strategies, such as medium-term business plans and operational plans, and basic policies relating to compliance and risk management. It also oversees the execution of operations.
The Shizuoka Bank has adopted the Audit & Supervisory Board Member system of governance. The Audit & Supervisory Board consists of four Audit & Supervisory Board Members, two of whom are outside Audit & Supervisory Board Members. Audit & Supervisory Board Members audit directors’ performance of their duties based on the auditing standards for Audit & Supervisory Board Members.
The Committee of Administrative Supervision (which is not a committee pursuant to the Companies Act but an optional organizational body) was established to reinforce supervision of the Directors' execution of operations and to strengthen corporate governance. This committee, consisting mainly of directors who are not involved in execution of operations and are selected by the Board of Directors, monitors the situation
of the execution of operations by the executive team consisting of the President & CEO, the Deputy President & CFO, and other directors, as well as executive officers appointed by the Board of Directors (as of June 23, 2014, there were 14 executive officers, six of whom concurrently held the post of director) and requires improvement, if necessary. Decisions on important matters that arise in the course of these day-to-day operations are made by convening bodies, including the Executive Committee, which have been established for particular fields of operation and appointed by the Board of Directors. This approach is designed to create a system that can respond precisely and flexibly to changes in the management environment, while clearly delineating authority and responsibility.
The Bank has one outside director. In addition, the Bank has the Advisory Board (in principle, the Advisory Board meets each quarter), consisting mainly of executives from outside the Bank, to reflect outside viewpoints with the goal of ensuring the objectivity of the Bank's decision-making process. The Advisory Board is an advisory body to the President & CEO.
General Meeting of ShareholdersAudit & Supervisory Board Members
(4 board members including 2 outside members)
Audit & Supervisory Board ∙ Office of Audit & Supervisory Board Members
Advisory Board
Board of Directors
Shizuoka Bank Group’s Corporate Governance System (as of June 23, 2014)
Director & Senior Managing Executive Officer
4 Director & Senior Executive Officers
Non-standing Director
Outside Director
President & CEO
Deputy President & CFO
Area Business Units
Domestic BranchesLoan Centers
Domestic BranchesLoan Center
Metropolitan Business UnitBusiness Promotion Dept.
Corporate Banking Dept.
Treasury Dept.
Metropolitan Division
Personal Banking Dept.International Dept.Overseas Offices
Committee of Administrative Supervision
Audit Department
Executive Committee and other major committees*
President & CEO
Internal Audit Div.(Complementing supervisory function
of the Board of Directors)
Corporate CenterBanking Div.(Operation Staff)
*Executive Committee, Committee for Integrated Risk and Budget Management, Compliance Committee, and Credit Committee
Corporate Planning Dept.Corporate Administration Dept.
Risk Management Dept.Compliance Dept.
(Management Staff)
Credit Dept.Business Support Dept.
Operations Planning Dept.Operations Dept.
Representative Director & Senior Managing Executive Officer
010_0254585842609.indd 11 2014/08/13 14:46:34
12
Internal Control SystemThe Shizuoka Bank classifies the headquarter organizations into three arms, based on function—the Banking Division, handling front office business operations; the Corporate Center for corporate planning, administration, and risk management; and the Internal Audit Division conducting internal auditing. This classification is designed to strengthen cross-checking among these three arms.
In order to ensure objectivity and effectiveness of internal auditing, the Audit Department, which conducts internal auditing, is independent of organizations subject to auditing and is supervised by the committee of Administrative Supervision under the Board of Directors. This system is designed to strengthen independence of the Internal Audit Division and the Audit Department and cross-checking. The Audit Department verifies the appropriateness and effectiveness of internal control.
The Corporate Center consists of the following corporate staff operations: the Corporate Planning Department, the Corporate Administration Department, the Risk Management Department, and the Compliance Department.
Basic PolicyAs a member of the local community, the Shizuoka Bank Group complies with laws, regulations, and social norms and embraces a spirit of fair play. To achieve a harmonious relationship with the community for further development, the Bank has established an Ethical Charter, which sets out the Bank’s basic compliance policy.
Ethical Charter
Gaining TrustWe are constantly aware of the importance of the Bank’s social responsibility and public mission. As a banking group, we strive to build unshakable trust through sound business management.
Compliance with Laws, Regulations and Rules
In the conduct of our business, we comply with laws, regula-tions, and Company rules and, on the basis of honesty and fair-ness, we adhere to social norms as a member of society.
Social Etiquette and Fair Play
As executives and employee of the Shizuoka Bank Group, we contribute to the development of the local community by foster-ing a strong social etiquette and a spirit of fair play.
Breaking Contact with Anti-Social Forces
The Shizuoka Bank Group adamantly rejects the unreasonable demands made by anti-social forces and groups that offend public order and morals and absolutely refuses to deal with such groups.
Active Communication We actively communicate with stakeholders and cooperate with them to build a strong compliance system.
Compliance SystemAt the Shizuoka Bank Group, the Board of Directors formulates the Compliance Program, an annual action plan.
The Compliance Committee, chaired by the president and consisting of directors and other executives, meets monthly to deliberate on important compliance-related matters and assess the operation of the compliance system across the Shizuoka Bank Group, including the progress toward achievement of the goals of the Compliance Program. The committee reviews and revises the Compliance System as deemed necessary.
The Compliance Department monitors the functioning of the compliance system through integrated management of compliance-related information to prevent possible compliance violations and strengthen the compliance system. Compliance Officers and officers responsible for the
management of risk-bearing products assigned to the Compliance Department provide guidance to the Bank’s branch offices and conduct monitoring, through on-site checks.
Compliance managers and compliance promoters are assigned to all branches of the Bank, headquarters departments, and Group companies where they conduct compliance inspections and draft reports on day-to-day business operations. The Audit Department of the Internal Audit Division verifies the appropriateness and effectiveness of the compliance system.
Cultivating Compliance-centered Corporate CultureManagement is actively involved in compliance activities to enhance awareness of all employees of the Shizuoka Bank Group concerning compliance. For example, directors directly give instructions about compliance, taking the opportunity of branch managers’ meetings and visits to branch offices.
The Bank’s measures to foster and raise compliance awareness include the following:Shizugin Compliance BookThe Bank has established standards of conduct vis-à-vis laws and regulations that must be observed in the execution of day-to-day business activities. The Shizugin Compliance Book, which is distributed to all officers and employees, provides clear explanations concerning the relevant laws and regulations.“Opinion Box” Internal Reporting SystemThe Bank has set up reporting counters for Compliance Officers in the Compliance Department and in attorneys’ offices so that executives and employees can directly report compliance-related issues. In this way, we seek to encourage more self-reporting within the organization.* Reporting can be done by phone, in writing, or by email.
Compliance Education and TrainingThe Bank conducts ongoing educational activities for the practice of compliance, such as training for executives and employees and the holding of monthly study groups at branches.
Prompt and Appropriate DisclosureTo ensure prompt and appropriate provision of corporate information to the Bank’s stakeholders, the Bank discloses information in accordance with the Banking Law and the Financial Instruments and Exchange Act and the securities listing regulations of the Japanese stock exchanges. The Bank also conducts voluntary proactive disclosure by appropriately disclosing information in a consistent, transparent and impartial manner.
The Corporate Planning Department centrally manages a various information generated by each group. Once it has decided that the information is within the scope of prompt disclosure, that information is, in principle, disclosed after Executive Committee approval is received. To maintain prompt and appropriate disclosure, when necessary, the Corporate Planning Department confers with the Compliance Department and the auditing firm, while the Internal Audit Division periodically verifies the appropriateness and effectiveness of overall disclosure.
010_0254585842609.indd 12 2014/08/13 14:46:35

13
Risk Management System
Shizuoka Bank Group’s Compliance and Risk Management Systems
Integrated Risk Management SystemsThe Shizuoka Bank Group has established a basic framework, including definitions of risk, an organizational structure for risk management, and specific risk control procedures based on the Basic Risk Management Regulations, which lay down the fundamental principles that underlie our approach to risk management.
To ensure an appropriate balance between raising earnings levels and financial sustainability, the Bank’s risk management is based on the allocation of risk capital as an integral part of its integrated risk management system.
The allocation of risk capital is a mechanism to ensure the soundness of management by keeping risk within a manage-able range. Shizuoka Bank defines core shareholder’s equity* as capital for allocation and allocates it to all departments involved in business execution. Even if market risk, credit risk and other risks were to materialize, the resulting losses would be controlled within the bounds of shareholders’ equity.* Common equity Tier 1 capital
Credit Risk Management SystemThe Credit Risk Management Group of the Risk Management Department is responsible for overall management of credit risk relating to the Shizuoka Bank Group’s operations both in Japan and overseas in order to maintain and enhance the soundness of the Group’s loan asset portfolio. In the Bank’s internal rating system, including its borrower credit rating system, which is the foundation stone of its credit risk management, the Credit Risk Management Group of the Risk Management Department is responsible for the design of the system and supervision of its operation; the Ratings Assessment Group of the Credit Department is responsible for the day-to-day operation of the credit rating system; and the Risk Management Group of the Risk Management Department is responsible for verification of the appropriateness of the system. Mutual checks and balances among these three units facilitate greater precision and proper functioning of the Bank’s internal ratings system.
The Credit Risk Management Group uses statistical meth-ods to quantify latent credit risk in the Bank’s loan portfolio. In this way, the Bank accurately assesses the amount of future risk, monitors the concentration of loans to particular large borrowers or specific industries, and thus controls the portfo-lio to avoid excessive credit risk.
The Audit Department, which is organizationally indepen-dent of the Banking Division, the Credit Department, and the Risk Management Department, audits the appropriateness and effectiveness of the design and operation of the credit risk management system.
External audit (audit firm)
Audit & Supervisory Board Mem
bers / Audit & Supervisory Board / Office of Audit & Supervisory Board Mem
bers
Internal Audit Division Audit Department
Audit Planning GroupSite Audit GroupAsset Assessm
ent Audit Group
Verification of effectiveness
Board of Directors
Committee of Administrative Supervision
Credit riskRisk types Market
riskLiquidity
risk
Business operations
Compliance Department Risk Management
Department(Integrated risk management)
Risk management groups
Administrative risk System risk
Operational risk
Other risk
Executive CommitteeCompliance Committee
Committee for Integrated Risk & Budget Management, etc.
Allocation and
monitoring of risk capital
Formulation of risk
management policy and standards
Risk Management Department
Risk Management Group
Risk Management GroupCredit Risk
Management Group
Operational Risk Management Group
●Branches in Japan and overseas, headquarters departments, Group companies in Japan, overseas subsidiaries
●Significant outsources
Compliance
010_0254585842609.indd 13 2014/08/13 14:46:35

14
Market Risk Management SystemIn market transactions, the Shizuoka Bank Group limits the amount of risk capital allocated and sets various restrictions, such as on gains or losses from valuation of investment secu-rities, and on the amount of exposure or loss depending upon the risk profile of each transaction or financial instrument. In this way, the Group keeps market risk within certain defined levels.
For banking account transactions, centering on deposits, loans, and investment securities, the ALM Group of the Corporate Planning Department formulates the hedging poli-cies based on current risk conditions and on the outlook for interest rates so as to keep risk volume within a certain range, and these policies are deliberated at the Committee for Integrated Risk and Budget Management.
The organization of the market operations is strictly sepa-rated into departments conducting transactions (front office: Treasury Department), administrative and control departments (back office: Treasury & International Operations Center of the Operations Department), and an independent risk manage-ment department (middle office: Risk Management Group of the Risk Management Department) for mutual checks and balances. Moreover, the Audit Department, which is indepen-dent of the departments responsible for executing transactions, verifies the effectiveness of the mutual checks and balances between these three departments.
Liquidity Risk Management SystemThe Shizuoka Bank Group has separate yen and foreign currency-denominated financing management departments (Fund & Foreign Exchange Group of the Treasury Department, Treasury & International Operations Center of the Operations Department, etc.), and a liquidity risk management depart-ment (Risk Management Group of the Risk Management Department) that is entirely independent of the financing management departments. In this way, the Bank has put in place a system that provides mutual checks and balances. The Fund & Foreign Exchange Group of the Treasury Department, which is one of the financing management departments, controls fundraising requirements within procur-able levels to avoid excessive fundraising. We conduct stable fund management activities, paying close attention to market conditions. Moreover, the liquidity risk management depart-ment monitors the status of financing management departments and assesses the stability of the assets-liabilities structure.
To handle unforeseen circumstances, we proactively prepared an emergency cash flow management system, assuming four stages of emergency: “Stage 1 (preventive stage)”; “Stage 2 (attention required stage)”; “Stage 3 (liquidity concern stage)”; and “Stage 4 (insufficient liquidity stage)”. We predefined countermeasures and authorized persons for each stage, thereby forming a structure capable of swiftly respond-ing to issues should they arise.
With regard to market liquidity risk, the liquidity risk management department routinely monitors the status of highly liquid asset holdings that can be easily monetized. The front office addresses market liquidity risk by selecting invest-ment assets based on their liquidity and setting limits on specific stocks and holding periods.
What is Value at Risk (VaR)?VaR is a risk management technique that statistically measures the potential loss in value of an asset over a given period of time.
Operational Risk Management SystemEach risk category is managed by a dedicated unit of the Bank, while the Operational Risk Management Group of the Risk Management Department is responsible for overseeing and managing operational risk throughout the Shizuoka Bank Group. In line with our basic policies on operational risk management, we are taking steps to strengthen our opera-tional risk management system through a range of measures including the compilation and analysis of internal loss data and the implementation of a risk control self-assessment. The Audit Department, which is organizationally independent from any of the units that it audits, verifies the effectiveness of the risk management system through on-site inspection, etc.
Administrative Risk ManagementThe Shizuoka Bank Group has established the Administrative Risk Management Rules that includes the Group’s basic policy for administrative risk management and executes operations in accordance with the rules. For administrative incidents that occur, we take preventive steps by according priority to measures for incidents involving higher risk to reduce adminis-trative risk. In response to diversification of operations and increasing transaction volumes, we are promoting the shifting of the administrative function at our branches to a shared services center and the introduction of IT systems to enhance efficiency and thus avert operational risk.
System Risk ManagementThe Shizuoka Bank Group positions IT systems as a part of information assets. We have established the Basic Policy for Information Asset Security Measures (Security Policy) that includes our basic policy for dealing with system risk. We are implementing various security measures based on the Standards for Information Asset Security Measures (Security Standards) to ensure secure operation of the IT systems.
010_0254585842609.indd 14 2014/08/13 14:46:35

15
Smooth Supply of Funds to Companies in the RegionThe Bank endeavors to ensure the smooth supply of funds to companies in the region without overly depend-ing on real-estate collateral or personal guarantees.
We work to meet funding needs of as many compa-nies as possible by making appropriate loans in light of their circumstances, such as use of guarantees by
Credit Guarantee Corporations through support of companies’ management innovation, and creating new demand for funds through provision of appropriate solu-tions for tackling growth fields.
Region-based Relationship Banking
Basic PolicyRegion-based relationship banking is a business model whereby financial institutions cultivate long-term relationships with customers and offer financial services based on their grasp of customer needs obtained through the relation-ships.
The Shizuoka Bank Group’s basic policy on region-based relationship banking is to “achieve sustained growth in tandem with the region by adhering to the Bank’s corporate philosophy, ‘expand dreams and affluence with our community.’” By putting this corporate philosophy into practice under the medium-term business plan and annual plans, we are promoting region-based relationship banking and aim to achieve sustained growth by cultivating mutu-ally beneficial relationships with our customers in the region through the provision of value-added services attuned to their needs.
Solutions for Various Management IssuesUtilizing an extensive network encompassing Group companies and external partners, the Shizuoka Bank supports vitalization of the regional economy and devel-opment of customers’ businesses over the medium to long term by offering high-value-added solution services and financing attuned to the development phase.
The Bank’s Shizugin Growth Field Support Project supports local companies concerning new business development, management innovation, and restructur-ing.
Shizuoka Bank GroupAchieve growth
Resolve issuesCustomers’ management issues
■ Solutions capitalizing on the Shizuoka Bank Group’s comprehensive financial functions
■ Support for expanding sales channels
■ Support for business development in growth fields
■ Support for innovation■ Support for business
startups and entry to new business fields
■ Support for business succession
■ Support for overseas business development
Utilization of governmental schemes and external partners
■ Utilization of the government’s growth strategy project for Japanese companies
■ Attracting companies to the region through collaboration with governmental organizations in the Prefecture
■ Utilization of support schemes operated by the public sector
■ Utilization of subsidy systems
■ Utilization of external partners’ expertise
Incubation phase – Growth phase
∙ Incubation support∙ Stable and diverse fund
procurement∙ Efficient administration
Growth phase – Mature phase
∙ Expansion of sales channels
∙ New business development
∙ Overseas business development, etc.
Mature phase – 2nd growth phase
∙ Management improvement, business rehabilitation
∙ Business succession, etc.
65.3% 75.1%
Ratio of loans in Shizuoka Prefecture to total loans (average balance)
Ratio of loans in Shizuoka Prefecture to total loans for small and medium-sized enterprises (SMEs) (average balance)
65.3% 75.1%
Ratio of loans in Shizuoka Prefecture to total loans (average balance)
Ratio of loans in Shizuoka Prefecture to total loans for small and medium-sized enterprises (SMEs) (average balance)
010_0254585842609.indd 15 2014/08/13 14:46:35

16
Support for Business Start-ups and Entry to New Business Fields and Initiatives in Growth Fields
Growth fieldsThe Shizuoka Bank Group is emphasizing its initiatives in five growth fields: healthcare and nursing care, the environment, agriculture, support of overseas business development, and business succession.
Healthcare and nursing care Specialists in the healthcare and nursing care field are assigned to the headquarters and regional business units. We hold seminars for healthcare institutions and offer support for the start-up of healthcare and nursing care businesses, business succession, and the securing of business sites.
The EnvironmentPrompted by the growing emphasis on environmental management, we support our customers’ response to environmental issues by offer-ing loans and private placement bonds based on environmental rating and support for obtaining ISO 14001 certification.
Furthermore, the feed-in-tariff system for renewable energy began from July 2012 and we proactively provide support for new energy businesses centering on photovoltaic generation.
AgricultureWe organize the shizugin@gricom trade show to support the food business in general. In order to meet the needs of customers wishing to enter the agricultural sector or new fields in the food industry, we follow the Agriculture, Commerce and Industry Collaboration Program, which is an initiative of the Japanese government, and support collaboration between agriculture and the food industry advocated by the Japanese government.
Business Succession SupportIn collaboration with subsidiary Shizugin Management Consulting Co., Ltd., the Shizuoka Bank assists customers with their business succes-sion planning and capital policies. We also hold seminars to provide information and organize the Shizuginship workshop for young managers to foster next-generation business leaders.
Support for Business Start-ups and Entry to New Business FieldsOur specialists in charge of management consulting who are qualified Small and Medium Enterprise Management Consultants identify promising companies and foster them. As well as addressing funding needs through a joint fund with Shizuoka Capital Co., Ltd. and loan schemes, such as those for supporting business start-ups and entry to new business fields and Shizugin New Business Development Fund, we support customers in terms of information and technology. For example, when visiting customers we may be accompanied by engineering consultants who offer technical advice.
We are strengthening support for venture businesses through industry-academia-government collaboration, which involves working with universities and technical colleges in Shizuoka Prefecture and elsewhere as well as with the Shizuoka Industrial Foundation and other public organizations.
ConsultingLeveraging the Group’s comprehensive financial capabilities, we offer information and consulting to help our customers solve their business issues.
0
10
30
20
40(cases)
2823
FY10 FY12
Number of M&A transactions through M&A Consulting
Number of M&A consulting contracts signed
13
31
FY13
26
9
20
FY1111
FY10 FY12
22
FY13
1316
0
10
20
30(cases)
FY11
25
M&A consultingCollaboration with Shizugin Management Consulting Co., Ltd.
Management consulting contractsCollaboration with Shizugin Management Consulting Co., Ltd.
* Regarding the “number of M&A transactions through M&A Consulting,” where separate contracts are concluded with both the acquiring company and the company being acquired, these are counted as two contracts.
“Shizuginship” for Young Managers“Shizuginship” is a membership service that the Bank launched in April 2007. It is a learning and networking opportunity for young managers who will be the next generation of business leaders. In addition to lectures, seminars and other events, Shizuginship members can access useful information through the dedicated website.
Business MatchingThe Shizuoka Bank offers business matching services. Leveraging our well-developed branch network centering on Shizuoka Prefecture, we introduce buyers and sellers of products and services. In fiscal 2013, the Bank arranged 4,360 business matchups. We also organize the shizugin@gricom trade show for the agriculture, forestry and fisheries sectors, and support other initiatives in collaboration with other finan-cial institutions to help market distinctive products of Shizuoka Prefecture.
In May 2013, we formed the Shizuoka Techno Frontier together with our corporate customers, and participated in the Automotive Engineering Exposition, Japan's largest technology exhibition for auto-motive engineers.
FY10 FY11FY090
2,0001,000
4,0003,000
5,000
3,149 3,589
FY12
3,953
FY13
4,360
2,595
(cases)
Business matchups by the Bank
Number of applications for the Shizugin Entrepreneur Awards
2nd Shizugin Entrepreneur AwardsFollowing fiscal 2012, we hosted the 2nd Shizugin Entrepreneur Awards and commended entrepreneurs engaged in innovative and creative businesses, capable of opening up a bright future for the regional economy.
Of the 87 business plan applications received for the three award categories—Next-generation Technology, New Business Plan, and Corporate Innovation—the screening committee consisting of officers and employees of the Shizuoka Bank Group and external experts selected three Excellent Award winners and four Outstanding Award winners and commended them in April 2014.The Shizuoka Bank Group will assist the award winners in their efforts to accomplish their business plans by offering them various supports in filing management innovation plan applications and business matching services for developing sales channels.
Category Definition Number of applications
Next-generation Technology
· Enterprises prior to the start of business or less than 5 years since the start of business that are tackling development of next-generation or other advanced technology
12
New Business Plan
· Enterprises prior to the start of business or less than 5 years since the start of business with an innovative, ingenious business plan
42
Corporate Innovation
· Enterprises with an innovative business plan venturing into a new field or attempting to trans-form a business format, regardless of the number of years since the start of business
33
Total 87
010_0254585842609.indd 16 2014/08/13 14:46:35

17
Support for Overseas Business DevelopmentSupport for Overseas Business DevelopmentTo support customers in the development of their overseas business, the Shizuoka Bank Group has six overseas offices: two in the U.S. (New York and Los Angeles), one in Europe (Brussels), and three in Asia (Hong Kong, Singapore, and Shanghai).
Support system in AsiaThe Overseas Business Support Office established in January 2011 is spearheading our efforts to meet the wide-ranging customer needs for overseas business development extend-ing from the initial phase to full-scale business operations in overseas markets. The Bank is also strengthening the support system through tie-ups with financial institutions in Asia.
Many of our customers are developing their businesses in Thailand, Indonesia, and Vietnam, and the Bank is responding to this by dispatching staffs to these countries to support customers.
We are establishing a strategic framework for supporting overseas business development in cooperation with local government. In December 2013, we concluded an agreement with Hamamatsu City concerning overseas business develop-ment support. In line with the launch in February 2014 of the SMEs’ Overseas Development Fast Pass scheme to help small and medium-sized companies in their overseas business development led by the Ministry of Economy, Trade and Industry and the Ministry of Foreign Affairs, we have started services under this scheme to introduce SMEs to capable service providers and to assist SMEs to which we are intro-duced.
As of July 2014, the Bank has tie-ups with twelve financial institutions in eight countries (regions) in Asia and there were a
total of 26 Shizuoka Bank staff stationed at the Bank’s offices or at partners’ offices in Asia to meet wide-ranging customer needs.
Networking events, business forums and seminarsThe Bank actively offers support to customer building busi-nesses overseas, such as through the holding of networking events for customers already doing business overseas or considering entry in overseas markets and business forums to help customers expand their sales channels.
We also hold seminars in Japan on market trends and laws and regulations of various countries in Asia to assist these customers. The Bank responds to a wide range of customer inquiries.
Support menu for overseas business development•Consultation on overseas business developmentThe Bank provides the latest information and fine-tuned services to meet diverse customer needs, including overseas business development, transactions with foreign companies, and foreign investment. •Support for export and import transactionsCapitalizing on its experience and overseas network, the Bank facilitates customers’ transactions.•Financing services (foreign-currency-denominated loans, guarantees, etc.)The Bank’s branches and overseas offices respond to the fund procurement needs of customers’ overseas subsidiaries, including foreign-currency-denominated loans and provision of stand-by letters of credit•International money remittance and exchange services
Indonesia (Jakarta)
Thailand (Bangkok)
Singapore Representative Office
South Korea (Seoul, Daegu)
Shizuoka Bank (Europe) S.A.
As of June 30, 2014
Network in Asia
Los Angeles Branch
New York Branch
Hong Kong Branch
Shanghai Representative Office
China (Beijing, Shanghai)Business alliance: Shinhan BankDaegu Bank
Business alliance: China Construction BankBank of Shanghai
2 employees (total of 3 staff)
2 dispatched employeesBusiness alliance: P.T. Bank CIMB Niaga Tbk (2 employees)
P.T. Bank Resona Perdania
2 employees (total of 3 staff)
Supervision of the Bank’s bases in Asia7 employees (total of 14 staff)
International Dept. (Shizuoka)
1 dispatched employeeBusiness alliance: ANZ Vietnam
3 dispatched employeesBusiness alliance:Kasikorn Bank (3 employees)Bangkok Bank
3 overseas offices+business alliances with 12 financial institutions in 8 countries (region)
Support by a total of 26 staff
Vietnam (Hanoi)
Planning and supervision of support for overseas business development
Overseas Business Support Office: 2 staff
Support for overseas business development and advice on trade
Forex Solutions: 6 staff
Business alliance: Bank of the Philippine Islands
Philippines (Manila)Business alliance: State Bank of India
India (Mumbai)
Business alliance: Chinatrust Financial Holding
(Chinatrust Commercial Bank)
Taiwan (Taipei)
Shizuoka Bank Group’s Overseas Network
* Dispatched employees to Vietnam were increased by 1 to a total of 2 from July 4, 2014.
010_0254585842609.indd 17 2014/08/13 14:46:36

18
011_0254501372609.indd 18 2014/08/12 20:20:32

19
Consolidated Balance SheetTHE SHIZUOKA BANK, LTD. and Consolidated Subsidiaries March 31, 2014
Millions of YenThousands of
U.S. Dollars (Note 2)
2014 2013 2014Assets:
Cash and due from banks (Notes 12 and 29) ¥ 674,581 ¥ 423,555 $ 6,554,421 Call loans and bills bought (Note 29) 125,850 83,674 1,222,800 Monetary claims bought 39,551 40,343 384,291 Trading assets (Notes 4 and 29) 30,086 31,599 292,327 Money held in trust (Note 5) 3,100 2,600 30,121 Securities (Notes 6, 12, and 29) 2,378,178 2,560,293 23,107,056 Loans and bills discounted (Notes 7, 13, and 29) 7,218,794 6,969,330 70,139,857 Foreign exchanges (Note 8) 6,793 5,037 66,004 Lease receivables and investment assets (Notes 12 and 27) 46,843 42,415 455,141 Other assets (Notes 9 and 12) 56,304 70,104 547,070 Tangible fixed assets (Note 10) 64,337 56,510 625,119 Intangible fixed assets (Note 10) 15,892 12,228 154,419 Asset for retirement benefits (Note 18) 782 7,603 Deferred tax assets (Note 26) 1,581 1,789 15,369 Customers’ liabilities for acceptances and guarantees (Note 11) 92,752 80,384 901,213 Allowance for loan losses (Note 29) (57,421) (65,035) (557,925)Allowance for investment losses (58) (61) (571)
Total Assets ¥10,697,948 ¥ 10,314,770 $103,944,315
Liabilities and Equity:Liabilities:
Deposits (Notes 12, 14, and 29) ¥ 8,684,659 ¥ 8,412,257 $ 84,382,624Call money and bills sold (Note 29) 340,841 327,007 3,311,711 Payables under securities lending transactions (Notes 12 and 29) 313,569 403,205 3,046,733 Trading liabilities (Note 4) 17,835 17,700 173,292 Borrowed money (Notes 12, 15, and 29) 185,026 57,480 1,797,766 Foreign exchanges (Note 8) 113 253 1,103 Bonds payable (Note 16) 20,000 20,000 194,326 Bonds with stock acquisition rights (Note 16) 51,460 500,000 Other liabilities (Notes 12 and 17) 118,532 128,462 1,151,700 Liability for retirement benefits (Note 18) 24,027 22,111 233,456 Provision for losses from reimbursement of inactive accounts 686 788 6,665 Provision for contingent losses 2,845 2,974 27,646 Provision for point program 238 170 2,322 Reserves under special laws 11 11 113 Deferred tax liabilities (Note 26) 28,644 31,217 278,317 Acceptances and guarantees (Note 11) 92,752 80,384 901,213
Total Liabilities 9,881,244 9,504,025 96,008,987
Equity: (Notes 19, 20, 21, and 35)Capital stock,
authorized, 2,414,596 thousand shares; 90,845 90,845 882,683 issued, 665,129 thousand shares in 2014 and 665,129 thousand shares in 2013Capital surplus 54,884 54,884 533,269 Subscription rights to shares 345 337 3,358 Retained earnings 590,414 553,598 5,736,635 Treasury stock-at cost, (36,260) (13,623) (352,319)36,601 thousand shares in 2014 and 16,616 thousand shares in 2013Accumulated other comprehensive income: 110,991 119,840 1,078,421
Valuation difference on available-for-sale securities 120,408 121,169 1,169,924 Deferred gains or losses on hedges (177) (171) (1,720)Foreign currency translation adjustments (491) (1,158) (4,776)Defined retirement benefit plans (8,748) (85,007)
Total 811,220 805,882 7,882,047 Minority interests 5,483 4,862 53,281
Total Equity 816,703 810,744 7,935,328 Total Liabilities and Equity ¥10,697,948 ¥10,314,770 $103,944,315
See notes to consolidated financial statements.
011_0254501372609.indd 19 2014/08/12 20:20:32

20
Consolidated Statement of Income
Consolidated Statement of Comprehensive Income
THE SHIZUOKA BANK, LTD. and Consolidated Subsidiaries Year ended March 31, 2014
THE SHIZUOKA BANK, LTD. and Consolidated Subsidiaries Year ended March 31, 2014
Millions of YenThousands of
U.S. Dollars (Note 2)
2014 2013 2014Income:Interest Income:
Interest on loans and discounts ¥ 93,911 ¥ 98,029 $ 912,467 Interest and dividends on securities 39,118 29,632 380,082 Other interest income 1,546 1,158 15,023
Subtotal 134,575 128,820 1,307,572 Fees and Commissions 52,114 48,846 506,358 Trading Income 2,063 2,229 20,045 Other Operating Income (Note 22) 19,977 13,018 194,107 Other Income (Note 23) 12,393 24,436 120,414
Total Income 221,123 217,351 2,148,496 Expenses:Interest Expense:
Interest on deposits 5,163 5,539 50,169 Interest on borrowings and rediscounts 719 535 6,989 Other interest expense 2,222 2,279 21,590
Subtotal 8,104 8,353 78,748 Fees and Commission Payments 25,187 24,156 244,726 Trading ExpenseOther Operating Expenses (Note 24) 17,019 2,996 165,363 General and Administrative Expenses 88,746 86,996 862,286 Other Expenses (Note 25) 8,235 11,035 80,016
Total Expenses 147,292 133,538 1,431,139 Income before Income Taxes and Minority Interests 73,830 83,812 717,357 Income Taxes: (Note 26)
Current 22,807 18,631 221,607 Deferred 3,708 7,652 36,031
Net Income before Minority Interests 47,314 57,527 459,719 Minority Interests in Net Income of Consolidated Subsidiaries 590 556 5,736
Net Income ¥ 46,723 ¥ 56,970 $ 453,983
Yen U.S. Dollars (Note 2)
Per Share: (Note 34)Basic net income ¥74.12 ¥87.47 $0.72 Diluted net income 70.21 87.42 0.68 Cash dividends applicable to the year 15.50 15.00 0.15
See notes to consolidated financial statements.
Millions of YenThousands of
U.S. Dollars (Note 2)2014 2013 2014
Net Income before Minority Interests ¥47,314 ¥57,527 $459,719 Other Comprehensive Income (Loss): (Note 32)Valuation difference on available-for-sale securities (718) 35,522 (6,982)Deferred gains or losses on hedges (5) 196 (57)Foreign currency translation adjustments 666 345 6,478
Total other comprehensive income (loss) (57) 36,065 (561)
Comprehensive Income 47,256 93,592 459,158
Total Comprehensive Income Attributable To:Owners of the parent ¥46,623 ¥92,963 $453,008 Minority interests 632 628 6,150
See notes to consolidated financial statements.
011_0254501372609.indd 20 2014/08/12 20:20:32

21
Consolidated Statement of Changes in EquityTHE SHIZUOKA BANK, LTD. and Consolidated Subsidiaries Year ended March 31, 2014
Thousands Millions of YenAccumulated Other
Comprehensive Income
Number ofShares of
Common StockOutstanding
CapitalStock
CapitalSurplus
SubscriptionRights toShares
RetainedEarnings
TreasuryStock
ValuationDifference
on Available-for-Sale
Securities
DeferredGains or
Losses onHedges
ForeignCurrency
TranslationAdjustments
Defined Retirement
Benefit Plans Total
MinorityInterests
TotalEquity
Balance at April 1, 2012 685,129 ¥90,845 ¥54,884 ¥324 ¥520,518 ¥(22,339) ¥85,719 ¥(367) ¥(1,504) ¥728,079 ¥23,166 ¥751,246 Changes during the period:
Cash dividends, ¥14.00 per share (9,130) (9,130) (9,130)Net income 56,970 56,970 56,970 Increase by share exchanges 186 1,980 2,166 2,166
(2,648 thousand shares) (Note 33)Purchases of treasury stock (8,273) (8,273) (8,273)
(10,040 thousand shares)Disposals of treasury stock 6 56 62 62
(75 thousand shares)Retirement of treasury stock (192) (14,760) 14,953
(20,000 thousand shares) (20,000)Net changes other than
shareholders’ equity 13 35,450 196 345 36,006 (18,304) 17,702 Total changes during the period (20,000) (0) 13 33,080 8,716 35,450 196 345 77,802 (18,304) 59,498 Balance at March 31, 2013 665,129 ¥90,845 ¥54,884 ¥337 ¥553,598 ¥(13,623) ¥121,169 ¥(171) ¥(1,158) ¥805,882 ¥4,862 ¥810,744
Balance at April 1, 2013 665,129 ¥90,845 ¥54,884 ¥337 ¥553,598 ¥(13,623) ¥121,169 ¥(171) ¥(1,158) ¥805,882 ¥4,862 ¥810,744 Change during the period:
Cash dividends, ¥15.50 per share (9,902) (9,902) (9,902)Net income 46,723 46,723 46,723 Purchase of treasury stock (22,730) (22,730) (22,730)
(20,079 thousand shares)Disposal of treasury stock (5) 93 87 87
(94 thousand shares)Net changes other than
shareholders’ equity 8 (761) (5) 666 ¥(8,748) (8,841) 621 (8,219)Total changes during the period 8 36,816 (22,637) (761) (5) 666 (8,748) 5,337 621 5,958 Balance at March 31, 2014 665,129 ¥90,845 ¥54,884 ¥345 ¥590,414 ¥(36,260) ¥120,408 ¥(177) ¥ (491) ¥(8,748) ¥811,220 ¥5,483 ¥816,703
Thousands of U.S. Dollars (Note 2)
Accumulated OtherComprehensive Income
CapitalStock
CapitalSurplus
SubscriptionRights toShares
RetainedEarnings
TreasuryStock
ValuationDifference
on Available-for-Sale
Securities
DeferredGains or
Losses onHedges
ForeignCurrency
TranslationAdjustments
Defined Retirement
Benefit Plans Total
MinorityInterests
TotalEquity
Balance at April 1, 2013 $882,683 $533,269 $3,278 $5,378,919 $(132,369) $1,177,320 $(1,663) $(11,254) $7,830,183 $47,246 $7,877,429 Change during the period:
Cash dividends, $0.15 per share (96,213) (96,213) (96,213)Net income 453,983 453,983 453,983 Purchase of treasury stock (220,855) (220,855) (220,855)Disposal of treasury stock (54) 905 851 851 Net changes other than
shareholders’ equity 80 (7,396) (57) 6,478 $(85,007) (85,902) 6,035 (79,867)Total changes during the period 80 357,716 (219,950) (7,396) (57) 6,478 (85,007) 51,864 6,035 57,899 Balance at March 31, 2014 $882,683 $533,269 $3,358 $5,736,635 $(352,319) $1,169,924 $(1,720) $(4,776) $(85,007) $7,882,047 $53,281 $7,935,328
See notes to consolidated financial statements.
011_0254501372609.indd 21 2014/08/12 20:20:33
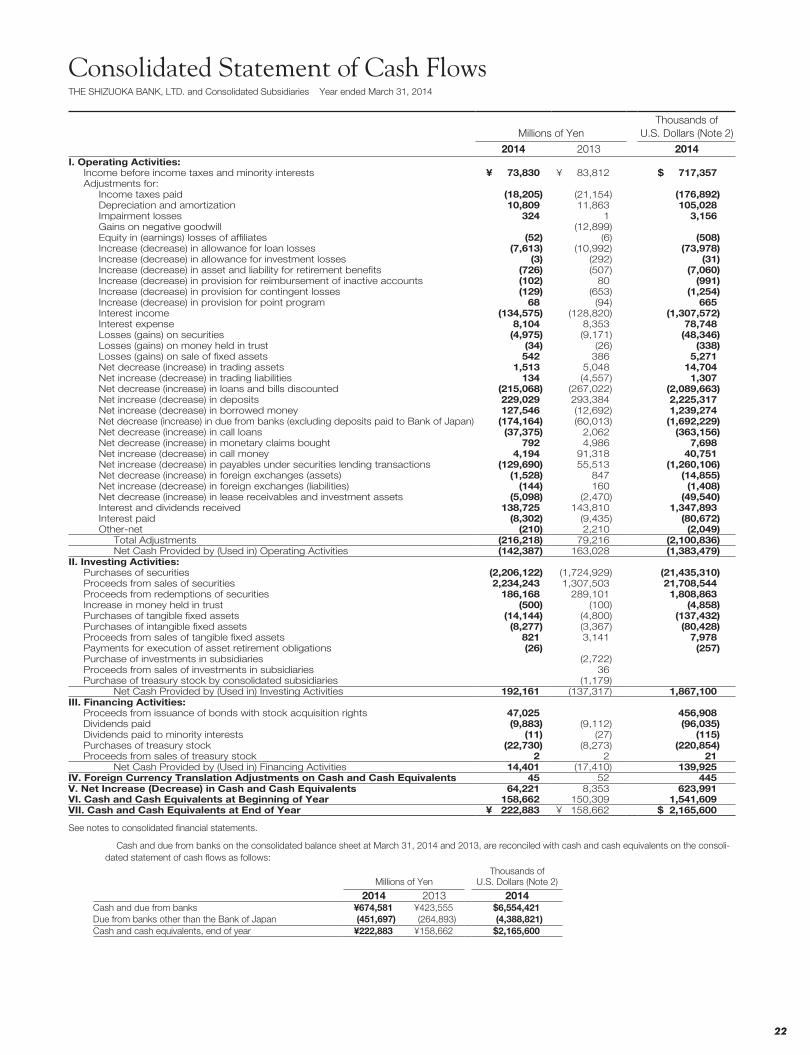
22
Consolidated Statement of Cash FlowsTHE SHIZUOKA BANK, LTD. and Consolidated Subsidiaries Year ended March 31, 2014
Millions of YenThousands of
U.S. Dollars (Note 2)
2014 2013 2014Cash and due from banks ¥674,581 ¥423,555 $6,554,421 Due from banks other than the Bank of Japan (451,697) (264,893) (4,388,821)Cash and cash equivalents, end of year ¥222,883 ¥158,662 $2,165,600
Millions of YenThousands of
U.S. Dollars (Note 2)
2014 2013 2014I. Operating Activities:
Income before income taxes and minority interests ¥ 73,830 ¥ 83,812 $ 717,357 Adjustments for:
Income taxes paid (18,205) (21,154) (176,892)Depreciation and amortization 10,809 11,863 105,028 Impairment losses 324 1 3,156 Gains on negative goodwill (12,899) Equity in (earnings) losses of affiliates (52) (6) (508)Increase (decrease) in allowance for loan losses (7,613) (10,992) (73,978)Increase (decrease) in allowance for investment losses (3) (292) (31)Increase (decrease) in asset and liability for retirement benefits (726) (507) (7,060)Increase (decrease) in provision for reimbursement of inactive accounts (102) 80 (991)Increase (decrease) in provision for contingent losses (129) (653) (1,254)Increase (decrease) in provision for point program 68 (94) 665Interest income (134,575) (128,820) (1,307,572)Interest expense 8,104 8,353 78,748 Losses (gains) on securities (4,975) (9,171) (48,346)Losses (gains) on money held in trust (34) (26) (338)Losses (gains) on sale of fixed assets 542 386 5,271 Net decrease (increase) in trading assets 1,513 5,048 14,704 Net increase (decrease) in trading liabilities 134 (4,557) 1,307 Net decrease (increase) in loans and bills discounted (215,068) (267,022) (2,089,663)Net increase (decrease) in deposits 229,029 293,384 2,225,317 Net increase (decrease) in borrowed money 127,546 (12,692) 1,239,274 Net decrease (increase) in due from banks (excluding deposits paid to Bank of Japan) (174,164) (60,013) (1,692,229)Net decrease (increase) in call loans (37,375) 2,062 (363,156)Net decrease (increase) in monetary claims bought 792 4,986 7,698 Net increase (decrease) in call money 4,194 91,318 40,751 Net increase (decrease) in payables under securities lending transactions (129,690) 55,513 (1,260,106)Net decrease (increase) in foreign exchanges (assets) (1,528) 847 (14,855)Net increase (decrease) in foreign exchanges (liabilities) (144) 160 (1,408)Net decrease (increase) in lease receivables and investment assets (5,098) (2,470) (49,540)Interest and dividends received 138,725 143,810 1,347,893 Interest paid (8,302) (9,435) (80,672)Other-net (210) 2,210 (2,049)
Total Adjustments (216,218) 79,216 (2,100,836)Net Cash Provided by (Used in) Operating Activities (142,387) 163,028 (1,383,479)
II. Investing Activities:Purchases of securities (2,206,122) (1,724,929) (21,435,310)Proceeds from sales of securities 2,234,243 1,307,503 21,708,544 Proceeds from redemptions of securities 186,168 289,101 1,808,863 Increase in money held in trust (500) (100) (4,858)Purchases of tangible fixed assets (14,144) (4,800) (137,432)Purchases of intangible fixed assets (8,277) (3,367) (80,428)Proceeds from sales of tangible fixed assets 821 3,141 7,978 Payments for execution of asset retirement obligations (26) (257)Purchase of investments in subsidiaries (2,722) Proceeds from sales of investments in subsidiaries 36 Purchase of treasury stock by consolidated subsidiaries (1,179)
Net Cash Provided by (Used in) Investing Activities 192,161 (137,317) 1,867,100 III. Financing Activities:
Proceeds from issuance of bonds with stock acquisition rights 47,025 456,908 Dividends paid (9,883) (9,112) (96,035)Dividends paid to minority interests (11) (27) (115)Purchases of treasury stock (22,730) (8,273) (220,854)Proceeds from sales of treasury stock 2 2 21
Net Cash Provided by (Used in) Financing Activities 14,401 (17,410) 139,925 IV. Foreign Currency Translation Adjustments on Cash and Cash Equivalents 45 52 445 V. Net Increase (Decrease) in Cash and Cash Equivalents 64,221 8,353 623,991 VI. Cash and Cash Equivalents at Beginning of Year 158,662 150,309 1,541,609 VII. Cash and Cash Equivalents at End of Year ¥ 222,883 ¥ 158,662 $ 2,165,600
See notes to consolidated financial statements.
Cash and due from banks on the consolidated balance sheet at March 31, 2014 and 2013, are reconciled with cash and cash equivalents on the consoli-dated statement of cash flows as follows:
011_0254501372609.indd 22 2014/08/12 20:20:33

23
Notes to Consolidated Financial StatementsTHE SHIZUOKA BANK, LTD. and Consolidated Subsidiaries Year ended March 31, 2014
Business Combinations:The accounting standard for business combinations states the follow-ing: (1) The standard requires accounting for business combinations only by the purchase method. (2) Under the standard, in-process research and development costs (IPR&D) acquired in the business combination are capitalized as an intangible asset. (3) Under the stan-dard, the acquirer recognizes the bargain purchase gain in profit or loss immediately on the acquisition date after reassessing and con-firming that all of the assets acquired and all of the liabilities assumed have been identified after a review of the procedures used in the pur-chase price allocation.
Trading purpose transactions:“Transactions for trading purposes” (the purpose of seeking to capture gains arising from short-term fluctuations in interest rates, currency exchange rates or market prices of securities, and other market-related indices or from gaps among markets) are included in “Trading assets” and “Trading liabilities” on a trade-date basis.Trading securities and monetary claims purchased for trading purposes recorded in these accounts are stated at market value, and trading-related financial derivatives are stated at the amounts that would be settled if they were terminated at the end of the fiscal year.
Profits and losses on transactions for trading purposes are shown as “Trading income (expense)” on a trade-date basis.
Securities:Held-to-maturity debt securities, which are expected to be held to maturity with the positive intent and ability to hold to maturity, are stated at amortized cost computed using the straight-line method.Available-for-sale securities, which are not classified as either trading account securities or held-to-maturity debt securities, are stated at fair value, with unrealized gains and losses, net of applicable taxes, reported in a separate component of equity.
Available-for-sale securities whose fair value cannot be reliably deter-mined are stated at cost, determined by the moving-average method.
For other-than-temporary declines in fair value, investment securities are reduced to net realizable value by a charge to income.
Tangible fixed assets:Tangible fixed assets are stated at cost, less accumulated deprecia-tion. Depreciation of tangible fixed assets owned by the Bank is computed using the declining-balance method over the estimated useful lives.
The range of useful lives is principally from 3 to 38 years for buildings and from 2 to 20 years for equipment.
Depreciation of tangible fixed assets owned by consolidated subsid-iaries is principally computed using the declining-balance method over the estimated useful lives of the assets.
The useful lives for lease assets are the terms of the respective leases.
Impairment loss:The Group reviews its long-lived assets for impairment whenever events or changes in circumstances indicate the carrying amount of an asset or asset group may not be recoverable. An impairment loss is recognized if the carrying amount of an asset or asset group exceeds the sum of the undiscounted future cash flows expected to result from the continued use and eventual disposition of the asset or asset group. The impairment loss would be measured as the amount by which the carrying amount of the asset exceeds its recoverable amount, which is the higher of the discounted cash flows from the continued use and eventual disposition of the asset or the net selling price at disposition.
Software:The Bank and its consolidated subsidiaries in Japan amortize internal-use software development costs using the straight-line method over the useful life (five years).
Allowance for loan losses:The amount of the allowance for loan losses is determined based on management’s judgement and assessment of future losses based
1. BASIS OF PRESENTATIONThe accompanying consolidated financial statements have been prepared from the accounts maintained by The Shizuoka Bank, Ltd. (the “Bank”) and its subsidiaries (the “Group”) in accordance with the provisions set forth in the Companies Act of Japan (the “Companies Act”), the Japanese Financial Instruments and Exchange Act, the Banking Act of Japan, and the Accounting Guideline for Banks in Japan stated by the Japanese Bankers’ Association, and in accor-dance with accounting principles generally accepted in Japan (“Japanese GAAP”), which are different in certain respects as to the application and disclosure requirements of International Financial Reporting Standards (IFRS).
In preparing these consolidated financial statements, certain reclas-sifications and rearrangements have been made to the consolidated financial statements issued domestically in order to present them in a form that is more familiar to readers outside Japan.
2. JAPANESE YEN AND U.S. DOLLAR AMOUNTSAs permitted by the Japanese Financial Instruments and Exchange Act, Japanese yen amounts less than one million have been omitted. As a result, the totals in Japanese yen shown in the accompanying consolidated financial statements and the notes thereto do not neces-sarily agree with the sum of the individual account balances.
The consolidated financial statements are stated in Japanese yen, the currency of the country in which the Bank is incorporated and operates. The translations of Japanese yen amounts into U.S. dollar amounts are included solely for the convenience of readers outside Japan and have been made at the rate of ¥102.92 to $1, the approxi-mate rate of exchange at March 31, 2014. Such translation should not be construed as a representation that Japanese yen amounts could be converted into U.S. dollars at that or any other rate.
3. SUMMARY OF SIGNIFICANT ACCOUNTING POLICIESConsolidation:The accompanying consolidated financial statements as of March 31, 2014, include the accounts of the Bank, its 11 significant subsidiaries, and one company accounted for by the equity method.
Under the control or influence concept, those companies in which the Bank, directly or indirectly, is able to exercise control over opera-tions are fully consolidated, and those companies over which the Group has the ability to exercise significant influence are accounted for by the equity method.
For investments in the remaining unconsolidated subsidiaries and associated companies, if the equity method of accounting had been applied, the effect on the accompanying consolidated financial state-ments would not be material.
The difference between the cost of an acquisition and the fair value of net assets of the acquired subsidiary at the date of acquisition is charged to income when incurred.
All significant intercompany accounts and transactions have been eliminated in consolidation. All material unrealized profits resulting from intercompany transactions are eliminated.
Unification of Accounting Policies Applied to ForeignSubsidiaries for the Consolidated Financial Statements:The accounting policies and procedures applied to a parent company and its subsidiaries for similar transactions and events under similar circumstances should in principle be unified for the preparation of the consolidated financial statements. However, financial statements pre-pared by foreign subsidiaries in accordance with either IFRS or the generally accepted accounting principles in the United States of America tentatively may be used for the consolidation process, except for the following items, which should be adjusted in the consolidation process so that net income is accounted for in accordance with Japanese GAAP, unless they are not material: (a) amortization of goodwill; (b) scheduled amortization of actuarial gain or loss of pensions that has been directly recorded in equity; (c) expensing capitalized development costs of R&D; (d) cancellation of the fair value model accounting for property, plant, and equipment and investment proper-ties and incorporation of the cost model accounting; and (e) exclusion of minority interests from net income, if contained in net income.
011_0254501372609.indd 23 2014/08/12 20:20:33

24
periods beginning on or after April 1, 2015, subject to certain disclo-sure in March 2015, both with earlier application being permitted from the beginning of annual periods beginning on or after April 1, 2013. However, no retrospective application of this accounting standard to consolidated financial statements in prior periods is required.
The Group applied the revised accounting standard and guidance for retirement benefits for (a) and (b) above, effective March 31, 2014. As a result, asset and liability for retirement benefits of ¥782 million ($7,603 thousand) and ¥24,027 million ($233,456 thousand) were recorded as of March 31, 2014, respectively , and accumulated other comprehensive income for the year ended March 31, 2014, decreased by ¥8,748 million ($85,007 thousand).
Provision for losses from reimbursement of inactive accounts:The provision for losses from reimbursement of inactive accounts, which are derecognized as liabilities under certain conditions, is provided for possible losses on future claims of withdrawal based on historical reimbursement experience.
Provision for contingent losses:The provision for contingent losses is provided for the estimated future payments to credit guarantee corporations due to the imple-mentation of a loss-sharing system.
Provision for point program:The provision for point program is provided for the reasonably esti-mated future usage of points given to credit card customers.
Reserves under special laws:Reserves under special laws are reserves for financial product transaction liabilities in accordance with Section 1 of Article 46-5 of the Financial Instruments and Exchange Act.
Asset retirement obligations:An asset retirement obligation is defined as a legal obligation imposed either by law or contract that results from the acquisition, construc-tion, development, and the normal operation of a tangible fixed asset and is associated with the retirement of such tangible fixed asset. The asset retirement obligation is recognized as the sum of the discounted cash flows required for the future asset retirement and is recorded in the period in which the obligation is incurred if a reasonable estimate can be made. If a reasonable estimate of the asset retirement obliga-tion cannot be made in the period the asset retirement obligation is incurred, the liability should be recognized when a reasonable esti-mate of the asset retirement obligation can be made. Upon initial recognition of a liability for an asset retirement obligation, an asset retirement cost is capitalized by increasing the carrying amount of the related fixed asset by the amount of the liability. The asset retirement cost is subsequently allocated to expense through depreciation over the remaining useful life of the asset. Over time, the liability is accreted to its present value each period. Any subsequent revisions to the tim-ing or the amount of the original estimate of undiscounted cash flows are reflected as an adjustment to the carrying amount of the liability and the capitalized amount of the related asset retirement cost.
Leases:In March 2007, the ASBJ issued ASBJ Statement No. 13, “Accounting Standard for Lease Transactions,” which revised the previous account-ing standard for lease transactions. The revised accounting standard for lease transactions is effective for fiscal years beginning on or after April 1, 2008.
LesseeUnder the previous accounting standard, finance leases that were deemed to transfer ownership of the leased property to the lessee were to be capitalized. However, other finance leases were permitted to be accounted for as operating lease transactions if certain “as if capitalized” information is disclosed in the notes to the lessee’s financial statements. The revised accounting standard requires that all finance lease transactions should be capitalized to recognize lease assets and lease obligations in the balance sheet. In addition, the revised accounting standard permits leases, which existed at the transition date and do not transfer ownership of the leased property to the lessee, to be accounted for as operating lease transactions.
The Bank and its consolidated subsidiaries in Japan applied the revised accounting standard effective April 1, 2008. In addition, the Bank and its consolidated subsidiaries in Japan accounted for leases,
on the Bank’s self-assessment system. This system reflects the past experience of credit losses, possible future credit losses, business and economic conditions, the character, quality and performance of the portfolio, and other pertinent indicators.
The Bank implemented a self-assessment system to monitor the quality of its assets. The quality of all loans is assessed by branches and the Credit Supervision Department, with a subsequent audit by the Credit Examination Department, in accordance with the Bank’s policy and rules for self-assessment of asset quality.
The Bank has established a credit rating system under which its borrowers are classified into five categories. The credit rating system is used for self-assessment of asset quality. All borrowers are classi-fied into five categories for self-assessment purposes — “normal,” “caution,” “possible bankruptcy,” “virtual bankruptcy,” and “legal bankruptcy.”
For loans to borrowers classified as legal bankruptcy or virtual bank-ruptcy, the Bank fully provides the net amount of loans and estimated collectible amounts by collateral or guarantees. Regarding loans to borrowers classified as possible bankruptcy, a specific reserve is provided to the necessary extent for the net amount of loans and esti-mated collectible amounts by collateral or guarantees.
For the borrower with certain loan amounts classified as possible bankruptcy or being with restructured loans, if cash flows from collec-tion of principals and interests can be reasonably estimated, the Bank provides the difference between the present value of these cash flows discounted at the initial contractual rates and the book values of loans (the “DCF” method).
For other loans, a general allowance is provided based on the histor-ical loan loss ratio.
The consolidated subsidiaries provide for the allowance for loan losses at the amount deemed necessary to cover such losses, principally based on past experience.
Allowance for investment losses:The allowance for investment losses is provided at a necessary amount based on the estimated possible losses on investments.
Retirement and pension plans:The Bank and certain consolidated subsidiaries have lump-sum retire-ment benefit plans, a contributory funded defined benefit pension plan, and a noncontributory funded pension plan.
The projected benefit obligations are attributed to periods on a straight-line basis. Actuarial gains and losses are amortized on a straight-line basis over 10 years within the average remaining service period. Past service costs are recognized at applicable year.
In May 2012, the ASBJ issued ASBJ Statement No. 26, “Accounting Standard for Retirement Benefits,” and ASBJ Guidance No. 25, “Guidance on Accounting Standard for Retirement Benefits,” which replaced the accounting standard for retirement benefits that had been issued by the Business Accounting Council in 1998 with an effective date of April 1, 2000, and the other related practical guid-ance, and were followed by partial amendments from time to time through 2009.(a) Under the revised accounting standard, actuarial gains and losses and past service costs that are yet to be recognized in profit or loss are recognized within equity (accumulated other comprehensive income), after adjusting for tax effects, and any resulting deficit or surplus is recognized as a liability (liability for retirement benefits) or asset (asset for retirement benefits).(b) The revised accounting standard does not change how to recog-nize actuarial gains and losses and past service costs in profit or loss. Those amounts are recognized in profit or loss over a certain period no longer than the expected average remaining service period of the employees. However, actuarial gains and losses and past service costs that arose in the current period and have not yet been recog-nized in profit or loss are included in other comprehensive income and actuarial gains and losses and past service costs that were recog-nized in other comprehensive income in prior periods and then recognized in profit or loss in the current period shall be treated as reclassification adjustments. (c) The revised accounting standard also made certain amendments relating to the method of attributing expected benefit to periods and relating to the discount rate and expected future salary increases.
This accounting standard and the guidance for (a) and (b) above are effective for the end of annual periods beginning on or after April 1, 2013, and for (c) above are effective for the beginning of annual peri-ods beginning on or after April 1, 2014, or for the beginning of annual
011_0254501372609.indd 24 2014/08/12 20:20:33
25
Special hedging treatment is applied for interest rate swaps.Methods similar to that utilized by the Bank are applied to hedge
transactions conducted by the subsidiaries of the Bank.(b) Transactions to hedge against foreign exchange fluctuation risk Deferral hedge accounting is applied to hedges against foreign exchange fluctuation risks associated with foreign currency-denomi-nated monetary assets and liabilities, stipulated in the JICPA Industry Audit Committee Report No. 25, “Accounting and Auditing Treatment of Accounting Treatment on Foreign Currency Transactions in the Banking Industry.”
The effectiveness of currency swap transactions, exchange swap transactions, and similar transactions hedging foreign exchange risks of monetary assets and liabilities denominated in foreign currencies is assessed by comparison of the foreign currency position of the hedged monetary assets and liabilities and the hedging instruments.
In order to hedge the foreign exchange risk of foreign currency-denominated available-for-sale securities (except bonds), the Bank applies the “general method,” using market value hedges in accordance with certain conditions, namely the stipulation in advance of which foreign-currency-denominated securities are to be hedged, and the existence in foreign currency of a spot-forward liability in excess of the acquisition cost of the relevant foreign-currency-denominated securities.
Statement of cash flows:For the purpose of the consolidated statement of cash flows, cash and cash equivalents represent cash and due from the Bank of Japan.
Per share information:Basic net income per share is computed by dividing net income available to common stockholders by the weighted-average number of common shares outstanding for the period, retroactively adjusted for stock splits. The average number of common shares used in the computation was 630,361 thousand shares for 2014 and 651,268 thousand shares for 2013.
Diluted net income per share reflects the potential dilution that could occur if the outstanding stock options were exercised. Diluted net income per share assumes full exercise of the outstanding stock options at the beginning of the year (or at the time of grant).
Cash dividends per share presented in the accompanying consoli-dated statement of income are dividends applicable to the respective years, including dividends to be paid after the end of the year.
New Accounting Pronouncements:Accounting Standard for Retirement BenefitsOn May 17, 2012, the ASBJ issued ASBJ Statement No. 26, “Accounting Standard for Retirement Benefits,” and ASBJ Guidance No. 25, “Guidance on Accounting Standard for Retirement Benefits,” which replaced the Accounting Standard for Retirement Benefits that had been issued by the Business Accounting Council in 1998 with an effective date of April 1, 2000, and the other related practical guidance, and followed by partial amendments from time to time through 2009.
From the viewpoint of the improvement of financial reporting and international trend, the revised accounting standard mainly (1) changes the treatments of unrecognized actuarial gains and losses and past service costs, and expands related disclosures, and (2) revises the calculation methods of projected benefit obligation and service cost.
The Group applied the revised accounting standard for (1) from the end of the annual period beginning on April 1, 2013, and expects to apply (2) above from the beginning of annual period on April 1, 2014.
The effect of application of (2) is expected to increase retained earn-ings at the beginning of annual period beginning on April 1, 2014 by ¥853 million ($8,289 thousand).
Accounting Standards for Business Combinations and Consolidated Financial Statements
On September 13, 2013, the ASBJ issued revised ASBJ Statement No. 21, “Accounting Standard for Business Combinations,”revised ASBJ Guidance No. 10, “Guidance on Accounting Standards for Business Combinations and Business Divestitures,” and revised ASBJ Statement No. 22, “Accounting Standard for Consolidated Financial Statements.”
Major accounting changes are (1) treatment of transactions with noncontrolling interest, (2) treatment of acquisition-related costs, (3) provisional accounting treatments for a business combination, and (4) presentation of the consolidated balance sheet and the consolidated
which existed at the transition date and do not transfer ownership of the leased property to the lessee, as operating lease transactions.
LessorUnder the previous accounting standard, finance leases that were deemed to transfer ownership of the leased property to the lessee were to be treated as sales. However, other finance leases were permitted to be accounted for as operating lease transactions if certain “as if sold” information is disclosed in the notes to the lessor’s financial statements. The revised accounting standard requires that all finance leases that are deemed to transfer ownership of the leased property to the lessee should be recognized as lease receivables, and all finance leases that are deemed not to transfer ownership of the leased property to the lessee should be recognized as investments in leases.
The Bank and its consolidated subsidiaries in Japan applied the revised accounting standard effective April 1, 2008.
In regard to finance lease, sales and cost of sales are accounted when lease payments are paid.
Stock options:The accounting standard for stock options requires companies to measure the cost of employee stock options based on the fair value at the date of grant and recognize compensation expense over the vesting period as consideration for receiving goods or services. The standard also requires companies to account for stock options granted to non-employees based on the fair value of either the stock option or the goods or services received. In the balance sheet, the stock option is presented as a stock acquisition right as a separate component of equity until exercised. The standard covers equity-settled, share-based payment transactions, but does not cover cash-settled, share-based payment transactions. In addition, the standard allows unlisted companies to measure options at their intrinsic value if they cannot reliably estimate fair value.
Translation of foreign currencies:Assets and liabilities, which are payable or receivable in foreign curren-cies, are converted into Japanese yen at the rates prevailing at each balance sheet date.
The financial statements of the consolidated subsidiaries outside Japan are translated into Japanese yen at the current exchange rate at each balance sheet date, except for equity, which is translated at the historical exchange rate.
Differences arising from such translation are shown as “Foreign currency translation adjustments” in a separate component of equity.
Income taxes:The Bank and its consolidated subsidiaries in Japan allocate income taxes based on the asset and liability method.
Deferred income taxes are recorded to reflect the impact of tempo-rary differences between assets and liabilities recognized for financial reporting purposes and such amounts recognized for tax purposes. These deferred taxes are measured by applying currently enacted tax laws to the temporary differences.
Derivatives and hedging activities:All derivative transactions, except those entered into for hedging purposes, are recognized as either assets or liabilities and measured at fair value, with gains or losses on derivative transactions recognized in the statement of income.
For derivative transactions used for hedging purposes, the methods of hedge accounting are as follows:(a) Transactions to hedge against interest rate risk Transactions to hedge against interest rate risk affecting the financial assets and liabilities of the Bank are accounted for using deferral hedge accounting as stipulated in the Japan Institute of Certified Public Accountant (“JICPA”) Industry Audit Committee Report No. 24, “Accounting and Auditing Treatment of Accounting Standards for Financial Instruments in the Banking Industry.” Regarding the effectiveness of a hedging relationship under fair value hedging, a portfolio of hedged items, such as deposits or loans with common maturities, is matched with a group of hedging instruments, such as interest rate swaps, which offset the effect of fair value fluctu-ations of the hedged items by identified maturities, and are designated as a hedge of the portfolio. The effectiveness of the fair value hedge is assessed by each group. Also, the effectiveness of a cash flow hedge is assessed on the basis of the correlation between the base interest rate index of the hedged cash flow and that of the hedging instrument.
011_0254501372609.indd 25 2014/08/12 20:20:33

26
statement of income.The Group expects to apply the revised accounting standards and
guidance from the beginning of the annual period beginning on April 1, 2015, and is in the process of measuring the effects of applying the revised accounting standards and guidance in future applicable peri-ods.
4. TRADING ASSETS AND LIABILITIESTrading assets and liabilities at March 31, 2014 and 2013, consisted of the following:(a) Trading assets
Millions of YenThousands ofU.S. Dollars
2014 2013 2014Trading securities:
Japanese government bonds ¥ 986 ¥ 1,599 $ 9,583 Local government bonds 2,550 2,540 24,778 (Government-guaranteed bonds)Foreign securities 696 664 6,768
Subtotal 4,232 4,804 41,129 Financial derivatives:
(Option premium)Other (Note) 18,854 18,796 183,195
Subtotal 18,854 18,796 183,195 Other trading assets:
Commercial paper 6,997 7,995 67,993 Other (Note) 1 2 10
Subtotal 6,998 7,997 68,003 Total ¥ 30,086 ¥ 31,599 $ 292,327
(b) Trading liabilities
Millions of YenThousands ofU.S. Dollars
2014 2013 2014Financial derivatives:
(Option premium)Other (Note) ¥ 17,835 ¥ 17,700 $173,292
Subtotal 17,835 17,700 173,292 Total ¥ 17,835 ¥ 17,700 $173,292
Note: Other in assets and liabilities represents unrealized gains and losses, respectively.
5. MONEY HELD IN TRUSTMoney held in trust at March 31, 2014 and 2013, consisted of the fol-lowing:
March 31, 2014
Millions of Yen
CostUnrealized
GainsUnrealized
LossesFair
ValueMoney held in trustclassified as:Held to maturity ¥3,100 ¥0 ¥3,100
March 31, 2013
Millions of Yen
CostUnrealized
GainsUnrealized
LossesFair
ValueMoney held in trustclassified as:Held to maturity ¥2,600 ¥0 ¥2,600
March 31, 2014
Thousands of U.S. Dollars
CostUnrealized
GainsUnrealized
LossesFair
ValueMoney held in trustclassified as:Held to maturity $30,121 $0 $30,121
6. SECURITIESSecurities at March 31, 2014 and 2013, consisted of the following:
Millions of YenThousands ofU.S. Dollars
2014 2013 2014Japanese government bonds ¥1,122,378 ¥1,316,834 $10,905,346 Local government bonds 59,915 44,453 582,153 Corporate bonds 282,215 313,046 2,742,087 Corporate stocks 265,228 237,316 2,577,035 Other securities 648,440 648,642 6,300,435
Total ¥2,378,178 ¥2,560,293 $23,107,056
As of March 31, 2014 and 2013, securities included equity invest-ments in unconsolidated subsidiaries and affiliated companies that amounted to ¥2,082 million ($20,235 thousand) and ¥2,207 million, respectively.
In the following description, in addition to securities in the consoli-dated balance sheets, also presented are trading account securities and commercial paper within the item trading assets.
Information regarding each category of the securities classified as trading, available for sale, and held to maturity at March 31, 2014 and 2013, was as follows:
March 31, 2014
Millions of Yen
CostUnrealized
GainsUnrealized
LossesFair
ValueSecurities classified as:
Trading ¥ 11,231 Available-for-sale:
Equity securities ¥ 104,631 ¥154,991 ¥ 646 258,976 Debt securities 1,446,662 11,594 352 1,457,905 Others 624,946 16,136 442 640,641
Held to maturity 11,216 264 6 11,473
March 31, 2013
Millions of Yen
CostUnrealized
GainsUnrealized
LossesFair
ValueSecurities classified as:
Trading ¥ 12,802 Available-for-sale:
Equity securities ¥ 107,926 ¥124,572 ¥1,175 231,323 Debt securities 1,634,826 33,911 130 1,668,608 Others 614,473 25,068 1,096 638,445
Held to maturity 9,478 265 8 9,735
March 31, 2014
Thousands of U.S. Dollars
CostUnrealized
GainsUnrealized
LossesFair
ValueSecurities classified as:
Trading $ 109,132 Available-for-sale:
Equity securities $ 1,016,629 $1,505,943 $6,284 2,516,288 Debt securities 14,056,186 112,657 3,420 14,165,423 Others 6,072,163 156,788 4,299 6,224,652
Held to maturity 108,979 2,572 68 111,483
Available-for-sale securities sold during the years ended March 31, 2014 and 2013, were as follows:
Year EndedMarch 31, 2014
Millions of YenProceeds from
SalesTotal Amount ofGains on Sales
Total Amount ofLosses on Sales
Equity securities ¥ 11,072 ¥ 3,008 ¥ 63Debt securities 1,221,756 12,668 4,597Others 969,193 18,445 12,714Total ¥ 2,202,022 ¥ 34,122 ¥17,376
Year EndedMarch 31, 2013
Millions of YenProceeds from
SalesTotal Amount ofGains on Sales
Total Amount ofLosses on Sales
Equity securities ¥ 4,211 ¥ 442 ¥ 182Debt securities 876,527 7,440 457Others 353,932 5,811 2,626Total ¥ 1,234,672 ¥ 13,694 ¥ 3,266
011_0254501372609.indd 26 2014/08/12 20:20:33
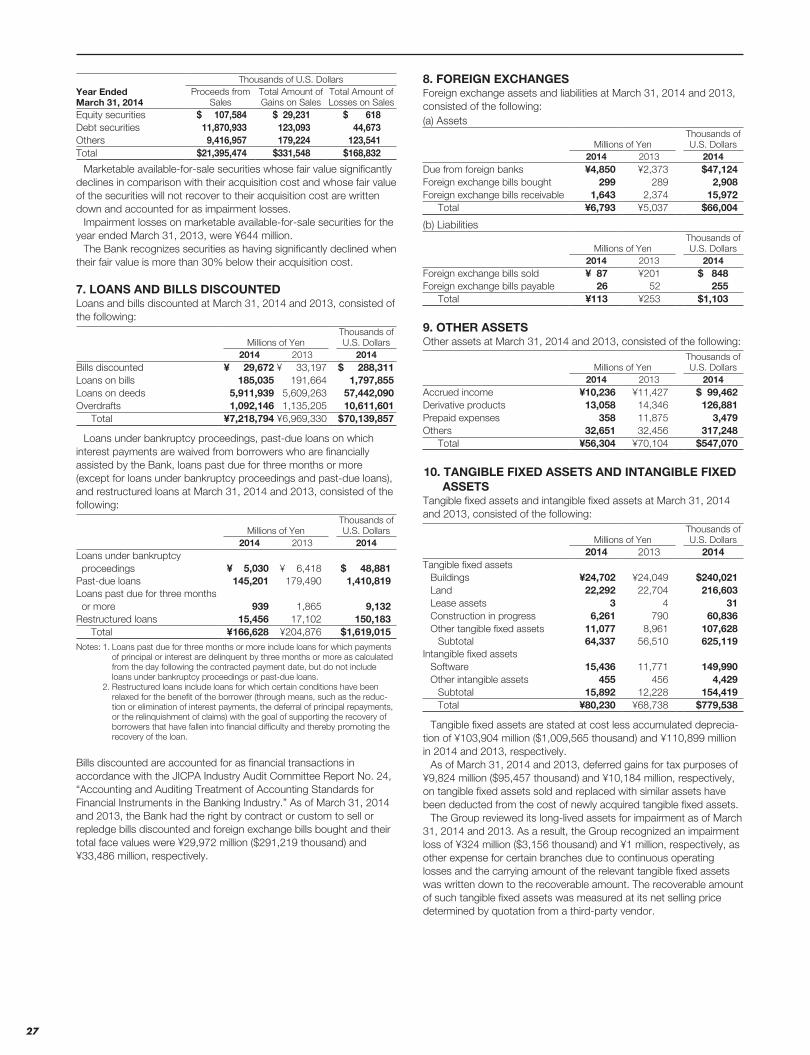
27
Year EndedMarch 31, 2014
Thousands of U.S. DollarsProceeds from
SalesTotal Amount ofGains on Sales
Total Amount ofLosses on Sales
Equity securities $ 107,584 $ 29,231 $ 618Debt securities 11,870,933 123,093 44,673Others 9,416,957 179,224 123,541Total $21,395,474 $331,548 $168,832
Marketable available-for-sale securities whose fair value significantly declines in comparison with their acquisition cost and whose fair value of the securities will not recover to their acquisition cost are written down and accounted for as impairment losses.
Impairment losses on marketable available-for-sale securities for the year ended March 31, 2013, were ¥644 million.
The Bank recognizes securities as having significantly declined when their fair value is more than 30% below their acquisition cost.
7. LOANS AND BILLS DISCOUNTEDLoans and bills discounted at March 31, 2014 and 2013, consisted of the following:
Millions of YenThousands ofU.S. Dollars
2014 2013 2014Bills discounted ¥ 29,672 ¥ 33,197 $ 288,311 Loans on bills 185,035 191,664 1,797,855 Loans on deeds 5,911,939 5,609,263 57,442,090 Overdrafts 1,092,146 1,135,205 10,611,601
Total ¥ 7,218,794 ¥6,969,330 $ 70,139,857
Loans under bankruptcy proceedings, past-due loans on which interest payments are waived from borrowers who are financially assisted by the Bank, loans past due for three months or more (except for loans under bankruptcy proceedings and past-due loans), and restructured loans at March 31, 2014 and 2013, consisted of the following:
Millions of YenThousands ofU.S. Dollars
2014 2013 2014Loans under bankruptcy proceedings ¥ 5,030 ¥ 6,418 $ 48,881 Past-due loans 145,201 179,490 1,410,819 Loans past due for three months or more 939 1,865 9,132 Restructured loans 15,456 17,102 150,183
Total ¥ 166,628 ¥204,876 $ 1,619,015 Notes: 1. Loans past due for three months or more include loans for which payments
of principal or interest are delinquent by three months or more as calculated from the day following the contracted payment date, but do not include loans under bankruptcy proceedings or past-due loans.
2. Restructured loans include loans for which certain conditions have been relaxed for the benefit of the borrower (through means, such as the reduc-tion or elimination of interest payments, the deferral of principal repayments, or the relinquishment of claims) with the goal of supporting the recovery of borrowers that have fallen into financial difficulty and thereby promoting the recovery of the loan.
Bills discounted are accounted for as financial transactions in accordance with the JICPA Industry Audit Committee Report No. 24, “Accounting and Auditing Treatment of Accounting Standards for Financial Instruments in the Banking Industry.” As of March 31, 2014 and 2013, the Bank had the right by contract or custom to sell or repledge bills discounted and foreign exchange bills bought and their total face values were ¥29,972 million ($291,219 thousand) and ¥33,486 million, respectively.
8. FOREIGN EXCHANGESForeign exchange assets and liabilities at March 31, 2014 and 2013, consisted of the following:(a) Assets
Millions of YenThousands ofU.S. Dollars
2014 2013 2014Due from foreign banks ¥4,850 ¥2,373 $47,124 Foreign exchange bills bought 299 289 2,908 Foreign exchange bills receivable 1,643 2,374 15,972
Total ¥6,793 ¥5,037 $66,004
(b) Liabilities
Millions of YenThousands ofU.S. Dollars
2014 2013 2014Foreign exchange bills sold ¥ 87 ¥201 $ 848 Foreign exchange bills payable 26 52 255
Total ¥113 ¥253 $1,103
9. OTHER ASSETSOther assets at March 31, 2014 and 2013, consisted of the following:
Millions of YenThousands ofU.S. Dollars
2014 2013 2014Accrued income ¥10,236 ¥11,427 $ 99,462 Derivative products 13,058 14,346 126,881 Prepaid expenses 358 11,875 3,479 Others 32,651 32,456 317,248
Total ¥56,304 ¥70,104 $547,070
10. TANGIBLE FIXED ASSETS AND INTANGIBLE FIXED ASSETS
Tangible fixed assets and intangible fixed assets at March 31, 2014 and 2013, consisted of the following:
Millions of YenThousands ofU.S. Dollars
2014 2013 2014Tangible fixed assets
Buildings ¥24,702 ¥24,049 $240,021 Land 22,292 22,704 216,603 Lease assets 3 4 31 Construction in progress 6,261 790 60,836 Other tangible fixed assets 11,077 8,961 107,628
Subtotal 64,337 56,510 625,119 Intangible fixed assets
Software 15,436 11,771 149,990 Other intangible assets 455 456 4,429
Subtotal 15,892 12,228 154,419 Total ¥80,230 ¥68,738 $779,538
Tangible fixed assets are stated at cost less accumulated deprecia-tion of ¥103,904 million ($1,009,565 thousand) and ¥110,899 million in 2014 and 2013, respectively.
As of March 31, 2014 and 2013, deferred gains for tax purposes of ¥9,824 million ($95,457 thousand) and ¥10,184 million, respectively, on tangible fixed assets sold and replaced with similar assets have been deducted from the cost of newly acquired tangible fixed assets.
The Group reviewed its long-lived assets for impairment as of March 31, 2014 and 2013. As a result, the Group recognized an impairment loss of ¥324 million ($3,156 thousand) and ¥1 million, respectively, as other expense for certain branches due to continuous operating losses and the carrying amount of the relevant tangible fixed assets was written down to the recoverable amount. The recoverable amount of such tangible fixed assets was measured at its net selling price determined by quotation from a third-party vendor.
011_0254501372609.indd 27 2014/08/12 20:20:33
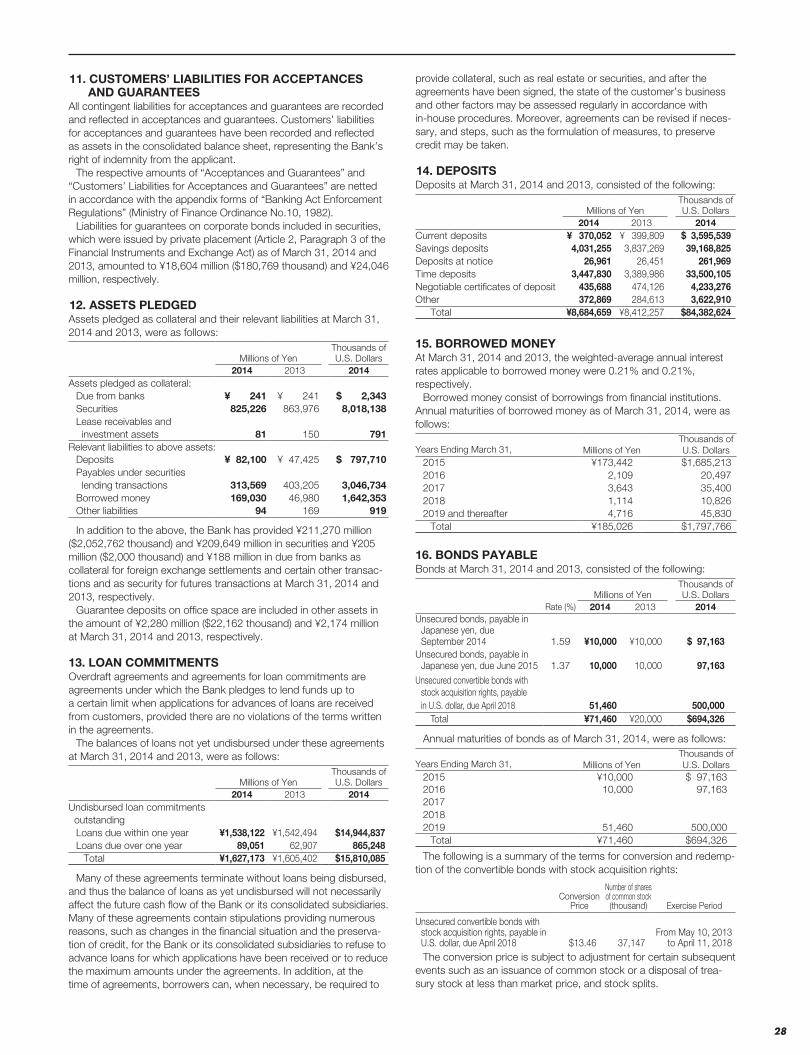
28
provide collateral, such as real estate or securities, and after the agreements have been signed, the state of the customer’s business and other factors may be assessed regularly in accordance with in-house procedures. Moreover, agreements can be revised if neces-sary, and steps, such as the formulation of measures, to preserve credit may be taken.
14. DEPOSITSDeposits at March 31, 2014 and 2013, consisted of the following:
Millions of YenThousands ofU.S. Dollars
2014 2013 2014Current deposits ¥ 370,052 ¥ 399,809 $ 3,595,539 Savings deposits 4,031,255 3,837,269 39,168,825 Deposits at notice 26,961 26,451 261,969 Time deposits 3,447,830 3,389,986 33,500,105 Negotiable certificates of deposit 435,688 474,126 4,233,276 Other 372,869 284,613 3,622,910
Total ¥8,684,659 ¥8,412,257 $84,382,624
15. BORROWED MONEYAt March 31, 2014 and 2013, the weighted-average annual interest rates applicable to borrowed money were 0.21% and 0.21%, respectively.
Borrowed money consist of borrowings from financial institutions. Annual maturities of borrowed money as of March 31, 2014, were as follows:
Years Ending March 31, Millions of YenThousands ofU.S. Dollars
2015 ¥173,442 $1,685,213 2016 2,109 20,497 2017 3,643 35,400 2018 1,114 10,826 2019 and thereafter 4,716 45,830
Total ¥185,026 $1,797,766
16. BONDS PAYABLEBonds at March 31, 2014 and 2013, consisted of the following:
Millions of YenThousands ofU.S. Dollars
Rate (%) 2014 2013 2014Unsecured bonds, payable in
Japanese yen, dueSeptember 2014 1.59 ¥10,000 ¥10,000 $ 97,163
Unsecured bonds, payable inJapanese yen, due June 2015 1.37 10,000 10,000 97,163
Unsecured convertible bonds with stock acquisition rights, payable in U.S. dollar, due April 2018 51,460 500,000
Total ¥71,460 ¥20,000 $694,326
Annual maturities of bonds as of March 31, 2014, were as follows:
Years Ending March 31, Millions of YenThousands ofU.S. Dollars
2015 ¥10,000 $ 97,1632016 10,000 97,163201720182019 51,460 500,000
Total ¥71,460 $694,326
The following is a summary of the terms for conversion and redemp-tion of the convertible bonds with stock acquisition rights:
Conversion Price
Number of shares of common stock (thousand) Exercise Period
Unsecured convertible bonds with stock acquisition rights, payable in U.S. dollar, due April 2018 $13.46 37,147
From May 10, 2013 to April 11, 2018
The conversion price is subject to adjustment for certain subsequent events such as an issuance of common stock or a disposal of trea-sury stock at less than market price, and stock splits.
11. CUSTOMERS’ LIABILITIES FOR ACCEPTANCES AND GUARANTEES
All contingent liabilities for acceptances and guarantees are recorded and reflected in acceptances and guarantees. Customers’ liabilities for acceptances and guarantees have been recorded and reflected as assets in the consolidated balance sheet, representing the Bank’s right of indemnity from the applicant.
The respective amounts of “Acceptances and Guarantees” and “Customers’ Liabilities for Acceptances and Guarantees” are netted in accordance with the appendix forms of “Banking Act Enforcement Regulations” (Ministry of Finance Ordinance No.10, 1982).
Liabilities for guarantees on corporate bonds included in securities, which were issued by private placement (Article 2, Paragraph 3 of the Financial Instruments and Exchange Act) as of March 31, 2014 and 2013, amounted to ¥18,604 million ($180,769 thousand) and ¥24,046 million, respectively.
12. ASSETS PLEDGEDAssets pledged as collateral and their relevant liabilities at March 31, 2014 and 2013, were as follows:
Millions of YenThousands ofU.S. Dollars
2014 2013 2014Assets pledged as collateral:
Due from banks ¥ 241 ¥ 241 $ 2,343 Securities 825,226 863,976 8,018,138 Lease receivables and
investment assets 81 150 791 Relevant liabilities to above assets:
Deposits ¥ 82,100 ¥ 47,425 $ 797,710 Payables under securities
lending transactions 313,569 403,205 3,046,734 Borrowed money 169,030 46,980 1,642,353 Other liabilities 94 169 919
In addition to the above, the Bank has provided ¥211,270 million ($2,052,762 thousand) and ¥209,649 million in securities and ¥205 million ($2,000 thousand) and ¥188 million in due from banks as collateral for foreign exchange settlements and certain other transac-tions and as security for futures transactions at March 31, 2014 and 2013, respectively.
Guarantee deposits on office space are included in other assets in the amount of ¥2,280 million ($22,162 thousand) and ¥2,174 million at March 31, 2014 and 2013, respectively.
13. LOAN COMMITMENTSOverdraft agreements and agreements for loan commitments are agreements under which the Bank pledges to lend funds up to a certain limit when applications for advances of loans are received from customers, provided there are no violations of the terms written in the agreements.
The balances of loans not yet undisbursed under these agreements at March 31, 2014 and 2013, were as follows:
Millions of YenThousands ofU.S. Dollars
2014 2013 2014Undisbursed loan commitments
outstandingLoans due within one year ¥1,538,122 ¥1,542,494 $14,944,837 Loans due over one year 89,051 62,907 865,248
Total ¥1,627,173 ¥1,605,402 $15,810,085
Many of these agreements terminate without loans being disbursed, and thus the balance of loans as yet undisbursed will not necessarily affect the future cash flow of the Bank or its consolidated subsidiaries.Many of these agreements contain stipulations providing numerous reasons, such as changes in the financial situation and the preserva-tion of credit, for the Bank or its consolidated subsidiaries to refuse to advance loans for which applications have been received or to reduce the maximum amounts under the agreements. In addition, at the time of agreements, borrowers can, when necessary, be required to
011_0254501372609.indd 28 2014/08/12 20:20:33
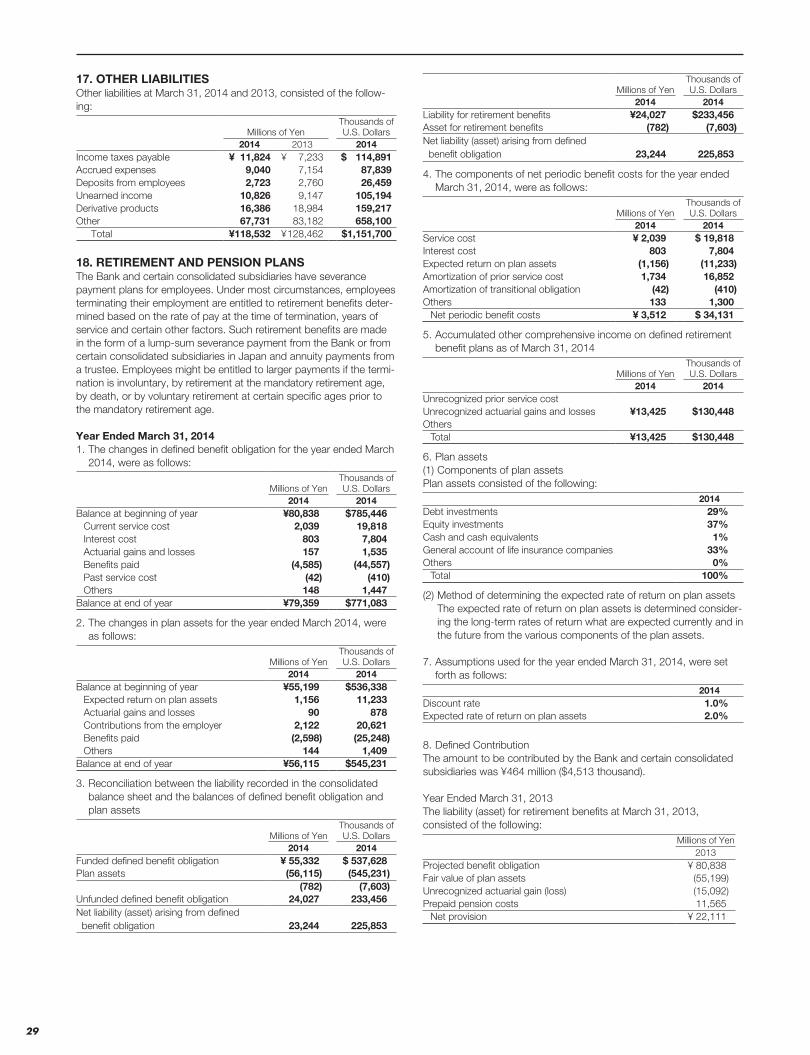
29
Millions of YenThousands ofU.S. Dollars
2014 2014Liability for retirement benefits ¥24,027 $233,456Asset for retirement benefits (782) (7,603)Net liability (asset) arising from defined
benefit obligation 23,244 225,853
4. The components of net periodic benefit costs for the year ended March 31, 2014, were as follows:
Millions of YenThousands ofU.S. Dollars
2014 2014Service cost ¥ 2,039 $ 19,818Interest cost 803 7,804Expected return on plan assets (1,156) (11,233)Amortization of prior service cost 1,734 16,852Amortization of transitional obligation (42) (410)Others 133 1,300
Net periodic benefit costs ¥ 3,512 $ 34,131
5. Accumulated other comprehensive income on defined retirement benefit plans as of March 31, 2014
Millions of YenThousands ofU.S. Dollars
2014 2014Unrecognized prior service cost Unrecognized actuarial gains and losses ¥13,425 $130,448Others
Total ¥13,425 $130,448
6. Plan assets(1) Components of plan assetsPlan assets consisted of the following:
2014Debt investments 29%Equity investments 37%Cash and cash equivalents 1%General account of life insurance companies 33%Others 0%
Total 100%
(2) Method of determining the expected rate of return on plan assets The expected rate of return on plan assets is determined consider-
ing the long-term rates of return what are expected currently and in the future from the various components of the plan assets.
7. Assumptions used for the year ended March 31, 2014, were set forth as follows:
2014Discount rate 1.0%Expected rate of return on plan assets 2.0%
8. Defined ContributionThe amount to be contributed by the Bank and certain consolidated subsidiaries was ¥464 million ($4,513 thousand).
Year Ended March 31, 2013The liability (asset) for retirement benefits at March 31, 2013, consisted of the following:
Millions of Yen2013
Projected benefit obligation ¥ 80,838Fair value of plan assets (55,199)Unrecognized actuarial gain (loss) (15,092)Prepaid pension costs 11,565
Net provision ¥ 22,111
17. OTHER LIABILITIESOther liabilities at March 31, 2014 and 2013, consisted of the follow-ing:
Millions of YenThousands ofU.S. Dollars
2014 2013 2014Income taxes payable ¥ 11,824 ¥ 7,233 $ 114,891Accrued expenses 9,040 7,154 87,839Deposits from employees 2,723 2,760 26,459Unearned income 10,826 9,147 105,194Derivative products 16,386 18,984 159,217Other 67,731 83,182 658,100
Total ¥118,532 ¥ 128,462 $1,151,700
18. RETIREMENT AND PENSION PLANSThe Bank and certain consolidated subsidiaries have severance payment plans for employees. Under most circumstances, employees terminating their employment are entitled to retirement benefits deter-mined based on the rate of pay at the time of termination, years of service and certain other factors. Such retirement benefits are made in the form of a lump-sum severance payment from the Bank or from certain consolidated subsidiaries in Japan and annuity payments from a trustee. Employees might be entitled to larger payments if the termi-nation is involuntary, by retirement at the mandatory retirement age, by death, or by voluntary retirement at certain specific ages prior to the mandatory retirement age.
Year Ended March 31, 20141. The changes in defined benefit obligation for the year ended March
2014, were as follows:
Millions of YenThousands ofU.S. Dollars
2014 2014Balance at beginning of year ¥80,838 $785,446
Current service cost 2,039 19,818Interest cost 803 7,804Actuarial gains and losses 157 1,535Benefits paid (4,585) (44,557)Past service cost (42) (410)Others 148 1,447
Balance at end of year ¥79,359 $771,083
2. The changes in plan assets for the year ended March 2014, were as follows:
Millions of YenThousands ofU.S. Dollars
2014 2014Balance at beginning of year ¥55,199 $536,338
Expected return on plan assets 1,156 11,233Actuarial gains and losses 90 878Contributions from the employer 2,122 20,621Benefits paid (2,598) (25,248)Others 144 1,409
Balance at end of year ¥56,115 $545,231
3. Reconciliation between the liability recorded in the consolidated balance sheet and the balances of defined benefit obligation and plan assets
Millions of YenThousands ofU.S. Dollars
2014 2014Funded defined benefit obligation ¥ 55,332 $ 537,628Plan assets (56,115) (545,231)
(782) (7,603)Unfunded defined benefit obligation 24,027 233,456Net liability (asset) arising from defined
benefit obligation 23,244 225,853
011_0254501372609.indd 29 2014/08/12 20:20:34

30
20. STOCK OPTIONSThe Bank’s stock option plans grant options to directors to purchase certain shares of the Bank’s common stock in the respective exercise periods.
Stock-based compensation expenses were ¥93 million ($908 thou-sand) and ¥73 million for the years ended March 31, 2014 and 2013, respectively.
The stock options outstanding as of March 31, 2014, were as follows:PersonsGranted
Numberof Options
Date ofGrant
ExercisePrice Exercise Period
2007Stock Option
8 directors67,000shares
2007.7.27
¥ 1($0.01)
From July 28, 2007to July 27, 2032
2008Stock Option
8 directors66,000shares
2008.7.18
¥ 1($0.01)
From July 19, 2008to July 18, 2033
2009Stock Option
8 directors89,000shares
2009.7.24
¥ 1($0.01)
From July 25, 2009to July 24, 2034
2010Stock Option
8 directors100,000shares
2010.7.23
¥ 1($0.01)
From July 24, 2010to July 23, 2035
2011Stock Option
8 directors100,000shares
2011.7.22
¥ 1($0.01)
From July 23, 2011to July 22, 2036
2012 Stock Option
8 directors100,000 shares
2012.7.24
¥ 1($0.01)
From July 25, 2012to July 24, 2037
2013 Stock Option
8 directors88,000 shares
2013.7.23
¥ 1($0.01)
From July 24, 2013to July 23, 2038
The stock option activity is as follows:
2007StockOption
2008StockOption
2009StockOption
2010StockOption
2011 Stock Option
2012 Stock Option
2013 Stock Option
For the year ended March 31, 2013Non-vested
March 31, 2012—Outstanding 100,000Granted 100,000Vested 100,000
March 31, 2013—Outstanding 100,000Vested
March 31, 2012—Outstanding 56,000 55,000 89,000 100,000Vested 100,000Exercised 9,000 9,000 13,000 21,000 20,000
March 31, 2013—Outstanding 47,000 46,000 76,000 79,000 80,000For the year ended March 31, 2014
Non-vestedMarch 31, 2013—Outstanding 100,000
Granted 88,000Vested 100,000
March 31, 2014—Outstanding 88,000Vested
March 31, 2013—Outstanding 47,000 46,000 76,000 79,000 80,000Vested 100,000Exercised 20,000 19,000 26,000 10,000 8,000 9,000
March 31, 2014—Outstanding 27,000 27,000 50,000 69,000 72,000 91,000
Exercise price¥ 1 ¥ 1 ¥ 1 ¥ 1 ¥ 1 ¥ 1 ¥ 1
($ 0.01) ($ 0.01) ($ 0.01) ($ 0.01) ($ 0.01) ($ 0.01) ($ 0.01)
Average stock price at exercise¥ 990 ¥ 990 ¥ 990 ¥ 990 ¥ 990 ¥ 990 ¥
($ 9.62) ($ 9.62) ($ 9.62) ($ 9.62) ($ 9.62) ($ 9.62) ($ )
Fair value price at grant date¥ 1,153 ¥ 1,057 ¥ 875 ¥ 704 ¥ 709 ¥ 743 ¥ 1,135
($ 11.20) ($ 10.27) ($ 8.50) ($ 6.84) ($ 6.89) ($ 7.22) ($ 11.03)
The assumptions used to measure the fair value of the 2013 stock option are as follows:Estimate method: Black-Scholes option-pricing modelVolatility of stock price: 22.0%Estimated remaining outstanding period: three yearsEstimated dividend: ¥15.0 per shareRisk-free interest rate: 0.1%
The components of net periodic benefit costs for the year ended March 31, 2013, were as follows:
Millions of Yen2013
Service cost ¥1,966Interest cost 825Expected return on plan assets (972)Recognized actuarial loss 2,602Other 563
Net periodic retirement benefit costs ¥4,985
Assumptions used for the year ended March 31, 2013, were set forth as follows:
2013Discount rate 1.0 %Expected rate of return on plan assets 2.0 %Amortization period of prior service cost 1 yearRecognition period of actuarial gain/loss 10 years
19. EQUITYJapanese companies are subject to the Companies Act. The signifi-cant provisions in the Companies Act that affect financial and accounting matters are summarized below:
(a) DividendsUnder the Companies Act, companies can pay dividends at any time during the fiscal year in addition to the year-end dividend upon resolu-tion at the shareholders’ meeting. For companies that meet certain criteria, such as (1) having a Board of Directors, (2) having independent auditors, (3) having an Audit & Supervisory Board, and (4) the term of service of the directors is prescribed as one year rather than two years of normal term by its articles of incorporation, the Board of Directors may declare dividends (except for dividends in kind) at any time during the fiscal year if the company has prescribed so in its articles of incor-poration. However, the Bank cannot do so because it does not meet all the above criteria. The Companies Act permits companies to distribute dividends in kind (noncash assets) to shareholders subject to certain limitations and additional requirements.
Semiannual interim dividends may also be paid once a year upon resolution by the Board of Directors if the articles of incorporation of the company so stipulate. The Companies Act and the Banking Act provide certain limitations on the amounts available for dividends or the purchase of treasury stock.
(b) Increases/decreases and transfer of capital stock, reserve, and surplusThe Banking Act requires that an amount equal to 20% of dividends must be appropriated as a legal reserve (a component of retained earnings) or as additional paid-in capital (a component of capital surplus) depending on the equity account charged upon the payment of such dividends, until the total of the aggregate amount of the legal reserve and additional paid-in capital equals 100% of capital stock.
The Companies Act also provides that capital stock, legal reserve, additional paid-in capital, other capital surplus, and retained earnings can be transferred among the accounts under certain conditions upon resolution of the shareholders.
(c) Treasury stock and treasury stock acquisition rightsThe Companies Act also provides for companies to purchase treasury stock and dispose of such treasury stock by resolution of the Board of Directors. The amount of treasury stock purchased cannot exceed the amount available for distribution to the shareholders, which is determined using a specific formula.
Under the Companies Act, stock acquisition rights are presented as a separate component of equity.
The Companies Act also provides that companies can purchase both treasury stock acquisition rights and treasury stock. Such trea-sury stock acquisition rights are presented as a separate component of equity or deducted directly from stock acquisition rights.
011_0254501372609.indd 30 2014/08/12 20:20:34

31
26. INCOME TAXESThe Bank and its domestic subsidiaries are subject to Japanese national and local income taxes that, in the aggregate, resulted in a normal effective statutory tax rate of approximately 37.2% for the years ended March 31, 2014 and 2013.
Millions of YenThousands ofU.S. Dollars
2014 2013 2014Deferred tax assets:
Allowance for loan losses ¥ 18,406 ¥ 21,369 $ 178,840 Liability for retirement benefits 15,091 10,863 146,631 Impairment loss on securities 4,362 4,816 42,383 Other 3,714 3,558 36,092
Deferred tax assets 41,574 40,608 403,946 Deferred tax liabilities:
Valuation difference on available-for-sale securities (60,685) (62,092) (589,638)
Gain on establishment of employee retirement benefit trust (6,066) (6,066) (58,949)
Other (1,884) (1,877) (18,307)Deferred tax liabilities (68,636) (70,036) (666,894)Net deferred tax
assets (liabilities) ¥(27,062) ¥(29,428) $(262,948)
A reconciliation between the normal effective statutory tax rates and the actual effective tax rates reflected in the accompanying consolidated statement of income for the year ended March 31, 2014, with the corresponding figures for 2013, is as follows:
2014 2013Normal effective statutory tax rate 37.2 % 37.2 %Dividends exempted for income tax purposes (2.9) % (1.1) %Gains on negative goodwill (5.7) %Reduction in deferred tax assets resulting
from a change in effective tax rate 0.9 %Other 0.7 % 1.0 %Actual effective tax rate 35.9 % 31.4 %
New tax reform laws enacted in 2014 in Japan changed the normal effective statutory tax rate for the fiscal year beginning on or after April 1, 2014, from 37.2% to 34.8%.
The effect of this change was to decrease deferred tax assets and to increase deferred tax liabilities in the consolidated balance sheet as of March 31, 2014, by ¥30 million ($298 thousand) and ¥638 million ($6,206 thousand), respectively, and to increase income taxes-deferred in the consolidated statement of income for the year then ended by ¥664 million ($6,461 thousand).
27. LEASES(1) Financial Lease(a) LesseeThe Group leases certain vehicles. They were capitalized as tangible fixed assets and depreciated as stated in Note 3.
Pro forma Information of Leased Property Whose Lease Inception Was before March 31, 2008:ASBJ Statement No. 13, “Accounting Standard for Lease Transactions,” requires that all finance lease transactions be capital-ized to recognize lease assets and lease obligations in the balance sheet. However, ASBJ Statement No. 13 permits leases without ownership transfer of the leased property to the lessee and whose lease inception was before March 31, 2008, to continue to be accounted for as operating lease transactions if certain “as if capital-ized” information is disclosed in the note to the consolidated financial statements. The Group applied ASBJ Statement No. 13 effective April 1, 2008, and accounted for such leases as operating lease transac-tions. Pro forma information of leased property whose lease inception was before March 31, 2008, was as follows:
21. VALUATION DIFFERENCE ON AVAILABLE-FOR-SALE SECURITIES
The breakdown of “Valuation difference on available-for-sale securi-ties” posted in the consolidated balance sheet is as follows:
Millions of YenThousands ofU.S. Dollars
2014 2013 2014Valuation difference ¥ 181,281 ¥ 183,406 $ 1,761,384 Deferred tax liabilities (60,685) (62,092) (589,638)Amounts equivalent to
difference onavailable-for-sale securities ¥ 120,596 ¥ 121,314 $ 1,171,746
Minority interests adjustment ¥ (187) ¥ (144) $ (1,822)Valuation difference on
available-for-sale securities ¥ 120,408 ¥ 121,169 $1,169,924
22. OTHER OPERATING INCOMEOther operating income for the years ended March 31, 2014 and 2013, consisted of the following:
Millions of YenThousands ofU.S. Dollars
2014 2013 2014Gains on foreign exchange
transactions ¥ 864 ¥ 528 $ 8,399 Gains on sales of bonds 18,996 12,478 184,572 Gains on financial derivatives 113 1,101 Other 3 11 35
Total ¥ 19,977 ¥ 13,018 $ 194,107
23. OTHER INCOMEOther income for the years ended March 31, 2014 and 2013, consisted of the following:
Millions of YenThousands ofU.S. Dollars
2014 2013 2014Gains on sales of stocks and
other securities ¥ 3,008 ¥ 442 $ 29,231Gains on negative goodwill 12,899 Other 9,384 11,093 91,183
Total ¥12,393 ¥24,436 $ 120,414
For the year ended March 31, 2013, gains on negative goodwill were accounted by deducing goodwill of ¥963 million from negative goodwill of ¥13,863 million. Details are disclosed in Note 33.
24. OTHER OPERATING EXPENSESOther operating expenses for the years ended March 31, 2014 and 2013, consisted of the following:
Millions of YenThousands ofU.S. Dollars
2014 2013 2014Losses on sales of bonds ¥17,019 ¥2,732 $165,363 Losses on redemption of bonds Losses on devaluation of bondsOther 264
Total ¥17,019 ¥2,996 $165,363
25. OTHER EXPENSESOther expenses for the years ended March 31, 2014 and 2013, consisted of the following:
Millions of YenThousands ofU.S. Dollars
2014 2013 2014Losses on written-off claims ¥ 262 ¥ 208 $ 2,547Losses on sales of stocks and
other securities 78 182 764 Losses on devaluation of stocks
and other securities 7 881 73 Losses on money held in trust 4 Losses on disposition of fixed assets 794 1,709 7,720 Impairment losses 324 1 3,156 Other 6,767 8,046 65,756
Total ¥8,235 ¥11,035 $ 80,016
011_0254501372609.indd 31 2014/08/12 20:20:34
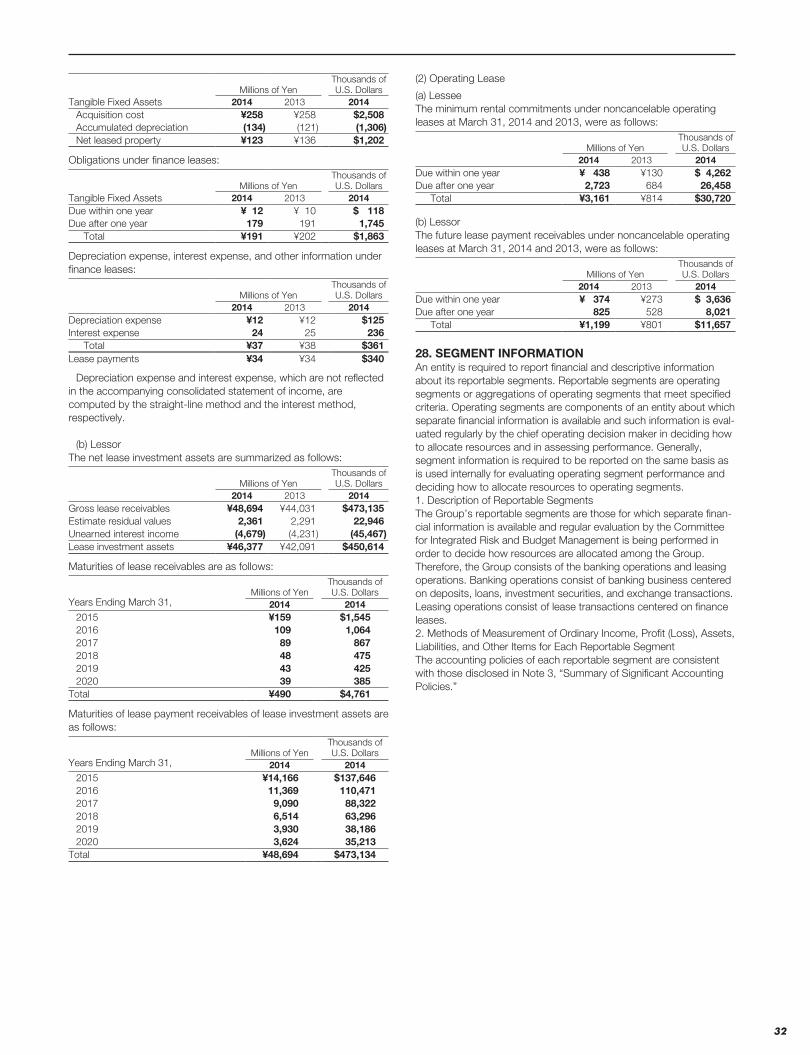
32
(2) Operating Lease
(a) LesseeThe minimum rental commitments under noncancelable operating leases at March 31, 2014 and 2013, were as follows:
Millions of YenThousands ofU.S. Dollars
2014 2013 2014Due within one year ¥ 438 ¥130 $ 4,262 Due after one year 2,723 684 26,458
Total ¥3,161 ¥814 $30,720
(b) LessorThe future lease payment receivables under noncancelable operating leases at March 31, 2014 and 2013, were as follows:
Millions of YenThousands ofU.S. Dollars
2014 2013 2014Due within one year ¥ 374 ¥273 $ 3,636 Due after one year 825 528 8,021
Total ¥1,199 ¥801 $11,657
28. SEGMENT INFORMATIONAn entity is required to report financial and descriptive information about its reportable segments. Reportable segments are operating segments or aggregations of operating segments that meet specified criteria. Operating segments are components of an entity about which separate financial information is available and such information is eval-uated regularly by the chief operating decision maker in deciding how to allocate resources and in assessing performance. Generally, segment information is required to be reported on the same basis as is used internally for evaluating operating segment performance and deciding how to allocate resources to operating segments.1. Description of Reportable SegmentsThe Group’s reportable segments are those for which separate finan-cial information is available and regular evaluation by the Committee for Integrated Risk and Budget Management is being performed in order to decide how resources are allocated among the Group. Therefore, the Group consists of the banking operations and leasing operations. Banking operations consist of banking business centered on deposits, loans, investment securities, and exchange transactions. Leasing operations consist of lease transactions centered on finance leases.2. Methods of Measurement of Ordinary Income, Profit (Loss), Assets, Liabilities, and Other Items for Each Reportable SegmentThe accounting policies of each reportable segment are consistent with those disclosed in Note 3, “Summary of Significant Accounting Policies.”
Millions of YenThousands ofU.S. Dollars
Tangible Fixed Assets 2014 2013 2014Acquisition cost ¥258 ¥258 $2,508 Accumulated depreciation (134) (121) (1,306)Net leased property ¥123 ¥136 $1,202
Obligations under finance leases:
Millions of YenThousands ofU.S. Dollars
Tangible Fixed Assets 2014 2013 2014Due within one year ¥ 12 ¥ 10 $ 118 Due after one year 179 191 1,745
Total ¥ 191 ¥202 $1,863
Depreciation expense, interest expense, and other information under finance leases:
Millions of YenThousands ofU.S. Dollars
2014 2013 2014Depreciation expense ¥12 ¥12 $125 Interest expense 24 25 236
Total ¥37 ¥38 $361Lease payments ¥34 ¥34 $340
Depreciation expense and interest expense, which are not reflected in the accompanying consolidated statement of income, are computed by the straight-line method and the interest method, respectively.
(b) LessorThe net lease investment assets are summarized as follows:
Millions of YenThousands ofU.S. Dollars
2014 2013 2014Gross lease receivables ¥48,694 ¥44,031 $473,135 Estimate residual values 2,361 2,291 22,946 Unearned interest income (4,679) (4,231) (45,467)Lease investment assets ¥46,377 ¥42,091 $450,614
Maturities of lease receivables are as follows:
Years Ending March 31,Millions of Yen
Thousands ofU.S. Dollars
2014 20142015 ¥159 $1,545 2016 109 1,064 2017 89 867 2018 48 475 2019 43 425 2020 39 385
Total ¥490 $4,761
Maturities of lease payment receivables of lease investment assets are as follows:
Years Ending March 31,Millions of Yen
Thousands ofU.S. Dollars
2014 20142015 ¥14,166 $137,646 2016 11,369 110,471 2017 9,090 88,322 2018 6,514 63,296 2019 3,930 38,186 2020 3,624 35,213
Total ¥48,694 $473,134
011_0254501372609.indd 32 2014/08/12 20:20:34

33
3. Information about Ordinary Income, Profit (Loss), Assets, Liabilities, and Other ItemsMillions of Yen
Reportable Segment Year Ended March 31, 2014
BankingOperations
LeasingOperations Total Other Total Reconciliations Consolidated
Ordinary income:Ordinary income from external customers ¥ 185,032 ¥ 22,420 ¥ 207,452 ¥ 13,418 ¥ 220,871 ¥ 220,871 Ordinary income from intersegment transactions 1,783 1,875 3,658 4,498 8,157 ¥ (8,157)
Total ¥ 186,815 ¥ 24,296 ¥ 211,111 ¥ 17,916 ¥ 229,028 ¥ (8,157) ¥ 220,871 Segment profit ¥ 67,336 ¥ 1,617 ¥ 68,954 ¥ 5,894 ¥ 74,849 ¥ (150) ¥ 74,698 Segment assets 10,654,647 67,677 10,722,324 50,694 10,773,019 (75,070) 10,697,948 Segment liabilities 9,871,645 53,976 9,925,621 21,518 9,947,140 (65,895) 9,881,244 Other:
Depreciation 9,884 741 10,626 278 10,904 (95) 10,809 Interest income 134,668 10 134,679 138 134,817 (242) 134,575 Interest expense 8,134 267 8,402 11 8,414 (309) 8,104 Increase in property, plant, equipment, and
intangible assets 20,808 817 21,626 1,052 22,679 (257) 22,422
Millions of YenReportable Segment
Year Ended March 31, 2013Banking
OperationsLeasing
Operations Total Other Total Reconciliations Consolidated
Ordinary income:Ordinary income from external customers ¥ 169,954 ¥22,052 ¥ 192,007 ¥ 11,119 ¥ 203,127 ¥ 203,127 Ordinary income from intersegment transactions 1,571 2,675 4,246 3,460 7,706 ¥ (7,706)
Total ¥ 171,526 ¥24,728 ¥ 196,254 ¥ 14,579 ¥ 210,834 ¥ (7,706) ¥ 203,127 Segment profit ¥ 65,367 ¥ 1,746 ¥ 67,113 ¥ 4,412 ¥ 71,526 ¥ (226) ¥ 71,300 Segment assets 10,285,558 63,259 10,348,817 42,008 10,390,825 (76,054) 10,314,770 Segment liabilities 9,503,488 51,016 9,554,504 16,512 9,571,017 (66,991) 9,504,025 Other:
Depreciation 10,758 944 11,702 236 11,939 (75) 11,863 Interest income 128,937 14 128,952 115 129,067 (246) 128,820 Interest expense 8,365 301 8,667 13 8,680 (327) 8,353 Increase in property, plant, equipment, and
intangible assets 7,488 540 8,028 276 8,305 (136) 8,168
Thousands of U.S. DollarsReportable Segment
Year Ended March 31, 2014Banking
OperationsLeasing
Operations Total Other Total Reconciliations Consolidated
Ordinary income:Ordinary income from external customers $ 1,797,827 $ 217,842 $ 2,015,669 $ 130,378 $ 2,146,047 $ 2,146,047 Ordinary income from intersegment transactions 17,325 18,227 35,552 43,705 79,257 $ (79,257)
Total $ 1,815,152 $ 236,069 $ 2,051,221 $ 174,083 $ 2,225,304 $ (79,257) $ 2,146,047 Segment profit $ 654,265 $ 15,718 $ 669,983 $ 57,272 $ 727,255 $ (1,467) $ 725,788 Segment assets 103,523,582 657,576 104,181,158 492,567 104,673,725 (729,410) 103,944,315 Segment liabilities 95,915,712 524,449 96,440,161 209,081 96,649,242 (640,255) 96,008,987 Other:
Depreciation 96,041 7,209 103,250 2,702 105,952 (924) 105,028 Interest income 1,308,480 101 1,308,581 1,345 1,309,926 (2,354) 1,307,572 Interest expense 79,041 2,603 81,644 109 81,753 (3,005) 78,748 Increase in property, plant, equipment, and
tangible assets 202,185 7,948 210,133 10,226 220,359 (2,498) 217,861 Note: “Reconciliations” are mainly eliminations of intersegment transactions.
011_0254501372609.indd 33 2014/08/12 20:20:34

34
4. Related information(1) Information about services
Millions of Yen Thousands of U.S. Dollars
LendingOperations
InvestmentOperations
LeasingOperations Other Total
LendingOperations
InvestmentOperations
LeasingOperations Other Total
Ordinary income from external customers
Year ended March 31, 2014 ¥93,476 ¥61,198 ¥22,250 ¥43,944 ¥220,871 $908,244 $594,627 $216,194 $426,982 $2,146,047 Year ended March 31, 2013 ¥97,844 ¥42,599 ¥21,706 ¥40,975 ¥203,127
(2) Information about geographical areas(i) Ordinary IncomeThe domestic share of ordinary income from external customers exceeds 90% of ordinary income in the consolidated statement of income, thus information is not presented.(ii) Tangible fixed assetsThe domestic share of tangible fixed assets exceeds 90% of tangible fixed assets in the consolidated balance sheet, thus information is not presented.
(3) Information about major customersOrdinary income from a specific customer does not exceed 10% of ordinary income in the consolidated statements of income, thus information is not presented.
5. Information about impairment losses of assetsMillions of Yen Thousands of U.S. Dollars
Reportable Segment Reportable Segment
BankingOperations
LeasingOperations Total Other Total
BankingOperations
LeasingOperations Total Other Total
Impairment losses of assetsYear ended March 31, 2014 ¥324 ¥324 ¥324 $3,156 $3,156 $3,156Year ended March 31, 2013 ¥ 1 ¥ 1 ¥ 1
6. Information about gains on negative goodwillAs stated in Notes 23 and 33, for the year ended March 31, 2013, the Group recorded gains on negative goodwill of ¥12,899 million, but this amount is not included in segment profit above.
29. FINANCIAL INSTRUMENTS AND RELATED DISCLOSURES
1 Qualitative Information of Financial Instruments(1) Group Policy for Financial Instruments
The Group provides comprehensive financial services, centering on banking, along with leasing and management consulting. Its base of operations is Shizuoka Prefecture.
The Bank, the core business operator of the Group, provides a range of financial instruments, including deposits in Japanese yen, deposits in foreign currencies, Japanese government bonds, investment trusts, and personal pension insurance. It also provides stable financing for customers in the region through loans to indi-viduals and lending operations for small and medium enterprises.
(2) Details of Financial Instruments and Risks Arising from ThemThe financial assets of the Bank consist primarily of loans and bills discounted to domestic customers and securities, including bonds and equity securities.
The loans and bills discounted are exposed to credit risk arising from potential default by borrowers. As about 70% of the loans and bills discounted are for customers in Shizuoka Prefecture, credit-related losses could occur on a large scale if the regional economic environment changes negatively or if a severe earth-quake occurs.
The Group holds securities, such as debt securities (bonds), equity securities, and investment trusts under its investment policy taking into account the safety and liquidity of the investment.These securities are exposed to risks of market price fluctuations associated with the credit standing of issuers and interest rate changes. If the prices of equity securities and other securities held decline, impairment losses or valuation losses could adversely affect the operating results and financial standing of the Group.
Financial liabilities consist primarily of deposits from domestic customers, corporate bonds, and funds raised in the call market. If the Group loses its credit status because of downgrades or other
factors or if the market environment deteriorates, conditions for financing could worsen or transactions could be constrained.
The Group enters into derivative transactions for customer needs of hedging exchange rates or interest rates, and for asset and liability management (ALM) or hedging individual transactions to appropriately manage the market risks of the Group. The Group also conducts trading transactions for the short term.
Derivatives mainly include interest-rate swaps, currency swaps, and bond futures, and are exposed to market risk that could cause losses in association with changes in interest rate markets and foreign exchange markets as well as credit risk (counterparty risk), that is, the risk of default on the initial contract due to the bankruptcy of the counterparty or other factors. Between financial assets and financial liabilities, there are interest rate risks associ-ated with mismatches of interest rates and terms.
(3) Risk Management Systems for Financial Instruments(i) Integrated risk management system
Under the Basic Risk Management Regulations that stipulate the Group’s basic risk management policy, the Group has established a basic framework, including an organizational structure for defining and managing risks and specific proce-dures for risk management.
To ensure a balance between profitability and soundness, the Group has introduced a management system based on a risk capital allocation at the core of integrated risk management.
The risk capital allocation is a system for avoiding excessive risk taking by setting risk limits. This system allocates core regulatory capital to each operational department or section and controls risk so that if market risks emerge, losses will be contained within the range of shareholder’s equity.
(ii) Credit risk management systemCredit risk is the risk of incurring losses when collecting loans and bills discounted becomes difficult because of the worsen-ing of borrowers’ financial conditions.
011_0254501372609.indd 34 2014/08/12 20:20:34

35
The Credit Risk Management Group of the Risk Management Department manages all credit risk relating to the Group’s operations both in Japan and overseas in order to ensure the soundness of the Group’s loan asset portfolio.
The Bank’s borrower credit rating system, which is an essential part of its credit risk management, together with other internal rating systems, is operated by the Rating Assessment Group of the Credit Department, designed and supervised by the Credit Risk Management Group which is independent from the Credit Department, and verified by the Risk Management Group of the Risk Management Department.
These three units exercise a mutual limitation and checking function with respect to one another, thereby facilitating greater precision and more advanced functions in the Bank’s internal ratings system.
In addition, the Asset Auditing Group inspects if credit risk management is performed conforming to the relevant rules through verification of the self-assessment process.
The Credit Risk Management Group uses statistical methods to quantify latent credit risk across the Bank’s entire loan portfolio. In this way, the Bank accurately assesses the scale of potential risk, monitors the concentration of loans to particular large-scale borrowers or specific industries, and thus controls the portfolio to avoid excessive credit risk.
The Bank’s credit risk management status, with the status of market risk management and liquidity risk management, which is described below, is reported through monthly meetings of the Committee for Integrated Risk and Budget Management, which is chaired by the president and other channels of management.
(iii) Market risk management systemMarket risk is the risk of incurring losses in association with changes in the prices of financial assets and liabilities that are caused by changes in interest rates, stock prices, and foreign exchange rates.
The Group controls the degree of market risks within a certain range by setting risk capital allocations to market transactions, the lower limits of gains or losses from the valuation of investment securities, and other limits, including position limits in accordance with the risk attributes of each transaction and product, and limits of losses.
The Bank has established ALM hedge criteria for transactions in banking accounts, especially deposits, loans and bills discounted, and investment securities, to control the degree of market risk within a certain range. The ALM Group of the Corporate Planning Department discusses ALM hedge policies based on the situation of interest rate risks and expected inter-est rates at meetings of the Committee for Integrated Risk and Budget Management.
The Bank has established a system of cross-checks and balances in the market division by strictly separating trading departments and operation departments, and has set up an independent risk management department. The Audit Department, which is independent of audited departments, checks the effectiveness of this system of checks and balances among the three divisions.
The Bank and the Shizuoka Bank (Europe) S.A. measure the market risks (the estimation of possible losses) of financial assets and liabilities, such as securities and derivatives held in trading portfolios, and loans, securities, deposits, bonds payable, and derivative transactions held in banking portfolios, using Value at Risk (VaR). VaR is utilized for the quantitative analysis to manage market fluctuations.
A historical simulation model (a variance covariance model in 2012) is used for the measurement of VaR. The Bank performs backtesting comparing VaR calculated by the model and actual profit and loss, in order to determine whether measurement model captures market risks with sufficient accuracy.
Nevertheless, VaR measures possible market risk amounts
statistically calculated based on historical data, and is unlikely to capture risks under significant market fluctuations not presumed.
The total amounts of market risks as of March 31, 2014 and 2013, are as follows:
Millions of YenThousands ofU.S. Dollars
2014 2013 2014VaR ¥114,300 ¥147,045 $1,110,571
The assumptions used to measure VaR are as follows:Observation period: five yearsConfidence interval: 99%Holding period: 125 days for banking transactions and 10 days for trading transactionsThe due dates of core deposits, defined as demand deposits
staying long term without withdrawal, are allocated within 10 years based on an internal model using a specific formula.
(iv) Liquidity risk management systemThere are two types of liquidity risk: (1) financing risk, that is, the risk of not being able to secure needed funds as a result of worsening market conditions and other factors, or incurring losses due to being forced to raise funds at much higher inter-est rates than usual, and (2) market liquidity risk, that is, the risk of not being able to trade financial instruments, such as bonds, because of market turmoil or other factors or incurring losses due to being forced to trade financial instruments at far less favorable prices than usual.
The Bank has established a system of cross-checks and balances by setting up fund management departments for financing in Japanese yen and in foreign currencies, and a liquidity risk management department that is independent of the fund management departments. The Fund & Foreign Exchange Group controls amounts raised in markets within a range of amounts that can be raised and seeks stable financ-ing, considering market circumstances. The Risk Management Group assesses the stability of the asset and liability structure, including the status of the holding of liquid assets and monitors the financing position and the status of the management of the financing departments.
To deal promptly with unforeseeable circumstances, the Group has classified financing management in emergencies into four phases—Phase 1 (prevention), Phase 2 (caution needed), Phase 3 (concern over liquidity), and Phase 4 (lack of liquidity)—and has determined the authorized personnel and countermeasures for each phase in advance.
To manage market liquidity risk, the liquidity risk management department monitors the holding of liquid assets on a timely basis, and the front office chooses assets to be managed after taking into account their liquidity and/or sets limits by name and by term.
(4) Supplementary Explanation of the Fair Values of Financial InstrumentsThe fair values of financial instruments include values based on market prices, and if there are no market prices, values are reason-ably calculated. Fair values could differ if different assumptions are used for calculation.
011_0254501372609.indd 35 2014/08/12 20:20:34

36
2. Fair Values of Financial InstrumentsThe carrying amount, fair values, and differences between them at March 31, 2014 and 2013, consisted of the following:
Millions of Yen
March 31, 2014CarryingAmount Fair Value
UnrealizedGains (Losses)
Cash and due from banks ¥ 674,581 ¥ 674,581 Call loans and bills bought 125,850 125,850 Trading assets:
Trading securities 11,231 11,231 Securities:
Held to maturity 11,216 11,473 ¥ 257 Available for sale 2,357,522 2,357,522
Loans and bills discounted 7,218,794 Allowance for loan losses (56,733)
Subtotal 7,162,060 7,203,100 41,040 Total ¥10,342,462 ¥10,383,761 ¥41,298 Deposits ¥ 8,684,659 ¥ 8,686,168 ¥ 1,508 Call money and bills sold 340,841 340,841 Payables under securities lending transactions 313,569 313,569 Borrowed money 185,026 185,032 6 Total ¥ 9,524,096 ¥ 9,525,611 ¥ 1,515 Derivative transactions:
Nonhedging derivatives ¥ 1,339 ¥ 1,339 Hedging derivatives (3,648) (3,648)
Total ¥ (2,308) ¥ (2,308)
Millions of Yen
March 31, 2013CarryingAmount Fair Value
UnrealizedGains (Losses)
Cash and due from banks ¥ 423,555 ¥ 423,555 Call loans and bills bought 83,674 83,674 Trading assets:
Trading securities 12,802 12,802 Securities:
Held to maturity 9,478 9,735 ¥ 257 Available for sale 2,537,632 2,537,632
Loans and bills discounted 6,969,330 Allowance for loan losses (61,837)
Subtotal 6,907,492 6,960,601 53,108 Total ¥ 9,974,636 ¥ 10,028,002 ¥ 53,365 Deposits ¥ 8,412,257 ¥ 8,413,804 ¥ 1,546 Call money and bills sold 327,007 327,007 Payables under securities lending transactions 403,205 403,205 Borrowed money 57,480 57,512 31 Total ¥ 9,199,950 ¥ 9,201,529 ¥ 1,578 Derivative transactions:
Nonhedging derivatives ¥ 226 ¥ 226 Hedging derivatives (3,768) (3,768)
Total ¥ (3,542) ¥ (3,542)
Thousands of U.S. Dollars
March 31, 2014CarryingAmount Fair Value
UnrealizedGains (Losses)
Cash and due from banks $ 6,554,421 $ 6,554,421Call loans and bills bought 1,222,800 1,222,800Trading assets:
Trading securities 109,132 109,132Securities:
Held to maturity 108,979 111,483 $ 2,504 Available for sale 22,906,363 22,906,363
Loans and bills discounted 70,139,857 Allowance for loan losses (551,240)
Subtotal 69,588,617 69,987,377 398,760 Total $ 100,490,312 $ 100,891,576 $ 401,264 Deposits $ 84,382,624 $ 84,397,282 $ 14,658 Call money and bills sold 3,311,711 3,311,711 Payables under securities lending transactions 3,046,733 3,046,733 Borrowed money 1,797,766 1,797,829 63 Total $ 92,538,834 $ 92,553,555 $ 14,721 Derivative transactions:
Nonhedging derivatives $ 13,015 $ 13,015 Hedging derivatives (35,448) (35,448)
Total $ (22,433) $ (22,433)
Notes: 1. Allowance for loan losses is deducted from the carrying amount of loans and bills discounted.
2. Derivative transactions include both derivatives accounted for as trading assets/liabilities and derivatives accounted for as other assets/liabilities.
Net assets and liabilities arising from derivative transactions are shown on a net basis and in the case that net amounts are liabilities, they are shown as a negative amount.
3. Interest rate swaps, for which special hedging treatment is applied, are excluded from derivative transactions as they are evaluated with hedged items on the whole.
4. Hedged items with special hedging treatment of interest rate swaps are treated as united transactions. For items whose fair value is calculated by discounting future cash flows, deferred and accrued accounts at the calcula-tion date are considered.
Methods used for calculating the fair values of financial instrumentsAssets(1) Cash and due from banks
Since the fair values of amounts due from banks without maturities approximate their carrying values, the fair values are deemed equal to the carrying values. The terms of all amounts due from banks with maturities are short (within one year) and their fair values approximate their carrying values. The fair values are therefore deemed equal to the carrying values.
(2) Call loans and bills boughtThe terms of all assets are short (within one year) and their fair values approximate their carrying values. The fair values are therefore deemed equal to the carrying values.
(3) Trading assetsThe fair values of securities, such as bonds held for trading, are determined by reference to quoted market prices on stock exchanges or prices offered by correspondent financial institutions.
(4) SecuritiesThe fair values of shares are determined by reference to quoted market prices on stock exchanges. The fair values of bonds are determined by reference to quoted market prices or prices offered by correspondent financial institutions. Investment trusts are determined by reference to their publicly available unit prices. The fair values of private placement bonds guaranteed by the Bank are determined by the calculation method for loans and bills dis-counted described in (5) below after adjusting to reflect guarantee commissions received, among other factors.
(5) Loans and bills discountedAs floating rate loans and bills discounted reflect market interest rates over short periods, unless the credit standing of the borrower is significantly different after the loan was made or the bill was drawn, the fair value approximates the carrying value. The fair value is therefore deemed equal to the carrying value.
The fair values of fixed-rate loans and bills discounted are their present values that are estimated for each classification based on their type, internal rating, status of collateral and guarantees, and terms, and by discounting the future cash flows of the principal and interest using the rates at which similar new loans would be made or market interest rates plus credit cost rates in accordance with internal ratings and expense rates. The fair values of fixed-rate loans and bills discounted, whose terms are short (within one year), approximate their carrying values and are therefore deemed equal to the carrying values.
Losses from loans to borrowers in legal bankruptcy, in virtual bankruptcy, and in possible bankruptcy are computed based on estimated recoverable amounts. The fair values of those loans approximate the consolidated balance sheet amounts at the closing date minus the currently estimated losses and are therefore deemed equal to the amounts.
The fair values of loans and bills discounted for which repayment terms are not set because of their attributes (e.g., loans are limited to the amounts of pledged assets) are assumed to approximate their carrying values, considering the expected repayment periods and interest rate conditions, and are deemed equal to the carrying values.
Liabilities(1) Deposits
The fair values of demand deposits are deemed equal to the amounts that would be paid (carrying values) if the payments were demanded at the balance sheet date. The fair values of time
011_0254501372609.indd 36 2014/08/12 20:20:35

37
deposits and negotiable certificates of deposit, which are classified in accordance with their periods, are their present values that are estimated by discounting the future cash flows, using the rates that would be offered for new deposits to be received.
The fair values of deposits and negotiable certificates of deposit with short deposit terms (within one year) or with variable interest rates approximate their carrying values and are deemed equal to their carrying values.
(2) Call money and bills sold and (3) Payables under securities lending transactions The terms of all liabilities are short (within one year) and their fair values approximate their carrying values. The fair values are therefore deemed equal to the carrying values.
(4) Borrowed moneyFloating rate borrowed money reflects market interest rates in short periods, and the credit standing of the Bank and its consolidated subsidiaries has not significantly changed from when the money was borrowed. The fair value of floating rate borrowed money is therefore considered to approximate the carrying value and is deemed equal to the carrying value. The present value of fixed-rate borrowed money, which is classified in accordance with its period, is estimated by discounting future cash flows, using rates that would be offered to similar borrowings. The fair value of borrowed money whose term is short (within one year)
approximates the carrying value and is therefore deemed equal to the carrying value.
DerivativesFair value information for derivatives is included in Note 30.
Carrying amount of financial instruments whose fair value cannot be reliably determined at March 31, 2014 and 2013, consisted of the following:
Millions of YenThousands ofU.S. Dollars
2014 2013 2014Unlisted stocks ¥ 6,253 ¥ 5,994 $ 60,763 Investments in partnerships
and others 3,185 7,188 30,951 Total ¥ 9,439 ¥ 13,183 $ 91,714Notes: 1. Unlisted stocks without market prices, and whose fair values are difficult to
determine, are not included in fair value information. The table above includes investments in associated companies accounted for by the equity method of ¥127 million ($1,235 thousand) and ¥74 million in 2014 and 2013, respectively.
2. The impairment losses on unlisted stocks for the year ended March 31, 2014, and unlisted stocks and investments in partnerships for the year end-ed March 31, 2013, were ¥7 million ($ 73 thousand) and ¥237 million, respectively.
3. Investments in partnership, whose assets include unlisted stocks and other assets, are not included in fair value disclosures as it is difficult to determine their fair values.
Maturity analysis for financial assets and securities with contractual maturitiesMillions of Yen
March 31, 2014Due in One Year
or LessDue after One Yearthrough Three Years
Due after Three Yearsthrough Five Years
Due after Five Yearsthrough Seven Years
Due after Seven Years through Ten Years
Due after Ten Years
Due from banks ¥ 589,281 Call loans and bills bought 125,850 Securities: 66,033 ¥ 291,681 ¥ 694,535 ¥265,807 ¥174,784 ¥ 429,727
Held-to-maturity 1,000 2,508 1,974 1,642 1,708 2,094 Available-for-sale 65,033 289,173 692,560 264,164 173,076 427,633
Loans and bills discounted 2,167,259 1,317,829 1,032,874 533,889 487,483 1,382,495 Total ¥ 2,948,426 ¥ 1,609,511 ¥ 1,727,409 ¥799,697 ¥662,267 ¥1,812,222
Thousands of U.S. Dollars
March 31, 2014Due in One Year
or LessDue after One Yearthrough Three Years
Due after Three Yearsthrough Five Years
Due after Five Yearsthrough Seven Years
Due after Seven Years through Ten Years
Due after Ten Years
Due from banks $ 5,725,631 Call loans and bills bought 1,222,800 Securities: 641,604 $ 2,834,065 $ 6,748,302 $2,582,658 $1,698,253 $ 4,175,355
Held-to-maturity 9,716 24,370 19,187 15,963 16,597 20,350 Available-for-sale 631,888 2,809,695 6,729,115 2,566,695 1,681,656 4,155,005
Loans and bills discounted 21,057,712 12,804,407 10,035,702 5,187,427 4,736,525 13,432,718 Total $28,647,747 $15,638,472 $16,784,004 $7,770,085 $6,434,778 $17,608,073
Notes: 1. The amount of loans and bills discounted without due dates which have been excluded is ¥146,729 million ($1,425,666 thousand). 2. The amount of loans and bills discounted for “possible bankruptcy,” “virtual bankruptcy”, and “legal bankruptcy,” excluding those without due dates, which have been
included is ¥150,232 million ($1,459,700 thousand).
Maturity analysis for borrowed money and other interest-bearing debtMillions of Yen
March 31, 2014Due in One Year
or LessDue after One Yearthrough Three Years
Due after Three Yearsthrough Five Years
Due after Five Yearsthrough Seven Years
Due after Seven Years through Ten Years
Due after Ten Years
Deposits ¥8,102,918 ¥503,711 ¥67,903 ¥4,186 ¥5,940 ¥Call money and bills sold 340,841 Payables under securities lending transactions 313,569 Borrowed money 173,442 5,752 5,831
Total ¥8,930,771 ¥509,464 ¥73,734 ¥4,186 ¥5,940 ¥
Thousands of U.S. Dollars
March 31, 2014Due in One Year
or LessDue after One Yearthrough Three Years
Due after Three Yearsthrough Five Years
Due after Five Yearsthrough Seven Years
Due after Seven Years through Ten Years
Due after Ten Years
Deposits $78,730,258 $4,894,206 $659,766 $40,673 $57,721 $Call money and bills sold 3,311,711 Payables under securities lending transactions 3,046,733 Borrowed money 1,685,213 55,897 56,656
Total $86,773,915 $4,950,103 $716,422 $40,673 $57,721 $Note: Demand deposits are included in “Due in One Year or Less.”
011_0254501372609.indd 37 2014/08/12 20:20:35

38
30. DERIVATIVESQualitative information on derivatives, such as the nature and the pur-pose of derivative financial instruments, is included in Note 29.
Derivative transactions to which hedge accounting is not applied at March 31, 2014 and 2013, consisted of the following:
March 31, 2014
Millions of YenContract
or NotionalAmount
ContractAmount Due
after One Year Fair Value
UnrealizedGains
(Losses)Listed:
Bond futures ¥ 578 Over the counter:
Interest rate swaps 1,466,421 1,231,838 622 622 Currency swaps 300,389 226,799 523 523 Forward contracts 87,928 8,233 150 150 Currency options 167,405 92,153 (2) (2)Other 8,069 5,523 44 44
March 31, 2013
Millions of YenContract
or NotionalAmount
ContractAmount Due
after One Year Fair Value
UnrealizedGains
(Losses)Over the counter:
Interest rate swaps ¥1,499,238 ¥1,245,204 ¥ 740 ¥ 740 Currency swaps 353,385 265,764 513 513 Forward contracts 111,396 13,449 (1,065) (1,065)Currency options 211,829 126,395 (51) (51)Other 11,874 9,513 88 88
March 31, 2014
Thousands of U.S. DollarsContract
or NotionalAmount
ContractAmount Due
after One Year Fair Value
UnrealizedGains
(Losses)Listed:
Bond futures $ 5,621 Over the counter:
Interest rate swaps 14,248,172 $11,968,889 $6,051 $6,051 Currency swaps 2,918,670 2,203,649 5,087 5,087 Forward contracts 854,339 80,000 1,466 1,466 Currency options 1,626,562 895,393 (22) (22)Other 78,401 53,670 433 433
Note: Derivatives included in the table above were measured at fair value, and the unrealized gains and losses were recognized in income.
Derivative transactions to which hedge accounting is applied at March31, 2014 and 2013, consisted of the following:
March 31, 2014
Millions of Yen
Hedged ItemContractAmount
ContractAmount Due
after One Year Fair ValuePrincipled treatment
Interest rate swaps Deposits ¥ 40,298 ¥40,298 ¥ 93
Currency swapsLoans, deposits, and securities in foreign currencies
17,554 17,554 176
Forward contractsLoans, deposits,and securities inforeign currencies
254,716 (3,918)
Special hedging treatmentInterest rate swaps Loans and bonds payable 56,303 27,248
March 31, 2013
Millions of Yen
Hedged ItemContractAmount
ContractAmount Due
after One Year Fair ValuePrincipled treatment
Interest rate swaps Deposits ¥ 20,311 ¥20,311 ¥ 81
Forward contractsLoans, deposits,and securities inforeign currencies
150,195 (3,850)
Special hedging treatmentInterest rate swaps Loans and bonds payable 49,739 46,382
March 31, 2014
Thousands of U.S. Dollars
Hedged ItemContractAmount
ContractAmount Due
after One Year Fair ValuePrincipled treatment
Interest rate swaps Deposits $ 391,547 $391,547 $ 907
Currency swapsLoans, deposits, and securities in foreign currencies
170,560 170,560 1,718
Forward contractsLoans, deposits,and securities inforeign currencies
2,474,899 (38,073)
Special hedging treatmentInterest rate swaps Loans and bonds payable 547,065 264,751
Notes: 1. Principally, deferral hedge accounting is applied as stipulated in JICPA Industry Audit Committee Report No. 24, “Accounting and Auditing Treat-ment of Accounting Standards for Financial Instruments in the Banking Industry.”
2. The fair value of interest rate swaps with special hedging treatment is omit-ted as interest rate swaps and loans are treated unitary and their values are included in the fair value of loans and bills discounted in Note 29.
The fair values of listed transactions represent the closing price on the Tokyo Financial Exchange and other exchanges at the consolidated balance sheet date. The fair values of over-the-counter transactions are calculated mainly by using the discounted present values or option-pricing models.
The contract or notional amounts of derivatives shown in the above table do not represent the amounts exchanged by the parties and do not measure the Bank’s exposure to credit or market risk.
31. RELATED-PARTY TRANSACTIONSRelated-party transactions for the years ended March 31, 2014 and 2013, were as follows:1. Related-Party Transactions with the Bank
Related Party CategoryDescription ofTransactions
Millionsof Yen
Thousandsof U.S.Dollars
2014 2013 2014
Yasuhiko Saito Lawyer
Audit & Supervisory Board Member of Shizuoka Bank
Legal service fees ¥ 20 ¥ 25 $ 195
Loans 67 73 656
Kai GotoClose relative ofa director ofShizuoka Bank
Loans 161 1,568
Kenji MizuguchiClose relative ofa director ofShizuoka Bank
Loans 39 41 383
Notes: 1. Related-party transactions stated above are processed under equal condi-tions to transactions with general customers.
2. Related-Party Transactions with Subsidiaries
Related Party CategoryDescription ofTransactions
Millionsof Yen
Thousandsof U.S.Dollars
2014 2013 2014
Yasuhiko SaitoLawyer
Audit & Supervisory Board Member of Shizuoka Bank and its subsidiaries
Legal service fees ¥ 2 ¥ 2 $ 21Lease payments 4 4 44
Lease investment assets on Mar 31
11 15 113
Note: Related-party transactions stated above are processed under equal conditions to transactions with general customers.
011_0254501372609.indd 38 2014/08/12 20:20:35

39
32. COMPREHENSIVE INCOMEThe components of other comprehensive income for the years ended March 31, 2014 and 2013, were as follows:
Millions of YenThousands of U.S. Dollars
2014 2013 2014Unrealized gain on available-for-sale securities
Gains arising during the year ¥15,475 ¥65,551 $ 150,365Reclassification adjustments to profit and loss (17,600) (12,256) (171,013)
Amount before income tax effect (2,125) 53,295 (20,648)
Income tax effect 1,406 (17,772) 13,666 Total ¥ (718) ¥35,522 $ (6,982)
Deferred gains on derivatives under hedge accounting
Gains arising during the year ¥ (862) ¥ (165) $ (8,382)Reclassification adjustments to profit and loss 866 474 8,417
Amount before income tax effect 3 309 35
Income tax effect (9) (112) (92)Total ¥ (5) ¥ 196 $ (57)
Foreign currency translation adjustments
Gains arising during the year ¥ 666 ¥ 345 $ 6,478 Reclassification adjustments to profit and loss
Amount before income tax effect 666 345 6,478
Income tax effect Total ¥ 666 ¥ 345 $ 6,478
Total other comprehensive income ¥ (57) ¥36,065 $ (561)
33. BUSINESS COMBINATION(1) Increase of Ownership in SubsidiariesOn April 27, 2012, the Bank acquired shares of Shizugin Lease Co., Ltd. and Shizugin DC Card Co., Ltd. from their minority shareholders, and Shizugin Credit Guaranty Co., Ltd. and Shizuoka Computer Ser-vice Co., Ltd. acquired their shares from their respective minority shareholders.As a result, the ownership of the Bank in these subsidiaries has increased.(2) Business CombinationThe Bank and Shizugin Management Consulting Co., Ltd. imple-mented the following business combination as a transaction under common control.① Summary of the Business Combination
(A) Name and Business of the SubsidiaryName: Shizugin Management Consulting Co., Ltd.Business: Management consulting
(B) Summary and Reasons of the Business CombinationThe Bank and Shizugin Management Consulting Co., Ltd. car-ried out a share exchange, which made the Bank a wholly owning parent company and Shizugin Management Consulting Co., Ltd. a wholly owned subsidiary. The purpose of this exchange was to meet our customer’s demands for services with higher quality and more variety, by increasing synergies among the Group and realizing more prompt and efficient man-agement.
(C) Date of the Business CombinationJune 29, 2012
(D) Legal Form of the CombinationShare exchange
(E) Name of the Subsidiary after the CombinationNo change
② Summary of the Accounting Treatment Implemented This business combination was accounted for as a transaction under common control, based on the Accounting Standards Board of Japan (ASBJ) Statement No. 21, “Accounting Standard for Busi-ness Combinations” and ASBJ Guidance No. 10, “Guidance for
Accounting Standard for Business Combinations and Business Divestitures”.
③ Additional Acquisition of Subsidiary’s Stocks(A) Acquisition Cost
Millions of YenAcquisition cost ¥2,169(Breakdown)
Treasury stock 2,166Actual cost of the acquisition 3
(B) Share Exchange Ratio, Calculation Method, and the Number of Allotted Shares Based on the Type of Stocks(a) Share Exchange Ratio
The Shizuoka Bank Ltd.(Common stock)
Shizugin Management Consulting Co., Ltd.(Common stock)
176 1
(b) Calculation MethodIn order to ensure the fairness and appropriateness of the share exchange ratio, the Bank and Shizugin Management Consulting Co., Ltd., assigned KPMG FAS Co., Ltd., and Gyosei & Co., respectively, as third-party valuation institu-tions to calculate the share exchange ratio.The Bank and Shizugin Management Consulting Co., Ltd. negotiated and consulted carefully referring to those calcula-tions, and concluded that the share exchange ratio above was fair and appropriate to implement the share exchange.
(c) Number of Allotted Shares2,648,800 shares
(C) Amount, Cause, and Amortization of Goodwill Incurred(a) Amount of Goodwill Incurred
¥963 million(b) Cause
Difference between the Bank’s increase in shares of stock corresponding to Shizugin Management Consulting Co., Ltd. and the acquisition cost.
(c) AmortizationThe Group has amortized all the goodwill incurred by this combination for the year ended March 31, 2013.
(3) Gains on Negative GoodwillBecause of the increase of ownership indirectly occured from above transactions, a negative goodwill of ¥13,863 million has incurred.Deducing the above-mentioned goodwill of ¥963 million from this negative goodwill, the Group recorded ¥12,899 million of gains on negative goodwill.
34. NET INCOME PER SHAREBasic net income per share (EPS) for the years ended March 31, 2014 and 2013, is computed as follows:
Year endedMarch 31, 2014
Millions of YenThousands of
Shares Yen U.S. Dollars
Net IncomeWeighted-Average
Shares EPS
Basic EPSNet income available to
common shareholders ¥46,723 630,361 ¥74.12 $0.720 Effect of dilutive securities
Stock options 418 (0.04) (0.000)Convertible bonds with stock acquisition rights 34,704 (3.86) (0.038)
Diluted EPSNet income for computation ¥46,723 665,484 ¥70.21 $0.682
011_0254501372609.indd 39 2014/08/12 20:20:35

40
Year ended March 31, 2013
Millions of YenThousands of
Shares Yen
Net IncomeWeighted-Average
Shares EPS
Basic EPSNet income available to
common shareholders ¥56,970 651,268 ¥87.47 Effect of dilutive securities
Stock options 413 (0.05)Diluted EPS
Net income for computation ¥56,970 651,682 ¥87.42
35. SUBSEQUENT EVENTS1. Establishment of capital and business allianceOn April 2, 2014, the Board of Directors resolved the following capital and business alliance with Monex Group Inc., and established a con-tract.(1) Details of business allianceThe Bank and Monex Group Inc. established a cooperation to provide forward-looking online financial services, which improve the lifestyles of customers, by adopting forefront technologies and ideas. Both par-ties will discuss the specific contents of alliance and practice without delay.(2) Details of capital allianceOn April 7, 2014, the Bank purchased following common stock of Monex Group Inc. from ORIX Corporation by over-the-counter trans-actions, and along with additional acquisition the holding ratio of the Bank reached 20%.Number of shares: 56,223,300 sharesPurchase price: ¥24,400 million ($237,086 thousand)Stock holding ratio: 19.54%Due to above stock acquisitions, Monex Group Inc. will become an associated company of the Bank accounted for by equity method for the year ending March 31, 2015.
2. Purchase of Treasury StockOn June 16, 2014, the Board of Directors resolved the following pur-chase of treasury stock.Type of stock: Common stockNumber of shares: Up to 10,000,000 sharesAggregate amount of shares: Up to ¥12,000 million ($116,595 thou-sand)Purchase period: July 1, 2014 to July 29, 2014
3. Appropriation of Retained EarningsThe following appropriation of retained earnings was authorized at the ordinary general shareholders’ meeting held on June 20, 2014:
Millions of YenThousands ofU.S. Dollars
Cash dividends,¥8.0 ($0.08) per share ¥5,028 $48,856
Total ¥5,028 $48,856
011_0254501372609.indd 40 2014/08/12 20:20:35

41
Key Consolidated Financial Indicators
Summary of Profits (Losses)Millions of Yen
Years ended March 31 2014 2013Increase
(Decrease)Percentage
ChangeNet interest income ¥126,470 ¥ 120,466 ¥ 6,003 5.0%Net fees and commissions 26,927 24,690 2,237 9.1 Net trading income 2,063 2,229 (166) (7.5)Net other operating income 2,958 10,021 (7,063) (70.5)General and administrative expenses 88,746 86,996 1,749 2.0 Net other ordinary income 5,025 888 4,137 (465.8)Ordinary profits 74,698 71,300 3,397 4.8 Income before income taxes and minority interests 73,830 83,812 (9,981) (11.9)Income taxes:
Current 22,807 18,631 4,176 22.4 Deferred 3,708 7,652 (3,944) 51.5
Minority interest in net income of consolidated subsidiaries 590 556 33 6.0 Net income 46,723 56,970 (10,246) (18.0)Comprehensive income 47,256 93,592 (46,336) (49.5)
Breakdown of Net Interest MarginBillions of Yen
Year ended March 31 2014
Interest income ¥ 134.5 Average interest-earning assets 9,664.2 Average interest rate of interest-earning assets (%) 1.39 Interest expense (Note) 8.1 Average interest-bearing liabilities 9,208.8 Average interest rate of interest-bearing liabilities (%) 0.08 Net interest income 126.4
Note: Interest expense here excludes interest paid in relation to investment in money held in trust.
Net Other Operating IncomeMillions of Yen
Years ended March 31 2014 2013Increase
(Decrease)Gains on foreign exchange transactions ¥ 864 ¥ 528 ¥ 335 Gains/losses on government bonds 1,976 9,746 (7,769)
Gains on sales 18,996 12,478 6,517 Losses on sales (17,019) (2,732) (14,287)Losses on redemptionsAmortized bond issue cost
Gains/losses on derivative transactions 113 (264) 378 Proceeds from derivative transactions 113 113 Expenses for derivative products (264) 264
Others 3 11 (7)Gains/losses on other business 2,958 10,021 (7,063)
Other operating income 19,977 13,018 6,958 Other operating expenses (17,019) (2,996) (14,022)
011_0254501372609.indd 41 2014/08/12 20:20:35

42
Loans Outstanding by Type of BorrowerBillions of Yen, % Share
March 31 2014 2013Domestic branches:
Manufacturing ¥1,249.0 17.87% ¥1,200.5 17.68%Agriculture and forestry 4.5 0.06 4.9 0.07 Fishery 3.4 0.05 3.6 0.05 Mining and quarrying 14.6 0.21 18.1 0.27 Construction 256.3 3.67 283.2 4.17 Utilities 47.0 0.67 41.8 0.62 Telecommunications 51.7 0.74 30.9 0.45 Transportation and mail service 253.9 3.63 256.0 3.77 Wholesale and retailing 777.2 11.12 789.9 11.63 Finance and insurance 495.9 7.09 466.3 6.87 Real estate, lease, and rental 1,382.6 19.78 1,396.2 20.56 Medical, welfare, lodging, and other services 458.0 6.55 467.6 6.89 Local governments 149.3 2.14 144.5 2.13 Other 1,846.5 26.42 1,687.3 24.84
Subtotal 6,990.6 100.00 6,791.5 100.00 Overseas branches and offshore accounts:
Banks and other financial institutions 5.0 2.21 3.7 2.12 Other 223.0 97.79 174.0 97.88
Subtotal 228.1 100.00 177.7 100.00 Total ¥7,218.7 ¥6,969.3
Risk-Monitored Asset InformationMillions of Yen
March 31 2014 2013Increase
(decrease)Loans under bankruptcy proceedings A ¥ 5,030 ¥ 6,418 ¥ (1,387)% of loans and bills discounted 0.06 0.09 (0.02)Past-due loans B 145,201 179,490 (34,288)% of loans and bills discounted 2.01 2.57 (0.56)Loans past due for three months or more C 939 1,865 (925)% of loans and bills discounted 0.01 0.02 (0.01)Restructured loans D 15,456 17,102 (1,645)% of loans and bills discounted 0.21 0.24 (0.03)Risk-monitored loan total E (E=A+B+C+D) 166,628 204,876 (38,247)% of loans and bills discounted 2.30 2.93 (0.63)Value covered with collateral, guarantees, etc. F 147,387 181,069 (33,682)Cover ratio (%) F/E 88.45 88.37 0.07
Notes: 1. Risk-monitored loans are based on Article 19-2 of the Ordinance for Endorsement of the Banking Act. Because these loans are disclosed regardless of the presence or absence of collateral, guarantees, or other coverage, the figures shown do not represent unrecoverable amounts.
2. Loans past due for three months or more include loans for which payments of principal or interest are delinquent by three months or more, as calculated from the day following the contracted payment date, but do not include loans to bankrupt borrowers or past-due loans.
3. Restructured loans include loans for which certain conditions have been relaxed for the benefit of the borrower (through such means as the reduction or elimination of interest payments, the deferral of principal repayments, or the relinquishment of a portion of liabilities) with the goal of supporting the recovery of borrowers that have fallen into financial difficulty and thereby promoting the recovery of the loan.
4. Value covered with collateral, guarantees, etc., includes provisions in the specific reserve for possible loan losses. The covered value was stated on a pos-sible disposal basis.
Allowance for Loan LossesMillions of Yen
March 31 2014 2013General allowance for loan losses ¥ 36,387 ¥ 41,008 Specific allowance for loan losses 21,033 24,027
Total ¥ 57,421 ¥ 65,035[Loans on written-off claims for the year] ¥ [262] ¥ [208]
Financial IndexConsolidated Non-Consolidated
Years ended March 31 2014 2013Increase
(Decrease) 2014 2013Increase
(Decrease)Per share (Yen):
Net income ¥ 74.12 ¥ 87.47 ¥(13.35) ¥ 67.83 ¥ 62.79 ¥ 5.04 Net assets 1,290.11 1,242.14 47.97 1,257.62 1,204.31 53.31 Cash dividends 15.50 15.00 0.50 15.50 15.00 0.50
Dividend payout ratio (%) 22.84 23.88 (1.04)Return on equity (%) (Note) 5.78 7.43 (1.65) 6.73 6.52 0.21 Price earnings ratio (%) 13.58 12.11 1.47 14.84 16.88 (2.04)
Note: The amount of net income returned as a percentage of the average balance of shareholder’s equity.
011_0254501372609.indd 42 2014/08/12 20:20:35

43
Capital Adequacy RatioBillions of Yen
Consolidated NonconsolidatedMarch 31 2014 2013 2014 2013
1. Total capital ratio (%) 16.85 17.46 16.37 16.97 2. Tier 1 ratio (%) 15.45 15.55 14.98 15.08 3. Common Equity Tier 1 ratio (%) 15.43 15.55 14.98 15.08 4. Total capital 782.9 768.4 747.8 737.5 5. Tier 1 capital 717.5 684.2 684.5 655.4 6. Common Equity Tier 1 capital 716.8 684.2 684.5 655.4 7. Total risk-weighted assets 4,643.5 4,400.1 4,568.3 4,343.5 8. Total capital requirements 371.4 352.0 365.4 347.4
Notes: 1. Capital ratios were calculated both on a consolidated and nonconsolidated basis conforming to the Ministry of Finance guidelines, based on Article 14-2 of the Banking Act.
2. The Group has adopted the Foundation Internal Rating-Based Approach to calculate credit risk assets, the Standardized Approach for operational risk, and applied the Market Risk Capital Regulations.
Credit-Related Financial InstrumentsBillions of Yen
Contract AmountMarch 31 2014 2013
Commitments to extend credit ¥3,041.4 ¥3,033.4 Guarantees 111.4 104.1
Total ¥3,152.8 ¥3,137.6
011_0254501372609.indd 43 2014/08/12 20:20:35

44
The Shizuoka Bank
HEAD OFFICE10, Gofukucho 1-chome, Aoi-ku,Shizuoka-shi, Shizuoka 420-8761, Japan
HEADQUARTERS2-1, Kusanagi-Kita, Shimizu-ku,Shizuoka-shi, Shizuoka 424-8677, JapanPhone: (81) 54-345-5411URL: http://www.shizuokabank.co.jp/
INTERNATIONAL BUSINESS PROMOTION GROUPPhone: (81) 54-345-5411Fax: (81) 54-344-0090
TREASURY & INTERNATIONAL OPERATIONS CENTERPhone: (81) 54-345-5700Fax: (81) 54-349-5501SWIFT address: SHIZJPJT
NUMBER OF EMPLOYEES(As of March 31, 2014)3,050
DATE OF ESTABLISHMENTMarch 1, 1943
DOMESTIC NETWORK(As of July 1, 2014)Head Office, 173 branches,26 sub-branches
OVERSEAS NETWORK(As of July 1, 2014)3 branches,2 representative offices and1 subsidiary
Corporate Data
Los Angeles Branch801 South Figueroa Street, Suite 610,Los Angeles, CA 90017, U.S.A.Phone: (1) 213-622-3233Fax: (1) 213-623-8674
New York Branch600 Lexington Ave,4th Floor, New York,NY 10022, U.S.A.Phone: (1) 212-319-6260Fax: (1) 212-319-6270
Hong Kong BranchSuite 1010, 10th Floor, Chater House,8 Connaught Road, Central, Hong Kong S.A.R.,People’s Republic of ChinaPhone: (852) 2521-6547Fax: (852) 2845-9257
Singapore Representative Office80 Raffles Place, #09-21 UOB Plaza 2, Singapore 048624Phone: (65) 6225-3600Fax: (65) 6225-9901
Shanghai Representative OfficeRoom 1813, ShanghaiInternational Trade Centre,2201 Yan-An Road (West),Chang Ning Qu, Shanghai,People’s Republic of ChinaPhone: (86) 21-6209-8115Fax: (86) 21-6209-8116
Shizuoka Bank (Europe) S.A.Rue Jules Cockx 8-10, Box 9, 1160 Auderghem, Brussels, BelgiumPhone: (32) 2-646-0470Fax: (32) 2-646-2462
Overseas Service Network
Central Area Business Unit Domestic Branches
Eastern Area Business Unit Domestic Branches
Western Area Business Unit Domestic Branches
Audit & Supervisory Board Members
Metropolitan Business Unit Domestic Branches
Treasury Dept.Metropolitan Division
Advisory Board
Board of Directors
Securities Investment Group
Banking Division
Fund & Foreign Exchange GroupSecurities & Derivatives Trading Group
President & CEO
Business Promotion Dept
Corporate Banking Dept.
Personal Banking Dept.
International Business Promotion GroupInternational Dept.Los Angeles BranchNew York Branch
Major Committees
Hong Kong BranchOperations Planning Dept.
Treasury & International Operations Planning Group
Operations Dept.
Treasury & International Operations Center
Credit Dept.
Business Support Dept.
Corporate Planning Dept.
Corporate Administration Dept.
Risk Management Dept. Risk Management GroupCorporate Center Credit Risk Management Group
Operational Risk Management Group
Compliance GroupCompliance Dept.Data Security Management Office
Audit Dept.Internal Audit Division
Committee of Administrative Supervision
General Meeting of Shareholders
Organization Chart
011_0254501372609.indd 44 2014/08/12 20:20:36

45
President & CEO
Katsunori Nakanishi
Deputy President & CFO
Masahiro Goto
Representative Director & Senior Managing Executive OfficerCOO
Akihiro Nakamura
Director & Senior Managing Executive Officer
Itsuro Hitosugi
Director & Senior Executive Officers
Hiroki SaitoYoshihiro NagasawaHisashi ShibataMinoru Yagi
Directors
Yukihiro FushimiKumi Fujisawa
Audit & Supervisory Board Members
Hisashi HottaYutaka OkoshiYasuhiko SaitoMitsuhiro Ishibashi
CEO=Chief Executive Officer
CFO=Chief Financial Officer
COO=Chief Operating Officer
(As of July 1, 2014)
Board of Directors and Audit & Supervisory Board
CAPITAL STOCK (As of March 31, 2014)Common stock .................................. ¥90,845 million
NUMBER OF SHARES (As of March 31, 2014)Authorized ......................................... 2,414,596,000 sharesIssued and outstanding ..................... 665,129,069 shares
NUMBER OF SHAREHOLDERS (As of March 31, 2014)22,528
STOCK LISTINGFirst Section of the Tokyo Stock Exchange
TRANSFER AGENTJapan Securities Agents, Ltd.
STOCK PRICE, TURNOVERAnnual high/low stock price (five years)(Yen)
Years ended March 31 2010 2011 2012 2013 2014
High 994 834 867 1,078 1,310Low 762 617 682 752 926
Monthly high/low stock price, turnover (six months)(Yen)
MonthOct.2013
Nov.2013
Dec.2013
Jan.2014
Feb.2014
Mar.2014
High 1,143 1,180 1,180 1,124 1,026 1,035Low 1,038 1,071 1,066 1,013 926 938
PRINCIPAL SHAREHOLDERSThe 10 largest shareholders of the Bank and their respectiveshareholdings at March 31, 2014 were as follows:
Number ofShares in
Thousands
Percentage ofTotal SharesOutstanding
Nippon Life Insurance Company 29,745 4.73%
Meiji Yasuda Life Insurance Company 29,117 4.63
The Bank of Tokyo-Mitsubishi UFJ, Ltd. 23,884 3.80
The Master Trust Bank of Japan, Ltd. (trust account) 23,043 3.66
Japan Trustee Services Bank, Ltd. (trust account) 20,505 3.26
Sumitomo Life Insurance Company 13,070 2.07
Tokio Marine & Nichido Fire Insurance Co., Ltd. 11,608 1.84
The Dai-ichi Mutual Life Insurance Company 11,546 1.83
Mitsui Sumitomo Insurance Company, Ltd. 10,197 1.62
Daiichi Sankyo Company, Limited 9,343 1.48
Total 182,058 28.92%
Investor Information
The Shizuoka Bank GroupConsolidated SubsidiariesSHIZUGIN MANAGEMENT CONSULTING CO., LTD.Corporate and financial managementadvisory servicesBill collection services
SHIZUGIN LEASE CO., LTD.Leasing
SHIZUOKA COMPUTER SERVICE CO., LTD.Computer system development and operation
SHIZUGIN CREDIT GUARANTY CO., LTD.Guarantee of housing loans, etc.
SHIZUGIN DC CARD CO., LTD.Credit card and guarantee of consumer loans
SHIZUOKA CAPITAL CO., LTD.Public-offering assistanceSupport for corporate rehabilitation
SHIZUGIN TM SECURITIES CO., LTD.Securities
SHIZUGIN GENERAL SERVICE CO., LTD.Fee-based job placement servicesGeneral administration
SHIZUGIN MORTGAGE SERVICE CO., LTD.Appraisal of real estate for loan collateralOperation center for loans
SHIZUGIN BUSINESS CREATE CO., LTD.Operation center for remittance and billcollectionPart-time employee management
SHIZUOKA BANK (EUROPE) S.A.Finance and securities-related services
Affiliates under Equity MethodSHIZUGIN SAISON CARD CO., LTD.Credit card and guarantee of consumer loans
* Other than the above mentioned Group companies, Monex Group, Inc. is an equity-method affiliate of Shizuoka Bank.
011_0254501372609.indd 45 2014/08/12 20:20:36

Printed in Japan