smith & nephew fourth quarter trading and full year 2015 ... · smith & nephew fourth...
TRANSCRIPT
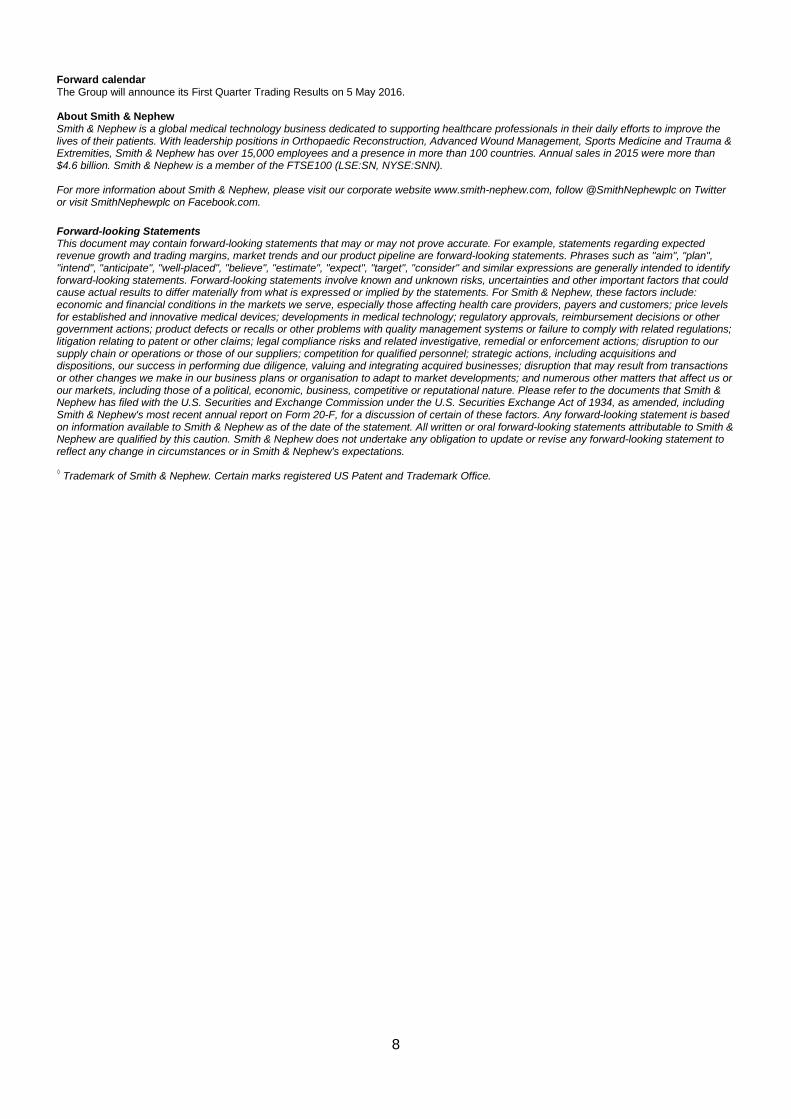
Smith & Nephew Fourth Quarter Trading and Full Year 2015 Results Delivering stronger underlying revenue growth, trading profit margin and adjusted earnings 4 February 2016 Smith & Nephew plc (LSE:SN, NYSE:SNN) results for fourth quarter and full year to 31 December 2015:
Trading Reported 31 Dec 31 Dec Underlying 31 Dec 31 Dec Reported 2015 2014 growth 2015 2014 growth $m $m % $m $m % Fourth Quarter Resultsi Revenue 1,257 1,249 5 1,257 1,249 1
Full Year Resultsi Revenue 4,634 4,617 4 4,634 4,617 0 Trading/operating profit 1,099 1,055 628 749 Trading/operating profit margin 23.7% 22.9% 13.6% 16.2% EPSA/ EPS (cents) 85.1 83.2 45.9 56.1
Fourth Quarter Highlightsi • Revenue up 5% underlying. 1% reported growth after -6% FX and 2% acquisition impacts • Established Markets revenue up 6%, our best quarterly performance since 2012 • Emerging Markets revenue growth of 2% with strong growth in most markets offset by China • Sports Medicine Joint Repair revenue up 9%, driven by US and ArthroCare benefits • Another strong performance in Knee Implants with revenue up 6% • Advanced Wound Management businesses deliver 8% revenue growth, led by US performance
2015 Full Year Highlightsi • Full year underlying revenue growth of 4%, twice that achieved in 2014. Reported growth flat
after -8% FX and 4% acquisition impacts • Trading profit margin up 80bps at 23.7%, reflecting Group Optimisation and ArthroCare synergies • $203m accounting charge (before future insurance recovery) taken for metal-on-metal claims • Proposed full year dividend distribution of 30.8¢ per share, up 4% year-on-year
Olivier Bohuon, Chief Executive Officer of Smith & Nephew, said: “The Group finished 2015 strongly, led by an excellent quarter in the US across Sports Medicine, Knee Implants and our Advanced Wound Management businesses. At the same time, we successfully continued to grow our businesses in Europe and the Emerging Markets. “For the full year we delivered higher underlying revenue growth, trading profit margin and adjusted earnings year-on-year. Our strategy is producing an improved performance through focused innovation, better commercial execution and greater efficiency. “We expect to deliver continued good underlying revenue growth in 2016 as we benefit from our investments in existing businesses, acquisitions and pioneering technologies.”
News

Analyst conference call An analyst meeting and conference call to discuss Smith & Nephew’s results will be held at 9.00am GMT / 4.00am EST today, Thursday 4 February. This can be heard live through the Smith & Nephew website at http://www.smith-nephew.com/results and a recording will be available on the site shortly afterwards. For those who wish to dial in to the call, details can be accessed on our website using the same link. Enquiries Investors Ingeborg Øie +44 (0) 20 7960 2285 Smith & Nephew Media Charles Reynolds +44 (0) 20 7401 7646 Smith & Nephew Ben Atwell / Deborah Scott / Matthew Cole +44 (0) 20 3727 1000 FTI Communications Notes
i. Certain items included in ‘Trading results’, such as trading profit, trading profit margin, trading cash flow, EPSA and underlying growth
are non-IFRS financial measures. The non-IFRS financial measures reported in this announcement are explained in Note 8 and are reconciled to the most directly comparable financial measure prepared in accordance with IFRS.
ii. All numbers given are for the quarter or full year ended 31 December 2015 unless stated otherwise.
iii. Unless otherwise specified as ‘reported’ all revenue growths throughout this document are underlying increases/decreases after
adjusting for the effects of currency translation and including the comparative impact of acquisitions and excluding disposals. All percentages compare to the equivalent 2014 period.
iv. Underlying revenue growth is used to compare the revenue in a given period to the comparative period on a like-for-like basis. Underlying revenue growth reconciles to reported revenue growth, the most directly comparable financial measure calculated in accordance with IFRS, by making adjustments for the effect of acquisitions and disposals and the impact of movements in exchange rates (currency impact), as described below.
v. The effect of acquisitions and disposals measures the impact on revenue from newly acquired material business combinations and
recent material business disposals. This is calculated by comparing the current year, constant currency actual revenue (which include acquisitions and exclude disposals from the relevant date of completion) with prior year, constant currency actual revenue, adjusted to include the results of acquisitions and exclude disposals for the commensurate period in the prior year.
vi. Currency impact measures the increase/decrease in revenue resulting from currency movements on non-US Dollar sales and is
measured as the difference between: 1) the increase/decrease in current year revenue translated into US Dollars at the current year average rate and the prior year revenue translated at the prior year average rate; and 2) the increase/decrease being measured by translating current and prior year revenue into US Dollars using a constant fixed rate.
vii. References to market growth rates are estimates generated by Smith & Nephew based on a variety of sources.
viii. Q4 2015 comprised 64 trading days (2014: 63 trading days). The full year of 2015 comprised 251 trading days (2014: 251 trading
days).
2

Smith & Nephew Fourth Quarter Trading and Full Year 2015 Results For the full year we delivered higher underlying revenue growth, trading profit margin and adjusted earnings year-on-year. Where we have invested to improve our existing businesses, we began to reap the rewards in 2015 as we continued to deliver against our five strategic priorities. A stronger commercial performance Geographically, we drove growth in all of our regions in 2015. In our Established Markets we delivered 5% growth in the United States, our largest market, a significant improvement on the previous year. We successfully stabilised our European business which delivered a better outturn year-on-year, and our Australia, New Zealand and Japan region delivered good growth, led by the Advanced Wound Management businesses. In the Emerging Markets we delivered 11% revenue growth in 2015 despite the slow-down in China. Whilst we expect growth in China to remain below previous levels in the near-term, it remains a very attractive market and we are committed to building our business here. We continued to successfully deliver strong revenue growth across the rest of the Emerging Markets. Global franchise highlights in 2015 included the performance of Sports Medicine, which was strengthened by the ArthroCare acquisition. The Advanced Wound Management businesses delivered a significantly better outcome driven by new management initiatives. Orthopaedic Reconstruction grew ahead of the market driven by our Knee Implant franchise. We are further strengthening our commercial platform by aligning under a newly created role of Chief Commercial Officer tasked with driving commercial excellence across the organisation globally. We are also bringing all of our US Orthopaedic Reconstruction, Sports Medicine, Trauma and Advanced Wound Management franchises under one leader, completing the roll-out of our single managing director model globally. Focused on innovation We continue to innovate for value. Through our Research and Development (‘R&D’) strategy we deliver pioneering products and services, and drive innovation across the markets we serve. In 2015 we reiterated our commitment to innovation by announcing a single global R&D organisation to be led by a new President of Global R&D. We launched many new products in 2015 and made good progress with our innovative business models, including Syncera◊, our value solution for orthopaedic reconstruction. We have a strong new product line-up for 2016 as the result of our internal programmes and recent acquisitions. With increased focus on R&D we will apply more resource to the development of disruptive products and services that increasingly define Smith & Nephew and will help drive our success in the future. Driving increased efficiency & operational excellence We continue to simplify and improve our operating model, becoming more efficient in 2015. Our programme to realise at least $120 million of annual savings is progressing ahead of plan, and had delivered $100 million of annualised benefits at year end. The suspension of the Medical Device Excise Tax will present us with opportunities to accelerate investment in our quality and regulatory systems and health economics teams, particularly in support of the US market. Successful acquisition track record Smith & Nephew has established a successful acquisition track record in recent years. With Healthpoint Biotherapeutics, acquired in 2012, our third year return on capital has exceeded our weighted average cost of capital, despite certain issues we had to address with regard to facilities acquired. ArthroCare, acquired in 2014, is performing in-line with our expectations and we expect the synergies to add $85 million to annual trading profit by 2017.
3

In 2015 we continued to invest in acquisitions that provide opportunities to supplement our organic growth, strengthening our technology and product portfolios and our Emerging Markets business. The acquisition of Blue Belt Technologies was announced in October 2015 and completed in January 2016, with the early integration progressing to plan. Blue Belt has given us a leading position in the fast growing area of robotics-assisted orthopaedic surgery. Its NAVIO◊ surgical system provides robotics-assistance in partial knee replacement surgery through a unique hand-held, bone-shaping device. NAVIO and our own partial knee implant portfolio form a strong combined business from which to accelerate growth in this attractive area of surgery. Additionally, we intend to expand NAVIO into total knee, bi-cruciate retaining knee and revision knee implants, delivering significant further upside. We also completed the acquisition of the ZUK partial knee system in the US market during the year. This has given us access to many new customers and is highly complementary to Blue Belt. In the Emerging Markets we enhanced our commercial footprint and product portfolio. In Russia, we acquired a trauma and orthopaedics distribution business that includes mid-tier manufacturing, significantly enhancing our local presence and giving us a platform to take advantage of local market dynamics. In Colombia, one of the largest economies in Latin America, we acquired our distributor for orthopaedic reconstruction, trauma and sports medicine products. Fourth Quarter 2015 Trading Update The Group finished 2015 strongly, led by excellent performances in the US across Sports Medicine, Knee Implants and our Advanced Wound Management businesses. At the same time, we successfully continued to grow our businesses in Europe and, despite the significant slow-down in China, the Emerging Markets. Our Q4 revenue was $1,257 million (2014: $1,249 million), an increase of 5% on an underlying basis and 1% on a reported basis. A foreign exchange headwind of -6% was partially offset by acquisitions, which added 2% to the reported growth rate. Q4 2015 comprised 64 trading days, one more than in Q4 2014, which typically increases the underlying revenue growth rate by around 1%. Fourth Quarter 2015 Franchise Highlights Sports Medicine Joint Repair had a good finish to the year, especially in the US, with revenue up 9% in the quarter as we benefited from the strength of our combined portfolio following the ArthroCare acquisition, in particular in shoulder repair. In Arthroscopic Enabling Technologies we delivered 3% revenue growth, considerably ahead of recent quarters as we delivered strong COBLATION◊ sales. Trauma & Extremities performance was flat, partly reflecting a slow-down in our Chinese business. Our Other Surgical Businesses franchise delivered revenue growth of 13%. Ear, Nose & Throat continued to deliver better growth following our actions to improve this business. In Reconstruction we achieved another quarter of strong growth in Knee Implants, growing revenue by 6%, outperforming the market which we estimate grew 3%. Our Q4 performance included growth of 7% in the US, driven by our differentiated VERILAST◊ technology and the JOURNEY◊ II Total Knee System. Hip Implants revenue growth was 1%, in-line with the estimated market growth rate of 1%. Good growth in our core hips was again offset by the declining sales of resurfacing systems. Advanced Wound Care delivered revenue growth of 4%, consolidating the improvements achieved across the year, particularly better US growth. Advanced Wound Bioactives revenue growth was 16% as SANTYL◊ finished the year strongly. OASIS◊ sales continued to be held back by the 2014 change in US reimbursement.
4

Advanced Wound Devices revenue growth was 14%. PICO◊ continued to deliver strong growth as the market increasingly adopts disposable negative pressure devices. We expect the improved outpatient reimbursement for PICO in the US will help us drive continued momentum for this product in 2016. Fourth Quarter 2015 Consolidated Revenue Analysis
31 December
2015 $m
31 December
2014 $m
Reported growth
%
Underlying growtha
%
Acquisitions /disposals
%
Currency impact
% Consolidated revenue 1,257 1,249 1 5 2 -6
Consolidated revenue by franchise
31 December
2015 $m
31 December
2014 $m
Reported growth
%
Underlying growtha
%
Underlying growtha
% Global US OUSb
Sports Medicine, Trauma & Other 511 509 0 5 8 2 Sports Medicine Joint Repair 169 159 6 9 Arthroscopic Enabling Technologies 159 169 -6 3 Trauma & Extremities 127 129 -2 0 Other Surgical Businesses 56 52 9 13 Reconstruction 411 405 2 4 4 3 Knee Implantsc 248 235 6 6 Hip Implantsc 163 170 -4 1 Advanced Wound Management 335 335 0 8 22 1 Advanced Wound Care 196 210 -7 4 Advanced Wound Bioactives 96 83 16 16 Advanced Wound Devices 43 42 3 14 Total 1,257 1,249 1 5 9 2
Consolidated revenue by geography
31 December
2015 $m
31 December
2014 $m
Reported growth
%
Underlying growtha
%
US 626 563 11 9 Other Established Marketsd 454 499 -9 2 Emerging Markets 177 187 -6 2 Total 1,257 1,249 1 5
a Underlying growth is defined in note iii on page 2 b Outside United States c US knees 7%, OUS knees 4%, US hips 0%, OUS hips 1% d Europe, Canada, Japan, Australia and New Zealand Fourth Quarter 2015 Regional Performance We delivered 9% revenue growth in the US for the quarter with our Sports Medicine Joint Repair, Knee Implants, and all our Advanced Wound Management franchises performing strongly. Growth across our Other Established Markets was 2%. Revenue growth was also 2% across the Emerging Markets, reflecting weakness in China principally across Sports Medicine, Trauma and Advanced Wound Care. Growth in most other Emerging Markets countries remained strong and, excluding China, we increased revenue by 15% in the quarter.
5

Legal Settlement and Provision During the quarter Smith & Nephew settled the majority of US metal-on-metal hip claims, without admitting liability. Insurance receipts to date have covered more than half of the gross settlement, with the net cash cost being $25 million. These claims principally related to Smith & Nephew’s portfolio of modular metal-on-metal hip products (such as the R3 metal liner), which are no longer on the market. We have taken an accounting charge of $203 million to cover this net cost and also the present value of the estimated costs to resolve all other known and anticipated claims over the coming years. This amount does not include any possible insurance recovery on these other claims and associated legal fees. The Group carries considerable product liability insurance and we will continue to defend claims vigorously. The estimate is based on assumptions relating to number of claims and outcomes, and is subject to revision as circumstances evolve. Full Year 2015 Consolidated Trading Analysis Smith & Nephew results for the full year ended 31 December 2015:
Trading Reported Full year Full year Full year Full year 2015 2014 2015 2014 $m $m $m $m Results* Revenue 4,634 4,617 4,634 4,617 Trading/operating profit 1,099 1,055 628 749 Trading/operating profit margin 23.7% 22.9% 13.6% 16.2% Net interest charge (41) (15) (38) (22) Other finance costs (13) (11) (15) (11) Share of losses from associates (5) (2) (16) (2) Profit before taxation 1,040 1,027 559 714 Taxation (279) (284) (149) (213) Effective tax rate 26.8% 27.7% 26.7% 29.8% Adjusted attributable/ attributable profit 761 743 410 501 EPSA/ EPS (cents) 85.1 83.2 45.9 56.1
* See note i on page 2 Full Year 2015 Highlights Group revenue for the full year was $4,634 million (FY 2014: $4,617 million), an increase of 4% on an underlying basis and flat on a reported basis. A foreign exchange headwind of -8% was partially offset by acquisitions, which added 4% to the reported growth rate. Revenue growth was 5% in the US, 1% across our Other Established Markets and 11% in the Emerging Markets. Trading profit was $1,099 million in the full year (2014: $1,055 million). The trading profit margin was 23.7% (FY 2014: 22.9%), up 80 bps, reflecting the benefits from the Group optimisation programme and synergies from the ArthroCare acquisition. Reported operating profit of $628 million (2014: $749 million) is after integration and acquisition costs, as well as restructuring and rationalisation costs, amortisation and impairment of acquisition intangibles and legal and other items incurred in the full year (see Note 8 to the Financial Statements). Significant items
6

include the $203 million accounting charge detailed above. The net interest charge and other financing costs for 2015 was $53 million (2014: $33 million), reflecting the acquisition of ArthroCare. Profit before tax was $559 million (2014: $714 million). The tax rate for the full year is 26.8% on Trading results (2014: 27.7%), a 90bps reduction year-on-year. We expect the tax rate on Trading results to be 26.5% or slightly lower for 2016, barring any changes to tax legislation. Adjusted earnings per share was 85.1¢ (170.2¢ per American Depositary Share, ‘ADS’) compared to 83.2¢ last year, up 2%. Basic earnings per share was 45.9¢ (91.8¢ per ADS) (FY 2014: 56.1¢) with the difference between adjusted and unadjusted earnings per share reflecting legal settlement and provision, restructuring charges relating to our optimisation programme and amortisation of an impairment of acquisition intangibles(see Note 8 to the Financial Statements). Trading cash flow was $936 million in the year. The trading profit to cash conversion ratio was 85% (2014: 74%), a year-on-year improvement in working capital management as the Group returned to recent stronger cash performance levels. Net debt was $1,361 million, down from $1,613 million at the end of 2014. This represents a net debt/EBITDA ratio of 1.0x. The Blue Belt acquisition was completed after the year-end for $279 million. Dividend The Board is pleased to recommend a Final Dividend of 19.0¢ per share (38.0¢ per ADS). This, together with the Interim Dividend of 11.8¢ per share (23.6¢ per ADS), will give a full year distribution of 30.8¢ per share (61.6¢ per ADS), up 4% year-on-year, in-line with our progressive dividend policy and slightly above EPSA growth. Outlook In 2016, we expect to deliver continued good underlying revenue growth as we benefit from our investments in existing businesses, acquisitions and pioneering technologies. We would have expected our trading profit margin to reach or exceed 24% in 2016, including the 60 bps dilution from investing in the Blue Belt Technologies product pipeline. However, our margin will be reduced by a significant -120 bps transactional currency headwind based on current exchange rates, as highlighted in our Q3 results. Our strategy is producing an improved performance through focused innovation, better commercial execution and greater efficiency.
7
Forward calendar The Group will announce its First Quarter Trading Results on 5 May 2016. About Smith & Nephew Smith & Nephew is a global medical technology business dedicated to supporting healthcare professionals in their daily efforts to improve the lives of their patients. With leadership positions in Orthopaedic Reconstruction, Advanced Wound Management, Sports Medicine and Trauma & Extremities, Smith & Nephew has over 15,000 employees and a presence in more than 100 countries. Annual sales in 2015 were more than $4.6 billion. Smith & Nephew is a member of the FTSE100 (LSE:SN, NYSE:SNN). For more information about Smith & Nephew, please visit our corporate website www.smith-nephew.com, follow @SmithNephewplc on Twitter or visit SmithNephewplc on Facebook.com. Forward-looking Statements This document may contain forward-looking statements that may or may not prove accurate. For example, statements regarding expected revenue growth and trading margins, market trends and our product pipeline are forward-looking statements. Phrases such as "aim", "plan", "intend", "anticipate", "well-placed", "believe", "estimate", "expect", "target", "consider" and similar expressions are generally intended to identify forward-looking statements. Forward-looking statements involve known and unknown risks, uncertainties and other important factors that could cause actual results to differ materially from what is expressed or implied by the statements. For Smith & Nephew, these factors include: economic and financial conditions in the markets we serve, especially those affecting health care providers, payers and customers; price levels for established and innovative medical devices; developments in medical technology; regulatory approvals, reimbursement decisions or other government actions; product defects or recalls or other problems with quality management systems or failure to comply with related regulations; litigation relating to patent or other claims; legal compliance risks and related investigative, remedial or enforcement actions; disruption to our supply chain or operations or those of our suppliers; competition for qualified personnel; strategic actions, including acquisitions and dispositions, our success in performing due diligence, valuing and integrating acquired businesses; disruption that may result from transactions or other changes we make in our business plans or organisation to adapt to market developments; and numerous other matters that affect us or our markets, including those of a political, economic, business, competitive or reputational nature. Please refer to the documents that Smith & Nephew has filed with the U.S. Securities and Exchange Commission under the U.S. Securities Exchange Act of 1934, as amended, including Smith & Nephew's most recent annual report on Form 20-F, for a discussion of certain of these factors. Any forward-looking statement is based on information available to Smith & Nephew as of the date of the statement. All written or oral forward-looking statements attributable to Smith & Nephew are qualified by this caution. Smith & Nephew does not undertake any obligation to update or revise any forward-looking statement to reflect any change in circumstances or in Smith & Nephew's expectations. ◊ Trademark of Smith & Nephew. Certain marks registered US Patent and Trademark Office.
8
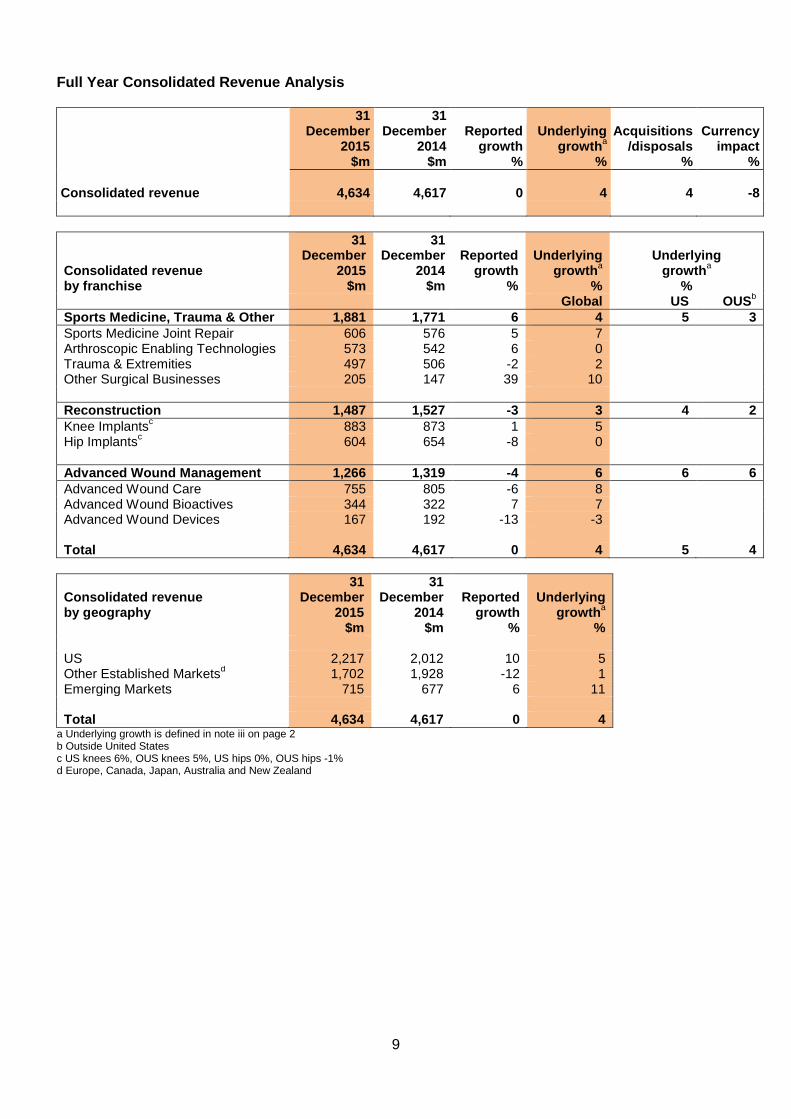
Full Year Consolidated Revenue Analysis
31 December
2015 $m
31 December
2014 $m
Reported growth
%
Underlying growtha
%
Acquisitions /disposals
%
Currency impact
% Consolidated revenue 4,634 4,617 0 4 4 -8
Consolidated revenue by franchise
31 December
2015 $m
31 December
2014 $m
Reported growth
%
Underlying growtha
%
Underlying growtha
% Global US OUSb
Sports Medicine, Trauma & Other 1,881 1,771 6 4 5 3 Sports Medicine Joint Repair 606 576 5 7 Arthroscopic Enabling Technologies 573 542 6 0 Trauma & Extremities 497 506 -2 2 Other Surgical Businesses 205 147 39 10 Reconstruction 1,487 1,527 -3 3 4 2 Knee Implantsc 883 873 1 5 Hip Implantsc 604 654 -8 0 Advanced Wound Management 1,266 1,319 -4 6 6 6 Advanced Wound Care 755 805 -6 8 Advanced Wound Bioactives 344 322 7 7 Advanced Wound Devices 167 192 -13 -3 Total 4,634 4,617 0 4 5 4
Consolidated revenue by geography
31 December
2015
31 December
2014 Reported
growth Underlying
growtha $m $m % % US 2,217 2,012 10 5 Other Established Marketsd 1,702 1,928 -12 1 Emerging Markets 715 677 6 11 Total 4,634 4,617 0 4
a Underlying growth is defined in note iii on page 2 b Outside United States c US knees 6%, OUS knees 5%, US hips 0%, OUS hips -1% d Europe, Canada, Japan, Australia and New Zealand
9

2015 CONDENSED CONSOLIDATED FINANCIAL STATEMENTS Unaudited Group Income Statement for the year to 31 December 2015
Notes 2015 2014 $m $m
Revenue 2 4,634 4,617 Cost of goods sold (1,143) (1,162) Gross profit 3,491 3,455 Selling, general and administrative expenses (2,641) (2,471) Research and development expenses (222) (235)
Operating profit 8 628 749 Interest receivable 11 13 Interest payable (49) (35) Other finance costs (15) (11) Share of losses from associates (16) (2)
Profit before taxation 559 714 Taxation 3 (149) (213)
Attributable profit A 410 501
Earnings per share A Basic 8 45.9c 56.1c Diluted 45.6c 55.7c
Unaudited Group Statement of Comprehensive Income for the year to 31 December 2015
2015 2014 $m $m
Attributable profit A 410 501 Other comprehensive income/(loss) Items that will not be reclassified to income statement Remeasurement of net retirement benefit obligations (8) (94) Taxation on other comprehensive income 10 19
Total items that will not be reclassified to income statement 2 (75) Items that are or may be reclassified to income statement Exchange differences on translation of foreign operations (176) (196) Net (losses)/gains on cash flow hedges (16) 12
Total items that are or may be reclassified to income statement
(192) (184)
Other comprehensive loss for the period, net of tax (190) (259)
Total comprehensive income for the period A 220 242
A Attributable to the equity holders of the parent and wholly derived from continuing operations.
10

Unaudited Group Balance Sheet as at 31 December 2015
Notes 31 Dec 31 Dec 2015 2014 $m $m
ASSETS Non-current assets Property, plant and equipment 932 891 Goodwill 2,012 2,027 Intangible assets 1,502 1,747 Investments 13 5 Investment in associates 115 112 Retirement benefit assets 13 7 Deferred tax assets 105 77
4,692 4,866
Current assets Inventories 1,217 1,181 Trade and other receivables 1,138 1,166 Cash at bank 6 120 93
2,475 2,440
TOTAL ASSETS 7,167 7,306
EQUITY AND LIABILITIES Equity attributable to equity holders of the parent Share capital 183 184 Share premium 590 574 Capital redemption reserve 12 11 Treasury shares (294) (315) Other reserves (256) (64) Retained earnings 3,731 3,650
Total equity 3,966 4,040
Non-current liabilities Long-term borrowings 6 1,434 1,666 Retirement benefit obligations 184 233 Trade and other payables 29 44 Provisions 133 63 Deferred tax liabilities 77 98
1,857 2,104
Current liabilities Bank overdrafts and loans 6 46 39 Trade and other payables 842 838 Provisions 193 67 Current tax payable 263 218
1,344 1,162
Total liabilities 3,201 3,266
TOTAL EQUITY AND LIABILITIES 7,167 7,306
11

Unaudited Condensed Group Cash Flow Statement for the year to 31 December 2015
2015 2014 $m $m
Cash flows from operating activities Profit before taxation 559 714 Net interest payable 38 22 Depreciation, amortisation, impairment and disposal losses 511 439 Share of losses from associates 16 2 Share-based payments expense 29 32 Profit on disposal of manufacturing facility - (9) Pension past service cost adjustment (19) (35) Pension buyouts - (11) Movement in working capital and provisions 69 (193)
Cash generated from operating activities 1,203 961 Net interest and finance costs paid (36) (33) Income taxes paid (137) (245)
Net cash inflow from operating activities 1,030 683
Cash flows from investing activities Acquisitions, net of cash acquired (44) (1,572) Investment in associate (25) (2) Proceeds from associate loan redemption - 188 Purchase of investments (2) (4) Proceeds on disposal of manufacturing facility - 20 Capital expenditure (358) (375)
Net cash used in investing activities (429) (1,745)
Net cash inflow/(outflow) before financing activities 601 (1,062)
Cash flows from financing activities Proceeds from issue of ordinary share capital 16 40 Proceeds from own shares 5 4 Purchase of own shares (77) (75) Equity dividends paid (272) (250) Cash movements in borrowings (215) 1,300 Settlement of currency rate swaps (15) (11)
Net cash (used in)/from financing activities (558) 1,008
Net increase/(decrease) in cash and cash equivalents 43 (54) Cash and cash equivalents at beginning of period 65 126 Exchange adjustments (6) (7)
Cash and cash equivalents at end of period B 102 65
B Cash and cash equivalents at the end of the period are net of overdrafts of $18 million (31 December 2014: $28 million).
12

Unaudited Group Statement of Changes in Equity for the year to 31 December 2015
Share Share
Capital redemption Treasury Other Retained Total
capital premium reserve shares reserves earnings equity $m $m $m $m $m $m $m
At 1 January 2015 184 574 11 (315) (64) 3,650 4,040 Attributable profit A - - - - - 410 410 Other comprehensive (loss)/ income A - - - - (192) 2 (190) Purchase of own shares C - - - (77) - - (77) Equity dividends paid - - - - - (272) (272) Share-based payments recognised - - - - - 29 29 Taxation on share-based payments - - - - - 5 5 Cost of shares transferred to beneficiaries - - - 38 - (33) 5 Cancellation of treasury shares C (1) - 1 60 - (60) - Issue of ordinary share capital - 16 - - - - 16
At 31 December 2015 183 590 12 (294) (256) 3,731 3,966
Share Share Capital
redemption Treasury Other Retained Total capital premium reserve shares reserves earnings equity $m $m $m $m $m $m $m
At 1 January 2014 (audited) 184 535 10 (322) 120 3,520 4,047 Attributable profit A - - - - - 501 501 Other comprehensive loss A - - - - (184) (75) (259) Purchase of own shares C - - - (75) - - (75) Equity dividends paid - - - - - (250) (250) Share-based payments recognised - - - - - 32 32 Cost of shares transferred to beneficiaries - - - 25 - (21) 4 Cancellation of treasury shares C (1) - 1 57 - (57) - Issue of ordinary share capital 1 39 - - - - 40
At 31 December 2014 (audited) 184 574 11 (315) (64) 3,650 4,040
A Attributable to the equity holders of the parent and wholly derived from continuing operations.
C Shares issued in connection with the Group’s share incentive plans are brought back on a quarterly basis. During the year ended 31 December 2015, a total of 4.4 million ordinary shares were purchased at a cost of $77 million and 4.4 million ordinary shares were cancelled. (2014: 4.4 million ordinary shares were purchased at a cost of $75 million and 4.4 million ordinary shares were cancelled.)
13

Notes to the Condensed Consolidated Financial Statements 1. Basis of preparation and accounting policies Smith & Nephew plc (the ‘Company’) is a public limited company incorporated in England and Wales. In
these condensed consolidated financial statements (‘Financial Statements’), ‘Group’ means the Company and all its subsidiaries. The financial information herein has been prepared on the basis of the accounting policies set out in the annual accounts of the Group for the year ended 31 December 2014, except for the change in reporting segments as discussed in Note 2. The Group prepares its annual accounts on the basis of International Financial Reporting Standards (‘IFRS’) as adopted by the European Union (‘EU’) and in accordance with the provisions of the Companies Act 2006. IFRS as adopted by the EU differs in certain respects from IFRS as issued by the International Accounting Standards Board. However, the differences have no impact for the periods presented. Under IFRS, the Directors are required to adopt those accounting policies most appropriate to the Group’s circumstances for the purpose of presenting fairly the Group’s financial position, financial performance and cash flows. In determining and applying accounting policies, judgement is often required in respect of items where the choice of specific policy, accounting estimate or assumption to be followed could materially affect the reported results or net asset position of the Group; it may later be determined that a different choice would have been more appropriate. The Group’s significant accounting policies which require the most use of management’s judgement are: valuation of inventories, impairment, liability provisioning, taxation, business combinations and segmental reporting. There has been no change in the methodology of applying management judgement to these policies since the year ended 31 December 2014 other than the determination of segmental reporting as discussed in Note 2.
The Group has adequate financial resources and its customers and suppliers are diversified across different geographic areas. The Directors believe that the Group is well placed to manage its business risk appropriately. The Directors have a reasonable expectation that the Group has sufficient resources to continue in operational existence for the foreseeable future. Thus they continue to adopt the going concern basis for accounting in preparing these Financial Statements. The principal risks and uncertainties to which the Group is exposed are consistent with those as at 31 December 2014. These are product portfolio development, pricing and re-imbursement pressures, single source site or supplier dependency, IT system disruption, catastrophic event, intellectual property protection, product defect, bribery and corruption and data privacy, product regulations, mergers and acquisitions, talent retention and organisation change effectiveness, excess inventory and currency exchange volatility. Further details on these risks can be found on pages 37-39 of the annual accounts of the Group for the year ended 31 December 2014.
The financial information contained in this document does not constitute statutory accounts as defined in sections 434 and 435 of the Companies Act 2006. The auditors issued an unqualified opinion that did not contain a statement under section 498 of the Companies Act 2006 on the Group’s statutory financial statements for the year ended 31 December 2014. The Group’s statutory financial statements for the year ended 31 December 2014 have been delivered to the Registrar of Companies. The financial information for the year ended 31 December 2015 has been extracted from the Group’s financial statements which will be delivered to the Registrar of Companies in due course.
14

2. Business segment information The Group has historically reported two operating segments, being Advanced Surgical Devices (‘ASD’) and
Advanced Wound Management (‘AWM’). Since the completion on 1 January 2015 of the Group’s transition to a new commercial organisational structure as part of the Group Optimisation programme, the Group is engaged in a single business activity, being the development, manufacture and sales of medical technology products and services. Development, manufacturing, supply chain and central functions are managed globally for the Group as a whole. Sales are managed through six geographical selling regions, with each having a president who is responsible for the commercial view of that region. The Commercial Operations team (‘CommOps’), comprises geographical presidents and certain heads of function and is chaired by the CEO. CommOps is the body through which the CEO uses the authority delegated to him by the Board of Directors to manage the operations and performance of the Group. All significant operating decisions regarding the prioritisation and allocation of the Group’s resources and assessment of the Group’s performance are made by CommOps, and whilst the members have individual responsibility for the implementation of decisions within their respective areas, it is at the CommOps level that these decisions are made. Accordingly, CommOps is considered to be the Group’s chief operating decision maker as defined by IFRS 8, Operating Segments. In making decisions about the prioritisation and allocation of the Group’s resources, CommOps reviews financial information on an integrated basis for the Group as a whole and determines the best allocation of resources to group-wide projects. This information is prepared substantially on the same basis as the Group’s IFRS financial statements aside from the adjustments described in Note 8. In assessing performance CommOps also considers financial information presented on a geographical selling region and product franchise basis for revenue. Financial information for corporate and functional costs is presented on a Group-wide basis. Detailed below is the revenue by the nine product franchises and summarised geographies. In applying the requirements of IFRS 8, the Group considers the fact that the prioritisation and allocation of resources by CommOps being determined at Group level on a project by project basis results in the Group having one operating segment. The results of the single segment are shown below. Comparative results from the 2014 operating segments, ASD and AWM, are shown in Note 2b in a product franchise view. A reconciliation of the trading and operating profit measures for these legacy segments to the single segment is not presented as the single segment is consistent with the total results of the Group.
2a. CommOps evaluates the performance of the single operating segment by considering its trading profit,
which is reconciled to the statutory measure for the Group below:
2015 2014 $m $m
Revenue 4,634 4,617
Cost of goods sold D (1,143) (1,127) Selling, general and administration expenses D (2,170) (2,200) Research and development expenses (222) (235)
Trading profit D 1,099 1,055
Non-trading items D (471) (306) Operating profit 628 749
D The above financial measures are not prepared in accordance with IFRS. The reconciliation to the most directly comparable
financial measures calculated in accordance with IFRS is presented in Note 8. Included within $471 million charge for non-trading items is a $203 million charge relating to known,
anticipated and settled metal on metal hip claims, amortisation and impairment of acquisition intangible assets of $204 million and $65 million from the Group’s restructuring programme. Other items total a net credit of $1 million, further detail provided in Note 8.
15

2. Business segment information (continued)
Underlying Acquisitions Currency Reported growth & disposals impact growth % % % %
Full year Revenue growth 4 4 (8) - Trading profit growth 5 5 (6) 4
Further description of why CommOps focuses on the underlying revenue growth and trading measure and
how this reconciles to operating profit is detailed in Note 8.
2b. The following table shows Group revenue by product franchise.
2015 2014 $m $m
Sports Medicine, Trauma & Other 1,881 1,771
Sports Medicine Joint Repair 606 576 Arthroscopic Enabling Technologies 573 542 Trauma & Extremities 497 506 Other Surgical Businesses 205 147
Reconstruction 1,487 1,527 Knee Implants 883 873 Hip Implants 604 654
Advanced Wound Management 1,266 1,319 Advanced Wound Care 755 805 Advanced Wound Bioactives 344 322 Advanced Wound Devices 167 192
Total 4,634 4,617
Advanced Surgical Device segment revenue of $3,298 million reported in 2014 included the franchises reported above under Sports Medicine, Trauma & Other and Reconstruction.
2c. The following table shows Group revenue by geographic market.
2015 2014 $m $m
Revenue by geographic market
US 2,217 2,012 Other Established Markets 1,702 1,928 Emerging and International Markets 715 677
Total 4,634 4,617
Other Established Markets comprises Australia, Canada, Europe, Japan and New Zealand. UK revenue for the year was $301 million (2014: $299 million).
16
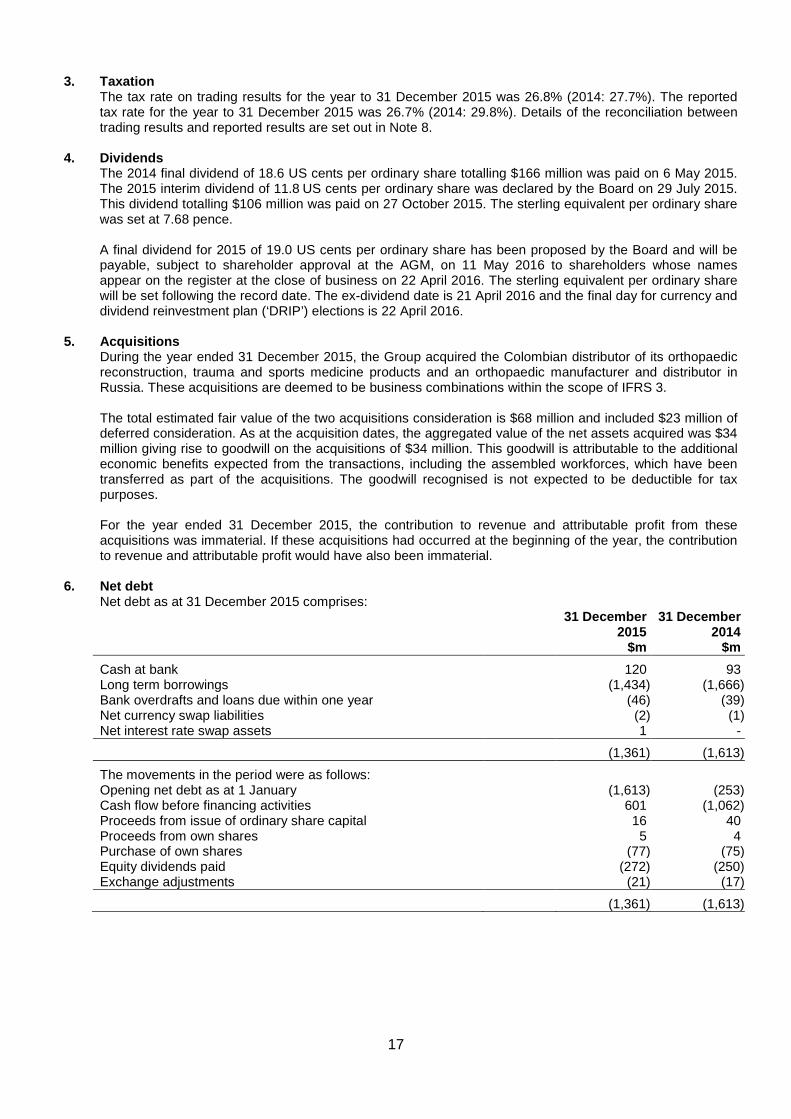
3. Taxation The tax rate on trading results for the year to 31 December 2015 was 26.8% (2014: 27.7%). The reported
tax rate for the year to 31 December 2015 was 26.7% (2014: 29.8%). Details of the reconciliation between trading results and reported results are set out in Note 8.
4. Dividends The 2014 final dividend of 18.6 US cents per ordinary share totalling $166 million was paid on 6 May 2015.
The 2015 interim dividend of 11.8 US cents per ordinary share was declared by the Board on 29 July 2015. This dividend totalling $106 million was paid on 27 October 2015. The sterling equivalent per ordinary share was set at 7.68 pence. A final dividend for 2015 of 19.0 US cents per ordinary share has been proposed by the Board and will be payable, subject to shareholder approval at the AGM, on 11 May 2016 to shareholders whose names appear on the register at the close of business on 22 April 2016. The sterling equivalent per ordinary share will be set following the record date. The ex-dividend date is 21 April 2016 and the final day for currency and dividend reinvestment plan (‘DRIP’) elections is 22 April 2016.
5. Acquisitions During the year ended 31 December 2015, the Group acquired the Colombian distributor of its orthopaedic
reconstruction, trauma and sports medicine products and an orthopaedic manufacturer and distributor in Russia. These acquisitions are deemed to be business combinations within the scope of IFRS 3. The total estimated fair value of the two acquisitions consideration is $68 million and included $23 million of deferred consideration. As at the acquisition dates, the aggregated value of the net assets acquired was $34 million giving rise to goodwill on the acquisitions of $34 million. This goodwill is attributable to the additional economic benefits expected from the transactions, including the assembled workforces, which have been transferred as part of the acquisitions. The goodwill recognised is not expected to be deductible for tax purposes. For the year ended 31 December 2015, the contribution to revenue and attributable profit from these acquisitions was immaterial. If these acquisitions had occurred at the beginning of the year, the contribution to revenue and attributable profit would have also been immaterial.
6. Net debt
Net debt as at 31 December 2015 comprises: 31 December 31 December 2015 2014 $m $m
Cash at bank 120 93 Long term borrowings (1,434) (1,666) Bank overdrafts and loans due within one year (46) (39) Net currency swap liabilities (2) (1) Net interest rate swap assets 1 -
(1,361) (1,613)
The movements in the period were as follows: Opening net debt as at 1 January (1,613) (253) Cash flow before financing activities 601 (1,062) Proceeds from issue of ordinary share capital 16 40 Proceeds from own shares 5 4 Purchase of own shares (77) (75) Equity dividends paid (272) (250) Exchange adjustments (21) (17)
(1,361) (1,613)
17

7. Financial instruments The following table shows the carrying amounts and fair values of financial assets and financial liabilities,
including their levels in the fair value hierarchy.
Carrying amount Fair value 31 Dec 31 Dec 31 Dec 31 Dec Fair 2015 2014 2015 2014 value $m $m $m $m level Financial assets at fair value Forward foreign exchange contacts 31 48 31 48 Level 2 Investments 13 5 13 5 Level 3 Currency swaps 1 1 1 1 Level 2 Interest rate swaps 1 - 1 - Level 2
46 54 46 54
Financial assets not measured at fair value Trade and other receivables E 1,022 1,019 1,022 1,019 Cash at bank 120 93 120 93
1,142 1,112 1,142 1,112 Total financial assets 1,188 1,166 1,188 1,166 Financial liabilities at fair value Contingent consideration 27 33 27 33 Level 3 Forward foreign exchange contracts 23 19 23 19 Level 2 Currency swaps 3 2 3 2 Level 2 Private placement debt 201 - 201 - Level 2
254 54 254 54
Financial liabilities not measured at fair value Bank overdrafts 18 28 18 28 Bank loans F 326 540 326 540 Private placement debt 925 1,125 949 1,144 Finance lease liabilities 10 12 10 12 Trade and other payables 818 828 818 828
2,097 2,533 2,121 2,552 Total financial liabilities 2,351 2,587 2,375 2,606
E Trade and other receivables excludes $70 million (2014: $98 million) of prepayments and accrued income considered to be
non-financial assets.
F During the year ended 31 December 2015, the Group entered into a $300 million bilateral loan facility with a commercial bank expiring in 2018, replacing the syndicated term loan facility of $400 million expiring in 2016. The Group also extended the maturity date of its $1 billion revolving credit facility from 2019 to 2020.
With the exception of private placement debt as presented above, the carrying amount of financial assets
and liabilities not measured at fair value is considered to be a reasonable approximation of fair value. There has been no change in the classification of financial assets and liabilities, the methods and
assumptions used in determining fair value and the categorisation of financial assets and liabilities within the fair value hierarchy from those disclosed in the annual report for the year ended 31 December 2014 other than the re-presentation of $98 million of prepayments and accrued income which are no longer presented as a financial asset.
18

8. Definitions of and reconciliation to measures included within ‘Trading results’
These financial statements include financial measures that are not prepared in accordance with IFRS. These measures, which include trading profit, trading profit margin, EPSA, trading cash flow and underlying growth, exclude the effect of certain cash and non-cash items that Group management believes are not related to the underlying performance of the Group. These non-IFRS financial measures are also used by management to make operating decisions because they facilitate internal comparisons of performance to historical results. Non-IFRS financial measures are presented in these financial statements as the Group’s management believe that they provide investors with a means of evaluating performance of the business segment and the consolidated Group on a consistent basis, similar to the way in which the Group’s management evaluates performance, that is not otherwise apparent on an IFRS basis, given that certain non-recurring, infrequent or non-cash items that management does not otherwise believe are indicative of the underlying performance of the consolidated Group may not be excluded when preparing financial measures under IFRS. These non-IFRS measures should not be considered in isolation from, as substitutes for, or superior to financial measures prepared in accordance with IFRS. Underlying revenue growth Underlying revenue growth is used to compare the revenue in a given period to the previous period on a like-for-like basis. Underlying revenue growth reconciles to reported revenue growth (see Note 2), the most directly comparable financial measure calculated in accordance with IFRS, by making adjustments for the effect of acquisitions and disposals and the impact of movements in exchange rates (currency impact), as described below. The effect of acquisitions and disposals measures the impact on revenue from newly acquired material business combinations and recent material business disposals. This is calculated by comparing the current year, constant currency actual revenue (which include acquisitions and exclude disposals from the relevant date of completion) with prior year, constant currency actual revenue, adjusted to include the results of acquisitions and exclude disposals for the commensurate period in the prior year. Currency impact measures the increase/decrease in revenue resulting from currency movements on non-US Dollar sales and is measured as the difference between: 1) the increase/decrease in current year revenue translated into US Dollars at the current year average rate and the prior year revenue translated at the prior year average rate; and 2) the increase/decrease being measured by translating current and prior year revenue into US Dollars using the constant fixed rate. Trading profit, trading profit margin and trading cash flow Trading profit and trading cash flow are trend measures, which present the long-term profitability of the Group excluding the impact of specific transactions that management considers affect the Group’s short-term profitability and cash flows. The Group has identified the following items, where material, as those to be excluded from operating profit and cash generated from operations when arriving at trading profit and trading cash flow, respectively: acquisition and disposal related items arising in connection with business combinations, including amortisation of acquisition intangible assets, impairments and integration costs; restructuring events; gains and losses resulting from legal disputes and uninsured losses. In addition to these items, gains or losses that materially impact the Group’s profitability or cash flows on a short-term or one-off basis are excluded from operating profit and cash generated from operations when arriving at trading profit and trading cash flow, respectively. Underlying growth in trading profit and trading profit margin (trading profit expressed as a percentage of revenue) are measures, which present the growth trend in the long-term profitability of the Group. Underlying growth in trading profit is used to compare the period-on-period growth in trading profit on a like-for-like basis. This is achieved by adjusting for the impact of material business combinations and disposals and for movements in exchange rates in the same manner as underlying revenue growth is determined, as described above. Adjusted earnings per ordinary share (‘EPSA’) EPSA is a trend measure which presents management’s long-term view of the profitability of the Group excluding the post-tax impact of specific transactions considered to affect the Group’s short-term profitability. The Group presents this measure to assist investors in their understanding of trends. Adjusted attributable profit is the numerator used for this measure and is determined by adjusting attributable profit for the items that are excluded from operating profit when arriving at trading profit and items that are recognised below operating profit that affect the Group’s short-term profitability. The most directly comparable financial measure calculated in accordance with IFRS is earnings per ordinary share (‘EPS’).
19
8. Definitions of and reconciliation to measures included within ‘Trading results’ (continued)
For the year to 31 December 2015
Trading results
2015
Acquisition related
costs
Restructuring & rationalisation
costs
Amortisation and impairment
of acquisition intangibles
Legal and
other
Capital
expenditure Reported
results 2015
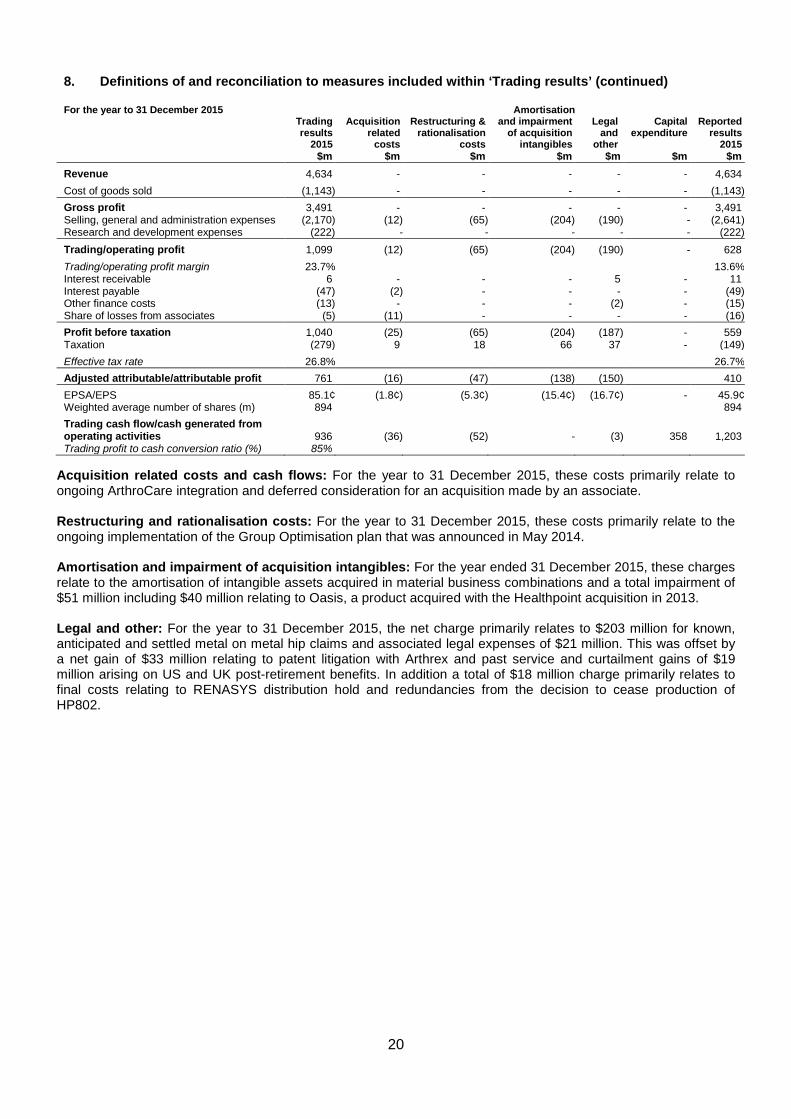
$m $m $m $m $m $m $m Revenue 4,634 - - - - - 4,634 Cost of goods sold (1,143) - - - - - (1,143) Gross profit 3,491 - - - - - 3,491 Selling, general and administration expenses (2,170) (12) (65) (204) (190) - (2,641) Research and development expenses (222) - - - - - (222) Trading/operating profit 1,099 (12) (65) (204) (190) - 628 Trading/operating profit margin 23.7% 13.6% Interest receivable 6 - - - 5 - 11 Interest payable (47) (2) - - - - (49) Other finance costs (13) - - - (2) - (15) Share of losses from associates (5) (11) - - - - (16) Profit before taxation 1,040 (25) (65) (204) (187) - 559 Taxation (279) 9 18 66 37 - (149) Effective tax rate 26.8% 26.7% Adjusted attributable/attributable profit 761 (16) (47) (138) (150) 410 EPSA/EPS 85.1¢ (1.8¢) (5.3¢) (15.4¢) (16.7¢) - 45.9¢ Weighted average number of shares (m) 894 894 Trading cash flow/cash generated from operating activities 936 (36) (52) - (3) 358 1,203 Trading profit to cash conversion ratio (%) 85%
Acquisition related costs and cash flows: For the year to 31 December 2015, these costs primarily relate to ongoing ArthroCare integration and deferred consideration for an acquisition made by an associate. Restructuring and rationalisation costs: For the year to 31 December 2015, these costs primarily relate to the ongoing implementation of the Group Optimisation plan that was announced in May 2014. Amortisation and impairment of acquisition intangibles: For the year ended 31 December 2015, these charges relate to the amortisation of intangible assets acquired in material business combinations and a total impairment of $51 million including $40 million relating to Oasis, a product acquired with the Healthpoint acquisition in 2013. Legal and other: For the year to 31 December 2015, the net charge primarily relates to $203 million for known, anticipated and settled metal on metal hip claims and associated legal expenses of $21 million. This was offset by a net gain of $33 million relating to patent litigation with Arthrex and past service and curtailment gains of $19 million arising on US and UK post-retirement benefits. In addition a total of $18 million charge primarily relates to final costs relating to RENASYS distribution hold and redundancies from the decision to cease production of HP802.
20
8. Definitions of and reconciliation to measures included within ‘Trading results’ (continued)
For the year to 31 December 2014
Trading results
2014
Acquisition related
costs
Restructuring & rationalisation
costs
Amortisation and impairment
of acquisition intangibles
Legal and
other
Capital
expenditure Reported
results 2014
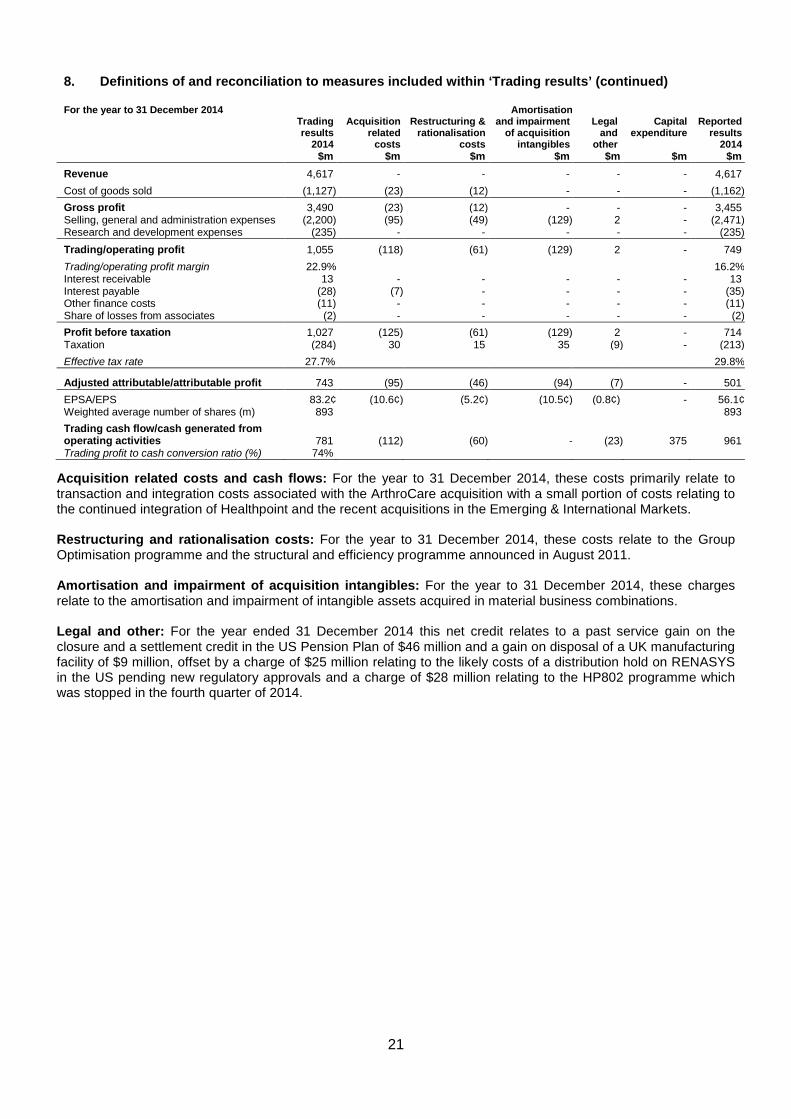
$m $m $m $m $m $m $m Revenue 4,617 - - - - - 4,617 Cost of goods sold (1,127) (23) (12) - - - (1,162) Gross profit 3,490 (23) (12) - - - 3,455 Selling, general and administration expenses (2,200) (95) (49) (129) 2 - (2,471) Research and development expenses (235) - - - - - (235) Trading/operating profit 1,055 (118) (61) (129) 2 - 749 Trading/operating profit margin 22.9% 16.2% Interest receivable 13 - - - - - 13 Interest payable (28) (7) - - - - (35) Other finance costs (11) - - - - - (11) Share of losses from associates (2) - - - - - (2) Profit before taxation 1,027 (125) (61) (129) 2 - 714 Taxation (284) 30 15 35 (9) - (213) Effective tax rate 27.7% 29.8% Adjusted attributable/attributable profit 743 (95) (46) (94) (7) - 501 EPSA/EPS 83.2¢ (10.6¢) (5.2¢) (10.5¢) (0.8¢) - 56.1¢ Weighted average number of shares (m) 893 893 Trading cash flow/cash generated from operating activities 781 (112) (60) - (23) 375 961 Trading profit to cash conversion ratio (%) 74%
Acquisition related costs and cash flows: For the year to 31 December 2014, these costs primarily relate to transaction and integration costs associated with the ArthroCare acquisition with a small portion of costs relating to the continued integration of Healthpoint and the recent acquisitions in the Emerging & International Markets. Restructuring and rationalisation costs: For the year to 31 December 2014, these costs relate to the Group Optimisation programme and the structural and efficiency programme announced in August 2011. Amortisation and impairment of acquisition intangibles: For the year to 31 December 2014, these charges relate to the amortisation and impairment of intangible assets acquired in material business combinations. Legal and other: For the year ended 31 December 2014 this net credit relates to a past service gain on the closure and a settlement credit in the US Pension Plan of $46 million and a gain on disposal of a UK manufacturing facility of $9 million, offset by a charge of $25 million relating to the likely costs of a distribution hold on RENASYS in the US pending new regulatory approvals and a charge of $28 million relating to the HP802 programme which was stopped in the fourth quarter of 2014.
21

9. Exchange rates The exchange rates used for the translation of currencies into US Dollars that have the most significant
impact on the Group results were:
31 December 31 December 2015 2014 $m $m
Average rates Sterling 1.53 1.65 Euro 1.11 1.33 Swiss Franc 1.04 1.09
Period-end rates Sterling 1.48 1.56 Euro 1.09 1.21 Swiss Franc 1.00 1.01
10. Post balance sheet event On 4 January the Group completed the acquisition of 100% of the share capital of Blue Belt Technologies, a
business specialising in robotic technologies for a total consideration of $279 million. This acquisition will be treated as a business combination under IFRS 3.
22