smith & nephew fourth quarter and full year 2017 results quarter a… · smith & nephew...
TRANSCRIPT

1
Smith & Nephew Fourth Quarter and Full Year 2017 Results 8 February 2018
Smith & Nephew plc (LSE:SN, NYSE:SNN) results for the Fourth Quarter and Full Year to 31 December 2017:
Reported Trading2 31 Dec 31 Dec Reported 31 Dec 31 Dec Underlying
2017 2016 growth 2017 2016 growth $m $m % $m $m %
Fourth Quarter Results1 Revenue 1,278 1,222 5 1,278 1,222 2
Full Year Results1 Revenue 4,765 4,669 2 4,765 4,669 3 Operating profit 934 801 Trading profit 1,048 1,020 Operating/trading profit margin (%) 19.6 17.2 22.0 21.8 EPS/ EPSA (cents) 87.8 88.1 94.5 82.6
2017 Full Year Highlights1
• Underlying revenue up 3% and trading profit margin up 20bps to 22.0%, in line with guidanceo Reported revenue growth of 2% is after -1% reduction from the disposal of
Gynaecology business in 2016 and no FX impacto Operating profit margin of 19.6%, up 240bps from more favourable non-trading items
• Performance driven by market-beating growth from Knee Implants and double-digit growth inEmerging Markets, offset by softness in AET and European Advanced Wound Care
• Trading cash flow of $940 million, up from $765 million in 2016, with higher trading profit tocash conversion ratio of 90%
• Tax rate on trading results reduced by 670bps to 17.1%, including benefit from one-off US taxsettlement (12.7% reported tax rate)
• EPSA up 14% to 94.5¢ reflecting improved trading and tax rate (EPS flat at 87.8¢)• ROIC4 improved 280bps to 14.3%• Full year dividend up 14% to 35.0¢ per share
Guidance1
• Revenue expected to increase 3%-4% underlying (around 7%-8% reported3)• Trading profit margin expected to improve by a further 30-70bps• Tax rate on trading results expected to be 20%-21% following US tax reform• Accelerating Performance and Execution (APEX) programme initiated to drive an annualised
benefit of $160 million by 2022 through better execution and efficiency for a one-off cost of$240 million
Olivier Bohuon, Chief Executive Officer of Smith & Nephew, said:
“We delivered on our promises to improve the top and bottom line in 2017. Our Knee Implants franchise delivered a standout performance and we returned to double-digit growth in the Emerging Markets. Our healthy balance sheet, good cash generation and increased dividend demonstrate the robust foundations underpinning our business.
“In 2018 I expect Smith & Nephew to build on 2017 by delivering another year of improved performance driven by our strong product portfolio and pipeline of innovative products.
“Looking further ahead, our greater focus on commercial execution gives us confidence we will outgrow our markets and the new APEX programme supports our expectation of improved trading profit margin.”
2
Analyst conference call An analyst meeting and conference call to discuss Smith & Nephew’s results for the year ended 31 December 2017 will be held today, Thursday 8 February 2018 at 9:00am GMT / 4:00am EST. This will be webcast live and available for replay shortly after. The details can be found on the Smith & Nephew website at www.smith-nephew.com/results. Enquiries Investors Ingeborg Øie +44 (0) 20 7960 2285 Smith & Nephew Media Charles Reynolds +44 (0) 20 7401 7646 Smith & Nephew Ben Atwell / Simon Conway +44 (0) 20 3727 1000 FTI Consulting Notes
1. Unless otherwise specified as ‘reported’ all revenue growth throughout this document is ‘underlying’ after adjusting for the effects
of currency translation and including the comparative impact of acquisitions and excluding disposals. All percentages compare to the equivalent 2016 period.
Underlying revenue growth is used to compare the revenue in a given period to the comparative period on a like-for-like basis. Underlying revenue growth reconciles to reported revenue growth, the most directly comparable financial measure calculated in accordance with IFRS, by making adjustments for the effect of acquisitions and disposals and the impact of movements in exchange rates (currency impact), as described below.
The effect of acquisitions and disposals measures the impact on revenue from newly acquired business combinations and recent business disposals. This is calculated by comparing the current year, constant currency actual revenue (which include acquisitions and exclude disposals from the relevant date of completion) with prior year, constant currency actual revenue, adjusted to include the results of acquisitions and exclude disposals for the commensurate period in the prior year.
Currency impact measures the increase/decrease in revenue resulting from currency movements on non-US Dollar sales and is measured as the difference between: 1) the increase/decrease in current year revenue translated into US Dollars at the current year average rate and the prior year revenue translated at the prior year average rate; and 2) the increase/decrease being measured by translating current and prior year revenue into US Dollars using a constant fixed rate.
2. Certain items included in ‘trading results’, such as trading profit, trading profit margin, tax rate on trading results, trading cash flow, trading profit to cash conversion ratio, EPSA and underlying growth are non-IFRS financial measures. The non-IFRS financial measures reported in this announcement are explained in Note 9 and are reconciled to the most directly comparable financial measure prepared in accordance with IFRS. Reported results represent IFRS financial measures as shown in the Condensed Consolidated Financial Statements.
3. Reported growth rate assumes exchange rates prevailing at 2 February 2018.
4. Return On Invested Capital (ROIC) is defined on page 95 of Smith & Nephew’s 2016 Annual Report.
3
Smith & Nephew Fourth Quarter Trading and Full Year 2017 Results Review of 2017 Group revenue for the Full Year 2017 was $4,765 million (2016: $4,669 million), an increase of 3% on an underlying basis, in line with guidance. The 2% reported growth rate includes a -1% reduction from the disposal of the Gynaecology business in 2016 and there was no impact from foreign exchange. In 2011 we set five strategic priorities that have shaped a fundamental management and operational restructuring of the Group as a foundation to improving its growth and profit profile. Through these priorities we seek to drive our commercial execution in the Established and Emerging Markets, invest in innovation that drives value, simplify and improve our operating model, and supplement organic growth through acquisitions. Commercial execution At a global franchise level, the highlights were Knee Implants, with revenue up 5% beating the 2% market growth rate, and Trauma and Extremities, up 4%, a notable improvement on 2016. Advanced Wound Management revenue was up 2%, with 13% revenue growth from Advanced Wound Devices partially offset by soft European Advanced Wound Care performance. Arthroscopic Enabling Technologies (AET) revenue was down -3%, but we expect performance to gradually improve during 2018 as we complete the full market rollout of new COBLATION◊ and camera systems. In our Established Markets revenue was up 1% in 2017. Within this, our business in the United States, representing 48% of global revenue, grew 2%. Other Established Markets growth was flat. Our Emerging Markets business, which now represent 16% of global revenue, delivered 12% revenue growth in 2017, a significant improvement over the flat performance of 2016. In China, our largest Emerging Markets country, we delivered double-digit revenue growth through better execution and channel management. In the oil-dependent Gulf States we returned to growth by focusing on securing more private healthcare business to compensate for the reduction in government tenders. We are well positioned to continue to drive strong growth from the Emerging Markets over the medium term. Innovating for Value Our strong new product portfolio reflects our decision of a few years ago to increase investment in R&D and technology acquisitions. In robotics, NAVIO◊ is a unique and compelling proposition and we are successfully extending its indications and taking it to new geographies, such as India. We launched the total knee arthroplasty (TKA) application and completed the world’s first robotics-assisted bi-cruciate retaining total knee replacement procedures using the new JOURNEY◊ II XR. In the Emerging Markets we continued to build our mid-tier portfolio. We extended the ANTHEM◊ Total Knee System and ORTHOMATCH◊ Universal Instrumentation Platform into more markets, including Russia and Saudi Arabia, and introduced a new Cruciate Retaining (CR) variant. We are also focusing on building a greater evidence-base to demonstrate the clinical and health economic effectiveness of our products. In 2017 PICO◊ benefited from new clinical evidence showing its effectiveness at reducing the incidence of surgical site infections. Our TRIGEN◊ INTERTAN◊ hip fracture system also performed strongly supported by new clinical evidence.
4
The new EU Medical Device Regulations came into force in 2017 and will apply from May 2020 after a transitional period of three years. We are working to implement the requirements, notably as regards clinical evidence and other data to support existing products and new product launches. We expect to incur costs associated with implementation during this period which will be recorded outside trading profit owing to their scale and one-off nature.
Finally, we continue to develop new business models to address changing or unmet customer needs. During 2017 we ran the first study of our innovative Episode of Care Assurance Program (eCAP◊) that combines our hip and knee implants with PICO and ACTICOAT◊ Flex 7 Antimicrobial Barrier Dressings. The first results showed eCAP delivering a 97% decrease in hospital readmission rates following total joint replacement surgery (based on 1,380 joint arthroplasties with only two readmissions, a readmission rate of only 0.145% as compared to published rates of 5.3% or more).
Delivering compelling acquisitions
During the year we strengthened our technology and product portfolio further with the acquisition of Rotation Medical, the developer of a novel tissue regeneration technology for shoulder rotator cuff repair. Its bioinductive implant is highly complementary to our Sports Medicine portfolio, serving an unmet clinical need and providing a compelling new treatment option for our customers.
In addition to this acquisition, in 2017 we also signed agreements to distribute two exciting technologies: a unique wireless patient monitoring system for pressure ulcer/injury prevention in the US from Leaf Healthcare; and MolecuLight i:XTM, a handheld point-of-care imaging device that uses fluorescence imaging to display potentially harmful concentrations of bacteria in wounds in real-time.
Accelerating Performance and Execution programme (APEX)
As announced with our Third Quarter 2017 Results, we believe that we now have the appropriate Group structure to allow us to strengthen our competitive position by driving further opportunities to accelerate performance through better execution, while at the same time realising more savings through greater efficiency.
We have completed our assessment of these opportunities and started to implement a programme called APEX - Accelerating Performance and Execution.
APEX is expected to deliver an annualised benefit of $160 million by 2022, with around three-quarters of this expected by 2020, for a one-off cash cost of up to $240 million, of which a charge of around $100 million is expected in 2018.
APEX has three workstreams: 1. Manufacturing, Warehousing and Distribution
We have already made significant improvements over the last two years, and see further opportunities to simplify in line with best practices to reduce overall cost, while improving quality and delivery through:
• A best practice facility footprint with larger manufacturing hubs supported by speciality facilitieswhere appropriate
• A product portfolio that meets the needs of our customers and complies with regulations, whileminimising cost, complexity and inventory
• A supply chain that is streamlined and efficient so that we are positioned to achieve the highestlevels of delivery at benchmark cost
5
2. General and Administrative (G&A) Expenses
We have improved our G&A expense ratio over the last five years, but with our global function structure we are now able to identify additional areas of opportunity to reduce costs and improve service through:
• Best-in-class Global Business Services that includes a full-spectrum of support services delivered quickly and efficiently, enabling full focus on our customers and business objectives
• Service hubs in locations that align to our regional needs and deliver the best value for money • System infrastructure that drives maximum efficiency, including rationalisation of legacy IT
systems and adopting a ‘cloud-first’ strategy
3. Commercial Effectiveness
Whilst the commercial opportunities and competitive environment continue to evolve with changing customer expectations, new go-to-market approaches and price pressure, we expect to improve overall productivity and accelerate top line growth through:
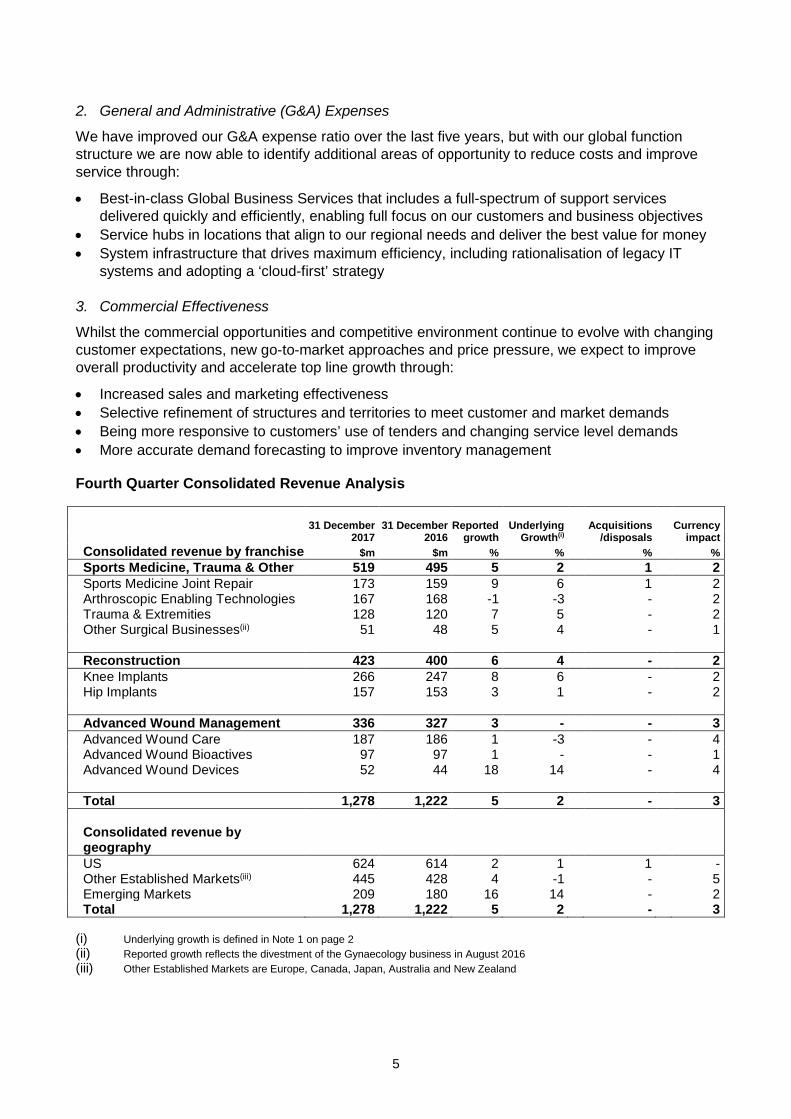
• Increased sales and marketing effectiveness • Selective refinement of structures and territories to meet customer and market demands • Being more responsive to customers’ use of tenders and changing service level demands • More accurate demand forecasting to improve inventory management Fourth Quarter Consolidated Revenue Analysis
31 December 31 December Reported Underlying Acquisitions
Currency
2017 2016 growth Growth(i) /disposals impact Consolidated revenue by franchise $m $m % % % % Sports Medicine, Trauma & Other 519 495 5 2 1 2 Sports Medicine Joint Repair 173 159 9 6 1 2 Arthroscopic Enabling Technologies 167 168 -1 -3 - 2 Trauma & Extremities 128 120 7 5 - 2 Other Surgical Businesses(ii) 51 48 5 4 - 1 Reconstruction 423 400 6 4 - 2 Knee Implants 266 247 8 6 - 2 Hip Implants 157 153 3 1 - 2 Advanced Wound Management 336 327 3 - - 3 Advanced Wound Care 187 186 1 -3 - 4 Advanced Wound Bioactives 97 97 1 - - 1 Advanced Wound Devices 52 44 18 14 - 4 Total 1,278 1,222 5 2 - 3 Consolidated revenue by geography US 624 614 2 1 1 - Other Established Markets(iii) 445 428 4 -1 - 5 Emerging Markets 209 180 16 14 - 2 Total 1,278 1,222 5 2 - 3
(i) Underlying growth is defined in Note 1 on page 2 (ii) Reported growth reflects the divestment of the Gynaecology business in August 2016 (iii) Other Established Markets are Europe, Canada, Japan, Australia and New Zealand
6
Fourth Quarter 2017 Trading Update Our Q4 revenue was $1,278 million (2016: $1,222 million), up 5% on a reported basis including a foreign exchange tailwind of 3%. Excluding this, underlying revenue growth was 2% in the quarter. The fourth quarter 2017 comprised 60 trading days, in line with the same period of 2016. Fourth Quarter 2017 Franchise Highlights Sports Medicine Joint Repair delivered 6% revenue growth in the quarter driven by a good performance from our shoulder repair portfolio. Revenue from Arthroscopic Enabling Technologies was down -3% as the softness in resection seen in previous quarters continued. We expect growth from the newer WEREWOLF◊ COBLATION and LENS◊ visualisation systems to offset the drag from legacy resection increasingly through 2018. In Trauma & Extremities we grew revenue by 5%. This included strong growth from the Emerging Markets, despite not benefitting from Middle East tenders, as our recently launched ATLAS◊ nail was well received. The INTERTAN nail continues to attract new customers in Established Markets, supported by its excellent clinical evidence. Our Other Surgical Businesses franchise delivered revenue growth of 4% in the quarter. This included another good quarter from our Ear, Nose & Throat (ENT) business and continued growth in our robotics NAVIO Surgical System, including further sales in the US, Asia-Pacific and Europe. We delivered 4% revenue growth across our Reconstruction business in the quarter, completing an excellent second half of 2017. This was led by Knee Implants, where revenue was up 6% as JOURNEY II continued to drive growth, as did recent additions to the LEGION◊ Revision Knee System. Our Hip Implants franchise delivered consecutive quarters of growth, up 1%, as we benefited from the new REDAPT◊ Revision and POLARSTEM◊ Cementless Stem systems. Advanced Wound Care revenue was down -3%. End-market demand remained broadly consistent with previous quarters, with the exception of the UK, where we have subsequently adapted our business. Advanced Wound Bioactives revenue was flat in the quarter. As expected SANTYL◊ delivered growth in the second half of the year and the reimbursement environment for OASIS® remained a headwind for the franchise. Advanced Wound Devices finished the year strongly, as we delivered 14% revenue growth in the quarter driven by the continued success of our single-use disposable negative pressure wound therapy (sNPWT) device PICO. Fourth Quarter Regional Performance In the US revenue was up 1% in fourth quarter, but down -1% across our Other Established Markets. Revenue growth was 14% across the Emerging Markets.
7
Full Year 2017 Results Smith & Nephew results for the Full Year ended 31 December 2017:
Reported 2017 2016 growth $m $m %
Revenue 4,765 4,669 2 Operating profit 934 801 17 Acquisition and disposal related items (10) 9 Restructuring and rationalisation costs - 62 Amortisation and impairment of acquisition intangibles 140 178 Legal and other (16) (30) Trading profit (non-IFRS) 1,048 1,020 3 ¢ ¢ Earnings per share “EPS” 87.8 88.1 - Acquisition and disposal related items (0.9) (22.2) Restructuring and rationalisation costs - 5.4 Amortisation and impairment of acquisition intangibles 11.4 13.4 Legal and other (0.1) (2.1) US tax reform (3.7) - Adjusted Earnings per share “EPSA” 94.5 82.6 14
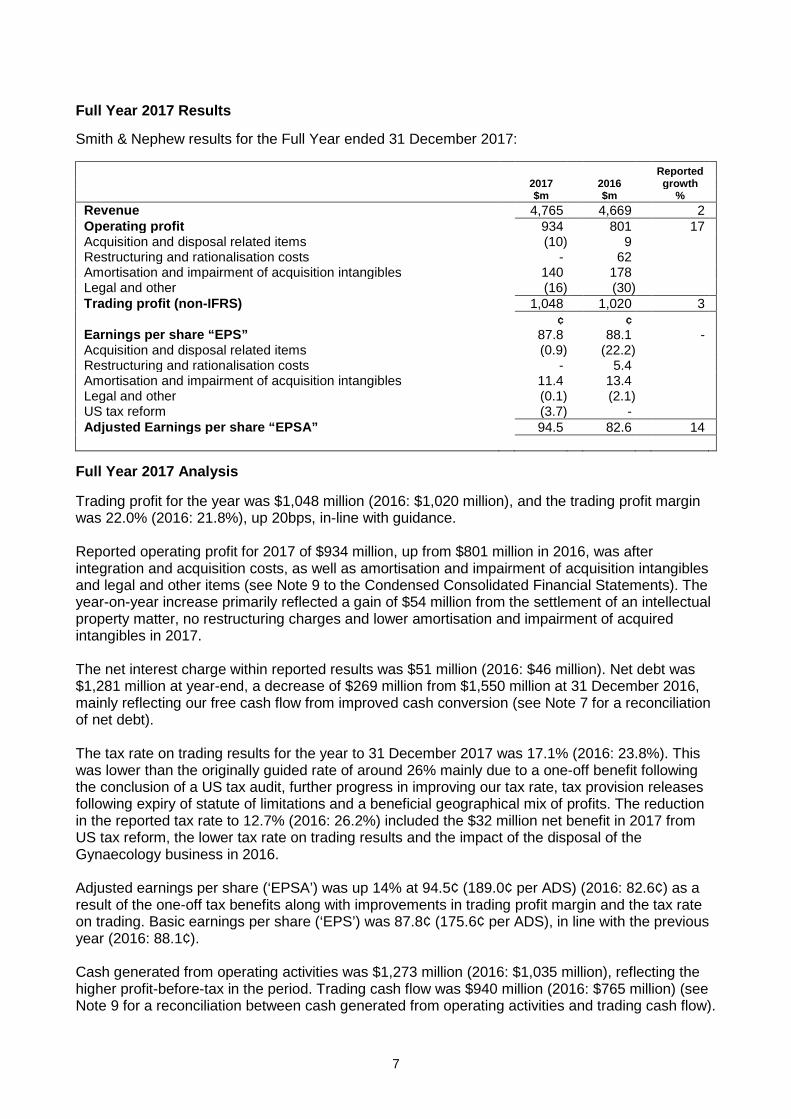
Full Year 2017 Analysis Trading profit for the year was $1,048 million (2016: $1,020 million), and the trading profit margin was 22.0% (2016: 21.8%), up 20bps, in-line with guidance. Reported operating profit for 2017 of $934 million, up from $801 million in 2016, was after integration and acquisition costs, as well as amortisation and impairment of acquisition intangibles and legal and other items (see Note 9 to the Condensed Consolidated Financial Statements). The year-on-year increase primarily reflected a gain of $54 million from the settlement of an intellectual property matter, no restructuring charges and lower amortisation and impairment of acquired intangibles in 2017. The net interest charge within reported results was $51 million (2016: $46 million). Net debt was $1,281 million at year-end, a decrease of $269 million from $1,550 million at 31 December 2016, mainly reflecting our free cash flow from improved cash conversion (see Note 7 for a reconciliation of net debt). The tax rate on trading results for the year to 31 December 2017 was 17.1% (2016: 23.8%). This was lower than the originally guided rate of around 26% mainly due to a one-off benefit following the conclusion of a US tax audit, further progress in improving our tax rate, tax provision releases following expiry of statute of limitations and a beneficial geographical mix of profits. The reduction in the reported tax rate to 12.7% (2016: 26.2%) included the $32 million net benefit in 2017 from US tax reform, the lower tax rate on trading results and the impact of the disposal of the Gynaecology business in 2016. Adjusted earnings per share (‘EPSA’) was up 14% at 94.5¢ (189.0¢ per ADS) (2016: 82.6¢) as a result of the one-off tax benefits along with improvements in trading profit margin and the tax rate on trading. Basic earnings per share (‘EPS’) was 87.8¢ (175.6¢ per ADS), in line with the previous year (2016: 88.1¢). Cash generated from operating activities was $1,273 million (2016: $1,035 million), reflecting the higher profit-before-tax in the period. Trading cash flow was $940 million (2016: $765 million) (see Note 9 for a reconciliation between cash generated from operating activities and trading cash flow).
8
The trading profit to cash conversion ratio was 90% (2016: 75%), an improvement driven primarily by working capital management. As the result of the improved operating profit and a stable asset base we saw an increase in Return On Invested Capital (ROIC) from 11.5% in 2016 to 14.3% in 2017. Dividend The Board is pleased to recommend a Final Dividend of 22.7¢ per share (45.4¢ per ADS). This, together with an Interim Dividend of 12.3¢ per share (24.6¢ per ADS), will give a total distribution of 35.0¢ per share (70.0¢ per ADS) in 2017. The 14% year-on-year growth in the declared full year dividend reflects the strong growth in adjusted earnings per share. The Final Dividend will be paid on 9 May 2018 to shareholders on the register at the close of business on 6 April 2018. Outlook We expect the overall dynamics in our markets to be similar in 2018 to those seen in 2017. Against this backdrop, the Group expects to continue to build on 2017 and again deliver an improved performance in 2018 driven by our strong product portfolio and pipeline of innovative products. In terms of revenue, we expect our underlying growth to be in the range of 3% to 4%. On a reported basis this equates to a range of around 7% to 8% at exchange rates prevailing on 2 February 2018 and including the impact of the Rotation Medical acquisition. In terms of trading profit margin, in 2018 we expect to drive a further 30-70bps improvement over the previous year. As a result of the recently enacted US tax reform, we expect a tax rate on trading results in the range 20% to 21%, barring any changes to tax legislation or other one-off items. Our healthy balance sheet, good cash generation and increased dividend demonstrate the robust foundations underpinning our business. Looking further ahead, our greater focus on commercial execution gives us confidence we will outgrow our markets and the new APEX programme supports our expectation of improved trading profit margin.
9
Forward calendar The Q1 Trading Report will be released on 3 May 2018. About Smith & Nephew Smith & Nephew is a global medical technology business dedicated to supporting healthcare professionals in their daily efforts to improve the lives of their patients. With leadership positions in Orthopaedic Reconstruction, Advanced Wound Management, Sports Medicine and Trauma & Extremities, Smith & Nephew has more than 15,000 employees and a presence in more than 100 countries. Annual sales in 2017 were $4.8 billion. Smith & Nephew is a member of the FTSE100 (LSE:SN, NYSE:SNN). For more information about Smith & Nephew, please visit our corporate website www.smith-nephew.com, follow @SmithNephewplc on Twitter or visit SmithNephewplc on Facebook.com. Forward-looking Statements This document may contain forward-looking statements that may or may not prove accurate. For example, statements regarding expected revenue growth and trading margins, market trends and our product pipeline are forward-looking statements. Phrases such as "aim", "plan", "intend", "anticipate", "well-placed", "believe", "estimate", "expect", "target", "consider" and similar expressions are generally intended to identify forward-looking statements. Forward-looking statements involve known and unknown risks, uncertainties and other important factors that could cause actual results to differ materially from what is expressed or implied by the statements. For Smith & Nephew, these factors include: economic and financial conditions in the markets we serve, especially those affecting health care providers, payers and customers; price levels for established and innovative medical devices; developments in medical technology; regulatory approvals, reimbursement decisions or other government actions; product defects or recalls or other problems with quality management systems or failure to comply with related regulations; litigation relating to patent or other claims; legal compliance risks and related investigative, remedial or enforcement actions; disruption to our supply chain or operations or those of our suppliers; competition for qualified personnel; strategic actions, including acquisitions and dispositions, our success in performing due diligence, valuing and integrating acquired businesses; disruption that may result from transactions or other changes we make in our business plans or organisation to adapt to market developments; and numerous other matters that affect us or our markets, including those of a political, economic, business, competitive or reputational nature. Please refer to the documents that Smith & Nephew has filed with the U.S. Securities and Exchange Commission under the U.S. Securities Exchange Act of 1934, as amended, including Smith & Nephew's most recent annual report on Form 20-F, for a discussion of certain of these factors. Any forward-looking statement is based on information available to Smith & Nephew as of the date of the statement. All written or oral forward-looking statements attributable to Smith & Nephew are qualified by this caution. Smith & Nephew does not undertake any obligation to update or revise any forward-looking statement to reflect any change in circumstances or in Smith & Nephew's expectations. ◊ Trademark of Smith & Nephew. Certain marks registered US Patent and Trademark Office.
10
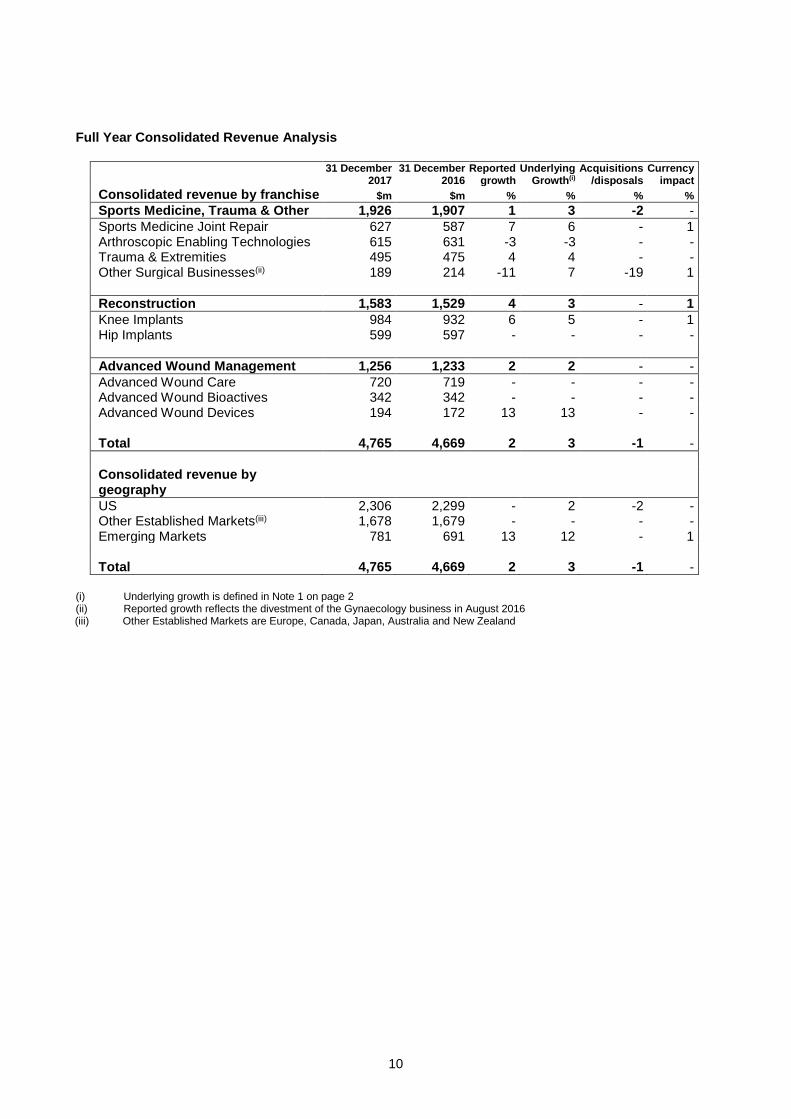
Full Year Consolidated Revenue Analysis
31 December 31 December Reported Underlying Acquisitions Currency 2017 2016 growth Growth(i) /disposals impact Consolidated revenue by franchise $m $m % % % % Sports Medicine, Trauma & Other 1,926 1,907 1 3 -2 - Sports Medicine Joint Repair 627 587 7 6 - 1 Arthroscopic Enabling Technologies 615 631 -3 -3 - - Trauma & Extremities 495 475 4 4 - - Other Surgical Businesses(ii) 189 214 -11 7 -19 1 Reconstruction 1,583 1,529 4 3 - 1 Knee Implants 984 932 6 5 - 1 Hip Implants 599 597 - - - - Advanced Wound Management 1,256 1,233 2 2 - - Advanced Wound Care 720 719 - - - - Advanced Wound Bioactives 342 342 - - - - Advanced Wound Devices 194 172 13 13 - - Total 4,765 4,669 2 3 -1 - Consolidated revenue by geography US 2,306 2,299 - 2 -2 - Other Established Markets(iii) 1,678 1,679 - - - - Emerging Markets 781 691 13 12 - 1 Total 4,765 4,669 2 3 -1 -
(i) Underlying growth is defined in Note 1 on page 2 (ii) Reported growth reflects the divestment of the Gynaecology business in August 2016 (iii) Other Established Markets are Europe, Canada, Japan, Australia and New Zealand
11
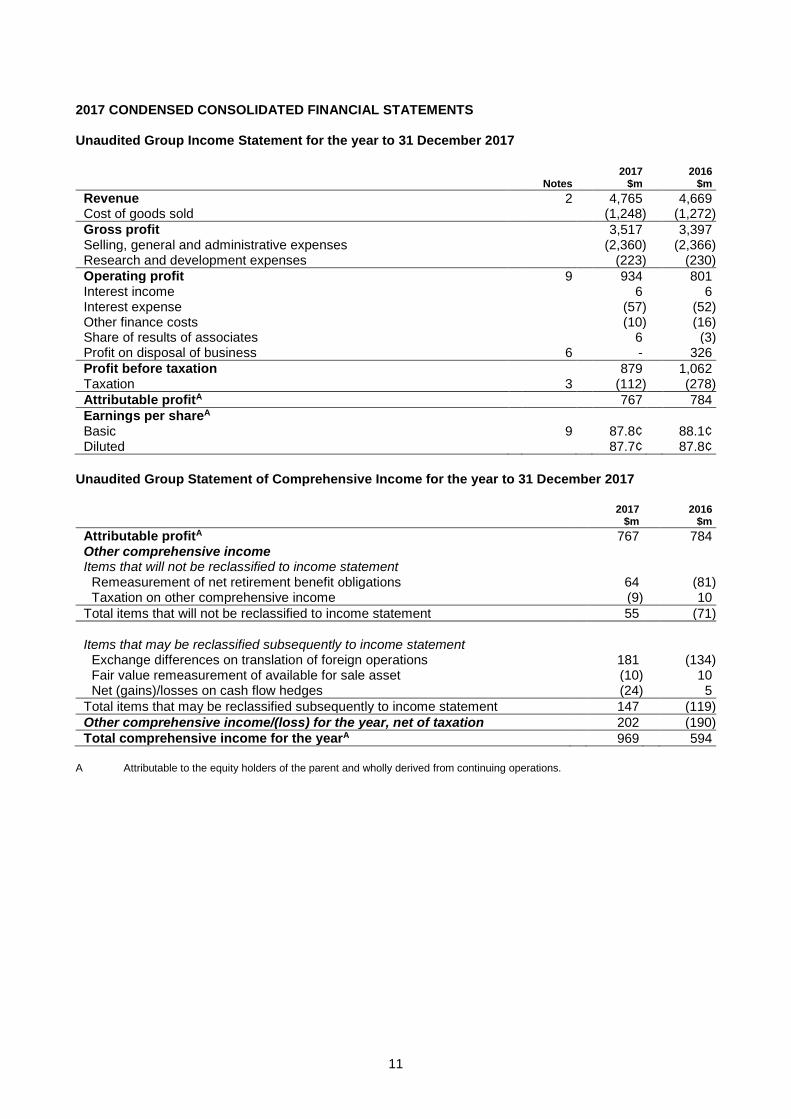
2017 CONDENSED CONSOLIDATED FINANCIAL STATEMENTS Unaudited Group Income Statement for the year to 31 December 2017
2017 2016 Notes $m $m
Revenue 2 4,765 4,669 Cost of goods sold (1,248) (1,272) Gross profit 3,517 3,397 Selling, general and administrative expenses (2,360) (2,366) Research and development expenses (223) (230) Operating profit 9 934 801 Interest income 6 6 Interest expense (57) (52) Other finance costs (10) (16) Share of results of associates 6 (3) Profit on disposal of business 6 - 326 Profit before taxation 879 1,062 Taxation 3 (112) (278) Attributable profitA 767 784 Earnings per shareA Basic 9 87.8¢ 88.1¢ Diluted 87.7¢ 87.8¢
Unaudited Group Statement of Comprehensive Income for the year to 31 December 2017
2017 2016 $m $m
Attributable profitA 767 784 Other comprehensive income Items that will not be reclassified to income statement
Remeasurement of net retirement benefit obligations 64 (81) Taxation on other comprehensive income (9) 10
Total items that will not be reclassified to income statement 55 (71) Items that may be reclassified subsequently to income statement
Exchange differences on translation of foreign operations 181 (134) Fair value remeasurement of available for sale asset (10) 10 Net (gains)/losses on cash flow hedges (24) 5
Total items that may be reclassified subsequently to income statement 147 (119) Other comprehensive income/(loss) for the year, net of taxation 202 (190) Total comprehensive income for the yearA 969 594
A Attributable to the equity holders of the parent and wholly derived from continuing operations.
12
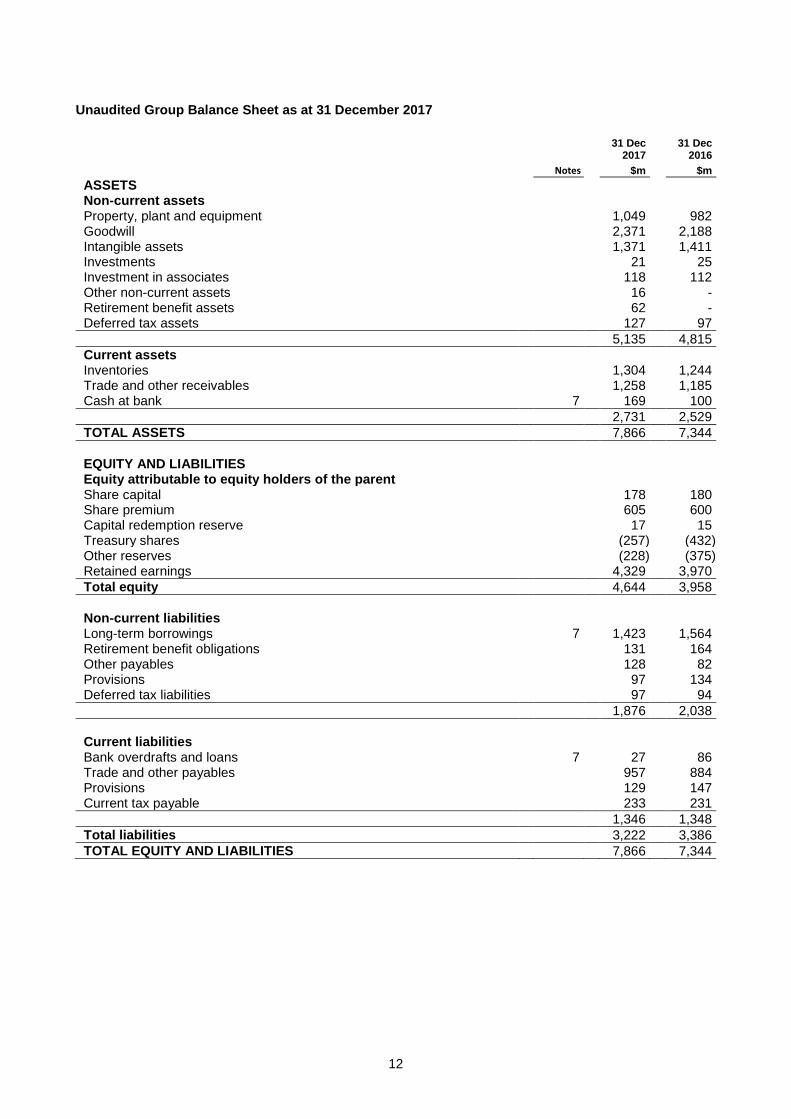
Unaudited Group Balance Sheet as at 31 December 2017
31 Dec 31 Dec 2017 2016 Notes $m $m
ASSETS Non-current assets Property, plant and equipment 1,049 982 Goodwill 2,371 2,188 Intangible assets 1,371 1,411 Investments 21 25 Investment in associates 118 112 Other non-current assets 16 - Retirement benefit assets 62 - Deferred tax assets 127 97 5,135 4,815 Current assets Inventories 1,304 1,244 Trade and other receivables 1,258 1,185 Cash at bank 7 169 100 2,731 2,529 TOTAL ASSETS 7,866 7,344 EQUITY AND LIABILITIES Equity attributable to equity holders of the parent Share capital 178 180 Share premium 605 600 Capital redemption reserve 17 15 Treasury shares (257) (432) Other reserves (228) (375) Retained earnings 4,329 3,970 Total equity 4,644 3,958 Non-current liabilities Long-term borrowings 7 1,423 1,564 Retirement benefit obligations 131 164 Other payables 128 82 Provisions 97 134 Deferred tax liabilities 97 94 1,876 2,038 Current liabilities Bank overdrafts and loans 7 27 86 Trade and other payables 957 884 Provisions 129 147 Current tax payable 233 231 1,346 1,348 Total liabilities 3,222 3,386 TOTAL EQUITY AND LIABILITIES 7,866 7,344
13
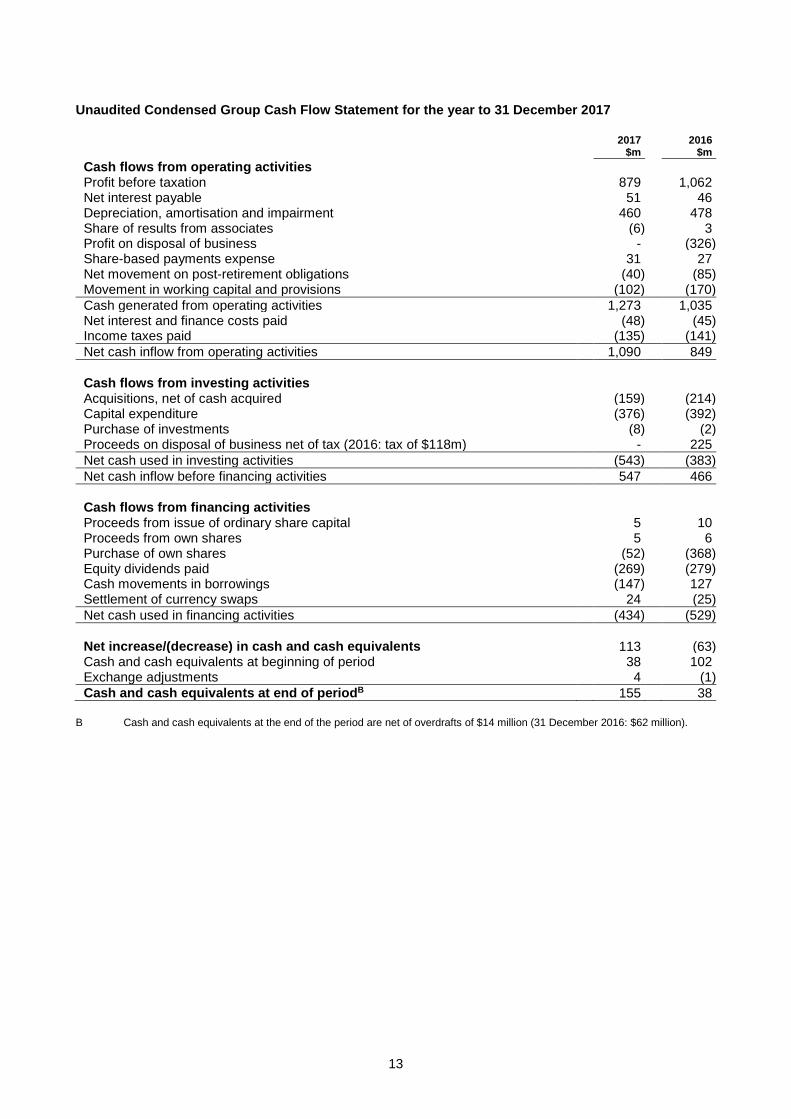
Unaudited Condensed Group Cash Flow Statement for the year to 31 December 2017
2017 2016 $m $m
Cash flows from operating activities Profit before taxation 879 1,062 Net interest payable 51 46 Depreciation, amortisation and impairment 460 478 Share of results from associates (6) 3 Profit on disposal of business - (326) Share-based payments expense 31 27 Net movement on post-retirement obligations (40) (85) Movement in working capital and provisions (102) (170) Cash generated from operating activities 1,273 1,035 Net interest and finance costs paid (48) (45) Income taxes paid (135) (141) Net cash inflow from operating activities 1,090 849 Cash flows from investing activities Acquisitions, net of cash acquired (159) (214) Capital expenditure (376) (392) Purchase of investments (8) (2) Proceeds on disposal of business net of tax (2016: tax of $118m) - 225 Net cash used in investing activities (543) (383) Net cash inflow before financing activities 547 466 Cash flows from financing activities Proceeds from issue of ordinary share capital 5 10 Proceeds from own shares 5 6 Purchase of own shares (52) (368) Equity dividends paid (269) (279) Cash movements in borrowings (147) 127 Settlement of currency swaps 24 (25) Net cash used in financing activities (434) (529) Net increase/(decrease) in cash and cash equivalents 113 (63) Cash and cash equivalents at beginning of period 38 102 Exchange adjustments 4 (1) Cash and cash equivalents at end of periodB 155 38
B Cash and cash equivalents at the end of the period are net of overdrafts of $14 million (31 December 2016: $62 million).
14
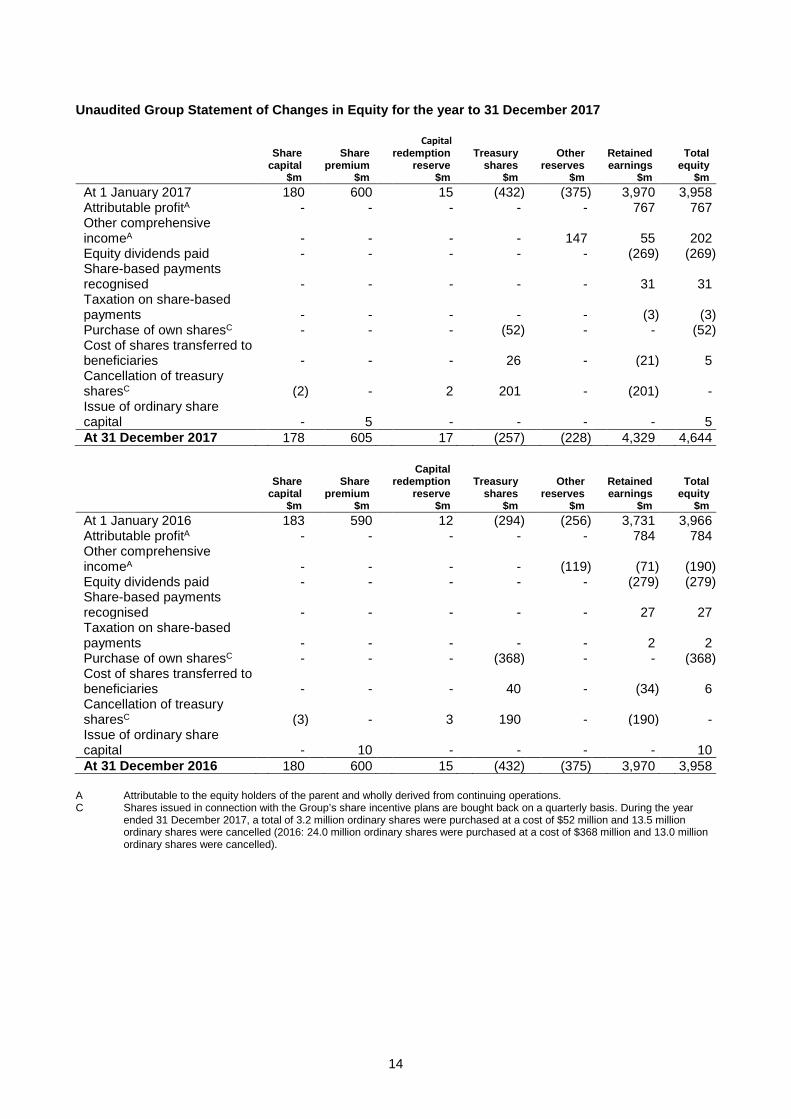
Unaudited Group Statement of Changes in Equity for the year to 31 December 2017
Capital Share Share redemption Treasury Other Retained Total capital premium reserve shares reserves earnings equity
$m $m $m $m $m $m $m At 1 January 2017 180 600 15 (432) (375) 3,970 3,958 Attributable profitA - - - - - 767 767 Other comprehensive incomeA - - - - 147 55 202 Equity dividends paid - - - - - (269) (269) Share-based payments recognised - - - - - 31 31 Taxation on share-based payments - - - - - (3) (3) Purchase of own sharesC - - - (52) - - (52) Cost of shares transferred to beneficiaries - - - 26 - (21) 5 Cancellation of treasury sharesC (2) - 2 201 - (201) - Issue of ordinary share capital - 5 - - - - 5 At 31 December 2017 178 605 17 (257) (228) 4,329 4,644
Capital Share Share redemption Treasury Other Retained Total capital premium reserve shares reserves earnings equity $m $m $m $m $m $m $m
At 1 January 2016 183 590 12 (294) (256) 3,731 3,966 Attributable profitA - - - - - 784 784 Other comprehensive incomeA - - - - (119) (71) (190) Equity dividends paid - - - - - (279) (279) Share-based payments recognised - - - - - 27 27 Taxation on share-based payments - - - - - 2 2 Purchase of own sharesC - - - (368) - - (368) Cost of shares transferred to beneficiaries - - - 40 - (34) 6 Cancellation of treasury sharesC (3) - 3 190 - (190) - Issue of ordinary share capital - 10 - - - - 10 At 31 December 2016 180 600 15 (432) (375) 3,970 3,958
A Attributable to the equity holders of the parent and wholly derived from continuing operations. C Shares issued in connection with the Group’s share incentive plans are bought back on a quarterly basis. During the year
ended 31 December 2017, a total of 3.2 million ordinary shares were purchased at a cost of $52 million and 13.5 million ordinary shares were cancelled (2016: 24.0 million ordinary shares were purchased at a cost of $368 million and 13.0 million ordinary shares were cancelled).
15
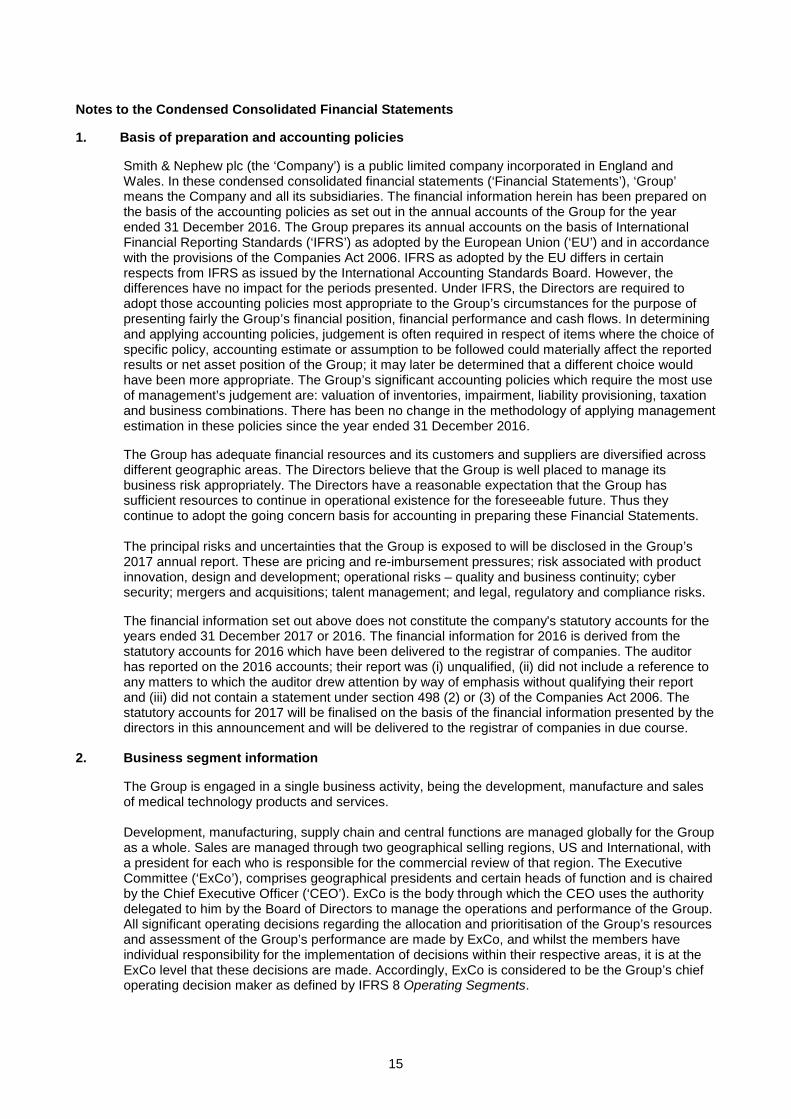
Notes to the Condensed Consolidated Financial Statements 1. Basis of preparation and accounting policies
Smith & Nephew plc (the ‘Company’) is a public limited company incorporated in England and Wales. In these condensed consolidated financial statements (‘Financial Statements’), ‘Group’ means the Company and all its subsidiaries. The financial information herein has been prepared on the basis of the accounting policies as set out in the annual accounts of the Group for the year ended 31 December 2016. The Group prepares its annual accounts on the basis of International Financial Reporting Standards (‘IFRS’) as adopted by the European Union (‘EU’) and in accordance with the provisions of the Companies Act 2006. IFRS as adopted by the EU differs in certain respects from IFRS as issued by the International Accounting Standards Board. However, the differences have no impact for the periods presented. Under IFRS, the Directors are required to adopt those accounting policies most appropriate to the Group’s circumstances for the purpose of presenting fairly the Group’s financial position, financial performance and cash flows. In determining and applying accounting policies, judgement is often required in respect of items where the choice of specific policy, accounting estimate or assumption to be followed could materially affect the reported results or net asset position of the Group; it may later be determined that a different choice would have been more appropriate. The Group’s significant accounting policies which require the most use of management’s judgement are: valuation of inventories, impairment, liability provisioning, taxation and business combinations. There has been no change in the methodology of applying management estimation in these policies since the year ended 31 December 2016. The Group has adequate financial resources and its customers and suppliers are diversified across different geographic areas. The Directors believe that the Group is well placed to manage its business risk appropriately. The Directors have a reasonable expectation that the Group has sufficient resources to continue in operational existence for the foreseeable future. Thus they continue to adopt the going concern basis for accounting in preparing these Financial Statements. The principal risks and uncertainties that the Group is exposed to will be disclosed in the Group’s 2017 annual report. These are pricing and re-imbursement pressures; risk associated with product innovation, design and development; operational risks – quality and business continuity; cyber security; mergers and acquisitions; talent management; and legal, regulatory and compliance risks.
The financial information set out above does not constitute the company's statutory accounts for the years ended 31 December 2017 or 2016. The financial information for 2016 is derived from the statutory accounts for 2016 which have been delivered to the registrar of companies. The auditor has reported on the 2016 accounts; their report was (i) unqualified, (ii) did not include a reference to any matters to which the auditor drew attention by way of emphasis without qualifying their report and (iii) did not contain a statement under section 498 (2) or (3) of the Companies Act 2006. The statutory accounts for 2017 will be finalised on the basis of the financial information presented by the directors in this announcement and will be delivered to the registrar of companies in due course.
2. Business segment information
The Group is engaged in a single business activity, being the development, manufacture and sales of medical technology products and services. Development, manufacturing, supply chain and central functions are managed globally for the Group as a whole. Sales are managed through two geographical selling regions, US and International, with a president for each who is responsible for the commercial review of that region. The Executive Committee (‘ExCo’), comprises geographical presidents and certain heads of function and is chaired by the Chief Executive Officer (‘CEO’). ExCo is the body through which the CEO uses the authority delegated to him by the Board of Directors to manage the operations and performance of the Group. All significant operating decisions regarding the allocation and prioritisation of the Group’s resources and assessment of the Group’s performance are made by ExCo, and whilst the members have individual responsibility for the implementation of decisions within their respective areas, it is at the ExCo level that these decisions are made. Accordingly, ExCo is considered to be the Group’s chief operating decision maker as defined by IFRS 8 Operating Segments.
16
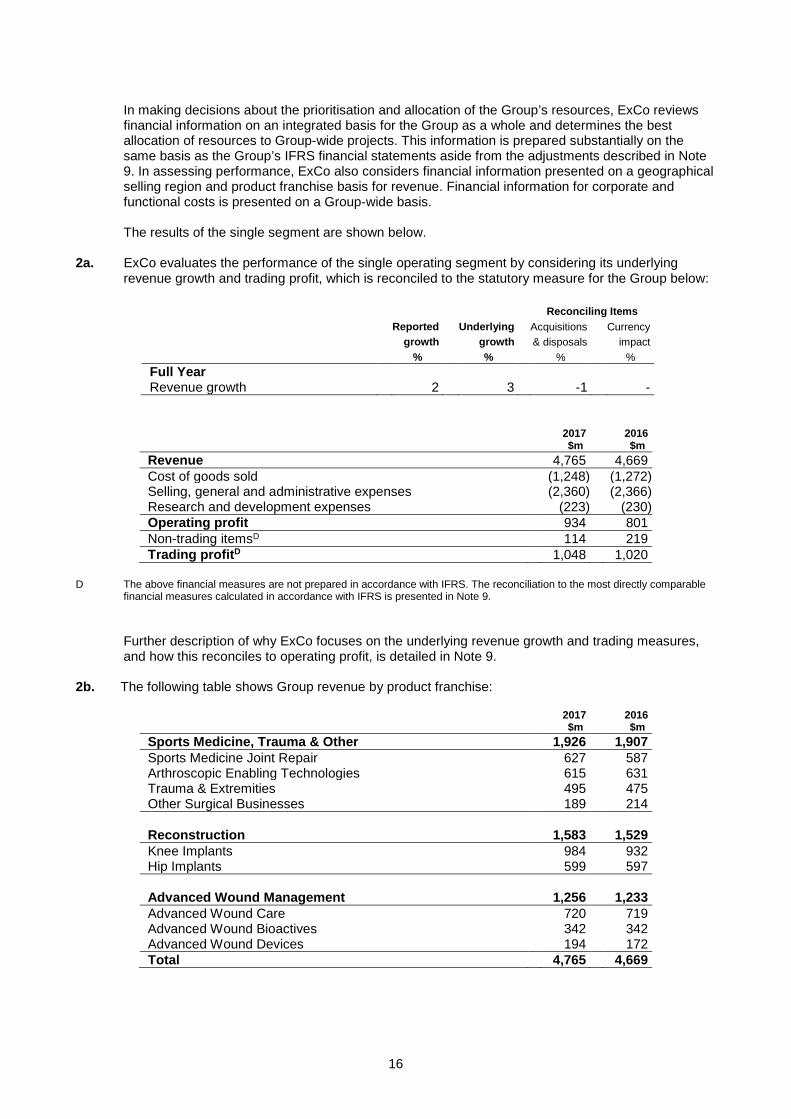
In making decisions about the prioritisation and allocation of the Group’s resources, ExCo reviews financial information on an integrated basis for the Group as a whole and determines the best allocation of resources to Group-wide projects. This information is prepared substantially on the same basis as the Group’s IFRS financial statements aside from the adjustments described in Note 9. In assessing performance, ExCo also considers financial information presented on a geographical selling region and product franchise basis for revenue. Financial information for corporate and functional costs is presented on a Group-wide basis. The results of the single segment are shown below.
2a. ExCo evaluates the performance of the single operating segment by considering its underlying
revenue growth and trading profit, which is reconciled to the statutory measure for the Group below:
Reconciling Items Reported Underlying Acquisitions Currency growth growth & disposals impact % % % %
Full Year Revenue growth 2 3 -1 -
2017 2016 $m $m
Revenue 4,765 4,669 Cost of goods sold (1,248) (1,272) Selling, general and administrative expenses (2,360) (2,366) Research and development expenses (223) (230) Operating profit 934 801 Non-trading itemsD 114 219 Trading profitD 1,048 1,020
D The above financial measures are not prepared in accordance with IFRS. The reconciliation to the most directly comparable
financial measures calculated in accordance with IFRS is presented in Note 9.
Further description of why ExCo focuses on the underlying revenue growth and trading measures, and how this reconciles to operating profit, is detailed in Note 9.
2b. The following table shows Group revenue by product franchise:
2017 2016 $m $m
Sports Medicine, Trauma & Other 1,926 1,907 Sports Medicine Joint Repair 627 587 Arthroscopic Enabling Technologies 615 631 Trauma & Extremities 495 475 Other Surgical Businesses 189 214 Reconstruction 1,583 1,529 Knee Implants 984 932 Hip Implants 599 597 Advanced Wound Management 1,256 1,233 Advanced Wound Care 720 719 Advanced Wound Bioactives 342 342 Advanced Wound Devices 194 172 Total 4,765 4,669
17
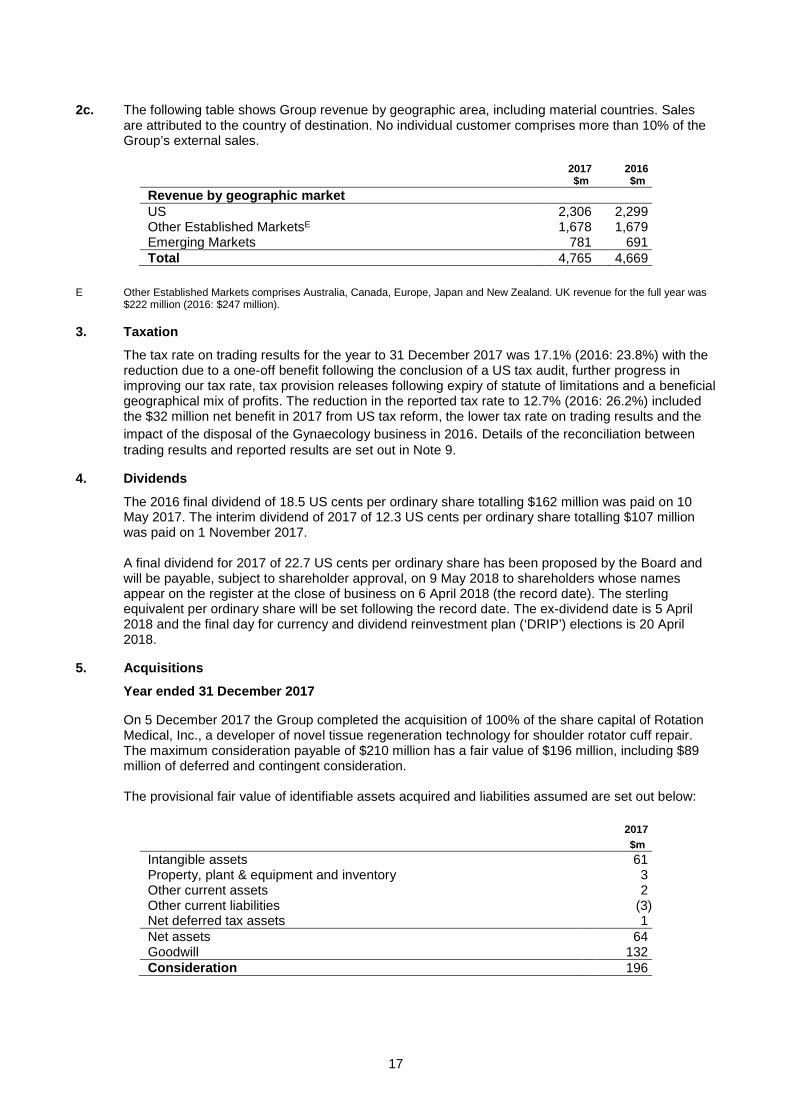
2c. The following table shows Group revenue by geographic area, including material countries. Sales are attributed to the country of destination. No individual customer comprises more than 10% of the Group’s external sales.
2017 2016 $m $m
Revenue by geographic market US 2,306 2,299 Other Established MarketsE 1,678 1,679 Emerging Markets 781 691 Total 4,765 4,669
E Other Established Markets comprises Australia, Canada, Europe, Japan and New Zealand. UK revenue for the full year was
$222 million (2016: $247 million). 3. Taxation
The tax rate on trading results for the year to 31 December 2017 was 17.1% (2016: 23.8%) with the reduction due to a one-off benefit following the conclusion of a US tax audit, further progress in improving our tax rate, tax provision releases following expiry of statute of limitations and a beneficial geographical mix of profits. The reduction in the reported tax rate to 12.7% (2016: 26.2%) included the $32 million net benefit in 2017 from US tax reform, the lower tax rate on trading results and the impact of the disposal of the Gynaecology business in 2016. Details of the reconciliation between trading results and reported results are set out in Note 9.
4. Dividends
The 2016 final dividend of 18.5 US cents per ordinary share totalling $162 million was paid on 10 May 2017. The interim dividend of 2017 of 12.3 US cents per ordinary share totalling $107 million was paid on 1 November 2017. A final dividend for 2017 of 22.7 US cents per ordinary share has been proposed by the Board and will be payable, subject to shareholder approval, on 9 May 2018 to shareholders whose names appear on the register at the close of business on 6 April 2018 (the record date). The sterling equivalent per ordinary share will be set following the record date. The ex-dividend date is 5 April 2018 and the final day for currency and dividend reinvestment plan (‘DRIP’) elections is 20 April 2018.
5. Acquisitions
Year ended 31 December 2017 On 5 December 2017 the Group completed the acquisition of 100% of the share capital of Rotation Medical, Inc., a developer of novel tissue regeneration technology for shoulder rotator cuff repair. The maximum consideration payable of $210 million has a fair value of $196 million, including $89 million of deferred and contingent consideration. The provisional fair value of identifiable assets acquired and liabilities assumed are set out below:
2017 $m
Intangible assets 61 Property, plant & equipment and inventory 3 Other current assets 2 Other current liabilities (3) Net deferred tax assets 1 Net assets 64 Goodwill 132 Consideration 196
18
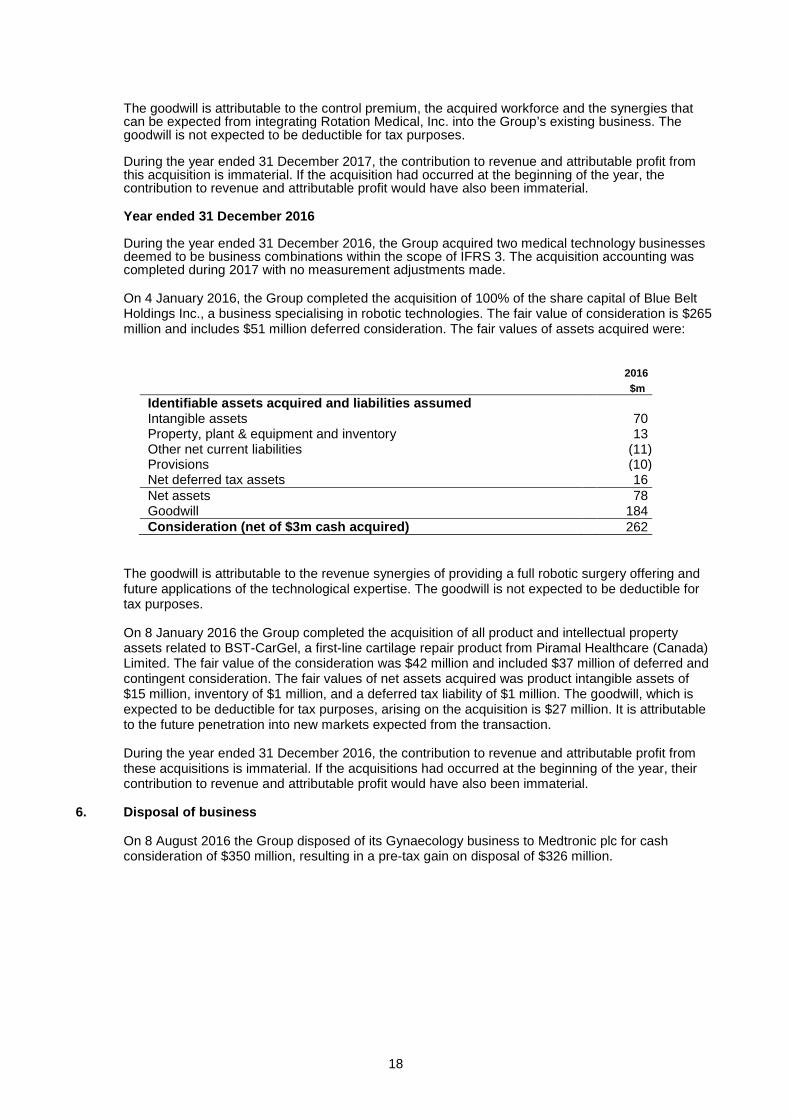
The goodwill is attributable to the control premium, the acquired workforce and the synergies that can be expected from integrating Rotation Medical, Inc. into the Group’s existing business. The goodwill is not expected to be deductible for tax purposes. During the year ended 31 December 2017, the contribution to revenue and attributable profit from this acquisition is immaterial. If the acquisition had occurred at the beginning of the year, the contribution to revenue and attributable profit would have also been immaterial. Year ended 31 December 2016 During the year ended 31 December 2016, the Group acquired two medical technology businesses deemed to be business combinations within the scope of IFRS 3. The acquisition accounting was completed during 2017 with no measurement adjustments made. On 4 January 2016, the Group completed the acquisition of 100% of the share capital of Blue Belt Holdings Inc., a business specialising in robotic technologies. The fair value of consideration is $265 million and includes $51 million deferred consideration. The fair values of assets acquired were:
2016 $m
Identifiable assets acquired and liabilities assumed Intangible assets 70 Property, plant & equipment and inventory 13 Other net current liabilities (11) Provisions (10) Net deferred tax assets 16 Net assets 78 Goodwill 184 Consideration (net of $3m cash acquired) 262
The goodwill is attributable to the revenue synergies of providing a full robotic surgery offering and future applications of the technological expertise. The goodwill is not expected to be deductible for tax purposes. On 8 January 2016 the Group completed the acquisition of all product and intellectual property assets related to BST-CarGel, a first-line cartilage repair product from Piramal Healthcare (Canada) Limited. The fair value of the consideration was $42 million and included $37 million of deferred and contingent consideration. The fair values of net assets acquired was product intangible assets of $15 million, inventory of $1 million, and a deferred tax liability of $1 million. The goodwill, which is expected to be deductible for tax purposes, arising on the acquisition is $27 million. It is attributable to the future penetration into new markets expected from the transaction. During the year ended 31 December 2016, the contribution to revenue and attributable profit from these acquisitions is immaterial. If the acquisitions had occurred at the beginning of the year, their contribution to revenue and attributable profit would have also been immaterial.
6. Disposal of business
On 8 August 2016 the Group disposed of its Gynaecology business to Medtronic plc for cash consideration of $350 million, resulting in a pre-tax gain on disposal of $326 million.
19
7. Net debt
Net debt as at 31 December 2017 comprises:
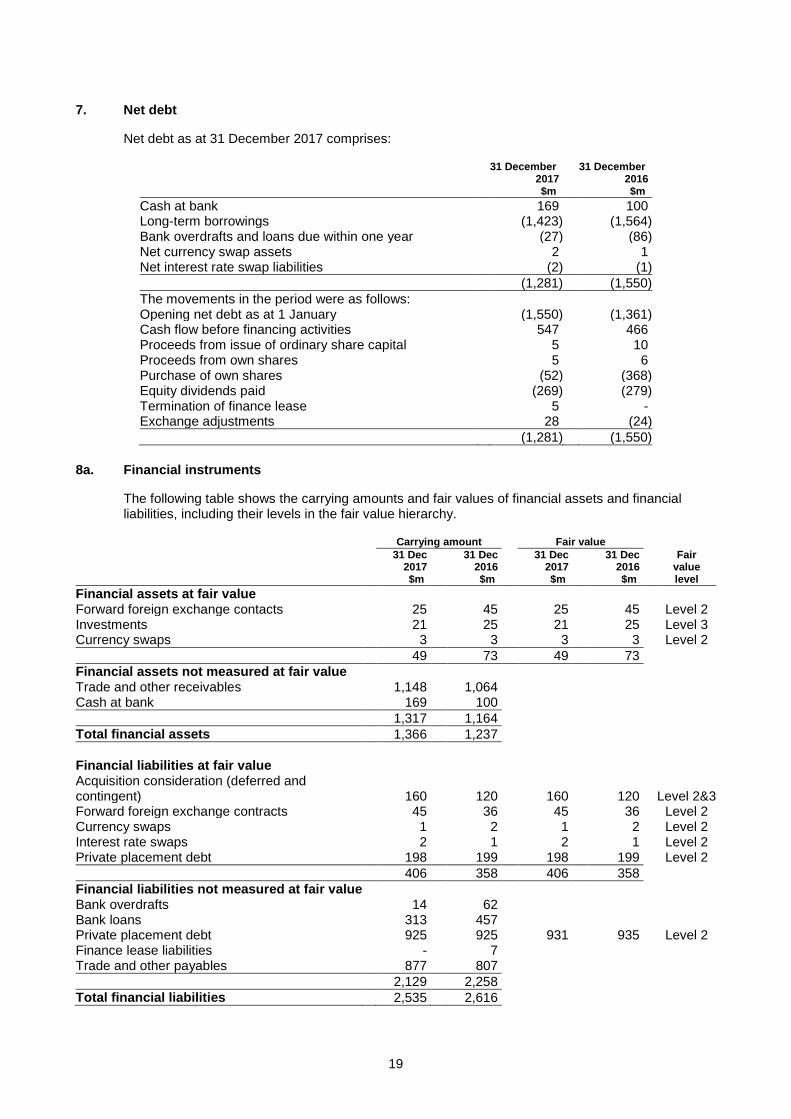
31 December 31 December 2017 2016 $m $m Cash at bank 169 100 Long-term borrowings (1,423) (1,564) Bank overdrafts and loans due within one year (27) (86) Net currency swap assets 2 1 Net interest rate swap liabilities (2) (1) (1,281) (1,550) The movements in the period were as follows: Opening net debt as at 1 January (1,550) (1,361) Cash flow before financing activities 547 466 Proceeds from issue of ordinary share capital 5 10 Proceeds from own shares 5 6 Purchase of own shares (52) (368) Equity dividends paid (269) (279) Termination of finance lease 5 - Exchange adjustments 28 (24) (1,281) (1,550)
8a. Financial instruments
The following table shows the carrying amounts and fair values of financial assets and financial liabilities, including their levels in the fair value hierarchy.
Carrying amount Fair value 31 Dec 31 Dec 31 Dec 31 Dec Fair 2017 2016 2017 2016 value $m $m $m $m level
Financial assets at fair value Forward foreign exchange contacts 25 45 25 45 Level 2 Investments 21 25 21 25 Level 3 Currency swaps 3 3 3 3 Level 2 49 73 49 73 Financial assets not measured at fair value Trade and other receivables 1,148 1,064 Cash at bank 169 100 1,317 1,164 Total financial assets 1,366 1,237 Financial liabilities at fair value Acquisition consideration (deferred and contingent) 160 120 160 120 Level 2&3 Forward foreign exchange contracts 45 36 45 36 Level 2 Currency swaps 1 2 1 2 Level 2 Interest rate swaps 2 1 2 1 Level 2 Private placement debt 198 199 198 199 Level 2 406 358 406 358 Financial liabilities not measured at fair value Bank overdrafts 14 62 Bank loans 313 457 Private placement debt 925 925 931 935 Level 2 Finance lease liabilities - 7 Trade and other payables 877 807 2,129 2,258 Total financial liabilities 2,535 2,616
20
There were no transfers between Levels 1, 2 and 3 during the year ended 31 December 2017 and the year ended 31 December 2016. With the exception of private placement debt as presented above, the carrying amount of financial assets and liabilities not measured at fair value is considered to be a reasonable approximation of fair value. For cash and cash equivalents, short-term loans and receivables, overdrafts and other short-term liabilities which have a maturity of less than three months, the book values approximate the fair values because of their short term nature. The fair values of long-term borrowings, which are not traded publicly, are estimated by discounting future contractual cashflows to net present values at the current market interest rates available to the Group for similar financial instruments. The fair value of currency swaps and foreign exchange contracts is determined by reference to quoted market rates. As a result, foreign forward exchange contracts and currency swaps are classified as Level 2 within the fair value hierarchy. During the year ended 31 December 2017, acquisition consideration increased by $89 million due to the acquisition of Rotation Medical, Inc. which was partially offset by remeasurements and payments of $49 million for acquisitions made in prior years. The fair value of contingent acquisition consideration is estimated using a discounted cash flow model. The valuation model considers the present value of risk adjusted expected payments, discounted using a risk-free discount rate. The expected payment is determined by considering the possible scenarios, which relate to the achievement of established milestones and targets, the amount to be paid under each scenario and the probability of each scenario. As a result, contingent acquisition consideration is classified as Level 3 within the fair value hierarchy. Deferred consideration, which is classified as Level 2, is discounted for the time value of money to reflect the period of time between the acquisition date and the agreed payment date. The fair value of investments is based upon third party pricing models for share issues. As a result, investments are considered Level 3 in the fair value hierarchy. During the year ended 31 December 2017, there were additions to investments of $8 million and a fair value loss of $10 million recognised in Other Comprehensive Income.
8b. Retirement benefit obligations
The discount rates applied to the future pension liabilities of the UK and US pension plans are based on the yield on bonds that have a credit rating of AA denominated in the currency in which the benefits are expected to be paid with a maturity profile approximately the same as the obligations. These have decreased since 31 December 2016 by 20bps to 2.4% and 50bps to 3.5% respectively. This was more than offset by a change in mortality assumptions in the UK plan to reflect revisions to long term mortality expectations, decrease in inflation rates and favourable asset performances that led to a remeasurement gain of $64 million recognised in Other Comprehensive Income.
9. Definitions of and reconciliation to measures included within adjusted “trading” results
These Financial Statements include financial measures that are not prepared in accordance with IFRS. These measures, which include trading profit, trading profit margin, tax rate on trading results, EPSA, trading cash flow, trading profit to trading cash conversion ratio, and underlying growth, exclude the effect of certain cash and non-cash items that Group management believes are not related to the underlying performance of the Group. These non-IFRS financial measures are also used by management to make operating decisions because they facilitate internal comparisons of performance to historical results. Non-IFRS financial measures are presented in these Financial Statements as the Group’s management believe that they provide investors with a means of evaluating performance of the business segment and the consolidated Group on a consistent basis, similar to the way in which the Group’s management evaluates performance, that is not otherwise apparent on an IFRS basis, given that certain non-recurring, infrequent, non-cash and other items that management does not otherwise believe are indicative of the underlying performance of the consolidated Group may not be excluded when preparing financial measures under IFRS. These non-IFRS measures should not be considered in isolation from, as substitutes for, or superior to financial measures prepared in accordance with IFRS.
21
Underlying revenue growth Underlying revenue growth is used to compare the revenue in a given period to the previous period on a like-for-like basis. Underlying revenue growth reconciles to reported revenue growth (see Note 2), the most directly comparable financial measure calculated in accordance with IFRS, by making adjustments for the effect of acquisitions and disposals and the impact of movements in exchange rates (currency impact), as described below. The effect of acquisitions and disposals measures the impact on revenue from newly acquired material business combinations and recent material business disposals. This is calculated by comparing the current year, constant currency actual revenue (which include acquisitions and exclude disposals from the relevant date of completion) with prior year, constant currency actual revenue, adjusted to include the results of acquisitions and exclude disposals for the commensurate period in the prior year. Currency impact measures the increase/decrease in revenue resulting from currency movements on non-US Dollar sales and is measured as the difference between: 1) the increase/decrease in current year revenue translated into US Dollars at the current year average rate and the prior year revenue translated at the prior year average rate; and 2) the increase/decrease being measured by translating current and prior year revenue into US Dollars using the constant fixed rate. Trading profit, trading profit margin, trading cash flow and trading profit to cash conversion ratio Trading profit, trading profit margin (trading profit expressed as a percentage of revenue, trading cash flow and trading profit to cash conversion ratio (trading cash flow expressed as a percentage of trading profit) are trend measures, which present the long-term profitability of the Group excluding the impact of specific transactions that management considers affect the Group’s short-term profitability and cash flows. The Group has identified the following items, where material, as those to be excluded from operating profit and cash generated from operations when arriving at trading profit and trading cash flow, respectively: acquisition and disposal related items arising in connection with business combinations, including amortisation of acquisition intangible assets, impairments and integration costs; restructuring events; gains and losses resulting from legal disputes and uninsured losses. In addition to these items, gains and losses that materially impact the Group’s profitability or cash flows on a short-term or one-off basis and the cash cost to fund defined benefit pension schemes that are closed to future accrual are excluded from operating profit and cash generated from operations when arriving at trading profit and trading cash flow, respectively.
Adjusted earnings per ordinary share (‘EPSA’) EPSA is a trend measure, which presents the long-term profitability of the Group excluding the post-tax impact of specific transactions that management considers affect the Group’s short-term profitability and the one-off impact of US tax reform. The Group presents this measure to assist investors in their understanding of trends. Adjusted attributable profit is the numerator used for this measure and is determined by adjusting attributable profit for the items that are excluded from operating profit when arriving at trading profit and items that are recognised below operating profit that affect the Group’s short-term profitability. The most directly comparable financial measure calculated in accordance with IFRS is basic earnings per ordinary share (‘EPS’).
22
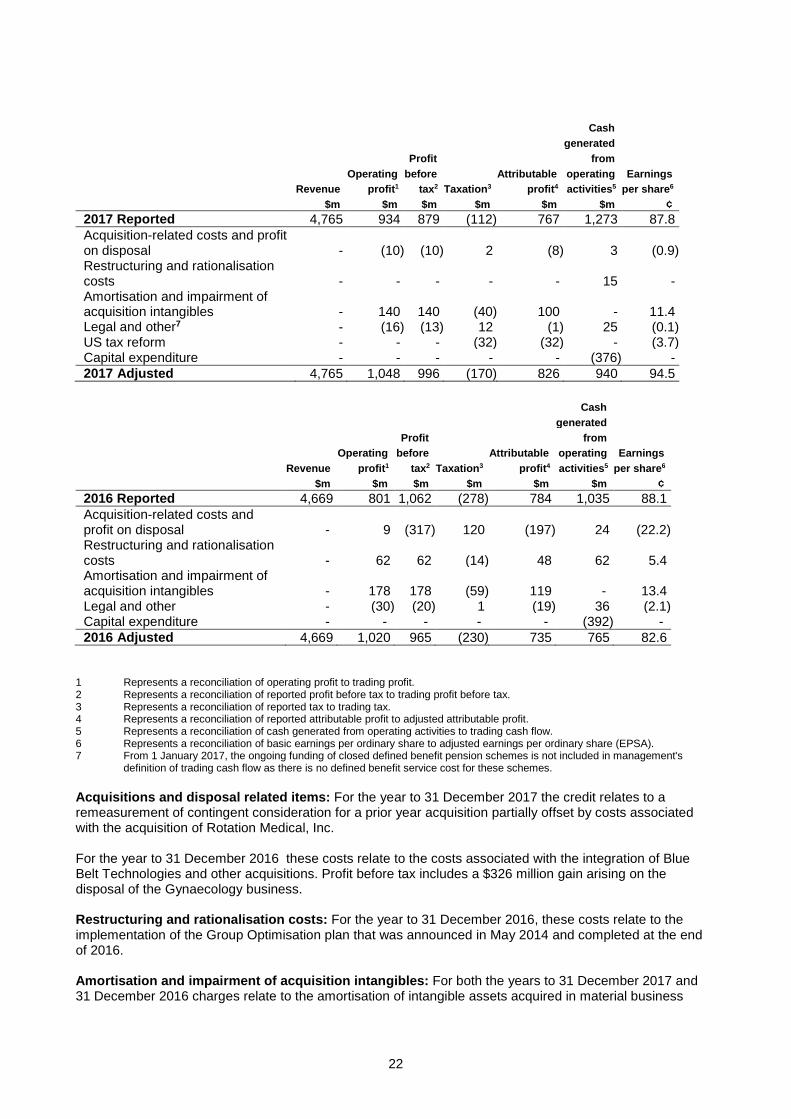
Cash generated Profit from Operating before Attributable operating Earnings Revenue profit1 tax2 Taxation3 profit4 activities5 per share6 $m $m $m $m $m $m ¢
2017 Reported 4,765 934 879 (112) 767 1,273 87.8 Acquisition-related costs and profit on disposal - (10) (10) 2 (8) 3 (0.9) Restructuring and rationalisation costs - - - - - 15 - Amortisation and impairment of acquisition intangibles - 140 140 (40) 100 - 11.4 Legal and other7 - (16) (13) 12 (1) 25 (0.1) US tax reform - - - (32) (32) - (3.7) Capital expenditure - - - - - (376) - 2017 Adjusted 4,765 1,048 996 (170) 826 940 94.5
Cash generated Profit from Operating before Attributable operating Earnings Revenue profit1 tax2 Taxation3 profit4 activities5 per share6 $m $m $m $m $m $m ¢
2016 Reported 4,669 801 1,062 (278) 784 1,035 88.1 Acquisition-related costs and profit on disposal - 9 (317) 120 (197) 24 (22.2) Restructuring and rationalisation costs - 62 62 (14) 48 62 5.4 Amortisation and impairment of acquisition intangibles - 178 178 (59) 119 - 13.4 Legal and other - (30) (20) 1 (19) 36 (2.1) Capital expenditure - - - - - (392) - 2016 Adjusted 4,669 1,020 965 (230) 735 765 82.6
1 Represents a reconciliation of operating profit to trading profit. 2 Represents a reconciliation of reported profit before tax to trading profit before tax. 3 Represents a reconciliation of reported tax to trading tax. 4 Represents a reconciliation of reported attributable profit to adjusted attributable profit. 5 Represents a reconciliation of cash generated from operating activities to trading cash flow. 6 Represents a reconciliation of basic earnings per ordinary share to adjusted earnings per ordinary share (EPSA). 7 From 1 January 2017, the ongoing funding of closed defined benefit pension schemes is not included in management's
definition of trading cash flow as there is no defined benefit service cost for these schemes. Acquisitions and disposal related items: For the year to 31 December 2017 the credit relates to a remeasurement of contingent consideration for a prior year acquisition partially offset by costs associated with the acquisition of Rotation Medical, Inc. For the year to 31 December 2016 these costs relate to the costs associated with the integration of Blue Belt Technologies and other acquisitions. Profit before tax includes a $326 million gain arising on the disposal of the Gynaecology business. Restructuring and rationalisation costs: For the year to 31 December 2016, these costs relate to the implementation of the Group Optimisation plan that was announced in May 2014 and completed at the end of 2016. Amortisation and impairment of acquisition intangibles: For both the years to 31 December 2017 and 31 December 2016 charges relate to the amortisation of intangible assets acquired in material business
23
combinations. The year to 31 December 2017 includes an impairment charge of $10 million (2016: $48 million). Legal and other: For both the years to 31 December 2017 and 31 December 2016 charges relate primarily to legal expenses for patent litigation with Arthrex and ongoing metal-on-metal hip claims and in the year to 31 December 2017 an increase of $10 million in the provision that reflects the present value of the estimated costs to resolve all other known and anticipated metal-on-metal hip claims. A $54 million credit has been recognised in the year to 31 December 2017 following a settlement payment received from Arthrex relating to patent litigation. The year to 31 December 2016 includes a $44 million curtailment credit on post-retirement benefits in the UK pension scheme. For the year to 31 December 2017 $44 million of cash funding to closed defined benefit pension schemes is excluded from trading cash flow following the closure of the UK scheme to future accrual in December 2016. 10. Exchange rates
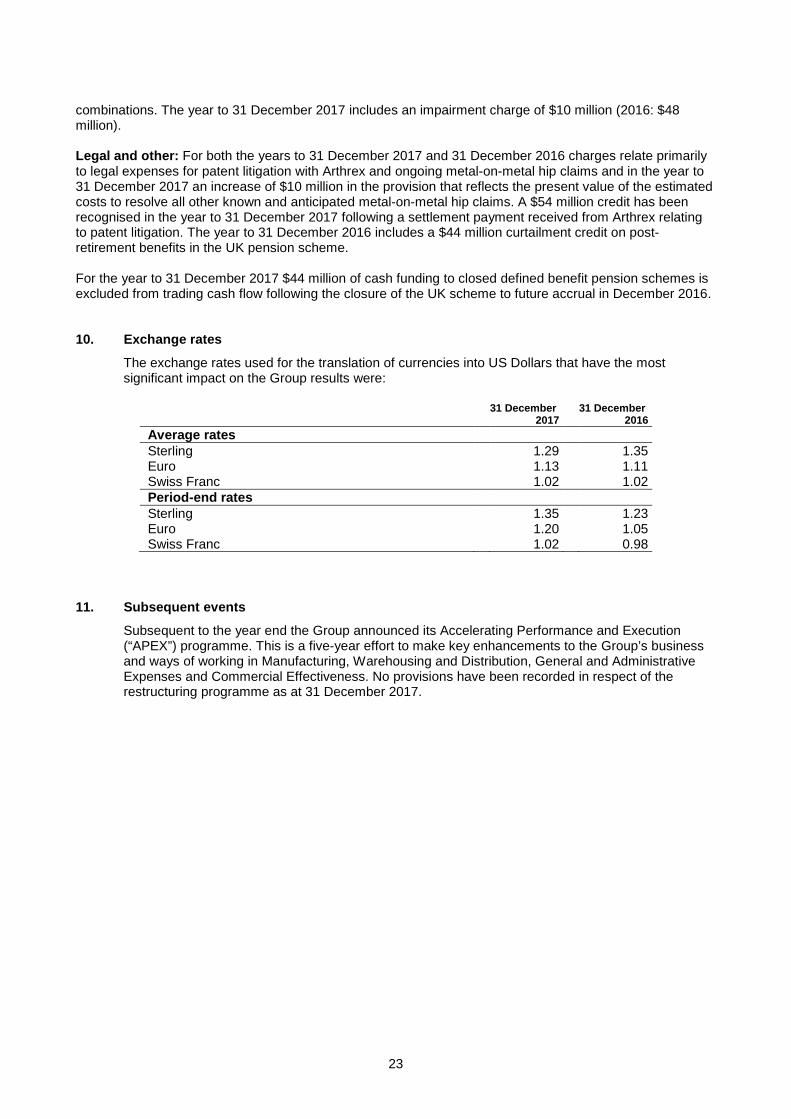
The exchange rates used for the translation of currencies into US Dollars that have the most significant impact on the Group results were:
31 December 31 December 2017 2016
Average rates Sterling 1.29 1.35 Euro 1.13 1.11 Swiss Franc 1.02 1.02 Period-end rates Sterling 1.35 1.23 Euro 1.20 1.05 Swiss Franc 1.02 0.98
11. Subsequent events Subsequent to the year end the Group announced its Accelerating Performance and Execution (“APEX”) programme. This is a five-year effort to make key enhancements to the Group’s business and ways of working in Manufacturing, Warehousing and Distribution, General and Administrative Expenses and Commercial Effectiveness. No provisions have been recorded in respect of the restructuring programme as at 31 December 2017.