social media sessions social media - research alan long senior account director
TRANSCRIPT
Social Media Sessions
Social Media - ResearchAlan LongSenior Account Director
Social Media Sessions
“ From Social Data to Knowledge”
Alan LongSenior Account Director -Data & Insights
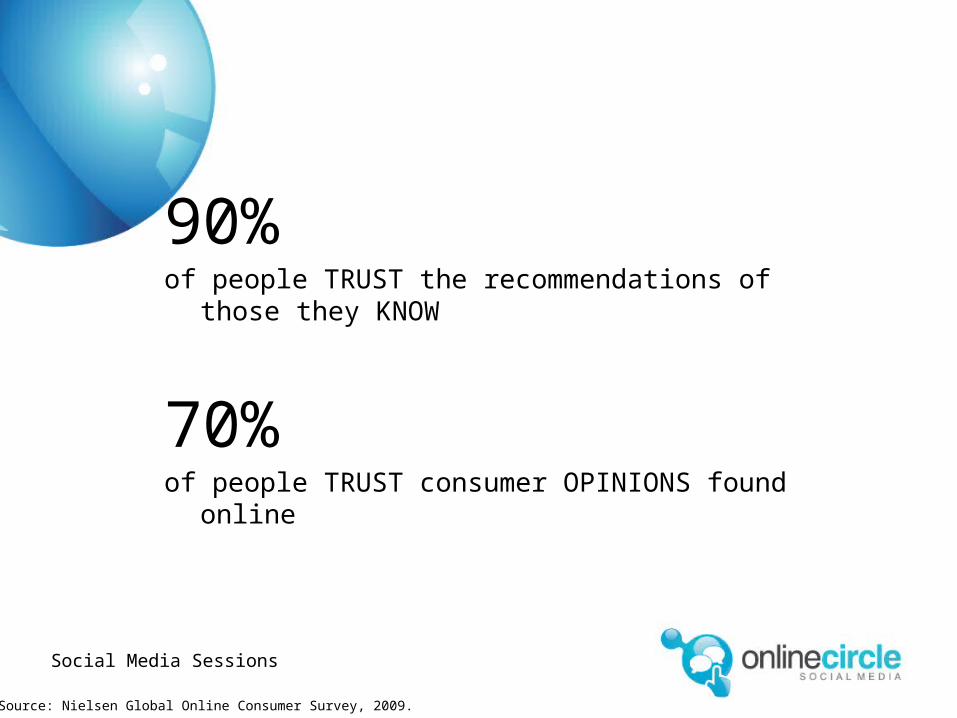
90%of people TRUST the recommendations of those
they KNOW
70%of people TRUST consumer OPINIONS found online
Social Media Sessions
Source: Nielsen Global Online Consumer Survey, 2009.
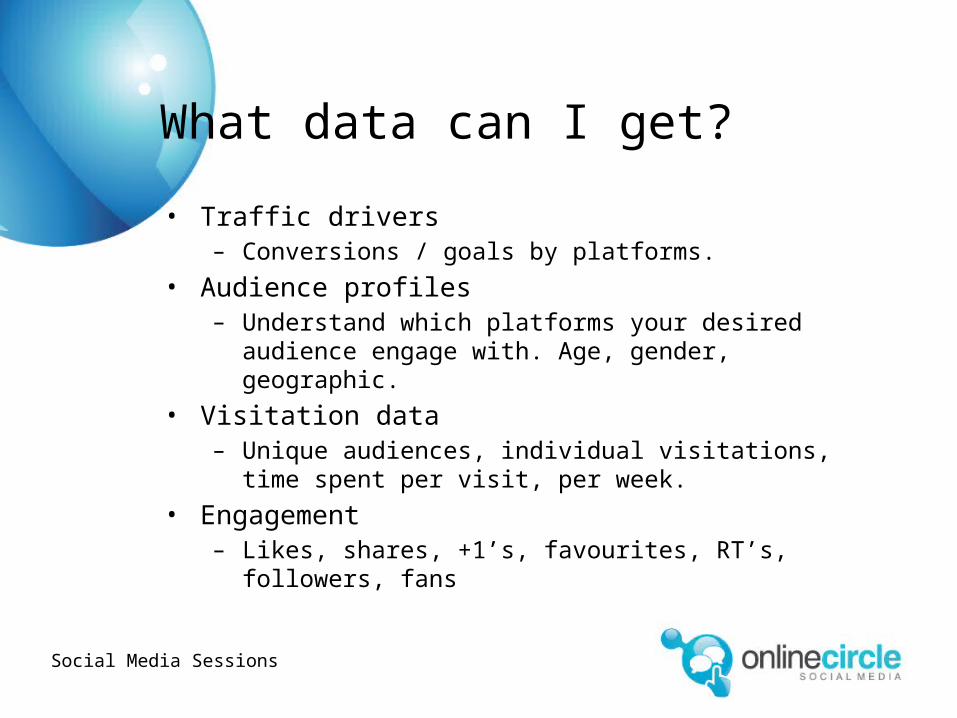
What data can I get?
• Traffic drivers– Conversions / goals by platforms.
• Audience profiles– Understand which platforms your desired audience
engage with. Age, gender, geographic.
• Visitation data– Unique audiences, individual visitations, time spent
per visit, per week.
• Engagement– Likes, shares, +1’s, favourites, RT’s, followers, fans
Social Media Sessions
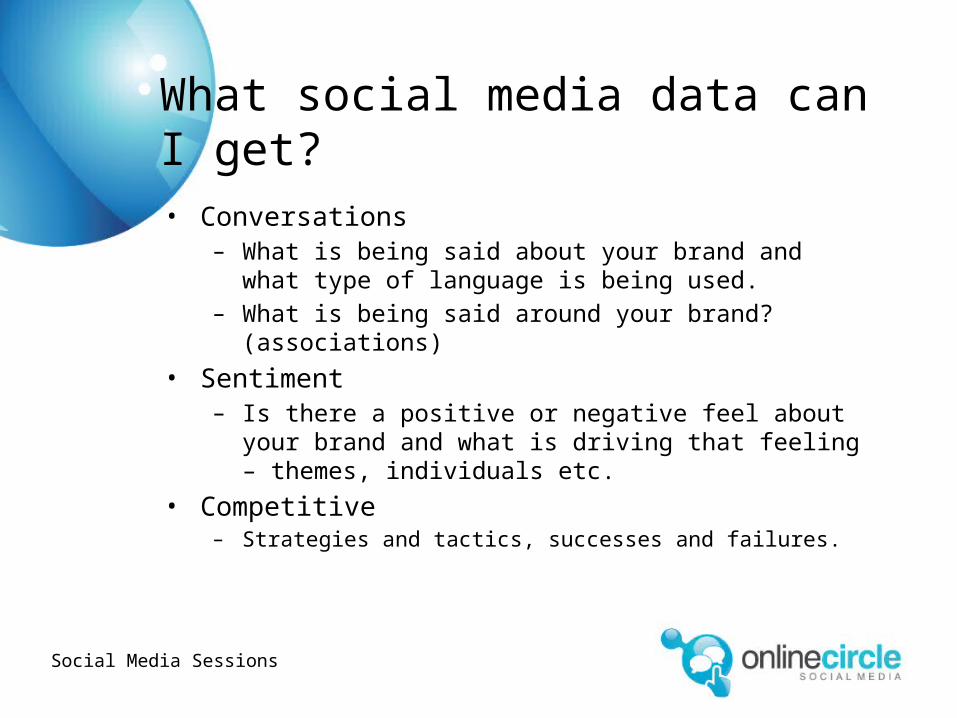
What social media data can I get?• Conversations
– What is being said about your brand and what type of language is being used.
– What is being said around your brand? (associations)
• Sentiment– Is there a positive or negative feel about your
brand and what is driving that feeling – themes, individuals etc.
• Competitive– Strategies and tactics, successes and failures.
Social Media Sessions

What social media data can I get?• Conversation
– # of Audience Comments (or Replies) Per Post
• Applause– # of Retweets Per Tweet (Twitter), # of Shares Per Post
(Facebook & Google+), # of Share Clicks Per Post (or Video) (Blog & YouTube)
• Amplification– # of Favourite Clicks Per Tweet (Twitter), # of Likes Per
Post (Facebook), # of +1s Per Post (Google+), # of +1s and Likes Per Post (or video) (Blogs & YouTube)
• Economic Value– Sum of Short and Long Term Revenue and Cost Savings
http://www.kaushik.net/avinash/best-social-media-metrics-conversation-amplification-applause-economic-value/
Social Media Sessions
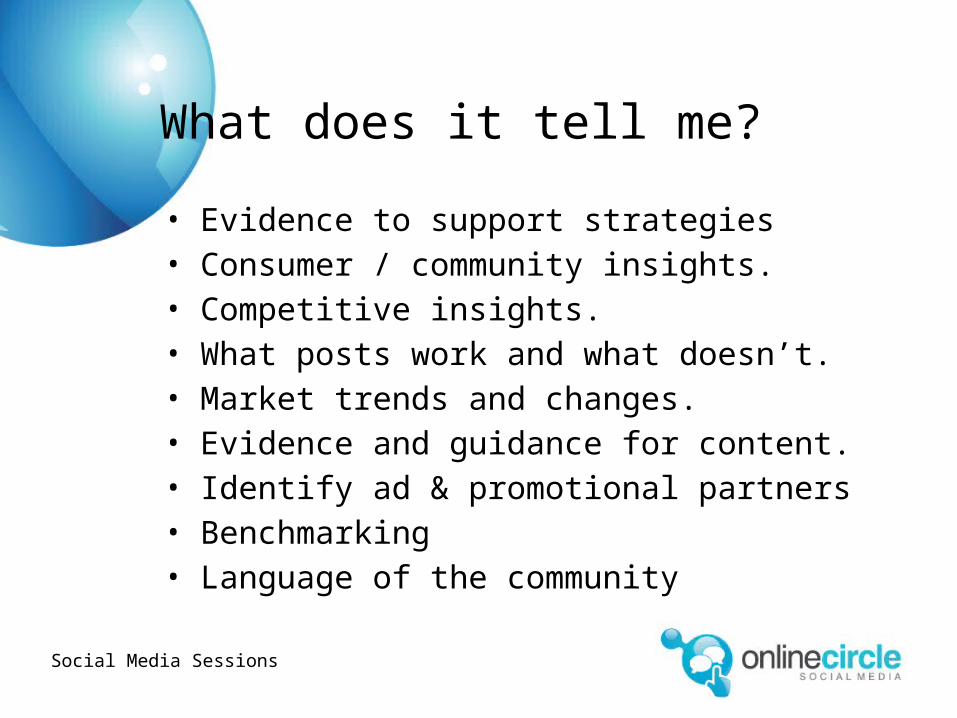
What does it tell me?
• Evidence to support strategies• Consumer / community insights.• Competitive insights.• What posts work and what doesn’t.• Market trends and changes.• Evidence and guidance for content.• Identify ad & promotional partners• Benchmarking• Language of the community
Social Media Sessions

Data to knowledge
Social Media Sessions
data
information
insight
knowledge
Hu
man
in
pu
t an
d e
ffort
->
>>
>
Value to Marketing and Corporate Affairs ->>>>
add filters and screens.i.e. test hypothesis / ask questions
add contextvertical expertise and political / economic
take actionmeasure outcomes & repeat process
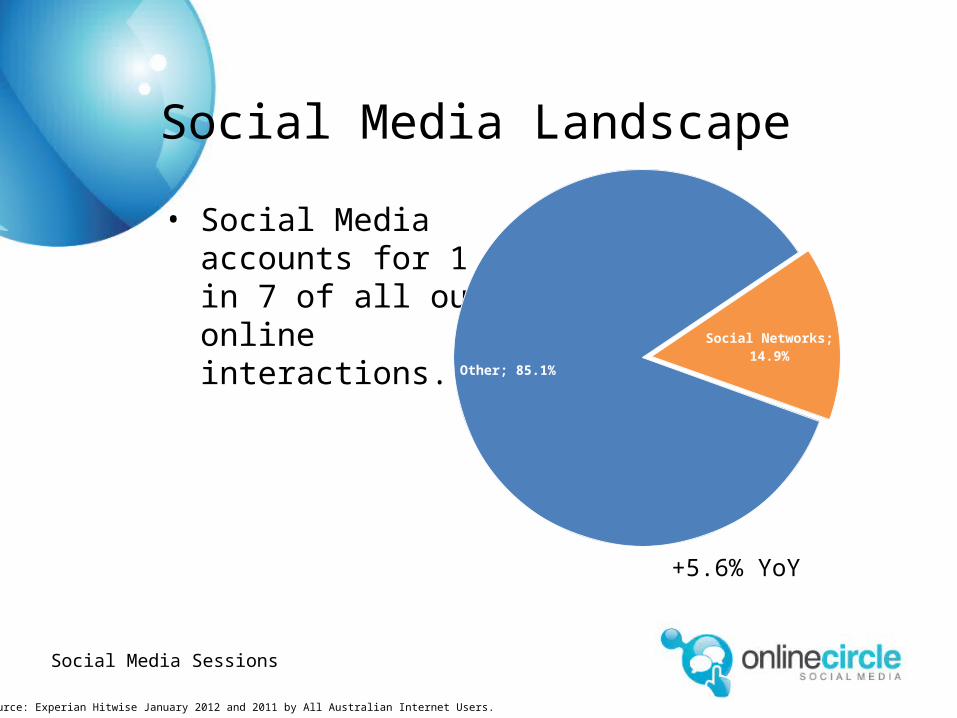
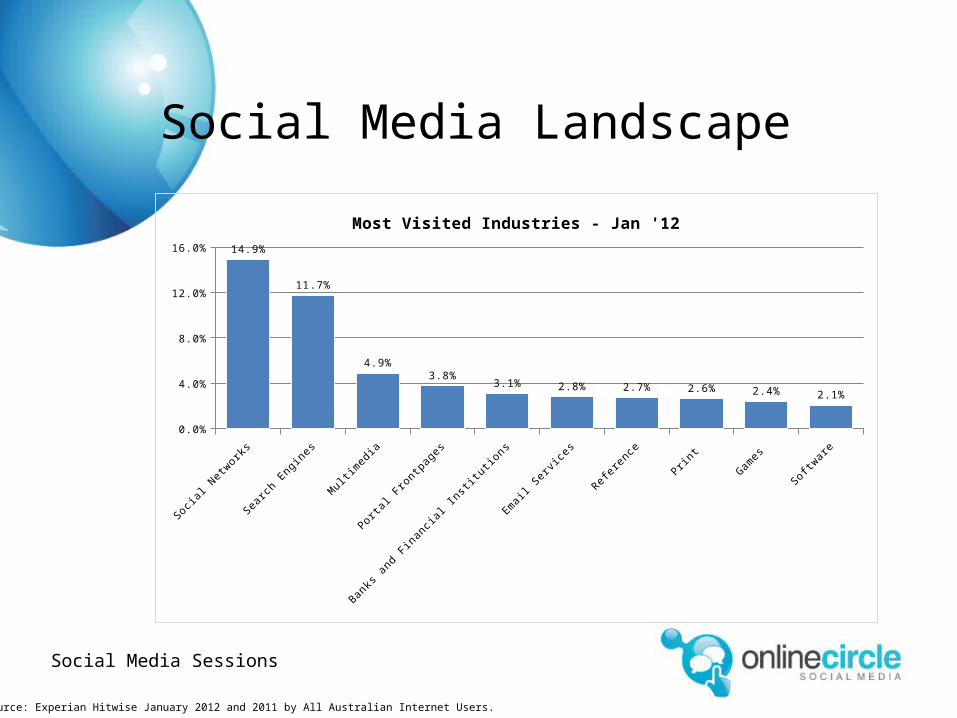
Social Media Landscape
• Social Media accounts for 1 in 7 of all our online interactions.
Social Media Sessions
Social Networks; 14.9%
Other; 85.1%
+5.6% YoY
Source: Experian Hitwise January 2012 and 2011 by All Australian Internet Users.
Social Media Landscape
Social Media Sessions
Social
Net
wor
ks
Sear
ch E
ngin
es
Mul
timed
ia
Portal
Fro
ntpa
ges
Banks
and
Fin
ancial
Inst
itutio
ns
Emai
l Ser
vice
s
Refer
ence
Prin
t
Gam
es
Softw
are
0.0%
4.0%
8.0%
12.0%
16.0% 14.9%
11.7%
4.9%
3.8%3.1% 2.8% 2.7% 2.6% 2.4% 2.1%
Most Visited Industries - Jan '12
Source: Experian Hitwise January 2012 and 2011 by All Australian Internet Users.
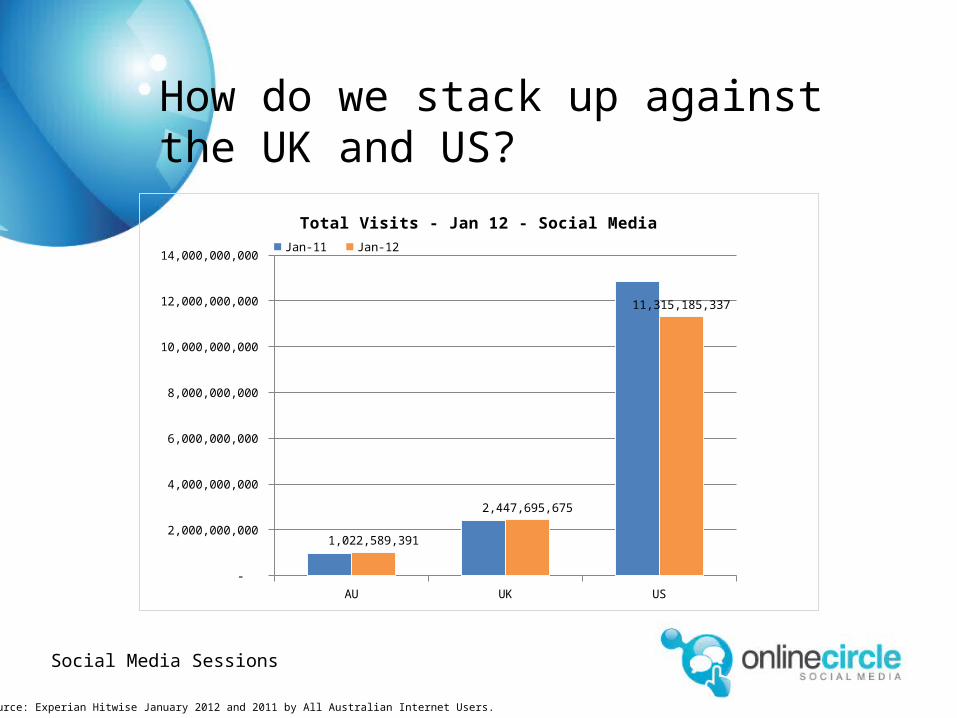
How do we stack up against the UK and US?
Social Media Sessions
AU UK US -
2,000,000,000
4,000,000,000
6,000,000,000
8,000,000,000
10,000,000,000
12,000,000,000
14,000,000,000
1,022,589,391
2,447,695,675
11,315,185,337
Total Visits - Jan 12 - Social Media
Jan-11 Jan-12
Source: Experian Hitwise January 2012 and 2011 by All Australian Internet Users.
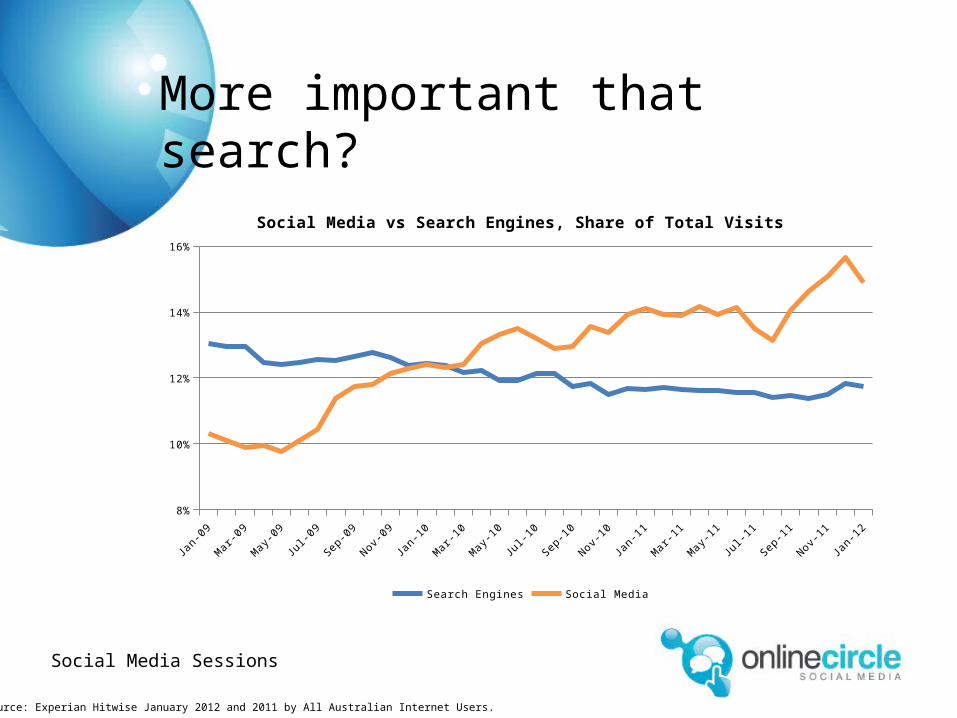
More important that search?
Social Media Sessions
Jan-
09
Mar
-09
May
-09
Jul-0
9
Sep-
09
Nov-0
9
Jan-
10
Mar
-10
May
-10
Jul-1
0
Sep-
10
Nov-1
0
Jan-
11
Mar
-11
May
-11
Jul-1
1
Sep-
11
Nov-1
1
Jan-
12
8%
10%
12%
14%
16%
Social Media vs Search Engines, Share of Total Visits
Search Engines Social Media
Source: Experian Hitwise January 2012 and 2011 by All Australian Internet Users.
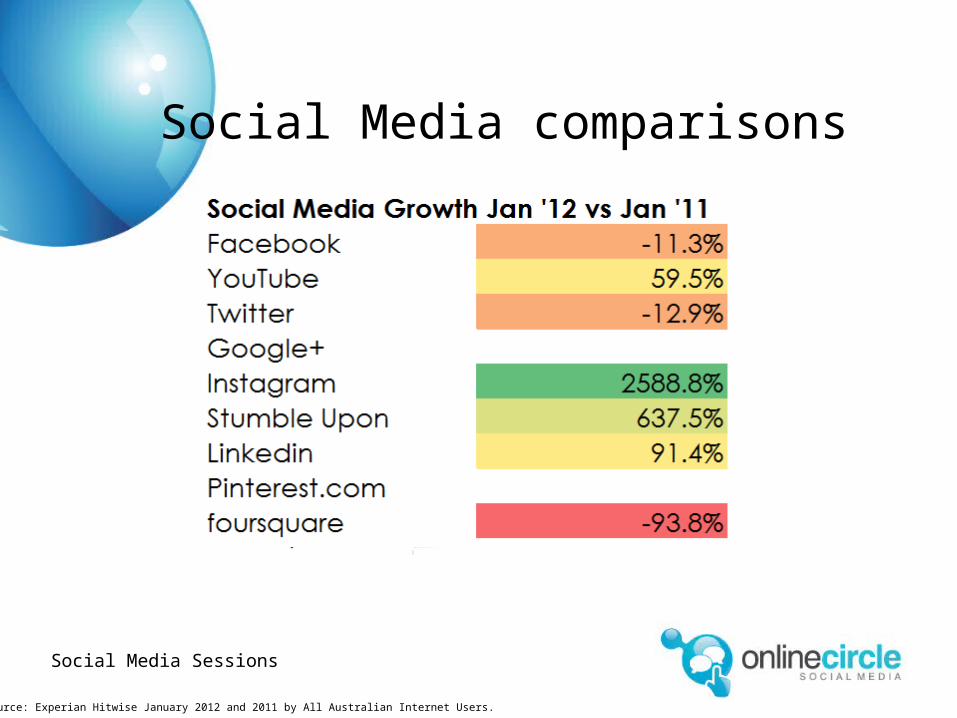
Social Media comparisons
Social Media Sessions
Source: Experian Hitwise January 2012 and 2011 by All Australian Internet Users.
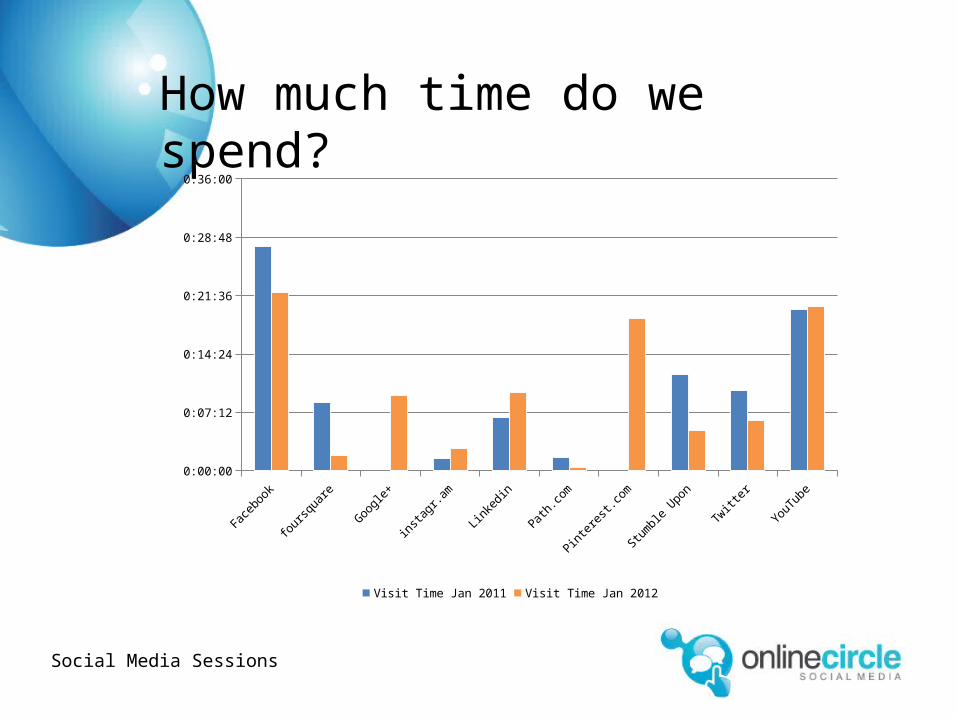
How much time do we spend?
Social Media Sessions
Face
book
four
squa
re
Googl
e+
inst
agr.a
m
Link
edin
Path
.com
Pint
eres
t.com
Stum
ble
Upon
Twitt
er
YouT
ube
0:00:00
0:07:12
0:14:24
0:21:36
0:28:48
0:36:00
Visit Time Jan 2011 Visit Time Jan 2012
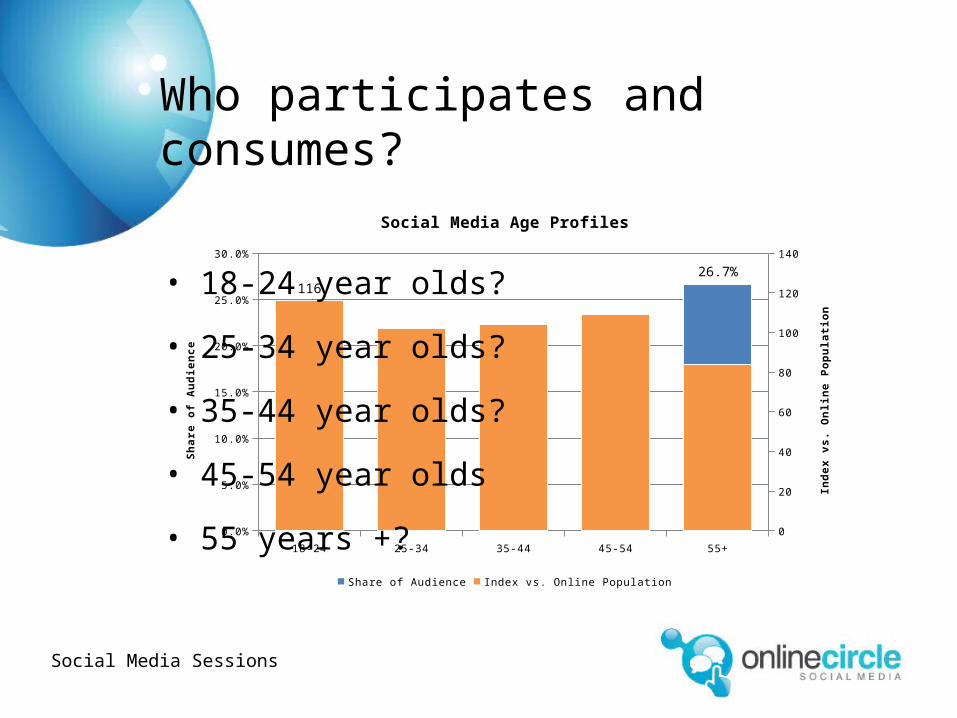
Who participates and consumes?
Social Media Sessions
18-24 25-34 35-44 45-54 55+
0.0%
5.0%
10.0%
15.0%
20.0%
25.0%
30.0%
0
20
40
60
80
100
120
140
11626.7%
Social Media Age Profiles
Share of Audience Index vs. Online Population
Sh
are
of
Au
die
nce
Ind
ex v
s.
On
lin
e P
op
ula
tio
n
• 18-24 year olds?
• 25-34 year olds?
• 35-44 year olds?
• 45-54 year olds
• 55 years +?

Summary
Social Media Sessions
• Establish success metrics based on business objectives.
• Measure those metrics through to economic benefit.
• Understand where the audience is.– Don’t go to Facebook just because everyone
else is.
• Listen to the audience and use their language in your communications.