social return on investment: practical tools for cost benefit analysis reclaiming futures webinar...
TRANSCRIPT

Social Return on Investment: Practical Tools for Cost Benefit Analysis
Reclaiming Futures WebinarKristina Smock Consulting
July 28, 2010
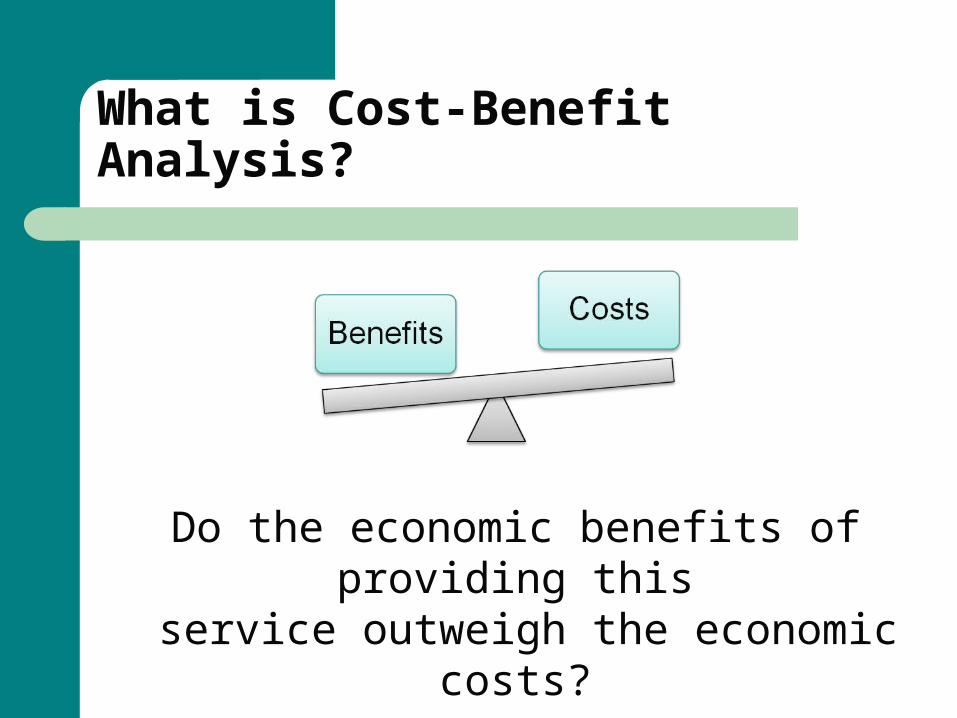
What is Cost-Benefit Analysis?
Do the economic benefits of providing this service outweigh the economic costs?

Benefit-to-Cost Ratio
monetary value of benefits
monetary costs of obtaining them

Case Study


Calculating Costs
Divide budget into individual program areas that each match with a specific outcome
Include all costs that are necessary in order to achieve the outcome
Time period for costs should match time period for outcomes
Make sure all relevant costs are captured in your final cost-benefit ratio

New Avenues’ Costs

Outputs and Outcomes

No Outcome Data?
Apply your output data to studies showing the outcomes of similar interventions.
Calculate how many people would have to benefit for the program to pay for itself.
Compare the costs of two alternatives.

Sample Outcomes

Identifying Benefits
Direct benefits to individual participants Benefits to other individuals Cost savings to society Financial returns to society

Sample Benefits

Calculating Monetary Value of Benefits

Calculating Actual Cost Savings Based on Government Records

Challenges of Calculating Actual Cost Savings from Records
Privacy issuesData base incompatibilityTime lagsGetting cost dataFinding a comparison group

Examples from New Avenues

Example 1: Reception Center

Example 2: Runaways

Example 3: Jobs

Example 4: Victimization

New Avenues’ Findings
New Avenues saved the community the equivalent of $4.12 for every $1.00 it
spent in 2004-05 across all of its programs

Challenges of the Methodology
Multi-layered researchTime consuming and labor intensiveDetailed documentation requiredNot all benefits can be captured

PLANNING TOOLS


Cost-Benefit Worksheet Example
1. Cost of program or program component: $195,203
2. Unit of cost: Per year
3. Number of youth served by program component during time period covered by unit of cost: 456 runaway youth were served
4. Outcome during same time period: 100% of runaway youth served were reunited with their families or connected to appropriate services when reunification wasn’t possible.
5. Primary or secondary data tied to outcome showing what would have likely happened to participants without the intervention: Nationally, 40% of runaways end up homeless.
6. Data showing per unit monetary equivalent of outcome: Nationally, about half of all homeless youth access shelter services, for an average of 4 months. The cost to provide shelter and basic services for each youth who accesses it is $62 per night, or an average of $7,440 for 4 months. Since only half of all homeless youth access shelter services, the average cost per youth is $3,720.

Calculate Ratio
100% x 1,392 x $221
Answer 5 x Answer 3 x Answer 6
Answer 1
195,203
= $1.58 in benefits for every dollar spent per year
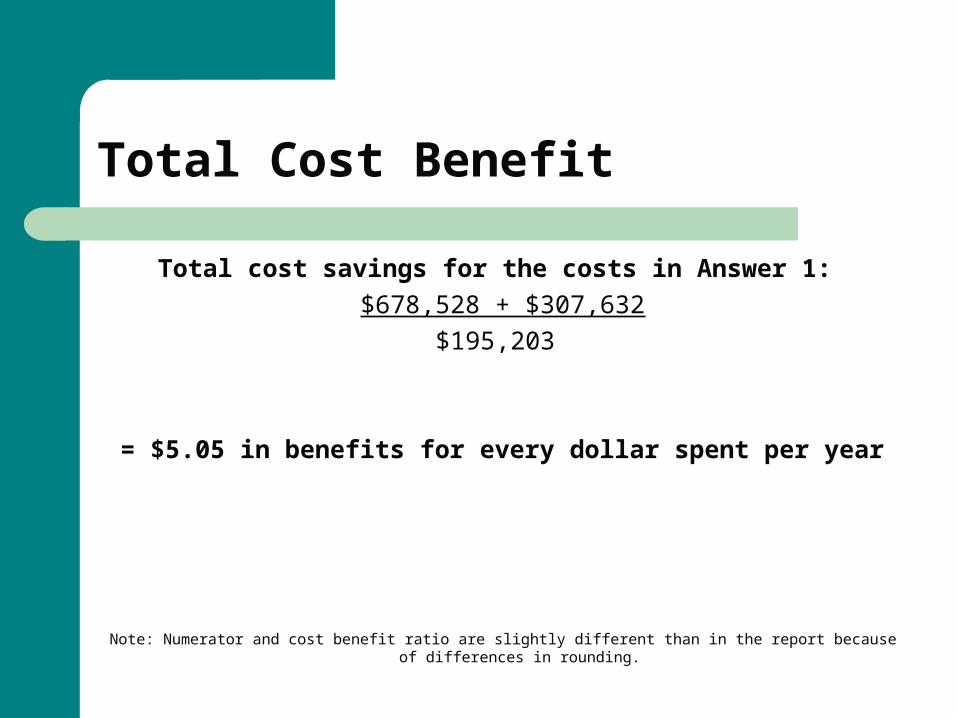
Total Cost Benefit
Total cost savings for the costs in Answer 1:
$678,528 + $307,632
$195,203
= $5.05 in benefits for every dollar spent per year
Note: Numerator and cost benefit ratio are slightly different than in the report because of differences in rounding.

Questions and Discussion