soil moisture measurement in cropped fields - hessd
TRANSCRIPT

HESSD10, 4237–4274, 2013
Soil moisturemeasurement incropped fields
C. A. Rivera Villarreyeset al.
Title Page
Abstract Introduction
Conclusions References
Tables Figures
J I
J I
Back Close
Full Screen / Esc
Printer-friendly Version
Interactive Discussion
Discussion
Paper
|D
iscussionP
aper|
Discussion
Paper
|D
iscussionP
aper|
Hydrol. Earth Syst. Sci. Discuss., 10, 4237–4274, 2013www.hydrol-earth-syst-sci-discuss.net/10/4237/2013/doi:10.5194/hessd-10-4237-2013© Author(s) 2013. CC Attribution 3.0 License.
EGU Journal Logos (RGB)
Advances in Geosciences
Open A
ccess
Natural Hazards and Earth System
Sciences
Open A
ccess
Annales Geophysicae
Open A
ccess
Nonlinear Processes in Geophysics
Open A
ccess
Atmospheric Chemistry
and Physics
Open A
ccess
Atmospheric Chemistry
and Physics
Open A
ccess
Discussions
Atmospheric Measurement
Techniques
Open A
ccess
Atmospheric Measurement
Techniques
Open A
ccess
Discussions
Biogeosciences
Open A
ccess
Open A
ccess
BiogeosciencesDiscussions
Climate of the Past
Open A
ccess
Open A
ccess
Climate of the Past
Discussions
Earth System Dynamics
Open A
ccess
Open A
ccess
Earth System Dynamics
Discussions
GeoscientificInstrumentation
Methods andData Systems
Open A
ccess
GeoscientificInstrumentation
Methods andData Systems
Open A
ccess
Discussions
GeoscientificModel Development
Open A
ccess
Open A
ccess
GeoscientificModel Development
Discussions
Hydrology and Earth System
Sciences
Open A
ccess
Hydrology and Earth System
Sciences
Open A
ccess
Discussions
Ocean Science
Open A
ccess
Open A
ccess
Ocean ScienceDiscussions
Solid Earth
Open A
ccess
Open A
ccess
Solid EarthDiscussions
The Cryosphere
Open A
ccess
Open A
ccessThe Cryosphere
Discussions
Natural Hazards and Earth System
Sciences
Open A
ccess
Discussions
This discussion paper is/has been under review for the journal Hydrology and Earth SystemSciences (HESS). Please refer to the corresponding final paper in HESS if available.
Calibration approaches of cosmic-rayneutron sensing for soil moisturemeasurement in cropped fieldsC. A. Rivera Villarreyes, G. Baroni, and S. E. Oswald
Institute of Earth and Environmental Science, University of Potsdam,Karl-Liebknecht-Strasse 24–25, 14476 Potsdam, Germany
Received: 15 March 2013 – Accepted: 22 March 2013 – Published: 4 April 2013
Correspondence to: C. A. Rivera Villarreyes ([email protected])
Published by Copernicus Publications on behalf of the European Geosciences Union.
4237

HESSD10, 4237–4274, 2013
Soil moisturemeasurement incropped fields
C. A. Rivera Villarreyeset al.
Title Page
Abstract Introduction
Conclusions References
Tables Figures
J I
J I
Back Close
Full Screen / Esc
Printer-friendly Version
Interactive Discussion
Discussion
Paper
|D
iscussionP
aper|
Discussion
Paper
|D
iscussionP
aper|
Abstract
Measurement of soil moisture at the plot or hill-slope scale is an important link be-tween local vadose-zone hydrology and catchment hydrology. This study evaluates theapplicability of the cosmic-ray neutron sensing for soil moisture in cropped fields.
Measurements of cosmic-ray neutrons (fast neutrons) were performed at a lowland5
farmland in Bornim (Brandenburg, Germany) cropped with sunflower and winter rye.Three field calibration approaches and four different ways of integration the soil mois-ture profile to an integral value for cosmic-ray neutron sensing were evaluated in thisstudy. The cosmic-ray sensing (CRS) probe was calibrated against a network of clas-sical point-scale soil moisture measurements. A large CRS parameter variability was10
observed by choosing calibration periods within the different growing stages of sun-flower and winter rye. Therefore, it was not possible to identify a single set of param-eters perfectly estimating soil moisture for both sunflower and winter rye periods. Onthe other hand, CRS signal and its parameter variability could be understood by somecrop characteristics and by predicting the attenuated neutrons by crop presence.15
This study proves the potentiality of the cosmic-ray neutron sensing at the field scale;however, its calibration needs to be adapted for seasonal vegetation in cropped fields.
1 Introduction
The understanding of soil moisture variability across spatial-temporal scales is of greatinterest for several important aspects such as flood prediction and forecasting (Brocca20
et al., 2010; Koster et al., 2010; Steenbergen and Willems, 2012), weather prediction(Albergel et al., 2010), climate modeling (Team et al., 2004), agriculture management(Champagne et al., 2011; Vico and Porporato, 2011), and groundwater recharge (Pat-terson and Bekele, 2011).
Despite the important role of soil moisture in the hydrological cycle (for exam-25
ple, Porporato and Rodriguez-Iturbe (2002), Robinson et al. (2008) and Vereecken
4238

HESSD10, 4237–4274, 2013
Soil moisturemeasurement incropped fields
C. A. Rivera Villarreyeset al.
Title Page
Abstract Introduction
Conclusions References
Tables Figures
J I
J I
Back Close
Full Screen / Esc
Printer-friendly Version
Interactive Discussion
Discussion
Paper
|D
iscussionP
aper|
Discussion
Paper
|D
iscussionP
aper|
et al. (2008), among others), there is still a gap of current measurement capabili-ties to be covered between point-scale and large-scale remote sensing (Tapley et al.,2004; Entekhabi et al., 2010). Especially at the intermediate scale (e.g. small catch-ment scale, agricultural-field scale, etc.), measurement techniques for soil moisture arestill under development. Indeed, many methodologies of soil moisture measurements5
at this intermediate scale are investigated such as wireless soil moisture monitoringnetworks (Bogena et al., 2010), spatial TDR network (Graeff et al., 2010), ground-penetrating radar (GPR) measurements (Huisman et al., 2003), electrical resistivitytomography (ERT) measurements (Garre et al., 2011), time-lapse gravity data (Chris-tiansen et al., 2011) and ground-based microwave radiometry (Schwank et al., 2009).10
Recently, integral quantifications of seasonal soil moisture in the root zone at the scaleof a field, a small watershed or a hydrologic response unit have become possiblewith a novel methodology introduced by Zreda et al. (2008) and Desilets et al. (2010)named cosmic-ray sensing. The first steps of this methodology were initially presentedin a case study of Kodama (1984) in which estimations, both snow water equivalent15
and below-ground soil moisture, were indirectly derived by measuring “albedo neu-trons”, secondary products of cosmic radiation. More recently, based on using neutrontransport simulations and field measurements in a grassland, Zreda et al. (2008) andDesilets et al. (2010) presented the first reliable measurements of soil moisture bycounting natural aboveground fast neutrons. This methodology is now being imple-20
mented routinely in the Cosmic-ray Soil Moisture Observing System (COSMOS, Zredaet al., 2012). It is worth mentioning that cosmic-ray sensing (Zreda et al., 2008, De-silets et al., 2010; Franz et al., 2012a, b, 2013) and ground albedo neutron sensing(Kodama et al., 1980, 1985; Rivera Villarreyes et al., 2011) are the same methodology.In this study, we use the term cosmic-ray neutron sensing, which describes better the25
physical basics.Indeed, the cosmic-ray neutron sensing shows a lot of potential for covering data re-
quirements for large-scale studies, e.g. calibration and validation of land surface mod-els and satellite-based soil moisture retrievals. Additionally, these data will improve
4239

HESSD10, 4237–4274, 2013
Soil moisturemeasurement incropped fields
C. A. Rivera Villarreyeset al.
Title Page
Abstract Introduction
Conclusions References
Tables Figures
J I
J I
Back Close
Full Screen / Esc
Printer-friendly Version
Interactive Discussion
Discussion
Paper
|D
iscussionP
aper|
Discussion
Paper
|D
iscussionP
aper|
existing worldwide initiatives of soil moisture monitoring such as the International SoilMoisture Network (ISMN; Dorigo et al., 2011). However, there are still some open ques-tions on this methodology that have to be evaluated with further research, such as fieldverification of measurement volume (vertical penetration depth and horizontal footprint)in complex topographies (i.e. hill slopes); field verification of influence from other water5
environmental compartments (e.g. interception water, bounded water, biomass water,ponded water, etc.) to the soil moisture estimations, meaning possible correction fac-tors; calibration approach without use of complex neutron transport models; transfer-ability of calibration parameters to other times and locations; etc.
Based on the open questions mentioned above, our work is motivated and designed10
to cover the following main objectives:
– to investigate different field calibration approaches for the cosmic-ray neutronsensing;
– to observe the variation of calibration parameters throughout the crop-growingseason;15
– and to extend knowledge of the cosmic-ray neutron sensing to different crops.
2 Materials and methods
2.1 Experimental site and monitoring activities
Fast neutron measurements were carried out at a lowland farmland in Bornim (Bran-denburg, Germany). The experimental site consisted of a 30 ha agricultural cropped20
field and is located close to Potsdam, and 30 km west of Berlin. Soil is mostly homo-geneous with a dominant soil classification of loamy sand (USDA classification). At thesame location, Rivera Villarreyes et al. (2011) applied the cosmic-ray neutron sensingmethod when the field was cropped with corn (Zea mays) in 2010.
4240

HESSD10, 4237–4274, 2013
Soil moisturemeasurement incropped fields
C. A. Rivera Villarreyeset al.
Title Page
Abstract Introduction
Conclusions References
Tables Figures
J I
J I
Back Close
Full Screen / Esc
Printer-friendly Version
Interactive Discussion
Discussion
Paper
|D
iscussionP
aper|
Discussion
Paper
|D
iscussionP
aper|
The first monitoring period in this study consisted of the entire growing season ofsunflower (Helianthus annuus) from 5 May 2011 (initial stage) until 5 September 2011(harvest). Later field activities and monitoring were restarted from 11 November 2011until 25 May 2012 (shortly before harvest), now cropped with winter rye (Secale ce-reale). We call these the sunflower period and the winter rye period. Because this5
study is focused on soil moisture estimations, we do not present data during winterperiod 2011–2012 when soil was frozen and sometimes there was snow.
During the sunflower and winter rye periods, a cosmic-ray soil moisture neutronsensor (CRS-1000, Hydroinnova, Albuquerque, USA), named here with the abbre-viation CRS probe, was installed. The probe contained two proportional counters,10
one counter surrounded by a low-density polyethylene (for fast neutrons) and a sec-ond, bare counter (for thermal neutrons) installed in the center of the field (52.431◦ N,13.021◦ E, WGS84, 84 m a.s.l.) named “A” in Fig. 1. Additionally, the sensor in locationA coincided with a monitoring location in Rivera Villarreyes et al. (2011), since one ob-jective of this study is to verify calibration parameters previously estimated during the15
corn period. The sensor was mounted on a pole at a height of 1.5 m above ground. Theneutron-pulse-counting modules of the CRS probe were set up to record counts every20 min; neutron counts were subsequently integrated into the one-hour time intervalsin data processing. It is well known that CRS uncertainty decreases in low altitudes,such as the Bornim site. However, since our calibration approach is based on a longer20
period (>30 days, cf. 2.3), we expected that this natural uncertainty is not relevant forcalibration.
In this study, twelve FDR (Frequency Domain Reflectometry MR2 probes, Delta-T Devices Ltd., Cambridge, UK) sensors were distributed in Bornim farmland in fivelocations (A–E in Fig. 1) and three depths (5, 20 and 40 cm). All the five locations had25
sensors at 5 and 20 cm depth, but only the locations labeled “B” and “D” had additionaldevices at 40 cm depth. The location of the deepest sensor was defined accordingto predictions of CRS penetration depth (Eq. 1) based on the observed level of soilmoisture from 2010. Additionally, soil texture measurements do not change significantly
4241
HESSD10, 4237–4274, 2013
Soil moisturemeasurement incropped fields
C. A. Rivera Villarreyeset al.
Title Page
Abstract Introduction
Conclusions References
Tables Figures
J I
J I
Back Close
Full Screen / Esc
Printer-friendly Version
Interactive Discussion
Discussion
Paper
|D
iscussionP
aper|
Discussion
Paper
|D
iscussionP
aper|
in the first 50 cm soil layer (cf. Sect. 3.1). Before installation of FDR sensors, soil coreswere extracted at same locations in order to verify FDR field calibration in both periods(sunflower and winter rye).
The FDR probes were used to measure soil moisture every 20 min. Subsequently,FDR soil moisture was averaged to an hourly time step and used for the CRS calibra-5
tion, as is explained in following sections. A field calibration from our previous study(Rivera Villarreyes et al., 2011) was used for FDR sensors.
During the sunflower and winter rye periods, measurements of crop heights weretaken throughout the monitoring period with four replicates of crop height per day ineach monitoring location (A–E; see Fig. 1). This information was used to distinguish10
major crop-growing stages in the monitoring period. Moreover, literature data from theFood and Agriculture Organization (FAO) was used for comparison.
2.2 Basis of the cosmic-ray neutron sensing
Intermediate-energy neutrons called fast neutrons (1–2 MeV; Hess et al., 1961) arecreated as the product of interactions (collisions) between secondary cosmic ray par-15
ticles and land surface materials such as soil, snow, plant canopies, etc. These neu-trons are randomly distributed below and above ground when they penetrate the soil,and later are scattered back into the air. The neutron energy level varies due to sev-eral collisions with soil nuclei. Some neutrons are absorbed completely, and otherscan be modified completely or partially by kinetic losses. In these collisions, the hy-20
drogen’s nuclei play an important role due to its large neutron-moderation capabilities(elastic scattering cross section) compared to other common elements found in soilminerals (Zreda et al., 2008; Rivera Villarreyes et al., 2011). This is the principle whichallows a passive and non-invasive estimation of soil moisture with the cosmic-ray neu-tron sensing. The mathematical function between fast neutrons and soil moisture is25
presented in Table 1.Horizontal spatial coverage of the CRS probe can be defined as the land surface
region from which 86 % of the counted fast neutrons originate. Zreda et al. (2008)4242
HESSD10, 4237–4274, 2013
Soil moisturemeasurement incropped fields
C. A. Rivera Villarreyeset al.
Title Page
Abstract Introduction
Conclusions References
Tables Figures
J I
J I
Back Close
Full Screen / Esc
Printer-friendly Version
Interactive Discussion
Discussion
Paper
|D
iscussionP
aper|
Discussion
Paper
|D
iscussionP
aper|
suggested adopting a value of ca. 600 m diameter. The depth of measurement of theCRS, called effective depth, depends on the mean free path length for elastic collisionsin soil, which is on the scale of tens of centimeters. Soil moisture controls this sampledepth because the probability of neutron scattering and absorption events dependsmainly on the number of hydrogen molecules. Very recently, Franz et al. (2012a) pre-5
sented an equation based on the hydrogen contribution from the soil moisture profileand mineral water content (or lattice water) only, as follows:
z∗ =5.8
ρbdτ +θ+0.0829, (1)
where z∗ is the effective depth of the CRS probe [cm], ρbd is the soil dry bulk density[gcm−3], τ is the weight fraction of lattice water in the mineral grains and bound water10
defined as the amount of water released at 1000 ◦C preceded by drying at 105 ◦C (g ofwater per g of dry minerals, herein known as lattice water), and Cθ is the volumetricpore water content [m3 m−3].
2.3 Calibration of the CRS probe
2.3.1 Corrections15
Prior to the calibration of the CRS probe, fast neutrons were corrected by changes oflocal atmospheric pressure (Rivera Villarreyes et al., 2011), incoming cosmic radiation(Zreda et al., 2012) and atmospheric water vapor (Franz et al., 2012b). In the caseof incoming cosmic rays, the neutron monitoring station Jungfraujoch in Switzerland(www.nmdb.eu) was set up as a reference station. When the neutrons in Jungfraujoch20
were different than the mean historical value of 179.71 countss−1, we assumed thatincoming cosmic rays in Bornim also changed proportionally.
4243

HESSD10, 4237–4274, 2013
Soil moisturemeasurement incropped fields
C. A. Rivera Villarreyeset al.
Title Page
Abstract Introduction
Conclusions References
Tables Figures
J I
J I
Back Close
Full Screen / Esc
Printer-friendly Version
Interactive Discussion
Discussion
Paper
|D
iscussionP
aper|
Discussion
Paper
|D
iscussionP
aper|
2.3.2 Calibration approaches
The calibration methodology is still a very important open question. On the one hand,cosmic-ray neutron sensing was calibrated with Monte Carlo neutron transport simu-lations (Desilets et al., 2010). In the equation proposed for relating soil moisture andfast neutrons (Table 1, Eq. 1), variables a0, a1 and a2 are defined as calibration param-5
eters and parameter N0 as a reference neutron count over dry soil conditions. In thefollowing, Rivera Villarreyes et al. (2011) successfully calibrated the probe modifyinga0, a1 and a2 for a corn field and showed how those have to be adapted when usingdifferent values of N0. Moreover, Franz et al. (2012b) presented a calibration procedurefitting directly a value N0 in a field with 24 % slow-changing vegetation cover, primarily10
composed of creosotebush (Larrea tridentate), grasses, forbes, catci, and mesquite. Inorder to explore the different methodologies and identify better approaches, we usedthree different approaches to calibrate the CRS probe: (i) a fully empirical approach al-tering a0, a1 and a2 freely, (ii) a semi-empirical approach where a0, a1 and a2 are rela-tively modified with respect to the parameter of Desilets (2010), and (iii) a N0-calibration15
approach according to Franz et al. (2012b) and Zreda et al. (2012). All mathematicalrelations for these approaches are presented in Table 1. The semi-empirical approachconsidered the CRS calibration by multiplying the curve of soil moisture–neutrons bya constant (Hydroinnova, 2010). The N0-calibration approach is slightly different fromthe one proposed in the literature, since an optimal single value of N0 for the entire cal-20
ibration period was chosen, instead of the N0 calculated with soil moisture data fromone-day (or six-hour) sampling campaigns. The calibration was done by minimizingthe root mean square error (RMSE) between FDR and CRS with the non-linear leastsquare (NLS) library in R language and environment. The goodness of fit in the cal-ibration was based on the RMSE between FDR observations and CRS soil moisture25
computed for the entire monitoring period, sunflower and winter rye.
4244

HESSD10, 4237–4274, 2013
Soil moisturemeasurement incropped fields
C. A. Rivera Villarreyeset al.
Title Page
Abstract Introduction
Conclusions References
Tables Figures
J I
J I
Back Close
Full Screen / Esc
Printer-friendly Version
Interactive Discussion
Discussion
Paper
|D
iscussionP
aper|
Discussion
Paper
|D
iscussionP
aper|
2.3.3 Calibration scenarios: effect of CRS effective depth
Recently, Franz et al. (2012a) presented an equation for estimation of the CRS penetra-tion depth (Eq. 1), which was evaluated mostly in field without significantly observablechanges of biomass. Therefore, we designed four calibration scenarios to verify therole of the CRS penetration depth and the different ways to integrate reference soil5
moisture for the CRS calibration in depth in cropped fields (Fig. 2):
S1 constant penetration depth and equal neutron weights in depth,
S2 variable penetration depth and equal neutron weights in depth,
S3 constant penetration depth and variable neutron weights in depth, and
S4 variable penetration depth and variable neutron weights in depth.10
In all scenarios the CRS values are taken to represent the soil water mass down tothe effective penetration depth, with the given weighting with depth z∗.
In the case of constant penetration depth (scenario S1), the value of z∗ was set as0.40 m, which is about the mean value between the minimum (12 cm) and the maxi-mum (70 cm) according to Desilets et al. (2010). Also, this depth was chosen for the15
installation of the deepest sensor in the field. The variable penetration depth for S2 wasestimated based on Eq. (1).
Scenarios S3 and S4 consider neutrons from different depths to be contributing dif-ferently to the total count observed above ground (Eq. 3). This is because detectedneutrons do not originate uniformly distributed in depth. In terms of neutron modera-20
tion, neutron intensity tends to decrease exponentially when they penetrate a certainmaterial (Hassanein et al., 2005; Oswald et al., 2008). This exponential decrease isa function of the thickness and neutron scattering properties of the penetrating ma-terial, i.e. soil porous medium. Therefore, we adopt an exponential neutron weightingmodel to account for the neutron contribution from several depths as follows:25
αz = ek ·z/z∗ , (2)4245

HESSD10, 4237–4274, 2013
Soil moisturemeasurement incropped fields
C. A. Rivera Villarreyeset al.
Title Page
Abstract Introduction
Conclusions References
Tables Figures
J I
J I
Back Close
Full Screen / Esc
Printer-friendly Version
Interactive Discussion
Discussion
Paper
|D
iscussionP
aper|
Discussion
Paper
|D
iscussionP
aper|
where αz is the weighting neutron factor [–], z is the vertical depth [m], z∗ is the pen-etration depth or effective depth for the CRS probe [m], and k is a negative constantwhich may depend on nuclear properties of the porous medium. In our case, k valueswere calibrated from FDR soil moisture. Therefore, the soil moisture value weightedaccording to different neutron contributions in depth was defined as follows:5
θavFDR =
z∗∫0αz ·θFDR,z ·dz
z∗∫0αz ·dz
, (3)
where θavFDR is the averaged FDR soil moisture used to calibrate for the CRS probe with
the scenarios S3 and S4 [m3 m−3], θFDR,z is the FDR volumetric soil moisture observed
at depth z [m3 m−3], and αz is the weighting factor at depth z. The effective depth, z∗, isconstant for S3, but variable for S4. In this study, z is only available at depths of 5 cm,10
20 cm, and 40 cm. The definite integral in Eq. (3) was approximated by the trapezoidrule.
In all the scenarios, special weighting was not applied in the horizontal direction. Ourassumption is justified in the very homogeneous soil conditions in Bornim (see discus-sion later). Moreover, others studies (Franz et al., 2012a, b, 2013; Zreda et al., 2012)15
have provided successful calibration with this assumption, even in more heterogeneousfields than Bornim.
2.3.4 Effect of calibration periods and duration
Calibration parameters of the CRS probe were derived using field data of soil moisturefrom the FDR network. Here, we focus on the understanding of how soil moisture esti-20
mation and calibration parameters change if they are calibrated with soil moisture datafrom different crop-growing stages. Thus, the entire monitoring period (cf. Sect. 2.1)
4246

HESSD10, 4237–4274, 2013
Soil moisturemeasurement incropped fields
C. A. Rivera Villarreyeset al.
Title Page
Abstract Introduction
Conclusions References
Tables Figures
J I
J I
Back Close
Full Screen / Esc
Printer-friendly Version
Interactive Discussion
Discussion
Paper
|D
iscussionP
aper|
Discussion
Paper
|D
iscussionP
aper|
was split into six consecutive short periods (D1 to D6, Table 2). Crop heights and FAOrecommendations were used as a proxy to identify these periods. In the case of sun-flower, calibration periods D1–D4 have approximately equal length, coinciding with themain growing stages of sunflower. In winter rye, mid-season and late stage extendedapproximately to 40 and 30 days, respectively. The objective of this subdivision was to5
determine if the crop stage leads to a different set of calibration parameters.
3 Results and discussion
3.1 Spatial variability of soil texture and soil moisture within CRS footprint
Surface soil texture was measured in our previous study (Rivera Villarreyes et al., 2011)in 16 locations (asterisk marks in Fig. 1). Additionally, soil samples were taken in the10
five FDR locations at 5, 10, 20, 30 and 40 cm depths (Fig. 1). Results revealed that soiltexture is very homogenous at the Bornim site, classified as loamy sand, with a highsand content up to 83 %. Moreover, soil texture was observed to change slightly below50 cm depth in two profiles dug up to 150 cm depth in locations B and D. From tex-ture information, therefore, soil heterogeneity is not significant within the measurement15
volume of the CRS probe.In terms of soil moisture, we analyzed old time series of near-surface FDR values
during the corn period in 2010 (Rivera Villarreyes et al., 2011). The idea was to verifywhether five selected locations for the FDR network in the current study (Fig. 1) arerepresentative in respect to 19 FDR locations previously evaluated in the corn period.20
The RMSE and r2 between time series of mean FDR soil moisture with 19 and 5 loca-tions were 0.018 m3 m−3 and 0.952, respectively, concluding that these five locationsare a good simplification of the former FDR network.
The representativeness of five FDR locations selected for this study was also verifiedagainst two soil moisture campaigns in 121 near-surface locations (three replicates at25
each location) within the CRS footprint (Fig. 1). A histogram of soil moisture showed
4247

HESSD10, 4237–4274, 2013
Soil moisturemeasurement incropped fields
C. A. Rivera Villarreyeset al.
Title Page
Abstract Introduction
Conclusions References
Tables Figures
J I
J I
Back Close
Full Screen / Esc
Printer-friendly Version
Interactive Discussion
Discussion
Paper
|D
iscussionP
aper|
Discussion
Paper
|D
iscussionP
aper|
a perfectly normal distribution (data not shown) with standard deviations of 0.014 and0.021 m3 m−3 for the two campaigns, respectively. In the two campaigns, mean soilmoisture was 0.053 and 0.14 m3 m−3. These values were well comparable to meanvalues from the five-FDR network, 0.064±0.006 m3 m−3 and 0.175±0.016 m3 m−3, re-spectively. Therefore, the selected locations for the FDR network in this study (A–E5
in Fig. 1) are considered a good representation of the mean soil moisture at the fieldbased on (i) the assumption that soil moisture variability is higher at 5 cm depth com-pared to deeper locations (e.g. Choi and Jacobs, 2007, among others) and (ii) obser-vations of homogenous soil texture in both vertical and horizontal directions. Finally,this FDR network was used as ground truth in order to calibrate the CRS probe.10
Additionally, the previous field calibration (Rivera Villarreyes et al., 2011) was veri-fied with new soil samples taken prior to installation of FDR sensors in sunflower andwinter rye periods. Gravimetric soil moisture and bulk density were measured from soilcores (100 cm3). Volumetric soil moisture from soil cores was calculated from gravi-metric soil moisture multiplied by the mean bulk density (∼1.40 gcm−3). Subsequently,15
volumetric field soil moisture was compared to the FDR calibration (Rivera Villarreyeset al., 2011). The RMSE between measured soil moisture and FDR estimations wasca. 0.04 m3 m−3.
3.2 Neutron corrections
The standard neutron correction due to changes of atmospheric pressure from the20
cosmic-ray neutron detector was applied in both monitoring periods. Neutrons at theJungfraujoch station showed a decreased tendency (from 0 to 10.7 %) of the incominghigh-energy cosmic rays (data not shown) during the monitoring period. Therefore,corrections were needed. In the case of corrections due to atmospheric water vapor,local variations were smaller and the correction factor was calculated as ca. 0.99925
throughout the monitoring periods. The final range of corrected fast neutrons used forthe CRS probe calibration varied from 668±26 to 1330±36 counts per hour.
4248

HESSD10, 4237–4274, 2013
Soil moisturemeasurement incropped fields
C. A. Rivera Villarreyeset al.
Title Page
Abstract Introduction
Conclusions References
Tables Figures
J I
J I
Back Close
Full Screen / Esc
Printer-friendly Version
Interactive Discussion
Discussion
Paper
|D
iscussionP
aper|
Discussion
Paper
|D
iscussionP
aper|
3.3 Comparison of calibration approaches
Calibration parameters derived in the same field previously cropped with corn in2010 (Rivera Villarreyes et al., 2011) provided a large overestimation of soil moisture(RMSE=0.20 m−3 m−3). The cause of this large discrepancy may be attributed to theCRS penetration depth. In the previous study, the working assumption was that CRS5
penetration depth is comparable to FDR sensors located at 5 cm depth under wet peri-ods only. However, the recently introduced Franz’ equation (2012a) for the CRS pene-tration depth suggested that minimum values could be up to 20 cm depth in respect tothis previous study.
Therefore, in the current study we evaluated four calibration scenarios to account for10
depth information in three calibration approaches named fully empirical, semi-empiricaland N0-calibration (Tables 1, A1, A2 and A3). Overall, calibration approaches fitting ei-ther fcal or N0 (Table A1) provided the maximum values of RMSE between the FDR net-work and CRS probe, compared to the approach fitting a0, a1, and a2. The mean valuesof RMSE (n = 24) obtained are 0.026, 0.032 and 0.044 m3 m−3 for the fully empirical,15
semi-empirical and N0-calibration approaches, respectively. The statistical significanceof the calibration results was tested with an analysis of variance (ANOVA; Driscoll,1996) test and a Student’s t test (Hedderich and Sachs, 2012). In the case of ANOVA,the null hypothesis was defined as H0: µFully = µSemi = µN0
, where µFully, µSemi, and µN0
represent the mean RMSE for the three calibration approaches; the alternative hypoth-20
esis was set as “at least one of the RMSEs is different”. The ANOVA test indicated therejection of the null hypothesis at the 0.05 significance level. Additionally, a one-by-onecomparison of the RMSE mean values with the Student’s t test was set up with nullhypotheses as H0 :µFully = µSemi, H0 :µSemi = µN0
and H0 :µFully = µN0. From the Stu-
dent’s t test, we observed a difference between the three calibration approaches at the25
0.05 significant level. Therefore, minimum RMSE= 0.026±0.008 m3 m−3 for the fullyempirical approach compared to the other two approaches is statistically significant.From the calibration results, we observed that the calibration approach fitting three
4249

HESSD10, 4237–4274, 2013
Soil moisturemeasurement incropped fields
C. A. Rivera Villarreyeset al.
Title Page
Abstract Introduction
Conclusions References
Tables Figures
J I
J I
Back Close
Full Screen / Esc
Printer-friendly Version
Interactive Discussion
Discussion
Paper
|D
iscussionP
aper|
Discussion
Paper
|D
iscussionP
aper|
parameters, as expected, improves significantly the soil moisture performance. How-ever, it will usually require more calibration data compared to single-parameter fittingapproaches.
3.4 Improvement of CRS soil moisture with calibration scenarios
The improvement of CRS soil moisture with the increase of scenario complexity is not5
so evident (Fig. 4). Based on the ANOVA test with null hypothesis set as H0: µS1 =µS2 = µS3 = µS4, where µS1, µS2, µS3 and µS4 are the RMSE for scenarios S1, S2, S3,and S4, the estimated F value (F-Statistics; Silvapulle, 1996) could not reject the nullhypothesis at the 0.05 significance level. Therefore, we conclude that four calibrationscenarios do not present a statistical difference.10
The effective depth for scenarios S2 and S4 ranged between 18 and 45 cmwith the assumptions of τ = 0. Introducing the measured value of lattice waterτ = 0.012 m3 m−3, penetration depth decreased up to 40 cm in dry periods. This valueof lattice water is the mean from five FDR locations at 5, 20 and 40 cm depths. The realpenetration depth may be slightly less than the range estimated here due to influence15
of other hydrogen pools not considered, for example organic matter (< 2 %; Gebberset al., 2009) and biomass. From all calibration datasets and calibration approaches(n = 18), scenario with constant effective depth (RMSE= 0.035±0.012 m3 m−3) andvariable effective depth (RMSE= 0.034±0.014 m3 m−3) do not provide a statistical dif-ference at the 0.05 significant level based on Student’s t test. Therefore, the assump-20
tion of constant penetration (z∗ = 40 cm) of the CRS probe is acceptable for our fieldconditions with a homogenous soil profile at the first 50 cm soil layer.
Moreover in the case of the fully empirical approach, the implementation of a neu-tron weighting function in depth showed no significant difference, with RMSE= 0.034±0.011 and RMSE= 0.033±0.010 m3 m−3 for S3 and S4, respectively. Such observa-25
tions are in agreement with Franz et al. (2012a) and Franz et al. (2012b), as the dif-ference between these scenarios was not relevant to their study either. The fact thatFranz et al. (2012a) and Franz et al. (2012b) evaluated a different neutron weighting
4250

HESSD10, 4237–4274, 2013
Soil moisturemeasurement incropped fields
C. A. Rivera Villarreyeset al.
Title Page
Abstract Introduction
Conclusions References
Tables Figures
J I
J I
Back Close
Full Screen / Esc
Printer-friendly Version
Interactive Discussion
Discussion
Paper
|D
iscussionP
aper|
Discussion
Paper
|D
iscussionP
aper|
function (linear shape) than the exponential-decay form tested in this study suggeststhat a neutron weighting scheme in depth may indeed not alter calibration parameters.
3.5 Crop influence on the cosmic-ray neutron sensing parameters
From statistical analyses, we found a large variability of calibration performance (RMSEincreased from 0.029 to 0.045 m3 m−3) at the 0.05 significance level by choosing differ-5
ent calibration periods (D1–D6). This variability is more evident in the sunflower periodthan in the winter rye period from RMSE values (Fig. 3). This could be attributed todifferences in soil moisture and crop characteristics during these two periods.
Due to the improvement of CRS soil moisture mostly depending on selection of thecalibration period, we opted to investigate how calibration parameters varied through-10
out the growing season. In Fig. 4, optimal calibration parameters for each growingperiod (D1–D6) are presented for each calibration approach. For the fully empiricalapproach only parameter a0 is shown. Parameters a1 and a2 show a similar behav-ior and, therefore, are only reported in the appendix. As was explained in Sect. 3.4,Fig. 4 shows also that parameters do not vary substantially between calibration sce-15
narios. Also, parameter tendency differed for sunflower and winter rye, e.g. parametersa0 and fcal at the mid-season and late stage (Fig. 4). This may be due to different soilmoisture levels observed in periods, length of growing periods and crop characteris-tics (Table 2). In the case of N0 parameters in the sunflower period, these presentedan exponential-decay tendency from initial to mid-season of sunflower, followed by an20
increase of N0 at the late sunflower season. Similar conclusions were drawn by Horn-buckle et al. (2012) with a decrease of N0 according to the increase of corn biomass;in our case N0 tendency was inversely proportional to sunflower height (Figs. 4 and7). Moreover, we also observed the same hysteresis behavior with an increase of N0at the end of the growing season (with expected decrease of sunflower biomass) as25
Hornbuckle et al. (2012). Parameter variability of a0, fcal and N0 was also computed ata daily time resolution throughout sunflower and winter rye periods (data not shown).The parameter variability in the long term (between growing stages) as shown in Fig. 4
4251

HESSD10, 4237–4274, 2013
Soil moisturemeasurement incropped fields
C. A. Rivera Villarreyeset al.
Title Page
Abstract Introduction
Conclusions References
Tables Figures
J I
J I
Back Close
Full Screen / Esc
Printer-friendly Version
Interactive Discussion
Discussion
Paper
|D
iscussionP
aper|
Discussion
Paper
|D
iscussionP
aper|
was significantly higher than the parameter variability within each growing period atthe 0.05 statistical level. Therefore, the fact that the observations of Hornbuckle (2012)derived from single-day soil campaigns are comparable to our approach of selectingthe entire growing period verified the methodology applied here.
3.6 The CRS-derived soil moisture5
Calibration datasets for the mid-season of sunflower (D3) and for the late season ofwinter rye (D6) delivered similar CRS parameters (Table A1) and a minimum RMSEof 0.019 m3 m−3 with the fully empirical approach. Similarity in calibration results (D3and D6) shows the consistency of the calibration approach and its independencyfrom the FDR setup. Moreover, RMSE is comparable to other studies such as Franz10
et al. (2012a) and Franz et al. (2012b). For simplification, calibration results of theD3 period are used in Fig. 5 and the following discussion. Additionally, soil moistureanomalies were computed for CRS and FDR. The anomalies were computed by sub-tracting the mean value from the times series and later dividing by the standard de-viation (Albergel et al., 2012). As they have been applied in other studies (e.g. Al-15
bergel et al., 2012, and references therein), soil moisture anomalies could be useful tocompare observations of different measurement volumes, e.g. remote sensing versusground observations.
In general, the fully empirical approach provided acceptable results of CRS soil mois-ture in terms of dynamics (Fig. 5 lower) and absolute values (Fig. 5 middle) for sun-20
flower and winter rye periods, beside its different measurement volume compared tothe FDR network. However, there are some discrepancies observed in short time pe-riods. For example in the drier period (May 2011) with few precipitation events and adecrease of soil moisture by evapotranspiration, the CRS probe underestimated theFDR soil moisture. Here, calibration parameters (D3) consider already crop influence25
(i.e. biomass and other crop characteristics); therefore, they are prevented from pre-cisely predicting values of soil moisture in the initial sunflower stage (low biomass). Inwet periods of the sunflower season, the CRS is in agreement with precipitation events,
4252

HESSD10, 4237–4274, 2013
Soil moisturemeasurement incropped fields
C. A. Rivera Villarreyeset al.
Title Page
Abstract Introduction
Conclusions References
Tables Figures
J I
J I
Back Close
Full Screen / Esc
Printer-friendly Version
Interactive Discussion
Discussion
Paper
|D
iscussionP
aper|
Discussion
Paper
|D
iscussionP
aper|
which is reflected by the good match to the peaks of FDR soil moisture (e.g. beginningand end of July 2011). On the other hand, the CRS probe sometimes underestimatedFDR soil moisture during the infiltration process (e.g. 25 August 2011). Already Franzet al. (2012a) showed this hysteresis behavior of the CRS probe during periods ofinfiltration, evaporation and drainage.5
Calibrated CRS parameters performed acceptably during the winter rye period interms of absolute values (Fig. 5 middle). From soil moisture anomalies (Fig. 5 lower),sometimes CRS showed a steeper decrease compared to the FDR network in thewinter rye period, e.g. from middle to end of May 2012. In general, the mean CRS soilmoisture was higher than the mean FDR during the sunflower period. However, this10
CRS mean tendency was slightly smaller than the FDR mean tendency in the winterrye period.
Discrepancies between the CRS probe and FDR network during sunflower and win-ter rye periods are attributed to changes of H pools moderating fast neutrons. As hasbeen observed, lattice water (Zreda et al., 2012), organic matter, biomass (Hornbuckle15
et al., 2012), atmospheric water vapor (Franz et al., 2012b), etc., could affect CRSsignal. Measurement of lattice water showed values below 0.012 m3 m−3, expected forsandy soils; therefore its importance is not relevant in this study. Organic matter wasmeasured below 2 %, in concordance with Gebbers et al. (2009), which may not con-tribute significantly to the neutron moderation. Therefore, major H moderations to fast20
neutrons are expected to come from soil moisture and crop, as discussed in the follow-ing section.
3.7 Understanding the CRS signal in cropped fields
Temporal variability of crop hydrogen pools throughout the season, as well spatialvariability within the crop aboveground biomass and root distribution, makes it more25
challenging to interpret the CRS signal in a cropped field. For example, fast neutrondecreased throughout the sunflower season (at least until its maximum stage) from918–1188 counts per hour (initial stage with 5 cm height) up to 682–970 counts per
4253

HESSD10, 4237–4274, 2013
Soil moisturemeasurement incropped fields
C. A. Rivera Villarreyeset al.
Title Page
Abstract Introduction
Conclusions References
Tables Figures
J I
J I
Back Close
Full Screen / Esc
Printer-friendly Version
Interactive Discussion
Discussion
Paper
|D
iscussionP
aper|
Discussion
Paper
|D
iscussionP
aper|
hour (middle season with maximum height of ca. 150 cm). Thus, the relation betweenfast neutrons and soil moisture is not unique throughout the crop season. This behav-ior is shown in Fig. 6 with a scatter plot between soil moisture and relative neutrons.Here, the CRS calibration curve could be readjusted by adding or subtracting 5 % (v/v)to account for temporal variability of crop properties affecting fast neutrons in the sun-5
flower period. On the other hand, the calibration curve (D3) fitted well datasets for themid-season (D5) and late season (D6) of winter rye. In these last two periods, neutronmoderation may be similar to the D3 period of sunflower; here two crops present itsmaximum yield, maximum height, maximum water content, etc.
Calibration parameters differed throughout crop stages (cf. Sects. 3.3–3.5). Differ-10
ence of CRS soil moisture by parameter differences is related to some time-variablecrop characteristic. For instance, absolute mean difference between CRS soil moistureusing D1 (low biomass and low root density) and D3 (high biomass and well-developedroot structure) parameters (∆θcrop) is well correlated to changes of crop height. Thisobservation is consistent for the three calibration approaches (Fig. 7 left side). More-15
over, it seems that the CRS signal is not affected significantly until a sunflower height ofca. 50 cm. Temporal variability of ∆θcrop followed well temporal dynamics of crop height(Fig. 7 right side). Moreover, this temporal trend of ∆θcrop was also verified against es-timations of leaf area index using Mailhol’s model (1997) based on heat accumulation(Growing Degree Days).20
The CRS signal is better understood with all environmental H pools considered, e.g.the study of Franz et al. (2013) at USA forest sites. In seasonal crops with fast-changingcharacteristics (i.e. aboveground biomass, biomass water content, root water contentand others), these H pools may be not easily quantified due to limited frequency ofmeasurements and invasiveness of existing measurement techniques (e.g. for roots25
and biomass). So alternatively, we proposed a simple measure to further understandthe neutron attenuation by the presence of a crop.
Our simple approach was based on the calculation of the neutron counts by the in-version of the CRS equation for known FDR soil moisture, named Nexp. These are
4254

HESSD10, 4237–4274, 2013
Soil moisturemeasurement incropped fields
C. A. Rivera Villarreyeset al.
Title Page
Abstract Introduction
Conclusions References
Tables Figures
J I
J I
Back Close
Full Screen / Esc
Printer-friendly Version
Interactive Discussion
Discussion
Paper
|D
iscussionP
aper|
Discussion
Paper
|D
iscussionP
aper|
the neutrons counted if a crop would not have been present. The real number ofcounts (NCRS) is directly measured in the CRS probe. Subsequently, the differencebetween Nexp and NCRS may be a measure of the attenuated neutrons by the croppresence (Natt). Figure 8 shows the relation between Natt and calibrated parameter N0for datasets D1–D6. Parameter N0 was chosen as reference in order to compare neu-5
trons versus neutrons. Results suggested an excellent agreement of N0 with Natt (r2 =0.973) for sunflower and winter rye. The decreased tendency of N0 values with respectto Natt (Fig. 8) was expected; the higher N0 values at the initial sunflower stage cor-responded to the lower values of Natt and vice versa. Maximum attenuation occurredat maximum crop stage in both sunflower and winter rye, i.e. large biomass and well-10
developed root structure. The fact that Natt is not zero at the initial sunflower stage maybe due to (i) its variability in biomass and root and/or (ii) Poisson’s variability of neutroncounts. Finally, we conclude that variability of N0 substantially depends on the neutronsattenuated by additional H pools to soil moisture. Further research directions could beoriented to estimate values of Natt from Monte Carlo neutron transport simulations with15
observed field profiles of soil moisture and situations with variable crop cover and rootdistribution. This information would provide an additional overview on how much Natt isaffected by a crop, as an entire system, and its parts in order to verify more preciselythe link between N0 and Natt.
4 Summary and conclusions20
This study evaluates the applicability of the cosmic-ray neutron sensing method for soilmoisture measurements in a farmland cropped with sunflower in 2011 and winter rye in2012. The main objectives of this study were (i) to investigate different field calibrationapproaches for cropped fields, (ii) to observe the variation of calibration parametersthroughout the crop-growing season, and (iii) to extend knowledge of cosmic-ray neu-25
tron sensing to different crops. We presented three calibration approaches for the CRSprobe (fully empirical, semi-empirical, and N0-calibration) evaluated with six calibration
4255

HESSD10, 4237–4274, 2013
Soil moisturemeasurement incropped fields
C. A. Rivera Villarreyeset al.
Title Page
Abstract Introduction
Conclusions References
Tables Figures
J I
J I
Back Close
Full Screen / Esc
Printer-friendly Version
Interactive Discussion
Discussion
Paper
|D
iscussionP
aper|
Discussion
Paper
|D
iscussionP
aper|
periods (sunflower and winter rye) and four calibration scenarios. This study kept theinvariant known mathematical relation between fast neutrons and soil moisture. TheCRS calibration parameters found in this study intend to suggest future research direc-tions (e.g. crop correction factors) to make long-term CRS probe monitoring feasible,especially in places with seasonal crops.5
The CRS probe was calibrated against a FDR network, which observes soil mois-ture at the point scale and is used as ground truth. According to field information (soiltexture, lattice water, soil moisture from two sampling campaigns and others), soil het-erogeneity is not significant within the CRS measurement volume. Therefore, a muchdenser FDR network would not modify the findings of this study. From calibration pos-10
sibilities presented here, the fully empirical calibration approach provided the best cal-ibration results compared to other two approaches, independent from the calibrationscenarios. Calibration parameters are highly variable throughout the vegetative peri-ods; therefore, improvement of CRS soil moisture mainly depends on the selection ofcalibration period. Two calibration periods were identified to provide minimum values15
of RMSE, mid-season of sunflower (D3) and late season of winter rye (D6). Similarityin calibration results (D3 and D6) supports the consistency of the calibration approachand its independency from the FDR setup. It is worth mentioning that FDR sensor lo-cations were not necessarily the same in both monitoring periods due to positioningaccuracy, soil re-structure by farming practices, etc.20
This study did not measure directly biomass components that may moderate fastneutrons (i.e. fresh matter and water content); instead crop height was used as a simpleproxy to identify growing stages and, therefore, possible maximum periods of biomass.Likewise, other crop characteristics such as root density, cellulose fraction, stem diam-eter, etc., may be used at a degree similar to or higher than crop height.25
From calibration scenarios designed in this study, the issues of the penetration depthand the soil moisture distribution in depth were also evaluated. Results did not revealstatistical differences using complex calibration scenarios with variable penetration
4256

HESSD10, 4237–4274, 2013
Soil moisturemeasurement incropped fields
C. A. Rivera Villarreyeset al.
Title Page
Abstract Introduction
Conclusions References
Tables Figures
J I
J I
Back Close
Full Screen / Esc
Printer-friendly Version
Interactive Discussion
Discussion
Paper
|D
iscussionP
aper|
Discussion
Paper
|D
iscussionP
aper|
depth and weighting functions in depth. However, we expect these conclusions maychange in other fields with strong vertical soil layering.
Overall, this study successfully tested the applicability of the cosmic-ray neutronsensing methodology in cropped fields. The message and conclusions to take homefrom this study are condensed into the following four points: (i) the CRS-derived soil5
moisture for cropped fields is highly affected throughout the growing periods, and (ii) itscalibration parameters are time-dependent and crop-dependent. Parameter variabilitybetween sunflower and winter rye may be attributed to how these crops modify its cropwater content (temporal and spatial) and other characteristics throughout its growingperiod. Moreover, (iii) CRS uncertainty can be related to some properties such as crop10
height, and the CRS parameter variability (N0) could be associated by predicting theattenuated neutrons by crop presence. In general, (iv) the cosmic-ray neutron sens-ing methodology has the potential to provide measurements between point scale andremote sensing scale; however, special attention should be taken in cropped fields.A further recommendation of this study is the need for neutron correction factors to15
deal with the problem of the biomass influence (and other crop characteristics) on theCRS soil moisture.
Acknowledgement. This study was partly funded by the German Ministry of Education andResearch (BMBF) as part of IPSWaT (International Postgraduate Studies in Water Technolo-gies). The research was supported by the Helmholtz Centre for Environmental Research (UFZ)20
and TERENO (Terrestrial Environmental Observatories) by providing the cosmic-ray sensor.Furthermore, we thank the Leibniz Institute for Agricultural Engineering Potsdam-Bornim (ATB)for their support, especially Robin Gebbers for conveying the experimental site and supportingour field work in Bornim. We also acknowledge the NMDB database (www.nmdb.eu), foundedunder the European Union’s FP7 programme (contract no. 213007) for providing cosmic-ray25
data, namely from the Jungfraujoch, JUNG, station. We also thank Ute Wollschlager (UFZ) andSteffen Zacharias (UFZ) for their critical and helpful comments in a previous version of thismanuscript.
4257

HESSD10, 4237–4274, 2013
Soil moisturemeasurement incropped fields
C. A. Rivera Villarreyeset al.
Title Page
Abstract Introduction
Conclusions References
Tables Figures
J I
J I
Back Close
Full Screen / Esc
Printer-friendly Version
Interactive Discussion
Discussion
Paper
|D
iscussionP
aper|
Discussion
Paper
|D
iscussionP
aper|
References
Albergel, C., Calvet, J.-C., de Rosnay, P., Balsamo, G., Wagner, W., Hasenauer, S., Naeimi, V.,Martin, E., Bazile, E., Bouyssel, F., and Mahfouf, J.-F.: Cross-evaluation of modelled andremotely sensed surface soil moisture with in situ data in southwestern France, Hydrol. EarthSyst. Sci., 14, 2177–2191, doi:10.5194/hess-14-2177-2010, 2010.5
Albergel, C., de Rosnay, P., Gruhier, C., Munoz-Sabater, J., Hasenauer, S., Isaksen, L., Kerr, Y.,and Wagner, W.: Evaluation of remotely sensed and modelled soil moisture products usingglobal ground-based in situ observations, Remote Sens. Environ., 118, 215–226, 2012.
Bogena, H. R., Herbst, M., Huisman, J. A., Rosenbaum, U., Weuthen, A., and Vereecken, H.:Potential of wireless sensor networks for measuring soil water content variability, Vadose10
Zone J., 9, 1002–1013, doi:10.2136/vzj2009.0173, 2010.Brocca, L., Melone, F., Moramarco, T., Wagner, W., Naeimi, V., Bartalis, Z., and Hasenauer, S.:
Improving runoff prediction through the assimilation of the ASCAT soil moisture product,Hydrol. Earth Syst. Sci., 14, 1881–1893, doi:10.5194/hess-14-1881-2010, 2010.
Champagne, C., McNairn, H., and Berg, A. A.: Monitoring agricultural soil moisture extremes in15
Canada using passive microwave remote sensing, Remote Sens. Environ., 115, 2434–2444,2011.
Choi, M. and Jacobs, J. M.: Soil moisture variability of root zone profiles within SMEX02 remotesensing footprints, Adv. Water Resour., 30, 883–896, doi:10.1016/j.advwatres.2006.07.007,2007.20
Christiansen, L., Haarder, E. B., Hansen, A. B., Looms, M. C., Binning, P. J., Rosbjerg, D.,Andersen, O. B., and Bauer-Gottwein, P.: Calibrating Vadose Zone Models with time-lapsegravity data, Vadose Zone J., 10, 1034–1044, doi:10.2136/vzj2010.0127, 2011.
Desilets, D., Zreda, M., and Ferre, T. P. A.: Nature’s neutron probe: Land surface hy-drology at an elusive scale with cosmic rays, Water Resour. Res., 46, W11505,25
doi:10.1029/2009wr008726, 2010.Dorigo, W. A., Wagner, W., Hohensinn, R., Hahn, S., Paulik, C., Xaver, A., Gruber, A., Dr-
usch, M., Mecklenburg, S., van Oevelen, P., Robock, A., and Jackson, T.: The InternationalSoil Moisture Network: a data hosting facility for global in situ soil moisture measurements,Hydrol. Earth Syst. Sci., 15, 1675–1698, doi:10.5194/hess-15-1675-2011, 2011.30
Driscoll, W. C.: Robustness of the ANOVA and Tukey–Kramer statistical tests, Comput. Ind.Eng., 31, 265–268, 1996.
4258

HESSD10, 4237–4274, 2013
Soil moisturemeasurement incropped fields
C. A. Rivera Villarreyeset al.
Title Page
Abstract Introduction
Conclusions References
Tables Figures
J I
J I
Back Close
Full Screen / Esc
Printer-friendly Version
Interactive Discussion
Discussion
Paper
|D
iscussionP
aper|
Discussion
Paper
|D
iscussionP
aper|
Entekhabi, D., Njoku, E. G., O’Neill, P. E., Kellogg, K. H., Crow, W. T., Edelstein, W. N.,Entin, J. K., Goodman, S. D., Jackson, T. J., Johnson, J., Kimball, J., Piepmeier, J. R.,Koster, R. D., Martin, N., McDonald, K. C., Moghaddam, M., Moran, S., Reichle, R., Shi, J. C.,Spencer, M. W., Thurman, S. W., Tsang, L., and Van Zyl, J.: The Soil Moisture Active Passive(SMAP) Mission, P. IEEE, 98, 704–716, doi:10.1109/JPROC.2010.2043918, 2010.5
Franz, T. E., Zreda, M., Ferre, T. P. A., Rosolem, R., Zweck, C., Stillman, S. Z. X., and Shuttle-worth, W. J.: Measurement depth of the cosmic-ray soil moisture probe affected by hydrogenfrom various sources, Water Resour. Res., 48, W08515, doi:10.1029/2012wr011871, 2012a.
Franz, T. E., Zreda, M., Rosolem, R., and Ferre, T. P. A.: Field Validation of a cosmic-ray neutronsensor using a distributed sensor network, Vadose Zone J., 11, 4, doi:10.2136/vzj2012.0046,10
2012b.Franz, T. E., Zreda, M., Rosolem, R., and Ferre, T. P. A.: A universal calibration function for
determination of soil moisture with cosmic-ray neutrons, Hydrol. Earth Syst. Sci., 17, 453–460, doi:10.5194/hess-17-453-2013, 2013.
Garre, S., Javaux, M., Vanderborght, J., Pages, L., and Vereecken, H.: Three-dimensional elec-15
trical resistivity tomography to monitor root zone water dynamics, Vadose Zone J., 10, 412–424, doi:10.2136/vzj2010.0079, 2011.
Graeff, T., Zehe, E., Schlaeger, S., Morgner, M., Bauer, A., Becker, R., Creutzfeldt, B., andBronstert, A.: A quality assessment of Spatial TDR soil moisture measurements in homoge-nous and heterogeneous media with laboratory experiments, Hydrol. Earth Syst. Sci., 14,20
1007–1020, doi:10.5194/hess-14-1007-2010, 2010.Hassanein, R., Lehmann, E., and Vontobel, P.: Methods of scattering corrections for quantitative
neutron radiography, Nucl. Instrum. Meth. A, 542, 353–360, 2005.Hess, W. N., Canfield, E. H., and Lingenfelter, R. E.: Cosmic-ray neutron demography, J. Geo-
phys. Res., 66, 665–677, doi:10.1029/JZ066i003p00665, 1961.25
Hornbuckle, B., Irvin, S., Franz, T. E., Rosolem, R., and Zweck, C.: The potential of the COS-MOS network to be a source of new soil moisture information for SMOS and SMAP, in:Proc. Geoscience and Remote Sensing Symposium (IGARSS), 22–27 July 2012, Munich,Germany, IEEE International, 1243–1246, doi:10.1109/IGARSS.2012.6351317, 2012.
Huisman, J. A., Hubbard, S. S., Redman, J. D., and Annan, A. P.: Measuring soil wa-30
ter content with ground penetrating radar: a review, Vadose Zone J., 2, 476–491,doi:10.2136/vzj2003.4760, 2003.
4259

HESSD10, 4237–4274, 2013
Soil moisturemeasurement incropped fields
C. A. Rivera Villarreyeset al.
Title Page
Abstract Introduction
Conclusions References
Tables Figures
J I
J I
Back Close
Full Screen / Esc
Printer-friendly Version
Interactive Discussion
Discussion
Paper
|D
iscussionP
aper|
Discussion
Paper
|D
iscussionP
aper|
Hydroinnova: Technical Document 01-07: Soil Water Content Measurements with CosmicRays, Albuquerque, New Mexico, 2010.
Kodama, M.: Continuous monitoring of snow water equivalent using cosmic ray neutrons, ColdReg. Sci. Technol., 3, 295–303, 1980.
Kodama, M.: An introduction to applied cosmic ray physics, Jpn. J. Appl. Phys., 23, 726–728,5
1984.Kodama, M., Kudo, S., and Kosuge, T.: Application of atmospheric neutrons to soil moisture
measurement, Soil Sci., 140, 237–242, 1985.Koster, R. D., Mahanama, S. P. P., Livneh, B., Lettenmaier, D. P., and Reichle, R. H.: Skill
in streamflow forecasts derived from large-scale estimates of soil moisture and snow, Nat.10
Geosci., 3, 613–616, 2010.Mailhol, J. C., Olufayo, A. A., and Ruelle, P.: Sorghum and sunflower evapotranspiration and
yield from simulated leaf area index, Agr. Water Manage., 35, 167–182, 1997.Neutron Monitor Database: available at: http://www.nmdb.eu/, last access: 5 March, 2013.Oswald, S. E., Menon, M., Carminati, A., Vontobel, P., Lehmann, E., and Schulin, R.: Quan-15
titative imaging of infiltration, root growth, and root water uptake via neutron radiography,Vadose Zone J., 7, 1035–1047, doi:10.2136/vzj2007.0156, 2008.
Patterson, B. M. and Bekele, E. B.: A novel technique for estimating wetting front migrationrates through the vadose zone based on changes in groundwater velocity, J. Hydrol., 409,538–544, 2011.20
Porporato, A. and Rodriguez-Iturbe, I.: Ecohydrology-a challenging multidisciplinary researchperspective/ ecohydrologie: une perspective stimulante de recherche multidisciplinaire, Hy-drolog. Sci. J., 47, 811–821, doi:10.1080/02626660209492985, 2002.
Rivera Villarreyes, C. A., Baroni, G., and Oswald, S. E.: Integral quantification of seasonal soilmoisture changes in farmland by cosmic-ray neutrons, Hydrol. Earth Syst. Sci., 15, 3843–25
3859, doi:10.5194/hess-15-3843-2011, 2011.Robinson, D. A., Campbell, C. S., Hopmans, J. W., Hombuckle, B. K., Jones, S. B.,
Knight, R., Ogden, F., Selker, J., and Wendroth, O.: Soil moisture measurement for ecologi-cal and hydrological watershed-scale observatories: a review, Vadose Zone J., 7, 358–389,doi:10.2136/vzj2007.0143, 2008.30
Schwank, M., Wiesmann, A., Werner, C., Matzler, C., Weber, D., Murk, A., Volksch, I., andWegmuller, U.: ELBARA II, an L-band radiometer system for soil moisture research, Sensors,10, 584–612, 2009.
4260

HESSD10, 4237–4274, 2013
Soil moisturemeasurement incropped fields
C. A. Rivera Villarreyeset al.
Title Page
Abstract Introduction
Conclusions References
Tables Figures
J I
J I
Back Close
Full Screen / Esc
Printer-friendly Version
Interactive Discussion
Discussion
Paper
|D
iscussionP
aper|
Discussion
Paper
|D
iscussionP
aper|
Silvapulle, M. J.: On an F-type statistic for testing one-sided hypotheses and computation ofchi-bar-squared weights, Stat. Probabil. Lett., 28, 137–141, 1996.
Steenbergen, N. V. and Willems, P.: Method for testing the accuracy of rainfall–runoff modelsin predicting peak flow changes due to rainfall changes, in a climate changing context, J.Hydrol., 414–415, 425–434, 2012.5
Sun, H., Nelson, M., Chen, F., and Husch, J.: Soil mineral structural water loss during LOIanalyses, Can. J. Soil Sci., 89, 603–610, 2009.
Tapley, B. D., Bettadpur, S., Ries, J. C., Thompson, P. F., and Watkins, M. M.:GRACE measurements of mass variability in the earth system, Science, 305, 503–505,doi:10.1126/science.1099192, 2004.10
Team, T. G., Koster, R. D., Dirmeyer, P. A., Guo, Z., Bonan, G., Chan, E., Cox, P., Gordon, C. T.,Kanae, S., Kowalczyk, E., Lawrence, D., Liu, P., Lu, C. H., Malyshev, S., McAvaney, B.,Mitchell, K., Mocko, D., Oki, T., Oleson, K., Pitman, A., Sud, Y. C., Taylor, C. M., Verseghy, D.,Vasic, R., Xue, Y., and Yamada, T.: Regions of strong coupling between soil moisture andprecipitation, Science, 305, 1138–1140, doi:10.1126/science.1100217, 2004.15
Vereecken, H., Huisman, J. A., Bogena, H. R., Vanderborght, J., Vrugt, J. A., and Hop-mans, J. W.: On the value of soil moisture measurements in vadose zone hydrology: a re-view., Water Resour. Res., 44, W00D06, doi:10.1029/2008WR006829, 2008.
Vico, G. and Porporato, A.: From rainfed agriculture to stress-avoidance irrigation: I. A gen-eralized irrigation scheme with stochastic soil moisture, Adv. Water Resour., 34, 263–271,20
2011.Western, A. W., Grayson, R. B., and Bloshl, G.: Scaling of soil moisture: a hydrologic perspec-
tive, Annu. Rev. Earth Pl. Sc., 30, 149–180, doi:10.1146/annurev.earth.30.091201.140434,2002.
Zreda, M., Desilets, D., Ferre, T. P. A., and Scott, R. L.: Measuring soil moisture content non-25
invasively at intermediate spatial scale using cosmic-ray neutrons, Geophys. Res. Lett., 35,1–5, 2008.
Zreda, M., Shuttleworth, W. J., Zeng, X., Zweck, C., Desilets, D., Franz, T., and Rosolem, R.:COSMOS: the COsmic-ray Soil Moisture Observing System, Hydrol. Earth Syst. Sci., 16,4079–4099, doi:10.5194/hess-16-4079-2012, 2012.30
4261

HESSD10, 4237–4274, 2013
Soil moisturemeasurement incropped fields
C. A. Rivera Villarreyeset al.
Title Page
Abstract Introduction
Conclusions References
Tables Figures
J I
J I
Back Close
Full Screen / Esc
Printer-friendly Version
Interactive Discussion
Discussion
Paper
|D
iscussionP
aper|
Discussion
Paper
|D
iscussionP
aper|
Table 1. Definition of calibration approaches applied in this study for the sunflower period. TheθCRS is the volumetric areal mean soil moisture [m3 m−3], N is the corrected neutron countingrate [–], ρb is the mean bulk density [kg m−3], ρw is water density [kgm−3], ai are dimensionlesscalibration parameters [–], and N0 is defined as the corrected neutron counting rate over dry soilunder the same reference conditions used for N. Note that the N0 value for the fully empiricaland semi-empirical approaches was set up to the maximum counting rate measured in the field.
Calibration approach Equation Fitting parameters
Fully empirical θCRS = ao
N/N0−a1−a2 a0,a1,a2
Semi-empirical θCRS =(
0.0808N/N0−0.372
− 0.115)· fcal fcal
N0-calibration θCRS = 0.0808N/N0−0.372
− 0.115 N0
4262

HESSD10, 4237–4274, 2013
Soil moisturemeasurement incropped fields
C. A. Rivera Villarreyeset al.
Title Page
Abstract Introduction
Conclusions References
Tables Figures
J I
J I
Back Close
Full Screen / Esc
Printer-friendly Version
Interactive Discussion
Discussion
Paper
|D
iscussionP
aper|
Discussion
Paper
|D
iscussionP
aper|
Table 2. Field characteristics of the calibration periods during sunflower and winter rye periods.Notice that FDR soil moisture presented in the table corresponds to the mean value at 5, 20and 40 cm depth.
Growing Duration Crop height FDR soil moisturePeriod Crop stage [days] [cm] [m3 m−3]
D1 Sunflower Initial 30 5–30 0.069–0.119D2 Sunflower Development 30 30–110 0.046–0.141D3 Sunflower Mid-season 30 110–150 0.090–0.224D4 Sunflower Late 34 110–125 0.122–0.165D5 Winter rye Mid-season 40 30–140 0.045–0.105D6 Winter rye Late 33 140–150 0.057–0.179
4263

HESSD10, 4237–4274, 2013
Soil moisturemeasurement incropped fields
C. A. Rivera Villarreyeset al.
Title Page
Abstract Introduction
Conclusions References
Tables Figures
J I
J I
Back Close
Full Screen / Esc
Printer-friendly Version
Interactive Discussion
Discussion
Paper
|D
iscussionP
aper|
Discussion
Paper
|D
iscussionP
aper|
Table A1. Fully empirical calibration approach and its four calibration scenarios: (S1) constantz∗ and no neutron weighting scheme, (S2) variable z∗ and no neutron weighting scheme, (S3)constant z∗ and neutron weighting scheme, and (S4) variable z∗ and neutron weighting scheme.The RMSE was calculated for the entire monitoring period.
Scenarios Datasets Crop a0 a1 a2 k RMSE[–] [–] [–] [–] [m3 m−3]
S1 D1 Sunflower 0.133 0.001 0.076 0.025S1 D2 Sunflower 0.035 0.219 0.001 0.036S1 D3 Sunflower 0.050 0.319 0.039 0.019S1 D4 Sunflower 0.092 0.001 0.001 0.040S2 D1 Sunflower 0.137 0.001 0.087 0.022S2 D2 Sunflower 0.035 0.283 0.001 0.027S2 D3 Sunflower 0.055 0.303 0.043 0.019S2 D4 Sunflower 0.086 0.001 0.001 0.034S3 D1 Sunflower 0.124 0.001 0.062 −0.010 0.026S3 D2 Sunflower 0.037 0.219 0.001 −0.010 0.033S3 D3 Sunflower 0.063 0.284 0.057 −2.965 0.019S3 D4 Sunflower 0.094 0.001 0.001 −0.010 0.042S4 D1 Sunflower 0.124 0.001 0.062 −0.010 0.026S4 D2 Sunflower 0.037 0.219 0.001 −0.010 0.033S4 D3 Sunflower 0.059 0.295 0.050 −1.887 0.019S4 D4 Sunflower 0.093 0.001 0.001 −0.050 0.041S1 D5 Winter rye 0.113 0.001 0.070 0.023S1 D6 Winter rye 0.038 0.374 0.024 0.019S2 D5 Winter rye 0.071 0.188 0.049 0.022S2 D6 Winter rye 0.038 0.374 0.024 0.019S3 D5 Winter rye 0.138 0.001 0.105 −1.021 0.021S3 D6 Winter rye 0.069 0.282 0.066 −2.015 0.019S4 D5 Winter rye 0.135 0.001 0.101 −0.890 0.021S4 D6 Winter rye 0.056 0.323 0.050 −1.522 0.019
4264

HESSD10, 4237–4274, 2013
Soil moisturemeasurement incropped fields
C. A. Rivera Villarreyeset al.
Title Page
Abstract Introduction
Conclusions References
Tables Figures
J I
J I
Back Close
Full Screen / Esc
Printer-friendly Version
Interactive Discussion
Discussion
Paper
|D
iscussionP
aper|
Discussion
Paper
|D
iscussionP
aper|
Table A2. Semi-empirical calibration approach and its four calibration scenarios: (S1) constantz∗ and no neutron weighting scheme, (S2) variable z∗ and no neutron weighting scheme, (S3)constant z∗ and neutron weighting scheme, and (S4) variable z∗ and neutron weighting scheme.The RMSE was calculated for the entire monitoring period.
Scenario Dataset Crop fcal k RMSE[–] [–] [m3 m−3]
S1 D1 Sunflower 1.002 0.058S1 D2 Sunflower 0.529 0.032S1 D3 Sunflower 0.583 0.028S1 D4 Sunflower 0.670 0.026S2 D1 Sunflower 0.936 0.049S2 D2 Sunflower 0.605 0.027S2 D3 Sunflower 0.587 0.028S2 D4 Sunflower 0.627 0.026S3 D1 Sunflower 0.963 −1.001 0.053S3 D2 Sunflower 0.550 −3.129 0.030S3 D3 Sunflower 0.590 −2.404 0.028S3 D4 Sunflower 0.608 <−10 0.027S4 D1 Sunflower 0.912 −1.961 0.046S4 D2 Sunflower 0.554 −2.737 0.030S4 D3 Sunflower 0.588 −1.559 0.028S4 D4 Sunflower 0.607 <−10 0.027S1 D5 Winter rye 0.796 0.033S1 D6 Winter rye 0.699 0.026S2 D5 Winter rye 0.773 0.031S2 D6 Winter rye 0.699 0.026S3 D5 Winter rye 0.789 −2.600 0.032S3 D6 Winter rye 0.728 −1.499 0.028S4 D5 Winter rye 0.792 −2.340 0.033S4 D6 Winter rye 0.729 −1.340 0.028
4265

HESSD10, 4237–4274, 2013
Soil moisturemeasurement incropped fields
C. A. Rivera Villarreyeset al.
Title Page
Abstract Introduction
Conclusions References
Tables Figures
J I
J I
Back Close
Full Screen / Esc
Printer-friendly Version
Interactive Discussion
Discussion
Paper
|D
iscussionP
aper|
Discussion
Paper
|D
iscussionP
aper|
Table A3. N0-calibration approach and its four calibration scenarios: (S1) constant z∗ and noneutron weighting scheme, (S2) variable z∗ and no neutron weighting scheme, (S3) constantz∗ and neutron weighting scheme, and (S4) variable z∗ and neutron weighting scheme. TheRMSE was calculated for the entire monitoring period.
Scenario Dataset Crop N0 k RMSE[cph] [–] [m3 m−3]
S1 D1 Sunflower 1333.0 0.059S1 D2 Sunflower 1159.4 0.033S1 D3 Sunflower 1162.7 0.033S1 D4 Sunflower 1202.4 0.029S2 D1 Sunflower 1312.1 0.051S2 D2 Sunflower 1191.2 0.029S2 D3 Sunflower 1164.6 0.033S2 D4 Sunflower 1182.9 0.030S3 D1 Sunflower 1331.8 −0.195 0.058S3 D2 Sunflower 1169.7 −5.291 0.032S3 D3 Sunflower 1166.1 −2.475 0.032S3 D4 Sunflower 1173.4 < −10 0.031S4 D1 Sunflower 1320.4 −0.807 0.054S4 D2 Sunflower 1171.1 −4.968 0.031S4 D3 Sunflower 1165.2 −1.607 0.032S4 D4 Sunflower 1173.0 < −10 0.031S1 D5 Winter rye 1274.5 0.038S1 D6 Winter rye 1229.9 0.030S2 D5 Winter rye 1266.0 0.036S2 D6 Winter rye 1229.9 0.030S3 D5 Winter rye 1268.9 −3.064 0.037S3 D6 Winter rye 1242.6 −1.749 0.031S4 D5 Winter rye 1270.0 −2.790 0.037S4 D6 Winter rye 1243.1 −1.574 0.031
4266

HESSD10, 4237–4274, 2013
Soil moisturemeasurement incropped fields
C. A. Rivera Villarreyeset al.
Title Page
Abstract Introduction
Conclusions References
Tables Figures
J I
J I
Back Close
Full Screen / Esc
Printer-friendly Version
Interactive Discussion
Discussion
Paper
|D
iscussionP
aper|
Discussion
Paper
|D
iscussionP
aper|
27
693
694
Figure 1. Monitoring network in Bornim during sunflower and winter rye periods: FDR 695
soil moisture network (A, B, C, D and E) and CRS probe at location A. Theoretical CRS 696
probe footprint is represented by 600 m diameter circle. 697
Fig. 1. Monitoring network in Bornim during sunflower and winter rye periods: FDR soil moisturenetwork (A–E) and CRS probe at location A. Theoretical CRS probe footprint is represented bya 600 m-diameter circle.
4267

HESSD10, 4237–4274, 2013
Soil moisturemeasurement incropped fields
C. A. Rivera Villarreyeset al.
Title Page
Abstract Introduction
Conclusions References
Tables Figures
J I
J I
Back Close
Full Screen / Esc
Printer-friendly Version
Interactive Discussion
Discussion
Paper
|D
iscussionP
aper|
Discussion
Paper
|D
iscussionP
aper|
28
698
699
Figure 2. Scheme of calibration approaches: constant penetration depth and constant 700
neutron weights in depth (S1), time-variable penetration depth and constant neutron 701
weights in depth (S2), constant penetration depth and space-variable neutron weights in 702
depth (S3), and time-variable penetration depth and space-variable neutron weights in 703
depth (S4). 704
Fig. 2. Scheme of calibration approaches: constant penetration depth and constant neutronweights in depth (S1), time-variable penetration depth and constant neutron weights in depth(S2), constant penetration depth and space-variable neutron weights in depth (S3), and time-variable penetration depth and space-variable neutron weights in depth (S4).
4268

HESSD10, 4237–4274, 2013
Soil moisturemeasurement incropped fields
C. A. Rivera Villarreyeset al.
Title Page
Abstract Introduction
Conclusions References
Tables Figures
J I
J I
Back Close
Full Screen / Esc
Printer-friendly Version
Interactive Discussion
Discussion
Paper
|D
iscussionP
aper|
Discussion
Paper
|D
iscussionP
aper|
29
705
706
Figure 3. Comparison of the three calibration approaches in terms of root mean square 707
error (RMSE, [m3 m-3]) for the fully-empirical approach (upper graph), semi-empirical 708
approach (middle graph), and N0-calibration approach (lower graph) applied for six 709
calibration datasets (Table 2) and four calibration scenarios (Figure 2). Notice that (i) the 710
error bars are defined by one standard deviation computed from the calibration scenarios, 711
and (ii) RMSE is calculated for the two monitoring periods. Different bar colors indicate 712
different crop stages. 713
Fig. 3. Comparison of the three calibration approaches in terms of root mean square error(RMSE, [m3 m−3]) for the fully empirical approach (upper graph), semi-empirical approach (mid-dle graph), and N0-calibration approach (lower graph) applied for six calibration datasets (Ta-ble 2) and four calibration scenarios (Fig. 2). Notice that (i) the error bars are defined by onestandard deviation computed from the calibration scenarios and (ii) RMSE is calculated for thetwo monitoring periods. Different bar colors indicate different crop stages.
4269

HESSD10, 4237–4274, 2013
Soil moisturemeasurement incropped fields
C. A. Rivera Villarreyeset al.
Title Page
Abstract Introduction
Conclusions References
Tables Figures
J I
J I
Back Close
Full Screen / Esc
Printer-friendly Version
Interactive Discussion
Discussion
Paper
|D
iscussionP
aper|
Discussion
Paper
|D
iscussionP
aper|
30
714
715
Figure 4. Variation of calibration parameters along the growing periods for sunflower 716
(left) and winter rye (right) for different calibration scenarios (Figure 2). The values of a0, 717
fcal and N0 are related to the fully-empirical, semi-empirical and N0-calibration 718
approaches. 719
Fig. 4. Variation of calibration parameters throughout the growing periods for sunflower (left)and winter rye (right) for different calibration scenarios (Fig. 2). The values of a0, fcal and N0 arerelated to the fully empirical, semi-empirical and N0-calibration approaches.
4270

HESSD10, 4237–4274, 2013
Soil moisturemeasurement incropped fields
C. A. Rivera Villarreyeset al.
Title Page
Abstract Introduction
Conclusions References
Tables Figures
J I
J I
Back Close
Full Screen / Esc
Printer-friendly Version
Interactive Discussion
Discussion
Paper
|D
iscussionP
aper|
Discussion
Paper
|D
iscussionP
aper|
31
720
721
Figure 5. Time series of soil moisture measured in the FDR network and CRS probe 722
during the sunflower period (left side) and winter rye period (right side): hourly 723
precipitation (upper graph), volumetric soil moisture (middle graph) and soil moisture 724
anomalies (lower graph). FDR soil moisture corresponds to the mean value in the 725
horizontal and vertical direction. Anomalies of soil moisture were calculated subtracting 726
the mean value (FDR or CRS) from the entire period and scaled to the standard deviation. 727
Calibration periods are defined by D1, D2, D3, D4, D5 and D6. 728
Fig. 5. Time series of soil moisture measured in the FDR network and CRS probe during thesunflower period (left side) and winter rye period (right side): hourly precipitation (upper graph),volumetric soil moisture (middle graph) and soil moisture anomalies (lower graph). FDR soilmoisture corresponds to the mean value in the horizontal and vertical direction. Anomalies ofsoil moisture were calculated by subtracting the mean value (FDR or CRS) from the entireperiod and scaled to the standard deviation. Calibration periods are defined by D1–D6.
4271

HESSD10, 4237–4274, 2013
Soil moisturemeasurement incropped fields
C. A. Rivera Villarreyeset al.
Title Page
Abstract Introduction
Conclusions References
Tables Figures
J I
J I
Back Close
Full Screen / Esc
Printer-friendly Version
Interactive Discussion
Discussion
Paper
|D
iscussionP
aper|
Discussion
Paper
|D
iscussionP
aper|
32
729
730
Figure 6. Relation between FDR soil moisture and relative fast neutrons during sunflower 731
and winter rye periods: CRS calibration is plotted as the dashed black line and its 732
readjustment by an increase (+5 m3 m-3) or decrease (-5 m3 m-3) of crop water content 733
respect to calibration curve is plotted in continuous lines. 734
Fig. 6. Relation between FDR soil moisture and relative fast neutrons during sunflower andwinter rye periods: CRS calibration is plotted as the dashed black line, and its readjustmentby an increase (+5 m3 m−3) or decrease (−5 m3 m−3) of crop water content with respect to thecalibration curve is plotted in continuous lines.
4272
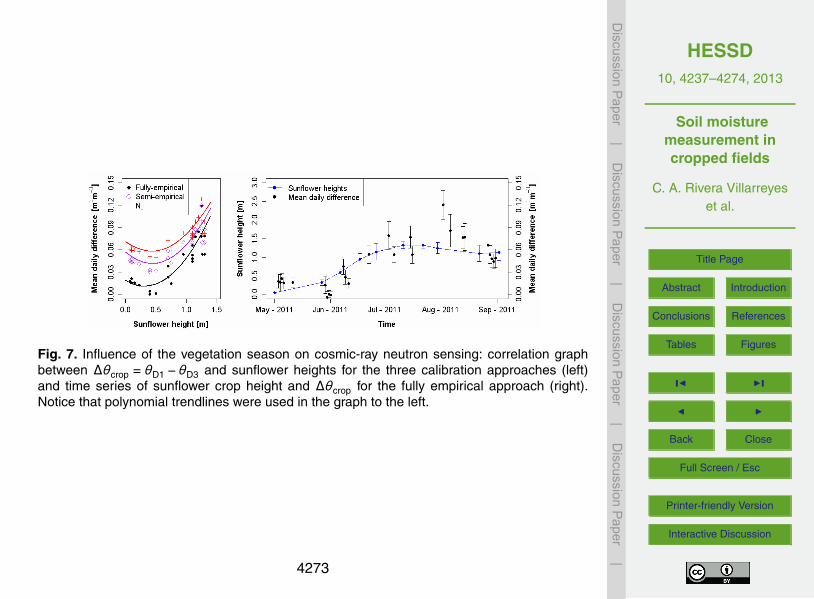
HESSD10, 4237–4274, 2013
Soil moisturemeasurement incropped fields
C. A. Rivera Villarreyeset al.
Title Page
Abstract Introduction
Conclusions References
Tables Figures
J I
J I
Back Close
Full Screen / Esc
Printer-friendly Version
Interactive Discussion
Discussion
Paper
|D
iscussionP
aper|
Discussion
Paper
|D
iscussionP
aper|
33
735
Figure 7. Influence of the vegetation season on cosmic-ray neutron sensing: correlation 736
graph between 31 DDcrop θθθ −=∆ and sunflower heights for the three calibration 737
approaches (left) and time series of sunflower crop height and cropθ∆ for the fully-738
empirical approach (right). Notice that polynomial trendlines were used in left graph. 739
Fig. 7. Influence of the vegetation season on cosmic-ray neutron sensing: correlation graphbetween ∆θcrop = θD1 −θD3 and sunflower heights for the three calibration approaches (left)and time series of sunflower crop height and ∆θcrop for the fully empirical approach (right).Notice that polynomial trendlines were used in the graph to the left.
4273

HESSD10, 4237–4274, 2013
Soil moisturemeasurement incropped fields
C. A. Rivera Villarreyeset al.
Title Page
Abstract Introduction
Conclusions References
Tables Figures
J I
J I
Back Close
Full Screen / Esc
Printer-friendly Version
Interactive Discussion
Discussion
Paper
|D
iscussionP
aper|
Discussion
Paper
|D
iscussionP
aper|
34
740
741
Figure 8. Correction of N0 parameter from estimated value of attenuated neutrons due to 742
additional H pools beside soil moisture. The N0 values correspond to calibrated values for 743
all datasets (D1-D6) with scenario S1. The expected neutrons without crop cover and 744
measured neutrons are defined as expN and CRSN , respectively. In graph, these are the 745
mean values for each calibration datasets. Three examples how N0 is correlated to the 746
attenuated neutrons is shown for (i) initial sunflower, (ii) middle winter rye and (iii) 747
middle sunflower in graph as Initial (S), Middle (WR) and Middle (S), respectively. We 748
expected that biomass, root density and crop water content increase from (i) to (iii). 749
Initial (S)
Middle (WR)
Middle (S)
Fig. 8. Correction of N0 parameter from estimated value of attenuated neutrons due to ad-ditional H pools beside soil moisture. The N0 values correspond to calibrated values for alldatasets (D1–D6) with scenario S1. The expected neutrons without crop cover and measuredneutrons are defined as Nexp and NCRS, respectively. In the graph, these are the mean valuesfor each calibration dataset. Three examples of how N0 is correlated to the attenuated neutronsare shown for (i) initial sunflower, (ii) middle winter rye and (iii) middle sunflower in graph asInitial (S), Middle (WR) and Middle (S), respectively. We expected biomass, root density andcrop water content to increase from (i) to (iii).
4274