solar panel simulator
TRANSCRIPT
8/8/2019 Solar Panel Simulator
http://slidepdf.com/reader/full/solar-panel-simulator 1/3
Solar panel simulator
Giovanni Romeo and Giuseppe Urbini
Istituto Nazionale di Geofisica e Vulcanologia
Roma, Italia
This is a funny kind of power supply, not stable in voltage or in current: it simulates the
comportment of a solar panel and can be very useful if you are playing around a solar powered
device in a raining day. We designed it for internal use, but it may have a general value.
We may roughly schematise a solar panel with the equivalent circuit shown in figure 1.
I dc
VCC out
Dn
D1
Fig. 1: Solar panel equivalent scheme. The current produced depends of the illumination and of the nature of the cells
(surface, material, geometry) and the voltage is tied also to the number of cells.
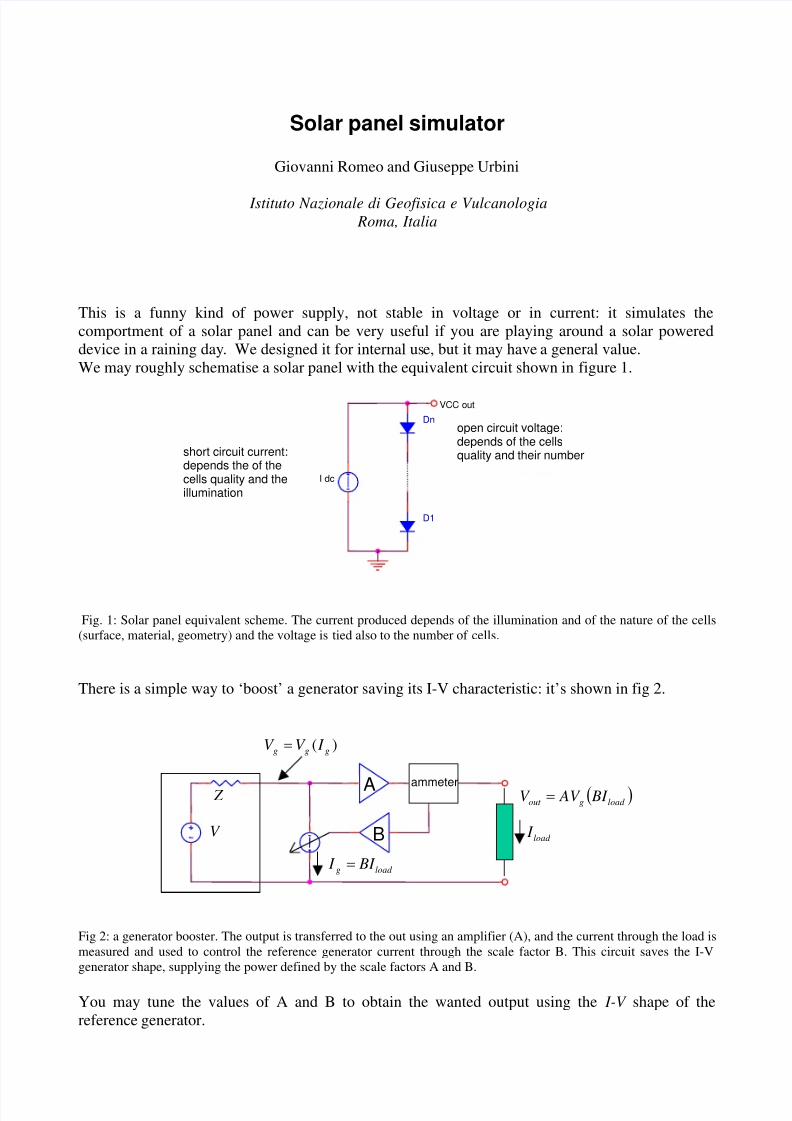
There is a simple way to ‘boost’ a generator saving its I-V characteristic: it’s shown in fig 2.
Fig 2: a generator booster. The output is transferred to the out using an amplifier (A), and the current through the load is
measured and used to control the reference generator current through the scale factor B. This circuit saves the I-V
generator shape, supplying the power defined by the scale factors A and B.
You may tune the values of A and B to obtain the wanted output using the I-V shape of the
reference generator.
ammeterA
BV
Z
)( ggg I V V =
load I
load g BI I =
( )load gout BI AV V =
open circuit voltage:depends of the cellsquality and their number short circuit current:
depends the of thecells quality and theillumination

8/8/2019 Solar Panel Simulator
http://slidepdf.com/reader/full/solar-panel-simulator 2/3
The schematic in fig. 3 is the designed to work simulator, obtained by a generator (like the one in
Fig. 1) boosted following the principle illustrated in fig. 2.
+5
D4
R3
1k
R7
220k
R13
1
+5
R10
20k
0
0
R11
100
D8
RED LED
R875
R18
1K
+24
R14 0.1
U4A
LM339
10
9
4
1 8
2
+
-
V +
V -
OUT
R21
1k
-5
-5
D7GREEN LED
R1
220k
R5
200k
+5
-5
0
+24
U1
LM741
3
2
7
4
6
1
5+
-
V +
V -
OUT
OS1
OS2
-5
+24
+24
0
R4220k
U3
LM741
3
2
7
4
6
1
5+
-
V +
V -
OUT
OS1
OS2
R12 45
U6
ADM660
1
2
3
4
8
7
6
5
FC
CAP+
GND
CAP-
V+
OSC
LV
OUT
D1
0
-5
0
0
0
D51N4148
negative output
-5
D2
Q1
MJE520
D3
0
-5
0
U5
LM7805
1
3
2VIN
G N D
VOUT
0
R2
800k
U4B
LM339
8
6
4
1 8
3
+
-
V +
V -
OUT
D6
+5
R6
4k
+ C2
100uF
+
C1
10u
R9
220k
+5
+5
+24
+
C4
10u
R20
1k
+24
R19
1k
0
U2LM741
3
2
7
4
6
1
5+
-
V +
V -
OUT
OS1
OS2
0
R16
1k
+5
+
C3
100uF
R15
800
R171K
positive output
Fig. 3. The simulator designed to work. The circuit is 24 volts powered (bubble +24 and analog ground), using a
floating power supply (we used a DC-DC converter). The output is between ‘positive output’ and ‘negative output’.
U1 is used as current generator, and the constant current, flowing through a series of diodes (D1,
D3, D5) is obtained by reading the shunt R13; the diodes and the constant current source form the
reference generator (as shown in fig.1). D2, D4, D6 and U2 operate a temperature correction. U3
and Q1 (fig. 3) are used as output amplifier. The information about the load current is obtained bythe shunt R14. Both of the shunts, R13 and R14 work in the low side; this is not elegant but, since a
solar panel is a floating device, you need to power the whole circuit with a floating voltage source,
and the low side shunts work perfectly. The number of cells (open circuit voltage) is obtained
changing the output gain modifying the R10 value (A gain in fig.2); the resistor R12 regulates the
short circuit current (Idc in fig. 1) by changing the B gain (fig. 2). Op amps are not critical, and
many modern quad op amps may replace the old beloved 741.
The circuit shows the power coupling conditions using a two-colours LED. It lights green when the
load is too weak, red when it is too heavy, and orange when it approaches the maximum power
transfer, indicating that your load is well coupled with the simulated panel. This is useful to quickly
check MPPT charge regulators.
This LED is operated by a couple of comparators (U4 A and B) looking at the voltage of the diodesseries. This is done after the thermal correction.
Fig.4 shows the simulator comportment, the blue curve is the typical V-I curve of a solar panel.

8/8/2019 Solar Panel Simulator
http://slidepdf.com/reader/full/solar-panel-simulator 3/3
The orange curve represents the power output. The traces red and green represent the LED status.
0 2 4 6 8 10 12 14 16
0
1
2
c u r r e n t ( A )
, p o w e r ( W / 1 0 ) , L E D s t a t u s
voltage (V)
currentred LED
green LED
power
maximum power point
Fig. 4: Simulator comportment. The blue trace shows a typical I-V curve of a solar panel; red and green traces show theLEDs actions. The light is green in case of weak load (low current, high voltage), red in case of heavy load (high
current, low voltage) and orange (both LEDs on) around the MPP. The LEDs thresholds can be tuned using R17 and
R18 in Fig. 3. The orange trace represents the output power.