southeast florida coral biomarker study final report
TRANSCRIPT

Final Report: Southeast Florida Coral Biomarker Local Action Study
John E. Fauth
Department of Biology, University of Central Florida, Orlando, FL 32816, USA
E-mail: [email protected]
Phillip Dustan and Eric Pante
Department of Biology, College of Charleston, Charleston, SC 29424, USA
Kenneth Banks
Broward County Department of Environmental Protection, Ft. Lauderdale, FL 33301,
USA
Bernardo Vargas-Angel
National Coral Reef Institute, NOVA Southeastern University Oceanographic Center,
Dania Beach, FL 33004, USA
Craig A. Downs
Haereticus Environmental Laboratory, Amherst, VA 24521, USA
19 January 2006

2
Abstract
We tested the feasibility of using cellular diagnostics to link land-based sources of
pollution with coral reef degradation. We collected tissue samples of mustard hill coral
(Porites astreiodes) from four paired inshore and offshore stations off Broward
Country, FL: 1) control sites (FTL1 and FTL 3) monitored by Broward County
Department of Environmental Protection, 2) a sewage outfall (Hollywood Outfall:
HWO2 and HWO3), 3) an inlet mouth (Port Everglades: PE2 and PE3), and 4) a sewage
outfall adjacent to an inlet mouth (Hillsborough Inlet: HI2 and HI3). Coral cover was
<4% at all sites and cluster analysis grouped all inshore sites (except HI) together based
on having the least bare substrate and the most Lyngbya. Rates of sampling lesion
regeneration were significantly greater than zero only at three inshore sites and the
offshore biomonitoring control site. Cellular diagnostics revealed that corals at all sites
were stressed compared to colonies from a more pristine site in the Bahamas. Offshore
corals consistently had higher accumulations of stress markers than inshore colonies.
Stress responses of corals from HWO and the Florida Keys National Marine Sanctuary
were consistent with sewage exposure, while responses of offshore colonies were
consistent with xenobiotic detoxification. Accumulations of biomarkers of xenobiotic
response and decreased protein turnover were associated with decreased rates of coral
regeneration. We compared these results to experimental corals exposed to water collected
from Port Everglades. Differences between coral clones within a depth zone remained
apparent even after two months’ acclimation to lab conditions, suggesting a genetic
component to coral responses. Exposure to Port Everglades water decreased
accumulation of multidrug resistance protein compared to colonies in the artificial sea
water control; the levels were similar to the response observed in the field. This project

3
is a first step in identifying the chain of causality between land-based pollutants, responses
of individual reef-building corals, and health of coral reef communities in the South
Florida watershed.
Keywords: biomarkers, coral, Porites astreoides, reefs, regeneration, stressor

4
Introduction
Coral reefs are declining world-wide due to deteriorating environmental conditions
(Dustan and Halas 1987; Bryant and Burke 1998; Dustan 1999; Hoegh-Guldberg 1999;
Wilkinson 1999; Gardner et al. 2003). Surveys indicate that 58–70% of coral reefs
worldwide are threatened by anthropogenic activities (Bryant and Burke 1998; Wilkinson
1999; Hoegh-Guldberg 1999; Goreau et al. 2000; Gardner et al. 2003). Coral colonies
that experience persistent environmental disturbance suffer mass mortality, reduced
growth and reproductive rates, and increased prevalence and severity of disease
(Richmond 1993; Hoegh-Guldberg 1999; Nystrom et al. 2000; Knowlton 2001; Porter
and Tougas 2001; Patterson et al. 2002). Unfortunately, most coral monitoring and
mapping programs cannot identify the causes of coral declines because these programs
were designed to quantify baseline conditions and determine trends, not identify stressors
(Risk 1999; Pennisi 2002; Vasseur and Cossu-Leguille 2003).
In 2003, the Southeast Florida Coral Reef Initiative Team (SEFCRI Team)
identified land-based sources of pollution as a potentially critical factor influencing the
long-term fate of coral reefs off southeastern Florida. Here, we report results of a project
that integrates traditional coral monitoring techniques with a novel biotechnology –
cellular diagnostics – to address how land-based sources of pollution identified by the
SEFCRI Team affect coral reefs. Cellular diagnostics is a new approach to
environmental health assessment. It is based on concepts and methodologies widely used
in medical diagnostics and epidemiology, and combines biomarkers of exposure,
physiological effect, and potential risk to identify likely environmental stressors and
forecast their biological effects (Downs 2005). Cellular diagnostics was designed to

5
assess the cellular-physiological condition of reef-building corals and identify mechanisms
of coral pathologies (Downs et al. 2000, 2002; Brown et al. 2002; Woodley et al. 2002;
Fauth et al. 2003; Downs 2005). Parameters evaluated include cell membrane integrity
and composition, anti-oxidant redox status, protein metabolic condition, xenobiotic
detoxification pathways, intra-cellular metal regulation, and genomic integrity. Cellular
diagnostics works because environmental stressors affect organisms by overwhelming
defenses at lower levels of the biological hierarchy: molecular, cellular, and organismal-
level homeostatic processes. Stressors then reduce individual fitness, which cascades into
altering demographic parameters, and diminishes the structure, function, and resilience of
ecological communities. By evaluating coral responses at the molecular, cellular,
organismal, and community levels, scientists can provide resource managers with critical
information needed to identify and ameliorate stressors before an ecosystem-scale
environmental crisis occurs (Fauth et al. 2003; Downs et al. in press).
Most studies of environmental stress and response are limited to using a weight
of-evidence or ecoepidemiological approach to infer causality (Adams 2003). To
strengthen inferences of our field study, we conducted a laboratory experiment that
exposed coral colonies to water collected from a putative source of stress. This
mechanistic approach permits rigorous application of the scientific method, including the
potential to falsify hypotheses derived from field sampling. By explicitly testing the
chain of causality, we provide the evidence that resource managers, citizens, and
legislators need to evaluate when making critical decisions about the effects of sewage

6
discharges, shipping channels, and other land-based sources of pollution on southeast
Florida coral reefs.
Materials and methods
Study sites and species
The high-latitude coral reefs of southeastern Florida off Broward County are highly
variable communities comprised of typical Caribbean taxa. These reef communities
occupy four parallel submarine ridges. The two middle ridges (approx. 10 and 20 m
depth) are remnants of earlier reefs that were drowned as sea level rose after the last
glaciation (Moyer et al. 2003). Benthic cover is dominated by sponges, macroalgae and
soft corals, and hermatypic or stony coral coverage comprise just 1-6% of projected cover
(Moyer et al. 2003, this study). Biogeographic patterns on southeastern Florida reefs do
not mirror those of reefs further south in the Florida Keys or the Caribbean basin.
Species richness of southeastern Florida reefs tends to increase from north to south while
diversity and evenness do not. This has been attributed to the harsher climate associated
with higher latitude, including reduced winter water temperatures, higher frequency of
major storms, and disturbances associated with close proximity to the Miami-Ft.
Lauderdale-West Palm Beach metropolitan region.
Our sampling scheme was designed for analysis of variance; we sampled coral
reefs near a sewage outfall, an inlet mouth, a sewage outfall located within an inlet
mouth, and a biomonitoring control site off Broward Country, Florida, USA (Table 1,
Fig. 1). Our focal species was the mustard hill coral (Porites astreoides: Fig. 2), which is
a common reef-building coral throughout the western Atlantic, Gulf of Mexico, and the

7
Table 1. Paired sampling stations and nearby potential sources of land-based pollution off the
southeastern Florida coastline, Broward County, Florida, USA.
Station/ depth
Ridge position
Latitude/Longitude Location Potential source of land- based pollution
FTL1 9-9.5 m
1st 26.095968 -80.052802
Fort Lauderdale Biomonitoring control site
FTL3 17.5 m
3rd 26.095183 -80.046402
Fort Lauderdale Biomonitoring control site
HWO2a 9-9.5 m
2nd 26.011414 -80.059973
Hollywood Sewage outfall
HWO3 15.5
16.5 m
3rd 26.011554 -80.052497
Hollywood Sewage outfall
PE2 8 m
2nd 26.054585 -80.057387
Port Everglades Shipping channel
PE3 14-15.5
m
3rd 26.059902 -80.050184
Port Everglades Shipping channel
HI2 9-9.5 m
2nd 26.142301 -80.047515
Hillsboro Inlet Sewage outfall + Shipping channel
HI3 15.5
16.5 m
3rd 26.151344 -80.039077
Hillsboro Inlet Sewage outfall + Shipping channel

8
Figure 1. Chart of paired sampling locations off Broward County, Florida. Sites labeled C2
and C3 correspond to sites FTL1 and FTL3, respectively, in the text of this report.

9
Figure 2. A colony of mustard hill coral (Porites astreoides) with a sampling lesion filled with
nontoxic modeling clay (gray oval). Note the recent tissue loss (whitish spots) on the opposite
side of this colony. Ruler markings are in cm.Caribbean Sea. Porites astreoides is a hardy
species that already was verified as acceptable for cellular-diagnostic analyses.
We used AGRRA (Atlantic and Gulf Reef Rapid Assessment) protocols to assess
coral condition (Kramer et al. 2005). We selected five colonies of Porites astreoides at
each site and measured their length, width, height, distance and direction from the U-post
that marked our sites. We calculated colony surface area (SA) using the equation for a
cone:
SA = Π R √(R2/2 + h
2)
where R = (colony length + width)/2 and h = colony height. We also estimated percent
old and recent tissue loss, recorded signs of bleaching, disease and overgrowth, and

10
recorded colony depth (m).
Ecosystem assessment
To assess coral reef community structure, we examined digital video imagery collected
along a 15-25 m transect at each of the paired stations in January, 2005. Video was
converted to single-frame images through frame grabbing and subsequent digital
processing. Point counting (15 pts/frame) was used to estimate projected coverage
(percent cover) of stony corals and other species (Dustan et al. 1999). We also estimated
percent cover of functional groups including gorgonians, zooanthids, porifera, macroalgae,
and members of the cyanobacteria genus Lyngbya.
To quantify environmental variation among sites, we deployed in submersible
cases two HOBO H08 temperature loggers (Onset Corporation, Bourne, MA) that recorded
water temperature hourly (accuracy: ± 0.7° at 21° C). We collected sediment by attaching
a 5.1 cm diameter x 60 cm long trap to a steel U-post painted with epoxy. One sediment
trap was deployed at each site in January and retrieved in August. We monitored
salinity of surface water using using a VeeGee Model A366ATC refractometer, turbidity
with an Orbeco-Hellige Model 966 turbidimeter (Orbeco Analytical Systems,
Farmingdale, NY) and water temperature, dissolved oxygen, and conductivity using a
Yellow Springs Instruments Model 556 Multiprobe System (Yellow Springs Instruments,
Inc., Yellow Springs, OH) . We also collected ~250 mL bottom sediment sample and
4 L of surface water in U.S. Environmental Protection Agency- certified glass
containers. These samples remain stored at -80° C at the University of Central Florida
(UCF).

11
Organismal assessment: lesion regeneration
We used a new method to assess the health of coral colonies – their ability to heal
sampling lesions (Fisher et al. in preparation). Briefly, when we removed coral tissue
and its underlying skeletal structure for cellular-diagnostic analyses, a standardized,
circular lesion was created, which was approximately 1-2 cm2
in area, 3 mm deep, and
surrounded by live tissue. We filled the hole with nontoxic modeling clay (Fig. 2) to
prevent colonization by fouling and bioeroding organisms, then measured its major and
minor chords using a ruler. We then photographed each lesion using a digital
videocamera or digital camera. We included a ruler or scale bar to calibrate
measurements. We re-measured and photographed each lesion in August, 2005 to
observe lesion regeneration over time (Fisher et al. in preparation).
We used in situ measurements to calculate the area (AL) and perimeter (PL) of all
lesions, which remained completely surrounded by live tissue (Type I lesions; Meesters
et al. 1997). We calculated lesion area using the equation for an ellipse, AL = πab, where a
and b are one-half of the length and width, respectively, of a lesion. We expressed
regeneration rate as mm2
d-1
for statistical analyses.
Cellular diagnostics
Reagents
Chemicals for buffered solutions were obtained from Sigma Chemicals Co. (St. Louis,
Missouri, USA). PVDF membrane was obtained from Millipore Corp. (Bedford,
Massachusetts, USA). Antibodies against all cellular parameters and their calibrant
standards were obtained as gifts from Robert Richmond, University of Hawai‘i, which in
12
turn were gifts from EnVirtue Biotechnologies, Inc. (Winchester, Virginia, USA).
Antibodies were raised against an 8–12 residue polypeptide conjugated to ova albumin.
Antigens were designed based on extremely conserved and unique domains found within
the target protein. Rabbits were immunized with the antigen with a Ribi-adjuvant carrier.
All antibodies used in this study were immuno-purified with a Pierce SulfoLink Kit (cat.#
44895) using the original unconjugated peptide as the affinity binding agent. Anti-rabbit
conjugated horseradish peroxidase antibodies were obtained from Jackson
Immunoresearch (West Grove, PA, USA).
Sampling coral colonies
We collected samples (1.5 cm diameter) from five colonies at each site in January, 2005.
Samples were biopsied using a leather punch and placed in labeled, opaque film canisters.
On deck, under shaded conditions, water was quickly removed from the film canister,
blotted dry on paper towels, placed in labeled containers, and transferred to dry ice.
Samples were stored at -80° C until analysis.
Sample preparation, ELISA validation, and ELISA
Frozen coral samples were ground to a powder using a liquid nitrogen-chilled ceramic
pestle and mortar. Samples (~10 mg) of frozen tissue were placed in 1.8 ml
microcentrifuge tubes with 1400 µl of a denaturing buffer consisting of 2% SDS, 50 mM
Tris–HCl (pH 6.8), 15 mM dithiothreitol, 10 mM EDTA, 0.001 mM sorbitol, 7%
polyvinylpolypyrrolidone (wt/vol), 0.1% polyvinylpyrrolidone (wt/vol), 0.01 mM alpha
tocopherol, 0.005 mM salicylic acid, 2 mM benzamidine, 0.04 mM Bestatin, 0.001 E-64,
2 mM phenylmethylsulfonyl fluoride, 0.01 mM apoprotin, 5 :Ma-amino-caproic acid, and
1 :g/100 ul pepstatin A. Samples were heated to 92° C for 3 min, vortexed for 20 s,
incubated at 92° C for another 3 min, and then incubated at 25° C for 5 min. Samples were

13
centrifuged at 10,000 · g for 10 min. Supernatant free of the lipid/glycoprotein mucilage
matrix was transferred to a new tube, centrifuged at 10,000 · g for 5 min and free
supernatant again was transferred to a new tube and subjected to a protein concentration
assay (Ghosh et al. 1988).
To ensure equal sample loading, 20 µg of total soluble protein (TSP) of samples
were loaded onto a 12.5% SDS-PAGE gel (16 cm), the gel was run until the
bromophenol blue dye front was near the bottom, stained with a Coomassie blue
solution (BB R-250) overnight, and then destained for 4 h with multiple washes of
destaining solution. Equal loading was determined by visualization and optical density
using a Canonscan scanner and analysis performed on a Macintosh computer using the
public domain NIH Image program (developed at the US National Institutes of Health
and available on the Internet at http://rsb.info.nih.gov/nih-image/). This protocol visually
validated the protein concentration assay and ensured that sample artifact did not occur
between the time of sample homogenization and sample analysis.
One-dimensional SDS-PAGE and western blotting validated the legitimacy of an
ELISA (enzyme linked immunosorbent assay) on this species of coral using a specific
antibody (Downs 2005). Five to 15 :g TSP of coral supernatant was loaded onto a 20-,
16-, or 8-cm SDS-polyacrylamide gel with various concentrations of bis/acrylamide. A
Tri(2-carboxyethyl) phosphine (TCEP) concentration of 1 mM was added to gels loaded
with samples to be assayed with antibody to the chloroplast sHsp and the invertebrate
sHsp. Tri(2-carboxyethyl)phosphine is a reductant that can be used in acrylamide gels
without interfering with acrylamide polymerization. Proteins can often spontaneously
form disulfide bonds in the loading buffer, in the stacker gel, and in the separating
gel, causing homomeric or heterometic dimerization. Proteins (e.g., small heat-shock

14
proteins) that dimerize under adverse environmental conditions readily aggregate under
standard SDS-PAGE procedures. Gels were blotted onto PVDF membrane using a wet
transfer system. Membrane was blocked in 7% nonfat dry milk, and incubated with the
primary antibody for 1 h. Blots were washed in tris buffered saline (TBS)-0.05% Tween
(v/v) four times, and incubated in a horseradish peroxidase-conjugated secondary
antibody solution for 1 h. Blots were washed four times in TBS and developed using a
chemiluminescent reporter system.
Once validated, antibodies and samples were optimized for ELISA using an 8 · 6 ·
4 factorial design (Crowther 1999). Every ELISA assay must be optimized for proper
concentration of protein loading, antibody titer, sample-to-standard calibration, and
handling procedures as a measure of quality control and quality assurance (Downs 2005).
A Bio-Tek 404 plate washer was used in conducting the ELISAs using a 96-well micro-
titer plate format. Antibodies were developed using a luminol-based chemiluminenscent
solution and documented using a Bio-Tek fluorescent/luminescent microplate reader.
Samples were assayed with Haereticus Environmental Laboratory’s antibodies
against heat shock protein 60 (Hsp 60), cytochrome P450-2 class (Cyp 2), cytochrome
P450-6 class (Cyp 6), Glucose-regulated protein 75 (Grp 75), total small heat shock
proteins (sHsp), ubiquitin, copper-zinc superoxide dismutase (Cu/Zn SOD), cnidarian
glutathione-S-transferase (GST), ferrochelatase (FC) and multi-drug resistance protein
(MDR). The biological significance of each cellular-diagnostic parameter (biomarker) is
summarized in Table 2. Samples were assayed in triplicate with intra-specific variation <
6% for the whole plate. An eight-point calibrant curve using a calibrant relevant to each
antibody was plated in triplicate for each plate.

15
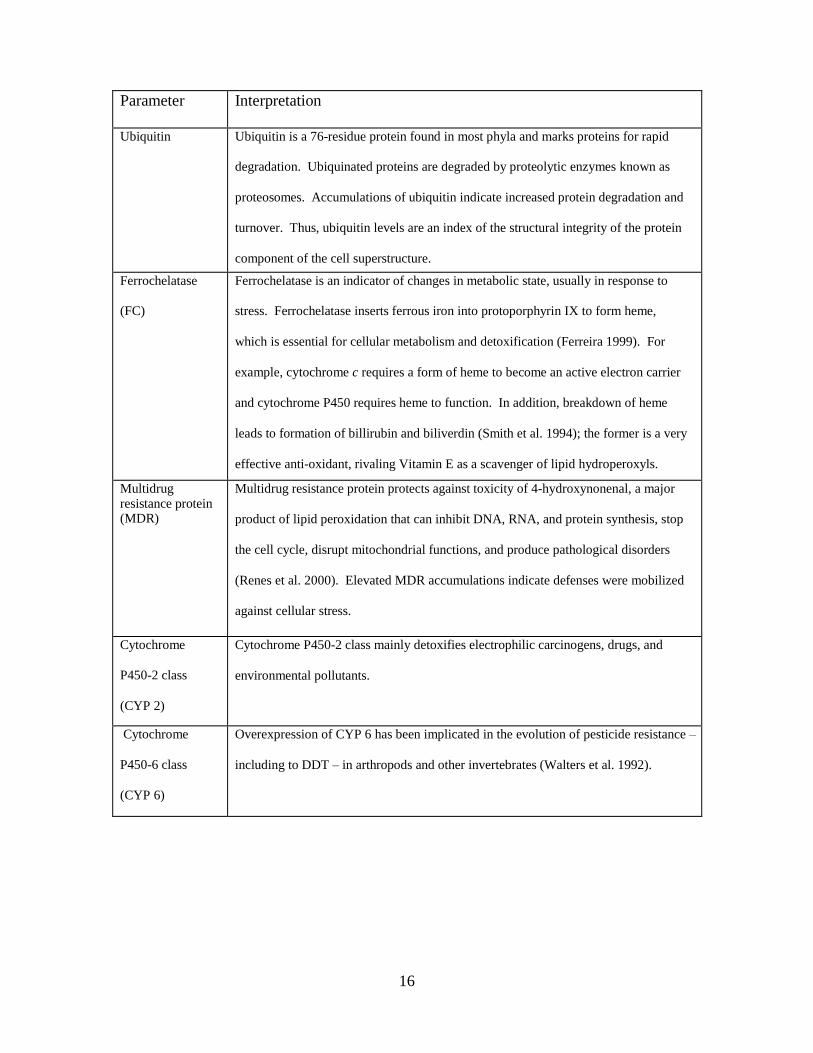
Table 2 Cellular-diagnostic parameters and their biological significance
Parameter Interpretation
Copper-Zinc
superoxide
dismutase
(Cu/Zn SOD)
Superoxide dismutases are enzymes that catalyze superoxide radicals to molecular
oxygen and hydrogen peroxide, and comprise a main antioxidant defense pathway
(Wu et al. 1999). Increased SOD levels have been linked to increased longevity and
tolerance to ischemic/reperfusion events and oxidative stress (Fridovich 1995).
Heat shock protein
60 (Hsp 60)
Heat shock proteins are molecular chaperones universal to all eukaryotic cells.
During stress, Hsp's protect cells from elevated temperature and are important in
repairing cellular damage (Near et al. 1990; Welch 1993). Hsp 60 accumulates in
response to stress, specifically increased protein synthesis and denaturation.
Total small heat
shock proteins
(sHsp)
Cnidarians have up to 5–6 major sHsp isoforms, including αB-crystallin, Hsp22,
Hsp23, Hsp26, and Hsp28 (Downs et al. 1999). In general, sHsp’s are absent under
optimal growing conditions and are only elicited by stress. For example, αB crystallin
is only found in the cytosol of animals, where it protects cytoskeletal elements during
stress (Derham and Harding 1999). Thus, the presence and concentration of different
small heat-shock proteins reflects the physiological status of several cellular metabolic
and structural pathways.
Glucose-regulated
protein (Grp)
Glucose regulated protein is a mitochondrial matrix protein related to the Hsp 70 family
and is induced under conditions of low glucose and other environmental stresses. It
also is involved in various chaperoning functions and possibly in antigen recognition,
cell proliferation and senescence (Pockley 2001). Concentrations of Grp often are used
as indicators of nutritional stress.
Glutathione-Stransferase (Gst)
Glutathione-S-transferase detoxifies genotoxic and cytotoxic xenobiotic electrophiles
by conjugating them to glutathione (Ketterer et al. 1988). It also can repair DNA by
detoxifying DNA hydroperoxides (Tan et al. 1988) and is a main defense for
detoxifying 4-hydroxynonenal, an extremely reactive product of lipid peroxidation that
cross-links proteins and forms adducts with DNA (de Zwart et al. 1999).
16
Parameter Interpretation
Ubiquitin Ubiquitin is a 76-residue protein found in most phyla and marks proteins for rapid
degradation. Ubiquinated proteins are degraded by proteolytic enzymes known as
proteosomes. Accumulations of ubiquitin indicate increased protein degradation and
turnover. Thus, ubiquitin levels are an index of the structural integrity of the protein
component of the cell superstructure.
Ferrochelatase
(FC)
Ferrochelatase is an indicator of changes in metabolic state, usually in response to
stress. Ferrochelatase inserts ferrous iron into protoporphyrin IX to form heme,
which is essential for cellular metabolism and detoxification (Ferreira 1999). For
example, cytochrome c requires a form of heme to become an active electron carrier
and cytochrome P450 requires heme to function. In addition, breakdown of heme
leads to formation of billirubin and biliverdin (Smith et al. 1994); the former is a very
effective anti-oxidant, rivaling Vitamin E as a scavenger of lipid hydroperoxyls.
Multidrug resistance protein (MDR)
Multidrug resistance protein protects against toxicity of 4-hydroxynonenal, a major
product of lipid peroxidation that can inhibit DNA, RNA, and protein synthesis, stop
the cell cycle, disrupt mitochondrial functions, and produce pathological disorders
(Renes et al. 2000). Elevated MDR accumulations indicate defenses were mobilized
against cellular stress.
Cytochrome
P450-2 class
(CYP 2)
Cytochrome P450-2 class mainly detoxifies electrophilic carcinogens, drugs, and
environmental pollutants.
Cytochrome
P450-6 class
(CYP 6)
Overexpression of CYP 6 has been implicated in the evolution of pesticide resistance –
including to DDT – in arthropods and other invertebrates (Walters et al. 1992).
17
Laboratory stressor-challenge experiment
Coral collection and maintenance
Four colonies of Porites astreoides were obtained from reefs off Fort Lauderdale, Florida
and transported to Nova Southeastern University Oceanographic Center (NSUOC). Two
colonies were collected from a depth of 7 m and two colonies from 15 m. In the
laboratory, colonies were placed into a 150 L holding tank linked to a ~520 L closed
system equipped with a 3590 Lh−1
recirculation pump and an 80 L protein skimmer.
Aquarium water consisted of a mixture (~1:1 ratio) of filtered natural seawater and
reverse-osmosis/deionized water mixed with commercial sea salt. Additional water
circulation within the holding tank was provided by submersible power heads. Tanks
were illuminated by four 175 W, 10000 K metal halide bulbs on a 12 h photoperiod.
Water temperature in the holding tank ranged from 23.8 - 28.3° C (25.8 ± 0.9; mean ±
SD) and salinity between 35 - 36‰ (35.4 ± 0.4). Colony fragments acclimated in this
tank for one month. Subsequently, twelve 13 mm diameter cores were removed from
each colony using a diamond core drill. Cores were glued in an upright position to epoxy
resin plugs using cyanoacrylate gel and allowed to recover in the holding tank for
approximately 1 month. During this recovery period, coral tissue grew and extended
down the side of each core.
Experimental manipulations
After the two-month acclimation period, coral cores were transferred to 24 separate, 9.5 L
closed-system aquaria. Coral cores (two per tank) and experimental treatments were
randomly assigned to each tank. Treatments consisted of a control exposed to filtered

18
natural seawater and reverse-osmosis/deionized water mixed with commercial sea salt as
described previously, and a stressor challenge, which consisted of water collected daily at
high tide from Port Everglades, filtered to 50 microns, and stored briefly in glass aquaria
before use. Both the control and stressor treatments were replicated twelve times.
During the experiment, water circulation and filtration were provided by Aquaclear
MiniTM power filters and 50% water changes were performed every 12 h. Light conditions
were similar to acclimation conditions. Temperature, salinity and pH of all tanks was
tested every 24 hrs. Temperature was measured with Cole-Parmer Instrument Co. NIST-
traceable mercury thermometer (accuracy 0.1°C) and averaged 25.7 ± 1.0°C. Salinity was
determined with Atago ATC-S/Mill-E Refractometer and averaged 35.8
±0.6 ppt. An Orion Research Model SA230 pH/mV/°C meter (electrode calibrated with
NBS Standard buffers of pH 2, 7 & 9) pH(NBS) was used to calculate pH from millivolt
measurements, which averaged 7.97 ± 0.73. Coral cores were maintained under
experimental conditions for 4 days (96 h).
Ammonia, nitrite, nitrate, alkalinity and phosphate were measured in the water
used for the water changes with LaMotte Scientific Test Kits. In the control tanks,
ammonia averaged 0.13 ± 0.25 ppm; nitrite and nitrate remained below detection limits.
Mean water alkalinity was 186 ± 3 ppm and mean phosphate concentration was 0.06 ±
0.03 ppm. In the treatment tanks with Port Everglades water, mean ammonia
concentration was 0.16 ± 0.23 ppm; nitrite and nitrate remained below detection limits.
Mean alkalinity was 192.0 ± 4.0 ppm and phosphate averaged 0.14 ± 0.08 ppm.
After each daily, 50% water change, ammonia, nitrite, nitrate, alkalinity, and
phosphate were measured in two tanks (randomly selected control and treatment tank)

19
with LaMotte Scientific Test Kits. In both the control and treatment tanks, ammonia
averaged 0.09 ±0.14 ppm; nitrite and nitrate remained below detection limits. In the
control tanks, alkalinity averaged 189.0 ± 6.0 ppm and phosphate averaged 0.03 ± 0.03
ppm. In the treatment tanks, alkalinity averaged 194.0 ± 3.0 ppm and phosphate averaged
0.05 ± 0.0 ppm. One-way analysis of variance indicated no significant differences in
temperature or salinity between acclimation, control, and treatment conditions (p > 0.05).
In addition, differences in pH, alkalinity, ammonia, and phosphate between control and
treatment tanks were not statistically significant (p > 0.05).
At the end of the experiment, we recorded the position of all tanks relative to the
lab door and aisle. These data were used as covariates to account for potential two-
dimensional gradients in the laboratory. All corals were removed from tanks, gently
blotted with paper towel to remove excess mucous and sacrificed. Each core was divided
in two pieces; one half was fixed in liquid nitrogen and stored at −80°C for cellular
diagnostic analysis, and the remaining half was fixed in either buffered, zinc-formalin (Z-
Fix) for histological analysis, or in glutaraldehyde for electron microscopy analyses. One
frozen sample from each tank, selected at random, was stored at the UCF and shipped to
Haereticus Environmental Laboratory for analysis. The other sample was frozen at
−80°C at the National Coral Research Institute (NCRI) at NSUOC. Unfortunately, the
freezer lost power for several days after Hurricane Wilma so these samples are no longer
useable.
Statistical analyses
We used multivariate of variance to test the general linear model

20
{Y1ijkl, Y2ijkl, . . . Yzijkl} = µ + αi + βj + γk + Iij + . . . + εijkl
where {Y1ijkl, Y2ijkl, . . . Yzijkl} was the response vector of CDS parameters from field-
collected samples, µ was the grand mean of the response, αi was the deviation due to
depth, βj was the deviation due to sewage outfall, γk was the deviation due to shipping
inlet, Iij, etc. were deviations due to interactions between the fixed effects of depth,
sewage outfall, and shipping inlet, and the εijkl were the residual errors.
We used nested analysis of covariance (ANCOVA) to examine coral responses in
the laboratory experiment, using the general linear model
Yijkl = µ + B1X1 + B2 X1 + αi + βj + Iij + Dk(j) + εijkl
where Yijkl was the accumulation of a particular CDS parameter in lab-reared corals, µ
was the grand mean of the response, B1 and B2 were regressors of the covariates X1 (aisle
gradient) and X2 (door gradient), αi was the deviation due to colony depth, βj was the
deviation due to water source, Iij was the colony depth x water source interaction, Dk(j)
was the random effect of coral colony nested within depth, and the εijkl were the residual
errors. In this analysis, the main effect of colony depth was tested using a residual that
contained the nested coral colony[depth] term. All other effects were tested using the
residual error in the denominator. Separate nested ANCOVA’s were performed for each
cellular-diagnostic parameter.
We adhered to model assumptions of multivariate random, normally-distributed
and independent residuals by transforming cellular-diagnostic responses as log10(x + 1).
We used separate univariate tests to interpret significant MANOVA results and Tukey's
Honestly Significant Difference method to separate univariate means. This procedure
limited the probability of committing a Type I error even when responses were

21
correlated. We used hierarchical clustering to examine patterns in coral diversity, bottom
cover and cellular-diagnostic responses. All statistical analyses were performed using
JMP V. 4.0.4 (SAS Institute, Inc., Cary, NC, USA), with α = 0.05 for all hypothesis tests.
Results
Percent cover of corals and associated reef organisms
Bottom substrate or Lyngbya was the dominant cover at all sites (Fig. 3) and these two
cover types were significantly negatively correlated (Pearson’s r = -0.91, P < 0.002). At
each site, sponges comprised 2.4-7.1% cover, and sponge cover was positively correlated
with substrate cover (Pearson’s r = 0.78, P < 0.03) and negatively correlated with coverage
by Lyngbya (Pearson’s r = -0.74, P < 0.04). All sites had <4% coral cover (Fig.
4) and soft corals (gorgonians and zooanthids) varied from 1-11% cover (Appendix I).
Differences in reef depth and the presence of sewage outfalls and shipping inlets did not
explain significant variation in bottom composition, regardless of whether the analysis
used MANOVA on original variates, on data summarized as principal components, or
ANOVA on each category separately.

22
Fig. 3 Percentage bottom cover at the four paired inshore and offshore sites off Broward
County, Florida.

Fig. 4. Typical bottom cover at non-biomonitoring control sites off Broward County, Florida, which were dominated by bare substrate and
the invasive red alga Lyngbya. The floating white chains were used to temporarily mark locations of colonies of Porites astreoides. Photo
by Ken Banks.

Sites clustered into two distinct groups based on bottom composition (Fig. 5). One group
was comprised of three inshore sites (FTL1, PE2 and HWO2), which had the lowest
percentages of bare substrate, the highest cover by Lyngbya, and the least cover by
sponges, stony corals, and soft corals (Fig. 3). The other group comprised all four
offshore sites plus the inshore HI2 site (Fig. 5). These five sites were characterized by
the highest percentages of bare substrate, the lowest cover by Lyngbya, and the most
cover by sponges, stony corals, and soft corals (Fig. 3).
Coral condition
Coral surface area varied significantly with depth (ANOVA on log10-transformed data:
F1,32 = 4.60, P < 0.04) during the initial sampling period, January 26-27, 2005. On
average, colonies at inshore sites had 43% less estimated surface area than colonies at
offshore sites (368 ± 36.3 versus 642.3 ± 108.6 cm2, mean ± SE). Significant differences
in length (ANOVA on log10-transformed data: F1,38 = 6.33, P < 0.02) and height (ANOVA
on log10-transformed data: F1,38 = 4.47, P < 0.04), but not width, contributed to this pattern.
Percentages of old and recent tissue loss varied significantly with the exact
combination of sewage outfall and shipping channel at each pair of sites (significant
interaction terms, Table 3) in January, 2005. Old loss of live coral tissue was
significantly lower at the biomonitoring control sites than at the paired sites with just a
sewage outfall (Fig. 6). The percentages of old tissue loss at the other two sites (PE and
HI) were indistinguishable statistically from these two extremes. New tissue loss had a
similar pattern (Fig. 6); it was significantly higher at paired sites having just a sewage

26
Fig. 5 Sites clustered by bottom composition, estimated as percentage cover of substrate,
Lyngbya, other algae species beside Lyngbya, Porifera, Scleractinia, and Octocoralia.
Shading identifies inshore sites and black boxes denote biomonitoring control sites
established by the Broward County Department of Environmental Protection.

27
outfall (HWO) than at the other three paired sites. Most new tissue loss (Fig. 2) appeared
to be caused by parrotfish or other grazers.
We observed little recent tissue loss when we resampled colonies on August 15
16, 2005. However, the percentage of total tissue loss, which includes mortality due to
non-regenerated sampling lesions, varied significantly with depth, the sewage outfall x
shipping channel interaction, and the three-way interaction between them (Table 4). On
average, total tissue loss was low at all inshore sites and at the offshore biomonitoring
control site, highest at the offshore site near a sewage outfall, and also high at the
offshore sites that had shipping channels (Fig. 7). The estimate of total tissue loss at the
Port Everglades offshore site (PE3) is conservative because we only re-located one
colony there (Appendix II). The missing colonies must have been overturned, buried by
sediment, moved off the site or destroyed. One colony at another offshore/shipping
channel site (HI3) was knocked loose from the bottom and moved 30 cm from its original
position near a sponge. We identified this colony from the photograph of its sampling
lesion.
Lesion regeneration
Regeneration rates of biopsy lesions varied significantly with their initial area
(F1,34 = 7.53, P < 0.01, R2
= 0.18); larger lesions regenerated faster than smaller lesions
(regression equation: regeneration rate [mm2/d] = -0.96 + 6.65 x 10
-3 x initial lesion size
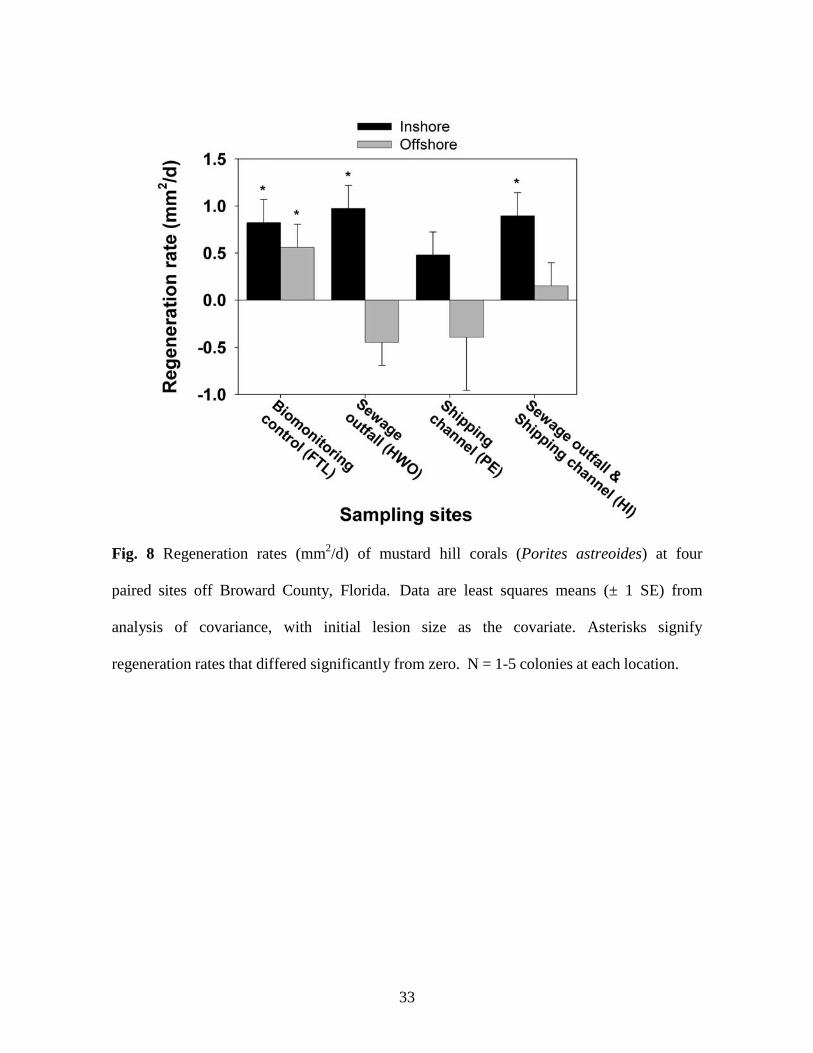
[mm2]). Lesion regeneration rate also varied significantly with depth and the sewage
outfall x shipping channel interaction (Table 5). Coral colonies at all inshore sites except
PE had lesion regeneration rates that were significantly greater than zero (Fig. 8). In
28
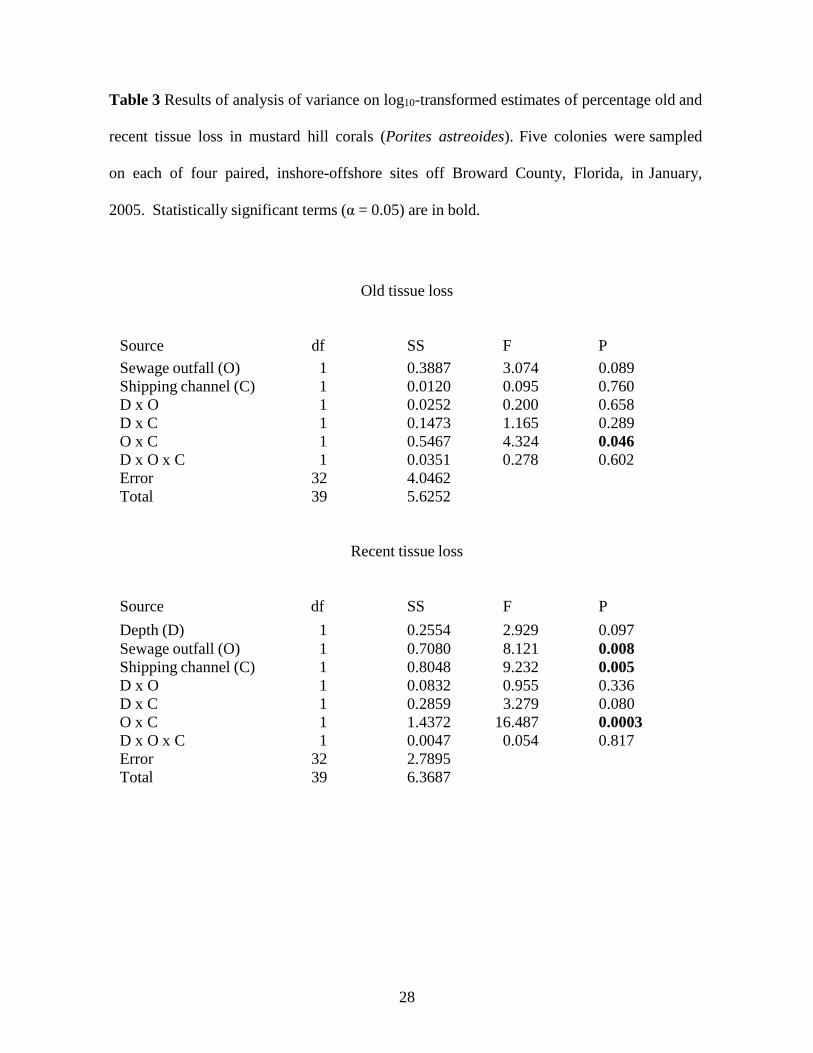
Table 3 Results of analysis of variance on log10-transformed estimates of percentage old and
recent tissue loss in mustard hill corals (Porites astreoides). Five colonies were sampled
on each of four paired, inshore-offshore sites off Broward County, Florida, in January,
2005. Statistically significant terms (α = 0.05) are in bold.
Old tissue loss
Source
Depth (D)
df
1
SS
0.4238
F
3.352
P
0.077
Sewage outfall (O) 1 0.3887 3.074 0.089
Shipping channel (C) 1 0.0120 0.095 0.760
D x O 1 0.0252 0.200 0.658
D x C 1 0.1473 1.165 0.289
O x C 1 0.5467 4.324 0.046
D x O x C 1 0.0351 0.278 0.602
Error 32 4.0462
Total 39 5.6252
Recent tissue loss
Source df SS F P
Depth (D) 1 0.2554 2.929 0.097
Sewage outfall (O) 1 0.7080 8.121 0.008
Shipping channel (C) 1 0.8048 9.232 0.005
D x O 1 0.0832 0.955 0.336
D x C 1 0.2859 3.279 0.080
O x C 1 1.4372 16.487 0.0003
D x O x C 1 0.0047 0.054 0.817
Error 32 2.7895
Total 39 6.3687

29
Fig. 6 Estimated percentages of old and recent tissue loss on mustard hill corals (Porites
astreoides) at four locations off Broward County, Florida. Data are untransformed means
± 1 SE; N = 10 colonies at each location, sampled January 26-27, 2005. Levels of old or
recent tissue loss that are not connected by the same letter differed significantly in
ANOVA on log10(x+1)-transformed variates.

30
Table 4 Results of analysis of variance on log10-transformed estimates of percentage total
tissue loss on mustard hill corals (Porites astreoides). Up to five colonies were re-
sampled on each of four paired, inshore-offshore sites off Broward County, Florida, in
August, 2005. Statistically significant terms (α = 0.05) are in bold. Model R2
= 0.59.
Source df SS F P
Depth (D) 1 0.3554 20.485 0.0001
Sewage outfall (O) 1 0.0001 0.003 0.954
Shipping channel (C) 1 0.0263 1.520 0.228
D x O 1 0.0166 0.960 0.336
D x C 1 0.0039 0.225 0.639
O x C 1 0.1802 10.386 0.003
D x O x C 1 0.1313 7.565 0.010
Error 28 0.4858
Total 35 1.1958

31
Fig. 7 Estimated percentages of total tissue loss on mustard hill corals (Porites astreoides)
at four paired sites off Broward County, Florida. Data are untransformed means ± 1 SE;
N = 1-5 colonies at each location, sampled August 14-15, 2005. Levels that are not
connected by the same letter differed significantly in ANOVA on square-root transformed
variates.

32
Table 5 Results of analysis of covariance on regeneration rates of mustard hill corals (Porites
astreoides). Up to five colonies were re-sampled at each of four paired, inshore- offshore sites
off Broward County, Florida, in August, 2005. Statistically significant terms (α = 0.05) are in
bold. Model R2 = 0.60.
Source df SS F P
Initial lesion size
1
3.4202
11.40
0.002
Depth (D) 1 4.4854 14.95 0.001
Sewage outfall (O) 1 0.0041 0.014 0.908
Shipping channel (C) 1 0.2244 0.813 0.375
D x O 1 0.4213 1.404 0.246
D x C 1 0.0021 0.007 0.934
O x C 1 1.3334 4.444 0.044
D x O x C 1 0.6497 2.165 0.153
Error 27 8.1031
Total 35 20.0190
33
Fig. 8 Regeneration rates (mm2/d) of mustard hill corals (Porites astreoides) at four
paired sites off Broward County, Florida. Data are least squares means (± 1 SE) from
analysis of covariance, with initial lesion size as the covariate. Asterisks signify
regeneration rates that differed significantly from zero. N = 1-5 colonies at each location.

34
contrast, among the offshore sites only colonies at the biomonitoring control site were
significantly greater than zero (Fig 9) . Regeneration rates at the three other offshore
sites were indistinguishable statistically from zero; mean regeneration rates at the offshore
sewage outfall (HWO3) and shipping channel (PE3) were negative (Fig. 8).
Cellular-diagnostic responses of biopsied corals
Multivariate and univariate analyses
The main effects of depth (MANOVA: F10,20 = 5.48, P < 0.001) and sewage outfall
(MANOVA: F10,20 = 4.38, P < 0.003), and the depth x shipping channel (MANOVA:
F10,20 = 2.47, P < 0.04) and sewage outfall x shipping channel (MANOVA: F10,20 = 3.35, P
< 0.02) interactions all explained significant variation in the vector of ten cellular-
diagnostic responses. Eight parameters contributed most to the significant multivariate
response: Hsp 60, Grp 75, ubiquitin, CYP 2, CYP 6, FC, MDR and GST. Accumulations
of sHsp and Cu/Zn SOD did not vary significantly with depth or proximity to potential
land-based sources of pollution (Appendix III).
Heat shock protein 60 and ubiquitin comprised assays of protein metabolic
condition. Averaged across all sites, offshore corals had significantly more Hsp 60 than
did inshore corals (ANOVA F1,29 = 9.00, P < 0.006) and colonies from HI had less Hsp
60 than expected for a site near both a sewage outfall and shipping channel (significant
interaction term: ANOVA F1,29 = 10.57, P < 0.003; Fig. 10A). Ubiquitin levels varied
significantly with the depth x shipping channel interaction (ANOVA F1,29 = 4.51, P <
0.043). Corals at inshore sites without a nearby shipping channel had twice as much

35
Fig. 9. Sampling lesion on colony 16 from PE2: A) initial, and B) expanding, thereby
increasing the total area of tissue loss. Sampling lesion of colony 33 from FTL3: A)
initial, B) almost totally regenerated.

36
Figure 10 Mean (± 1 SE) accumulations of parameters indicative of protein metabolic
condition in Porites astreoides sampled off Broward County, Florida, and two other
regions. A) Heat shock protein 60, B) ubiquitin. Abbreviations are as in the text.

37
ubiquitin as colonies at inshore sites with a shipping channel nearby (Fig. 10B). In
contrast, corals at offshore sites had intermediate ubiquitin levels.
Total sHsp’s and Grp 75 assayed of overall metabolic condition. Total sHsp
levels did not vary among the Broward County sites (Fig. 11A). Levels of Grp 75 varied
significantly with the sewage outfall x shipping channel interaction (ANOVA F1,29 =
15.79, P = 0.0004). Averaged across both depths, corals at HWO had more than three
times as much Grp 75 as colonies at the biomonitoring and HI sites (difference
significant: Tukey’s HSD test; Fig. 11B).
Copper/zinc superoxide dismutase and FC comprised assays of oxidative stress
and response. Levels of Cu/Zn SOD did not vary significantly among the Broward
County sites (Fig. 12A). In contrast, FC levels varied significantly with the depth x
sewage outfall interaction (ANOVA F1,29 = 5.86, P < 0.03). Corals at inshore sites with a
sewage outfall nearby had significantly less FC than colonies at inshore sites without a
sewage outfall and offshore sites with a sewage outfall nearby. Offshore colonies at sites
without a sewage outfall were indistinguishable statistically from these two groups (Fig.
12B).
Cytochrome P450-2 class, CYP 6, GST and MDR assayed coral responses to
xenobiotics. Responses of CYP 2 and GST were very similar (Fig. 13A,B); both parameters
were significantly higher at offshore than at inshore sites (ANOVA’s: F1,29 > 6.17, P <
0.02). Mean CYP 6 levels were significantly higher at sites without shipping channels
compared to sites near them (ANOVA: F1,29 = 4.39, P = 0.045). On average, sites without
shipping channels had CYP 6 levels 26% higher than sites with shipping channels (Fig.
13C). Mean levels of MDR varied significantly with depth, sewage

38
Figure 11 Mean (± 1 SE) accumulations of parameters indicative of cellular metabolic
condition in Porites astreoides sampled off Broward County, Florida, and two other
regions. A) Total small heat shock proteins, B) glucose-regulated protein. Abbreviations are
as in the text.

39
Figure 12 Mean (± 1 SE) accumulations of parameters indicative of oxidative stress
response in Porites astreoides sampled off Broward County, Florida, and two other
regions. A) Cu/Zn superoxide dismutase, B) ferrochelatase. Abbreviations are as in the text.

40
Figure 13 Mean (± 1 SE) accumulations of parameters indicative of xenobiotic response in
Porites astreoides sampled off Broward County, Florida, and two other regions. A)
Cytochrome P450-2 class, B) glutathione-S-transferase, C) Cytochrome P450-6 class, and
D) multidrug resistance protein. Abbreviations are as in the text.

41
outfall, and the sewage outfall x shipping channel interaction (ANOVA: all F1,29 > 4.97, P
< 0.034). On average, mean MDR levels were 26% lower on inshore sites compared to
offshore sites, and 30% lower at sites near sewage outfalls compared to those without
them (Fig. 13D). In addition, mean MDR levels were significantly higher at the FTL
biomonitoring sites than at the two HWO sites (0.117 ± 0.00820 versus 0.061 ± 0.00531
fmol/pg TSP, respectively). Mean MDR levels at the paired PE and HI sites were
statistically indistinguishable from both of these groups (Tukey’s HSD test).
Comparisons with other sites
Mean accumulations of every cellular-diagnostic parameter at the eight Broward County
sites were indistinguishable statistically from those of P. astreoides sampled in Biscayne
National Park and the Florida Keys (one-way ANOVA followed by Tukey’s HSD test).
However, mean accumulations of all biomarkers at every U.S. site were significantly
higher than those of P. astreoides from the Bahamas (Figs. 10-13). The only exception
was Hsp 60, which was undetectable in Bahamian corals and did not differ significantly
from zero in inshore HI colonies.
Cluster analysis confirmed that corals from the Bahamas had very different
cellular-diagnostic responses than corals sampled in BNP, FKNMS, and off Broward
County (Fig. 14). The two Hollywood sewage outfall sites clustered with FKNMS
corals; the remaining inshore and offshore sites formed natural groups (Fig. 14).

42
Fig. 14 Sites clustered by mean cellular-diagnostic responses into four groups. Corals
from the Bahamas had low levels of all parameters. The two stations near the City of
Hollywood’s sewage outfall (HWO2 and HWO3) group with colonies sampled in Florida
Keys National Marine Sanctuary (Molasses Reef, Looe Key, and Marquesas Atoll). The
remaining three inshore (blue) and offshore sites (green) cluster together. The former
group also includes corals sampled at Biscayne National Park (BNP).

43
Cellular-diagnostic responses of corals in the laboratory experiment
After adjusting for the two-dimensional gradient in the laboratory, mean MDR
accumulations were significantly higher in coral explants exposed to artificial sea water
compared to PE water (least-squares means and SE’s of log10(MDR + 1): for artificial sea
water, 0.034 ± 0.00226; for PE water, 0.026 ± 0.00225; F1,16 = 5.55, P < 0.032). Mean
accumulations of every other CDS parameter did not differ significantly between
treatments or depths (Appendix IV). Instead, mean accumulations of all CDS parameters
except sHsp differed significantly between coral colonies nested within depth (Table 6).
There was substantial genetic variation (up to 90% of total phenotypic variation) between
coral colonies collected within inshore and offshore sites, particularly in mean
accumulations of GST, Cu/Zn SOD, ubiquitin, Hsp 60, MDR and CYP 6. Genetic
variation between colonies nested within depths was moderate for GRP 75 and FC (56
and 49%, respectively), and extremely low (1%) for sHsp. When the colony nested
within depth term was removed from statistical models, all except sHsp showed
significant differences in mean CDS levels between depths, which was consistent with
the pattern observed in field samples.
Correlated responses
Developing prognostic indicators of coral condition requires linking parameters of
molecular and cellular function with the fitness of individuals and ecosystem structure
and function (Depledge et al. 1993, Moore 2001, Fauth et al. 2003). In Porites astreoides
sampled off Broward County, percent tissue loss regressed positively on GRP 75
(mortalin) accumulation (Fig. 15), which is essential for cell proliferation. Backward

44
Table 6 Results of analysis of covariance on cellular-diagnostic parameters of mustard hill
corals (Porites astreoides) from inshore and offshore biomonitoring control sites exposed to
artificial sea water or water from Port Everglades, Florida.
Source of variation GST sHsp Cu/ZN
SOD
Ubiquitin GRP 75
Door gradient 3.76 0.08 5.43* 2.41 10.00
Aisle gradient
0.48
2.00
1.45
3.12
2.52
Water
0.02
0.89
0.63
0.86
0.02
Colony depth
2.55
2.89
2.61
0.33
4.32
Colony[Colony depth]
13.4****
0.86
18.1****
28.8****
4.44*
Water*Colony depth
1.39
1.98
0.100
0.17
0.23
Model R2
0.903
0.380
0.902
0.878
0.817
% variation genetic
87.4
1.04
87.2
87.1
56.2
*P < 0.05; ****P < 0.0001

45
Table 6 continued.
Source of variation Hsp 60 MDR FC CYP 6
Door gradient
4.33
10.6**
5.99*
0.9
Aisle gradient
2.12
5.01*
2.79
1.27
Water
1.06
5.63*
1.08
0.47
Colony depth
4.03
2.01
1.58
0
Colony[Colony depth]
18.6****
34.4****
5.81*
8.84**
Water*Colony depth
0.02
0.29
0.45
1.66
Model R2
0.935
0.896
0.658
0.640
% variation genetic
90.6
87.0
49.1
61.1
*P < 0.05; **P < 0.01; ****P < 0.0001

Fig. 15 Log-linear regression of coral % mortality as a function of the concentration of
glucose regulated protein 75 (Grp 75), which also is known as mortalin. Regression
equation: Log10(% mortality + 1) = 0.48 + 0.042 Grp 75 (femtomoles/ng total soluble
protein). F1,32 = 8.10, P < 0.008, R2
= 0.20.

47
Table 7 Regression model relating log10(percentage mortality + 1) of Porites astreoides as a
function of cellular-diagnostic parameters. Statistically significant regressors are in bold.
Whole model F4,29 = 4.78, P < 0.005, R2
= 0.40.
Source Estimate Std. error t-ratio P
Intercept
1.32
0.5521
2.39
0.0237
Log10(Grp + 1)
0.419
0.2108
1.99
0.0565
Log10(ubiquitin + 1)
-0.845
0.2564
-3.30
0.0026
Log10(CYP 2 + 1)
0.636
0.3241
1.96
0.0593
Log10(CYP 6 + 1)
2.150
0.7130
3.01
0.0053

48
Table 8 Log-linear regression model of the regeneration rate (mm/d) of Porites astreoides
as a function of cellular-diagnostic parameters. Statistically significant regressors are in bold.
Whole model F3,33 = 3.00, P < 0.046, R2
= 0.24.
Source Estimate Std. error t-ratio P
Intercept
-0.0907
1.015
-0.09
0.9294
Log10(ubiquitin + 1)
1.03
0.471
2.20
0.0359
Log10(CYP 2 + 1)
-1.32
0.596
-2.22
0.0342
Log10(CYP 6 + 1)
-3.14
1.284
-2.44
0.0207

49
stepwise selection identified a log-log model with Grp 75, ubiquitin, Cyp 2 and CYP 6 as
predictors of percent tissue loss (Table 7). Coral colonies with low ubiquitin levels and
high levels of Grp 75, CYP 2, and CYP 6 lost the most tissue. Similarly, levels of
ubiquitin, Cyp 2 and CYP 6 were significant predictors of lesion regeneration rate (Table
8). Coral colonies with high ubiquitin levels and low levels of CYP 2 and CYP 6 had the
highest regeneration rates.
Discussion
The objective of this pilot project was to test the feasibility of using cellular diagnostics
to link land-based sources of pollution with coral reef degradation. Our research detected
elevated biomarker levels in tissue samples of mustard hill coral (Porites astreiodes)
collected at four paired inshore and offshore stations off Broward County, FL, which
included biomonitoring control sites and sites near a sewage outfall, an inlet mouth, and a
sewage outfall adjacent to an inlet mouth. We used standard ecological methods to
assess coral health, including monitoring regeneration of lesions that we created while
sampling colonies. The results show that coral colonies at different sites varied in tissue
loss and regeneration rate, which in turn were associated with specific changes in cellular-
diagnostic parameters.
Typical coral monitoring programs use temporal changes in the percentage of
substrate occupied by live coral tissue as an indicator of reef health (Gardner et al. 2003).
This method requires increasingly greater sampling effort to detect significant changes as
coral cover approaches zero. At our four paired sites off Broward County, mean coral

50
cover was <4%, making this method imprecise and impractical. Instead we used cluster
analysis to determine that three inshore stations (FTL 1, PE2 and HWO2) had the lowest
percentages of bare substrate and cover by corals and sponges. In contrast, the four
offshore stations and the inshore Hillsborough Inlet station (HI2) grouped together and
had the highest percentages of bare substrate, corals and sponges, and the least area with
the cyanobateria Lyngbya. The area near the mouth of Hillsborough Inlet may present a
challenging environment for P. astreoides; the species was absent from the first area that
we dove and we had to explore further south. The dichotomy between inshore and
offshore stations is a repeated theme in the data, and illustrates the insight provided by
multivariate analyses of coral reef community structure.
Colonies at offshore stations were significantly longer and higher than those at
inshore stations and also had higher percentages of total tissue loss and lower
regeneration rates. The exception was the offshore FTL3 biomonitoring control site,
where coral colonies had little tissue loss and high regeneration rates. Total tissue loss
was greatest near the City of Hollywood’s sewage outfall and moderately high at the
offshore Port Everglades and Hillsborough Inlet stations. These three stations also had
lesion regeneration rates that were indistinguishable from zero, and in two cases (HWO3
and PE3) tended to be negative; lesions grew larger instead of healing. The inability to
regenerate small lesions indicates that conditions were poor for coral growth and
reproduction (e.g., Lester and Bak 1985; Meesters et al. 1997; Mascarelli and Bunkley-
Williams 1999; Fine et al. 2002) when we sampled colonies in January, 2005.
Cellular-diagnostic parameters were elevated at all four paired stations and at
several other sites that we sampled the following week in Biscayne National Park and

51
Florida Keys National Marine Sanctuary, compared to two coral colonies sampled in the
remote Exhumas, Bahamas. This pattern was clear and consistent and illustrates how
much easier it is to identify patterns when at least one site is distant from major sources
of anthropogenic stress. Cluster analysis organized sites into four main groups: Bahamas,
Hollywood outfall sites + FKNMS, the remaining offshore sites, and the three remaining
inshore sites + Biscayne National Park. Porites astreoides from the Bahamas had very
low accumulations of all cellular-diagnostic parameters, and total sHsp was below
detection limits there. This enzyme localizes to the mitochondria in cnidarians and other
invertebrates, where it protect aspects of oxidative phosphorylation (Morrow et al., 2000).
High levels of cnidarian sHsp at all eight Broward County stations indicate they were
responding to an oxidative stress (Downs et al. 2006).
The two stations near the City of Hollywood’s sewage outfall and sites in Florida
Keys National Marine Sanctuary were characterized by high levels of GRP 75, also
known as mortalin. This enzyme is induced by glucose deprivation and is involved in
pathways to cellular senescence and transformation. In our study, elevated GRP 75
levels were associated with increased amounts of coral tissue loss. Colonies at these sites
also had high levels of ubiquitin, which tags damaged proteins for degradation.
Combined, these results suggest that coral nutrition was altered by sewage discharge and
resulted in higher than normal rates of protein turnover. Nutrient enrichment and sediment
loads from sewage discharge are known to directly and indirectly inhibit growth and
recruitment of corals and decrease coral cover, including in the Florida Keys (e.g.,
Pastorak and Bilyard 1985, LaPointe et al. 2004).

52
Three offshore sites (FTL3, PE3 and HI3) were characterized by high levels of
Hsp 60, CYP 2 and MDR. Elevated levels of these three parameters are consistent with
oxidative damage caused by exposure to xenobiotics. Cytochrome P450-2 class is
induced by electrophilic carcinogens, drugs, and other environmental pollutants, which it
oxidizes in a cellular suicide reaction. Glutathione-S-transferase, which also was elevated
at these sites, conjugates the oxidized xenobiotic to glutathione, which is pumped from the
cell by MDR. Multidrug resistance protein is an ABC cassette protein that lowers the
intracellular concentration of toxic compounds below their level of toxicity (Bard 2000).
Increases in MDR usually occur only in response to an organic xenobiotic (Bard, 2000;
Sauna et al. 2001). The antibody used in this study binds both the cnidarian and
dinoflagellate isoforms, hence results are a composite of MDR expression in both.
Together, these results are consistent with offshore corals at the FTL3 biomonitoring site
and off Port Everglades and Hillsborough Inlet reacting to exposure to anthropogenic
contaminants. Regeneration of sampling lesions was negatively correlated with elevated
levels of CYP 2, which suggests that mounting xenobiotic defenses had a metabolic cost:
impaired ability to repair tissue damage. We plan to analyze frozen sediment and water
samples to identify likely stressors at these sites.
Coral colonies at three inshore stations (FTL1, PE2 and HI2) and Biscayne
National Park were characterized by cellular-diagnostic responses that tended to be lower
than at the other Broward County sites. Corals at these three inshore stations also had
moderate to high regeneration rates and little tissue loss, which is consistent with the
defense trade-off hypothesis. While seemingly contrary to conventional wisdom,
nearshore patch reefs in the Florida Keys have lost less live coral cover than more

53
offshore reef communities (Porter et al. 2001). On such inshore reefs, coral colonies
appear to be in better condition than conspecifics on offshore reefs, in part because
inshore colonies accumulate defensive compounds more rapidly and return to homeostasis
quickly once stressors recede (e.g., Downs et al. 1999; Fauth 2004; Downs et al. in press).
Much of the difference between inshore and offshore corals may have an ecotypic basis,
as differences between coral clones were strongly expressed in the laboratory experiment
even after two months of acclimation.
The laboratory experiment tested whether Port Everglades water induced cellular-
diagnostic responses similar to those of corals samples offshore. We found no evidence
that water collected at high tide from Port Everglades induced coral stress responses
compared to the artificial seawater control. This suggests that contaminants (if present)
must be bioaccumulated, combined with other stressors, or act indirectly (e.g., by
increasing the competitive effects of algae and invertebrates) to impair corals.
Alternatively, contaminant release may be episodic, tidal, or seasonal; the single
sampling event that we conducted cannot detect temporal variation in coral responses.
Reciprocal transplants or common garden experiments using coral colonies from the
more “pristine” and impacted sites would be useful for evaluating longer-term coral
responses to environmental stress. Combined with water quality and contaminant analyses
conducted at the same time and place, these experiments can strengthen the chain of
causality between land-based sources of pollution and coral reef degradation.
Porites astreoides is considered a hardy, r-selected or weedy coral species that is
capable of persisting under conditions that kill less-tolerant species. Consequently,
cellular-diagnostic parameters are generally induced less under environmental stress in P.

54
astreoides compared to members of the Montastraea annularis species complex (Fauth
and Downs, unpublished data from Flower Garden Banks National Marine Sanctuary and
the Florida reef tract). Greatly elevated levels of cellular-diagnostic parameters and low
coral cover at all sites we sampled off Broward County are cause for concern, especially
when regeneration rates were indistinguishable from zero at 4 of 8 stations. Observations
made during sampling suggest that these reef habitats were more luxuriant in the past
twenty years than at present. Our preliminary study begins establishing a line of evidence
suggesting that land-based sources of pollution are affecting the status and trends of
these communities. While this line of inquiry is in its infancy, it suggests that the reefs
supporting vital elements of Southeast Florida’s tourist and recreation economies
(Leeworthy and Bowker 1997) and should receive greater protection from potential
damage due to land-based sources of pollution.

55
Acknowledgments
We greatly appreciated sampling help provided by Les Paul and her postdoctoral
students. We thank Erin Hodel and Abby Renegar for their dedicated assistance with
the laboratory experiment. This study was permitted by the Florida Fish and Wildlife
Conservation Commission (Special Activity License #04SRP-846 and 04SR-830),
Biscayne National Park (Permit #BISC-2004-SCI-0031), and National Ocean Service
Permit FKNMS-2004-022. This project and the preparation of this report was funded in
part by a Coastal Zone Management Administration grant from the United States
Department of Commerce through an agreement/contract with the Office of Coastal and
Aquatic Managed Areas, of the Florida Department of Environmental Protection. The
total cost of the project was $52,746, of which $52,746 or 100% was provided by the
United States Department of Commerce.

56
References
Adams SM (2003) Establishing causality between environmental stressors and effects on
aquatic ecosystems. Hum Ecol Risk Assess 9:17-35
Bard SM (2000) Multixenobiotic resistance as a cellular defense mechanism in aquatic
organisms. Aq Toxicol 48:357–389.
Brown BA, Downs CA, Dunne RP, Gibb SW (2002) Exploring the basis of
thermotolerance in the reef coral Goniastrea aspera. Mar Ecol Prog Ser 242:119–
129
Bryant D, Burke L (1998) Reefs at risk: a map-based indicator of potential threats to the
world’s coral reefs. World Resources Institute, Washington, DC
Crowther JR (1999) The ELISA Guidebook. Humana Press, Totowa, New Jersey
de Zwart, BC, Frings-Dresen MH, van Duivenbooden JC (1999) Senior workers in the
Dutch construction industry: a search for age-related work and health issues. Exp
Ag Res 25:385-391
Depledge MH, Amaral-Mendes JJ, Daniel B, Halbrook RS, Kloepper-Sams P, Moore
MN, Peakall D.P (1993) The conceptual basis of the biomarker approach. In:
(Peakall DG, Shugart RL (eds.) Biomarkers - research and application in the
assessment of environmental health, Springer, Berlin, pp.15-29
Derham BK, Harding JJ (1999) Alpha-crystallin as a molecular chaperone. Progr Retinal
Eye Res18:463–509
Downs CA (2005) Cellular diagnostics and its application to aquatic and marine
toxicology. In: Ostrander G (ed) Techniques in Aquatic Toxicology, vol. 2. CRC
Press, Boca Raton, pp. 181–207

57
Downs CA, Coleman JS, Heckathorn SA (1999) The chloroplast22-Ku heat-shock
protein: a lumenal protein that associates with the oxygen evolving complex and
protects photosystem II during heat stress. J. Plant Physiol 55:477–487
Downs CA, Mueller E, Phillips S, Fauth, JE, Woodley CM (2000). A molecular
biomarker system for assessing the health of coral (Montastraea faveolata) during
heat stress. Mar Biotech 2:533–544
Downs CA, Fauth JE, Halas JC, Dustan P, Bemiss JA, Woodley CM, (2002). Oxidative
stress and coral bleaching. Free Rad Biol Med 33:533–543
Downs CA, Woodley CM, Richmond RH, Lanning LL, Owen R (2005) Shifting the
paradigm for coral-reef “health” assessment. Mar Poll Bull in press.
Dustan P (1999) Coral reefs under stress: Sources of mortality in the Florida Keys. Nat
Res For 23:147–155
Dustan P, Halas JC (1987) Changes in the reef-coral community of Carysfort Reef, Key
Largo, Florida: 1974–1982. Coral Reefs 6:91–106.
Dustan P, Leard J, Meier O, Brill M, Kosmynin V (1999) PointCount ’99 user manual.
http://www.cofc.edu/~coral/pc99/PC99manual.htm. Web accessed October 1,
2005.
Fauth JE, Downs CA, Halas JC, Dustan P, Woodley CM (2003) Mid-range prediction of
coral bleaching: A molecular diagnostic system approach. In: Valette-Silver N,
Scavia D (eds) Ecological Forecasting: New Tools for Coastal and Ecosystem
Management. NOAA Technical Memorandum NOS NCCOS 1, pp. 5–12
Ferreira GC (1999) Ferrochelatase. Intl J Biochem Cell Biol 31:995-1000

58
Fine M, Oren U, Loya Y (2002) Bleaching effect on regeneration and resource
translocation in the coral Oculina patagonica. Mar Ecol Prog Ser 234:119-125
Fisher EM, Fauth JE, Hallock P, Woodley CM (in prep.) Lesion regeneration in reef-
building corals (Montastraea annularis complex) in Biscayne National Park and
the Upper Florida Keys, USA. Mar Ecol Prog Ser in preparation.
Gardner TA, Cote, IM, Gill JA, Grant A, Watkinson AR (2003). Long-term region-wide
declines in Caribbean corals. Science 301: 958–960
Ghosh S, Gepstein S, Heikkila JJ, Dumbroff BG (1988) Use of a scanning densitometer
or an ELISA plate reader for measurement of nanogram amounts of protein in
crude extracts from biological tissue. Anal Biochem 169:227–233
Goreau TJ, McClanahan T, Hayes R, Strong AE (2000) Conservation of coral reefs after
the 1998 global bleaching event. Cons Biol 14:5–15.
Hoegh-Guldberg O (1999) Climate change, coral bleaching and the future of the world’s
coral reefs. Mar Freshw Res 50:839–866
Ketterer B, Harris JM, Talaska G, Meyer DJ, Pemble SE, Taylor JB, Lang NP, Kadlubar
FF (1992) The glutathione S-transferase supergene family, superfluous period, its
polymorphism, and its effects on susceptibility to lung cancer. Env Health
Perspect 98:87–94
Knowlton N (2001) The future of coral reefs. Proc Nat Acad Sci USA 98:5419–5425
Kramer P, Lang J, Marks K, Garza-Pérez R, Ginsburg R (2005) AGRRA methodology v.
4.0. http://www.agrra.org/method/AGRRAv4_2005.pdf, web accessed
September 30, 2005.

59
Lapointe BE, Barile PJ, Matzie WR. (2004) Anthropogenic nutrient enrichment of
seagrass and coral reef communities in the Lower Florida Keys: discrimination of
local versus regional nitrogen sources. J Exp Mar Biol Ecol 308:23– 58
Leeworthy VR, Bowker JM (1997) Linking the economy and environment of Florida
Keys/Florida Bay: Nonmarket economic user values of the Florida Keys/Key
West. National Oceanic and Atmospheric Administration report. Web accessed
June 14, 2003: http://www.srs.fs.usda.gov/pubs/rpc/1998-12/rpc_98dec_26.pdf.
Mascarelli PE, Bunkley-Williams L (1999) An experimental field evaluation of healing
in damaged, unbleached and artificially bleached star coral, Montastrea annularis.
Bull Mar Sci 65:577-586
Meesters EH, Weeseling I, Bak RPM (1997) Coral colony tissue damage in six species of
reef-building corals: partial mortality in relation with depth and surface area. J
Sea Res 37:131-144
Moore MM (2001) A strategy for impact and risk assessment in integrated environmental
management. Revue Méd Vét 153:507-512
Morrow G, Inaguma Y, Kato K, Tanguay RM (2000) The small heat shock protein
Hsp22 of Drosophila melanogaster is a mitochondrial protein displaying
oligomeric organization. J Biol Chem 275:31204–31210
Moyer RP, Riegl B, Banks K, Dodge RE (2003) Spatial patterns and ecology of benthic
communities on a high-latitude South Florida (Broward County, USA) reef
system. Coral Reefs 22:447–464

60
Near JC, Easton DP, Rutledge PS, Dickinson DP, Spotila JR (1990) Heat shock protein
gene expression in intact salamanders (Eurycea bislineata) in response to
calibrated heat shocks and high temperatures encountered in the field. J Exp Zool
256:303-314
Nystrom M, Folke C, Moberg F (2000) Coral reef disturbance and resilience in a human-
dominated environment. Trends Ecol Evol 15:413–417
Patterson KL, Porter JW, Ritchie KB, Polson SW, Mueller E, Peters EC, Santavy DL,
Smith GW (2002) The etiology of white pox, a lethal disease of the Caribbean
elkhorn coral, Acropora palmata. Proc Nat Acad Sci USA 99:8725–8730
Pastorok, RA, Bilyard, GR (1985) Effects of sewage pollution on coral-reef communities.
Mar Ecol Progr Ser 21:175-189.
Pennisi E (2002) Survey confirms coral reefs are in peril. Science 297:1622–1623
Pockley AG (2001) Heat shock proteins in health and disease: therapeutic targets or
therapeutic agents? Expert Reviews in Molecular Medicine, 21 September,
http://www.expertreviews.org/01003556h.htm.
Porter, JW, Tougas JI (2001) Reef ecosystems: threats to their biodiversity. In: Levin S
(ed) Encyclopedia of biodiversity, vol. 5. Academic Press, pp. 73–95
Porter JW, Jaap WC, Wheaton JL, Kosmynin V, Tsokos CP, Yanev G, Hackett K,
Paterson KL, Marcinek DM, Dotten J, Eaken D, Brill M, Lybolt M, Patterson M,
Meter OW, Porter KG, Dustan P (2001) Detection of coral reef change by the
Florida Keys Coral Reef Monitoring Project. In: Porter JW and Porter KG (eds)
Linkages between ecosystems in the South Florida hydroscape: the river of grass
continues. CRC Press, Boca Raton, pp. 915-936.

61
Renes J, de Vries EG, Jansen PL, Muller M (2000) The (patho)physiological functions of
the MRP family. Drug Res Update 3:289-302
Richmond RH (1993) Coral reefs: Present problems and future concerns resulting from
anthropogenic disturbance. Amer Zool 33:524–536
Sauna ZE, Smith MM, Muller M, Kerr KM, Ambudkar SV (2001) The mechanism of
action of multidrug-resistance-linked-P glycoprotein. Journal of Bioenergetics and
Biomembranes 33:481–491.
Smith AG, Marsh O, Elder GH (1993) Investigation of the subcellular location of the
tetrapyrrole-biosynthesis enzyme coproporphyrinogen oxidase in higher plants.
Biochem Journal 292:503-508
Tan KH, Meyer DJ, Gillies N, Ketter B (1988) Detoxification of DNA hydroperoxide by
glutathione transferases and the purification and characterization of glutathione
transferases of the rat liver nucleus. Biochem Journ 254:841-845
Vasseur P, Cossu-Leguille C (2003) Biomarkers and community indices as
complementary tools for environmental safety. Envir Intl 28:711–717
Waters LC, Zelhof AC, Shaw BJ, Chang L-Y (1992) Possible involvement of the long
terminal repeat of transposable element 17.6 in regulating expression of an
insecticide resistance-associated P450 gene in Drosophila. Proc Natl Acad Sci
USA 89:4855-4859.
Welch WJ (1993) Heat shock proteins functioning as molecular chaperones: their roles in
normal and stressed cells. Phil Trans Royal Soc London, Series B, 339:327-333
Wilkinson CR (1999) Global and local threats to coral reef functioning and existence:
review and predictions. Mar Freshwater Res 50:867–878

62
Wu G, Wilen RW, Robertson AJ, Gusta LV (1999) Isolation, chromosomal
localization, and differential expression of mitochondrial manganese superoxide
dismutase and chloroplastic copper/zinc superoxide dismutase genes in wheat.
Plant Phys 120:513-520

63
Appendix I
Estimated percent cover of substrate, corals and other benthic taxa at four paired stations off
Broward County, Florida.
Species / group
HWO2A
HWO3
PE2
PE3
mean se mean se mean se mean se
Substrate 33.34 3.27 81.11 1.14 38.65 1.31 69.82 1.48
Porites asteroides
0.16
0.10
0.06
0.06
0.06
0.06
0.00
0.00
Favia fragum 0.00 0.00 0.00 0.00 0.06 0.06 0.00 0.00
Porites porites 0.00 0.00 0.06 0.06 0.00 0.00 0.00 0.00
Siderastrea siderea 0.06 0.06 0.00 0.00 0.12 0.07 0.11 0.06
Montastraea cavernosa 0.62 0.62 0.15 0.09 0.00 0.00 0.29 0.07
Meandrina meandrites 0.00 0.00 0.00 0.00 0.00 0.00 0.00 0.00
Acropora cervicornis 0.36 0.29 0.00 0.00 0.00 0.00 0.00 0.00
Dichocoenia stokesii 0.22 0.22 0.00 0.00 0.00 0.00 0.00 0.00
Stephanocoenia michelinii 0.00 0.00 0.06 0.06 0.00 0.00 0.00 0.00
Diploria labyrinthiformis 0.00 0.00 0.00 0.00 0.00 0.00 0.00 0.00
Diploria strigosa 0.68 0.55 0.45 0.27 0.00 0.00 0.00 0.00
Siderastrea radians 0.00 0.00 0.00 0.00 0.00 0.00 0.00 0.00
Scleractinia 0.00 0.00 0.06 0.06 0.00 0.00 0.04 0.04
Colpophyllia natans 0.00 0.00 0.00 0.00 0.00 0.00 0.00 0.00
Solenastrea bournoni 0.00 0.00 0.00 0.00 0.12 0.12 0.00 0.00
Porifera
2.93
0.87
6.73
1.59
2.54
0.44
7.13
0.84
zoanthidae (Palythoa) 13.42 2.76 0.00 0.00 0.36 0.29 2.26 1.76
Octocoral 1.87 0.63 4.27 0.91 0.72 0.36 0.83 0.38
Dictyota 0.12 0.07 0.00 0.00 0.00 0.00 0.00 0.00
Halimeda 0.00 0.00 0.06 0.06 0.00 0.00 2.30 1.35
Lobophora 0.00 0.00 0.00 0.00 0.00 0.00 0.04 0.04
Lyngbya 36.84 5.80 6.40 0.96 56.00 2.38 14.67 0.55
Padina 0.11 0.11 0.00 0.00 0.00 0.00 0.00 0.00
Macroalgae 0.67 0.32 0.13 0.07 1.30 0.65 0.36 0.25
Algal mat community 7.97 3.79 0.30 0.11 0.06 0.06 2.16 0.55
Crustose coralline algae 0.17 0.10 0.00 0.00 0.00 0.00 0.00 0.00
TOTAL
100.00
0.00
99.88
0.00
100.00
0.00
100.00
0.00

64
Species / group HI2 HI3 FTL1 FTL3
mean se mean se mean se mean se
Substrate
66.53
1.75
62.64
5.88
48.49
3.14
64.27
2.95
Porites asteroides
0.37
0.22
0.31
0.19
0.24
0.16
0.13
0.08
Favia fragum 0.06 0.06 0.07 0.07 0.08 0.08 0.00 0.00
Porites porites 0.00 0.00 0.00 0.00 0.00 0.00 0.07 0.07
Siderastrea siderea 0.27 0.01 0.00 0.00 0.00 0.00 0.27 0.19
Montastraea cavernosa 1.13 0.38 0.31 0.19 0.86 0.57 0.26 0.26
Meandrina meandrites 0.37 0.37 0.05 0.05 0.07 0.07 0.00 0.00
Acropora cervicornis 0.00 0.00 0.00 0.00 0.00 0.00 0.00 0.00
Dichocoenia stokesii 0.06 0.06 0.00 0.00 0.14 0.14 0.00 0.00
Stephanocoenia michelinii 0.00 0.00 0.00 0.00 0.00 0.00 0.00 0.00
Diploria labyrinthiformis 0.28 0.28 0.00 0.00 0.00 0.00 0.00 0.00
Diploria strigosa 0.14 0.14 0.00 0.00 0.00 0.00 0.00 0.00
Siderastrea radians 0.00 0.00 0.05 0.05 0.00 0.00 0.35 0.35
Scleractinia 0.00 0.00 0.00 0.00 0.00 0.00 0.07 0.07
Colpophyllia natans 0.90 0.45 0.11 0.11 0.00 0.00 0.00 0.00
Solenastrea bournoni 0.00 0.00 0.00 0.00 0.00 0.00 0.00 0.00
Porifera
5.34
0.79
4.97
1.35
3.01
0.85
2.38
0.64
zoanthidae (Palythoa) 0.14 0.08 0.00 0.00 4.75 0.83 0.00 0.00
Octocoral 8.58 0.78 6.88 2.03 1.34 0.56 11.25 2.41
Dictyota 0.00 0.00 0.00 0.00 0.77 0.33 0.00 0.00
Halimeda 0.27 0.27 0.00 0.00 0.15 0.09 0.00 0.00
Lobophora 0.00 0.00 0.00 0.00 0.00 0.00 0.00 0.00
Lyngbya 11.25 1.35 21.04 2.77 36.75 2.17 17.88 1.24
Padina 0.00 0.00 0.00 0.00 0.00 0.00 0.00 0.00
Macroalgae 2.42 0.25 1.46 0.45 1.20 0.38 1.31 0.91
Algal mat community 1.56 0.25 2.11 0.32 1.35 1.35 1.77 0.88
Crustose coralline algae 0.33 0.15 0.00 0.00 0.00 0.00 0.00 0.00
TOTAL
100.00
0.00
100.00
0.00
100.00
0.00
100.00
0.00

65
Appendix II
Ecological aspects of Porites colonies.
Site Coral # depth (m) initial lesion
size mm2
regen rate
(mm2/d)
total tissue loss
(%)
HWO3 1 14.5 176.8 -0.6059701 67
HWO3 2 14.5 176.8 -0.1208955 15
HWO3 3 14.5 153.9 -1.2124378 20
HWO3 4 15 300 -0.1497512 55
HWO3 5 15 254.5 -0.219403 3
HWO2 6 7 330 1.64179104 0
HWO2 7 7 213.8 1.06368159 2
HWO2 8 7 201.1 0.95263184 1
HWO2 9 7 201.1 0.92139303 2
HWO2 10 7 143.1 0.39547264 4
PE3 11 14 283.5 0.07313433 30
PE3 12 14.5 176.8 . . PE3 13 14.5 165.1 . . PE3 14 15.5 176.8 . . PE3 15 15.5 176.8 . . PE2 16 8 194.8 -0.4412935 15
PE2 17 8 176.8 0.16766169 2
PE2 18 8 213.8 0.50099502 2
PE2 19 8 201.1 0.68402985 2
PE2 20 8 254.5 1.26616915 4
HI3 21 15.5 254.5 0.83537313 4
HI3 22 16.5 188.7 0.00004975 5
HI3 23 16.5 176.8 -2.1838308 36
HI3 24 16 188.7 0.89094527 8
HI3 25 16 213.8 0.87223881 3
HI2 26 9.5 363.1 1.55636816 2
HI2 27 9.5 227 1.08148756 2
HI2 28 9.5 188.7 0.71900498 3
HI2 29 9.5 176.8 0.85517413 1
HI2 30 9 176.8 0.659801 1
FTL3 31 17.5 213.8 0.45313433 3
FTL3 32 17.5 240.5 0.43069652 2
FTL3 33 17.5 201.1 0.95263184 1
FTL3 34 17.5 201.1 0.28835821 5
FTL3 35 17.5 176.8 0.40681592 2
FTL2 36 9.5 254.5 0.98383085 3
FTL2 37 9 254.5 1.26577841 1
FTL2 38 9.5 213.8 0.74716418 2
FTL2 39 9 176.8 0.76139303 2
FTL2 40 9 165.1 0.30462687 2

66
Appendix III
Accumulations of cellular-diagnostic parameters in Porites astreoides sampled off
Broward County, Florida; Biscayne National Park and Florida Keys National Marine
Sanctuary, Florida; and Little Exuma Island, Bahamas.
Site Coral # Hsp 60 Ubiquitin sHsp GRP75 Cu/Zn SOD
HWO3 1 8.29 920 2.58 15 2.69
HWO3 2 7.07 459 1.56 6.14 2.07
HWO3 3 2.57 218 0.61 7.39 1.22
HWO3 4 3.64 199 0.88 20.7 1.34
HWO3 5 8.69 975 1.67 8.14 2.25
HWO2 6 4.68 1208 1.72 4.62 2.28
HWO2 7 3.2 550 1.23 8.55 1.79
HWO2 8 3.28 1228 0.91 5.3 1.58
HWO2 9 4.63 1190 2.57 10.3 2.19
HWO2 10 4.06 1688 2.45 3.55 2.5
PE3 11 5.76 219 0.32 8.42 0.88
PE3 12 3.95 833 1.63 0.63 1.95
PE3 13 10.3 847 1.34 8.98 2.42
PE3 14 4.16 442 1.2 1.42 2.01
PE3 15 6.01 1391 3.76 5.73 3.23
PE2 16 4.25 377 1.2 2.07 1.51
PE2 17 5.79 466 0.4 12.3 1.35
PE2 18 5.12 547 2.33 2.79 3.01
PE2 19 . . . . .
PE2 20 4.74 298 0.61 7.72 1.62
HI3 21 3.75 585 1.89 2.92 2.84
HI3 22 6.16 619 2.19 2.65 2.29
HI3 23 1.89 302 0.94 1.11 1.7
HI3 24 6.92 1077 4.47 4.23 3.1
HI3 25 1.61 527 0.82 0.91 1.75
HI2 26 0.95 185 0.89 0.89 1.52
HI2 27 -2.2 68.5 0.34 0.47 0.65
HI2 28 5.02 1418 2.1 4.89 2.36
HI2 29 0.78 136 0.45 10.3 0.72
HI2 30 1.6 222 1.51 0.45 1.85
FTL3 31 3.66 556 1.94 2.27 2.09
FTL3 32 3.81 599 1.51 1.45 1.85
FTL3 33 8.46 1297 2.85 5.23 2.6
FTL3 34 8.12 522 4.75 3.45 2.17
FTL3 35 3.04 471 1.12 1.06 1.52
FTL2 36 2.76 244 1.27 1.72 1.05
FTL2 37 4.32 526 2.46 2.58 2.31
FTL2 38 1.19 1261 0.77 0.98 1.66
FTL2 39 2.93 876 1.82 1.99 2.78
FTL2 40 4.81 540 1.54 2.42 1.4
BNP Al 2.75 321 0.96 3.51 1.51
BNP Al 4.36 1205 1.44 2.27 3.27
FKNMS Lo 3.01 2113 2.11 1.05 2.29
FKNMS Lo 6.81 319 1.67 6.6 1.73

67
Site Coral # Hsp 60 Ubiquitin sHsp GRP75 Cu/Zn SOD
FKNMS Mo 8.71 587 0.52 22.7 1.53
FKNMS Mo 0.95 85.4 0.72 10.9 0.99
FKNMS Ma 7.78 172 1.26 12.3 1.53
Bahamas Ba -2.6 6.84 0.34 0.54 0.13
Bahamas Ba -2.6 28.8 0.34 0.53 0.17

68
Site Coral # FC CYP 2 CYP 6 cnidarian GST MDR
HWO3 1 6.76 2.22 3.15 3.86 0.07
HWO3 2 7.42 2.8 3.07 3.37 0.07
HWO3 3 4.02 5.08 1.38 4.45 0.1
HWO3 4 5.65 0.41 3.11 1.63 0.04
HWO3 5 6.73 6.88 1.71 4.73 0.1
HWO2 6 5.02 0.99 3.01 2.66 0.06
HWO2 7 4.43 1.01 3.17 2.58 0.05
HWO2 8 3.35 1.99 1.41 3.77 0.05
HWO2 9 4.5 1.5 3.16 2.4 0.05
HWO2 10 4.53 3.81 3.02 4.37 0.05
PE3 11 4.88 0.71 2.97 2.36 0.04
PE3 12 3.78 4.31 1.71 5.29 0.05
PE3 13 6.52 3.58 1.7 5.9 0.08
PE3 14 3.72 1.05 1.94 1.64 0.12
PE3 15 10 5.76 2.2 4.25 0.2
PE2 16 6.19 1.75 2.05 1.99 0.1
PE2 17 7.84 3 1.56 3.28 0.06
PE2 18 6.9 2.67 2.21 3.48 0.13 PE2 19 . . . . .
PE2 20 6.68 1.29 1.81 2.97 0.06
HI3 21 5.11 4.41 2.2 5.51 0.15
HI3 22 5.42 3.81 2.17 3.69 0.13
HI3 23 3.56 3.18 3.02 2.99 0.07
HI3 24 7.82 5.92 1.91 3.9 0.17
HI3 25 4.37 6.03 2.51 4.7 0.13
HI2 26 2.89 1.12 1.51 1.1 0.08
HI2 27 0.87 0.29 0.96 0.46 0.03
HI2 28 5.7 1.78 3.17 2.41 0.05
HI2 29 2.29 0.42 1.32 1.08 0.02
HI2 30 3.44 2.05 1.28 3.94 0.03
FTL3 31 5.65 1.41 1.9 1.97 0.12
FTL3 32 4.96 0.62 3.68 2.98 0.09
FTL3 33 9.51 7.24 3.36 4.68 0.15
FTL3 34 5.3 4.18 1.48 3.03 0.14
FTL3 35 3.94 0.46 3.36 2.31 0.09
FTL2 36 4.6 0.91 1.35 1.84 0.08
FTL2 37 6.17 1.48 1.96 2.55 0.13
FTL2 38 2.91 1 1.91 1.73 0.09
FTL2 39 5.47 1.32 2.71 2.84 0.15
FTL2 40 6.93 0.99 1.7 2.59 0.12
BNP Al 2.99 0.57 1.88 2.63 0.07
BNP Al 6.42 3 1.95 3.07 0.15
FKNMS Lo 4.09 1.32 2.82 4.18 0.07
FKNMS Lo 5.58 5.7 1.88 4.62 0.06
FKNMS Mo 5.26 2.56 2.67 3.53 0.05
FKNMS Mo 1.78 0.93 1.35 2.09 0.03
FKNMS Ma 3.53 0.81 1.4 2.49 0.06
Bahamas Ba 0.09 0.32 0 0.21 0
Bahamas Ba 0.35 0.48 0.1 0.33 0
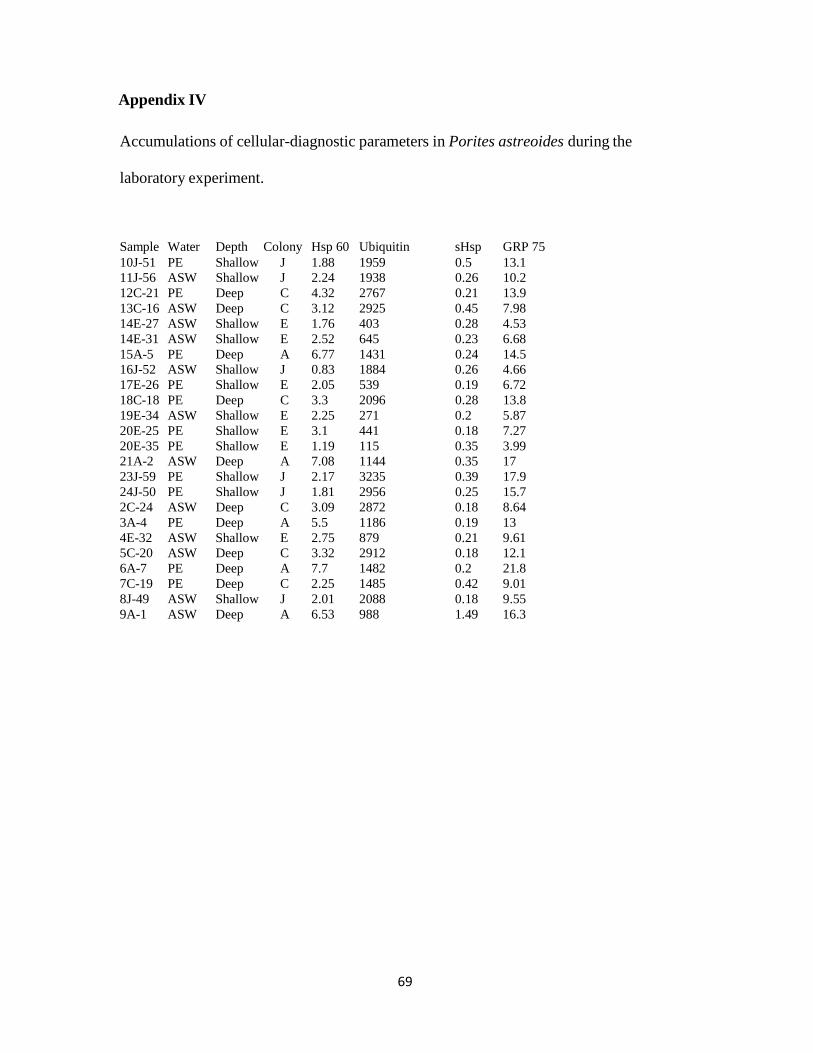
69
Appendix IV
Accumulations of cellular-diagnostic parameters in Porites astreoides during the
laboratory experiment.
Sample Water Depth Colony Hsp 60 Ubiquitin sHsp GRP 75
10J-51 PE Shallow J 1.88 1959 0.5 13.1
11J-56 ASW Shallow J 2.24 1938 0.26 10.2
12C-21 PE Deep C 4.32 2767 0.21 13.9
13C-16 ASW Deep C 3.12 2925 0.45 7.98
14E-27 ASW Shallow E 1.76 403 0.28 4.53
14E-31 ASW Shallow E 2.52 645 0.23 6.68
15A-5 PE Deep A 6.77 1431 0.24 14.5
16J-52 ASW Shallow J 0.83 1884 0.26 4.66
17E-26 PE Shallow E 2.05 539 0.19 6.72
18C-18 PE Deep C 3.3 2096 0.28 13.8
19E-34 ASW Shallow E 2.25 271 0.2 5.87
20E-25 PE Shallow E 3.1 441 0.18 7.27
20E-35 PE Shallow E 1.19 115 0.35 3.99
21A-2 ASW Deep A 7.08 1144 0.35 17
23J-59 PE Shallow J 2.17 3235 0.39 17.9
24J-50 PE Shallow J 1.81 2956 0.25 15.7
2C-24 ASW Deep C 3.09 2872 0.18 8.64
3A-4 PE Deep A 5.5 1186 0.19 13
4E-32 ASW Shallow E 2.75 879 0.21 9.61
5C-20 ASW Deep C 3.32 2912 0.18 12.1
6A-7 PE Deep A 7.7 1482 0.2 21.8
7C-19 PE Deep C 2.25 1485 0.42 9.01
8J-49 ASW Shallow J 2.01 2088 0.18 9.55
9A-1 ASW Deep A 6.53 988 1.49 16.3

70
Sample Cu/Zn SOD FC CYP P450 6 class cnid GST MDR
10J-51 2.61 5.81 4.2 5.46 0.04
11J-56 2.31 5.48 1.58 4.32 0.06
12C-21 4.19 4.48 1.83 6.81 0.08
13C-16 3.39 4.12 0.9 6.13 0.05
14E-27 1.66 3.37 0.93 2.94 0.03
14E-31 2.5 4.59 2.81 4.19 0.05
15A-5 6.17 5.61 3.41 10.5 0.13
16J-52 1.37 3.21 0.98 2.47 0.02
17E-26 2.25 3.83 1.19 3.92 0.04
18C-18 2.75 5.55 1.06 5.68 0.07
19E-34 2.34 4.07 1.36 3.35 0.04
20E-25 2.36 5.12 4.62 5.81 0.06
20E-35 1.79 2.62 0.92 2.79 0.02
21A-2 6.09 7.34 5.3 10.3 0.2
23J-59 3.00 6.57 5.79 5.1 0.05
24J-50 2.88 4.92 5.07 6.31 0.03
2C-24 2.38 3.78 0.85 4.72 0.05
3A-4 5.23 4.82 3.15 10.1 0.1
4E-32 3.27 4.76 2.79 5.47 0.06
5C-20 3.53 5.48 1.17 5.92 0.08
6A-7 7.37 7.95 5.69 11.8 0.18
7C-19 2.12 4.45 0.81 3.49 0.04
8J-49 2.76 4.54 3.57 4.7 0.04
9A-1 6.07 7.21 3.95 11.4 0.14