spainwatch - bbva research
TRANSCRIPT

March 2009Economic Research Department
SpainWatch
The weakness of the world economy, the de-leveraging process and the resizing ofthe property sector are a burden on the Spanish economy.
The fall in interest rates and inflation and the fiscal boost will cushion the effectof, but not avoid, a recession in 2009.
Better savings and reforms on the commodity and labor markers will allow recoveryto be brought forward.

SpainWatch
1
1. Summary 2
2. The Spanish economy is nowentering the most intense phaseof its adjustment 4Box 1: “Quantification of the impact of liquidity tensions
on credit growth in Spain” 10
Box 2: “Current account balance: savings and investment” 15
3. Ten years of inflation differentialbetween Spain and the Eurozone 17Box 3: “Foreign competitiveness and innovation” 22
4. Three structural reforms for theSpanish labor market 24
5. Forecast summary 39
Index
Publication prepared by:
Rafael Doménech 34 91 537 36 72 [email protected]
Miguel Cardoso 34 91 374 39 61 [email protected]ónica Correa López 34 91 374 64 01 [email protected] Díez de los Ríos 34 91 374 36 57 [email protected] Ramón García 34 91 374 33 39 [email protected] J. González 34 91 374 99 24 [email protected] González-Panizo 34 91 538 63 50 [email protected] Jiménez 34 91 537 37 76 [email protected]Ángel Melguizo 34 91 537 67 65 [email protected] Pou 34 91 537 77 23 [email protected] Rodríguez-Vález 34 91 537 48 90 [email protected] Rubio 34 91 374 33 42 [email protected] Scatigna 34 91 374 01 82 [email protected]
We would like to thank Cristina Mingorance and Anabel Arador for their collaboration and comments
Closing date: 27 February 2009
SpainWatch
SpainWatch
2
1. Summary
In recent months, the world economy has seen a significantdeterioration in its economic scenario as a result of the financial crisisand the de-leveraging process in the private sector. In this context,although the policies of the central banks have managed to avoid worst-case scenarios such as the total collapse of the system, they havebeen insufficient. In spite of the decrease of the liquidity tensions inthe interbank markets, there is still a great deal of uncertainty as tothe solvency of certain entities within the international banking system.In future months, losses due to securitizations and the increase in thedefault rate will continue to hinder any significant reactivation offinancing on a worldwide scale. Added to this restriction are factorssuch as the continuing adjustment in the housing market in someeconomies or the sudden drop in worldwide trade, which causes adownward shift in the outlook for 2009. Although there is someuncertainty regarding the potential impact of the ambitious tax policymeasures enacted by the majority of governments in developedcountries, and the possibility that the central banks may use unorthodoxpolicies in order to reactivate credit, 2009 is still expected to be a yearof global recession.
This downturn in the outlook for the world economy has meant anintensification of the adjustment process of the Spanish economybeyond the forecasts of three months ago. In this context, thedeterioration observed in employment indicators during the last monthsof 2008 and the beginning of 2009 is especially worrying, with verynegative effects on consumer and business confidence. Thedestruction of jobs has not just continued in the construction sector,but has also spread to other sectors of the economy which have beenaffected by the fall in international trade and by the climate ofuncertainty. This general worsening of employment prospects, and itseffect on families’ disposable incomes has intensified the deleveragingprocess of the private sector, which has increased its savings out ofprecaution. The desire by households and corporations to reduce theirdebt levels has led to a significant drop in the demand for credit, leadingto negative growth for the first time in many years. All these downwardbiases will lead to a 2.8 per cent decline in the Spanish economy in2009.
However there are factors which will partially mitigate the effects ofthe economic crisis on the gross disposable income of Spanishhouseholds. These include a drop in the price of fuel, the fall in inflationand interest rates, and the boost to the economy provided by theexpansive monetary and tax policies.
In any case, the current adjustment process has highlighted the weak-nesses and imbalances in the Spanish economy as compared to otheradvanced economies; proof of this is that Spain is the country whichhas suffered the sharpest rise in unemployment over the last year.Regardless of whether some policies may mitigate the fall in demand,a large part of the effort should be dedicated to improving supplyconditions in order to eliminate the bane of unemployment and to laythe foundations for a new pattern of growth. This would enable Spainto resume as soon as possible the process of convergence of its percapita income with the most advanced European economies, withoutdepending, as in recent years, on a growing requirement for foreigncapital.
This review continues the analysis begun in the previous issue of SpainWatch regarding strategies to regain high potential growth rates in the
SpainWatch
3
future, and for a transition towards a more competitive and efficienteconomy, and devotes particular attention to two aspects of theSpanish economy which have an adverse effect on its productionpossibilities: the loss of competitiveness due to the inflation differentialwith the countries in the Economic and Monetary Union, and the highrate of unemployment.
The first article studies the main factors determining the high growthin prices in Spain compared to the rest of Europe. The size of thisdifferential and its persistence over time imply that there are factorsother than the mere convergence of the per capita income whichaccount for the Spanish economy’s constant loss of competitiveness.The results obtained indicate that a large part of the inflation differentialis a direct consequence of domestic factors, and is only partiallyexplained by the greater growth of domestic demand in Spaincompared to the other members of the EMU. The combination of highprofit margins and the disparity between wage increases and theevolution of productivity have contributed significantly to making Spain’sinflation rate higher than that of the EMU. It may therefore be necessaryto implement policies which improve competitiveness in goods andlabor markets in order to improve the competitiveness of the Spanisheconomy.
The second article analyses three specific initiatives to improve thefunctioning of the labor market. These initiatives must be seen as onepart of the solution to the problem of unemployment and of the dualityin the labor market, and be enacted together with other equallynecessary reforms. First, we analyze the discrepancy between contractconditions for permanent and temporary workers. This has created atwo-tiered labor market; it has steered growth towards low-productivitysectors, and has meant that the destruction of employment isconcentrated among temporary workers. In order to reduce this dualityin coming years, we need to realign current contract conditions sothat the average protection levels are maintained, but increasingprotection of temporary workers with a single indefinite contract fornew jobs in which dismissal compensation rises with years of seniority.In second place, we study the current collective bargaining structurein Spain. The evidence, compared with other countries, shows thatthe pattern of collective bargaining currently operating in Spain is notsufficiently flexible to cope with the disparate nature of the disturbancesaffecting the different productive sectors and businesses. This exertsa downward pull on the productivity of the economy as a whole,increases unemployment and leads to an inflationary trend. Finally,we analyze the possible effects on employment of substituting a partof the social security contributions by indirect taxation (known in somecountries as social VAT), in order to maintain the financing of thepensions system unchanged. The estimates submitted indicate that adecrease of 3.5 points in present social security contributions, offsetby a 2-point increase in VAT one year later, would enable 280 thousandjobs to be created.
SpainWatch
4
Chart 2.2.
Spain: IA-BBVA activity indicator(trend)
Source: BBVA ERD
-4
-3
-2
-1
0
1
2
Jan-
90Ja
n-91
Jan-
92Ja
n-93
Jan-
94Ja
n-95
Jan-
96Ja
n-97
Jan-
98Ja
n-99
Jan-
00Ja
n-01
Jan-
02Ja
n-03
Jan-
04Ja
n-05
Jan-
06Ja
n-07
Jan-
08Ja
n-09
Chart 2.1.
GDP growth(Quarter-on-quarter annualized rate)
Source: BBVA ERD based on INE and Eurostat
SpainEMU
-6
-4
-2
0
2
4
6
Mar
-01
Sep
-01
Mar
-02
Sep
-02
Mar
-03
Sep
-03
Mar
-04
Sep
-04
Mar
-05
Sep
-05
Mar
-06
Sep
-06
Mar
-07
Sep
-07
Mar
-08
Sep
-08
-6
-4
-2
0
2
4
6
Dec
-08
2. The Spanish economy is now enteringthe most intense phase of its adjustment
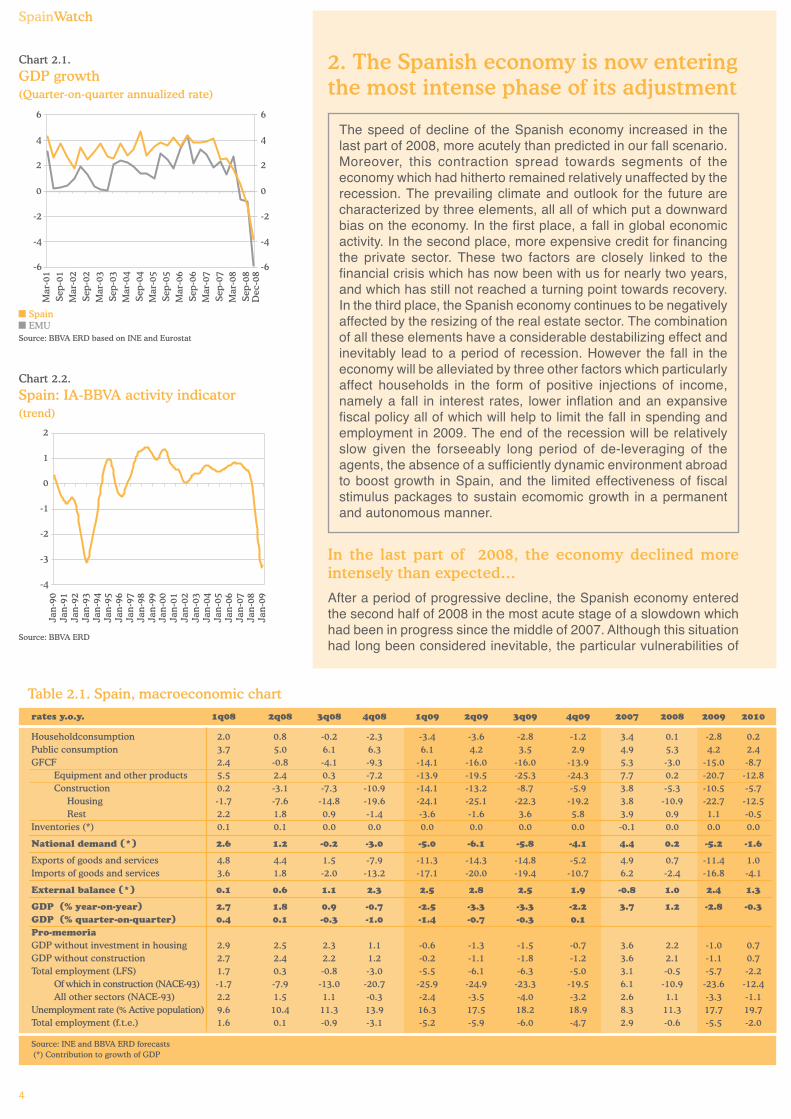
The speed of decline of the Spanish economy increased in thelast part of 2008, more acutely than predicted in our fall scenario.Moreover, this contraction spread towards segments of theeconomy which had hitherto remained relatively unaffected by therecession. The prevailing climate and outlook for the future arecharacterized by three elements, all all of which put a downwardbias on the economy. In the first place, a fall in global economicactivity. In the second place, more expensive credit for financingthe private sector. These two factors are closely linked to thefinancial crisis which has now been with us for nearly two years,and which has still not reached a turning point towards recovery.In the third place, the Spanish economy continues to be negativelyaffected by the resizing of the real estate sector. The combinationof all these elements have a considerable destabilizing effect andinevitably lead to a period of recession. However the fall in theeconomy will be alleviated by three other factors which particularlyaffect households in the form of positive injections of income,namely a fall in interest rates, lower inflation and an expansivefiscal policy all of which will help to limit the fall in spending andemployment in 2009. The end of the recession will be relativelyslow given the forseeably long period of de-leveraging of theagents, the absence of a sufficiently dynamic environment abroadto boost growth in Spain, and the limited effectiveness of fiscalstimulus packages to sustain ecomomic growth in a permanentand autonomous manner.
In the last part of 2008, the economy declined moreintensely than expected…
After a period of progressive decline, the Spanish economy enteredthe second half of 2008 in the most acute stage of a slowdown whichhad been in progress since the middle of 2007. Although this situationhad long been considered inevitable, the particular vulnerabilities of
Table 2.1. Spain, macroeconomic chartrates y.o.y. 1q08 2q08 3q08 4q08 1q09 2q09 3q09 4q09 2007 2008 2009 2010
Householdconsumption 2.0 0.8 -0.2 -2.3 -3.4 -3.6 -2.8 -1.2 3.4 0.1 -2.8 0.2Public consumption 3.7 5.0 6.1 6.3 6.1 4.2 3.5 2.9 4.9 5.3 4.2 2.4GFCF 2.4 -0.8 -4.1 -9.3 -14.1 -16.0 -16.0 -13.9 5.3 -3.0 -15.0 -8.7
Equipment and other products 5.5 2.4 0.3 -7.2 -13.9 -19.5 -25.3 -24.3 7.7 0.2 -20.7 -12.8Construction 0.2 -3.1 -7.3 -10.9 -14.1 -13.2 -8.7 -5.9 3.8 -5.3 -10.5 -5.7 Housing -1.7 -7.6 -14.8 -19.6 -24.1 -25.1 -22.3 -19.2 3.8 -10.9 -22.7 -12.5 Rest 2.2 1.8 0.9 -1.4 -3.6 -1.6 3.6 5.8 3.9 0.9 1.1 -0.5
Inventories (*) 0.1 0.1 0.0 0.0 0.0 0.0 0.0 0.0 -0.1 0.0 0.0 0.0
National demand (*) 2.6 1.2 -0.2 -3.0 -5.0 -6.1 -5.8 -4.1 4.4 0.2 -5.2 -1.6
Exports of goods and services 4.8 4.4 1.5 -7.9 -11.3 -14.3 -14.8 -5.2 4.9 0.7 -11.4 1.0Imports of goods and services 3.6 1.8 -2.0 -13.2 -17.1 -20.0 -19.4 -10.7 6.2 -2.4 -16.8 -4.1
External balance (*) 0.1 0.6 1.1 2.3 2.5 2.8 2.5 1.9 -0.8 1.0 2.4 1.3
GDP (% year-on-year) 2.7 1.8 0.9 -0.7 -2.5 -3.3 -3.3 -2.2 3.7 1.2 -2.8 -0.3GDP (% quarter-on-quarter) 0.4 0.1 -0.3 -1.0 -1.4 -0.7 -0.3 0.1Pro-memoriaGDP without investment in housing 2.9 2.5 2.3 1.1 -0.6 -1.3 -1.5 -0.7 3.6 2.2 -1.0 0.7GDP without construction 2.7 2.4 2.2 1.2 -0.2 -1.1 -1.8 -1.2 3.6 2.1 -1.1 0.7Total employment (LFS) 1.7 0.3 -0.8 -3.0 -5.5 -6.1 -6.3 -5.0 3.1 -0.5 -5.7 -2.2
Of which in construction (NACE-93) -1.7 -7.9 -13.0 -20.7 -25.9 -24.9 -23.3 -19.5 6.1 -10.9 -23.6 -12.4All other sectors (NACE-93) 2.2 1.5 1.1 -0.3 -2.4 -3.5 -4.0 -3.2 2.6 1.1 -3.3 -1.1
Unemployment rate (% Active population) 9.6 10.4 11.3 13.9 16.3 17.5 18.2 18.9 8.3 11.3 17.7 19.7Total employment (f.t.e.) 1.6 0.1 -0.9 -3.1 -5.2 -5.9 -6.0 -4.7 2.9 -0.6 -5.5 -2.0
Source: INE and BBVA ERD forecasts(*) Contribution to growth of GDP
SpainWatch
5
Chart 2.4.
Spanish exports and growth in the EMU(Year-on-year variation rate)
Source: INE and Eurostat
Spanish exports (Right)EMU GDP (Left)
-1.5-1.0
-0.50.00.5
1.01.5
2.02.53.0
3.54.0
-10-8
-6-4-2
02
468
1012
Mar
-01
Sep-
01M
ar-0
2Se
p-02
Mar
-03
Sep-
03M
ar-0
4Se
p-04
Mar
-05
Sep-
05M
ar-0
6Se
p-06
Mar
-07
Sep-
07M
ar-0
8Se
p-08
Dec
-08
Chart 2.5.
Indicator of 3-month interbankliquidity tensions:Differential (LIBOR 3M -Monetary Policy
Forecasts 3M)
Source: Bloomberg
EMUUSA
0
50
100
150
200
250
300
350
Jan
-07
Feb
-07
Mar
-07
Apr
-07
May
-07
Jun
-07
July
-07
Au
g-07
Sep-
07O
ct-0
7N
ov-0
7D
ec-0
7Ja
n-0
8F
eb-0
8M
ar-0
8A
pr-0
8M
ay-0
8Ju
n-0
8Ju
ly-0
8A
ug-
08Se
p-08
Oct
-08
Nov
-08
Dec
-08
Jan
-09
Feb
-09
0
50
100
150
200
250
300
350
Bear Stearns
LehmanBrothers
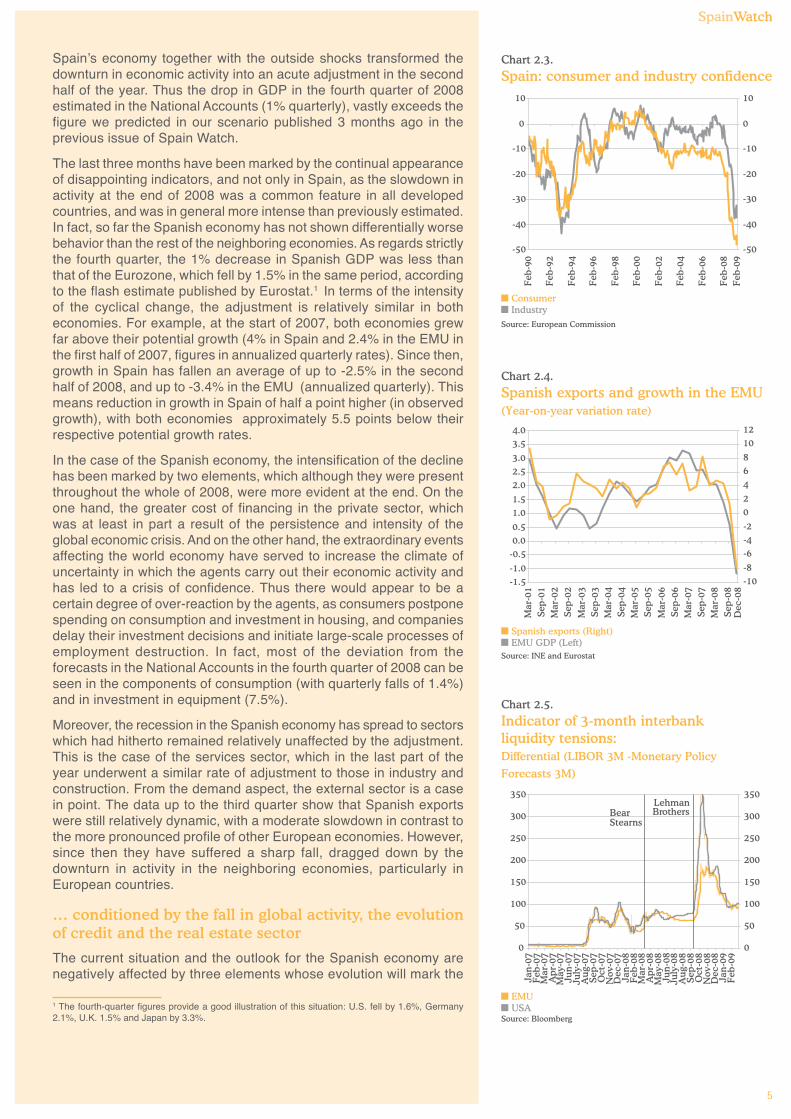
Chart 2.3.
Spain: consumer and industry confidence
Source: European Commission
ConsumerIndustry
-50
-40
-30
-20
-10
0
10
Feb
-90
Feb
-92
Feb
-94
Feb
-96
Feb
-98
Feb
-00
Feb
-02
Feb
-04
Feb
-06
Feb
-08
-50
-40
-30
-20
-10
0
10
Feb
-09
Spain’s economy together with the outside shocks transformed thedownturn in economic activity into an acute adjustment in the secondhalf of the year. Thus the drop in GDP in the fourth quarter of 2008estimated in the National Accounts (1% quarterly), vastly exceeds thefigure we predicted in our scenario published 3 months ago in theprevious issue of Spain Watch.
The last three months have been marked by the continual appearanceof disappointing indicators, and not only in Spain, as the slowdown inactivity at the end of 2008 was a common feature in all developedcountries, and was in general more intense than previously estimated.In fact, so far the Spanish economy has not shown differentially worsebehavior than the rest of the neighboring economies. As regards strictlythe fourth quarter, the 1% decrease in Spanish GDP was less thanthat of the Eurozone, which fell by 1.5% in the same period, accordingto the flash estimate published by Eurostat.1 In terms of the intensityof the cyclical change, the adjustment is relatively similar in botheconomies. For example, at the start of 2007, both economies grewfar above their potential growth (4% in Spain and 2.4% in the EMU inthe first half of 2007, figures in annualized quarterly rates). Since then,growth in Spain has fallen an average of up to -2.5% in the secondhalf of 2008, and up to -3.4% in the EMU (annualized quarterly). Thismeans reduction in growth in Spain of half a point higher (in observedgrowth), with both economies approximately 5.5 points below theirrespective potential growth rates.
In the case of the Spanish economy, the intensification of the declinehas been marked by two elements, which although they were presentthroughout the whole of 2008, were more evident at the end. On theone hand, the greater cost of financing in the private sector, whichwas at least in part a result of the persistence and intensity of theglobal economic crisis. And on the other hand, the extraordinary eventsaffecting the world economy have served to increase the climate ofuncertainty in which the agents carry out their economic activity andhas led to a crisis of confidence. Thus there would appear to be acertain degree of over-reaction by the agents, as consumers postponespending on consumption and investment in housing, and companiesdelay their investment decisions and initiate large-scale processes ofemployment destruction. In fact, most of the deviation from theforecasts in the National Accounts in the fourth quarter of 2008 can beseen in the components of consumption (with quarterly falls of 1.4%)and in investment in equipment (7.5%).
Moreover, the recession in the Spanish economy has spread to sectorswhich had hitherto remained relatively unaffected by the adjustment.This is the case of the services sector, which in the last part of theyear underwent a similar rate of adjustment to those in industry andconstruction. From the demand aspect, the external sector is a casein point. The data up to the third quarter show that Spanish exportswere still relatively dynamic, with a moderate slowdown in contrast tothe more pronounced profile of other European economies. However,since then they have suffered a sharp fall, dragged down by thedownturn in activity in the neighboring economies, particularly inEuropean countries.
… conditioned by the fall in global activity, the evolutionof credit and the real estate sector
The current situation and the outlook for the Spanish economy arenegatively affected by three elements whose evolution will mark the
1 The fourth-quarter figures provide a good illustration of this situation: U.S. fell by 1.6%, Germany2.1%, U.K. 1.5% and Japan by 3.3%.
SpainWatch
6
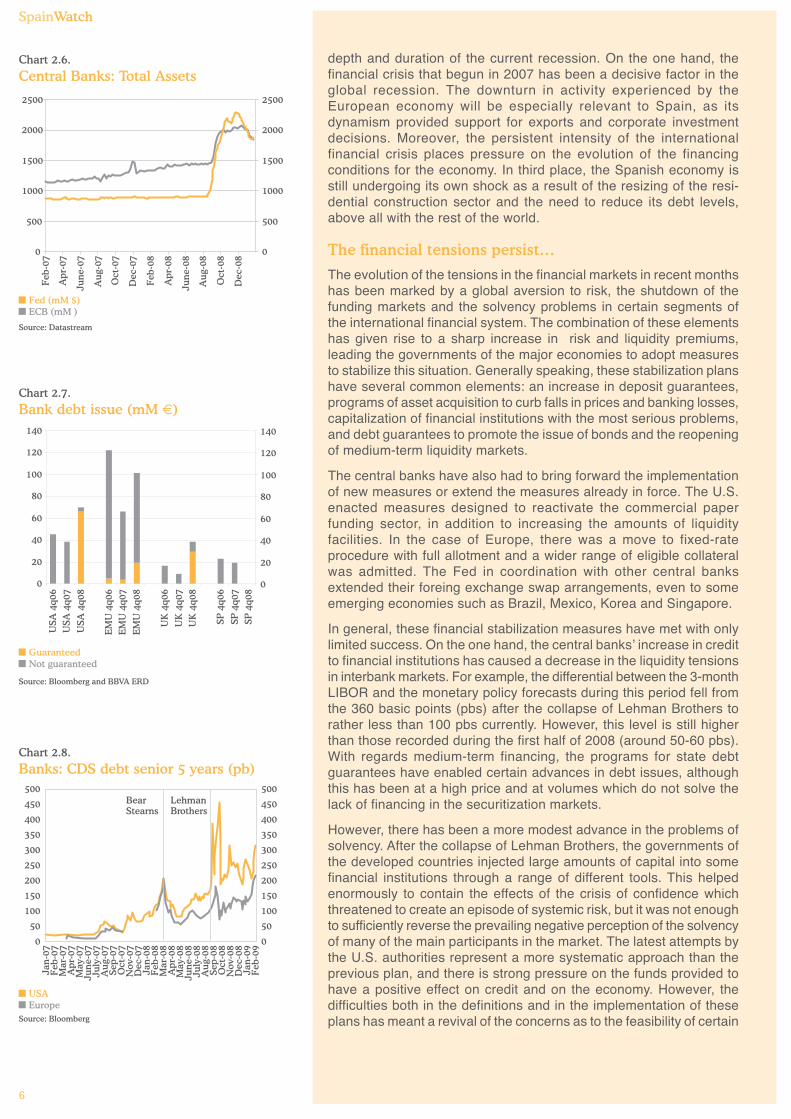
Chart 2.7.
Bank debt issue (mM €)
Source: Bloomberg and BBVA ERD
GuaranteedNot guaranteed
0
20
40
60
80
100
120
140
USA
4q0
6U
SA 4
q07
USA
4q0
8
EM
U 4
q06
EM
U 4
q07
EM
U 4
q08
UK
4q0
6
UK
4q0
7U
K 4
q08
SP 4
q06
SP 4
q07
SP 4
q08
0
20
40
60
80
100
120
140
Chart 2.8.
Banks: CDS debt senior 5 years (pb)
Source: Bloomberg
USAEurope
500
450
400
350
300
250
200
150
100
50
0
500
450
400
350
300
250
200
150
100
50
0
Jan
-07
Feb
-07
Mar
-07
Ap
r-07
May
-07
Jun
e-07
July
-07
Au
g-07
Sep
-07
Oct
-07
Nov
-07
Dec
-07
Jan
-08
Feb
-08
Mar
-08
Ap
r-08
May
-08
Jun
e-08
July
-08
Au
g-08
Sep
-08
Oct
-08
Nov
-08
Dec
-08
Jan
-09
Feb
-09
Bear Stearns
LehmanBrothers
Chart 2.6.
Central Banks: Total Assets
Source: Datastream
Fed (mM $)ECB (mM )
0
500
1000
1500
2000
2500
Feb
-07
Apr
-07
June
-07
Aug
-07
Oct
-07
Dec
-07
Feb
-08
Apr
-08
June
-08
Aug
-08
Oct
-08
Dec
-08
0
500
1000
1500
2000
2500
depth and duration of the current recession. On the one hand, thefinancial crisis that begun in 2007 has been a decisive factor in theglobal recession. The downturn in activity experienced by theEuropean economy will be especially relevant to Spain, as itsdynamism provided support for exports and corporate investmentdecisions. Moreover, the persistent intensity of the internationalfinancial crisis places pressure on the evolution of the financingconditions for the economy. In third place, the Spanish economy isstill undergoing its own shock as a result of the resizing of the resi-dential construction sector and the need to reduce its debt levels,above all with the rest of the world.
The financial tensions persist…
The evolution of the tensions in the financial markets in recent monthshas been marked by a global aversion to risk, the shutdown of thefunding markets and the solvency problems in certain segments ofthe international financial system. The combination of these elementshas given rise to a sharp increase in risk and liquidity premiums,leading the governments of the major economies to adopt measuresto stabilize this situation. Generally speaking, these stabilization planshave several common elements: an increase in deposit guarantees,programs of asset acquisition to curb falls in prices and banking losses,capitalization of financial institutions with the most serious problems,and debt guarantees to promote the issue of bonds and the reopeningof medium-term liquidity markets.
The central banks have also had to bring forward the implementationof new measures or extend the measures already in force. The U.S.enacted measures designed to reactivate the commercial paperfunding sector, in addition to increasing the amounts of liquidityfacilities. In the case of Europe, there was a move to fixed-rateprocedure with full allotment and a wider range of eligible collateralwas admitted. The Fed in coordination with other central banksextended their foreing exchange swap arrangements, even to someemerging economies such as Brazil, Mexico, Korea and Singapore.
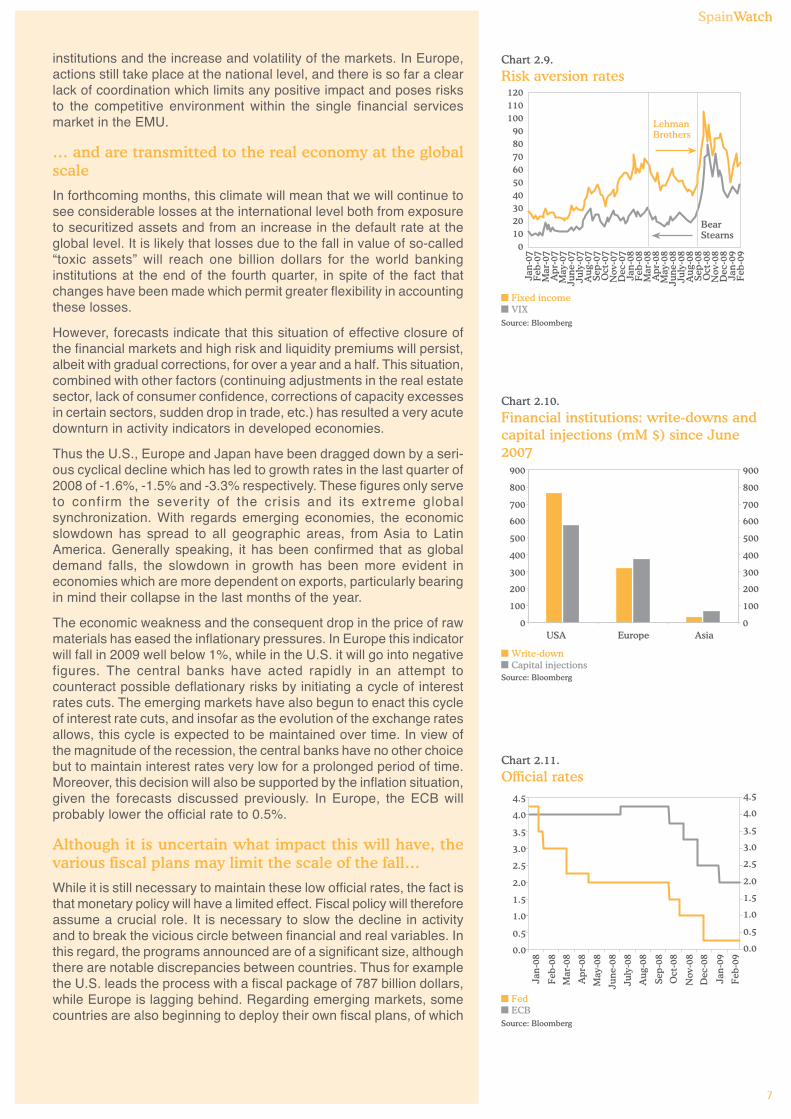
In general, these financial stabilization measures have met with onlylimited success. On the one hand, the central banks’ increase in creditto financial institutions has caused a decrease in the liquidity tensionsin interbank markets. For example, the differential between the 3-monthLIBOR and the monetary policy forecasts during this period fell fromthe 360 basic points (pbs) after the collapse of Lehman Brothers torather less than 100 pbs currently. However, this level is still higherthan those recorded during the first half of 2008 (around 50-60 pbs).With regards medium-term financing, the programs for state debtguarantees have enabled certain advances in debt issues, althoughthis has been at a high price and at volumes which do not solve thelack of financing in the securitization markets.
However, there has been a more modest advance in the problems ofsolvency. After the collapse of Lehman Brothers, the governments ofthe developed countries injected large amounts of capital into somefinancial institutions through a range of different tools. This helpedenormously to contain the effects of the crisis of confidence whichthreatened to create an episode of systemic risk, but it was not enoughto sufficiently reverse the prevailing negative perception of the solvencyof many of the main participants in the market. The latest attempts bythe U.S. authorities represent a more systematic approach than theprevious plan, and there is strong pressure on the funds provided tohave a positive effect on credit and on the economy. However, thedifficulties both in the definitions and in the implementation of theseplans has meant a revival of the concerns as to the feasibility of certain
SpainWatch
7
Chart 2.10.
Financial institutions: write-downs andcapital injections (mM $) since June2007
Source: Bloomberg
Write-downCapital injections
0
100
200
300
400
500
600
700
800
900
USA Europe Asia0
100
200
300
400
500
600
700
800
900
Chart 2.11.
Official rates
Source: Bloomberg
FedECB
0.0
0.5
1.0
1.5
2.0
2.5
3.0
3.5
4.0
4.5
0.0
0.5
1.0
1.5
2.0
2.5
3.0
3.5
4.0
4.5
Jan-
08
Feb
-08
Mar
-08
Apr
-08
May
-08
June
-08
July
-08
Aug
-08
Sep-
08
Oct
-08
Nov
-08
Dec
-08
Jan-
09
Feb
-09
Chart 2.9.
Risk aversion rates
Source: Bloomberg
Fixed incomeVIX
Jan-
07F
eb-0
7M
ar-0
7A
pr-0
7M
ay-0
7Ju
ne-0
7Ju
ly-0
7A
ug-0
7Se
p-07
Oct
-07
Nov
-07
Dec
-07
Jan-
08F
eb-0
8M
ar-0
8A
pr-0
8M
ay-0
8Ju
ne-0
8Ju
ly-0
8A
ug-0
8Se
p-08
Oct
-08
Nov
-08
Dec
-08
Jan-
09F
eb-0
9
120110100
908070605040302010
0
Bear Stearns
Lehman Brothers
institutions and the increase and volatility of the markets. In Europe,actions still take place at the national level, and there is so far a clearlack of coordination which limits any positive impact and poses risksto the competitive environment within the single financial servicesmarket in the EMU.
… and are transmitted to the real economy at the globalscale
In forthcoming months, this climate will mean that we will continue tosee considerable losses at the international level both from exposureto securitized assets and from an increase in the default rate at theglobal level. It is likely that losses due to the fall in value of so-called“toxic assets” will reach one billion dollars for the world bankinginstitutions at the end of the fourth quarter, in spite of the fact thatchanges have been made which permit greater flexibility in accountingthese losses.
However, forecasts indicate that this situation of effective closure ofthe financial markets and high risk and liquidity premiums will persist,albeit with gradual corrections, for over a year and a half. This situation,combined with other factors (continuing adjustments in the real estatesector, lack of consumer confidence, corrections of capacity excessesin certain sectors, sudden drop in trade, etc.) has resulted a very acutedownturn in activity indicators in developed economies.
Thus the U.S., Europe and Japan have been dragged down by a seri-ous cyclical decline which has led to growth rates in the last quarter of2008 of -1.6%, -1.5% and -3.3% respectively. These figures only serveto confirm the severity of the crisis and its extreme globalsynchronization. With regards emerging economies, the economicslowdown has spread to all geographic areas, from Asia to LatinAmerica. Generally speaking, it has been confirmed that as globaldemand falls, the slowdown in growth has been more evident ineconomies which are more dependent on exports, particularly bearingin mind their collapse in the last months of the year.
The economic weakness and the consequent drop in the price of rawmaterials has eased the inflationary pressures. In Europe this indicatorwill fall in 2009 well below 1%, while in the U.S. it will go into negativefigures. The central banks have acted rapidly in an attempt tocounteract possible deflationary risks by initiating a cycle of interestrates cuts. The emerging markets have also begun to enact this cycleof interest rate cuts, and insofar as the evolution of the exchange ratesallows, this cycle is expected to be maintained over time. In view ofthe magnitude of the recession, the central banks have no other choicebut to maintain interest rates very low for a prolonged period of time.Moreover, this decision will also be supported by the inflation situation,given the forecasts discussed previously. In Europe, the ECB willprobably lower the official rate to 0.5%.
Although it is uncertain what impact this will have, thevarious fiscal plans may limit the scale of the fall…
While it is still necessary to maintain these low official rates, the fact isthat monetary policy will have a limited effect. Fiscal policy will thereforeassume a crucial role. It is necessary to slow the decline in activityand to break the vicious circle between financial and real variables. Inthis regard, the programs announced are of a significant size, althoughthere are notable discrepancies between countries. Thus for examplethe U.S. leads the process with a fiscal package of 787 billion dollars,while Europe is lagging behind. Regarding emerging markets, somecountries are also beginning to deploy their own fiscal plans, of which
SpainWatch
8
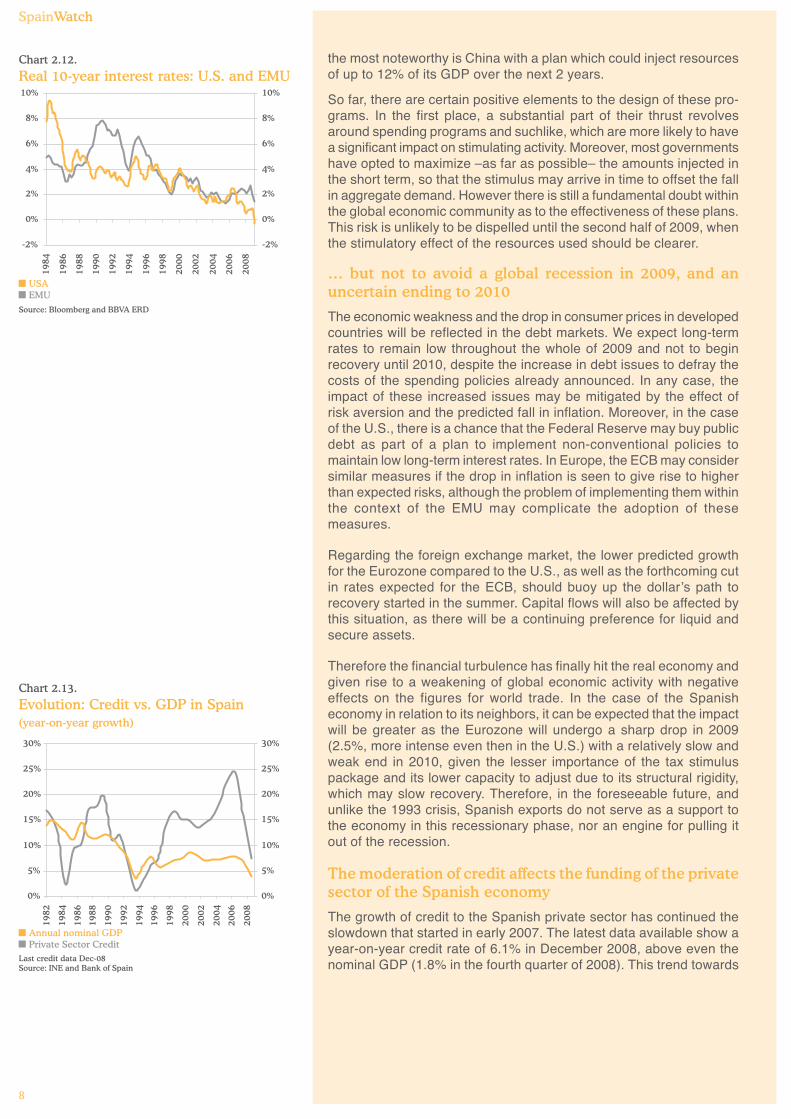
Chart 2.13.
Evolution: Credit vs. GDP in Spain(year-on-year growth)
Last credit data Dec-08Source: INE and Bank of Spain
Annual nominal GDPPrivate Sector Credit
0%
5%
10%
15%
20%
25%
30%
1982
1984
1986
1988
1990
1992
1994
1996
1998
2000
2002
2004
2006
2008
0%
5%
10%
15%
20%
25%
30%
Chart 2.12.
Real 10-year interest rates: U.S. and EMU
Source: Bloomberg and BBVA ERD
USAEMU
-2%
0%
2%
4%
6%
8%
10%
1984
1986
1988
1990
1992
1994
1996
1998
2000
2002
2004
2006
2008
-2%
0%
2%
4%
6%
8%
10%
the most noteworthy is China with a plan which could inject resourcesof up to 12% of its GDP over the next 2 years.
So far, there are certain positive elements to the design of these pro-grams. In the first place, a substantial part of their thrust revolvesaround spending programs and suchlike, which are more likely to havea significant impact on stimulating activity. Moreover, most governmentshave opted to maximize –as far as possible– the amounts injected inthe short term, so that the stimulus may arrive in time to offset the fallin aggregate demand. However there is still a fundamental doubt withinthe global economic community as to the effectiveness of these plans.This risk is unlikely to be dispelled until the second half of 2009, whenthe stimulatory effect of the resources used should be clearer.
… but not to avoid a global recession in 2009, and anuncertain ending to 2010
The economic weakness and the drop in consumer prices in developedcountries will be reflected in the debt markets. We expect long-termrates to remain low throughout the whole of 2009 and not to beginrecovery until 2010, despite the increase in debt issues to defray thecosts of the spending policies already announced. In any case, theimpact of these increased issues may be mitigated by the effect ofrisk aversion and the predicted fall in inflation. Moreover, in the caseof the U.S., there is a chance that the Federal Reserve may buy publicdebt as part of a plan to implement non-conventional policies tomaintain low long-term interest rates. In Europe, the ECB may considersimilar measures if the drop in inflation is seen to give rise to higherthan expected risks, although the problem of implementing them withinthe context of the EMU may complicate the adoption of thesemeasures.
Regarding the foreign exchange market, the lower predicted growthfor the Eurozone compared to the U.S., as well as the forthcoming cutin rates expected for the ECB, should buoy up the dollar’s path torecovery started in the summer. Capital flows will also be affected bythis situation, as there will be a continuing preference for liquid andsecure assets.
Therefore the financial turbulence has finally hit the real economy andgiven rise to a weakening of global economic activity with negativeeffects on the figures for world trade. In the case of the Spanisheconomy in relation to its neighbors, it can be expected that the impactwill be greater as the Eurozone will undergo a sharp drop in 2009(2.5%, more intense even then in the U.S.) with a relatively slow andweak end in 2010, given the lesser importance of the tax stimuluspackage and its lower capacity to adjust due to its structural rigidity,which may slow recovery. Therefore, in the foreseeable future, andunlike the 1993 crisis, Spanish exports do not serve as a support tothe economy in this recessionary phase, nor an engine for pulling itout of the recession.
The moderation of credit affects the funding of the privatesector of the Spanish economy
The growth of credit to the Spanish private sector has continued theslowdown that started in early 2007. The latest data available show ayear-on-year credit rate of 6.1% in December 2008, above even thenominal GDP (1.8% in the fourth quarter of 2008). This trend towards
SpainWatch
9
Chart 2.14.
Private sector credit /GDP
*Last data Sep-08, Dec-08 estimatedSource: BBVA ERD
20002005
0%
50%
100%
150%
200%
250%
Ger
man
y
Spai
n
Fra
nce
Net
her
lan
ds
Irel
and
Ital
y
Por
tuga
l
Eu
rozo
ne
UK
USA
*
EurozoneDec-08
2008
Chart 2.15.
Spain: private sector credit(% GDP)
Source: ECB and BBVA ERD
0%
20%
40%
60%
80%
100%
120%
140%
160%
180%
2000
2001
2002
2003
2004
2005
2006
2007
2008
2009
2010
2011
2012
Eurozone Dec-08
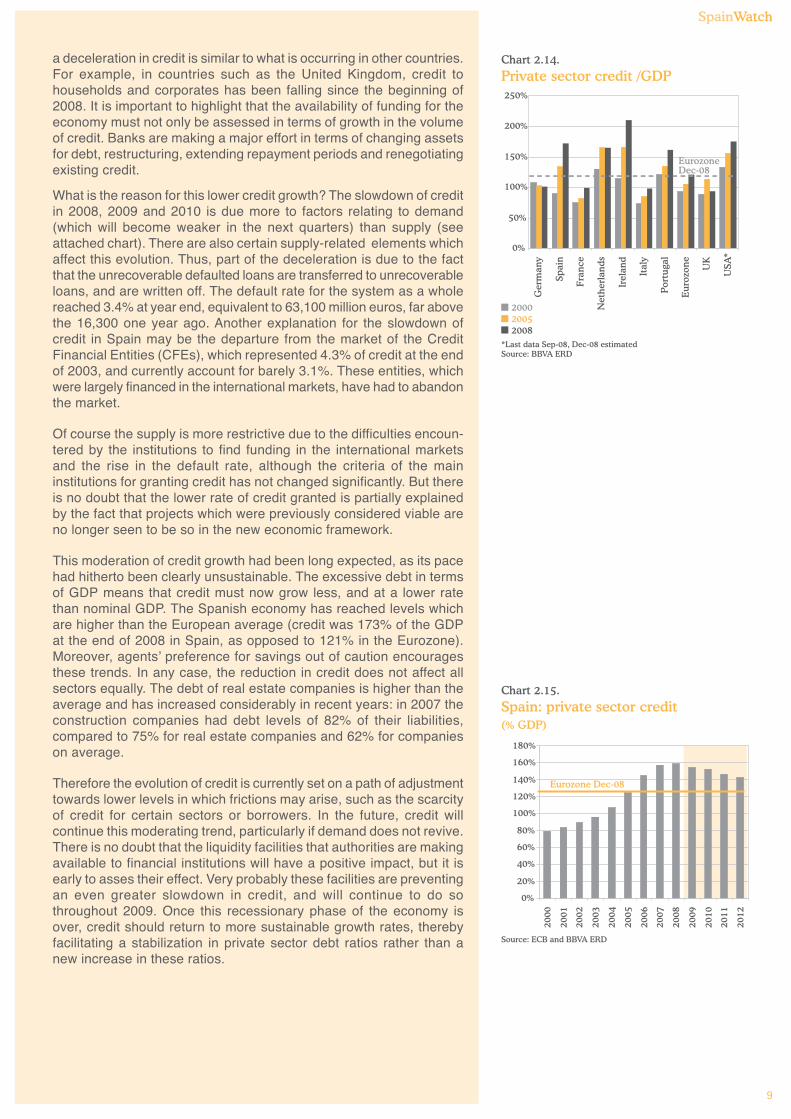
a deceleration in credit is similar to what is occurring in other countries.For example, in countries such as the United Kingdom, credit tohouseholds and corporates has been falling since the beginning of2008. It is important to highlight that the availability of funding for theeconomy must not only be assessed in terms of growth in the volumeof credit. Banks are making a major effort in terms of changing assetsfor debt, restructuring, extending repayment periods and renegotiatingexisting credit.
What is the reason for this lower credit growth? The slowdown of creditin 2008, 2009 and 2010 is due more to factors relating to demand(which will become weaker in the next quarters) than supply (seeattached chart). There are also certain supply-related elements whichaffect this evolution. Thus, part of the deceleration is due to the factthat the unrecoverable defaulted loans are transferred to unrecoverableloans, and are written off. The default rate for the system as a wholereached 3.4% at year end, equivalent to 63,100 million euros, far abovethe 16,300 one year ago. Another explanation for the slowdown ofcredit in Spain may be the departure from the market of the CreditFinancial Entities (CFEs), which represented 4.3% of credit at the endof 2003, and currently account for barely 3.1%. These entities, whichwere largely financed in the international markets, have had to abandonthe market.
Of course the supply is more restrictive due to the difficulties encoun-tered by the institutions to find funding in the international marketsand the rise in the default rate, although the criteria of the maininstitutions for granting credit has not changed significantly. But thereis no doubt that the lower rate of credit granted is partially explainedby the fact that projects which were previously considered viable areno longer seen to be so in the new economic framework.
This moderation of credit growth had been long expected, as its pacehad hitherto been clearly unsustainable. The excessive debt in termsof GDP means that credit must now grow less, and at a lower ratethan nominal GDP. The Spanish economy has reached levels whichare higher than the European average (credit was 173% of the GDPat the end of 2008 in Spain, as opposed to 121% in the Eurozone).Moreover, agents’ preference for savings out of caution encouragesthese trends. In any case, the reduction in credit does not affect allsectors equally. The debt of real estate companies is higher than theaverage and has increased considerably in recent years: in 2007 theconstruction companies had debt levels of 82% of their liabilities,compared to 75% for real estate companies and 62% for companieson average.
Therefore the evolution of credit is currently set on a path of adjustmenttowards lower levels in which frictions may arise, such as the scarcityof credit for certain sectors or borrowers. In the future, credit willcontinue this moderating trend, particularly if demand does not revive.There is no doubt that the liquidity facilities that authorities are makingavailable to financial institutions will have a positive impact, but it isearly to asses their effect. Very probably these facilities are preventingan even greater slowdown in credit, and will continue to do sothroughout 2009. Once this recessionary phase of the economy isover, credit should return to more sustainable growth rates, therebyfacilitating a stabilization in private sector debt ratios rather than anew increase in these ratios.
SpainWatch
10
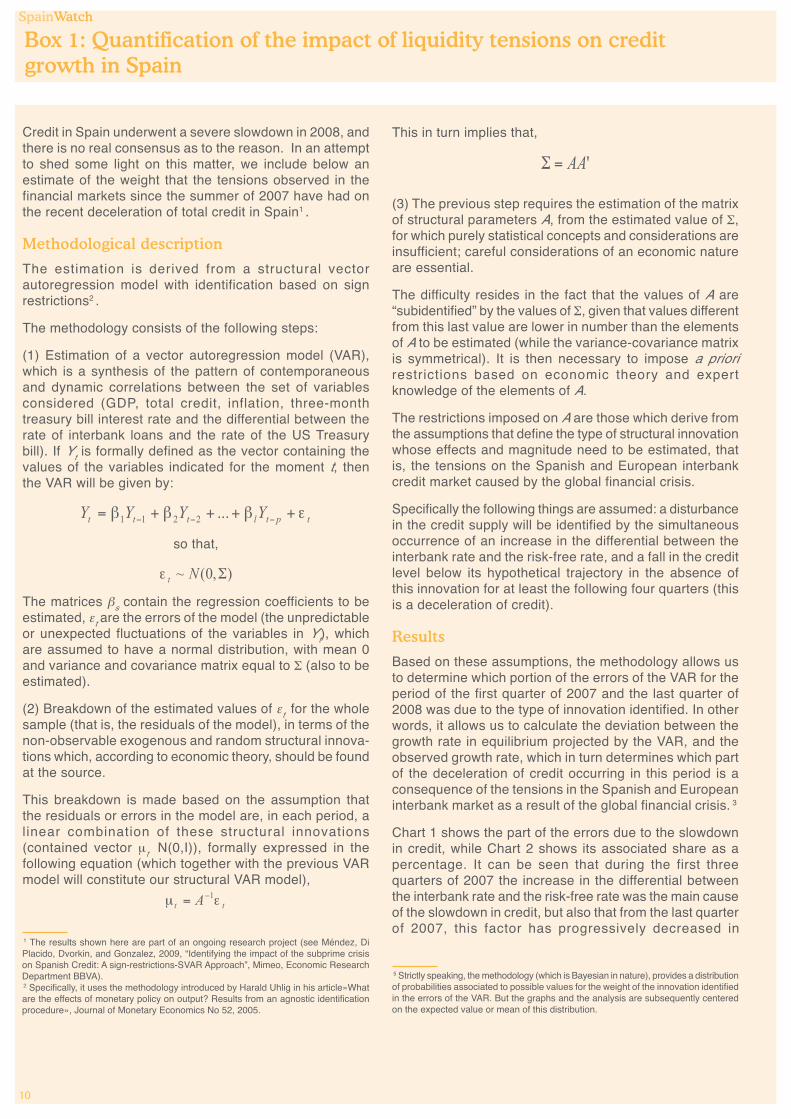
Credit in Spain underwent a severe slowdown in 2008, andthere is no real consensus as to the reason. In an attemptto shed some light on this matter, we include below anestimate of the weight that the tensions observed in thefinancial markets since the summer of 2007 have had onthe recent deceleration of total credit in Spain1 .
Methodological description
The estimation is derived from a structural vectorautoregression model with identification based on signrestrictions2 .
The methodology consists of the following steps:
(1) Estimation of a vector autoregression model (VAR),which is a synthesis of the pattern of contemporaneousand dynamic correlations between the set of variablesconsidered (GDP, total credit, inflation, three-monthtreasury bill interest rate and the differential between therate of interbank loans and the rate of the US Treasurybill). If Yt is formally defined as the vector containing thevalues of the variables indicated for the moment t, thenthe VAR will be given by:
so that,
The matrices βs contain the regression coefficients to beestimated, εt are the errors of the model (the unpredictableor unexpected fluctuations of the variables in Yt), whichare assumed to have a normal distribution, with mean 0and variance and covariance matrix equal to Σ (also to beestimated).
(2) Breakdown of the estimated values of εt for the wholesample (that is, the residuals of the model), in terms of thenon-observable exogenous and random structural innova-tions which, according to economic theory, should be foundat the source.
This breakdown is made based on the assumption thatthe residuals or errors in the model are, in each period, alinear combination of these structural innovations(contained vector μt N(0,I)), formally expressed in thefollowing equation (which together with the previous VARmodel will constitute our structural VAR model),
Box 1: Quantification of the impact of liquidity tensions on creditgrowth in Spain
1 The results shown here are part of an ongoing research project (see Méndez, DiPlacido, Dvorkin, and Gonzalez, 2009, “Identifying the impact of the subprime crisison Spanish Credit: A sign-restrictions-SVAR Approach”, Mimeo, Economic ResearchDepartment BBVA).2 Specifically, it uses the methodology introduced by Harald Uhlig in his article»Whatare the effects of monetary policy on output? Results from an agnostic identificationprocedure», Journal of Monetary Economics No 52, 2005.
5 Strictly speaking, the methodology (which is Bayesian in nature), provides a distributionof probabilities associated to possible values for the weight of the innovation identifiedin the errors of the VAR. But the graphs and the analysis are subsequently centeredon the expected value or mean of this distribution.
SpainWatch
This in turn implies that,
(3) The previous step requires the estimation of the matrixof structural parameters A, from the estimated value of Σ,for which purely statistical concepts and considerations areinsufficient; careful considerations of an economic natureare essential.
The difficulty resides in the fact that the values of A are“subidentified” by the values of Σ, given that values differentfrom this last value are lower in number than the elementsof A to be estimated (while the variance-covariance matrixis symmetrical). It is then necessary to impose a priorirestrictions based on economic theory and expertknowledge of the elements of A.
The restrictions imposed on A are those which derive fromthe assumptions that define the type of structural innovationwhose effects and magnitude need to be estimated, thatis, the tensions on the Spanish and European interbankcredit market caused by the global financial crisis.
Specifically the following things are assumed: a disturbancein the credit supply will be identified by the simultaneousoccurrence of an increase in the differential between theinterbank rate and the risk-free rate, and a fall in the creditlevel below its hypothetical trajectory in the absence ofthis innovation for at least the following four quarters (thisis a deceleration of credit).
Results
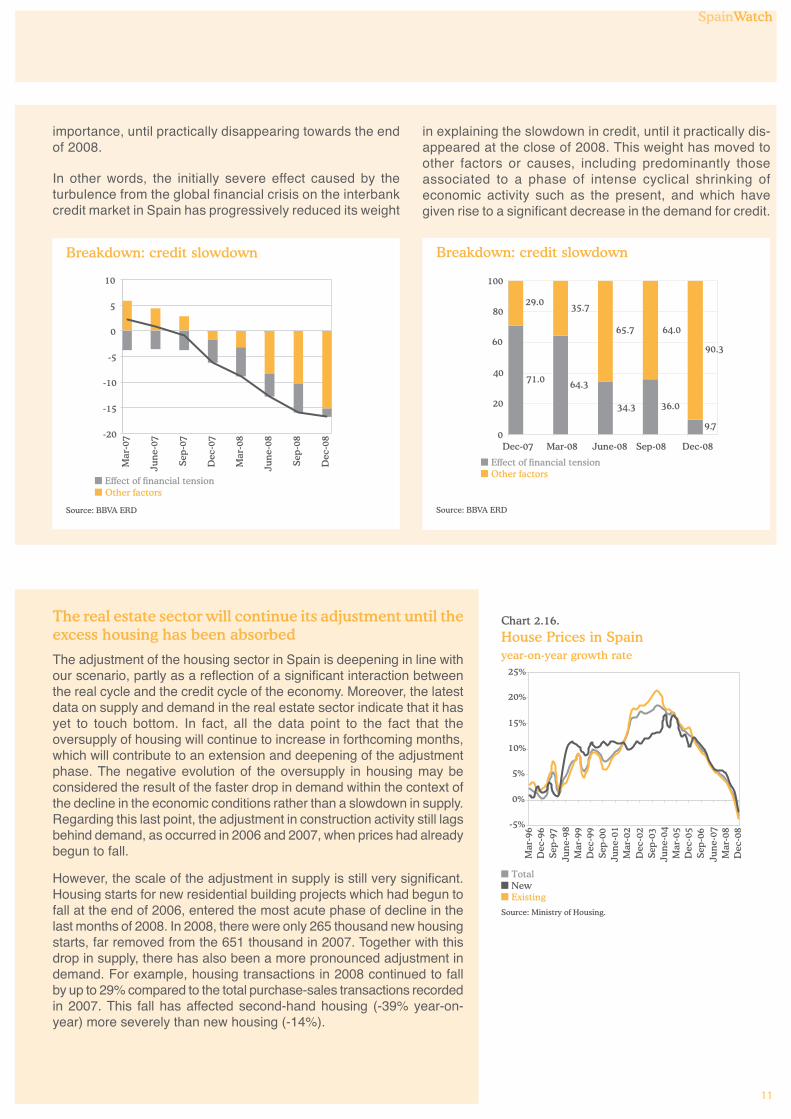
Based on these assumptions, the methodology allows usto determine which portion of the errors of the VAR for theperiod of the first quarter of 2007 and the last quarter of2008 was due to the type of innovation identified. In otherwords, it allows us to calculate the deviation between thegrowth rate in equilibrium projected by the VAR, and theobserved growth rate, which in turn determines which partof the deceleration of credit occurring in this period is aconsequence of the tensions in the Spanish and Europeaninterbank market as a result of the global financial crisis. 3
Chart 1 shows the part of the errors due to the slowdownin credit, while Chart 2 shows its associated share as apercentage. It can be seen that during the first threequarters of 2007 the increase in the differential betweenthe interbank rate and the risk-free rate was the main causeof the slowdown in credit, but also that from the last quarterof 2007, this factor has progressively decreased in
10
SpainWatch
11
Breakdown: credit slowdown
Source: BBVA ERD
Breakdown: credit slowdown
Source: BBVA ERD
Chart 2.16.
House Prices in Spainyear-on-year growth rate
Source: Ministry of Housing.
TotalNewExisting
-5%
0%
5%
10%
15%
20%
25%
Mar
-96
Dec
-96
Sep-
97Ju
ne-
98M
ar-9
9D
ec-9
9Se
p-00
Jun
e-01
Mar
-02
Dec
-02
Sep-
03Ju
ne-
04M
ar-0
5D
ec-0
5Se
p-06
Jun
e-07
Mar
-08
Dec
-08
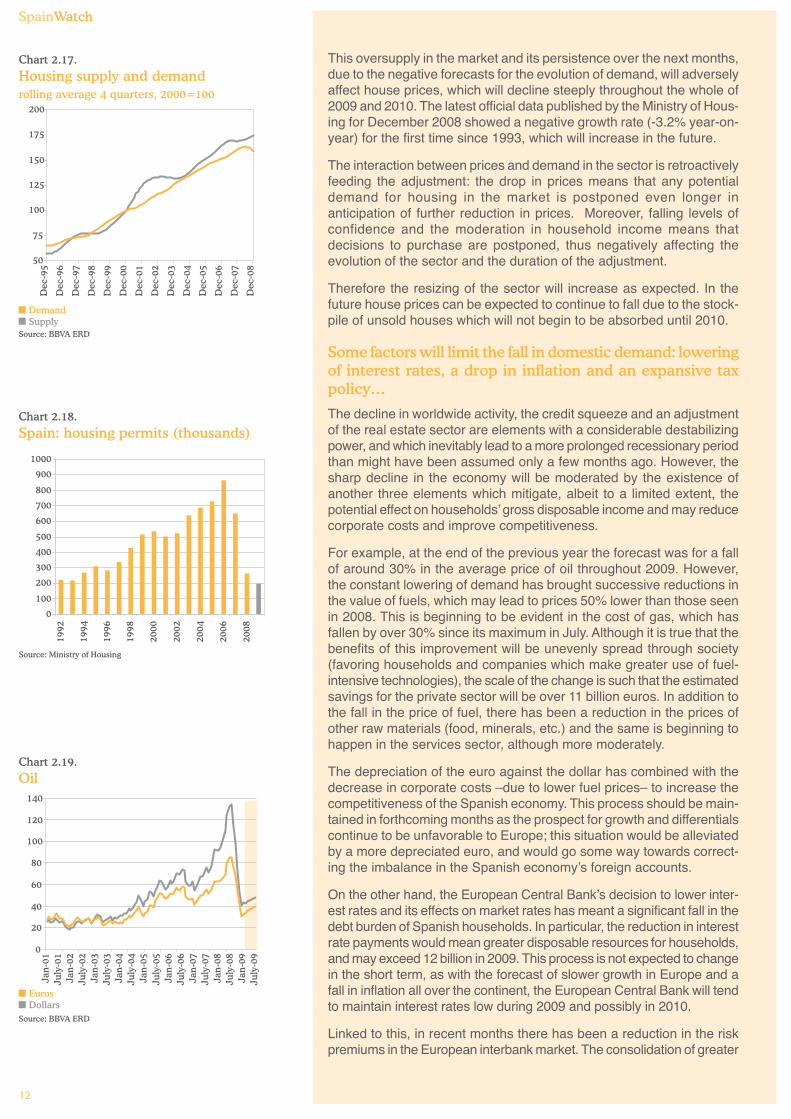
The real estate sector will continue its adjustment until theexcess housing has been absorbed
The adjustment of the housing sector in Spain is deepening in line withour scenario, partly as a reflection of a significant interaction betweenthe real cycle and the credit cycle of the economy. Moreover, the latestdata on supply and demand in the real estate sector indicate that it hasyet to touch bottom. In fact, all the data point to the fact that theoversupply of housing will continue to increase in forthcoming months,which will contribute to an extension and deepening of the adjustmentphase. The negative evolution of the oversupply in housing may beconsidered the result of the faster drop in demand within the context ofthe decline in the economic conditions rather than a slowdown in supply.Regarding this last point, the adjustment in construction activity still lagsbehind demand, as occurred in 2006 and 2007, when prices had alreadybegun to fall.
However, the scale of the adjustment in supply is still very significant.Housing starts for new residential building projects which had begun tofall at the end of 2006, entered the most acute phase of decline in thelast months of 2008. In 2008, there were only 265 thousand new housingstarts, far removed from the 651 thousand in 2007. Together with thisdrop in supply, there has also been a more pronounced adjustment indemand. For example, housing transactions in 2008 continued to fallby up to 29% compared to the total purchase-sales transactions recordedin 2007. This fall has affected second-hand housing (-39% year-on-year) more severely than new housing (-14%).
Effect of financial tensionOther factors
-20
-15
-10
-5
0
5
10
Mar
-07
Jun
e-07
Sep
-07
Dec
-07
Mar
-08
Jun
e-08
Sep
-08
Dec
-08
Effect of financial tensionOther factors
9.7
36.034.3
64.371.0
29.0 35.7
65.7 64.0
90.3
0
20
40
60
80
100
Dec-07 Mar-08 June-08 Sep-08 Dec-08
importance, until practically disappearing towards the endof 2008.
In other words, the initially severe effect caused by theturbulence from the global financial crisis on the interbankcredit market in Spain has progressively reduced its weight
in explaining the slowdown in credit, until it practically dis-appeared at the close of 2008. This weight has moved toother factors or causes, including predominantly thoseassociated to a phase of intense cyclical shrinking ofeconomic activity such as the present, and which havegiven rise to a significant decrease in the demand for credit.
SpainWatch
SpainWatch
12
Chart 2.19.
Oil
Source: BBVA ERD
EurosDollars
0
20
40
60
80
100
120
140
Jan-
01Ju
ly-0
1Ja
n-02
July
-02
Jan-
03Ju
ly-0
3Ja
n-04
July
-04
Jan-
05Ju
ly-0
5Ja
n-06
July
-06
Jan-
07Ju
ly-0
7Ja
n-08
July
-08
Jan-
09Ju
ly-0
9
Chart 2.18.
Spain: housing permits (thousands)
Source: Ministry of Housing
0
100
200
300
400
500
600
700
800
900
1000
1992
1994
1996
1998
2000
2002
2004
2006
2008
This oversupply in the market and its persistence over the next months,due to the negative forecasts for the evolution of demand, will adverselyaffect house prices, which will decline steeply throughout the whole of2009 and 2010. The latest official data published by the Ministry of Hous-ing for December 2008 showed a negative growth rate (-3.2% year-on-year) for the first time since 1993, which will increase in the future.
The interaction between prices and demand in the sector is retroactivelyfeeding the adjustment: the drop in prices means that any potentialdemand for housing in the market is postponed even longer inanticipation of further reduction in prices. Moreover, falling levels ofconfidence and the moderation in household income means thatdecisions to purchase are postponed, thus negatively affecting theevolution of the sector and the duration of the adjustment.
Therefore the resizing of the sector will increase as expected. In thefuture house prices can be expected to continue to fall due to the stock-pile of unsold houses which will not begin to be absorbed until 2010.
Some factors will limit the fall in domestic demand: loweringof interest rates, a drop in inflation and an expansive taxpolicy…
The decline in worldwide activity, the credit squeeze and an adjustmentof the real estate sector are elements with a considerable destabilizingpower, and which inevitably lead to a more prolonged recessionary periodthan might have been assumed only a few months ago. However, thesharp decline in the economy will be moderated by the existence ofanother three elements which mitigate, albeit to a limited extent, thepotential effect on households’ gross disposable income and may reducecorporate costs and improve competitiveness.
For example, at the end of the previous year the forecast was for a fallof around 30% in the average price of oil throughout 2009. However,the constant lowering of demand has brought successive reductions inthe value of fuels, which may lead to prices 50% lower than those seenin 2008. This is beginning to be evident in the cost of gas, which hasfallen by over 30% since its maximum in July. Although it is true that thebenefits of this improvement will be unevenly spread through society(favoring households and companies which make greater use of fuel-intensive technologies), the scale of the change is such that the estimatedsavings for the private sector will be over 11 billion euros. In addition tothe fall in the price of fuel, there has been a reduction in the prices ofother raw materials (food, minerals, etc.) and the same is beginning tohappen in the services sector, although more moderately.
The depreciation of the euro against the dollar has combined with thedecrease in corporate costs –due to lower fuel prices– to increase thecompetitiveness of the Spanish economy. This process should be main-tained in forthcoming months as the prospect for growth and differentialscontinue to be unfavorable to Europe; this situation would be alleviatedby a more depreciated euro, and would go some way towards correct-ing the imbalance in the Spanish economy’s foreign accounts.
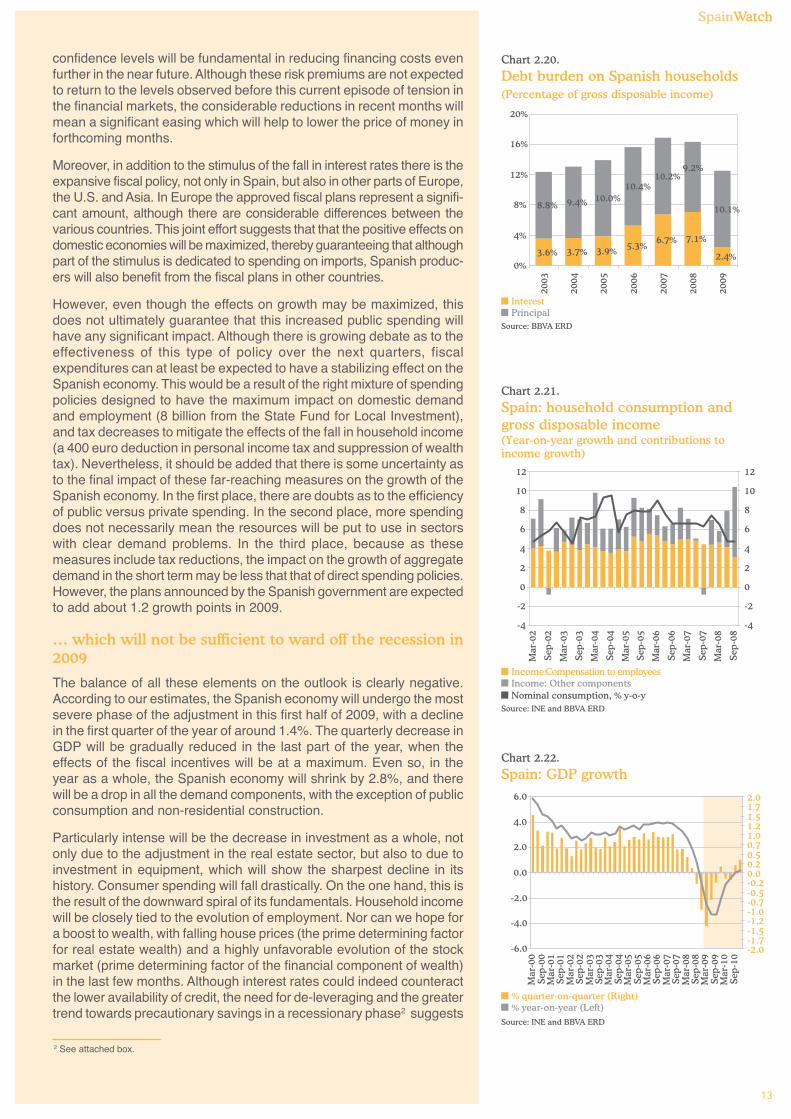
On the other hand, the European Central Bank’s decision to lower inter-est rates and its effects on market rates has meant a significant fall in thedebt burden of Spanish households. In particular, the reduction in interestrate payments would mean greater disposable resources for households,and may exceed 12 billion in 2009. This process is not expected to changein the short term, as with the forecast of slower growth in Europe and afall in inflation all over the continent, the European Central Bank will tendto maintain interest rates low during 2009 and possibly in 2010.
Linked to this, in recent months there has been a reduction in the riskpremiums in the European interbank market. The consolidation of greater
Chart 2.17.
Housing supply and demandrolling average 4 quarters, 2000=100
Source: BBVA ERD
DemandSupply
50
75
100
125
150
175
200
Dec
-95
Dec
-96
Dec
-97
Dec
-98
Dec
-99
Dec
-00
Dec
-01
Dec
-02
Dec
-03
Dec
-04
Dec
-05
Dec
-06
Dec
-07
Dec
-08
SpainWatch
13
Chart 2.20.
Debt burden on Spanish households(Percentage of gross disposable income)
Source: BBVA ERD
3.6% 3.7% 3.9% 5.3%6.7% 7.1%
2.4%
8.8% 9.4% 10.0%10.4%
10.2%9.2%
10.1%
0%
4%
8%
12%
16%
20%
2003
2004
2005
2006
2007
2008
2009
InterestPrincipal
Chart 2.21.
Spain: household consumption andgross disposable income(Year-on-year growth and contributions toincome growth)
Source: INE and BBVA ERD
Income: Compensation to employeesIncome: Other componentsNominal consumption, % y-o-y
-4
-2
0
2
4
6
8
10
12
Mar
-02
Sep-
02
Mar
-03
Sep-
03
Mar
-04
Sep-
04
Mar
-05
Sep-
05
Mar
-06
Sep-
06
Mar
-07
Sep-
07
Mar
-08
Sep-
08
-4
-2
0
2
4
6
8
10
12
Chart 2.22.
Spain: GDP growth
Source: INE and BBVA ERD
% quarter-on-quarter (Right)% year-on-year (Left)
-6.0
-4.0
-2.0
0.0
2.0
4.0
6.0
Mar
-00
Sep-
00M
ar-0
1Se
p-01
Mar
-02
Sep-
02M
ar-0
3Se
p-03
Mar
-04
Sep-
04M
ar-0
5Se
p-05
Mar
-06
Sep-
06M
ar-0
7Se
p-07
Mar
-08
Sep-
08M
ar-0
9Se
p-09
Mar
-10
Sep-
10
-2.0-1.7-1.5-1.2-1.0-0.7-0.5-0.20.00.20.50.71.01.21.51.72.0
confidence levels will be fundamental in reducing financing costs evenfurther in the near future. Although these risk premiums are not expectedto return to the levels observed before this current episode of tension inthe financial markets, the considerable reductions in recent months willmean a significant easing which will help to lower the price of money inforthcoming months.
Moreover, in addition to the stimulus of the fall in interest rates there is theexpansive fiscal policy, not only in Spain, but also in other parts of Europe,the U.S. and Asia. In Europe the approved fiscal plans represent a signifi-cant amount, although there are considerable differences between thevarious countries. This joint effort suggests that that the positive effects ondomestic economies will be maximized, thereby guaranteeing that althoughpart of the stimulus is dedicated to spending on imports, Spanish produc-ers will also benefit from the fiscal plans in other countries.
However, even though the effects on growth may be maximized, thisdoes not ultimately guarantee that this increased public spending willhave any significant impact. Although there is growing debate as to theeffectiveness of this type of policy over the next quarters, fiscalexpenditures can at least be expected to have a stabilizing effect on theSpanish economy. This would be a result of the right mixture of spendingpolicies designed to have the maximum impact on domestic demandand employment (8 billion from the State Fund for Local Investment),and tax decreases to mitigate the effects of the fall in household income(a 400 euro deduction in personal income tax and suppression of wealthtax). Nevertheless, it should be added that there is some uncertainty asto the final impact of these far-reaching measures on the growth of theSpanish economy. In the first place, there are doubts as to the efficiencyof public versus private spending. In the second place, more spendingdoes not necessarily mean the resources will be put to use in sectorswith clear demand problems. In the third place, because as thesemeasures include tax reductions, the impact on the growth of aggregatedemand in the short term may be less that that of direct spending policies.However, the plans announced by the Spanish government are expectedto add about 1.2 growth points in 2009.
… which will not be sufficient to ward off the recession in2009
The balance of all these elements on the outlook is clearly negative.According to our estimates, the Spanish economy will undergo the mostsevere phase of the adjustment in this first half of 2009, with a declinein the first quarter of the year of around 1.4%. The quarterly decrease inGDP will be gradually reduced in the last part of the year, when theeffects of the fiscal incentives will be at a maximum. Even so, in theyear as a whole, the Spanish economy will shrink by 2.8%, and therewill be a drop in all the demand components, with the exception of publicconsumption and non-residential construction.
Particularly intense will be the decrease in investment as a whole, notonly due to the adjustment in the real estate sector, but also to due toinvestment in equipment, which will show the sharpest decline in itshistory. Consumer spending will fall drastically. On the one hand, this isthe result of the downward spiral of its fundamentals. Household incomewill be closely tied to the evolution of employment. Nor can we hope fora boost to wealth, with falling house prices (the prime determining factorfor real estate wealth) and a highly unfavorable evolution of the stockmarket (prime determining factor of the financial component of wealth)in the last few months. Although interest rates could indeed counteractthe lower availability of credit, the need for de-leveraging and the greatertrend towards precautionary savings in a recessionary phase2 suggests
2 See attached box.
SpainWatch
14
Chart 2.25.
Spain: Labor market
Source: INE and BBVA ERD
Job creation. % (Left)Unemployment rate (Right)
-8.0
-6.0
-4.0
-2.0
0.0
2.0
4.0
6.0
8.0
2000
2001
2002
2003
2004
2005
2006
2007
2008
2009
2010
5.0
7.5
10.0
12.5
15.0
17.5
20.0
that we can expect a significant drop in consumption. The external sector,for its part, will contribute positively to growth due to the correction inimports (proportional to the fall in domestic demand), as the decreasein international trade, and particularly the fall in the GDP in the EMU,will also lead to a decrease in exports.
There are elements which indicate that the period of decline will persistuntil the second half of 2010. On the one hand, Europe’s economicpulse will continue to be weak, and therefore the expected depreciationin the euro will not be enough for the external sector to drive growth in2010. On the other hand, the fiscal stimulus package is for the largepart temporary, and its extension until 2010 has not been announcedyet. However, the accumulation of income shocks on households couldmean that in 2010 consumption will undergo, if not significant growth,at least a much less negative evolution. In any case, and still with a highdegree of uncertainty, the Spanish economy does not appear likely toenjoy consecutive quarters of positive growth until the second half of2010. Thus our most probable scenario would point towards thestagnation of the GDP for 2010 as a whole.
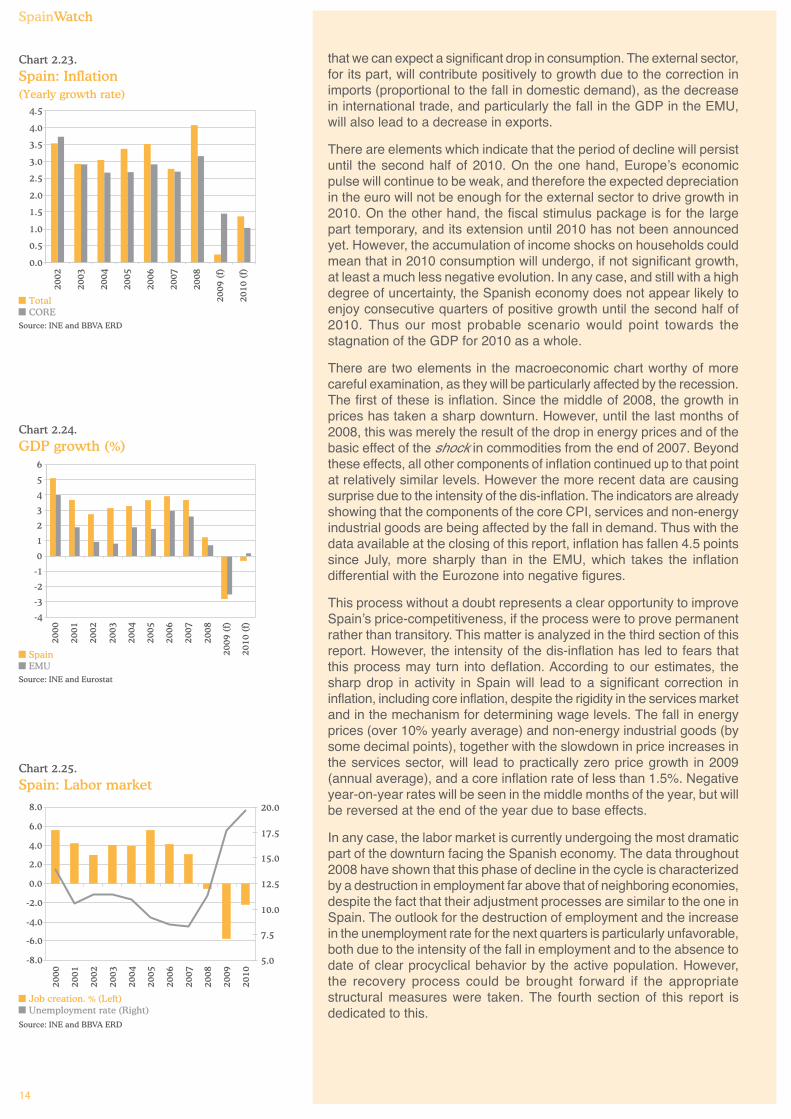
There are two elements in the macroeconomic chart worthy of morecareful examination, as they will be particularly affected by the recession.The first of these is inflation. Since the middle of 2008, the growth inprices has taken a sharp downturn. However, until the last months of2008, this was merely the result of the drop in energy prices and of thebasic effect of the shock in commodities from the end of 2007. Beyondthese effects, all other components of inflation continued up to that pointat relatively similar levels. However the more recent data are causingsurprise due to the intensity of the dis-inflation. The indicators are alreadyshowing that the components of the core CPI, services and non-energyindustrial goods are being affected by the fall in demand. Thus with thedata available at the closing of this report, inflation has fallen 4.5 pointssince July, more sharply than in the EMU, which takes the inflationdifferential with the Eurozone into negative figures.
This process without a doubt represents a clear opportunity to improveSpain’s price-competitiveness, if the process were to prove permanentrather than transitory. This matter is analyzed in the third section of thisreport. However, the intensity of the dis-inflation has led to fears thatthis process may turn into deflation. According to our estimates, thesharp drop in activity in Spain will lead to a significant correction ininflation, including core inflation, despite the rigidity in the services marketand in the mechanism for determining wage levels. The fall in energyprices (over 10% yearly average) and non-energy industrial goods (bysome decimal points), together with the slowdown in price increases inthe services sector, will lead to practically zero price growth in 2009(annual average), and a core inflation rate of less than 1.5%. Negativeyear-on-year rates will be seen in the middle months of the year, but willbe reversed at the end of the year due to base effects.
In any case, the labor market is currently undergoing the most dramaticpart of the downturn facing the Spanish economy. The data throughout2008 have shown that this phase of decline in the cycle is characterizedby a destruction in employment far above that of neighboring economies,despite the fact that their adjustment processes are similar to the one inSpain. The outlook for the destruction of employment and the increasein the unemployment rate for the next quarters is particularly unfavorable,both due to the intensity of the fall in employment and to the absence todate of clear procyclical behavior by the active population. However,the recovery process could be brought forward if the appropriatestructural measures were taken. The fourth section of this report isdedicated to this.
Chart 2.23.
Spain: Inflation(Yearly growth rate)
Source: INE and BBVA ERD
TotalCORE
0.0
0.5
1.0
1.5
2.0
2.5
3.0
3.5
4.0
4.5
2002
2003
2004
2005
2006
2007
2008
2009
(f)
2010
(f)
Chart 2.24.
GDP growth (%)
Source: INE and Eurostat
SpainEMU
-4
-3
-2
-1
0
1
2
3
4
5
6
2000
2001
2002
2003
2004
2005
2006
2007
2008
2009
(f)
2010
(f)
SpainWatch
15
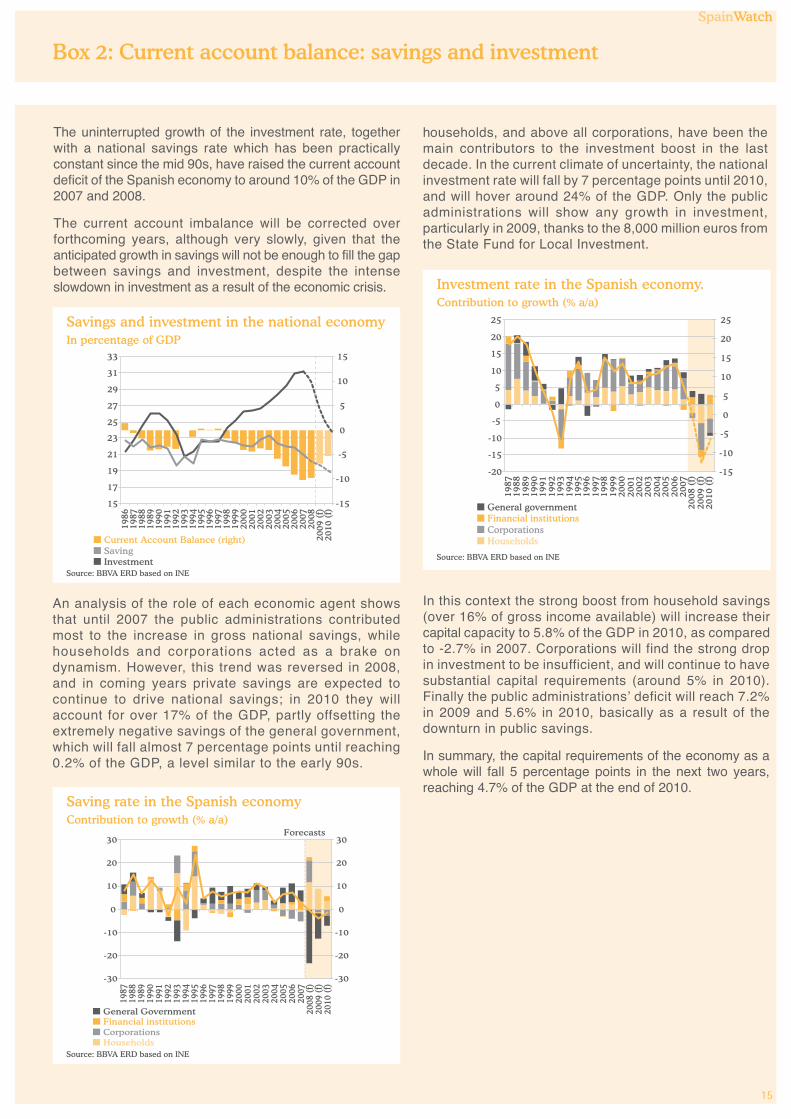
The uninterrupted growth of the investment rate, togetherwith a national savings rate which has been practicallyconstant since the mid 90s, have raised the current accountdeficit of the Spanish economy to around 10% of the GDP in2007 and 2008.
The current account imbalance will be corrected overforthcoming years, although very slowly, given that theanticipated growth in savings will not be enough to fill the gapbetween savings and investment, despite the intenseslowdown in investment as a result of the economic crisis.
households, and above all corporations, have been themain contributors to the investment boost in the lastdecade. In the current climate of uncertainty, the nationalinvestment rate will fall by 7 percentage points until 2010,and will hover around 24% of the GDP. Only the publicadministrations will show any growth in investment,particularly in 2009, thanks to the 8,000 million euros fromthe State Fund for Local Investment.
Box 2: Current account balance: savings and investment
An analysis of the role of each economic agent showsthat until 2007 the public administrations contributedmost to the increase in gross national savings, whilehouseholds and corporations acted as a brake ondynamism. However, this trend was reversed in 2008,and in coming years private savings are expected tocontinue to drive national savings; in 2010 they willaccount for over 17% of the GDP, partly offsetting theextremely negative savings of the general government,which will fall almost 7 percentage points until reaching0.2% of the GDP, a level similar to the early 90s.
Savings and investment in the national economyIn percentage of GDP
Source: BBVA ERD based on INE
Current Account Balance (right)Saving
15
17
19
21
23
25
27
29
31
33
1986
1987
1988
1989
1990
1991
1992
1993
1994
1995
1996
1997
1998
1999
2000
2001
2002
2003
2004
2005
2006
2007
2008
2009
(f)
2010
(f)
-15
-10
-5
0
5
10
15
Investment
Saving rate in the Spanish economyContribution to growth (% a/a)
Source: BBVA ERD based on INE
Financial institutionsCorporationsHouseholds
-30
-20
-10
0
10
20
30
1987
1988
1989
1990
1991
1992
1993
1994
1995
1996
1997
1998
1999
2000
2001
2002
2003
2004
2005
2006
2007
2008
(f)
2009
(f)
2010
(f)
-30
-20
-10
0
10
20
30Forecasts
General Government
Investment rate in the Spanish economy.Contribution to growth (% a/a)
Source: BBVA ERD based on INE
Financial institutionsCorporationsHouseholds
General government
-20
-15
-10
-5
0
5
10
15
20
25
1987
1988
1989
1990
1991
1992
1993
1994
1995
1996
1997
1998
1999
2000
2001
2002
2003
2004
2005
2006
2007
2008
(f)
2009
(f)
2010
(f)
-15
-10
-5
0
5
10
15
20
25
In this context the strong boost from household savings(over 16% of gross income available) will increase theircapital capacity to 5.8% of the GDP in 2010, as comparedto -2.7% in 2007. Corporations will find the strong dropin investment to be insufficient, and will continue to havesubstantial capital requirements (around 5% in 2010).Finally the public administrations’ deficit will reach 7.2%in 2009 and 5.6% in 2010, basically as a result of thedownturn in public savings.
In summary, the capital requirements of the economy as awhole will fall 5 percentage points in the next two years,reaching 4.7% of the GDP at the end of 2010.
SpainWatch
15

SpainWatch
16
Despite the expected fall in national capital requirements,they will still remain high, which means an ongoingaccumulation of liabilities bis a bis to other countries. Thusthe financial debt (loans and securities other than shares)with respect to the rest of the world could reach over 120%of the GDP in the next two years.
Net lending (+)/ Net borrowing (-) of Spanisheconomy through institutional agentsIn percentage of GDP
Source: BBVA ERD based on INE
Financial institutionsCorporationssHouseholds
General government
-15
-10
-5
0
5
10
1986
1987
1988
1989
1990
1991
1992
1993
1994
1995
1996
1997
1998
1999
2000
2001
2002
2003
2004
2005
2006
2007
2008
(f)
2009
(f)
2010
(f)
-15
-10
-5
0
5
10Total Domestic (right)
Foreing debt in the form of Loans and Securitiesother than shares
Source: BBVA ERD based on INE, BoS and IMF
0
20
40
60
80
100
120
140
1990
1991
1992
1993
1994
1995
1996
1997
1998
1999
2000
2001
2002
2003
2004
2005
2006
2007
2008
(f)
2009
(f)
2010
(f)
This debt instrument notably increases the resources thatthe Spanish economy must devote to interest payments onits foreign debt. While the volume of net interest paid hasgone from 0.3% of the GDP in 2004 to over 1.8% in 2007,the net yield of direct investment abroad has increased 0.4percentage points since 20041 , representing a gap of nearly1.5 percentage points of the GDP, which further contributesto the deterioration of the current account balance.
Net income from direct investment vs. net interestfrom debtIncome balance. 4Q rolling sum. In % of GDP
Source: BBVA ERD based on IMF
Net Direct investment return (1)Net debt interest
-2.0
-1.5
-1.0
-0.5
0.0
0.5
1.0
Dec
-90
Dec
-91
Dec
-92
Dec
-93
Dec
-94
Dec
-95
Dec
-96
Dec
-97
Dec
-98
Dec
-99
Dec
-00
Dec
-01
Dec
-02
Dec
-03
Dec
-04
Dec
-05
Dec
-06
Dec
-07
-2.0
-1.5
-1.0
-0.5
0.0
0.5
1.0
1 Net interest is understood as the difference between income and debt payments inthe income balance; and net returns on foreign direct investment as the differencebetween income and payments of this investment in the income balance.
The current climate of financial uncertainty, where the returnson direct foreign investment could forseeably fall even further,requires a reversal of this upward trend in foreign debt inorder to reduce interest payments and avoid a greaterdeterioration of the current account balance.
SpainWatch
16
SpainWatch
17
3.Ten years of inflation differentialbetween Spain and the Eurozone
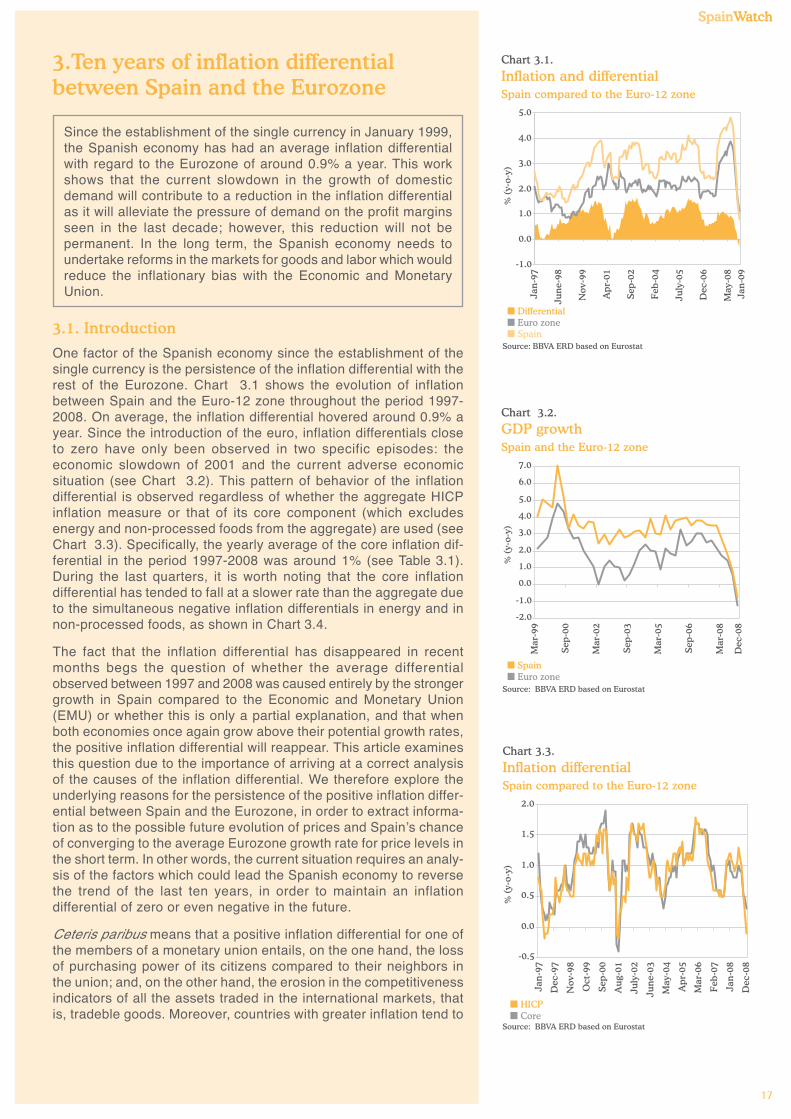
Since the establishment of the single currency in January 1999,the Spanish economy has had an average inflation differentialwith regard to the Eurozone of around 0.9% a year. This workshows that the current slowdown in the growth of domesticdemand will contribute to a reduction in the inflation differentialas it will alleviate the pressure of demand on the profit marginsseen in the last decade; however, this reduction will not bepermanent. In the long term, the Spanish economy needs toundertake reforms in the markets for goods and labor which wouldreduce the inflationary bias with the Economic and MonetaryUnion.
3.1. Introduction
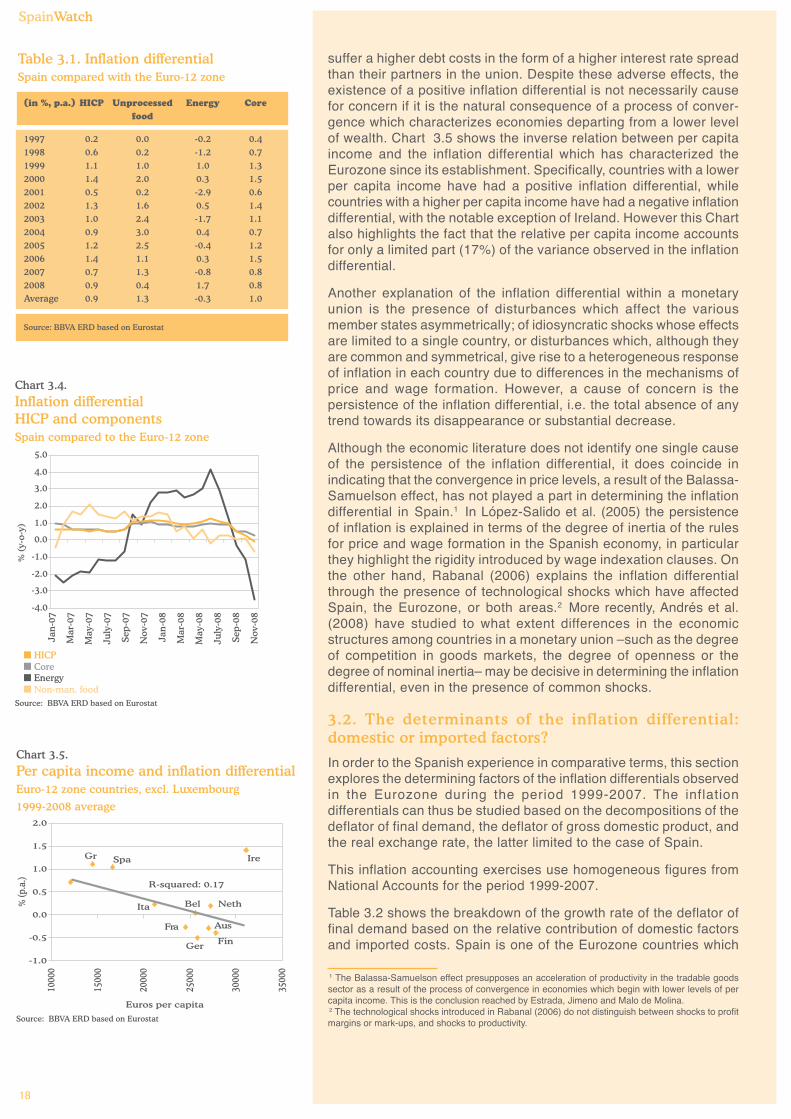
One factor of the Spanish economy since the establishment of thesingle currency is the persistence of the inflation differential with therest of the Eurozone. Chart 3.1 shows the evolution of inflationbetween Spain and the Euro-12 zone throughout the period 1997-2008. On average, the inflation differential hovered around 0.9% ayear. Since the introduction of the euro, inflation differentials closeto zero have only been observed in two specific episodes: theeconomic slowdown of 2001 and the current adverse economicsituation (see Chart 3.2). This pattern of behavior of the inflationdifferential is observed regardless of whether the aggregate HICPinflation measure or that of its core component (which excludesenergy and non-processed foods from the aggregate) are used (seeChart 3.3). Specifically, the yearly average of the core inflation dif-ferential in the period 1997-2008 was around 1% (see Table 3.1).During the last quarters, it is worth noting that the core inflationdifferential has tended to fall at a slower rate than the aggregate dueto the simultaneous negative inflation differentials in energy and innon-processed foods, as shown in Chart 3.4.
The fact that the inflation differential has disappeared in recentmonths begs the question of whether the average differentialobserved between 1997 and 2008 was caused entirely by the strongergrowth in Spain compared to the Economic and Monetary Union(EMU) or whether this is only a partial explanation, and that whenboth economies once again grow above their potential growth rates,the positive inflation differential will reappear. This article examinesthis question due to the importance of arriving at a correct analysisof the causes of the inflation differential. We therefore explore theunderlying reasons for the persistence of the positive inflation differ-ential between Spain and the Eurozone, in order to extract informa-tion as to the possible future evolution of prices and Spain’s chanceof converging to the average Eurozone growth rate for price levels inthe short term. In other words, the current situation requires an analy-sis of the factors which could lead the Spanish economy to reversethe trend of the last ten years, in order to maintain an inflationdifferential of zero or even negative in the future.
Ceteris paribus means that a positive inflation differential for one ofthe members of a monetary union entails, on the one hand, the lossof purchasing power of its citizens compared to their neighbors inthe union; and, on the other hand, the erosion in the competitivenessindicators of all the assets traded in the international markets, thatis, tradeble goods. Moreover, countries with greater inflation tend to
Chart 3.1.
Inflation and differentialSpain compared to the Euro-12 zone
Source: BBVA ERD based on Eurostat
DifferentialEuro zone
Jan
-97
Jun
e-98
Nov
-99
Ap
r-01
Sep
-02
Feb
-04
July
-05
Dec
-06
May
-08
Spain
-1.0
0.0
1.0
2.0
3.0
4.0
5.0
% (
y-o-
y)
Jan
-09
Chart 3.2.
GDP growthSpain and the Euro-12 zone
Source: BBVA ERD based on Eurostat
SpainEuro zone
Mar
-99
Sep
-00
Mar
-02
Sep
-03
Mar
-05
Sep
-06
Mar
-08
-2.0
-1.0
0.0
1.0
2.0
3.0
4.0
5.0
6.0
7.0
% (
y-o-
y)
Dec
-08
Chart 3.3.
Inflation differentialSpain compared to the Euro-12 zone
Source: BBVA ERD based on Eurostat
HICPCore
Jan
-97
Dec
-97
Nov
-98
Oct
-99
Sep
-00
Au
g-01
July
-02
Jun
e-03
May
-04
Ap
r-05
Mar
-06
Feb
-07
Jan
-08
Dec
-08
-0.5
0.0
0.5
1.0
1.5
2.0
% (
y-o-
y)
SpainWatch
SpainWatch
18
suffer a higher debt costs in the form of a higher interest rate spreadthan their partners in the union. Despite these adverse effects, theexistence of a positive inflation differential is not necessarily causefor concern if it is the natural consequence of a process of conver-gence which characterizes economies departing from a lower levelof wealth. Chart 3.5 shows the inverse relation between per capitaincome and the inflation differential which has characterized theEurozone since its establishment. Specifically, countries with a lowerper capita income have had a positive inflation differential, whilecountries with a higher per capita income have had a negative inflationdifferential, with the notable exception of Ireland. However this Chartalso highlights the fact that the relative per capita income accountsfor only a limited part (17%) of the variance observed in the inflationdifferential.
Another explanation of the inflation differential within a monetaryunion is the presence of disturbances which affect the variousmember states asymmetrically; of idiosyncratic shocks whose effectsare limited to a single country, or disturbances which, although theyare common and symmetrical, give rise to a heterogeneous responseof inflation in each country due to differences in the mechanisms ofprice and wage formation. However, a cause of concern is thepersistence of the inflation differential, i.e. the total absence of anytrend towards its disappearance or substantial decrease.
Although the economic literature does not identify one single causeof the persistence of the inflation differential, it does coincide inindicating that the convergence in price levels, a result of the Balassa-Samuelson effect, has not played a part in determining the inflationdifferential in Spain.1 In López-Salido et al. (2005) the persistenceof inflation is explained in terms of the degree of inertia of the rulesfor price and wage formation in the Spanish economy, in particularthey highlight the rigidity introduced by wage indexation clauses. Onthe other hand, Rabanal (2006) explains the inflation differentialthrough the presence of technological shocks which have affectedSpain, the Eurozone, or both areas.2 More recently, Andrés et al.(2008) have studied to what extent differences in the economicstructures among countries in a monetary union –such as the degreeof competition in goods markets, the degree of openness or thedegree of nominal inertia– may be decisive in determining the inflationdifferential, even in the presence of common shocks.
3.2. The determinants of the inflation differential:domestic or imported factors?
In order to the Spanish experience in comparative terms, this sectionexplores the determining factors of the inflation differentials observedin the Eurozone during the period 1999-2007. The inflationdifferentials can thus be studied based on the decompositions of thedeflator of final demand, the deflator of gross domestic product, andthe real exchange rate, the latter limited to the case of Spain.
This inflation accounting exercises use homogeneous figures fromNational Accounts for the period 1999-2007.
Table 3.2 shows the breakdown of the growth rate of the deflator offinal demand based on the relative contribution of domestic factorsand imported costs. Spain is one of the Eurozone countries which
1 The Balassa-Samuelson effect presupposes an acceleration of productivity in the tradable goodssector as a result of the process of convergence in economies which begin with lower levels of percapita income. This is the conclusion reached by Estrada, Jimeno and Malo de Molina.2 The technological shocks introduced in Rabanal (2006) do not distinguish between shocks to profitmargins or mark-ups, and shocks to productivity.
(in %, p.a.) HICP Unprocessed Energy Corefood
1997 0.2 0.0 -0.2 0.41998 0.6 0.2 -1.2 0.71999 1.1 1.0 1.0 1.32000 1.4 2.0 0.3 1.52001 0.5 0.2 -2.9 0.62002 1.3 1.6 0.5 1.42003 1.0 2.4 -1.7 1.12004 0.9 3.0 0.4 0.72005 1.2 2.5 -0.4 1.22006 1.4 1.1 0.3 1.52007 0.7 1.3 -0.8 0.82008 0.9 0.4 1.7 0.8Average 0.9 1.3 -0.3 1.0
Source: BBVA ERD based on Eurostat
Table 3.1. Inflation differentialSpain compared with the Euro-12 zone
Chart 3.4.
Inflation differentialHICP and componentsSpain compared to the Euro-12 zone
Source: BBVA ERD based on Eurostat
HICPCore
Jan
-07
Mar
-07
May
-07
July
-07
Sep
-07
Nov
-07
Jan
-08
Mar
-08
May
-08
July
-08
Sep
-08
Nov
-08
-4.0
-3.0
-2.0
-1.0
0.0
1.0
2.0
3.0
4.0
5.0
% (
y-o-
y)
EnergyNon-man. food
Chart 3.5.
Per capita income and inflation differentialEuro-12 zone countries, excl. Luxembourg
1999-2008 average
Source: BBVA ERD based on Eurostat
-1.0
-0.5
0.0
0.5
1.0
1.5
2.0
1000
0
1500
0
2000
0
2500
0
3000
0
3500
0
% (p
.a.)
Euros per capita
R-squared: 0.17
Gr Spa Ire
Ita NethBel
Fra
Ger
Aus
Fin
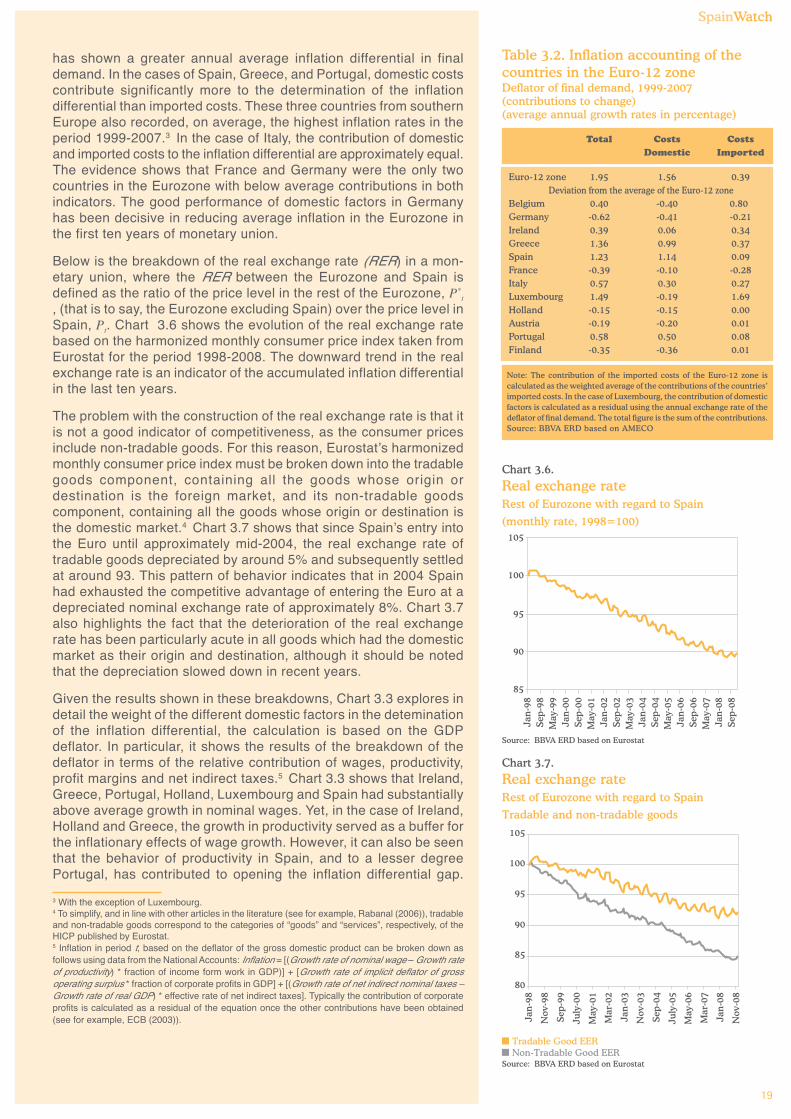
SpainWatch
19
has shown a greater annual average inflation differential in finaldemand. In the cases of Spain, Greece, and Portugal, domestic costscontribute significantly more to the determination of the inflationdifferential than imported costs. These three countries from southernEurope also recorded, on average, the highest inflation rates in theperiod 1999-2007.3 In the case of Italy, the contribution of domesticand imported costs to the inflation differential are approximately equal.The evidence shows that France and Germany were the only twocountries in the Eurozone with below average contributions in bothindicators. The good performance of domestic factors in Germanyhas been decisive in reducing average inflation in the Eurozone inthe first ten years of monetary union.
Below is the breakdown of the real exchange rate (RER) in a mon-etary union, where the RER between the Eurozone and Spain isdefined as the ratio of the price level in the rest of the Eurozone, P*
t
, (that is to say, the Eurozone excluding Spain) over the price level inSpain, Pt. Chart 3.6 shows the evolution of the real exchange ratebased on the harmonized monthly consumer price index taken fromEurostat for the period 1998-2008. The downward trend in the realexchange rate is an indicator of the accumulated inflation differentialin the last ten years.
The problem with the construction of the real exchange rate is that itis not a good indicator of competitiveness, as the consumer pricesinclude non-tradable goods. For this reason, Eurostat’s harmonizedmonthly consumer price index must be broken down into the tradablegoods component, containing all the goods whose origin ordestination is the foreign market, and its non-tradable goodscomponent, containing all the goods whose origin or destination isthe domestic market.4 Chart 3.7 shows that since Spain’s entry intothe Euro until approximately mid-2004, the real exchange rate oftradable goods depreciated by around 5% and subsequently settledat around 93. This pattern of behavior indicates that in 2004 Spainhad exhausted the competitive advantage of entering the Euro at adepreciated nominal exchange rate of approximately 8%. Chart 3.7also highlights the fact that the deterioration of the real exchangerate has been particularly acute in all goods which had the domesticmarket as their origin and destination, although it should be notedthat the depreciation slowed down in recent years.
Given the results shown in these breakdowns, Chart 3.3 explores indetail the weight of the different domestic factors in the deteminationof the inflation differential, the calculation is based on the GDPdeflator. In particular, it shows the results of the breakdown of thedeflator in terms of the relative contribution of wages, productivity,profit margins and net indirect taxes.5 Chart 3.3 shows that Ireland,Greece, Portugal, Holland, Luxembourg and Spain had substantiallyabove average growth in nominal wages. Yet, in the case of Ireland,Holland and Greece, the growth in productivity served as a buffer forthe inflationary effects of wage growth. However, it can also be seenthat the behavior of productivity in Spain, and to a lesser degreePortugal, has contributed to opening the inflation differential gap.
3 With the exception of Luxembourg.4 To simplify, and in line with other articles in the literature (see for example, Rabanal (2006)), tradableand non-tradable goods correspond to the categories of “goods” and “services”, respectively, of theHICP published by Eurostat.5 Inflation in period t, based on the deflator of the gross domestic product can be broken down asfollows using data from the National Accounts: Inflation = [(Growth rate of nominal wage – Growth rateof productivity) * fraction of income form work in GDP)] + [Growth rate of implicit deflator of grossoperating surplus * fraction of corporate profits in GDP] + [(Growth rate of net indirect nominal taxes –Growth rate of real GDP) * effective rate of net indirect taxes]. Typically the contribution of corporateprofits is calculated as a residual of the equation once the other contributions have been obtained(see for example, ECB (2003)).
Total Costs CostsDomestic Imported
Euro-12 zone 1.95 1.56 0.39Deviation from the average of the Euro-12 zone
Belgium 0.40 -0.40 0.80Germany -0.62 -0.41 -0.21Ireland 0.39 0.06 0.34Greece 1.36 0.99 0.37Spain 1.23 1.14 0.09France -0.39 -0.10 -0.28Italy 0.57 0.30 0.27Luxembourg 1.49 -0.19 1.69Holland -0.15 -0.15 0.00Austria -0.19 -0.20 0.01Portugal 0.58 0.50 0.08Finland -0.35 -0.36 0.01
Note: The contribution of the imported costs of the Euro-12 zone iscalculated as the weighted average of the contributions of the countries’imported costs. In the case of Luxembourg, the contribution of domesticfactors is calculated as a residual using the annual exchange rate of thedeflator of final demand. The total figure is the sum of the contributions.Source: BBVA ERD based on AMECO
Table 3.2. Inflation accounting of thecountries in the Euro-12 zoneDeflator of final demand, 1999-2007(contributions to change)(average annual growth rates in percentage)
Chart 3.6.
Real exchange rateRest of Eurozone with regard to Spain
(monthly rate, 1998=100)
Source: BBVA ERD based on Eurostat
85
90
95
100
105Ja
n-9
8Se
p-98
May
-99
Jan
-00
Sep-
00M
ay-0
1Ja
n-0
2Se
p-02
May
-03
Jan
-04
Sep-
04M
ay-0
5Ja
n-0
6Se
p-06
May
-07
Jan
-08
Sep-
08
Chart 3.7.
Real exchange rateRest of Eurozone with regard to Spain
Tradable and non-tradable goods
Source: BBVA ERD based on Eurostat
80
85
90
95
100
105
Jan
-98
Nov
-98
Sep-
99
July
-00
May
-01
Mar
-02
Jan
-03
Nov
-03
Sep-
04
July
-05
May
-06
Mar
-07
Jan
-08
Nov
-08
Tradable Good EERNon-Tradable Good EER
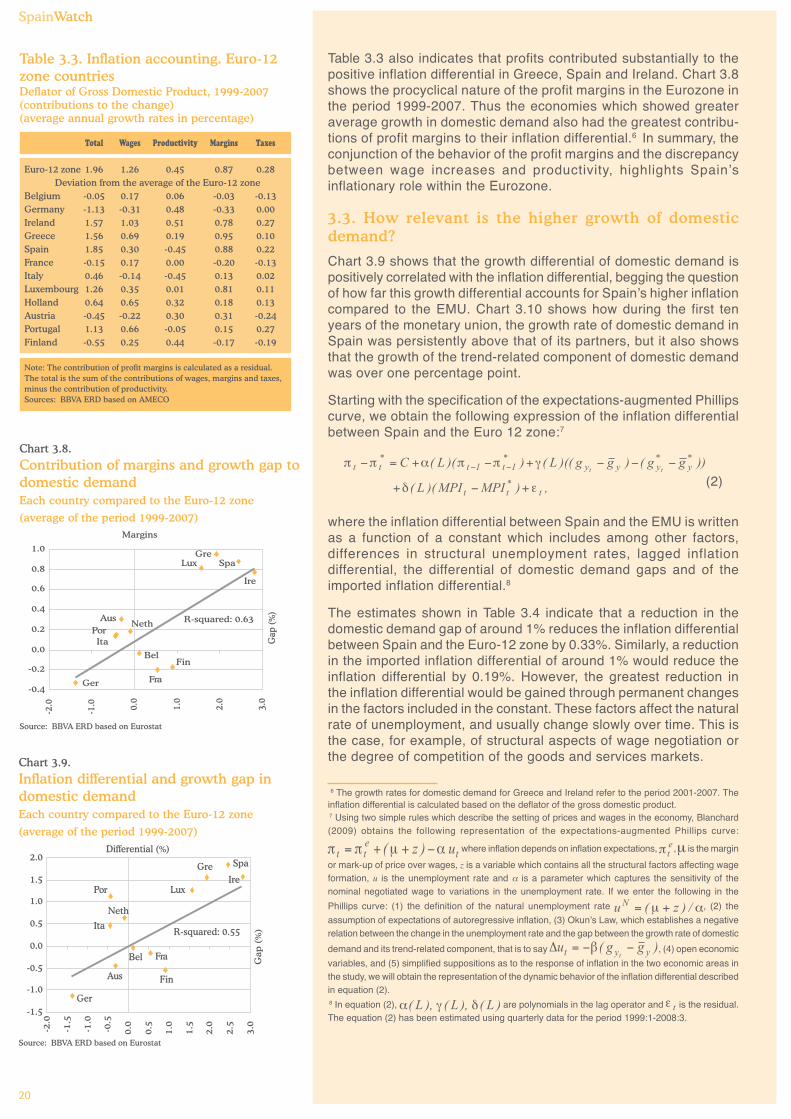
SpainWatch
20
Table 3.3 also indicates that profits contributed substantially to thepositive inflation differential in Greece, Spain and Ireland. Chart 3.8shows the procyclical nature of the profit margins in the Eurozone inthe period 1999-2007. Thus the economies which showed greateraverage growth in domestic demand also had the greatest contribu-tions of profit margins to their inflation differential.6 In summary, theconjunction of the behavior of the profit margins and the discrepancybetween wage increases and productivity, highlights Spain’sinflationary role within the Eurozone.
3.3. How relevant is the higher growth of domesticdemand?
Chart 3.9 shows that the growth differential of domestic demand ispositively correlated with the inflation differential, begging the questionof how far this growth differential accounts for Spain’s higher inflationcompared to the EMU. Chart 3.10 shows how during the first tenyears of the monetary union, the growth rate of domestic demand inSpain was persistently above that of its partners, but it also showsthat the growth of the trend-related component of domestic demandwas over one percentage point.
Starting with the specification of the expectations-augmented Phillipscurve, we obtain the following expression of the inflation differentialbetween Spain and the Euro 12 zone:7
(2)
where the inflation differential between Spain and the EMU is writtenas a function of a constant which includes among other factors,differences in structural unemployment rates, lagged inflationdifferential, the differential of domestic demand gaps and of theimported inflation differential.8
The estimates shown in Table 3.4 indicate that a reduction in thedomestic demand gap of around 1% reduces the inflation differentialbetween Spain and the Euro-12 zone by 0.33%. Similarly, a reductionin the imported inflation differential of around 1% would reduce theinflation differential by 0.19%. However, the greatest reduction inthe inflation differential would be gained through permanent changesin the factors included in the constant. These factors affect the naturalrate of unemployment, and usually change slowly over time. This isthe case, for example, of structural aspects of wage negotiation orthe degree of competition of the goods and services markets.
6 The growth rates for domestic demand for Greece and Ireland refer to the period 2001-2007. Theinflation differential is calculated based on the deflator of the gross domestic product.7 Using two simple rules which describe the setting of prices and wages in the economy, Blanchard(2009) obtains the following representation of the expectations-augmented Phillips curve:
where inflation depends on inflation expectations, , is the margin
or mark-up of price over wages, z is a variable which contains all the structural factors affecting wageformation, u is the unemployment rate and α is a parameter which captures the sensitivity of thenominal negotiated wage to variations in the unemployment rate. If we enter the following in the
Phillips curve: (1) the definition of the natural unemployment rate , (2) the
assumption of expectations of autoregressive inflation, (3) Okun’s Law, which establishes a negativerelation between the change in the unemployment rate and the gap between the growth rate of domestic
demand and its trend-related component, that is to say , (4) open economic
variables, and (5) simplified suppositions as to the response of inflation in the two economic areas inthe study, we will obtain the representation of the dynamic behavior of the inflation differential describedin equation (2).8 In equation (2), are polynomials in the lag operator and is the residual.The equation (2) has been estimated using quarterly data for the period 1999:1-2008:3.
Chart 3.8.
Contribution of margins and growth gap todomestic demandEach country compared to the Euro-12 zone
(average of the period 1999-2007)
Source: BBVA ERD based on Eurostat
-0.4
-0.2
0.2
0.4
0.6
0.8
1.0
-2.0
-1.0 0.0
1.0
2.0
3.0
Margins
Gap
(%)
R-squared: 0.63
0.0
AusPorIta
Neth
Bel
Ger Fra
Fin
GreLux Spa
Ire
Total Wages Productivity Margins Taxes
Euro-12 zone 1.96 1.26 0.45 0.87 0.28Deviation from the average of the Euro-12 zone
Belgium -0.05 0.17 0.06 -0.03 -0.13Germany -1.13 -0.31 0.48 -0.33 0.00Ireland 1.57 1.03 0.51 0.78 0.27Greece 1.56 0.69 0.19 0.95 0.10Spain 1.85 0.30 -0.45 0.88 0.22France -0.15 0.17 0.00 -0.20 -0.13Italy 0.46 -0.14 -0.45 0.13 0.02Luxembourg 1.26 0.35 0.01 0.81 0.11Holland 0.64 0.65 0.32 0.18 0.13Austria -0.45 -0.22 0.30 0.31 -0.24Portugal 1.13 0.66 -0.05 0.15 0.27Finland -0.55 0.25 0.44 -0.17 -0.19
Note: The contribution of profit margins is calculated as a residual.The total is the sum of the contributions of wages, margins and taxes,minus the contribution of productivity.Sources: BBVA ERD based on AMECO
Table 3.3. Inflation accounting. Euro-12zone countriesDeflator of Gross Domestic Product, 1999-2007(contributions to the change)(average annual growth rates in percentage)
Chart 3.9.
Inflation differential and growth gap indomestic demandEach country compared to the Euro-12 zone
(average of the period 1999-2007)
Source: BBVA ERD based on Eurostat
-1.5
-1.0
-0.5
0.0
0.5
1.0
1.5
2.0
-2.0
-1.5
-1.0
-0.5
0.0
0.5
1.0
1.5
2.0
2.5
3.0
Gap
(%
)
Differential (%)
R-squared: 0.55
Ger
Por
Neth
Ita
Aus
Bel Fra
Fin
SpaGre
LuxIre
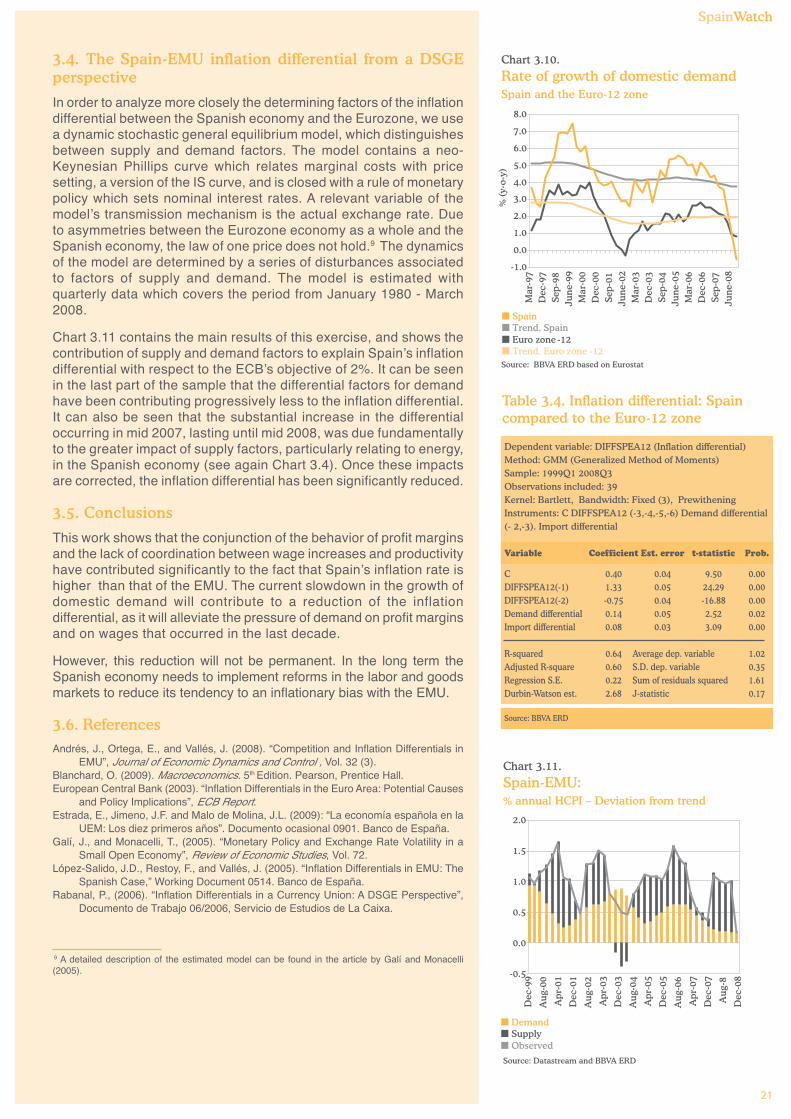
SpainWatch
21
3.4. The Spain-EMU inflation differential from a DSGEperspective
In order to analyze more closely the determining factors of the inflationdifferential between the Spanish economy and the Eurozone, we usea dynamic stochastic general equilibrium model, which distinguishesbetween supply and demand factors. The model contains a neo-Keynesian Phillips curve which relates marginal costs with pricesetting, a version of the IS curve, and is closed with a rule of monetarypolicy which sets nominal interest rates. A relevant variable of themodel’s transmission mechanism is the actual exchange rate. Dueto asymmetries between the Eurozone economy as a whole and theSpanish economy, the law of one price does not hold.9 The dynamicsof the model are determined by a series of disturbances associatedto factors of supply and demand. The model is estimated withquarterly data which covers the period from January 1980 - March2008.
Chart 3.11 contains the main results of this exercise, and shows thecontribution of supply and demand factors to explain Spain’s inflationdifferential with respect to the ECB’s objective of 2%. It can be seenin the last part of the sample that the differential factors for demandhave been contributing progressively less to the inflation differential.It can also be seen that the substantial increase in the differentialoccurring in mid 2007, lasting until mid 2008, was due fundamentallyto the greater impact of supply factors, particularly relating to energy,in the Spanish economy (see again Chart 3.4). Once these impactsare corrected, the inflation differential has been significantly reduced.
3.5. Conclusions
This work shows that the conjunction of the behavior of profit marginsand the lack of coordination between wage increases and productivityhave contributed significantly to the fact that Spain’s inflation rate ishigher than that of the EMU. The current slowdown in the growth ofdomestic demand will contribute to a reduction of the inflationdifferential, as it will alleviate the pressure of demand on profit marginsand on wages that occurred in the last decade.
However, this reduction will not be permanent. In the long term theSpanish economy needs to implement reforms in the labor and goodsmarkets to reduce its tendency to an inflationary bias with the EMU.
3.6. ReferencesAndrés, J., Ortega, E., and Vallés, J. (2008). “Competition and Inflation Differentials in
EMU”, Journal of Economic Dynamics and Control , Vol. 32 (3).Blanchard, O. (2009). Macroeconomics. 5th Edition. Pearson, Prentice Hall.European Central Bank (2003). “Inflation Differentials in the Euro Area: Potential Causes
and Policy Implications”, ECB Report.Estrada, E., Jimeno, J.F. and Malo de Molina, J.L. (2009): “La economía española en la
UEM: Los diez primeros años”. Documento ocasional 0901. Banco de España.Galí, J., and Monacelli, T., (2005). “Monetary Policy and Exchange Rate Volatility in a
Small Open Economy”, Review of Economic Studies, Vol. 72.López-Salido, J.D., Restoy, F., and Vallés, J. (2005). “Inflation Differentials in EMU: The
Spanish Case,” Working Document 0514. Banco de España.Rabanal, P., (2006). “Inflation Differentials in a Currency Union: A DSGE Perspective”,
Documento de Trabajo 06/2006, Servicio de Estudios de La Caixa.
9 A detailed description of the estimated model can be found in the article by Galí and Monacelli(2005).
Chart 3.10.
Rate of growth of domestic demandSpain and the Euro-12 zone
Source: BBVA ERD based on Eurostat
Mar
-97
Dec
-97
Sep
-98
Jun
e-99
Mar
-00
Dec
-00
Sep
-01
Jun
e-02
Mar
-03
Dec
-03
Sep
-04
Jun
e-05
Mar
-06
Dec
-06
Sep
-07
Jun
e-08
SpainTrend. Spain
-1.0
0.0
1.0
2.0
3.0
4.0
5.0
6.0
7.0
8.0
% (
y-o-
y)
Euro zone -12Trend. Euro zone -12
Table 3.4. Inflation differential: Spaincompared to the Euro-12 zone
Dependent variable: DIFFSPEA12 (Inflation differential)Method: GMM (Generalized Method of Moments)Sample: 1999Q1 2008Q3Observations included: 39Kernel: Bartlett, Bandwidth: Fixed (3), PrewitheningInstruments: C DIFFSPEA12 (-3,-4,-5,-6) Demand differential(- 2,-3). Import differential
Variable Coefficient Est. error t-statistic Prob.
C 0.40 0.04 9.50 0.00DIFFSPEA12(-1) 1.33 0.05 24.29 0.00DIFFSPEA12(-2) -0.75 0.04 -16.88 0.00Demand differential 0.14 0.05 2.52 0.02Import differential 0.08 0.03 3.09 0.00
R-squared 0.64 Average dep. variable 1.02Adjusted R-square 0.60 S.D. dep. variable 0.35Regression S.E. 0.22 Sum of residuals squared 1.61Durbin-Watson est. 2.68 J-statistic 0.17
Source: BBVA ERD
Chart 3.11.
Spain-EMU:% annual HCPI – Deviation from trend
Source: Datastream and BBVA ERD
2.0
1.5
1.0
0.5
0.0
-0.5
Dec
-99
Au
g-00
Apr
-01
Dec
-01
Au
g-02
Apr
-03
Dec
-03
Au
g-04
Apr
-05
Dec
-05
Au
g-06
Apr
-07
Dec
-07
Au
g-8
Dec
-08
DemandSupplyObserved
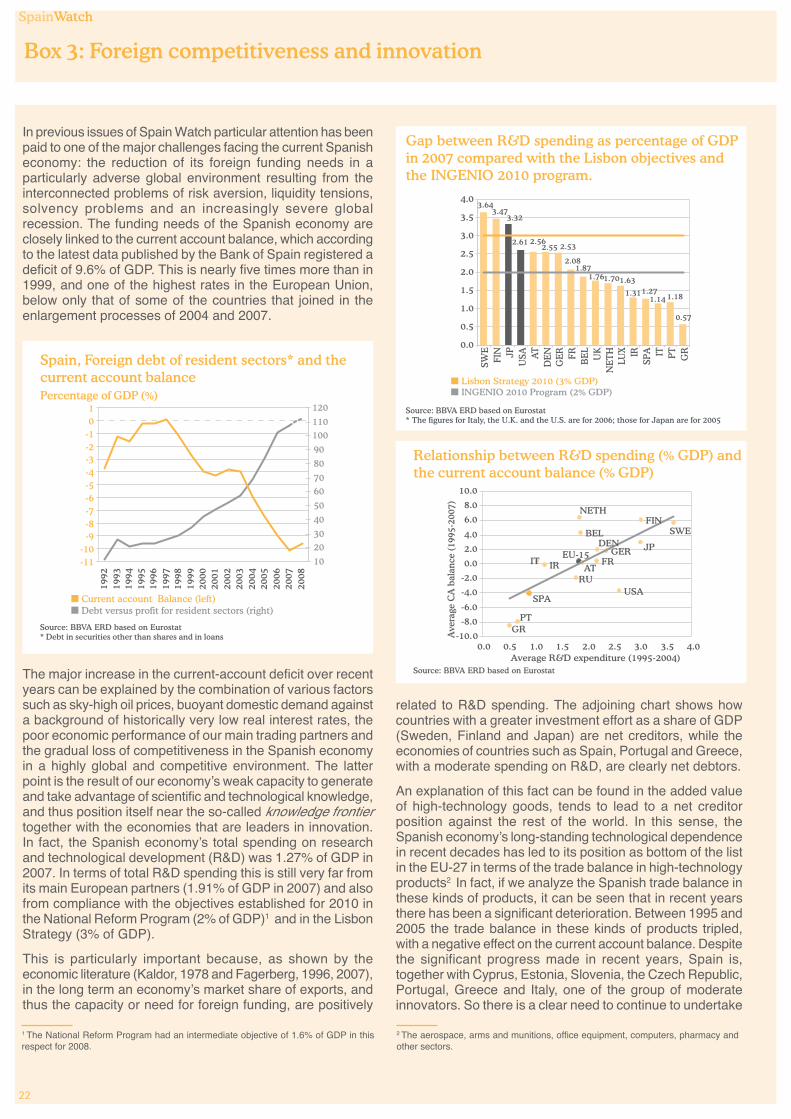
SpainWatch
22
Box 3: Foreign competitiveness and innovation
In previous issues of Spain Watch particular attention has beenpaid to one of the major challenges facing the current Spanisheconomy: the reduction of its foreign funding needs in aparticularly adverse global environment resulting from theinterconnected problems of risk aversion, liquidity tensions,solvency problems and an increasingly severe globalrecession. The funding needs of the Spanish economy areclosely linked to the current account balance, which accordingto the latest data published by the Bank of Spain registered adeficit of 9.6% of GDP. This is nearly five times more than in1999, and one of the highest rates in the European Union,below only that of some of the countries that joined in theenlargement processes of 2004 and 2007.
Spain, Foreign debt of resident sectors* and thecurrent account balancePercentage of GDP (%)
Current account Balance (left)Debt versus profit for resident sectors (right)
-11-10
-9-8-7-6-5-4-3-2-101
1992
1993
1994
1995
1996
1997
1998
1999
2000
2001
2002
2003
2004
2005
2006
2007
2008
102030405060708090100110120
Source: BBVA ERD based on Eurostat* Debt in securities other than shares and in loans
The major increase in the current-account deficit over recentyears can be explained by the combination of various factorssuch as sky-high oil prices, buoyant domestic demand againsta background of historically very low real interest rates, thepoor economic performance of our main trading partners andthe gradual loss of competitiveness in the Spanish economyin a highly global and competitive environment. The latterpoint is the result of our economy’s weak capacity to generateand take advantage of scientific and technological knowledge,and thus position itself near the so-called knowledge frontiertogether with the economies that are leaders in innovation.In fact, the Spanish economy’s total spending on researchand technological development (R&D) was 1.27% of GDP in2007. In terms of total R&D spending this is still very far fromits main European partners (1.91% of GDP in 2007) and alsofrom compliance with the objectives established for 2010 inthe National Reform Program (2% of GDP)1 and in the LisbonStrategy (3% of GDP).
This is particularly important because, as shown by theeconomic literature (Kaldor, 1978 and Fagerberg, 1996, 2007),in the long term an economy’s market share of exports, andthus the capacity or need for foreign funding, are positively
Relationship between R&D spending (% GDP) andthe current account balance (% GDP)
Source: BBVA ERD based on Eurostat
EU-15
BELDEN
GER
IR
GR
SPA
FRIT
NETH
AT
PT
FINSWE
RUUSA
JP
-10.0
-8.0
-6.0
-4.0
-2.0
0.0
2.0
4.0
6.0
8.0
10.0
0.0 0.5 1.0 1.5 2.0 2.5 3.0 3.5 4.0Average R&D expenditure (1995-2004)
Ave
rage
CA
bal
ance
(19
95-2
007)
related to R&D spending. The adjoining chart shows howcountries with a greater investment effort as a share of GDP(Sweden, Finland and Japan) are net creditors, while theeconomies of countries such as Spain, Portugal and Greece,with a moderate spending on R&D, are clearly net debtors.
An explanation of this fact can be found in the added valueof high-technology goods, tends to lead to a net creditorposition against the rest of the world. In this sense, theSpanish economy’s long-standing technological dependencein recent decades has led to its position as bottom of the listin the EU-27 in terms of the trade balance in high-technologyproducts2 In fact, if we analyze the Spanish trade balance inthese kinds of products, it can be seen that in recent yearsthere has been a significant deterioration. Between 1995 and2005 the trade balance in these kinds of products tripled,with a negative effect on the current account balance. Despitethe significant progress made in recent years, Spain is,together with Cyprus, Estonia, Slovenia, the Czech Republic,Portugal, Greece and Italy, one of the group of moderateinnovators. So there is a clear need to continue to undertake
1 The National Reform Program had an intermediate objective of 1.6% of GDP in thisrespect for 2008.
Gap between R&D spending as percentage of GDPin 2007 compared with the Lisbon objectives andthe INGENIO 2010 program.
Source: BBVA ERD based on Eurostat* The figures for Italy, the U.K. and the U.S. are for 2006; those for Japan are for 2005
Lisbon Strategy 2010 (3% GDP)INGENIO 2010 Program (2% GDP)
3.473.32
2.55
2.08
1.271.14
0.57
1.631.701.76
2.532.562.61
1.181.31
3.64
1.87
0.0
0.5
1.0
1.5
2.0
2.5
3.0
3.5
4.0
SWE
FIN JP
USA A
TD
EN
GE
R FR BE
LU
KN
ET
HLU
X IRSP
A IT PT GR
SpainWatch
22
2 The aerospace, arms and munitions, office equipment, computers, pharmacy andother sectors.
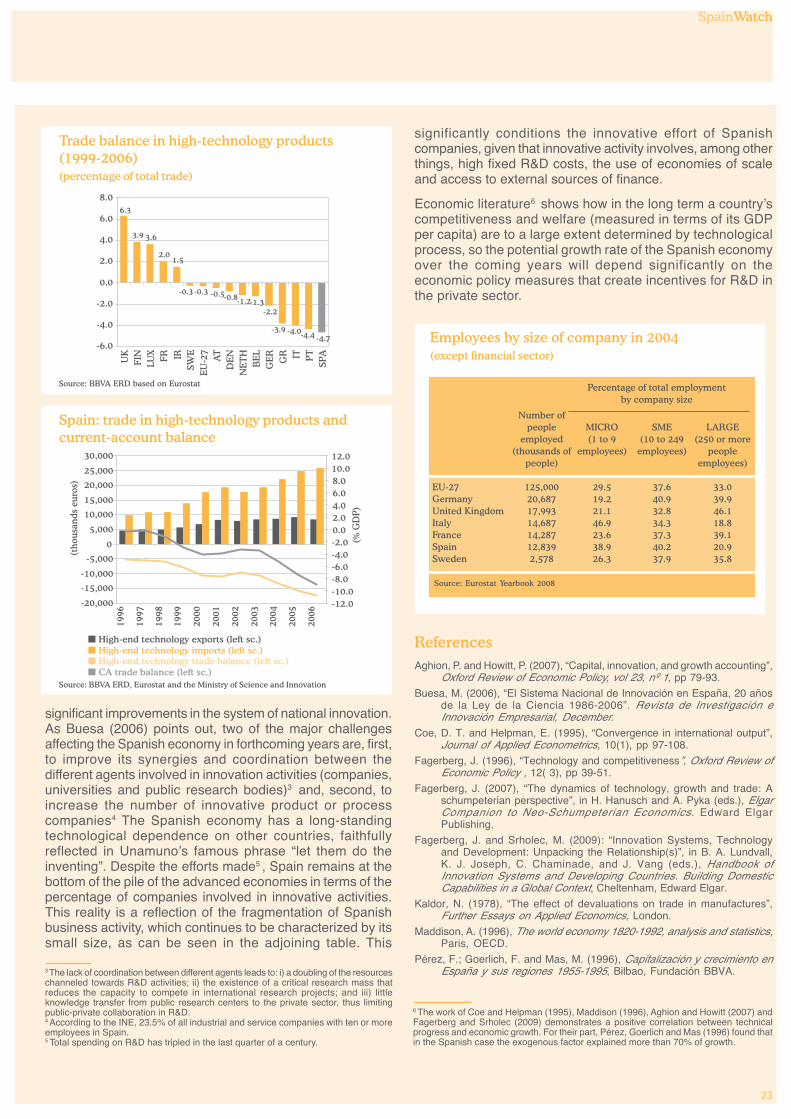
SpainWatch
23
significant improvements in the system of national innovation.As Buesa (2006) points out, two of the major challengesaffecting the Spanish economy in forthcoming years are, first,to improve its synergies and coordination between thedifferent agents involved in innovation activities (companies,universities and public research bodies)3 and, second, toincrease the number of innovative product or processcompanies4 The Spanish economy has a long-standingtechnological dependence on other countries, faithfullyreflected in Unamuno’s famous phrase “let them do theinventing”. Despite the efforts made5 , Spain remains at thebottom of the pile of the advanced economies in terms of thepercentage of companies involved in innovative activities.This reality is a reflection of the fragmentation of Spanishbusiness activity, which continues to be characterized by itssmall size, as can be seen in the adjoining table. This
Trade balance in high-technology products(1999-2006)(percentage of total trade)
Source: BBVA ERD based on Eurostat
3.9 3.6
2.01.5
-0.3 -0.3 -0.5-0.8-1.2-1.3-2.2
-3.9 -4.0-4.4 -4.7
6.3
-6.0
-4.0
-2.0
0.0
2.0
4.0
6.0
8.0
UK
FIN
LUX
FR IRSW
EE
U-2
7A
TD
EN
NE
TH
BE
LG
ER
GR IT PT
SPA
Spain: trade in high-technology products andcurrent-account balance
Source: BBVA ERD, Eurostat and the Ministry of Science and Innovation
High-end technology exports (left sc.)High-end technology imports (left sc.)High-end technology trade balance (left sc.)CA trade balance (left sc.)
-20,000
-15,000
-10,000
-5,000
0
5,000
10,000
15,000
20,000
25,000
30,000
1996
1997
1998
1999
2000
2001
2002
2003
2004
2005
2006
(tho
usan
ds e
uros
)
-12.0-10.0-8.0-6.0-4.0-2.00.02.04.06.08.010.012.0
(% G
DP)
Percentage of total employmentby company size
Number ofpeople MICRO SME LARGE
employed (1 to 9 (10 to 249 (250 or more(thousands of employees) employees) people
people) employees)
EU-27 125,000 29.5 37.6 33.0Germany 20,687 19.2 40.9 39.9United Kingdom 17,993 21.1 32.8 46.1Italy 14,687 46.9 34.3 18.8France 14,287 23.6 37.3 39.1Spain 12,839 38.9 40.2 20.9Sweden 2,578 26.3 37.9 35.8
Source: Eurostat Yearbook 2008
Employees by size of company in 2004(except financial sector)
3 The lack of coordination between different agents leads to: i) a doubling of the resourceschanneled towards R&D activities; ii) the existence of a critical research mass thatreduces the capacity to compete in international research projects; and iii) littleknowledge transfer from public research centers to the private sector, thus limitingpublic-private collaboration in R&D.4 According to the INE, 23.5% of all industrial and service companies with ten or moreemployees in Spain.5 Total spending on R&D has tripled in the last quarter of a century.
significantly conditions the innovative effort of Spanishcompanies, given that innovative activity involves, among otherthings, high fixed R&D costs, the use of economies of scaleand access to external sources of finance.
Economic literature6 shows how in the long term a country’scompetitiveness and welfare (measured in terms of its GDPper capita) are to a large extent determined by technologicalprocess, so the potential growth rate of the Spanish economyover the coming years will depend significantly on theeconomic policy measures that create incentives for R&D inthe private sector.
ReferencesAghion, P. and Howitt, P. (2007), “Capital, innovation, and growth accounting”,
Oxford Review of Economic Policy, vol 23, nº 1, pp 79-93.
Buesa, M. (2006), “El Sistema Nacional de Innovación en España, 20 añosde la Ley de la Ciencia 1986-2006”. Revista de Investigación eInnovación Empresarial, December.
Coe, D. T. and Helpman, E. (1995), “Convergence in international output”,Journal of Applied Econometrics, 10(1), pp 97-108.
Fagerberg, J. (1996), “Technology and competitiveness”, Oxford Review ofEconomic Policy , 12( 3), pp 39-51.
Fagerberg, J. (2007), “The dynamics of technology, growth and trade: Aschumpeterian perspective”, in H. Hanusch and A. Pyka (eds.), ElgarCompanion to Neo-Schumpeterian Economics. Edward ElgarPublishing.
Fagerberg, J. and Srholec, M. (2009): “Innovation Systems, Technologyand Development: Unpacking the Relationship(s)”, in B. A. Lundvall,K. J. Joseph, C. Chaminade, and J. Vang (eds.), Handbook ofInnovation Systems and Developing Countries. Building DomesticCapabilities in a Global Context, Cheltenham, Edward Elgar.
Kaldor, N. (1978), “The effect of devaluations on trade in manufactures”,Further Essays on Applied Economics, London.
Maddison, A. (1996), The world economy 1820-1992, analysis and statistics,Paris, OECD.
Pérez, F.; Goerlich, F. and Mas, M. (1996), Capitalización y crecimiento enEspaña y sus regiones 1955-1995, Bilbao, Fundación BBVA.
SpainWatch
23
6 The work of Coe and Helpman (1995), Maddison (1996), Aghion and Howitt (2007) andFagerberg and Srholec (2009) demonstrates a positive correlation between technicalprogress and economic growth. For their part, Pérez, Goerlich and Mas (1996) found thatin the Spanish case the exogenous factor explained more than 70% of growth.
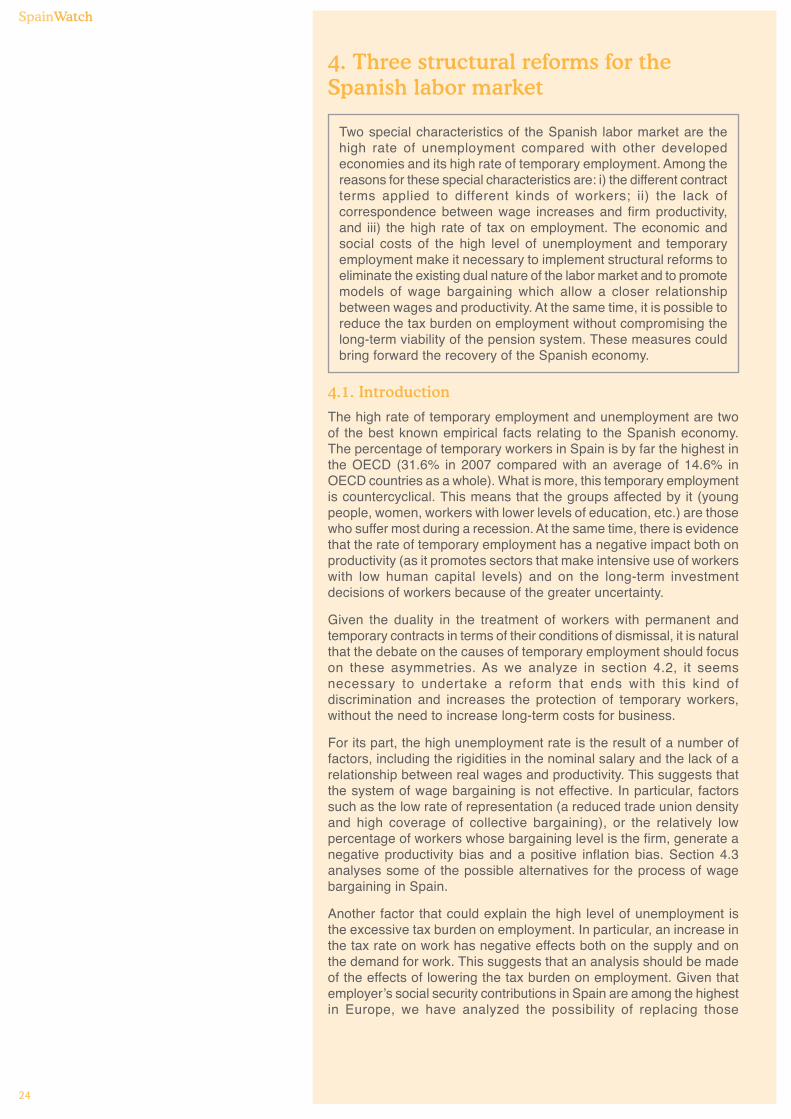
SpainWatch
24
4. Three structural reforms for theSpanish labor market
Two special characteristics of the Spanish labor market are thehigh rate of unemployment compared with other developedeconomies and its high rate of temporary employment. Among thereasons for these special characteristics are: i) the different contractterms applied to different kinds of workers; ii) the lack ofcorrespondence between wage increases and firm productivity,and iii) the high rate of tax on employment. The economic andsocial costs of the high level of unemployment and temporaryemployment make it necessary to implement structural reforms toeliminate the existing dual nature of the labor market and to promotemodels of wage bargaining which allow a closer relationshipbetween wages and productivity. At the same time, it is possible toreduce the tax burden on employment without compromising thelong-term viability of the pension system. These measures couldbring forward the recovery of the Spanish economy.
4.1. Introduction
The high rate of temporary employment and unemployment are twoof the best known empirical facts relating to the Spanish economy.The percentage of temporary workers in Spain is by far the highest inthe OECD (31.6% in 2007 compared with an average of 14.6% inOECD countries as a whole). What is more, this temporary employmentis countercyclical. This means that the groups affected by it (youngpeople, women, workers with lower levels of education, etc.) are thosewho suffer most during a recession. At the same time, there is evidencethat the rate of temporary employment has a negative impact both onproductivity (as it promotes sectors that make intensive use of workerswith low human capital levels) and on the long-term investmentdecisions of workers because of the greater uncertainty.
Given the duality in the treatment of workers with permanent andtemporary contracts in terms of their conditions of dismissal, it is naturalthat the debate on the causes of temporary employment should focuson these asymmetries. As we analyze in section 4.2, it seemsnecessary to undertake a reform that ends with this kind ofdiscrimination and increases the protection of temporary workers,without the need to increase long-term costs for business.
For its part, the high unemployment rate is the result of a number offactors, including the rigidities in the nominal salary and the lack of arelationship between real wages and productivity. This suggests thatthe system of wage bargaining is not effective. In particular, factorssuch as the low rate of representation (a reduced trade union densityand high coverage of collective bargaining), or the relatively lowpercentage of workers whose bargaining level is the firm, generate anegative productivity bias and a positive inflation bias. Section 4.3analyses some of the possible alternatives for the process of wagebargaining in Spain.
Another factor that could explain the high level of unemployment isthe excessive tax burden on employment. In particular, an increase inthe tax rate on work has negative effects both on the supply and onthe demand for work. This suggests that an analysis should be madeof the effects of lowering the tax burden on employment. Given thatemployer’s social security contributions in Spain are among the highestin Europe, we have analyzed the possibility of replacing those
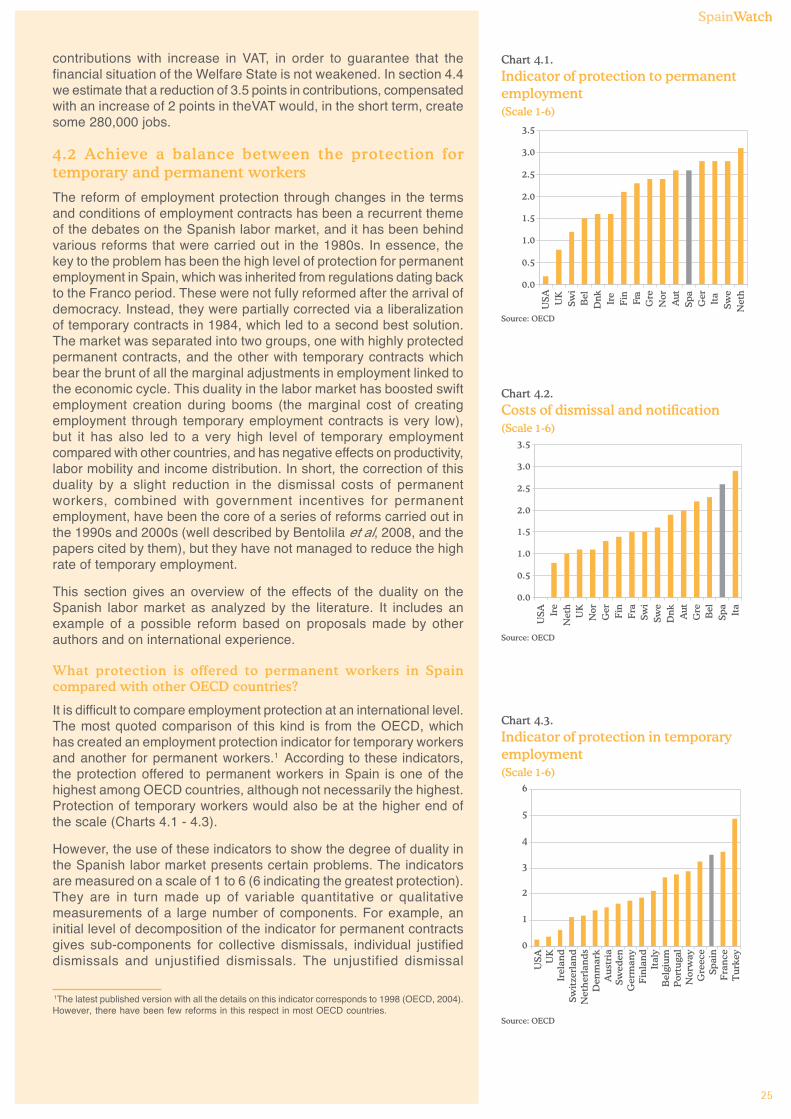
SpainWatch
25
contributions with increase in VAT, in order to guarantee that thefinancial situation of the Welfare State is not weakened. In section 4.4we estimate that a reduction of 3.5 points in contributions, compensatedwith an increase of 2 points in theVAT would, in the short term, createsome 280,000 jobs.
4.2 Achieve a balance between the protection fortemporary and permanent workers
The reform of employment protection through changes in the termsand conditions of employment contracts has been a recurrent themeof the debates on the Spanish labor market, and it has been behindvarious reforms that were carried out in the 1980s. In essence, thekey to the problem has been the high level of protection for permanentemployment in Spain, which was inherited from regulations dating backto the Franco period. These were not fully reformed after the arrival ofdemocracy. Instead, they were partially corrected via a liberalizationof temporary contracts in 1984, which led to a second best solution.The market was separated into two groups, one with highly protectedpermanent contracts, and the other with temporary contracts whichbear the brunt of all the marginal adjustments in employment linked tothe economic cycle. This duality in the labor market has boosted swiftemployment creation during booms (the marginal cost of creatingemployment through temporary employment contracts is very low),but it has also led to a very high level of temporary employmentcompared with other countries, and has negative effects on productivity,labor mobility and income distribution. In short, the correction of thisduality by a slight reduction in the dismissal costs of permanentworkers, combined with government incentives for permanentemployment, have been the core of a series of reforms carried out inthe 1990s and 2000s (well described by Bentolila et al, 2008, and thepapers cited by them), but they have not managed to reduce the highrate of temporary employment.
This section gives an overview of the effects of the duality on theSpanish labor market as analyzed by the literature. It includes anexample of a possible reform based on proposals made by otherauthors and on international experience.
What protection is offered to permanent workers in Spaincompared with other OECD countries?
It is difficult to compare employment protection at an international level.The most quoted comparison of this kind is from the OECD, whichhas created an employment protection indicator for temporary workersand another for permanent workers.1 According to these indicators,the protection offered to permanent workers in Spain is one of thehighest among OECD countries, although not necessarily the highest.Protection of temporary workers would also be at the higher end ofthe scale (Charts 4.1 - 4.3).
However, the use of these indicators to show the degree of duality inthe Spanish labor market presents certain problems. The indicatorsare measured on a scale of 1 to 6 (6 indicating the greatest protection).They are in turn made up of variable quantitative or qualitativemeasurements of a large number of components. For example, aninitial level of decomposition of the indicator for permanent contractsgives sub-components for collective dismissals, individual justifieddismissals and unjustified dismissals. The unjustified dismissal
1The latest published version with all the details on this indicator corresponds to 1998 (OECD, 2004).However, there have been few reforms in this respect in most OECD countries.
Chart 4.1.
Indicator of protection to permanentemployment(Scale 1-6)
Source: OECD
0.0
0.5
1.0
1.5
2.0
2.5
3.0
3.5
USA UK
Swi
Bel
Dn
kIr
eF
in Fra
Gre
Nor
Aut
Spa
Ger Ita
Swe
Net
h
Chart 4.2.
Costs of dismissal and notification(Scale 1-6)
Source: OECD
0.0
0.5
1.0
1.5
2.0
2.5
3.0
3.5
USA Ir
eN
eth
UK
Nor
Ger Fin
Fra
Swi
Swe
Dn
kA
utG
re Bel
Spa
Ita
Chart 4.3.
Indicator of protection in temporaryemployment(Scale 1-6)
Source: OECD
0
1
2
3
4
5
6
US
AU
KIr
elan
dS
wit
zerl
and
Net
her
lan
ds
Den
mar
kA
ust
ria
Sw
eden
Ger
man
yF
inla
nd
Ital
yB
elgi
um
Por
tuga
lN
orw
ayG
reec
eS
pai
nF
ran
ceT
urk
ey
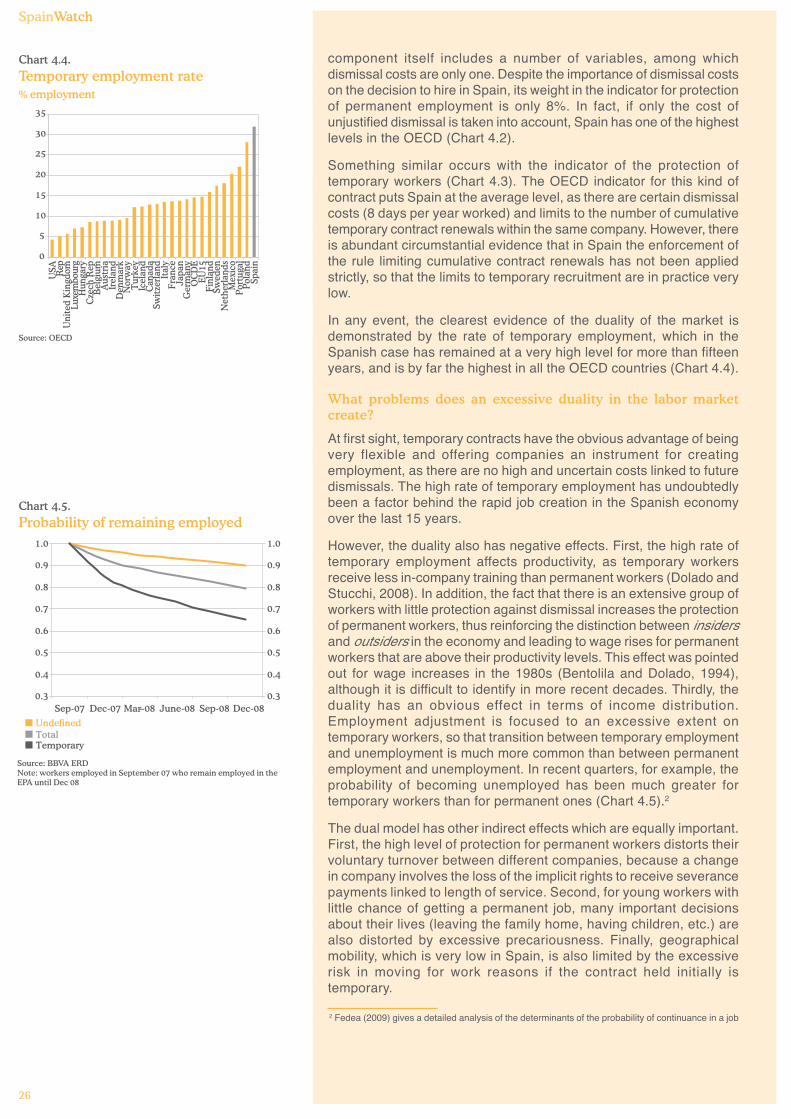
SpainWatch
26
component itself includes a number of variables, among whichdismissal costs are only one. Despite the importance of dismissal costson the decision to hire in Spain, its weight in the indicator for protectionof permanent employment is only 8%. In fact, if only the cost ofunjustified dismissal is taken into account, Spain has one of the highestlevels in the OECD (Chart 4.2).
Something similar occurs with the indicator of the protection oftemporary workers (Chart 4.3). The OECD indicator for this kind ofcontract puts Spain at the average level, as there are certain dismissalcosts (8 days per year worked) and limits to the number of cumulativetemporary contract renewals within the same company. However, thereis abundant circumstantial evidence that in Spain the enforcement ofthe rule limiting cumulative contract renewals has not been appliedstrictly, so that the limits to temporary recruitment are in practice verylow.
In any event, the clearest evidence of the duality of the market isdemonstrated by the rate of temporary employment, which in theSpanish case has remained at a very high level for more than fifteenyears, and is by far the highest in all the OECD countries (Chart 4.4).
What problems does an excessive duality in the labor marketcreate?
At first sight, temporary contracts have the obvious advantage of beingvery flexible and offering companies an instrument for creatingemployment, as there are no high and uncertain costs linked to futuredismissals. The high rate of temporary employment has undoubtedlybeen a factor behind the rapid job creation in the Spanish economyover the last 15 years.
However, the duality also has negative effects. First, the high rate oftemporary employment affects productivity, as temporary workersreceive less in-company training than permanent workers (Dolado andStucchi, 2008). In addition, the fact that there is an extensive group ofworkers with little protection against dismissal increases the protectionof permanent workers, thus reinforcing the distinction between insidersand outsiders in the economy and leading to wage rises for permanentworkers that are above their productivity levels. This effect was pointedout for wage increases in the 1980s (Bentolila and Dolado, 1994),although it is difficult to identify in more recent decades. Thirdly, theduality has an obvious effect in terms of income distribution.Employment adjustment is focused to an excessive extent ontemporary workers, so that transition between temporary employmentand unemployment is much more common than between permanentemployment and unemployment. In recent quarters, for example, theprobability of becoming unemployed has been much greater fortemporary workers than for permanent ones (Chart 4.5).2
The dual model has other indirect effects which are equally important.First, the high level of protection for permanent workers distorts theirvoluntary turnover between different companies, because a changein company involves the loss of the implicit rights to receive severancepayments linked to length of service. Second, for young workers withlittle chance of getting a permanent job, many important decisionsabout their lives (leaving the family home, having children, etc.) arealso distorted by excessive precariousness. Finally, geographicalmobility, which is very low in Spain, is also limited by the excessiverisk in moving for work reasons if the contract held initially istemporary.
Chart 4.4.
Temporary employment rate% employment
Source: OECD
0
5
10
15
20
25
30
35
USA Rep
Uni
ted
Kin
gdom
Luxe
mbo
urg
Hun
gary
Cze
ch R
epB
elgi
umA
ustr
iaIr
elan
dD
enm
ark
Nor
way
Tur
key
Icel
and
Can
ada
Swit
zerl
and
Ital
yFr
ance
Japa
nG
erm
any
OC
DE
EU15
Finl
and
Swed
enN
ethe
rlan
ds M
exic
oPo
rtug
alPo
land
Spai
n
Chart 4.5.
Probability of remaining employed
Source: BBVA ERDNote: workers employed in September 07 who remain employed in theEPA until Dec 08
0.3
0.4
0.5
0.6
0.7
0.8
0.9
1.0
Sep-07 Dec-07 Mar-08- June-08 Sep-08 Dec-08
UndefinedTotalTemporary
0.3
0.4
0.5
0.6
0.7
0.8
0.9
1.0
2 Fedea (2009) gives a detailed analysis of the determinants of the probability of continuance in a job
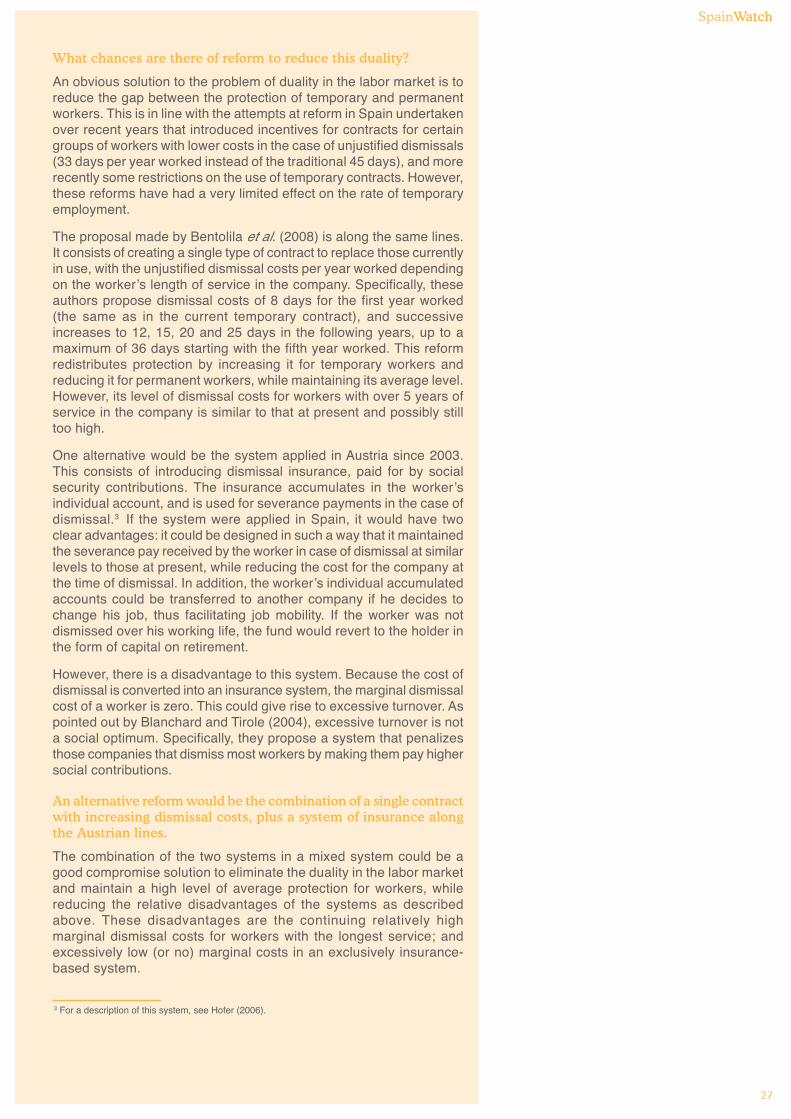
SpainWatch
27
What chances are there of reform to reduce this duality?
An obvious solution to the problem of duality in the labor market is toreduce the gap between the protection of temporary and permanentworkers. This is in line with the attempts at reform in Spain undertakenover recent years that introduced incentives for contracts for certaingroups of workers with lower costs in the case of unjustified dismissals(33 days per year worked instead of the traditional 45 days), and morerecently some restrictions on the use of temporary contracts. However,these reforms have had a very limited effect on the rate of temporaryemployment.
The proposal made by Bentolila et al. (2008) is along the same lines.It consists of creating a single type of contract to replace those currentlyin use, with the unjustified dismissal costs per year worked dependingon the worker’s length of service in the company. Specifically, theseauthors propose dismissal costs of 8 days for the first year worked(the same as in the current temporary contract), and successiveincreases to 12, 15, 20 and 25 days in the following years, up to amaximum of 36 days starting with the fifth year worked. This reformredistributes protection by increasing it for temporary workers andreducing it for permanent workers, while maintaining its average level.However, its level of dismissal costs for workers with over 5 years ofservice in the company is similar to that at present and possibly stilltoo high.
One alternative would be the system applied in Austria since 2003.This consists of introducing dismissal insurance, paid for by socialsecurity contributions. The insurance accumulates in the worker’sindividual account, and is used for severance payments in the case ofdismissal.3 If the system were applied in Spain, it would have twoclear advantages: it could be designed in such a way that it maintainedthe severance pay received by the worker in case of dismissal at similarlevels to those at present, while reducing the cost for the company atthe time of dismissal. In addition, the worker’s individual accumulatedaccounts could be transferred to another company if he decides tochange his job, thus facilitating job mobility. If the worker was notdismissed over his working life, the fund would revert to the holder inthe form of capital on retirement.
However, there is a disadvantage to this system. Because the cost ofdismissal is converted into an insurance system, the marginal dismissalcost of a worker is zero. This could give rise to excessive turnover. Aspointed out by Blanchard and Tirole (2004), excessive turnover is nota social optimum. Specifically, they propose a system that penalizesthose companies that dismiss most workers by making them pay highersocial contributions.
An alternative reform would be the combination of a single contractwith increasing dismissal costs, plus a system of insurance alongthe Austrian lines.
The combination of the two systems in a mixed system could be agood compromise solution to eliminate the duality in the labor marketand maintain a high level of average protection for workers, whilereducing the relative disadvantages of the systems as describedabove. These disadvantages are the continuing relatively highmarginal dismissal costs for workers with the longest service; andexcessively low (or no) marginal costs in an exclusively insurance-based system.
3 For a description of this system, see Hofer (2006).
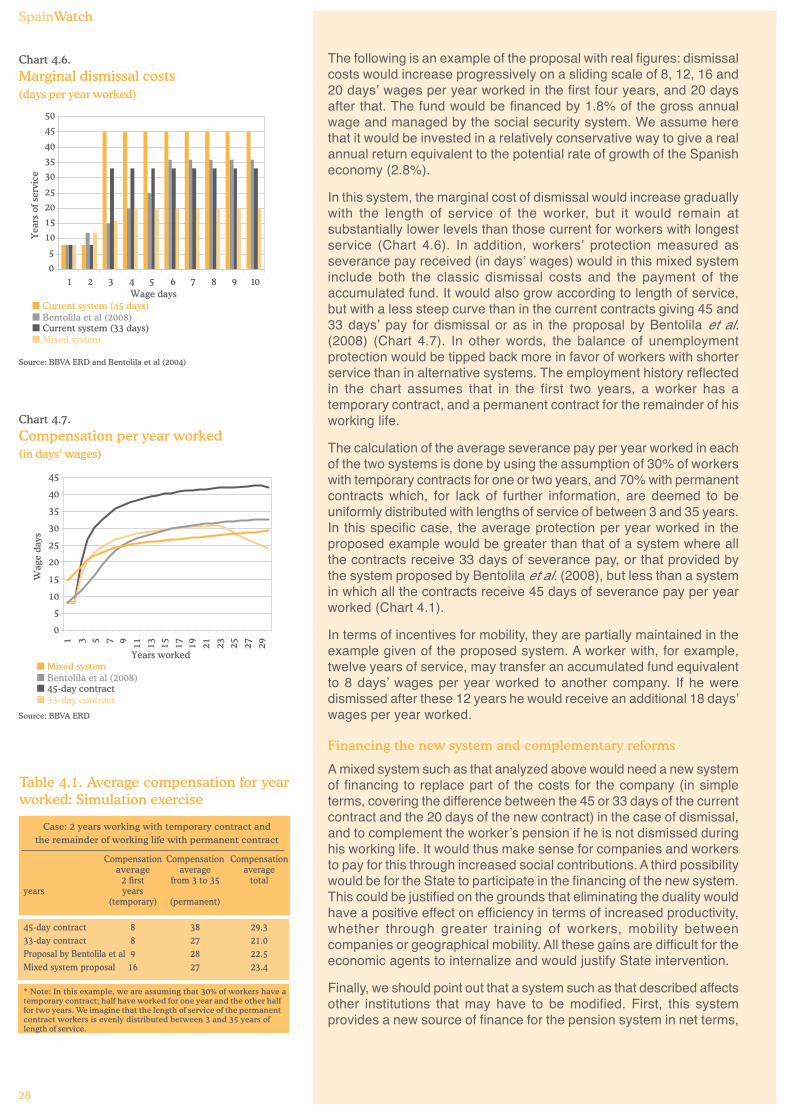
SpainWatch
28
The following is an example of the proposal with real figures: dismissalcosts would increase progressively on a sliding scale of 8, 12, 16 and20 days’ wages per year worked in the first four years, and 20 daysafter that. The fund would be financed by 1.8% of the gross annualwage and managed by the social security system. We assume herethat it would be invested in a relatively conservative way to give a realannual return equivalent to the potential rate of growth of the Spanisheconomy (2.8%).
In this system, the marginal cost of dismissal would increase graduallywith the length of service of the worker, but it would remain atsubstantially lower levels than those current for workers with longestservice (Chart 4.6). In addition, workers’ protection measured asseverance pay received (in days’ wages) would in this mixed systeminclude both the classic dismissal costs and the payment of theaccumulated fund. It would also grow according to length of service,but with a less steep curve than in the current contracts giving 45 and33 days’ pay for dismissal or as in the proposal by Bentolila et al.(2008) (Chart 4.7). In other words, the balance of unemploymentprotection would be tipped back more in favor of workers with shorterservice than in alternative systems. The employment history reflectedin the chart assumes that in the first two years, a worker has atemporary contract, and a permanent contract for the remainder of hisworking life.
The calculation of the average severance pay per year worked in eachof the two systems is done by using the assumption of 30% of workerswith temporary contracts for one or two years, and 70% with permanentcontracts which, for lack of further information, are deemed to beuniformly distributed with lengths of service of between 3 and 35 years.In this specific case, the average protection per year worked in theproposed example would be greater than that of a system where allthe contracts receive 33 days of severance pay, or that provided bythe system proposed by Bentolila et al. (2008), but less than a systemin which all the contracts receive 45 days of severance pay per yearworked (Chart 4.1).
In terms of incentives for mobility, they are partially maintained in theexample given of the proposed system. A worker with, for example,twelve years of service, may transfer an accumulated fund equivalentto 8 days’ wages per year worked to another company. If he weredismissed after these 12 years he would receive an additional 18 days’wages per year worked.
Financing the new system and complementary reforms
A mixed system such as that analyzed above would need a new systemof financing to replace part of the costs for the company (in simpleterms, covering the difference between the 45 or 33 days of the currentcontract and the 20 days of the new contract) in the case of dismissal,and to complement the worker’s pension if he is not dismissed duringhis working life. It would thus make sense for companies and workersto pay for this through increased social contributions. A third possibilitywould be for the State to participate in the financing of the new system.This could be justified on the grounds that eliminating the duality wouldhave a positive effect on efficiency in terms of increased productivity,whether through greater training of workers, mobility betweencompanies or geographical mobility. All these gains are difficult for theeconomic agents to internalize and would justify State intervention.
Finally, we should point out that a system such as that described affectsother institutions that may have to be modified. First, this systemprovides a new source of finance for the pension system in net terms,
Case: 2 years working with temporary contract andthe remainder of working life with permanent contract
Compensation Compensation Compensationaverage average average
2 first from 3 to 35 totalyears years
(temporary) (permanent)
45-day contract 8 38 29.333-day contract 8 27 21.0Proposal by Bentolila et al 9 28 22.5Mixed system proposal 16 27 23.4
* Note: In this example, we are assuming that 30% of workers have atemporary contract; half have worked for one year and the other halffor two years. We imagine that the length of service of the permanentcontract workers is evenly distributed between 3 and 35 years oflength of service.
Table 4.1. Average compensation for yearworked: Simulation exercise
Chart 4.6.
Marginal dismissal costs(days per year worked)
Source: BBVA ERD and Bentolila et al (2004)
Current system (45 days)Bentolila et al (2008)Current system (33 days)
0
5
10
15
20
25
30
35
40
45
50
1 2 3 4 5 6 7 8 9 10Wage days
Yea
rs o
f ser
vice
Mixed system
Chart 4.7.
Compensation per year worked(in days’ wages)
Source: BBVA ERD
Mixed systemBentolila et al (2008)45-day contract33-day contract
0
5
10
15
20
25
30
35
40
45
1 3 5 7 9 11 13 15 17 19 21 23 25 27 29
Years worked
Wag
e d
ays
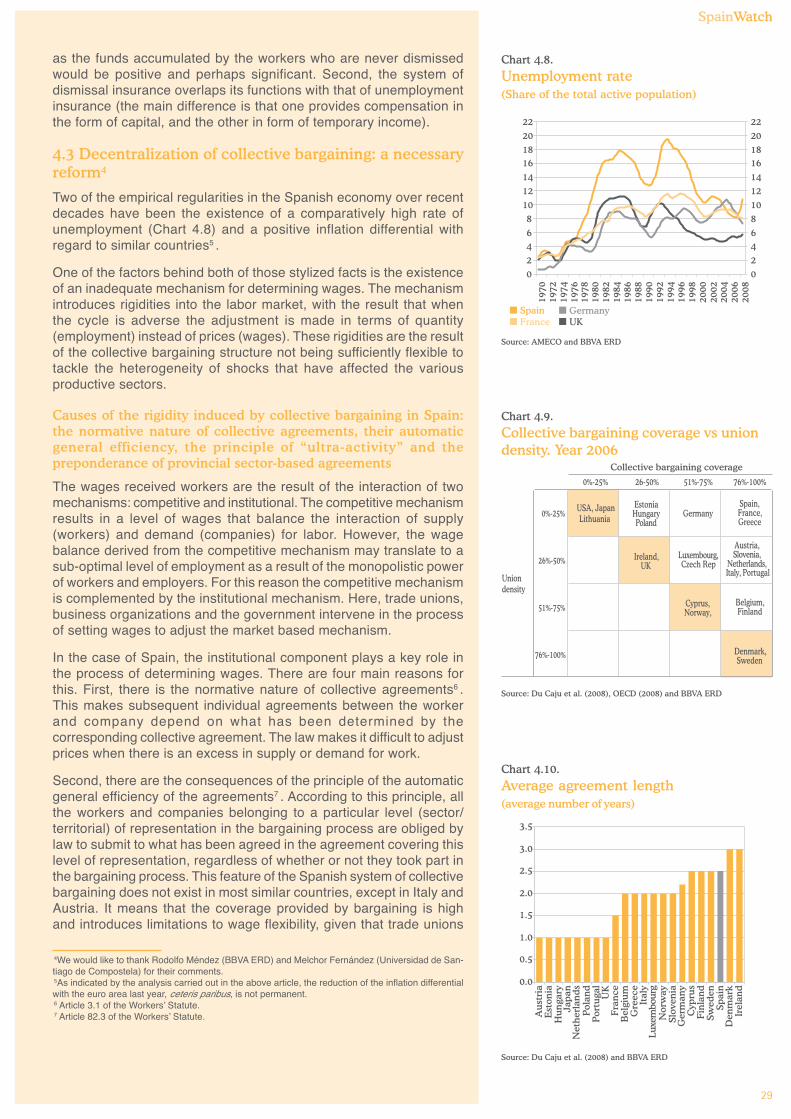
SpainWatch
29
as the funds accumulated by the workers who are never dismissedwould be positive and perhaps significant. Second, the system ofdismissal insurance overlaps its functions with that of unemploymentinsurance (the main difference is that one provides compensation inthe form of capital, and the other in form of temporary income).
4.3 Decentralization of collective bargaining: a necessaryreform4
Two of the empirical regularities in the Spanish economy over recentdecades have been the existence of a comparatively high rate ofunemployment (Chart 4.8) and a positive inflation differential withregard to similar countries5 .
One of the factors behind both of those stylized facts is the existenceof an inadequate mechanism for determining wages. The mechanismintroduces rigidities into the labor market, with the result that whenthe cycle is adverse the adjustment is made in terms of quantity(employment) instead of prices (wages). These rigidities are the resultof the collective bargaining structure not being sufficiently flexible totackle the heterogeneity of shocks that have affected the variousproductive sectors.
Causes of the rigidity induced by collective bargaining in Spain:the normative nature of collective agreements, their automaticgeneral efficiency, the principle of “ultra-activity” and thepreponderance of provincial sector-based agreements
The wages received workers are the result of the interaction of twomechanisms: competitive and institutional. The competitive mechanismresults in a level of wages that balance the interaction of supply(workers) and demand (companies) for labor. However, the wagebalance derived from the competitive mechanism may translate to asub-optimal level of employment as a result of the monopolistic powerof workers and employers. For this reason the competitive mechanismis complemented by the institutional mechanism. Here, trade unions,business organizations and the government intervene in the processof setting wages to adjust the market based mechanism.
In the case of Spain, the institutional component plays a key role inthe process of determining wages. There are four main reasons forthis. First, there is the normative nature of collective agreements6 .This makes subsequent individual agreements between the workerand company depend on what has been determined by thecorresponding collective agreement. The law makes it difficult to adjustprices when there is an excess in supply or demand for work.
Second, there are the consequences of the principle of the automaticgeneral efficiency of the agreements7 . According to this principle, allthe workers and companies belonging to a particular level (sector/territorial) of representation in the bargaining process are obliged bylaw to submit to what has been agreed in the agreement covering thislevel of representation, regardless of whether or not they took part inthe bargaining process. This feature of the Spanish system of collectivebargaining does not exist in most similar countries, except in Italy andAustria. It means that the coverage provided by bargaining is highand introduces limitations to wage flexibility, given that trade unions
Chart 4.8.
Unemployment rate(Share of the total active population)
Source: AMECO and BBVA ERD
SpainFrance
GermanyUK
02468
10121416182022
1970
1972
1974
1976
1978
1980
1982
1984
1986
1988
1990
1992
1994
1996
1998
2000
2002
2004
2006
2008
0246810121416182022
Chart 4.10.
Average agreement length(average number of years)
Source: Du Caju et al. (2008) and BBVA ERD
0.0
0.5
1.0
1.5
2.0
2.5
3.0
3.5
Au
stri
aE
ston
iaH
un
gary
Jap
anN
eth
erla
nd
sP
olan
dP
ortu
gal
UK
Fra
nce
Bel
giu
mG
reec
eIt
aly
Luxe
mbo
urg
Nor
way
Slov
enia
Ger
man
yC
ypru
sF
inla
nd
Swed
enSp
ain
Den
mar
kIr
elan
d
0%-25% 26-50% 51%-75% 76%-100%
0%-25% USA, JapanLithuania
EstoniaHungaryPoland
GermanySpain,France,Greece
26%-50% Ireland,UK
Luxembourg,Czech Rep
Austria,Slovenia,
Netherlands,
51%-75% Cyprus,Norway,
Belgium,Finland
76%-100% Denmark,Sweden
Union density
Collective bargaining coverage
Italy, Portugal
Chart 4.9.
Collective bargaining coverage vs uniondensity. Year 2006
Source: Du Caju et al. (2008), OECD (2008) and BBVA ERD
4We would like to thank Rodolfo Méndez (BBVA ERD) and Melchor Fernández (Universidad de San-tiago de Compostela) for their comments.5As indicated by the analysis carried out in the above article, the reduction of the inflation differentialwith the euro area last year, ceteris paribus, is not permanent.6 Article 3.1 of the Workers’ Statute.7 Article 82.3 of the Workers’ Statute.
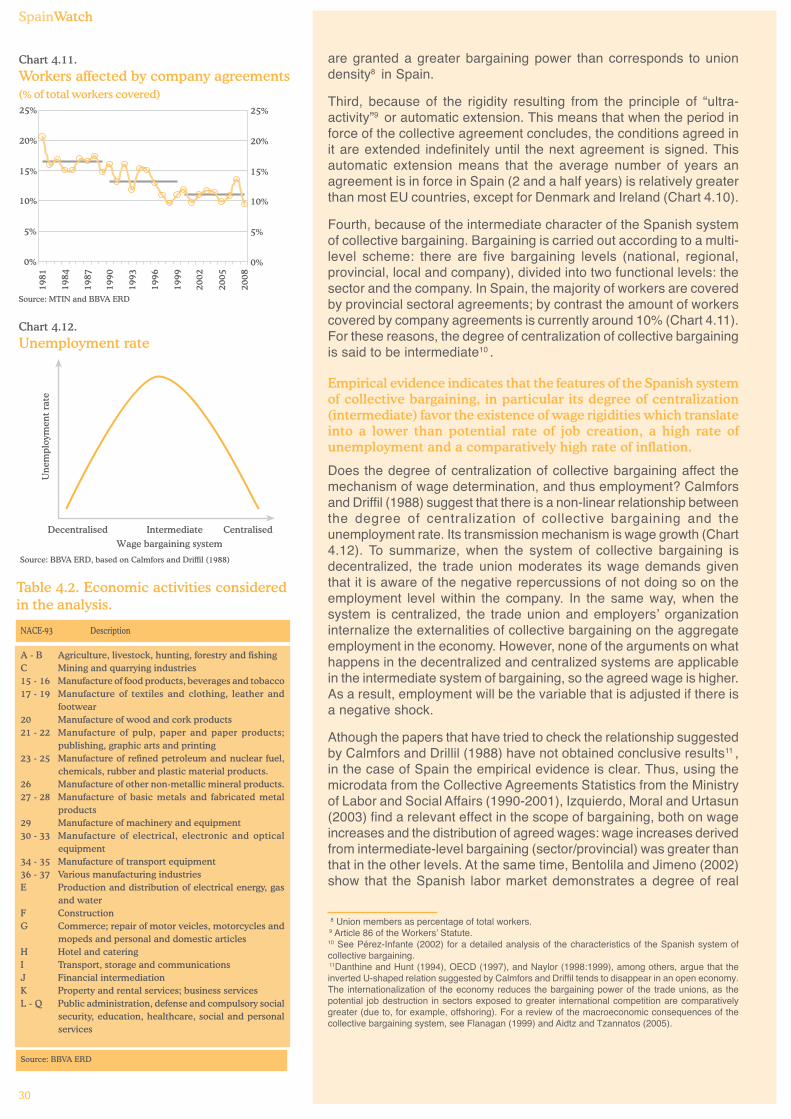
SpainWatch
30
are granted a greater bargaining power than corresponds to uniondensity8 in Spain.
Third, because of the rigidity resulting from the principle of “ultra-activity”9 or automatic extension. This means that when the period inforce of the collective agreement concludes, the conditions agreed init are extended indefinitely until the next agreement is signed. Thisautomatic extension means that the average number of years anagreement is in force in Spain (2 and a half years) is relatively greaterthan most EU countries, except for Denmark and Ireland (Chart 4.10).
Fourth, because of the intermediate character of the Spanish systemof collective bargaining. Bargaining is carried out according to a multi-level scheme: there are five bargaining levels (national, regional,provincial, local and company), divided into two functional levels: thesector and the company. In Spain, the majority of workers are coveredby provincial sectoral agreements; by contrast the amount of workerscovered by company agreements is currently around 10% (Chart 4.11).For these reasons, the degree of centralization of collective bargainingis said to be intermediate10 .
Empirical evidence indicates that the features of the Spanish systemof collective bargaining, in particular its degree of centralization(intermediate) favor the existence of wage rigidities which translateinto a lower than potential rate of job creation, a high rate ofunemployment and a comparatively high rate of inflation.
Does the degree of centralization of collective bargaining affect themechanism of wage determination, and thus employment? Calmforsand Driffil (1988) suggest that there is a non-linear relationship betweenthe degree of centralization of collective bargaining and theunemployment rate. Its transmission mechanism is wage growth (Chart4.12). To summarize, when the system of collective bargaining isdecentralized, the trade union moderates its wage demands giventhat it is aware of the negative repercussions of not doing so on theemployment level within the company. In the same way, when thesystem is centralized, the trade union and employers’ organizationinternalize the externalities of collective bargaining on the aggregateemployment in the economy. However, none of the arguments on whathappens in the decentralized and centralized systems are applicablein the intermediate system of bargaining, so the agreed wage is higher.As a result, employment will be the variable that is adjusted if there isa negative shock.
Athough the papers that have tried to check the relationship suggestedby Calmfors and Drillil (1988) have not obtained conclusive results11 ,in the case of Spain the empirical evidence is clear. Thus, using themicrodata from the Collective Agreements Statistics from the Ministryof Labor and Social Affairs (1990-2001), Izquierdo, Moral and Urtasun(2003) find a relevant effect in the scope of bargaining, both on wageincreases and the distribution of agreed wages: wage increases derivedfrom intermediate-level bargaining (sector/provincial) was greater thanthat in the other levels. At the same time, Bentolila and Jimeno (2002)show that the Spanish labor market demonstrates a degree of real
8 Union members as percentage of total workers.9 Article 86 of the Workers’ Statute.10 See Pérez-Infante (2002) for a detailed analysis of the characteristics of the Spanish system ofcollective bargaining.11Danthine and Hunt (1994), OECD (1997), and Naylor (1998:1999), among others, argue that theinverted U-shaped relation suggested by Calmfors and Driffil tends to disappear in an open economy.The internationalization of the economy reduces the bargaining power of the trade unions, as thepotential job destruction in sectors exposed to greater international competition are comparativelygreater (due to, for example, offshoring). For a review of the macroeconomic consequences of thecollective bargaining system, see Flanagan (1999) and Aidtz and Tzannatos (2005).
NACE-93 Description
A - B Agriculture, livestock, hunting, forestry and fishingC Mining and quarrying industries15 - 16 Manufacture of food products, beverages and tobacco17 - 19 Manufacture of textiles and clothing, leather and
footwear20 Manufacture of wood and cork products21 - 22 Manufacture of pulp, paper and paper products;
publishing, graphic arts and printing23 - 25 Manufacture of refined petroleum and nuclear fuel,
chemicals, rubber and plastic material products.26 Manufacture of other non-metallic mineral products.27 - 28 Manufacture of basic metals and fabricated metal
products29 Manufacture of machinery and equipment30 - 33 Manufacture of electrical, electronic and optical
equipment34 - 35 Manufacture of transport equipment36 - 37 Various manufacturing industriesE Production and distribution of electrical energy, gas
and waterF ConstructionG Commerce; repair of motor veicles, motorcycles and
mopeds and personal and domestic articlesH Hotel and cateringI Transport, storage and communicationsJ Financial intermediationK Property and rental services; business servicesL - Q Public administration, defense and compulsory social
security, education, healthcare, social and personalservices
Source: BBVA ERD
Table 4.2. Economic activities consideredin the analysis.
Chart 4.12.
Unemployment rate
Source: BBVA ERD, based on Calmfors and Driffil (1988)
Decentralised Intermediate Centralised
Wage bargaining system
Un
empl
oym
ent
rate
Chart 4.11.
Workers affected by company agreements(% of total workers covered)
Source: MTIN and BBVA ERD
0%
5%
10%
15%
20%
25%
1981
1984
1987
1990
1993
1996
1999
2002
2005
2008
0%
5%
10%
15%
20%
25%
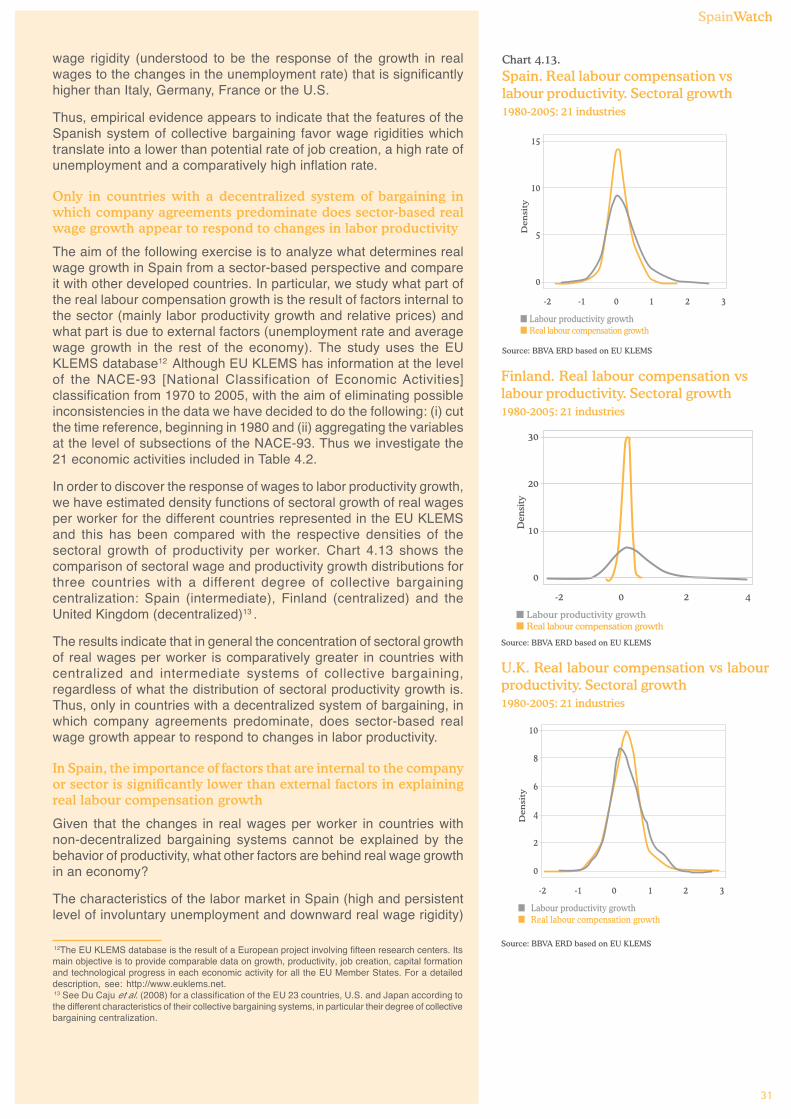
SpainWatch
31
wage rigidity (understood to be the response of the growth in realwages to the changes in the unemployment rate) that is significantlyhigher than Italy, Germany, France or the U.S.
Thus, empirical evidence appears to indicate that the features of theSpanish system of collective bargaining favor wage rigidities whichtranslate into a lower than potential rate of job creation, a high rate ofunemployment and a comparatively high inflation rate.
Only in countries with a decentralized system of bargaining inwhich company agreements predominate does sector-based realwage growth appear to respond to changes in labor productivity
The aim of the following exercise is to analyze what determines realwage growth in Spain from a sector-based perspective and compareit with other developed countries. In particular, we study what part ofthe real labour compensation growth is the result of factors internal tothe sector (mainly labor productivity growth and relative prices) andwhat part is due to external factors (unemployment rate and averagewage growth in the rest of the economy). The study uses the EUKLEMS database12 Although EU KLEMS has information at the levelof the NACE-93 [National Classification of Economic Activities]classification from 1970 to 2005, with the aim of eliminating possibleinconsistencies in the data we have decided to do the following: (i) cutthe time reference, beginning in 1980 and (ii) aggregating the variablesat the level of subsections of the NACE-93. Thus we investigate the21 economic activities included in Table 4.2.
In order to discover the response of wages to labor productivity growth,we have estimated density functions of sectoral growth of real wagesper worker for the different countries represented in the EU KLEMSand this has been compared with the respective densities of thesectoral growth of productivity per worker. Chart 4.13 shows thecomparison of sectoral wage and productivity growth distributions forthree countries with a different degree of collective bargainingcentralization: Spain (intermediate), Finland (centralized) and theUnited Kingdom (decentralized)13 .
The results indicate that in general the concentration of sectoral growthof real wages per worker is comparatively greater in countries withcentralized and intermediate systems of collective bargaining,regardless of what the distribution of sectoral productivity growth is.Thus, only in countries with a decentralized system of bargaining, inwhich company agreements predominate, does sector-based realwage growth appear to respond to changes in labor productivity.
In Spain, the importance of factors that are internal to the companyor sector is significantly lower than external factors in explainingreal labour compensation growth
Given that the changes in real wages per worker in countries withnon-decentralized bargaining systems cannot be explained by thebehavior of productivity, what other factors are behind real wage growthin an economy?
The characteristics of the labor market in Spain (high and persistentlevel of involuntary unemployment and downward real wage rigidity)
12The EU KLEMS database is the result of a European project involving fifteen research centers. Itsmain objective is to provide comparable data on growth, productivity, job creation, capital formationand technological progress in each economic activity for all the EU Member States. For a detaileddescription, see: http://www.euklems.net.13 See Du Caju et al. (2008) for a classification of the EU 23 countries, U.S. and Japan according tothe different characteristics of their collective bargaining systems, in particular their degree of collectivebargaining centralization.
Chart 4.13.
Spain. Real labour compensation vslabour productivity. Sectoral growth1980-2005: 21 industries
Source: BBVA ERD based on EU KLEMS
15
10
5
0
-2 -1 0 1 2 3
Den
sity
Labour productivity growthReal labour compensation growth
U.K. Real labour compensation vs labourproductivity. Sectoral growth1980-2005: 21 industries
Source: BBVA ERD based on EU KLEMS
10
8
6
4
2
0
-2 -1 2 3
Den
sity
Labour productivity growthReal labour compensation growth
0 1
Finland. Real labour compensation vslabour productivity. Sectoral growth1980-2005: 21 industries
Source: BBVA ERD based on EU KLEMS
30
20
10
0
-2 0 2 4
Den
sity
Labour productivity growthReal labour compensation growth
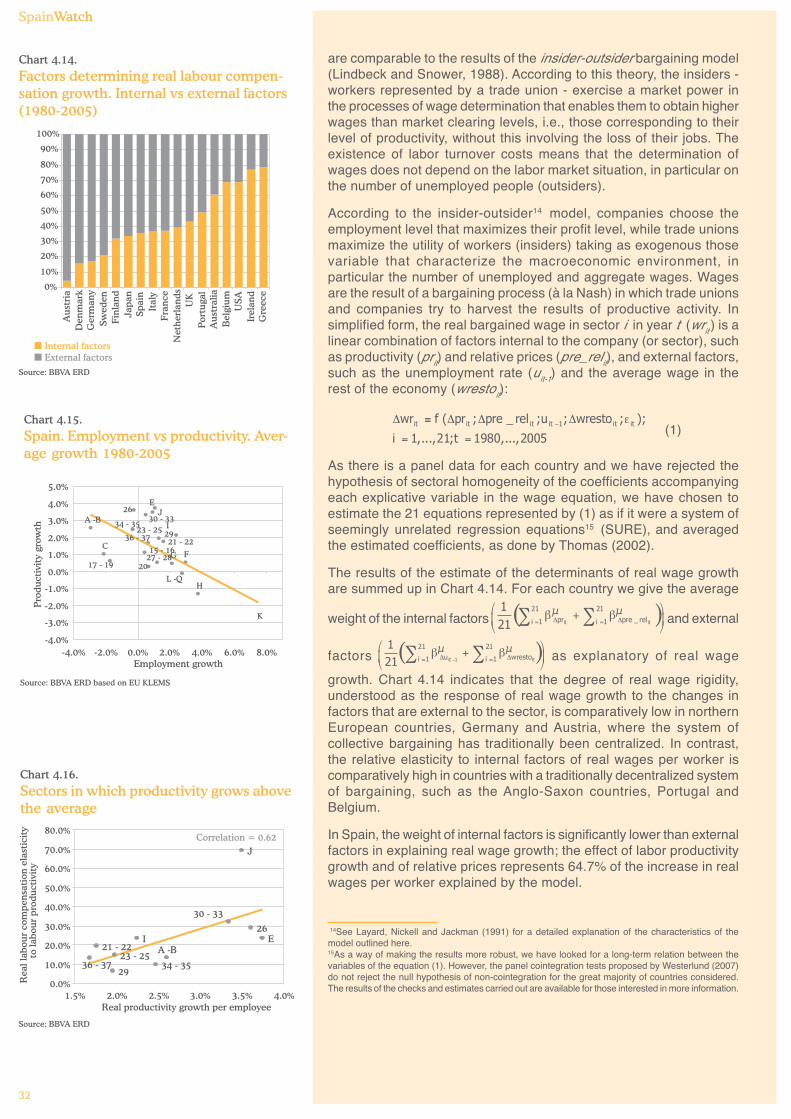
SpainWatch
32
are comparable to the results of the insider-outsider bargaining model(Lindbeck and Snower, 1988). According to this theory, the insiders -workers represented by a trade union - exercise a market power inthe processes of wage determination that enables them to obtain higherwages than market clearing levels, i.e., those corresponding to theirlevel of productivity, without this involving the loss of their jobs. Theexistence of labor turnover costs means that the determination ofwages does not depend on the labor market situation, in particular onthe number of unemployed people (outsiders).
According to the insider-outsider14 model, companies choose theemployment level that maximizes their profit level, while trade unionsmaximize the utility of workers (insiders) taking as exogenous thosevariable that characterize the macroeconomic environment, inparticular the number of unemployed and aggregate wages. Wagesare the result of a bargaining process (à la Nash) in which trade unionsand companies try to harvest the results of productive activity. Insimplified form, the real bargained wage in sector i in year t (writ ) is alinear combination of factors internal to the company (or sector), suchas productivity (prit) and relative prices (pre_relit), and external factors,such as the unemployment rate (uit-1) and the average wage in therest of the economy (wrestoit):
(1)
As there is a panel data for each country and we have rejected thehypothesis of sectoral homogeneity of the coefficients accompanyingeach explicative variable in the wage equation, we have chosen toestimate the 21 equations represented by (1) as if it were a system ofseemingly unrelated regression equations15 (SURE), and averagedthe estimated coefficients, as done by Thomas (2002).
The results of the estimate of the determinants of real wage growthare summed up in Chart 4.14. For each country we give the average
weight of the internal factors and external
factors as explanatory of real wage
growth. Chart 4.14 indicates that the degree of real wage rigidity,understood as the response of real wage growth to the changes infactors that are external to the sector, is comparatively low in northernEuropean countries, Germany and Austria, where the system ofcollective bargaining has traditionally been centralized. In contrast,the relative elasticity to internal factors of real wages per worker iscomparatively high in countries with a traditionally decentralized systemof bargaining, such as the Anglo-Saxon countries, Portugal andBelgium.
In Spain, the weight of internal factors is significantly lower than externalfactors in explaining real wage growth; the effect of labor productivitygrowth and of relative prices represents 64.7% of the increase in realwages per worker explained by the model.
14See Layard, Nickell and Jackman (1991) for a detailed explanation of the characteristics of themodel outlined here.15As a way of making the results more robust, we have looked for a long-term relation between thevariables of the equation (1). However, the panel cointegration tests proposed by Westerlund (2007)do not reject the null hypothesis of non-cointegration for the great majority of countries considered.The results of the checks and estimates carried out are available for those interested in more information.
Chart 4.14.
Factors determining real labour compen-sation growth. Internal vs external factors(1980-2005)
Source: BBVA ERD
Internal factorsExternal factors
0%
10%
20%
30%
40%
50%
60%
70%
80%
90%
100%
Au
stri
a
Ger
man
y
Fin
lan
d
Spai
n
Fra
nce
UK
Au
stra
lia
USA
Gre
ece
Den
mar
k
Swed
en
Jap
an
Ital
y
Net
her
lan
ds
Por
tuga
l
Bel
giu
m
Irel
and
Chart 4.16.
Sectors in which productivity grows abovethe average
Source: BBVA ERD
21 - 2223 - 25
26
29
30 - 33
34 - 3536 - 37
A - BEI
JCorrelation = 0.62
0.0%
10.0%
20.0%
30.0%
40.0%
50.0%
60.0%
70.0%
80.0%
1.5% 2.0% 2.5% 3.0% 3.5% 4.0%Real productivity growth per employee
Rea
l lab
our
com
pen
sati
on e
last
icit
yto
labo
ur
pro
du
ctiv
ity
Chart 4.15.
Spain. Employment vs productivity. Aver-age growth 1980-2005
Source: BBVA ERD based on EU KLEMS
L - Q
K
J
I
H
G F
E
C
A - B
36 - 37
34 - 3530 - 33
29
27 - 28
26
23 - 2521 - 22
2017 - 19
15 - 16
-4.0%
-3.0%
-2.0%
-1.0%
0.0%
1.0%
2.0%
3.0%
4.0%
5.0%
-4.0% -2.0% 0.0% 2.0% 4.0% 6.0% 8.0%Employment growth
Pro
du
ctiv
ity
grow
th
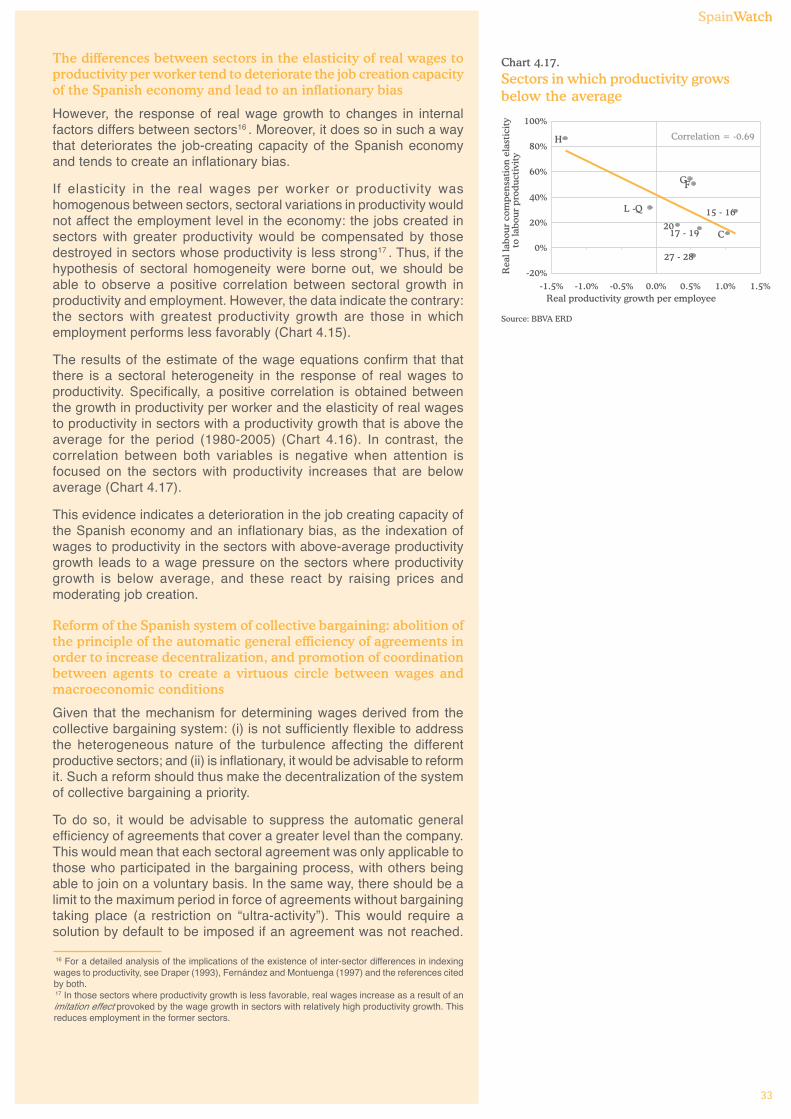
SpainWatch
33
The differences between sectors in the elasticity of real wages toproductivity per worker tend to deteriorate the job creation capacityof the Spanish economy and lead to an inflationary bias
However, the response of real wage growth to changes in internalfactors differs between sectors16 . Moreover, it does so in such a waythat deteriorates the job-creating capacity of the Spanish economyand tends to create an inflationary bias.
If elasticity in the real wages per worker or productivity washomogenous between sectors, sectoral variations in productivity wouldnot affect the employment level in the economy: the jobs created insectors with greater productivity would be compensated by thosedestroyed in sectors whose productivity is less strong17 . Thus, if thehypothesis of sectoral homogeneity were borne out, we should beable to observe a positive correlation between sectoral growth inproductivity and employment. However, the data indicate the contrary:the sectors with greatest productivity growth are those in whichemployment performs less favorably (Chart 4.15).
The results of the estimate of the wage equations confirm that thatthere is a sectoral heterogeneity in the response of real wages toproductivity. Specifically, a positive correlation is obtained betweenthe growth in productivity per worker and the elasticity of real wagesto productivity in sectors with a productivity growth that is above theaverage for the period (1980-2005) (Chart 4.16). In contrast, thecorrelation between both variables is negative when attention isfocused on the sectors with productivity increases that are belowaverage (Chart 4.17).
This evidence indicates a deterioration in the job creating capacity ofthe Spanish economy and an inflationary bias, as the indexation ofwages to productivity in the sectors with above-average productivitygrowth leads to a wage pressure on the sectors where productivitygrowth is below average, and these react by raising prices andmoderating job creation.
Reform of the Spanish system of collective bargaining: abolition ofthe principle of the automatic general efficiency of agreements inorder to increase decentralization, and promotion of coordinationbetween agents to create a virtuous circle between wages andmacroeconomic conditions
Given that the mechanism for determining wages derived from thecollective bargaining system: (i) is not sufficiently flexible to addressthe heterogeneous nature of the turbulence affecting the differentproductive sectors; and (ii) is inflationary, it would be advisable to reformit. Such a reform should thus make the decentralization of the systemof collective bargaining a priority.
To do so, it would be advisable to suppress the automatic generalefficiency of agreements that cover a greater level than the company.This would mean that each sectoral agreement was only applicable tothose who participated in the bargaining process, with others beingable to join on a voluntary basis. In the same way, there should be alimit to the maximum period in force of agreements without bargainingtaking place (a restriction on “ultra-activity”). This would require asolution by default to be imposed if an agreement was not reached.
Chart 4.17.
Sectors in which productivity growsbelow the average
Source: BBVA ERD
L - Q
H
GF
C
27 - 28
2017 - 19
15 - 16
Correlation = -0.69
-20%
0%
20%
40%
60%
80%
100%
-1.5% -1.0% -0.5% 0.0% 0.5% 1.0% 1.5%Real productivity growth per employee
Rea
l lab
our
com
pen
sati
on e
last
icit
y to
labo
ur
pro
du
ctiv
ity
16 For a detailed analysis of the implications of the existence of inter-sector differences in indexingwages to productivity, see Draper (1993), Fernández and Montuenga (1997) and the references citedby both. 17 In those sectors where productivity growth is less favorable, real wages increase as a result of animitation effect provoked by the wage growth in sectors with relatively high productivity growth. Thisreduces employment in the former sectors.
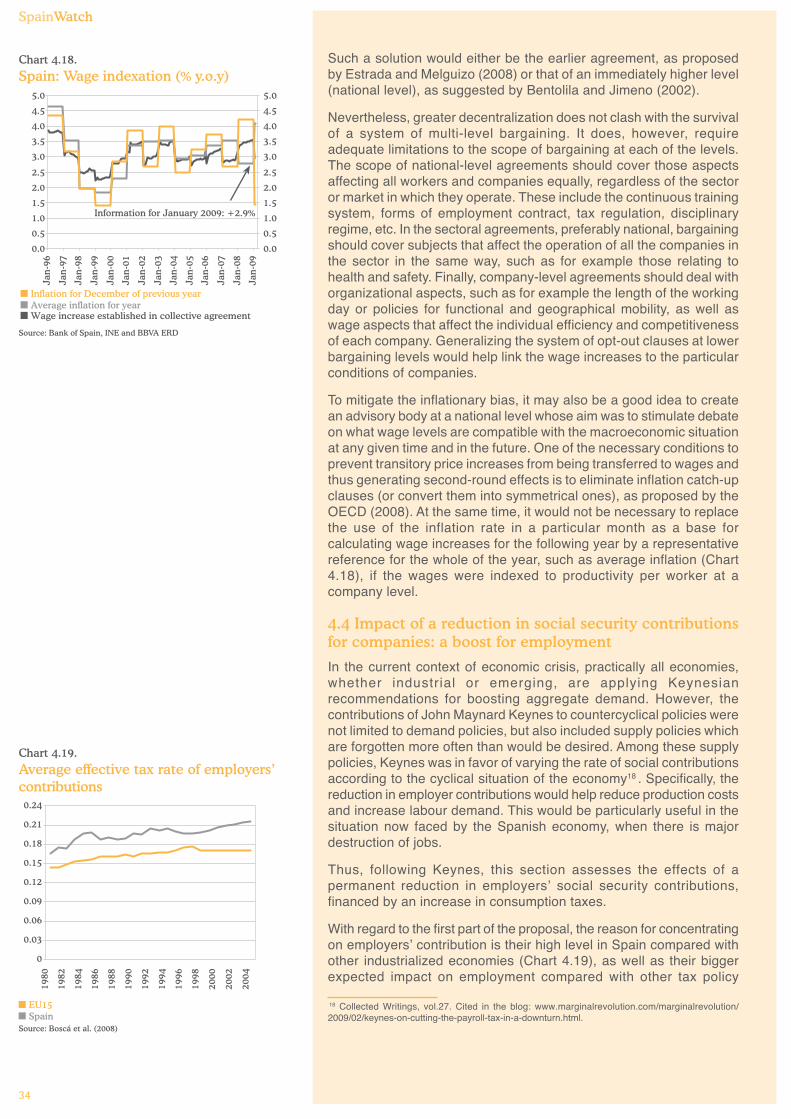
SpainWatch
34
Such a solution would either be the earlier agreement, as proposedby Estrada and Melguizo (2008) or that of an immediately higher level(national level), as suggested by Bentolila and Jimeno (2002).
Nevertheless, greater decentralization does not clash with the survivalof a system of multi-level bargaining. It does, however, requireadequate limitations to the scope of bargaining at each of the levels.The scope of national-level agreements should cover those aspectsaffecting all workers and companies equally, regardless of the sectoror market in which they operate. These include the continuous trainingsystem, forms of employment contract, tax regulation, disciplinaryregime, etc. In the sectoral agreements, preferably national, bargainingshould cover subjects that affect the operation of all the companies inthe sector in the same way, such as for example those relating tohealth and safety. Finally, company-level agreements should deal withorganizational aspects, such as for example the length of the workingday or policies for functional and geographical mobility, as well aswage aspects that affect the individual efficiency and competitivenessof each company. Generalizing the system of opt-out clauses at lowerbargaining levels would help link the wage increases to the particularconditions of companies.
To mitigate the inflationary bias, it may also be a good idea to createan advisory body at a national level whose aim was to stimulate debateon what wage levels are compatible with the macroeconomic situationat any given time and in the future. One of the necessary conditions toprevent transitory price increases from being transferred to wages andthus generating second-round effects is to eliminate inflation catch-upclauses (or convert them into symmetrical ones), as proposed by theOECD (2008). At the same time, it would not be necessary to replacethe use of the inflation rate in a particular month as a base forcalculating wage increases for the following year by a representativereference for the whole of the year, such as average inflation (Chart4.18), if the wages were indexed to productivity per worker at acompany level.
4.4 Impact of a reduction in social security contributionsfor companies: a boost for employment
In the current context of economic crisis, practically all economies,whether industrial or emerging, are applying Keynesianrecommendations for boosting aggregate demand. However, thecontributions of John Maynard Keynes to countercyclical policies werenot limited to demand policies, but also included supply policies whichare forgotten more often than would be desired. Among these supplypolicies, Keynes was in favor of varying the rate of social contributionsaccording to the cyclical situation of the economy18 . Specifically, thereduction in employer contributions would help reduce production costsand increase labour demand. This would be particularly useful in thesituation now faced by the Spanish economy, when there is majordestruction of jobs.
Thus, following Keynes, this section assesses the effects of apermanent reduction in employers’ social security contributions,financed by an increase in consumption taxes.
With regard to the first part of the proposal, the reason for concentratingon employers’ contribution is their high level in Spain compared withother industrialized economies (Chart 4.19), as well as their biggerexpected impact on employment compared with other tax policy
18 Collected Writings, vol.27. Cited in the blog: www.marginalrevolution.com/marginalrevolution/2009/02/keynes-on-cutting-the-payroll-tax-in-a-downturn.html.
Chart 4.19.
Average effective tax rate of employers’contributions
Source: Boscá et al. (2008)
EU15Spain
0
0.03
0.06
0.09
0.12
0.15
0.18
0.21
0.24
1980
1982
1984
1986
1988
1990
1992
1994
1996
1998
2000
2002
2004
Chart 4.18.
Spain: Wage indexation (% y.o.y)
Source: Bank of Spain, INE and BBVA ERD
Inflation for December of previous yearAverage inflation for yearWage increase established in collective agreement
0.0
0.5
1.0
1.5
2.0
2.5
3.0
3.5
4.0
4.5
5.0
Jan-
96
Jan-
97
Jan-
98
Jan-
99
Jan-
00
Jan-
01
Jan-
02
Jan-
03
Jan-
04
Jan-
05
Jan-
06
Jan-
07
Jan-
08
Jan-
090.0
0.5
1.0
1.5
2.0
2.5
3.0
3.5
4.0
4.5
5.0
Information for January 2009: +2.9%
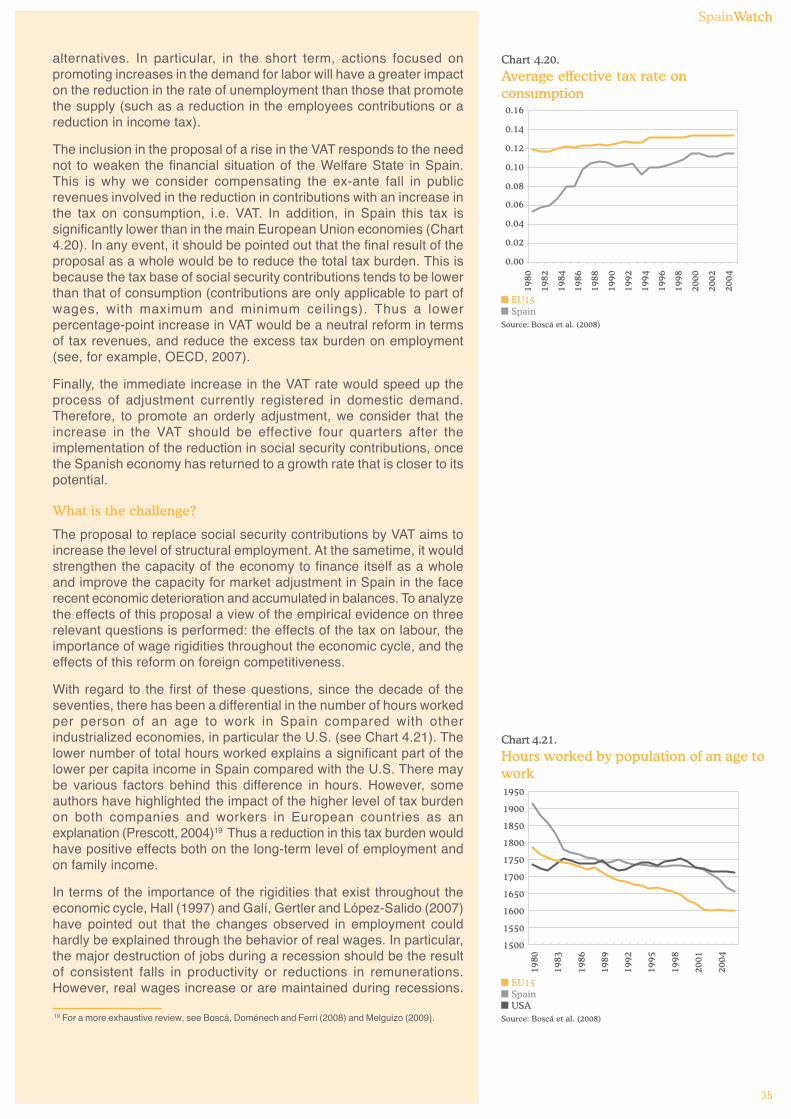
SpainWatch
35
alternatives. In particular, in the short term, actions focused onpromoting increases in the demand for labor will have a greater impacton the reduction in the rate of unemployment than those that promotethe supply (such as a reduction in the employees contributions or areduction in income tax).
The inclusion in the proposal of a rise in the VAT responds to the neednot to weaken the financial situation of the Welfare State in Spain.This is why we consider compensating the ex-ante fall in publicrevenues involved in the reduction in contributions with an increase inthe tax on consumption, i.e. VAT. In addition, in Spain this tax issignificantly lower than in the main European Union economies (Chart4.20). In any event, it should be pointed out that the final result of theproposal as a whole would be to reduce the total tax burden. This isbecause the tax base of social security contributions tends to be lowerthan that of consumption (contributions are only applicable to part ofwages, with maximum and minimum ceilings). Thus a lowerpercentage-point increase in VAT would be a neutral reform in termsof tax revenues, and reduce the excess tax burden on employment(see, for example, OECD, 2007).
Finally, the immediate increase in the VAT rate would speed up theprocess of adjustment currently registered in domestic demand.Therefore, to promote an orderly adjustment, we consider that theincrease in the VAT should be effective four quarters after theimplementation of the reduction in social security contributions, oncethe Spanish economy has returned to a growth rate that is closer to itspotential.
What is the challenge?
The proposal to replace social security contributions by VAT aims toincrease the level of structural employment. At the sametime, it wouldstrengthen the capacity of the economy to finance itself as a wholeand improve the capacity for market adjustment in Spain in the facerecent economic deterioration and accumulated in balances. To analyzethe effects of this proposal a view of the empirical evidence on threerelevant questions is performed: the effects of the tax on labour, theimportance of wage rigidities throughout the economic cycle, and theeffects of this reform on foreign competitiveness.
With regard to the first of these questions, since the decade of theseventies, there has been a differential in the number of hours workedper person of an age to work in Spain compared with otherindustrialized economies, in particular the U.S. (see Chart 4.21). Thelower number of total hours worked explains a significant part of thelower per capita income in Spain compared with the U.S. There maybe various factors behind this difference in hours. However, someauthors have highlighted the impact of the higher level of tax burdenon both companies and workers in European countries as anexplanation (Prescott, 2004)19 Thus a reduction in this tax burden wouldhave positive effects both on the long-term level of employment andon family income.
In terms of the importance of the rigidities that exist throughout theeconomic cycle, Hall (1997) and Galí, Gertler and López-Salido (2007)have pointed out that the changes observed in employment couldhardly be explained through the behavior of real wages. In particular,the major destruction of jobs during a recession should be the resultof consistent falls in productivity or reductions in remunerations.However, real wages increase or are maintained during recessions.
Chart 4.21.
Hours worked by population of an age towork
Source: Boscá et al. (2008)
EU15SpainUSA
1500
1550
1600
1650
1700
1750
1800
1850
1900
1950
1980
1983
1986
1989
1992
1995
1998
2001
2004
19 For a more exhaustive review, see Boscá, Doménech and Ferri (2008) and Melguizo (2009).
Chart 4.20.
Average effective tax rate onconsumption
Source: Boscá et al. (2008)
EU15Spain
0.00
0.02
0.04
0.06
0.08
0.10
0.12
0.14
0.16
1980
1982
1984
1986
1988
1990
1992
1994
1996
1998
2000
2002
2004
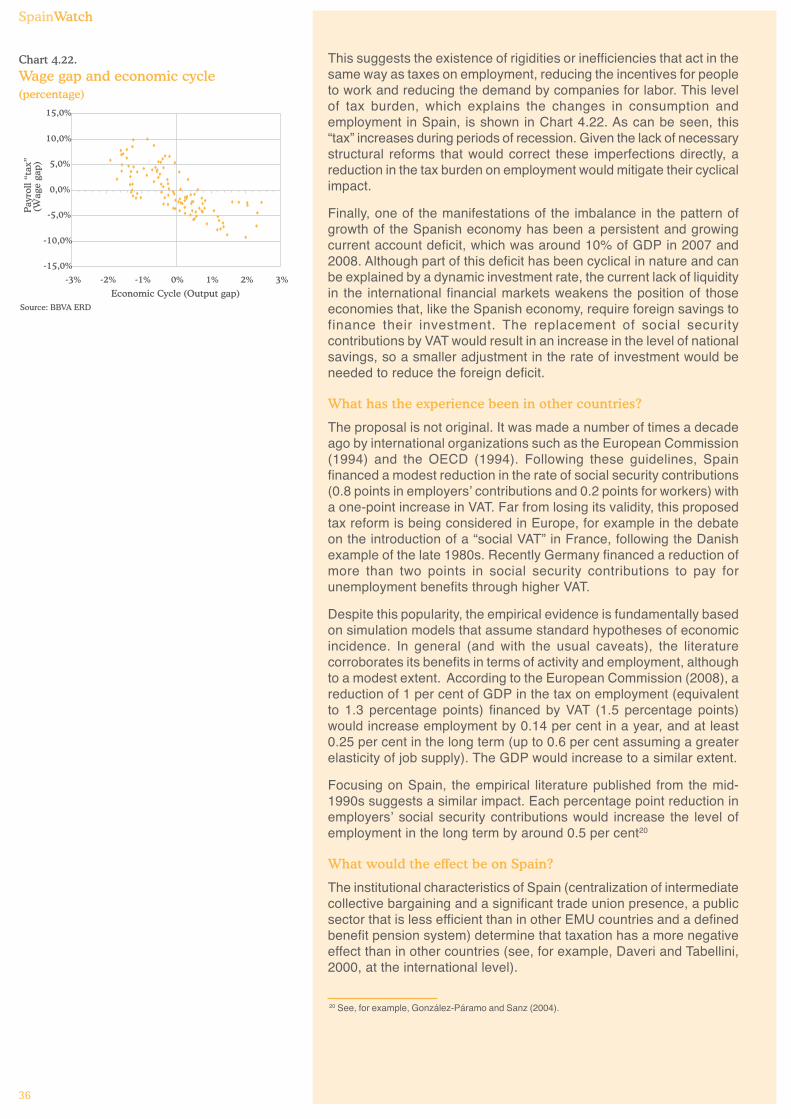
SpainWatch
36
This suggests the existence of rigidities or inefficiencies that act in thesame way as taxes on employment, reducing the incentives for peopleto work and reducing the demand by companies for labor. This levelof tax burden, which explains the changes in consumption andemployment in Spain, is shown in Chart 4.22. As can be seen, this“tax” increases during periods of recession. Given the lack of necessarystructural reforms that would correct these imperfections directly, areduction in the tax burden on employment would mitigate their cyclicalimpact.
Finally, one of the manifestations of the imbalance in the pattern ofgrowth of the Spanish economy has been a persistent and growingcurrent account deficit, which was around 10% of GDP in 2007 and2008. Although part of this deficit has been cyclical in nature and canbe explained by a dynamic investment rate, the current lack of liquidityin the international financial markets weakens the position of thoseeconomies that, like the Spanish economy, require foreign savings tofinance their investment. The replacement of social securitycontributions by VAT would result in an increase in the level of nationalsavings, so a smaller adjustment in the rate of investment would beneeded to reduce the foreign deficit.
What has the experience been in other countries?
The proposal is not original. It was made a number of times a decadeago by international organizations such as the European Commission(1994) and the OECD (1994). Following these guidelines, Spainfinanced a modest reduction in the rate of social security contributions(0.8 points in employers’ contributions and 0.2 points for workers) witha one-point increase in VAT. Far from losing its validity, this proposedtax reform is being considered in Europe, for example in the debateon the introduction of a “social VAT” in France, following the Danishexample of the late 1980s. Recently Germany financed a reduction ofmore than two points in social security contributions to pay forunemployment benefits through higher VAT.
Despite this popularity, the empirical evidence is fundamentally basedon simulation models that assume standard hypotheses of economicincidence. In general (and with the usual caveats), the literaturecorroborates its benefits in terms of activity and employment, althoughto a modest extent. According to the European Commission (2008), areduction of 1 per cent of GDP in the tax on employment (equivalentto 1.3 percentage points) financed by VAT (1.5 percentage points)would increase employment by 0.14 per cent in a year, and at least0.25 per cent in the long term (up to 0.6 per cent assuming a greaterelasticity of job supply). The GDP would increase to a similar extent.
Focusing on Spain, the empirical literature published from the mid-1990s suggests a similar impact. Each percentage point reduction inemployers’ social security contributions would increase the level ofemployment in the long term by around 0.5 per cent20
What would the effect be on Spain?
The institutional characteristics of Spain (centralization of intermediatecollective bargaining and a significant trade union presence, a publicsector that is less efficient than in other EMU countries and a definedbenefit pension system) determine that taxation has a more negativeeffect than in other countries (see, for example, Daveri and Tabellini,2000, at the international level).
Chart 4.22.
Wage gap and economic cycle(percentage)
Source: BBVA ERD
-15,0%
-10,0%
-5,0%
0,0%
5,0%
10,0%
15,0%
-3% -2% -1% 0% 1% 2% 3%
Pay
roll
“tax
”(W
age
gap
)
Economic Cycle (Output gap)
20 See, for example, González-Páramo and Sanz (2004).
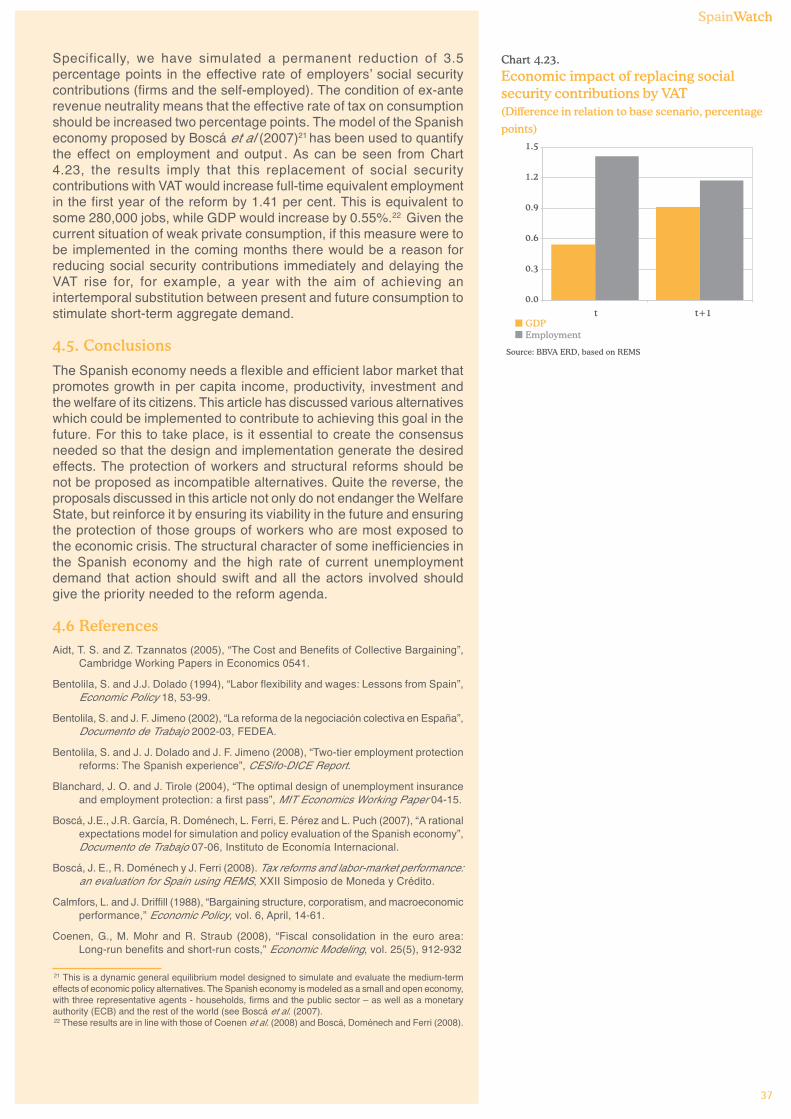
SpainWatch
37
Specifically, we have simulated a permanent reduction of 3.5percentage points in the effective rate of employers’ social securitycontributions (firms and the self-employed). The condition of ex-anterevenue neutrality means that the effective rate of tax on consumptionshould be increased two percentage points. The model of the Spanisheconomy proposed by Boscá et al (2007)21 has been used to quantifythe effect on employment and output . As can be seen from Chart4.23, the results imply that this replacement of social securitycontributions with VAT would increase full-time equivalent employmentin the first year of the reform by 1.41 per cent. This is equivalent tosome 280,000 jobs, while GDP would increase by 0.55%.22 Given thecurrent situation of weak private consumption, if this measure were tobe implemented in the coming months there would be a reason forreducing social security contributions immediately and delaying theVAT rise for, for example, a year with the aim of achieving anintertemporal substitution between present and future consumption tostimulate short-term aggregate demand.
4.5. Conclusions
The Spanish economy needs a flexible and efficient labor market thatpromotes growth in per capita income, productivity, investment andthe welfare of its citizens. This article has discussed various alternativeswhich could be implemented to contribute to achieving this goal in thefuture. For this to take place, is it essential to create the consensusneeded so that the design and implementation generate the desiredeffects. The protection of workers and structural reforms should benot be proposed as incompatible alternatives. Quite the reverse, theproposals discussed in this article not only do not endanger the WelfareState, but reinforce it by ensuring its viability in the future and ensuringthe protection of those groups of workers who are most exposed tothe economic crisis. The structural character of some inefficiencies inthe Spanish economy and the high rate of current unemploymentdemand that action should swift and all the actors involved shouldgive the priority needed to the reform agenda.
4.6 ReferencesAidt, T. S. and Z. Tzannatos (2005), “The Cost and Benefits of Collective Bargaining”,
Cambridge Working Papers in Economics 0541.
Bentolila, S. and J.J. Dolado (1994), “Labor flexibility and wages: Lessons from Spain”,Economic Policy 18, 53-99.
Bentolila, S. and J. F. Jimeno (2002), “La reforma de la negociación colectiva en España”,Documento de Trabajo 2002-03, FEDEA.
Bentolila, S. and J. J. Dolado and J. F. Jimeno (2008), “Two-tier employment protectionreforms: The Spanish experience”, CESifo-DICE Report.
Blanchard, J. O. and J. Tirole (2004), “The optimal design of unemployment insuranceand employment protection: a first pass”, MIT Economics Working Paper 04-15.
Boscá, J.E., J.R. García, R. Doménech, L. Ferri, E. Pérez and L. Puch (2007), “A rationalexpectations model for simulation and policy evaluation of the Spanish economy”,Documento de Trabajo 07-06, Instituto de Economía Internacional.
Boscá, J. E., R. Doménech y J. Ferri (2008). Tax reforms and labor-market performance:an evaluation for Spain using REMS, XXII Simposio de Moneda y Crédito.
Calmfors, L. and J. Driffill (1988), “Bargaining structure, corporatism, and macroeconomicperformance,” Economic Policy, vol. 6, April, 14-61.
Coenen, G., M. Mohr and R. Straub (2008), “Fiscal consolidation in the euro area:Long-run benefits and short-run costs,” Economic Modeling, vol. 25(5), 912-932
Chart 4.23.
Economic impact of replacing socialsecurity contributions by VAT(Difference in relation to base scenario, percentage
points)
Source: BBVA ERD, based on REMS
GDPEmployment
0.0
0.3
0.6
0.9
1.2
1.5
t t+1
21 This is a dynamic general equilibrium model designed to simulate and evaluate the medium-termeffects of economic policy alternatives. The Spanish economy is modeled as a small and open economy,with three representative agents - households, firms and the public sector – as well as a monetaryauthority (ECB) and the rest of the world (see Boscá et al. (2007).22 These results are in line with those of Coenen et al. (2008) and Boscá, Doménech and Ferri (2008).
SpainWatch
38
European Commission (1994). Growth, competitiveness, employment. The challengesand ways forward the 21st century. White paper. Luxembourg.
European Commission (2008): “The efficiency of tax systems”, in Public Finances inEMU 2008, PP.167-205, Brussels.
Danthine, J.-P. and J. Hunt (1994), “Wage bargaining structure, employment andeconomic integration”, Economic Journal, 104 (424), 528-541.
Daveri, F. and G. Tabellini (2000), “Unemployment and taxes. Do taxes affect the rateof unemployment? ”, Economic Policy, n.30, 48-104.
Dolado, J. J. and R. Stucchi (2008), “Do temporary contracts affect TFP? Evidencefrom Spanish manufacturing firms”, CEPR Discussion Paper No. 7055.
Draper, M. (1993), “Indiciación salarial y empleo: Un análisis desagregado para el casoespañol”, Moneda y Crédito, 197, 129-165.
Du Caju, P., E. Gautier, D. Momferatou, M. Ward-Warmedinger (2008), “InstitutionalFeatures of Wage Bargaining in 23 European Countries, the US and Japan”, IZADiscussion Paper No. 3867.
Estrada, A. and A. Melguizo (2008), “Propuestas para la Reforma de la NegociaciónColectiva”. Mímeo. Oficina Económica del Presidente del Gobierno.
FEDEA (2009). Observatorio laboral de la crisis. Boletín II. Enero 2009. FEDEA.
Fernández, M. and V. Montuenga (1997), “Salario y productividad sectorial: ¿existeevidencia de un comportamiento dual?, Cuadernos económicos de ICE, 63, 79-103.
Flanagan, R. (1999), “Macroeconomic performance and collective bargaining: Aninternational perspective”, Journal of Economic Literature, 37 (3), 1150-1175.
Galí, J., M. Gertler and D. López-Salido (2007), “Markups, Gaps, and the Welfare Costsof Business Fluctuations,” The Review of Economics and Statistics, vol.89, n.1,44-59.
González-Páramo, J. M. and J. F. Sanz (2004). Evaluando reformas fiscales medianteel coste marginal de los fondos públicos, Bilbao, Fundación BBVA.
Hall, R. E (1997): “Macroeconomic Fluctuations and the Allocation of Time”, Journal ofLabor Economics, vol.15, n.1, 223-250
Hofer, H. (2006), “Reform of severance pay law in Austria”, Discussion paper. Peerreview programme of the European Employment Strategy. DG Employment andSocial Affairs. European Commission.
Izquierdo, M., E. Moral and A. Urtasun (2003), “El sistema de negociación colectiva enEspaña: un análisis con datos individuales de convenios”, Documento Ocasional0302, Banco de España.
Layard, P. R., S. Nickell and R. Jackman (1991), “Unemployment MacroeconomicPerformance and the Labour Market”, Oxford University Press. Oxford.
Lindbeck, A. and D. Snower (1988), “The Insider-Outsider Theory of Employment andUnemployment”, The MIT Press, Cambridge, Massachusetts.
Melguizo, A. (2009): “¿Quién soporta las cotizaciones sociales empresariales y lafiscalidad laboral? Una panorámica de la literatura empírica”, Hacienda PúblicaEspañola / Revista de Economía Pública n.188-(1/2009), 125-182.
Naylor, R. (1998), “International trade and economic integration when labour marketsare generally unionised”, European Economic Review, 42 (7), 1251-1267.
OCDE (1994). The OECD Jobs Study. Evidence and explanations. Part II. Theadjustment potential of labour market, Paris.
OECD (2004). Employment Outlook, Paris.
OECD (2007). “Financing social protection: the employment effect”, OCDE EmploymentOutlook, pp.57-206, Paris.
OECD (2008). Going for Growth. Paris.
Pérez-Infante, J. I. (2003), “La estructura de la negociación colectiva y los salarios enEspaña”, Revista del Ministerio de Trabajo e Inmigración, 46, 41-97.
Prescott, E. C. (2004), “Why do Americans work so much more than Europeans?”,Federal Reserve Bank of Minneapolis Quarterly Review, vol.28, n.1, 2-13.
Thomas, A. (2002), “The Costs and Benefits of Various Wage Bargaining Structures:An Empirical Exploration”, IMF Working Paper WP/02/71. IMF.
Westerlund, J. (2007), “Testing for Error Correction in Panel Data”, Oxford BulletinEconomics and Statistics, 69, 709-748.
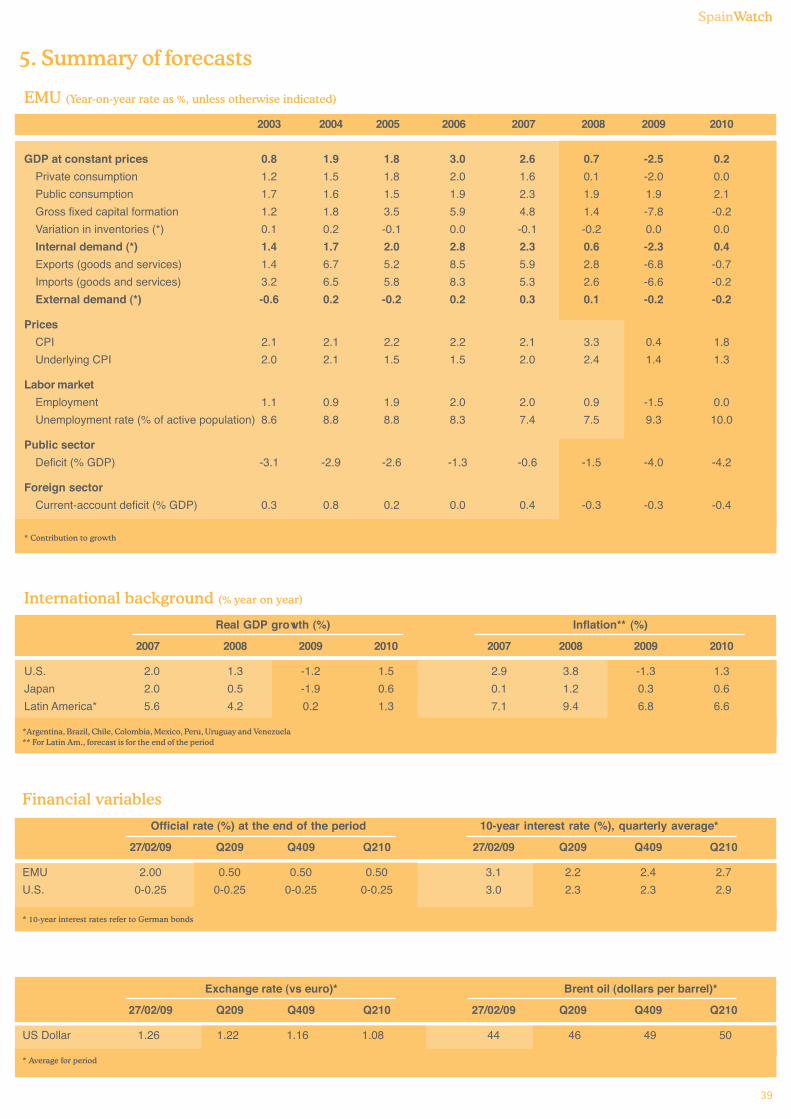
SpainWatch
39
5. Summary of forecasts
Financial variables
Official rate (%) at the end of the period 10-year interest rate (%), quarterly average*
27/02/09 Q209 Q409 Q210 27/02/09 Q209 Q409 Q210
EMU 2.00 0.50 0.50 0.50 3.1 2.2 2.4 2.7
U.S. 0-0.25 0-0.25 0-0.25 0-0.25 3.0 2.3 2.3 2.9
* 10-year interest rates refer to German bonds
International background (% year on year)
Real GDP growth (%) Inflation** (%)
2007 2008 2009 2010 2007 2008 2009 2010
U.S. 2.0 1.3 -1.2 1.5 2.9 3.8 -1.3 1.3
Japan 2.0 0.5 -1.9 0.6 0.1 1.2 0.3 0.6
Latin America* 5.6 4.2 0.2 1.3 7.1 9.4 6.8 6.6
*Argentina, Brazil, Chile, Colombia, Mexico, Peru, Uruguay and Venezuela** For Latin Am., forecast is for the end of the period
Exchange rate (vs euro)* Brent oil (dollars per barrel)*
27/02/09 Q209 Q409 Q210 27/02/09 Q209 Q409 Q210
US Dollar 1.26 1.22 1.16 1.08 44 46 49 50
* Average for period
EMU (Year-on-year rate as %, unless otherwise indicated)
2003 2004 2005 2006 2007 2008 2009 2010
GDP at constant prices 0.8 1.9 1.8 3.0 2.6 0.7 -2.5 0.2
Private consumption 1.2 1.5 1.8 2.0 1.6 0.1 -2.0 0.0
Public consumption 1.7 1.6 1.5 1.9 2.3 1.9 1.9 2.1
Gross fixed capital formation 1.2 1.8 3.5 5.9 4.8 1.4 -7.8 -0.2
Variation in inventories (*) 0.1 0.2 -0.1 0.0 -0.1 -0.2 0.0 0.0
Internal demand (*) 1.4 1.7 2.0 2.8 2.3 0.6 -2.3 0.4
Exports (goods and services) 1.4 6.7 5.2 8.5 5.9 2.8 -6.8 -0.7
Imports (goods and services) 3.2 6.5 5.8 8.3 5.3 2.6 -6.6 -0.2
External demand (*) -0.6 0.2 -0.2 0.2 0.3 0.1 -0.2 -0.2
Prices
CPI 2.1 2.1 2.2 2.2 2.1 3.3 0.4 1.8
Underlying CPI 2.0 2.1 1.5 1.5 2.0 2.4 1.4 1.3
Labor market
Employment 1.1 0.9 1.9 2.0 2.0 0.9 -1.5 0.0
Unemployment rate (% of active population) 8.6 8.8 8.8 8.3 7.4 7.5 9.3 10.0
Public sector
Deficit (% GDP) -3.1 -2.9 -2.6 -1.3 -0.6 -1.5 -4.0 -4.2
Foreign sector
Current-account deficit (% GDP) 0.3 0.8 0.2 0.0 0.4 -0.3 -0.3 -0.4
* Contribution to growth
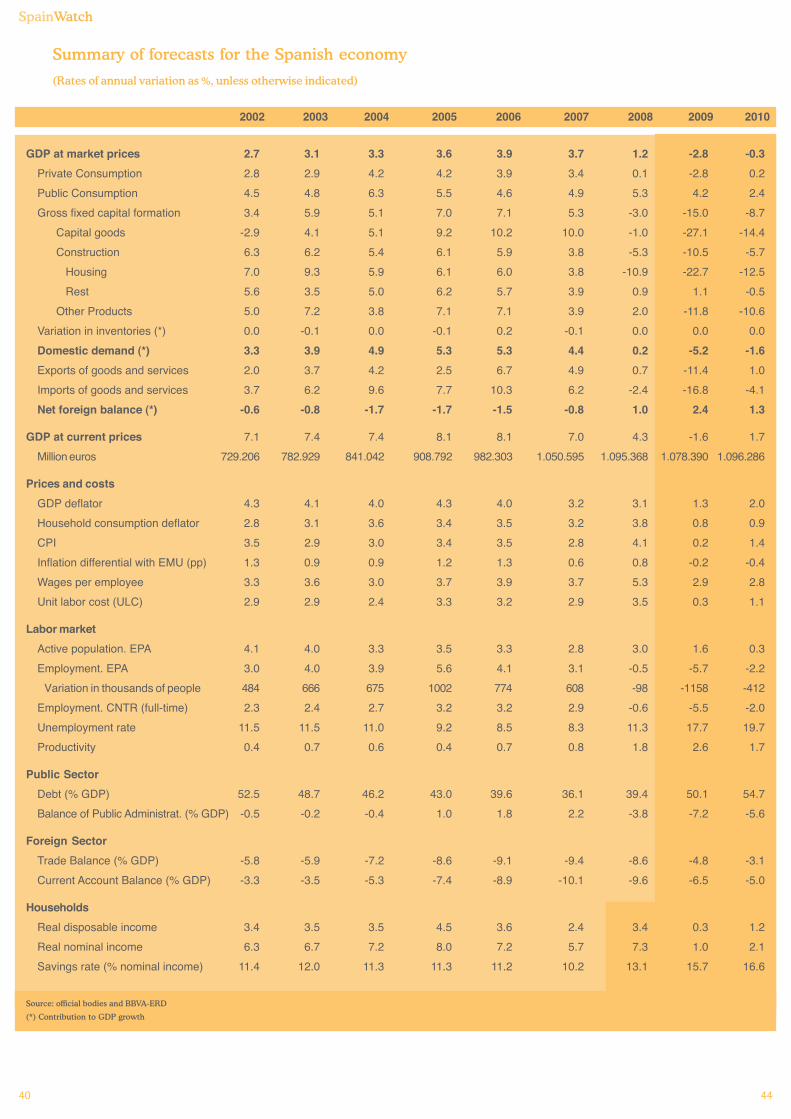
SpainWatch
40
Summary of forecasts for the Spanish economy
(Rates of annual variation as %, unless otherwise indicated)
2002 2003 2004 2005 2006 2007 2008 2009 2010
GDP at market prices 2.7 3.1 3.3 3.6 3.9 3.7 1.2 -2.8 -0.3
Private Consumption 2.8 2.9 4.2 4.2 3.9 3.4 0.1 -2.8 0.2
Public Consumption 4.5 4.8 6.3 5.5 4.6 4.9 5.3 4.2 2.4
Gross fixed capital formation 3.4 5.9 5.1 7.0 7.1 5.3 -3.0 -15.0 -8.7
Capital goods -2.9 4.1 5.1 9.2 10.2 10.0 -1.0 -27.1 -14.4
Construction 6.3 6.2 5.4 6.1 5.9 3.8 -5.3 -10.5 -5.7
Housing 7.0 9.3 5.9 6.1 6.0 3.8 -10.9 -22.7 -12.5
Rest 5.6 3.5 5.0 6.2 5.7 3.9 0.9 1.1 -0.5
Other Products 5.0 7.2 3.8 7.1 7.1 3.9 2.0 -11.8 -10.6
Variation in inventories (*) 0.0 -0.1 0.0 -0.1 0.2 -0.1 0.0 0.0 0.0
Domestic demand (*) 3.3 3.9 4.9 5.3 5.3 4.4 0.2 -5.2 -1.6
Exports of goods and services 2.0 3.7 4.2 2.5 6.7 4.9 0.7 -11.4 1.0
Imports of goods and services 3.7 6.2 9.6 7.7 10.3 6.2 -2.4 -16.8 -4.1
Net foreign balance (*) -0.6 -0.8 -1.7 -1.7 -1.5 -0.8 1.0 2.4 1.3
GDP at current prices 7.1 7.4 7.4 8.1 8.1 7.0 4.3 -1.6 1.7
Million euros 729.206 782.929 841.042 908.792 982.303 1.050.595 1.095.368 1.078.390 1.096.286
Prices and costs
GDP deflator 4.3 4.1 4.0 4.3 4.0 3.2 3.1 1.3 2.0
Household consumption deflator 2.8 3.1 3.6 3.4 3.5 3.2 3.8 0.8 0.9
CPI 3.5 2.9 3.0 3.4 3.5 2.8 4.1 0.2 1.4
Inflation differential with EMU (pp) 1.3 0.9 0.9 1.2 1.3 0.6 0.8 -0.2 -0.4
Wages per employee 3.3 3.6 3.0 3.7 3.9 3.7 5.3 2.9 2.8
Unit labor cost (ULC) 2.9 2.9 2.4 3.3 3.2 2.9 3.5 0.3 1.1
Labor market
Active population. EPA 4.1 4.0 3.3 3.5 3.3 2.8 3.0 1.6 0.3
Employment. EPA 3.0 4.0 3.9 5.6 4.1 3.1 -0.5 -5.7 -2.2
Variation in thousands of people 484 666 675 1002 774 608 -98 -1158 -412
Employment. CNTR (full-time) 2.3 2.4 2.7 3.2 3.2 2.9 -0.6 -5.5 -2.0
Unemployment rate 11.5 11.5 11.0 9.2 8.5 8.3 11.3 17.7 19.7
Productivity 0.4 0.7 0.6 0.4 0.7 0.8 1.8 2.6 1.7
Public Sector
Debt (% GDP) 52.5 48.7 46.2 43.0 39.6 36.1 39.4 50.1 54.7
Balance of Public Administrat. (% GDP) -0.5 -0.2 -0.4 1.0 1.8 2.2 -3.8 -7.2 -5.6
Foreign Sector
Trade Balance (% GDP) -5.8 -5.9 -7.2 -8.6 -9.1 -9.4 -8.6 -4.8 -3.1
Current Account Balance (% GDP) -3.3 -3.5 -5.3 -7.4 -8.9 -10.1 -9.6 -6.5 -5.0
Households
Real disposable income 3.4 3.5 3.5 4.5 3.6 2.4 3.4 0.3 1.2
Real nominal income 6.3 6.7 7.2 8.0 7.2 5.7 7.3 1.0 2.1
Savings rate (% nominal income) 11.4 12.0 11.3 11.3 11.2 10.2 13.1 15.7 16.6
Source: official bodies and BBVA-ERD
(*) Contribution to GDP growth
44

For more information please contact:
Servicios Generales Difusión BBVA Gran Vía 1 planta 2 48001 Bilbao P 34 944 876 231 F 34 944 876 417 www.bbva.es
other publications
LatinwatchServicio de Estudios Febrero 2003Febrero 2003
América Latina: depreciaciones cambiariasArgentina: en busca de la financiación perdidaBrasil: la duda de la deuda¡Ahora Colombia!México: la debilidad del peso no preocupa
Situació
América Latina: depreciaciones cambiariasArgentina: en busca de la financiación perdidaBrasil: la duda de la deuda¡Ahora Colombia!México: la debilidad del peso no preocupa
Servicio de Estudios Febrero 2003
América Latina: depreciaciones cambiariasArgentina: en busca de la financiación perdidaBrasil: la duda de la deuda¡Ahora Colombia!México: la debilidad del peso no preocupa
Septiembre 2004
Septiembre 2004Septiembre 2004
América Latina: depreciaciones cambiariasArgentina: en busca de la financiación perdidaBrasil: la duda de la deuda¡Ahora Colombia!México: la debilidad del peso no preocupa
América Latina: depreciaciones cambiariasArgentina: en busca de la financiación perdidaBrasil: la duda de la deuda¡Ahora Colombia!México: la debilidad del peso no preocupa
Septiembre 2004
América Latina: depreciaciones cambiariasArgentina: en busca de la financiación perdidaBrasil: la duda de la deuda¡Ahora Colombia!México: la debilidad del peso no preocupa
Septiembre 2004
América Latina: depreciaciones cambiariasArgentina: en busca de la financiación perdidaBrasil: la duda de la deuda¡Ahora Colombia!México: la debilidad del peso no preocupa
Septiembre 2004
América Latina: depreciaciones cambiariasArgentina: en busca de la financiación perdidaBrasil: la duda de la deuda¡Ahora Colombia!México: la debilidad del peso no preocupa
Septiembre 2004
América Latina: depreciaciones cambiariasArgentina: en busca de la financiación perdidaBrasil: la duda de la deuda¡Ahora Colombia!México: la debilidad del peso no preocupa
Septiembre 2004Situación Inmobiliaria
España 2005: más viviendas terminadas que nuncaRalentización ordenada de preciosSuave desaceleración del créditoRiqueza inmobiliaria: una garantía del consumo futuro
Servicio de Estudios Económicos Enero 2005
Situación Consumo
Consumo de los hogares: por encima del 3% en 2006 y 2007
Ventas de automóviles: se aleja el tercer récord consecutivo
Financiación al consumo: creciente demanda
¿Cómo es la morosidad del crédito al consumo en España?
Servicio de Estudios Económicos Segundo semestre 2006
���� ����� ��� �������� �� ����� ������ ������� ����� ������ ������ ������� �������� ����� �� �� ����� � � ��� ��� � � � ���� �� ������������� � ���� !��� "������ �� ��� ��� ��� �� �� #�� �� $ � �� ��� �� ��� � �� ����� ��� �� ���%���� �� �� ��� ��� ������� ����& ��� �� ��� ���'��������' �� �� �� ��� ������ � ��� ����� ������ �� �� � �� ����� �� �� � ��� ��� ��(�� � ������� �� �� �� ��� �� � ��)� �� � ����&��� �� ��� ���' ��������' �� �� �� ��� ������ � ��� ����� �� ��� ����� ��%� ���� �� ����� �� �� ����� �� ����� ������ �����%�� � �� ������ �� ��"����� ���������� ���� �������' ����� �����' ���*�� ������ ����&���� ����� �� �� �� � �� � ���� �� � ������ � ��� � ��+��� �� ������� � �� �� ���� �� ����� ���&
Julio 2008Servicio de Estudios Económicos
Andalucía y Extremadura: crecimiento elevado, pero convergencia real insuficienteAgricultura, Construcción y Servicios Públicos, más importantes en ambas regionesIntensa desaceleración en marcha y expectativas a la baja en el corto plazoLa juventud de la población andaluza, oportunidad para el empleo que ha de reforzarse con más formación
Economic Research Department:Chief Economist:
José Luis Escrivá
Unit Heads:Spain and Europe: Rafael Doménech - [email protected]
Spain: Miguel Cardoso - [email protected]: Miguel Jiménez - [email protected]
US and Mexico: Jorge Sicilia - [email protected]: Nathaniel Karp - [email protected]: Adolfo Albo - [email protected] Analysis Mexico: Julián Cubero - [email protected]
Economic and Financial Scenarios: Mayte Ledo - [email protected] Analysis: Ana Rubio - [email protected] Scenarios: Daniel Navia - [email protected] Analysis: Giovanni di Placido - [email protected] Trends: David Tuesta - [email protected]
Emerging Markets: Alicia García-Herrero - [email protected] America: Joaquín Vial - [email protected]
Argentina: Gloria Sorensen - [email protected]: Joaquín Vial - [email protected]: Juana Téllez - [email protected]: Hugo Perea - [email protected]: Oscar Carvallo - [email protected]
Asia:China: Li-Gang Liu - [email protected] Asia: Ya Lan Liu - [email protected]
Cross Country Analysis: Sonsoles Castillo - [email protected]