spatial patterns and eco-epidemiological systems{part i: multi … · disease (triatoma sordidaand...
TRANSCRIPT
Spatial patterns and eco-epidemiological systems–part I:
multi-scale spatial modelling of the occurrence of
Chagas disease insect vectors
Emmanuel Roux, Annamaria De Fatima Venancio, Jean-Francois Girres,
Christine A Romana
To cite this version:
Emmanuel Roux, Annamaria De Fatima Venancio, Jean-Francois Girres, Christine A Romana.Spatial patterns and eco-epidemiological systems–part I: multi-scale spatial modelling of theoccurrence of Chagas disease insect vectors. Geospatial Health, 2011, 6 (1), pp.41-51. <ird-01369876>
HAL Id: ird-01369876
http://hal.ird.fr/ird-01369876
Submitted on 21 Sep 2016
HAL is a multi-disciplinary open accessarchive for the deposit and dissemination of sci-entific research documents, whether they are pub-lished or not. The documents may come fromteaching and research institutions in France orabroad, or from public or private research centers.
L’archive ouverte pluridisciplinaire HAL, estdestinee au depot et a la diffusion de documentsscientifiques de niveau recherche, publies ou non,emanant des etablissements d’enseignement et derecherche francais ou etrangers, des laboratoirespublics ou prives.


Introduction
American trypanosomiasis or Chagas disease is avector-borne disease, caused by Trypanosoma cruzi(Chagas, 1909) and transmitted by insects of theTriatominae subfamily. Environmental conditions,including human behaviour, dwellings and peri-domi-ciliary characteristics that can potentially influencevector presence, abundance and infestation, are notwell known for all species. In fact, there are up to 45triatomine species in Brazil, which all have differentecological niches (palm trees, rocks anfractuosities,animal burrows, etc.) and behaviour.
Environmental conditions partially determine thepresence, density and spatio-temporal distribution of
pathogens, vectors and hosts and thus the epidemics,the (re)-emergence and/or the endemicity of many vec-tor-borne diseases. In this framework, much deals withmapping environmental and geo-localized epidemio-logical data (prevalence and, ideally, incidence), whiletransmission of the disease is considered a “blackbox” (Peterson, 2007). This approach is justified whenthe epidemiological data are aggregated making geo-localised cases, and associated transmission zonescoincide spatially and temporally. However, this pro-vides only a poor insight into how the eco-epidemio-logical system functions. In fact, understanding thetrue mechanisms of transmission demands a finer spa-tial and temporal resolution than is normally appliedand, without a strong hypothesis on possible trans-mission locations, the vector and its ecology becomethe focus of the system (Romaña, 2004; Peterson,2006, 2007). Such studies map environmental charac-terisation, notably derived from high, or very high,resolution image processing, geo-localised entomolog-ical data (presence/absence and/or abundance data)and, but rarely jointly, epidemiological data (Girod et
Geospatial Health 6(1), 2011, pp. 41-51
Corresponding author:Emmanuel RouxESPACE-DEV, UMR228 IRD/UMII/UR/UAGInstitut de Recherche pour le DéveloppementCayenne, French GuianaTel. +594 (0)5 94 29 92 77 Fax +594 (0)5 94 31 98 55E-mail : [email protected]
Spatial patterns and eco-epidemiological systems – part I:multi-scale spatial modelling of the occurrence of Chagasdisease insect vectors
Emmanuel Roux1, Annamaria de Fátima Venâncio2, Jean-François Girres3, Christine A.Romaña4
1ESPACE-DEV, UMR228 IRD/UMII/UR/UAG, Institut de Recherche pour le Développement, Cayenne,French Guiana; 2Instituto do Meio Ambiente e Recursos Hídricos do Estado da Bahia e Centro deDesenvolvimento Sustentável da Universidade de Brasília, Brazil; 3IGN, COGIT, Saint Mandé, France/IRD,ESPACE-DEV (UMR228), Cayenne, French Guiana; 4Université Paris Descartes, Paris, France/IRD, ESPACE-DEV (UMR228), France
Abstract. Studies that explicitly and specifically take into account the spatial dimension within the study of eco-epidemio-logical systems remain rare. Our approach of modelling the spatial and/or temporal properties of the entomological and/orepidemiological data before their mapping with possible explanatory variables, objectively underline the significant patternsat different scales. The domiciliary and peri-domiciliary presence and abundance of juvenile and adult vectors of the Chagasdisease (Triatoma sordida and Panstrongylus geniculatus) in Bahia state in northeast Brazil, has been modelled by auto-matically identifying significant multi-scale spatial patterns of the entomological data by the application and adaptation ofthe spatial modelling methodology proposed by Dray et al. (2006) and based on principal coordinate analysis of neighbourmatrices. We found that entomological data can be modelled by a set of eigenvectors that present a significant Moran’s Iindex of spatial autocorrelation. The models for juvenile and adult vectors are defined by 28 and 32 eigenvectors that explain82.3% and 79.9%, respectively, of the total data variances. The results support insect presence as the outcome both of alocal scale “near-to-near” dispersal and an infestation from the wild, surrounding environment that produces a higher insectdensity at the village periphery.
Keywords: principal coordinate analysis of neighbourhood matrices, spatial modelling, Chagas disease, vectors, Brazil.
E. Roux et al. - Geospatial Health 6(1), 2011, pp. 41-51
al., 2011). However, when using remotely sensed data,a compromise between spatial and temporal resolu-tion has to be found (Kitron et al., 2006). Moreover,the availability of remotely sensed data can be particu-larly restricted in regions with persistent cloud cover,which is often the case in tropical zones. Beyond thesepractical limits, such an approach can also be ques-tioned from a theoretical point of view. In fact, the spa-tially observable resultants of the eco-epidemiologicalsystem depend on environmental, social, demographicand behavioural characteristics as well as on the inter-actions between these factors at different scales. Thus,associations between the epidemiological and/or ento-mological data and the space dimension encompass thelinks between such data and the factors listed above.We suggest that a specific study of the spatial and/ortemporal properties of the entomological and/or epi-demiological data should be carried out before linkingsuch data with any explanatory variables, as thisapproach would permit the exploration of the spatialand/or temporal properties at different scales.
Numerous epidemiological studies on Chagas dis-ease take into account the spatial dimension in animplicit way by integrating environmental variableshaving by nature a strong spatial basis (e.g. Costa etal., 2002; Peterson et al., 2002; Dumonteil et al.,2004; Abad-Franch et al., 2010). However, studiesthat explicitly take into account the spatial dimensionremain rare. For example, Ramirez-Sierra et al.(2010) studied domiciliary infestation of four villageson the Yucatan peninsula, Mexico with regard toinsect sex, infection status and distance betweenhouses and the village boundary, the latter variablebeing suggested by observations and the outcome of amodel proposed by Slimi et al. (2009). In a compara-ble way, Roux et al. (2009) used several attributes toexplicitly characterise the spatial structure of aBrazilian village in the semi-arid region of Bahia: (i)distance to the village centre; (ii) distance to the spe-cific house where the majority of the insects wasfound; and (iii) relative situations of the domiciliaryunit (central or peripheral and connected or isolated).Such a characterisation contributed to the explana-tion of the presence of two triatomines: Panstrongylusgeniculatus (Latreille, 1811) (adults) and Triatomasordida (Stål, 1859) (juveniles). These two character-isations of the village structure remain subjective.Among works that specifically took into account thespatial dimension, Khan et al. (2010) used both spa-tial analysis and remote sensing to study the infesta-tion of Argentinean communities by Triatoma infes-tans (Klug, 1834). The Getis-Ord local spatial statis-
tic was used to identify spatial clusters correspondingto “hotspots of high-prevalence domestic infesta-tion”, while multivariate regression analysis wasapplied to identify the environmental and demo-graphic factors that could explain the inclusion of acommunity in a hotspot. To explain re-infestation,Kitron et al. (2006) used the Getis-Ord local spatialstatistic as focal statistic and the local K-function inorder to identify clusters around a priori knownsources for T. infestans and T. guasayana(Wygodzinsky and Abalos, 1951) dispersal. In addi-tion, Slimi et al. (2009) have proposed a cellularautomata model that permits the explicit considera-tion of both temporal and spatial dimensions to sim-ulate the infestation in a “virtual” village, whileBarbu et al. (2010) put forward a spatially explicitmodel to reconstruct observed spatial and temporalpatterns of house infestation by T. dimidiata in a vil-lage on the Yucatan peninsula, Mexico.
The objective of our approach, schematically pre-sented in Fig. 1, was to investigate the application of amethod for the identification and modelling of spatialmulti-scale patterns (part I) and the application of amultivariate descriptive data analysis to explain thepatterns identified (part II). The applicative context isthe study of the presence and abundance of Chagasdisease vectors (T. sordida and P. geniculatus) in a vil-lage in a semi-arid region of Bahia, Brazil. First, weapply the modelling approach proposed by Dray et al.(2006), based on the principal coordinates analysis ofa neighbour matrix (PCNM) (Borcard et al., 2004),consisting in the modelling of the spatial structure of aset of sampling sites, by orthonormal eigenvectors thatmaximise the Moran’s I index of spatial auto-correla-tion and thus characterise significant spatial patterns.Borcard et al. (2004), Dray et al. (2006) and Bellier etal. (2007) have investigated to what extent theseeigenvectors (considered as variables) explain one (ora set of) response variable(s) and Dray et al. (2006)proposed a data-driven model selection method basedon the Akaike information criterion (AIC). In this firstpart of our communication, the entomological dataand the methodology are described in a specificapplicative framework that emphasises the adapta-tions of Dray et al.'s work (2006).
Materials and methods
Study area
Santa Rita, belonging to the Iraquara municipality,is a rural locality at an altitude of about 700 m above
42

E. Roux et al. - Geospatial Health 6(1), 2011, pp. 41-51
Fig. 1. Schematic representation of the overall methodology used. AICc: corrected Akaike information criterion; DU: domiciliaryunit; FAMG: factorial analysis of mixed groups; PCNM: principal coordinate analysis of neighbour matrices.
Fig. 2. SPOT-5 image (copyright CNES/SPOT Image-Seas GuyaneProject) of the study site in panchromatic mode and spatial reso-lution of 2.5 m (acquisition date: 15 January 2007). Whitesquares represent houses, geo-positioned by means of a GPS.Dotted lines delimit the groups of dwellings mentioned in the text.
sea level with about 500 inhabitants in the central partof Bahia, in northeast Brazil. It is part of the environ-mental protection area Marimbus/Iraquara. A subjec-tive and broad-scale observation of the spatial struc-ture of the village shows a densely inhabited zone (herereferred to as the main hamlet) and four isolatedgroups of three to five houses, one in the south, denot-ed S in Fig. 2, and three in the north, denoted N, NN1and NN2, respectively.
The main hamlet and surrounding areas is shown inFig. 2, which is a SPOT-5 panchromatic image with aspatial resolution of 2.5 m emanating from the SeasGuyane Project (http://www.seas-guyane.org) andacquired, on 15 January 2007.
Collection methodology
The domiciliary unit (DU), i.e. the human dwellingand its peri-domiciliary space with all annexes asdefined by Silveira and Rezende (1994), constitutedthe sampling unit. For each of the 132 village DUs,geo-localized by means of a global positioning system(GPS) instrument (GARMIN eTrex Legend®), eggs,juveniles, adults and exuvii were collected fromOctober to December, 2007. In the homes, the insectswere searched for in cracks and crevices of walls,under mattresses, behind cabinets and tables, in boxesor in piles of clothing or objects. In the peri-domicil-iary spaces, every possible insect niche was considered:
43

E. Roux et al. - Geospatial Health 6(1), 2011, pp. 41-5144
plants (alive or dead), fences, henhouses, pig-sties cor-rals, warehouse deposits, stacks of tiles, bricks, stoneslabs and wood.
Entomological data
Table 1 summarises the results of triatomine cap-tures and Fig. 3 represents the data spatially. Overall195 eggs and 53 exuvii were found, while 154 juve-niles of the T. sordida species were captured. Twelvejuveniles were not identified, but there is a strong pre-sumption that these also belonged to the T. sordidaspecies. Similarly, due to the almost systematic pres-ence of T. sordida juveniles with eggs and exuvii, thesetwo latter stages were also assumed to belong to the T.sordida species.
The adults found belonged to the species T. sordida,T. lenti (Sherlock and Serafim, 1967), T. pseudomacu-lata (Correa and Espinola, 1964), P. lutzi (Neiva andPinto, 1923) and P. geniculatus. Forty-six T. sordidaspecimens were found but only five of the P. genicula-tus species. In one unique DU, 35 T. sordida specimenswere found, while the other infested DUs had only oneindividual (of variable species) each, except one whereone T. sordida and one P. geniculatus were found.
Adults and non-flying (here referred to as juveniles)specimens coexisted in five DUs, where four of themwere exclusively infested by T. sordida, while one DUwas infested by two T. sordida juveniles, one egg andone T. pseudomaculata adult.
In the analysis, we considered the cumulated num-ber of eggs, exuvii and juveniles of the T. sordidaspecies in order to characterise the non-flying stages(here referred to as juveniles). Presence of insects atthese evolution stages indicates suitable conditions forreproduction and development. Given the very lownumber of individuals found for some of the species,we considered only two adult species in the analysis:T. sordida and P. geniculatus (Table 1).
Spatial modelling
We applied the spatial modelling method proposedby Dray et al. (2006) as it provides the most explana-tory, spatial model given the entomological data. Inthe following, the different steps of the method aredetailed in the specific framework of our applicationby focusing on the methodological adaptations. Theimplementation of the method was performed bymeans of the free and open-source geographical
Fig. 3. Maps of vector occurrences. Small white squares represent DUs with no specimen found. (a) Juvenile abundance (blacksquares); (b) presence of adults of two species: T. sordida (large white squares) and P. geniculatus (grey squares).

S · y.j
E. Roux et al. - Geospatial Health 6(1), 2011, pp. 41-51 45
information system (GIS) GRASS (GRASSDevelopment Team, 2010) and the free R environ-ment for statistical computing (R Development CoreTeam, 2010).
Raw data pre-processing
The variable juveniles were first logarithmicallytransformed after the value of one had been added tothe data, in order to make the distribution more sym-metrical. No significant linear spatial trend was foundfor this variable. Consequently, the variable was notde-trended before being analysed (Borcard et al.,2004).
Due to the distribution of adults, we recoded thedata to obtain information on presence and absence.We then computed the complete disjunctive tableY=[yi,j]i=1, ..., N; j=1, ...2·S with yij ∈ {0,1}, and finally per-formed the following transformation of the indicatorvariables as described by Legendre and Gallagher(2001) and Pagès (2002):
where i and j represent the row and column indexes,respectively, y.. the sum of all cells of thepresence/absence species table, i.e. the product of thenumber of species (S) by the number of sites (N) andy.j the sum of the jth column. This coding ensures thatthe χ2 distance is used for site comparison in the fol-lowing, which is consistent with a presence/absence
coding of the species values and more generally withcategorical variables. It provides other propertiesdetailed below in terms of the spatial model selectioncriterion.
Neighbour matrices
Five types of neighbourhood structures (here alsocalled graphs) were tested as mentioned by Dray et al.(2006): the Delaunay triangulation graph, the Gabrielgraph, the relative neighbourhood graph, the mini-mum spanning tree, and distance based graph (dnn),considering that two sites i and j are neighbours ifd(i,j)<=γ.
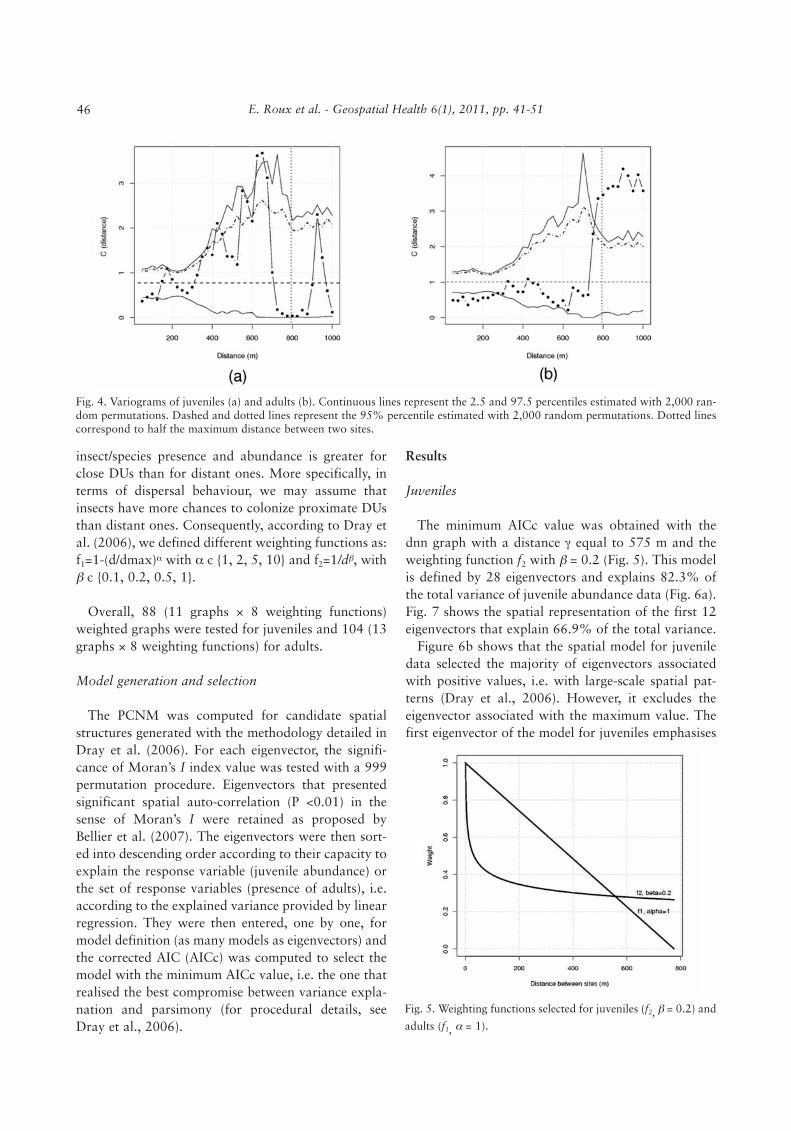
We explored several uniformly distributed values forγ and for each dataset (juveniles and adults). The min-imum value was set to 75 m. Taking univariate andmultivariate variograms into account (Wagner, 2003)for juvenile and adult data, respectively, the maximumvalue for γ was the maximum inter-site distance forwhich the empirical variogram was significant, i.e. 650m and 775 m for juveniles and adults, respectively(Fig. 4). Consequently, the sets of values for juvenilesand adults were Sγ
j = {75, 175, 275, 375, 475, 575,650} and Sγ
a = Sγj ∪ {675, 775}.
Neighbour matrice weighting
Previously presented spatial structures assign thesame weight to all links (weight = 1). However, wemay expect that DU similarity in terms of
y'ij = y.. · = ,yij
S · y.j
yijN ·
Table 1. Summary of Triatomine capture results.
Development stage / speciesTotalfound
Minimumfound per DU
Maximumfound per DU
Number ofinfested DUs
Exuvii, eggsand non-
flying stages
Eggs 195 4 65 6
Exuvii 53 1 23 10
Juveniles(Triatoma sordida)
166 1 106 10
Eggs + exuvii +juveniles
(called juveniles inthe study)
414 1 161 14
Adults
Triatoma sordida 461
(in all but one DU)35
(in one DU)12
Panstrongylusgeniculatus
5 1 1 5
Panstrongylus lutzi 3 1 1 3
Triatomapseudomaculata
2 1 1 2
Triatoma lenti 1 1 1 1
insect/species presence and abundance is greater forclose DUs than for distant ones. More specifically, interms of dispersal behaviour, we may assume thatinsects have more chances to colonize proximate DUsthan distant ones. Consequently, according to Dray etal. (2006), we defined different weighting functions as:f1=1-(d/dmax)α with α є {1, 2, 5, 10} and f2=1/dβ, withβ є {0.1, 0.2, 0.5, 1}.
Overall, 88 (11 graphs × 8 weighting functions)weighted graphs were tested for juveniles and 104 (13graphs × 8 weighting functions) for adults.
Model generation and selection
The PCNM was computed for candidate spatialstructures generated with the methodology detailed inDray et al. (2006). For each eigenvector, the signifi-cance of Moran’s I index value was tested with a 999permutation procedure. Eigenvectors that presentedsignificant spatial auto-correlation (P <0.01) in thesense of Moran’s I were retained as proposed byBellier et al. (2007). The eigenvectors were then sort-ed into descending order according to their capacity toexplain the response variable (juvenile abundance) orthe set of response variables (presence of adults), i.e.according to the explained variance provided by linearregression. They were then entered, one by one, formodel definition (as many models as eigenvectors) andthe corrected AIC (AICc) was computed to select themodel with the minimum AICc value, i.e. the one thatrealised the best compromise between variance expla-nation and parsimony (for procedural details, seeDray et al., 2006).
Results
Juveniles
The minimum AICc value was obtained with thednn graph with a distance γ equal to 575 m and theweighting function f2 with β = 0.2 (Fig. 5). This modelis defined by 28 eigenvectors and explains 82.3% ofthe total variance of juvenile abundance data (Fig. 6a).Fig. 7 shows the spatial representation of the first 12eigenvectors that explain 66.9% of the total variance.
Figure 6b shows that the spatial model for juveniledata selected the majority of eigenvectors associatedwith positive values, i.e. with large-scale spatial pat-terns (Dray et al., 2006). However, it excludes theeigenvector associated with the maximum value. Thefirst eigenvector of the model for juveniles emphasises
E. Roux et al. - Geospatial Health 6(1), 2011, pp. 41-51
Fig. 4. Variograms of juveniles (a) and adults (b). Continuous lines represent the 2.5 and 97.5 percentiles estimated with 2,000 ran-dom permutations. Dashed and dotted lines represent the 95% percentile estimated with 2,000 random permutations. Dotted linescorrespond to half the maximum distance between two sites.
Fig. 5. Weighting functions selected for juveniles (f2, β = 0.2) and
adults (f1, α = 1).
46

E. Roux et al. - Geospatial Health 6(1), 2011, pp. 41-51
Fig. 6. (a) Cumulative percentage of the explained variances by the selected spatial models for juvenile and adult data. Cumulativepercentages associated with the numbers of orthogonal eigenvectors chosen by the two models (28 and 32 eigenvectors for juvenilesand adults, respectively) are shown, as well as the cumulative percentages associated with the first 12 eigenvectors depicted in Figs.7 and 8. (b) and (c) Eigenvalues of the PCNM re-ordered by their capacity to explain juveniles and adults, respectively. Black barscorrespond to the eigenvalues associated with selected eigenvectors by the AICc selection procedure.
Fig. 7. Spatial representation of the first 12 eigenvectors of the selected spatial model for juveniles. Black and white squares corre-spond to positive and negative values of the eigenvector components, respectively. The square size is proportional to the absolutevalue of the eigenvector components. The eigenvectors are ranked by their capacity to explain juvenile abundance. This capacity isindicated by the percentage of variance of the juvenile data explained by the eigenvector. The other numbers correspond to the eigen-vector number in the model (from 1 to 12) and to the associated eigenvalue. The eigenvalues are proportional to the Moran’s I ofspatial autocorrelation (Dray et al., 2006).
47

E. Roux et al. - Geospatial Health 6(1), 2011, pp. 41-51
Fig. 8. Spatial representation of the first 12 eigenvectors of the selected spatial model for adults. See legend of Fig. 7 for explana-tions of symbols and numbers.
the DUs (black squares in Fig. 7) belonging to a bandoriented southwest-northeast corresponding to themain road crossing the village, which separates thesouth-eastern from the north-western part.Eigenvectors associated with negative values were alsoselected, as they are associated with local-scale spatialpatterns. In Fig. 7, spatial patterns associated witheigenvectors 2, 10 and 12 are shown to characterisevery local features associated with a particular area ofthe village, near DU no. 117, where the great majori-ty of the next-generation insects were found (43% ofthe exuvii, 16% of the eggs and 63% of the juveniles).
Adults
The minimum AICc value was obtained with the dnngraph with a distance γ equal to 775 m and the weight-ing function f1 with α = 1 (Fig. 5). It provides a linearweighting as a function of the distance between sites.The model is defined by 32 eigenvectors and explains79.9% of the total variance of the presence of adults(Fig. 6a). Fig. 8 shows the spatial representation of the
first 12 eigenvectors, which explains 58.8% of the totalvariance. The first eigenvector, corresponding to thehighest value, clearly discriminates the isolated DUgroups, especially the extreme northern ones denotedNN1 and NN2 in Fig. 2, associated with the presenceof P. geniculatus (Fig. 3b). The fourth eigenvector iscomparable with the first eigenvector of the juvenilemodel. The ninth eigenvector discriminates very centralDUs (black squares) from the peripheral ones (whitesquares). Local patterns were associated with differentparts of the main hamlet with a relatively high densityof houses: the north-western part (eigenvector 2), thenorth-eastern part (eigenvectors 7 and 11), the south-eastern part (eigenvectors 3, 10 and 12) and the south-western part (eigenvector 8).
Discussion
Where insects are transiently present and/or in verylow density in the domestic habitat, community par-ticipation has been found highly reliable for entomo-logic surveys and also shown to be more sensitive than
48

E. Roux et al. - Geospatial Health 6(1), 2011, pp. 41-51
manual collection (Barbu et al., 2010; Ramirez-Sierraet al., 2010). Although we initially chose manual col-lection, it was performed by the same person to avoidoperator bias. Moreover, this procedure permittedidentification of the infestation process around highlyinfested sites, something that would not have beenpossible even by long-term, continuous collectionbased on community participation. Nevertheless,manual collection was necessary to make a first inven-tory of the situation, drawing attention to the publichealth issues associated with triatomines and toencourage people to bring insects to the TriatominaeInformation Centres (Postos de Informação deTriatomíneos = PIT), installed in the villages since the1980s. However, it should be admitted that the chosencollection procedure prevents the study of temporaldynamics. To overcome this limitation, communityparticipation should be seriously considered.
Dray et al. (2006) take into account all the eigen-vectors provided by PCNM computation. Thisapproach provides highly explanatory variables.However, such selected variables do not necessarypresent significant spatial patterns in the sense ofMoran’s I. The set of selected variables can comprisehighly specific explanatory variables that can be diffi-cult to interpret within the application context andthat cannot be used for knowledge generalization.
In Bellier et al. (2007), only one spatial structure isdefined corresponding to the truncated distancematrix proposed in Borcard et al. (2004). Only eigen-vectors that present a significant spatial auto-correla-tion according to the Moran’s I were selected. Thisresults in a model with strong spatial correlations buta model that depends much on a priori and arbitrarychosen spatial structures. In this paper, we benefitfrom the advantages of these two approaches, whileavoiding their drawbacks: (i) by performing a spatialmodel selection with no a priori spatial structure, and;(ii) by taking into account model components with astrong spatial correlation.
Given the data pre-processing used, model selectioncriteria differ for juveniles and adults, while being con-sistent with the data characteristics. For juveniles char-acterised by a quantitative variable, the selected spatialmodel realises the compromise between the model par-simony and the minimum variance of multiple linearregression residuals. For adults, on the other hand,investigating the presence/absence data given theweighting of the indicators of the complete disjunctivetable, the selected model realises the compromisebetween the model parsimony and the maximum cor-relation ratio.
The first eigenvector of the spatial model for adultinsects essentially explains the P. geniculatus speciesdistribution. It corresponds to the first eigenvector ofthe PCNM, associated with a large-scale variation,more specifically with the distance to the village centrein the latitudinal direction. The application of themethodology for explaining spatial repartition of theP. geniculatus species is questionable due to the lownumber of infested sites (n = 5) and because thisspecies was clearly associated with isolated DUs locat-ed in the northern part of the village, except for onespecimen. A de-trended version of this species abun-dance data, i.e. the residuals of a multiple linearregression model on geographic coordinates, couldhave been considered (Borcard et al., 2004; Dray etal., 2006). However, due to the low number of infest-ed sites, and the fact that only one individual has beenfound at each site, these de-trended data differed toomuch from the true observations. Moreover, weapplied the methodology on the de-trended version ofthe adult data (Legendre and Gallagher, 2001). Theselected model did not provide a better explanationand was not more parsimonious than the model select-ed with the proposed methodology.
Models obtained by the methodology used result inhigh numbers of components (28 and 32 for juvenilesand adults, respectively) and interpreting each of themis a difficult task. As in Bellier et al. (2007), eigenvec-tor clustering could result in a better insight regardingthe different significant scales identified by the model.However, mapping of eigenvectors with explanatoryvariables (environment, behavioural, etc.), as done inpart II of this paper, provides more information.
For both juvenile and adults, spatial patterns areassociated with both local and global scales. However,the spatial model for juveniles is defined by a morelocalized neighbourhood (γ = 575 m) than the modelfor adults (γ = 775 m). Moreover, the weights of thelinks for the juvenile spatial structure decrease fast asfunction of the inter-site distance, whereas theseweights decrease linearly with the inter-site distancefor adults (Fig. 5). These results indicate that the spa-tial correlation for juveniles are associated with morelocal scales and can be interpreted as “near-to-near”dispersal. Barbu et al. (2010) have demonstrated thatT. dimidiata disperse at rather small distances too. Inour case, local-scale phenomena for juveniles seemessentially derived from a “near-to-near” dispersal ofthe insects associated with DU no. 117 that was hostto the great majority of the insects (43% of the exuvii,16% of the eggs and 63% of the juveniles). A similarinfestation, or re-infestation, process around highly
49

E. Roux et al. - Geospatial Health 6(1), 2011, pp. 41-51
infested sites has previously been observed forT. infestans and T. guayasana (Kitron et al., 2006;Ramirez-Sierra et al., 2010).
Large-scale spatial patterns appear to be linked tothe distance to the centre of the main hamlet, this dis-tance being positively correlated with the presence ofinsects. This suggests a colonisation from the wildenvironment surrounding the village and a progressiveinfestation towards the village centre as alreadyobserved and modelled (Slimi et al., 2009; Ramirez-Sierra et al., 2010; Barbu et al., 2010). Thus, by objec-tive and quantitative approaches, two dispersalmodalities can be derived: (i) infestation steming fromthe “natural” environment surrounding villages, and;(ii) local dispersal from one domiciliary unit of a vil-lage to the nearest one.
Conclusion
The methodology presented here makes it possibleto spatially model the presence and abundance of dis-ease vectors at different scales. It also supports theconstruction of a hypothesis regarding the dispersalbehaviour of the insects. Infestation can originatefrom the “natural” environment surrounding villagesas well as be the result of local dispersal from onedomiciliary unit of a village to another.
The methodology presented here can be applied toother geo-localised data, e.g. disease cases. Naturally,many factors influence the eco-epidemiological systemand consequently the spatial patterns of its observablecharacteristics (presence and abundance of the vec-tors/hosts, prevalence/incidence of disease). In Part IIof this paper, we propose a method to hierarchicallyexplore a multi-factorial set of data to explain the spa-tial patterns observed.
Acknowledgements
The field work, realised by A. F. Venâncio during her PhD
studies, benefitted from collaboration and methodological sup-
port elaborated during the CNPq-IRD programme “Ecologie du
paysage, dynamique des agroécosystèmes et complexes
pathogènes: la définition du risque éco-épidémiologique dans le
cas de la trypanosomose américaine, EDCTA” (2002-2004). We
are thankful for the authorisation for field work in the APA by
the Brazilian institutions (IBAMA, CECAV, Ministério da
Saúde, Comitê de Ética em Pesquisa and Secretaria de Meio
Ambiente e Recursos Hídricos do Estado da Bahia - SEMARH,
Superintendência de Biodiversidade, Florestas e Unidades de
Conservação - SFC).
The authors thank the inhabitants of Santa Rita for their par-
ticipation and the SEAS-Guyane project for providing the
SPOT-5 image.
References
Abad-Franch F, Ferraz G, Campos C, Palomeque FS, Grijalva
MJ, Aguilar HM, Miles MA, 2010. Modeling disease vector
occurrence when detection is imperfect: infestation of
Amazonian palm trees by Triatomine bugs at three spatial
scales. PLoS Negl Trop Dis 4, e620.
Barbu C, Dumonteil E, Gourbière S, 2010. Characterization of
the dispersal of non-domiciliated Triatoma dimidiata through
the selection of spatially explicit models. PLoS Negl Trop Dis
4, e777.
Bellier E, Monestiez P, Durbec J-P, Candau J-N, 2007.
Identifying spatial relationships at multiple scales: principal
coordinates of neighbour matrices (PCNM) and geostatistical
approaches. Ecography, 385-399.
Borcard D, Legendre P, Avois-Jacquet C, Tuomisto H, 2004.
Dissecting the spatial structure of ecological data at multiple
scales. Ecology 85, 1826-1832.
Costa J, Peterson AT, Beard CB, 2002. Ecologic niche modeling
and differentiation of populations of Triatoma brasiliensis
Neiva, 1911, the most important Chagas’ disease vector in
northeastern Brazil (Hemiptera, Reduviidae, Triatominae).
Am J Trop Med Hyg 67, 516-520.
Dray S, Legendre P, Peres-Neto PR, 2006. Spatial modelling: a
comprehensive framework for principal coordinate analysis of
neighbour matrices (PCNM). Ecol Model 196, 483-493.
Dumonteil E, Gourbiére S, 2004. Predicting Triatoma dimidia-
ta abundance and infection rate: a risk map for natural trans-
mission of Chagas disease in the Yucatan peninsula of Mexico.
Am J Trop Med Hyg 70, 514-519.
GRASS Development Team, 2010. Geographic Resources
Analysis Support System (GRASS GIS) Software. Open Source
Geospatial Foundation. USA. http://grass.osgeo.org (accessed
on December 2010)
Khan OA, Davenhall W, Ali M, Castillo-Salgado C, Vazquez-
Prokopec G, Kitron U, Soares Magalhaes RJ, Clements A,
2010. Geographical information systems and tropical medi-
cine. Ann Trop Med Parasitol 104, 303-318.
Kitron U, Clennon JA, Cecere MC, Gürtler RE, King CH,
Gonzalo M, Vazquez-Prokopec G, 2006. Upscale or down-
scale: applications of fine scale remotely sensed data to Chagas
disease in Argentina and schistosomiasis in Kenya. Geospat
Health 1, 49-58.
Legendre P, Eugene Gallagher E, 2001. Ecologically meaningful
transformations for ordination of species data. Oecologia 129,
271-280.
Pagès J, 2002. Analyse factorielle multiple appliquée aux vari-
ables qualitatives and aux données mixtes. Rev Stat Appl 50,
5-37.
50

E. Roux et al. - Geospatial Health 6(1), 2011, pp. 41-51
Peterson AT, 2006. Ecologic niche modeling and spatial patterns
of disease transmission. Emerg Infect Dis 12, 1822-1826.
Peterson AT, 2007. Ecological niche modelling and understand-
ing the geography of disease transmission. Vet Res 43, 393-
400.
Peterson AT, Sánchez-Cordero V, Beard CB, Ramsey JM, 2002.
Ecologic niche modeling and potential reservoirs for Chagas
disease, Mexico. Emerg Infect Dis 8, 662-667.
R Development Core Team. 2010. R: a language and environ-
ment for statistical computing. R Foundation for Statistical
Computing. Vienna, Austria.
Ramirez-Sierra MJ, Herrera-Aguilar M, Gourbière S,
Dumonteil E, 2010. Patterns of house infestation dynamics by
non-domiciliated Triatoma dimidiata reveal a spatial gradient
of infestation in rural villages and potential insect manipula-
tion by Trypanosoma cruzi. Trop Med Int Health 15, 77-86.
Romaña CA, 2004. Eco-épidémiologie. In: Lecourt,
Dictionnaire de la pensée médicale, Presses Universitaire de
France (PUF), 378-382.
Romain G, Roux E, Berger F, Stefani A, Gaborit P, Carinci R,
Issaly J, Carme B, Dusfour I. 2011. Unraveling relationships
between Anopheles darlingi (Diptera: Culicidae) densities,
environmental factors and malaria incidences: understanding
variable patterns of transmission in French Guiana (South
America). Ann Trop Med Parasitol 105, 107-122.
Roux E, de Fátima Venâncio A, Girres J-F, Romaña C, 2009.
High resolution remote sensing and heterogeneous data analy-
sis for local screas. IN: XIV Simpósio Brasileiro de
Sensoriamento Remoto, Natal, Brasil, pp. 7577-7586.
Silveira AC, Rezende DF, 1994. Epidemiologia e controle da
transmissão vetorial da doença de Chagas. Rev Soc Bras Med
Trop 27, 11-22.
Slimi R, El Yacoubi S, Dumonteil E, Gourbière S, 2009. A cel-
lular automata model for Chagas disease. Appl Math Model
33, 1072-1085.
Wagner, 2003. Spatial covariance in plant communities: inte-
grating ordination, geostatistics, and variance testing. Ecology
84, 1045-1057.
51