spower, the economics of the solar market, and government ... · spower, the economics of the solar...
TRANSCRIPT

sPower, the Economics of the Solar Market,
and Government Policy
September 2017

2

3
What was done different that helped sPower’s success?
• Spotting the opportunity to research clean energy when most investors (PE
and venture firms) had given up on clean tech
• Seizing the right business model
• Finding management from outside the industry
• Very conservative capital structure – Initially funded 100% with equity
capital
• Keep it simple
• Luck

4

5
Devastated Landscape
Greentech Media – incomplete list of the solar firms that have left the building – either by closure,
bankruptcy, or fire-sale acquisition:
2009 – 2010
Bankrupt, closed
• Advent Solar (emitter wrap-through Si) acquired by Applied Materials
• Applied Solar (solar roofing) acquired by Quercus Trust
• OptiSolar (a-Si on a grand scale) closed
• Ready Solar (PV installation) acquired by SunEdison
• Solasta (nano-coaxial solar) closed
• SV Solar (low-concentration PV) closed
• Senergen (depositing silane onto free-form metallurgical-grade Si substrates) closed
• Signet Solar (a-Si) bankrupt
• Sunfilm (a-Si) bankrupt
• Wakonda (GaAs) closed
2011
Bankrupt, closed
• EPV Solar (a-Si) bankrupt
• Evergreen (drawn Si) bankrupt
• Solyndra (CIGS) bankrupt
• SpectraWatt (c-Si) bankrupt
• Stirling Energy Systems (dish engine) bankrupt
Acquisition, sale
• Ascent Solar (CIGS) acquired by TFG Radiant
• Calyxo (CdTe) acquired by Solar Fields from Q.cells
• HelioVolt (CIGS) acquired by Korea's SK Innovation
• National Semiconductor Solar Magic (panel optimizers) exited systems business
• NetCrystal (silicon on flexible substrate) acquired by Solar Semiconductor
• Soliant (CPV) acquired by Emcore

6
Devastated Landscape (cont’d)
2012
Bankrupt, closed
• Abound Solar (CdTe) bankrupt
• AQT (CIGS) closed
• Ampulse (thin silicon) closed
• Arise Technology (PV modules) bankrupt
• Azuray (microinverters) closed
• BP (c-Si panels) exits solar business
• Centrotherm (PV manufacturing equipment) bankrupt
• CSG (c-Si on glass) closed by Suntech
• Day4 Energy (cell interconnects) delisted from TSX exchange
• ECD (a-Si) bankrupt
• Energy Innovations (CPV) bankrupt
• Flexcell (a-Si roll-roll BIPV) closed
• GlobalWatt (solar) closed
• GreenVolts (CPV) closed
• Global Solar Energy (CIGS) closed
• G24i (DSCs) bankrupt in 2012, re-emerged as G24i Power
with new investors
• Hoku (polysilicon) shut down its Idaho polysilicon production
facility
• Inventux (a-Si) bankrupt
• Konarka (OSCs) bankrupt
• Odersun (CIGS) bankrupt
• Pramac (a-Si panels built with equipment from Oerlikon)
insolvent
• Pairan (Germany inverters) insolvent
• Ralos (developer) bankrupt
• REC Wafer (c-Si) bankrupt
• Satcon (BoS) bankrupt
• Schott (c-Si) exits c-Si business
• Schuco (a-Si) shutting down its a-Si business
• Sencera (a-Si) closed
• Siliken (c-Si modules) closed
• Skyline Solar (LCPV) closed
• Siemens (CSP, inverters, BOS) divestment from solar
• Solar Millennium (developer) insolvent
• Solarhybrid (developer) insolvent
• Sovello (Q.cells, Evergreen, REC JV) bankrupt
• SolarDay (c-Si modules) insolvent
• Solar Power Industries (PV modules) bankrupt
• Soltecture (CIGS BIPV) bankrupt
• Sun Concept (developer) bankrupt

7
Devastated Landscape (cont’d)
2012
Acquisition, fire-sale, restructuring
• Oelmaier (Germany inverters) insolvent, bought by
agricultural supplier Lehner Agrar
• Q.Cells (c-Si) insolvent, acquired by South Korea's Hanwha
• Sharp (a-Si) backing away from a-Si, retiring 160 of its 320
megawatts in Japan
• Solibro (CIGS) Q-Cells unit acquired by China's Hanergy
• Solon (c-Si) acquired by UAE's Microsol
• Scheuten Solar (BIPV) bankrupt, then acquired by Aikosolar
• SolFocus (CPV) layoffs, restructuring for sale
• Sunways (c-Si, inverters) bought by LDK, restructuring to
focus on BIPV and storage
2013
Bankrupt, closed, restructured
• Bosch (c-Si PV module) exits module business
• Concentrator Optics (CPV) bankrupt
• Suntech Wuxi (c-Si) bankrupt
• ISET (CIGS) moving into "microsolar"
• MiaSolé (CIGS) acquired by China's Hanergy
• Nanosolar (CIGS) restructuring for sale
• Wuerth Solar (installer) business turned over to BayWa

8

9
Quality Cash FlowsP
ort
foli
o
Co
mp
os
itio
n Off-take
MW233 MW 183 MW 142 MW 129 MW 121 MW 110 MW 109 MW 106 MW 1,135 MW
% of
Portfolio~18% ~14% ~11% ~10% ~9% ~8% ~8% ~8% ~87%
Total /Wtd. Avg.
2.7%
1.5%
2.8% 2.8%
1.5% 1.5%
2.8%
1.5%
0.0%
1.0%
2.0%
3.0%
4.0%
SCE LADWP PacifiCorp PG&E SCPPA City of Palo Alto Duke EnergyProgress
CDWR
Market Cost of Credit (1)
Average:
2.1%
-------------------------------------------------------------------------------------------------

10

11
sPower Historical Growth
1. Includes ~29 MW which reached COD prior to 2014.
2. Source: SNL, company filings, company websites and investor presentations.
3. Reflects contracted US solar projects currently under construction or near-construction.
97 486
1,090 1,558
2,058
2,808
3,558
4,458
5,458
0
1,000
2,000
3,000
4,000
5,000
6,000
2014 2015 2016E 2017E 2018E 2019E 2020E 2021E 2022E
(MW)
Solar
Wind
Operational Platform
492
587
1,079
0
200
400
600
800
1,000
1,200
(MW)
US Solar PV Assets Brought Online (Since 2014) (2)

12

13
Future Demand for Utility Scale Solar & Wind: 3 Main Business Drivers
1. Corporate Demand:
• 50 gigawatts with Fortune 500 companies over next 5 years
• Leaders: Amazon, Google, Apple, Johnson & Johnson, Microsoft, Wal-Mart, IBM, Intel
2. State Renewable Portfolio Standards (RPS) & Other State Incentives:
• 80 + gigawatts over next decade
3. China Investment & Cost Curve Implications:
• sPower buildout costs went from $2 mw/hour to about $1 and heading to .85 - .90 in just 3 years!
• China plans to spend $350 billion on clean energy over the next 4 years and create 13 million
jobs = much lower costs
Near Term Issue:
• Suniva Trade Tariff case

14

15
Corporate and Industrial Market
Largest Market Opportunity For Renewables – 60 GW of Renewables by 2023
58 COMPANIES BUYING 60 GW OF RENEWABLES BY 2023

16
17
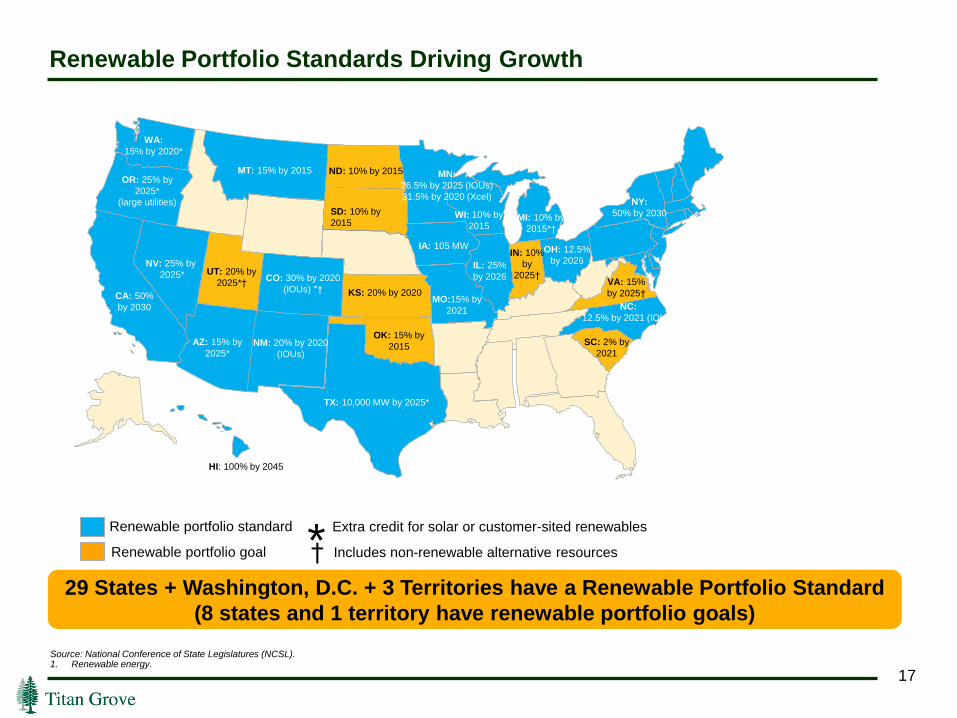
Renewable Portfolio Standards Driving Growth
WA:
15% by 2020*
OR: 25% by
2025*
(large utilities)
CA: 50%
by 2030
MT: 15% by 2015
NV: 25% by
2025* UT: 20% by
2025*†
AZ: 15% by
2025*
ND: 10% by 2015
NM: 20% by 2020
(IOUs)
HI: 100% by 2045
CO: 30% by 2020
(IOUs) *†
OK: 15% by
2015
MI: 10% by
2015*†
WI: 10% by
2015
MO:15% by
2021
IA: 105 MWIN: 10%
by
2025†IL: 25%
by 2026
OH: 12.5%
by 2026
NC:
12.5% by 2021 (IOUs)
VA: 15%
by 2025†KS: 20% by 2020
Renewable portfolio standard
Renewable portfolio goal Includes non-renewable alternative resources*Extra credit for solar or customer-sited renewables
†
TX: 10,000 MW by 2025*
SD: 10% by
2015
SC: 2% by
2021
NY:
50% by 2030
MN:
26.5% by 2025 (IOUs)
31.5% by 2020 (Xcel)
Source: National Conference of State Legislatures (NCSL).1. Renewable energy.
29 States + Washington, D.C. + 3 Territories have a Renewable Portfolio Standard
(8 states and 1 territory have renewable portfolio goals)

18

19
Solar Cost Curve
1. Source: National Renewable Energy Lab.
2. Bloomberg New Energy Finance (BNEF).
3. Based on tracking projects in high solar resource states (AZ, CA, NV, NM, TX).
Declining Solar Construction Costs (1)
$1.78
$0.00
$0.25
$0.50
$0.75
$1.00
$1.25
$1.50
$1.75
$2.00
($ / Watt)
$1.42
$1.13$1.07
$1.02$0.97
$0.93
2016E1 2017E220151 2018E2 2019E2 2020E2 2021E2

20

21
Solar Cost Curve (cont’d)
1. Bloomberg New Energy Finance (BNEF).
2. Based on tracking projects in high solar resource states (AZ, CA, NV, NM, TX).
Unsubsidized Cost of Utility Scale Solar Approaching Parity (1)
$25
$35
$45
$55
$65
$75
2016 2017 2018 2019 2020 2021 2022 2023 2024 2025
($ / MWh)Levelized Cost of Electricity (LCOE)
Utility Scale PV (unsubsidized) Utility Scale PV (subsidized) Natural Gas Coal
Question: The incremental China benefit?

22

23
Clean Energy: The “Jobs Story”
• sPower’s projects employed nearly 3,000 American workers last year. Jobs that didn’t exist a few
years ago. Skilled jobs and the majority are union jobs (e.g. International Brotherhood of
Electrical Workers 2.5 million labor hours for first gigawatt)
• 3 million + Americans employed in clean energy/ energy efficiency & growing 5% + = 150,000
new jobs each year
• Opportunity to increase by multiples due to 3 major business drivers
• Note: Only 50,000 coal miners in our nation (see graph)

24

25
Clean Energy: The “Jobs Story” (cont’d)
• US coal mines employ fewer than 60,000 workers today
• Industry has been in decline for past 100 years
0k
250k
500k
750k
1,000k
1900 10 20 30 40 50 60 70 80 90 2000 10 15
1 Million

26

27
New State Momentum
• Hawaii: 100% clean energy
• California: new bill for 100% clean energy by 2045 – 6th largest economy in the world
• CA/NY: commit to exceed “Clean Power Plan”
• 9 State Regional Greenhouse Gas Initiative (RGGI) Announcement
• Red & Blue: Large projected non-RPS growth in red & blue states: TX, NC, GA, UT, CA

28

29
Utility Positive Behavior: Seeing the Future
• FPL building 600 megawatts of solar in Florida
• XCEL says 200 megawatts of new solar and 450 megawatts of new wind are cheaper than coal & gas
• “This is the first time we have seen, purely on a price basis, solar projects made a cut – without
considering carbon costs or a need to comply with a renewable standard – strictly on an economic
basis.”
David Eves, President of Xcel
• “Economics are driving what’s happening in the industry. We’re looking at prices in the low teens to
low 20’s in dollars/mwh. That beats gas, even at today’s prices. I like to say we backed up the truck
because the fuel of tomorrow is on sale today.”
Ben Fowke, CEO of Xcel
• “We are committed to continuing our path of moving to a clean energy economy, notwithstanding
President Trump’s announcement about withdrawing from the global climate pact. Our future is driven by
renewables due to the lowering costs.”
Nick Akins, CEO of AEP
• AEP proposes to build $4.5 billion wind farm in Oklahoma that will create nearly 10,000 jobs

30

31
Utility Negative Behavior: Fighting PURPA
PURPA: Requires utilities to buy clean energy when it is equal or cheaper than building a new plant
Duke Energy: Recently introduced new interconnection obstacles to slow PURPA clean energy projects
in North Carolina
Montana: The largest state utility lobbied successfully to suspend new PURPA clean energy projects
now that they are cost competitive with fossil fuel fired electricity
• To further kill solar, the Montana PUC is “limiting solar to projects that have 5 years of
contractual pricing”

32

33
A Glimpse Into the Future: The Nevada Story
• 2015 - Nevada Power kills rooftop solar: December 2015 – Nevada slashes utility payments to
rooftop solar owners
• 2016-2017 - Grassroots fight:
• Thousands of solar workers, energy advocates, customers, MGM resorts, Tesla, ballot
initiative, etc.
• Election fight – Joe Heck anti solar vs. Catherine Cortez pro solar – Cortez won
• 2017 legislative session – 11 energy bills passed, including reinstatement of rooftop solar
payments
• Governor signs bill to reinstate net metering payments
• New 40% RPS standard approved by legislature (vetoed by Governor)

34
35
A Glimpse Into the Future: The AES Story
AES is a fortune 200 global power company with $14 billion in revenues and 19,000 employees
February 24, 2017: AES announces plans to buy sPower, our nation’s largest private solar utility, for
$1.6 billion
March 21, 2017: AES announces plans to shut 3 gigawatts of coal fired electric plants in Ohio!
July 1, 2017: AES announces it is shifting to renewables and natural gas
July 11, 2017: AES announces joint venture with Siemens to create global energy storage venture
July 18, 2017: AES announces plan to divest $1 billion Philippine coal fired electric plant

36

37
Conclusion
• Dramatic acceleration of clean energy
• Driven by:
• China led cost curve decline
• Corporate America’s energy buying
• State & local led initiatives (e.g. RPS)
• Job creation
• Fortune 500 energy companies morphing to be clean energy leaders

38

39
Q & A