sr 25 @ bolsa nlt field report no. 5
TRANSCRIPT
SR 25 @ BOLSA NLT FIELD REPORT NO. 5
March 12, 2021
Caltrans Highway Operations [email protected]
Abstract TMC between January 25th-29th, 2021 M-Fri at SR 25 @ Bolsa Rd. & Bloomfield Ave.

Sixth Turning Movement Count (TMC) Data Collection Summary
Implementation of No Left Turn (NLT) from Bolsa onto SR 25 This report summarizes Turning Movement Count (TMC) data collection for before and after implementation of No Left Turn (NLT) interim study from Bolsa onto SR 25. This pilot project was initiated on August 10th, 2020 for six months up to February 2021. The “No Left Turn” (NLT) restriction is from 3 pm to 7 pm, Monday to Friday from Bolsa onto SR 25. Bloomfield/SR 25 intersection (West of Bolsa/SR 25 intersection) is considered as an alternative route for left turn movements from Bolsa onto SR 25. TMC data are collected for both intersections before and after implementation of No Left Turn from Bolsa onto SR 25. Figure 1 shows the intersection locations for TMC data collection.
Figure 1 Area Map of Locations 1 & 2
Figure 1 shows the sign were installed for No Left Turn restriction at Bolsa.
Figure 2 - No Left Turn Restriction Sign at Bolsa
TMC data were collected for five consecutive days Jan 25th -29th. TMCs were collected for both intersections during PM peak period from 2:00 p.m. – 8:00 p.m. every 15 minutes. The summary of TMC are shown as below:
Count Date TMC-1 8/10/2020 - 8/14/2020 TMC-2 8/17/2020 - 8/21/2020 TMC-3 9/14/2020 - 9/18/2020 TMC-4 10/12/2020 - 10/16/2020 TMC-5 11/16/2020 - 11/20/2020 TMC-6 1/25/2021 - 1/29/2021

Table 1 Location 1: Bloomfield Ave/SR 25
PM Peak 3:30-4:30 SB (SR 25) WB (Bloomfield Ave) NB (SR 25) Date Thru Left Right Left Right Thru
1/25/2021 1300 67 62 64 13 640 1/26/2021 1299 89 61 82 8 622 1/27/2021 1143 38 72 44 12 483 1/28/2021 1201 47 104 62 14 684 1/29/2021 1266 94 68 30 11 701
Average 1242 67 73 56 12 626 PHF 0.93 0.83 0.80 0.81 0.67 0.93
Table 2 Location 2: Bolsa Rd/SR 25
PM Peak 3:30-4:30 SB (SR 25) WB (Bolsa Rd) NB (SR 25) Date Thru Left Right Left Right Thru
1/25/2021 1388 4 5 6 16 622 1/26/2021 1371 3 4 17 13 617 1/27/2021 1221 3 1 7 9 479 1/28/2021 1236 1 1 7 12 552 1/29/2021 1293 3 3 13 10 669
Average 1302 3 3 10 12 588 PHF 0.94 0.39 0.60 0.73 0.58 0.92
The p.m. peak hour (3:30-4:30) data for the average of five days TMCs at the study intersections are illustrated in the Figure 3.
Figure 3 - Turning Movement Count (Average September 14th-18th, PM peak 3:30-4:30)

In Report No. 1, submitted on September 8, data were also collected for the week of August 17th (after No-Left Turn Restriction) for five consecutive days after implementing of Left Turn movement resection from Bolsa onto SR 25. Table below compares the turning movement summary for Left-Turn movement from Bolsa location onto SR 25.
Table 3 - Comparison of No Left Turn from Bolsa Rd onto SR 25
PM Peak Volume
August 10th-14th 2020
January 25th-29th 2021
WB (Bolsa Rd) WB (Bolsa Rd) Right Left Right Left
Monday 11 155 5 6 Tuesday 1 84 4 17
Wednesday 0 76 1 7 Thursday 9 161 1 7
Friday 8 149 3 13 Average 6 125 3 10
PHF 0.52 0.85 0.60 0.73 As shown in Table 3 by comparing left turn movement from Bolsa onto SR 25 decreased from 125vph to 10vph after NLT restriction at Bolsa. This means that 10vph still make an illegal turning movement from Bolsa onto SR 25. While, drivers were informed by PCMS in advance of the closure’s implementation. Way finding applications including Waze and Google Maps continue to be engaged. The reduction in left turn violations can be attributed to enhanced enforcement by the CHP in addition to the continued communication with the way-finding application owners. Furthermore, there is an increase in left turns from Bloomfield Avenue. Figure 4 shows the illegal left turns from WB Bolsa to SB 25 has been significantly reduced, and the traffic has increased at Bloomfield Ave between TMC 2 and TMC 5. This suggested that the motorists have been forced to use the mainline routes or elsewhere without bypass through Bolsa Rd or Bloomfield Ave in the PM peak hours.
Figure 4 - Bolsa WB Left Turn VS. Bloomfield Ave WB Left Turn
020406080
100120140
TMC1 TMC2 TMC3 TMC4 TMC5 TMC6
vph
Average Peak Hour (Bolsa WB LT)
020406080
100
TMC1 TMC2 TMC3 TMC4 TMC5 TMC6
vph
Average Peak Hour (Bloomfield WB LT)

Table 4 and Table 5 show the summary of all peak-hour volumes at the 2 intersections of SR 25/Bolsa Rd and SR 25/Bloomfield Ave:
Table 4 - SR 25/BOLSA RD
TMC-1 | PM Peak 3:30-4:30 SB (SR 25) WB (Bolsa Rd) NB (SR 25) 8/10/2020 - 8/14/2020 Thru Left Right Left Right Thru
Monday 8/10/2020 1146 8 11 155 14 667 Tuesday 8/11/2020 1212 7 1 84 13 591
Wednesday 8/12/2020 1295 5 0 76 9 616 Thursday 8/13/2020 1202 4 9 161 13 644
Friday 8/14/2020 1157 7 8 149 5 714 Average 1202 6 6 125 11 646
TMC-2 | PM Peak 3:30-4:30 SB (SR 25) WB (Bolsa Rd) NB (SR 25) 8/17/2020 - 8/21/2020 Thru Left Right Left Right Thru
Monday 8/17/2020 1193 1 13 143 9 578 Tuesday 8/18/2020 1275 2 10 65 15 585
Wednesday 8/19/2020 1323 1 3 28 19 580 Thursday 8/20/2020 1210 4 12 75 20 646
Friday 8/21/2020 1177 1 8 71 21 656 Average 1236 2 9 76 17 609
TMC-3 | PM Peak 3:30-4:30 SB (SR 25) WB (Bolsa Rd) NB (SR 25) 9/14/2020 - 9/18/2020 Thru Left Right Left Right Thru
Monday 9/14/2020 1257 6 12 39 20 705 Tuesday 9/15/2020 1303 7 10 27 21 657
Wednesday 9/16/2020 1179 5 9 71 14 732 Thursday 9/17/2020 1293 0 4 31 27 673
Friday 9/18/2020 1226 1 12 79 15 790 Average 1252 4 9 49 19 711
TMC-4 | PM Peak 3:30-4:30 SB (SR 25) WB (Bolsa Rd) NB (SR 25) 10/12/2020 - 10/16/2020 Thru Left Right Left Right Thru
Monday 10/12/2020 1296 4 16 35 12 777 Tuesday 10/13/2020 1300 5 18 6 16 711
Wednesday 10/14/2020 1208 8 11 69 15 694 Thursday 10/15/2020 1276 7 20 66 8 741
Friday 10/16/2020 1203 3 13 74 23 807 Average 1257 5 16 50 15 746
TMC-5 | PM Peak 3:30-4:30 SB (SR 25) WB (Bolsa Rd) NB (SR 25) 11/16/2020 - 11/20/2020 Thru Left Right Left Right Thru
Monday 11/16/2020 1312 8 11 27 12 707 Tuesday 11/17/2020 1183 6 3 50 9 722

Wednesday 11/18/2020 1310 3 2 21 11 640 Thursday 11/19/2020 1177 8 10 94 7 795
Friday 11/20/2020 1076 8 15 162 15 783 Average 1212 7 8 71 11 729
TMC-6 | PM Peak 3:30-4:30 SB (SR 25) WB (Bolsa Rd) NB (SR 25) 1/25/2021 - 1/29/2021 Thru Left Right Left Right Thru
Monday 1/25/2021 1388 4 5 6 16 622 Tuesday 1/26/2021 1371 3 4 17 13 617
Wednesday 1/27/2021 1221 3 1 7 9 479 Thursday 1/28/2021 1236 1 1 7 12 552
Friday 1/29/2021 1293 3 3 13 10 669 Average 1302 3 3 10 12 588
Table -5: SR 25/BLOOMFIELD AVE
TMC-1 | PM Peak 3:30-4:30 SB (SR 25) WB (Bloomfield Ave) NB (SR 25)
8/10/2020 - 8/14/2020 Thru Left Right Left Right Thru Monday 8/10/2020 1246 141 118 46 12 601 Tuesday 8/11/2020 1197 73 115 32 9 624
Wednesday 8/12/2020 1241 135 95 50 11 643 Thursday 8/13/2020 1139 120 181 69 14 665
Friday 8/14/2020 1027 155 177 98 15 722 Average 1170 125 137 59 12 651
TMC-2 | PM Peak 3:30-4:30 SB (SR 25) WB (Bloomfield Ave) NB (SR 25)
8/17/2020 - 8/21/2020 Thru Left Right Left Right Thru Monday 8/17/2020 1098 134 143 73 9 719 Tuesday 8/18/2020 1301 149 86 97 10 588
Wednesday 8/19/2020 1155 96 68 37 10 554 Thursday 8/20/2020 1065 105 123 76 13 622
Friday 8/21/2020 1003 207 163 107 28 540 Average 1124 138 117 78 14 605
TMC-3 | PM Peak 3:30-4:30 SB (SR 25) WB (Bloomfield Ave) NB (SR 25)
9/14/2020 - 9/18/2020 Thru Left Right Left Right Thru Monday 9/14/2020 1169 107 120 78 20 691 Tuesday 9/15/2020 1246 105 106 53 17 662
Wednesday 9/16/2020 1080 105 126 105 20 713 Thursday 9/17/2020 1240 100 104 62 14 684
Friday 9/18/2020 1103 133 130 99 14 814 Average 1168 110 117 79 17 713

TMC-4 | PM Peak 3:30-4:30 SB (SR 25) WB (Bloomfield Ave) NB (SR 25)
10/12/2020 - 10/16/2020 Thru Left Right Left Right Thru Monday 10/12/2020 1212 102 115 72 20 777 Tuesday 10/13/2020 1271 78 106 47 26 711
Wednesday 10/14/2020 1190 103 98 56 21 662 Thursday 10/15/2020 1134 143 99 104 22 722
Friday 10/16/2020 1103 128 164 114 15 761 Average 1182 111 116 79 21 727
TMC-5 | PM Peak 3:30-4:30 SB (SR 25) WB (Bloomfield Ave) NB (SR 25)
11/16/2020 - 11/20/2020 Thru Left Right Left Right Thru Monday 11/16/2020 1206 92 91 97 19 697 Tuesday 11/17/2020 1196 86 79 65 12 631
Wednesday 11/18/2020 1224 66 102 43 14 621 Thursday 11/19/2020 1206 86 78 60 19 680
Friday 11/20/2020 1214 84 109 58 18 738 Average 1209 83 92 65 16 673
TMC-6 | PM Peak 3:30-4:30 SB (SR 25) WB (Bloomfield Ave) NB (SR 25)
1/25/2021 - 1/29/2021 Thru Left Right Left Right Thru Monday 1/25/2021 1300 67 62 64 13 640 Tuesday 1/26/2021 1299 89 61 82 8 622
Wednesday 1/27/2021 1143 38 72 44 12 483 Thursday 1/28/2021 1201 47 104 62 14 684
Friday 1/29/2021 1266 94 68 30 11 701 Average 1242 67 73 56 12 626
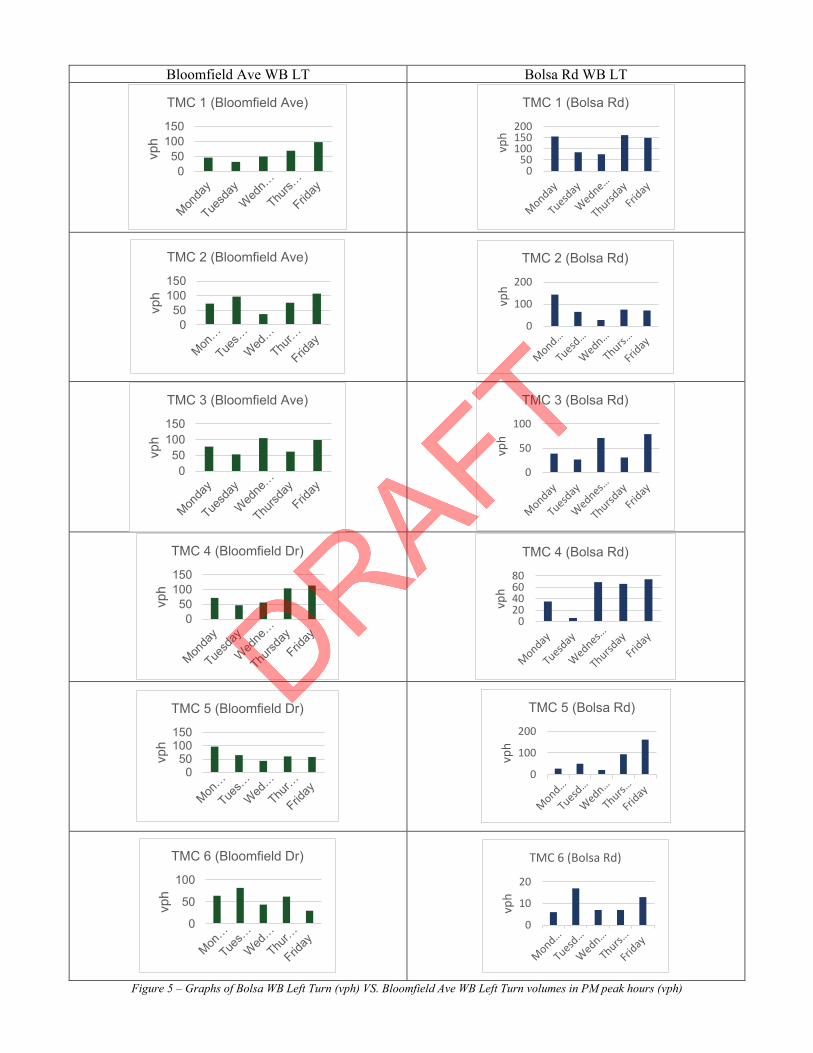
Bloomfield Ave WB LT Bolsa Rd WB LT
Figure 5 – Graphs of Bolsa WB Left Turn (vph) VS. Bloomfield Ave WB Left Turn volumes in PM peak hours (vph)
050
100150
vph
TMC 1 (Bloomfield Ave)
050
100150200
vph
TMC 1 (Bolsa Rd)
050
100150
vph
TMC 2 (Bloomfield Ave)
0
100
200
vph
TMC 2 (Bolsa Rd)
050
100150
vph
TMC 3 (Bloomfield Ave)
0
50
100
vph
TMC 3 (Bolsa Rd)
050
100150
vph
TMC 4 (Bloomfield Dr)
020406080
vph
TMC 4 (Bolsa Rd)
050
100150
vph
TMC 5 (Bloomfield Dr)
0
100
200
vph
TMC 5 (Bolsa Rd)
0
50
100
vph
TMC 6 (Bloomfield Dr)
0
10
20
vph
TMC 6 (Bolsa Rd)

PCMS in advance of SR 25 on Bolsa prior to Bloomfield will be installed by Caltrans to encourage the use of Bloomfield in lieu of Bolsa for the southern/eastern movement onto SR 25. Caltrans obtained an encroachment permit from Santa Clara County to place the PCMS sign on County Rd. 4. A bigger No Left Turn sign (48” X 48”) will be installed by Caltrans in the first/second week of April at the far side of the intersection for improved visibility of the sign. Future TMC No.7 is planned for February 8th-12th 2021, along with development of Report No. 6.