st annual baby products - ecrm · 1st annual baby products us market ... consumer survey fielded by...
TRANSCRIPT

March 30th, 2016
1st Annual BABY PRODUCTSUS MARKET STUDY
Webinar Series

1st Annual BABY PRODUCTS US MARKET STUDY
2
METHODOLOGY
Consumer Survey fielded by Toluna to 2,000 Adults 18-75 in March 2016
Areas of Questioning:
Product Types purchased at least once in the past 12 months. 28 Types across 5 segments
Outlets where purchase specific segments. Focus on Mass Market vs. Specialty vs.
Ecommerce
Key demographics: Presence of Young Children and HH Income
TABS Analytics Test for:
Internal Data Validity
External Industry Corroboration
Known areas of under and overstatement

1st Annual BABY PRODUCTS US MARKET STUDY
3
WHO IS BUYING?
As expected, Households with Young Children have, by far, the highest incidence in Baby.
BUT ARE THEY REALLY THAT
BIG OF A TARGET?
Source: TABS Analytics, March 2016

1st Annual BABY PRODUCTS US MARKET STUDY
4
WHO IS BUYING?
Adults with Young Children are only 29% of US Adults. The other 71% without young children in the HH, account for 30-40% of any given segment sales.
1.6
Types per Buyer
8.5
Source: TABS Analytics, March 2016

1st Annual BABY PRODUCTS US MARKET STUDY
5
Who is Buying?
Purchasing spread across a variety of Types. All of them show a high skew of sales to Upper Income shoppers.
FEEDING
28%
25%
23%
DIAPERS
SAFETY
SEGMENT INCIDENCE
Source: TABS Analytics, March 2016
TYPE INCIDENCE BY INCOME

1st Annual BABY PRODUCTS US MARKET STUDY
6
Who is Buying?
Baby Needs purchasing shows the flattest income distribution of the 6 Segments. Baby Food and Formula have a big difference in incidence between high and low income.
BABY NEEDS
FORMULA / FOOD
23%
20%
SEGMENTINCIDENCE
Source: TABS Analytics, March 2016
TYPE INCIDENCE BY INCOME

1st Annual BABY PRODUCTS US MARKET STUDY
7
Where do the Buy?
9 in 10 shoppers purchase products in store whereas eComm penetration by Segment ranges from 27-36%.
Still very few exclusive Online shoppers in the category.
Source: TABS Analytics, March 2016
64% 64%66%
70%73% 73%
24%
29%27% 27%
21% 21%
12%
7% 7%3%
6% 6%
SAFETY FEEDING DIAPERS/ ACCESS FORMULA FOOD NEEDS
% of Buyers Purchasing at…
Store Only
Both
Online Only

1st Annual BABY PRODUCTS US MARKET STUDY
8
Where do they Buy?
Share of Mentions - Diapers
Note: Share of Occasions in eCommfor high repeat categories will tend to be lower than Share of Mentions.
Source: TABS Analytics, March 2016

1st Annual BABY PRODUCTS US MARKET STUDY
9
Where do they Buy?
Share of Mentions - Feeding
Source: TABS Analytics, March 2016
PENETRATIONWalmart 70%+ for each SegmentTarget 50%+ for each Segment

1st Annual BABY PRODUCTS US MARKET STUDY
10
Where do they Buy?
Share of Mentions - Safety
Source: TABS Analytics, March 2016
Note: Share of Occasions correlates highly to Share of Mentions in low repeat categories, such as Safety.
1st Annual BABY PRODUCTS US MARKET STUDY
11
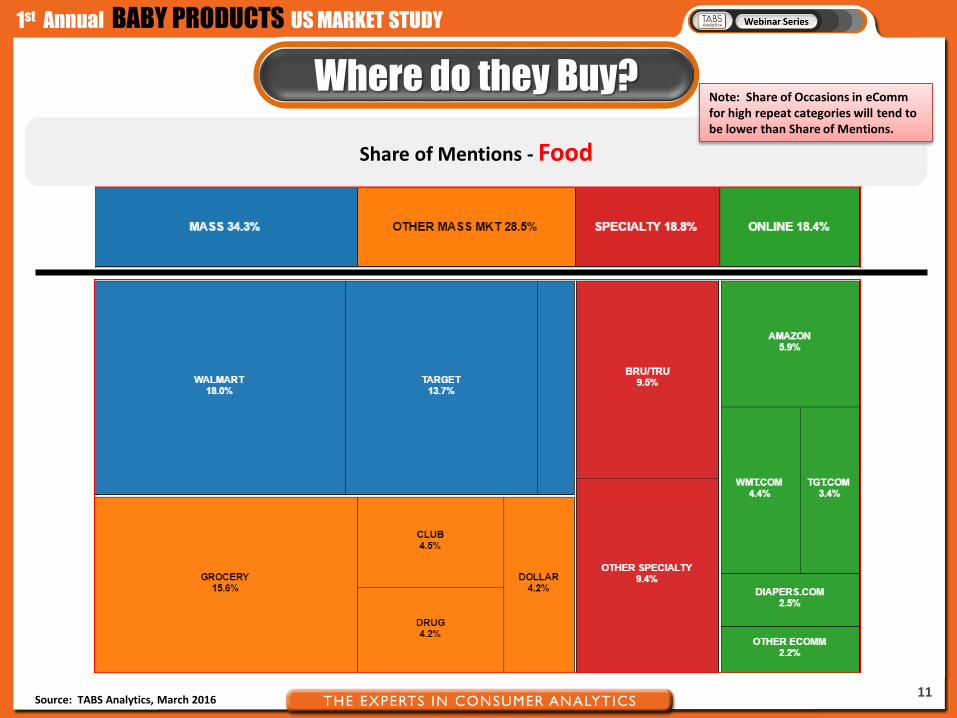
Where do they Buy?
Share of Mentions - Food
Note: Share of Occasions in eCommfor high repeat categories will tend to be lower than Share of Mentions.
Source: TABS Analytics, March 2016

1st Annual BABY PRODUCTS US MARKET STUDY
12
Where do they Buy?
Share of Mentions - Formula
Note: Share of Occasions in eCommfor high repeat categories will tend to be lower than Share of Mentions.
Source: TABS Analytics, March 2016

1st Annual BABY PRODUCTS US MARKET STUDY
13
Where do they Buy?
Share of Mentions – Baby Needs
Source: TABS Analytics, March 2016
DIAPER.COM1.7%
Note: Share of Occasions correlates highly to Share of Mentions in low repeat categories, such as Baby Needs.

1st Annual BABY PRODUCTS US MARKET STUDY
14
Where do they Buy?
Outlet Share of Mentions by Child Presence in Household
Non-FDMCD accounts for
roughly 40% of sales.
Note: Share of Occasions in eComm for high repeat categories will tend to be lower than Share of Mentions.
Source: TABS Analytics, March 2016
1st Annual BABY PRODUCTS US MARKET STUDY
15
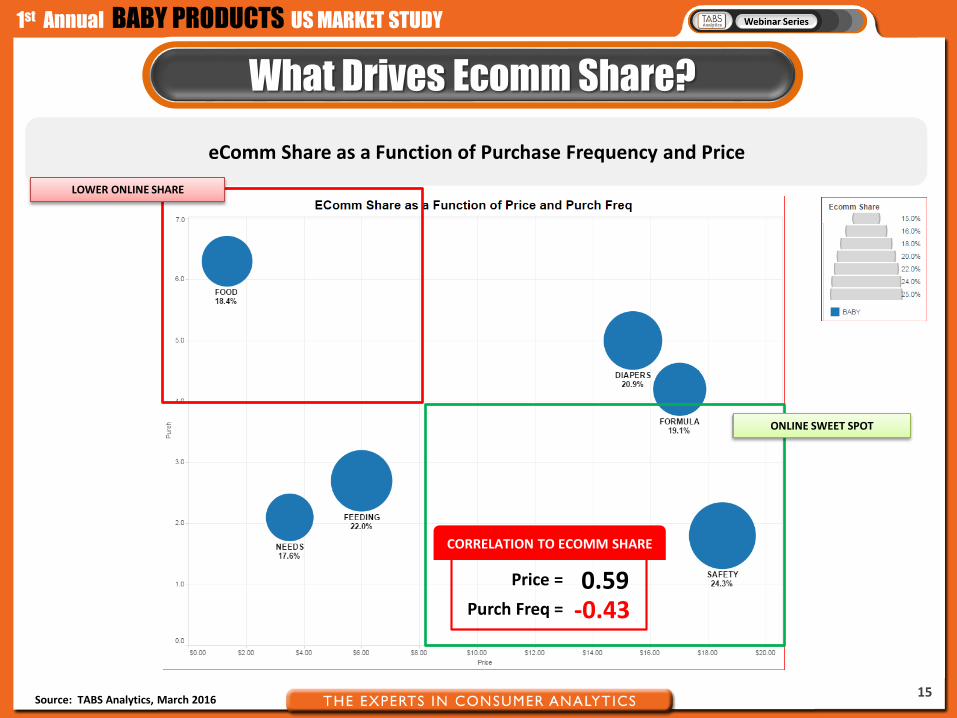
What Drives Ecomm Share?
Source: TABS Analytics, March 2016
eComm Share as a Function of Purchase Frequency and Price
ONLINE SWEET SPOT
LOWER ONLINE SHARE
Price =
CORRELATION TO ECOMM SHARE
0.59Purch Freq = -0.43

1st Annual BABY PRODUCTS US MARKET STUDY
16
What Drives Ecomm Share?
Source: TABS Analytics, March 2016
eComm Share as a Function of Purchase Frequency and Price
Price =
CORRELATION TO ECOMM SHARE
0.58Purch Freq = -0.69

1st Annual BABY PRODUCTS US MARKET STUDY
17
Conclusions
Households with Kids are the primary, but not the only, target for Baby Products. 40% of the Buyers have no Young Kids in the Household.
No question Young Families are heavier buyers, overall. They purchase 8.5 Baby Product Types in a year vs. 1.6 for all other shoppers. 37% of Adults 18-75 shop the category.
For almost every Type, strong skew to Upper Income shoppers. 55-65% of the buyers make $75K (44% of Adults).
Explains why Target is a very close #2 to Walmart in Baby
About 40% of purchase made outside of Mass Market Channels. Ecomm accounts for 18-24% of purchasing, depending on segment.
Walmart.com and Target.com are meaningful players in Baby with 5-10% of sales.
High correlation of eComm share by Segment to Average Price (positively correlated) and Purchase Frequency (negatively correlated).
Higher priced brands and Types would tend to have a higher contribution from eComm

1st Annual BABY PRODUCTS US MARKET STUDY
18
So What to Do?
Incorporate a strategy for communicating to the 40% of category consumers that are not Young Families.
Companies should conduct further research into their specific product areas to understand such questions as: What accounts for the income skew in usage?
How does outlet purchasing different vs. the segment?
Brand Awareness and Favorability
Manufacturers should not over-emphasize the Big 3 in Baby. Apply resources proportionate to their sales potential (50-60%).
Use the outlet purchasing data for business and volume planning. Use Purchase Frequency and Average Price data to establish expectations for online sales.
There are numerous meaningful online outlets in Baby vs. other categories: Amazon, Diapers, Walmart, Target all have meaningful shares.
Brick & Mortar retailers with eComm aspirations should treat Baby as the frontline of the battle for Online success.

1st Annual BABY PRODUCTS US MARKET STUDY
19
Wrap-Up & Next Steps
We’ll send out the recording of this webinar tomorrow along with the presentation.
A white paper report will be available in the next few weeks to download: On the TABS Analytics homepage (www.tabsanalytics.com)
An email announcement will go out to all webinar attendees that the white paper is available
If you have any technical difficulties receiving this information, please contact us at [email protected]
If you’re interested in a deeper dive of the information presented today to gain further insight into these baby category sectors, please contact us at [email protected]