st. johns county association roundtable june 8, 2015 jesse dunn assistant director omb st. johns...
TRANSCRIPT
St. Johns County Association Roundtable June 8, 2015
Jesse DunnAssistant Director OMBSt. Johns County BCC
Fiscal Year 2016: Separate Challenges Looking Forward to FY 2016
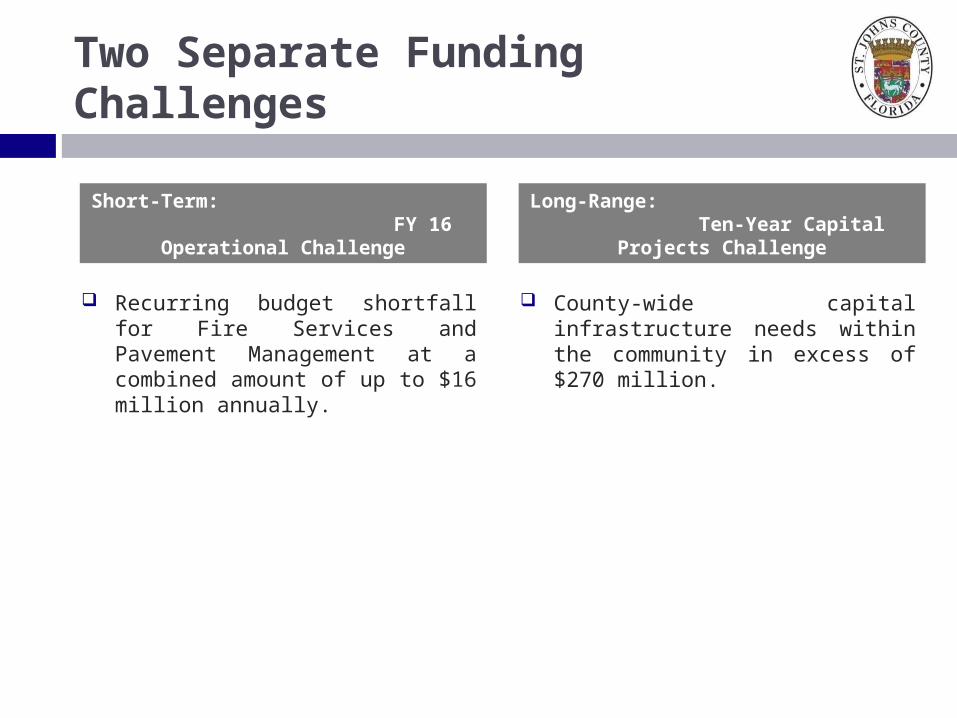
Short-Term: FY 16 Operational Challenge
Recurring budget shortfall for Fire Services and Pavement Management at a combined amount of up to $16 million annually.
Long-Range: Ten-Year Capital Projects Challenge
County-wide capital infrastructure needs within the community in excess of $270 million.
Two Separate Funding Challenges
St. Johns County’s Financial Backdrop
SJC Financial Backdrop
Assumptions under which OMB considers the FY 2016 tentative budget: The Commission is committed to not increase the millage rate for the next
several years (OPERATE WITHIN OUR MEANS). 2008 Property Tax Reform placed limits on revenue growth from existing
inventory of homes (non-homesteaded properties). The County's Capital Improvement Program reflects in excess of $600 million
reflecting the community’s desire to maintain/enhance existing County-wide services.
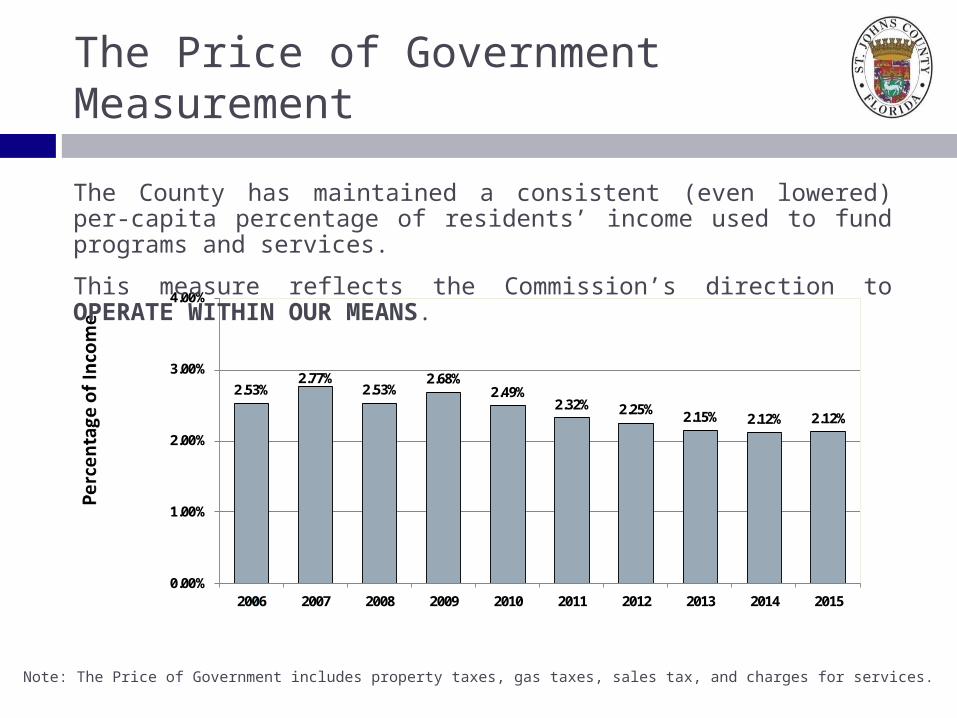
The Price of Government Measurement
2.53%2.77%
2.53%2.68%
2.49%2.32% 2.25% 2.15% 2.12% 2.12%
0
0.00%
1.00%
2.00%
3.00%
4.00%
2006 2007 2008 2009 2010 2011 2012 2013 2014 2015
The County has maintained a consistent (even lowered) per-capita percentage of residents’ income used to fund programs and services.
This measure reflects the Commission’s direction to OPERATE WITHIN OUR MEANS.
Note: The Price of Government includes property taxes, gas taxes, sales tax, and charges for services.
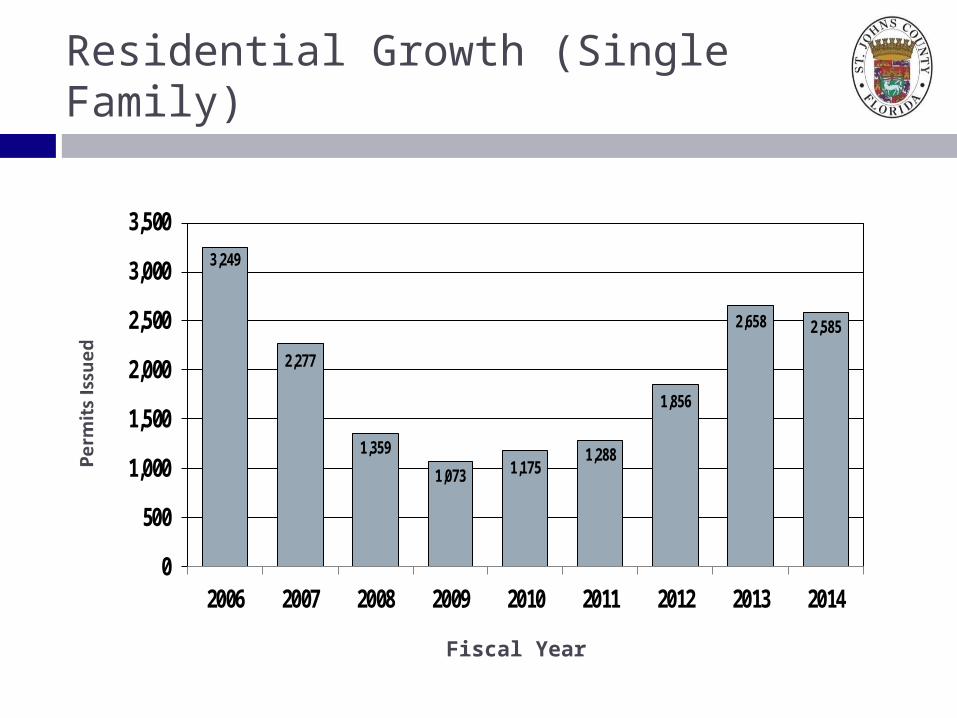
Residential Growth (Single Family)
Fiscal Year
3,249
2,277
1,359
1,073 1,1751,288
1,856
2,658 2,585
0
500
1,000
1,500
2,000
2,500
3,000
3,500
2006 2007 2008 2009 2010 2011 2012 2013 2014
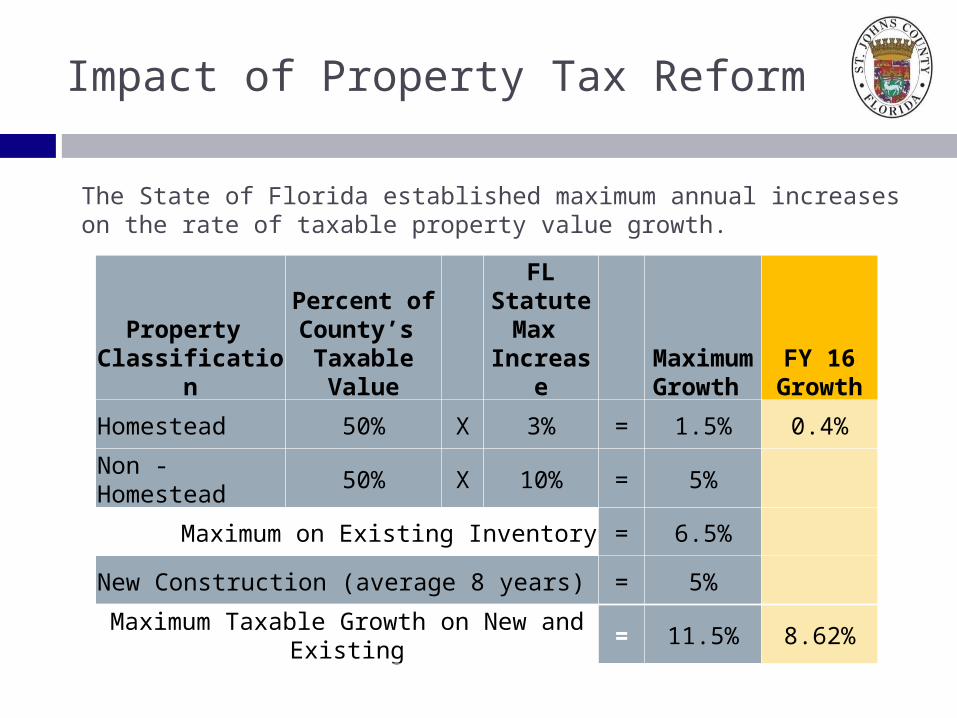
Impact of Property Tax Reform
Property Classification
Percent of County’s
Taxable Value
FL Statute Max
IncreaseMaximumGrowth
FY 16 Growth
Homestead 50% X 3% = 1.5% 0.4%
Non - Homestead 50% X 10% = 5%
Maximum on Existing Inventory = 6.5%
New Construction (average 8 years) = 5%
Maximum Taxable Growth on New and Existing = 11.5% 8.62%
The State of Florida established maximum annual increases on the rate of taxable property value growth.
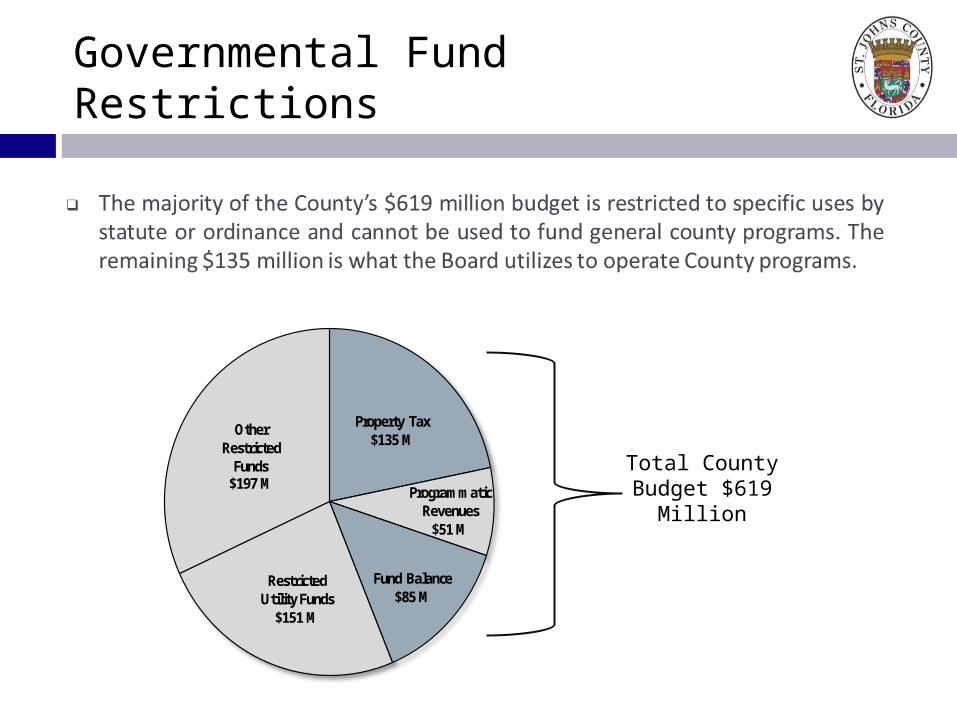
Governmental Fund Restrictions
Property Tax$135 M
Programmatic Revenues
$51 M
Fund Balance$85 M
Restricted Utility Funds
$151 M
OtherRestricted
Funds$197 M
Total County Budget $619 Million
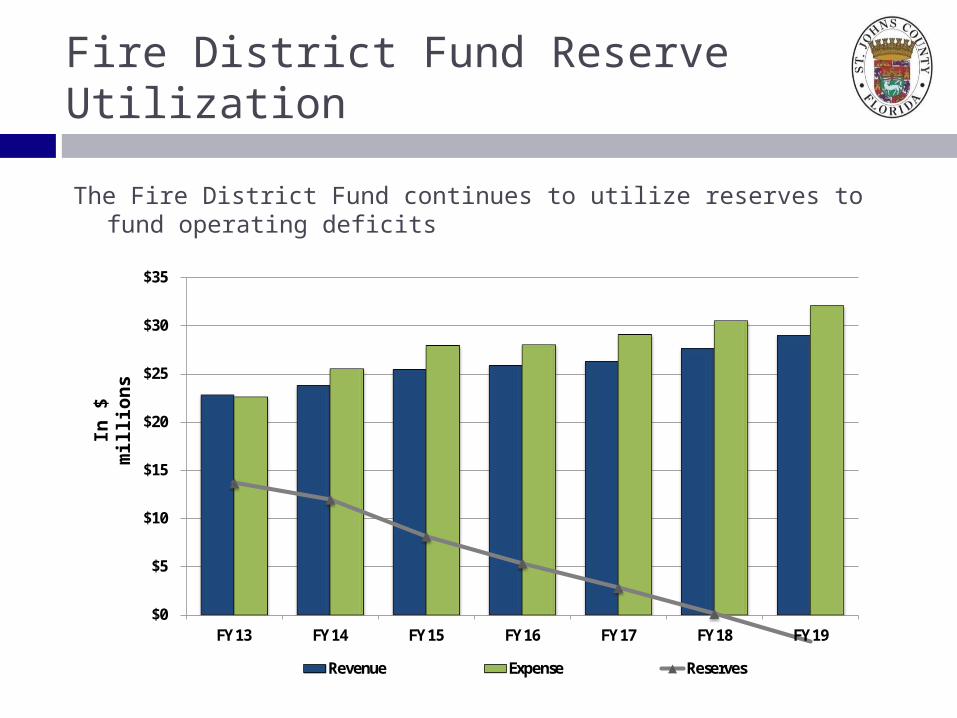
Fire District Fund Reserve Utilization
$0
$5
$10
$15
$20
$25
$30
$35
FY 13 FY 14 FY 15 FY 16 FY 17 FY 18 FY 19
Revenue Expense Reserves
The Fire District Fund continues to utilize reserves to fund operating deficits
In $
mill
ions

TTF Pavement Management
$11 $30
$53
$83
$118
$160
$207
$260
$296 75.5
72.7
69.5
66.1
62.3
58.0
53.6
49.9
46.9
45.0
50.0
55.0
60.0
65.0
70.0
75.0
80.0
$0
$50
$100
$150
$200
$250
$300
$350
FY 14 FY 15 FY 16 FY 17 FY 18 FY 19 FY 20 FY 21 FY 22
Financial Impact Pavement Index
Deferring pavement management compounds the long-term financial impact.
In $
mill
ions

$0
$20
$40
$60
$80
$100
$120
$140
$160
FY 13 FY 14 FY 15 FY 16 FY 17 FY 18 FY 19Revenue Expense Reserves Target Reserves
General Fund Reserve Utilization
Adherence to budgetary guidelines will resolve General Fund’s structural deficit by FY19.
Note: Reserves are declining from $47.9 million to the recommended minimum of $26.3 million in FY19.
In $
mill
ions

Short-Term: FY 16 Operational Challenge
Recurring budget shortfall for Fire Services and Pavement Management at a combined amount of up to $16 million annually.
Long-Range: Ten-Year Capital Projects Challenge
County-wide capital infrastructure needs within the community in excess of $270 million.
Two Separate Funding Challenges

Short-Term Operational Challenge
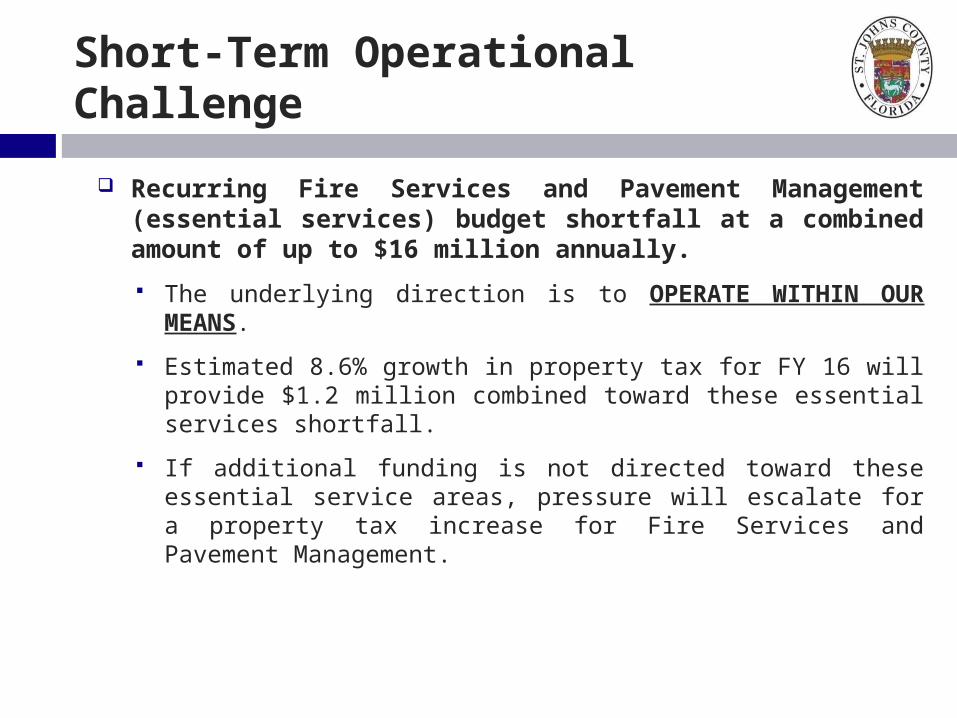
Short-Term Operational Challenge
Recurring Fire Services and Pavement Management (essential services) budget shortfall at a combined amount of up to $16 million annually.
The underlying direction is to OPERATE WITHIN OUR MEANS.
Estimated 8.6% growth in property tax for FY 16 will provide $1.2 million combined toward these essential services shortfall.
If additional funding is not directed toward these essential service areas, pressure will escalate for a property tax increase for Fire Services and Pavement Management.
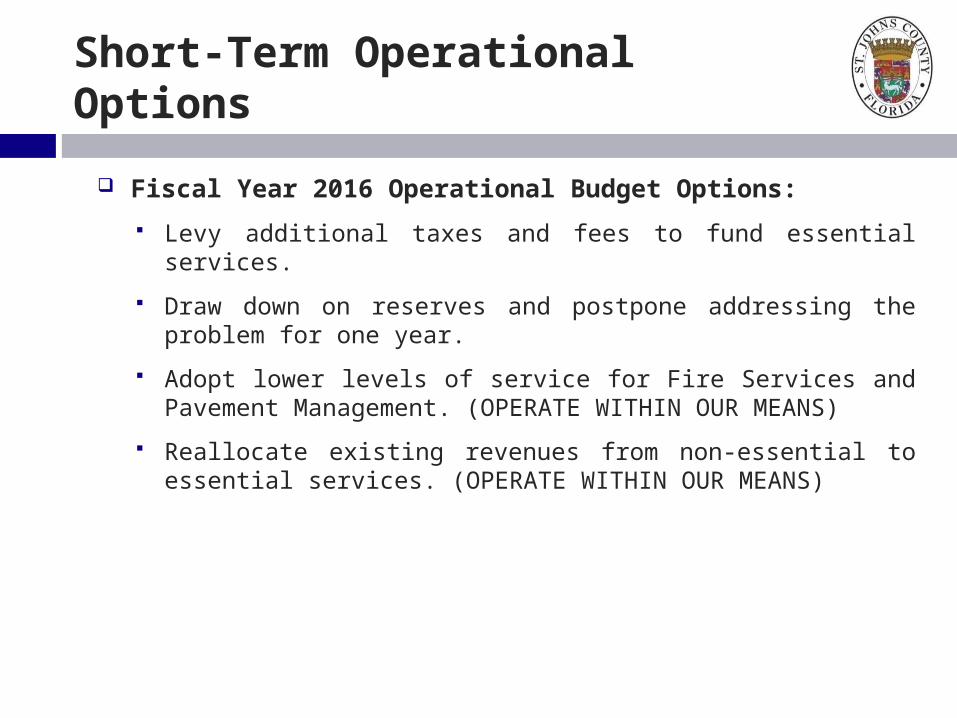
Short-Term Operational Options
Fiscal Year 2016 Operational Budget Options:
Levy additional taxes and fees to fund essential services.
Draw down on reserves and postpone addressing the problem for one year.
Adopt lower levels of service for Fire Services and Pavement Management. (OPERATE WITHIN OUR MEANS)
Reallocate existing revenues from non-essential to essential services. (OPERATE WITHIN OUR MEANS)
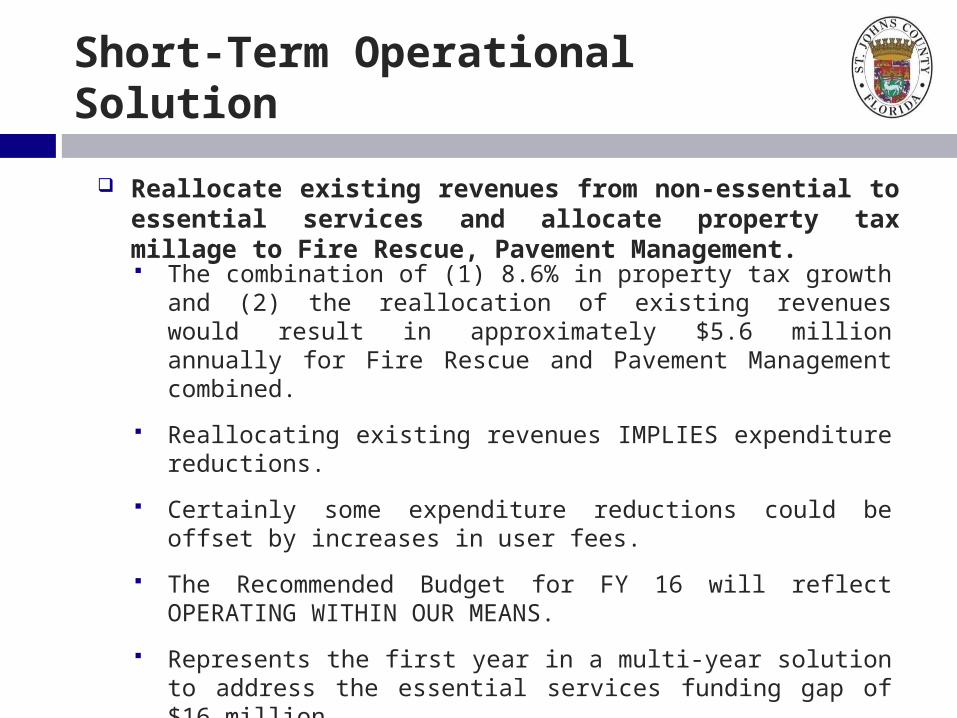
Short-Term Operational Solution
Reallocate existing revenues from non-essential to essential services and allocate property tax millage to Fire Rescue, Pavement Management.
The combination of (1) 8.6% in property tax growth and (2) the reallocation of existing revenues would result in approximately $5.6 million annually for Fire Rescue and Pavement Management combined.
Reallocating existing revenues IMPLIES expenditure reductions.
Certainly some expenditure reductions could be offset by increases in user fees.
The Recommended Budget for FY 16 will reflect OPERATING WITHIN OUR MEANS.
Represents the first year in a multi-year solution to address the essential services funding gap of $16 million.
Long-Range Infrastructure Challenge
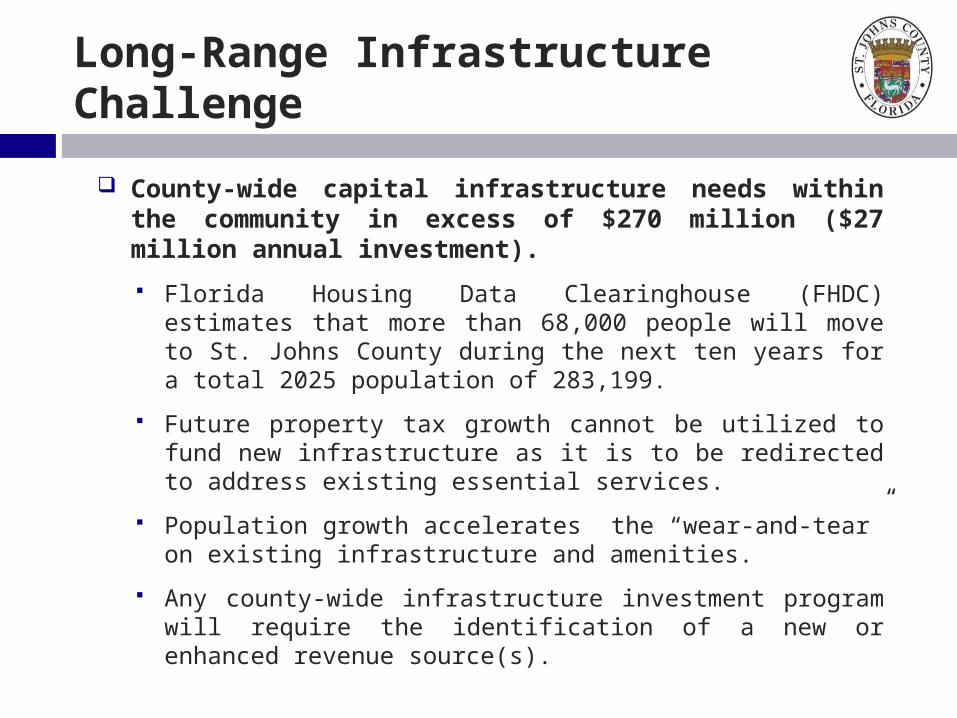
County-wide capital infrastructure needs within the community in excess of $270 million ($27 million annual investment).
Florida Housing Data Clearinghouse (FHDC) estimates that more than 68,000 people will move to St. Johns County during the next ten years for a total 2025 population of 283,199.
Future property tax growth cannot be utilized to fund new infrastructure as it is to be redirected to address existing essential services.
Population growth accelerates the “wear-and-tear” on existing infrastructure and amenities.
Any county-wide infrastructure investment program will require the identification of a new or enhanced revenue source(s).
Long-Range Infrastructure Challenge

County-wide infrastructure investment program options include: Defer investment in capital infrastructure projects. Establish lower levels of service for public services and facilities. Identify a new or enhanced capital revenue source(s).
Fee/Tax Increase Who Pays Annual Revenue Used For
1% Infrastructure Sales Tax Residents, Tourists $23.6 Capital Projects
Property Tax Increase (1 Mil) Property Owners $17.9 Operating / Capital
Utility Franchise Fee Property Owners $7.0 Operating / Capital
Stormwater Utility Fee Property Owners $6.0 Water Quality
Additional Gas Taxes Residents, Tourists $5.8 Transportation
1% Additional Bed Tax Tourists $1.5 Tourism
Increase/Add User Fees Residents $1.0 Operating / Capital
Long-Range Infrastructure Options
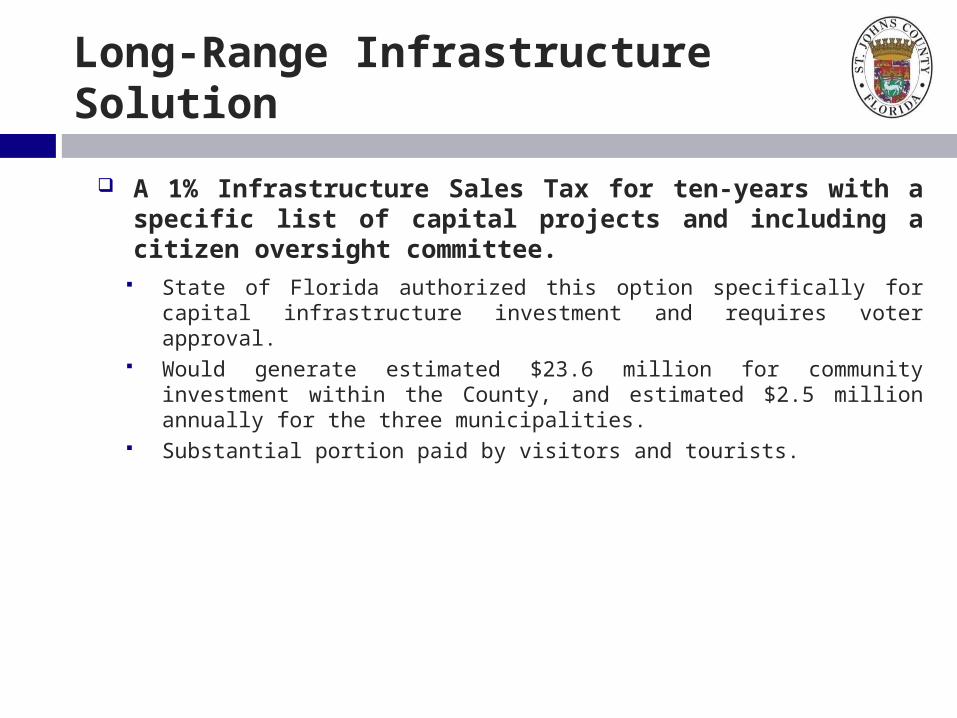
A 1% Infrastructure Sales Tax for ten-years with a specific list of capital projects and including a citizen oversight committee.
State of Florida authorized this option specifically for capital infrastructure investment and requires voter approval.
Would generate estimated $23.6 million for community investment within the County, and estimated $2.5 million annually for the three municipalities.
Substantial portion paid by visitors and tourists.
Long-Range Infrastructure Solution
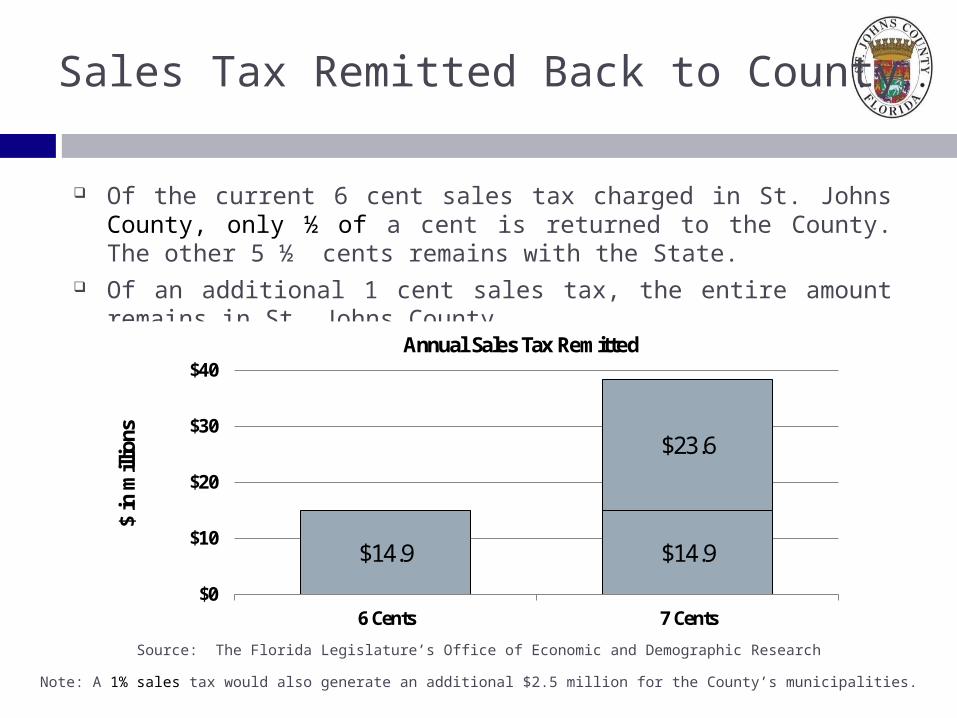
Sales Tax Remitted Back to County
Of the current 6 cent sales tax charged in St. Johns County, only ½ of a cent is returned to the County. The other 5 ½ cents remains with the State.
Of an additional 1 cent sales tax, the entire amount remains in St. Johns County.
Source: The Florida Legislature’s Office of Economic and Demographic Research
$14.9 $14.9
$23.6
$0
$10
$20
$30
$40
6 Cents 7 Cents
$ in
mill
ions
Annual Sales Tax Remitted
Note: A 1% sales tax would also generate an additional $2.5 million for the County’s municipalities.
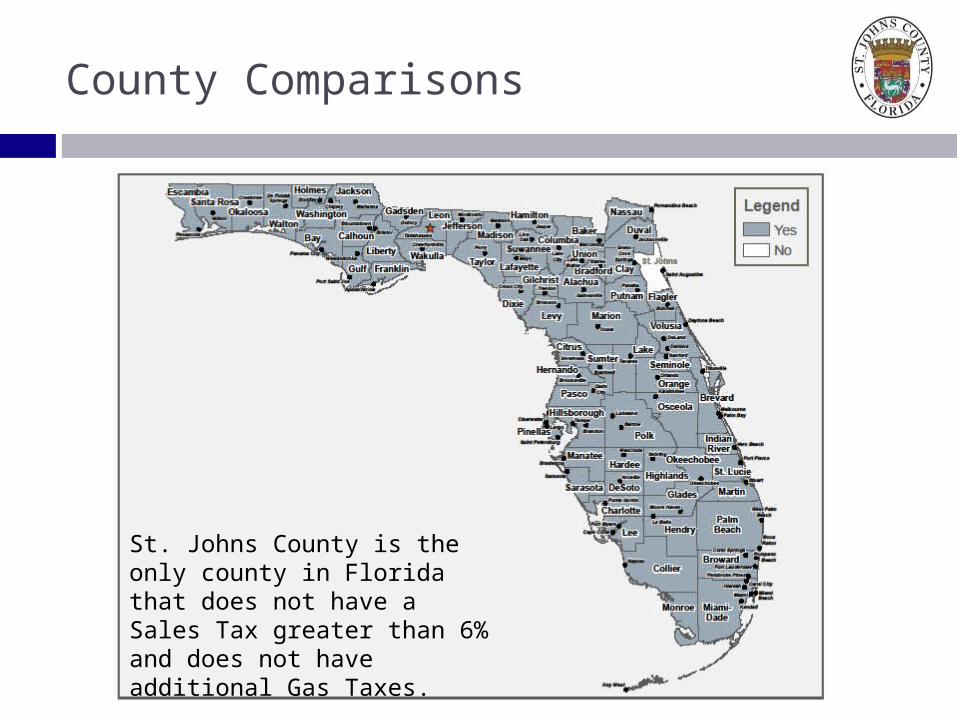
County Comparisons
St. Johns County is the only county in Florida that does not have a Sales Tax greater than 6% and does not have additional Gas Taxes.

Sales Tax Facts Sales tax is NOT applicable to most food items and medications.
Sales tax is applicable ONLY to the first $5,000 of an item’s sales amount which limits the tax to $50 per item.
Sales tax is NOT paid solely by County residents but includes tourists, commuters, and visitors.
Service reductions for non-essential services may be greater than the impact of a sales tax to a lower income person.
Sales Tax Facts
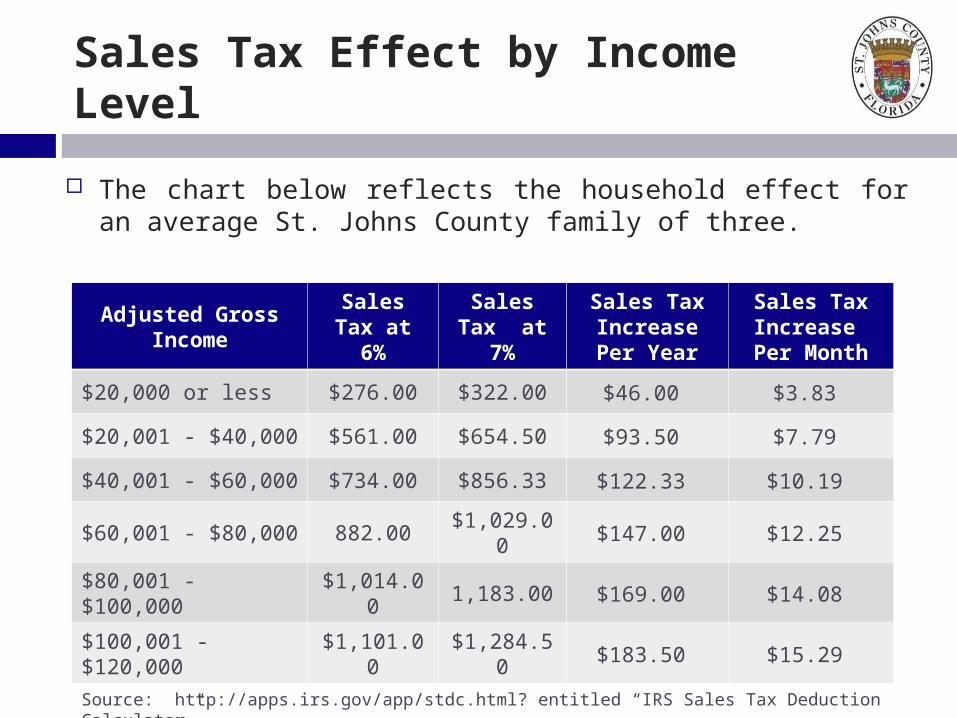
Sales Tax Effect by Income Level
Adjusted Gross Income Sales Tax at 6%
Sales Tax at 7%
Sales Tax Increase Per
Year
Sales Tax Increase Per
Month
$20,000 or less $276.00 $322.00 $46.00 $3.83
$20,001 - $40,000 $561.00 $654.50 $93.50 $7.79
$40,001 - $60,000 $734.00 $856.33 $122.33 $10.19
$60,001 - $80,000 882.00 $1,029.00 $147.00 $12.25
$80,001 - $100,000 $1,014.00 1,183.00 $169.00 $14.08
$100,001 - $120,000 $1,101.00 $1,284.50 $183.50 $15.29
Source: http://apps.irs.gov/app/stdc.html? entitled “IRS Sales Tax Deduction Calculator”
The chart below reflects the household effect for an average St. Johns County family of three.
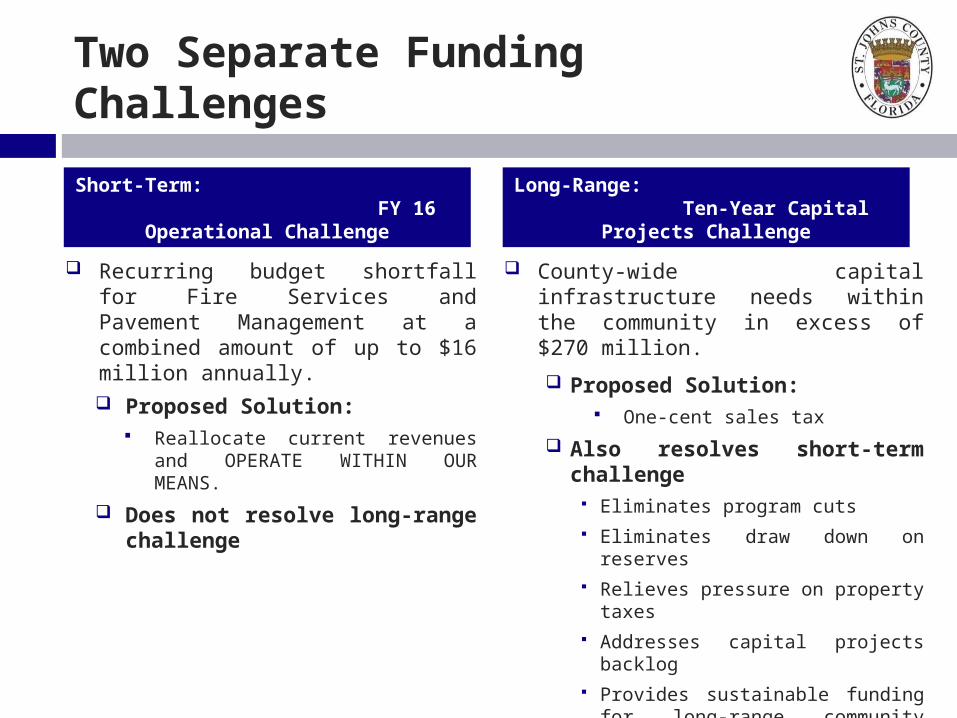
Short-Term: FY 16 Operational Challenge
Recurring budget shortfall for Fire Services and Pavement Management at a combined amount of up to $16 million annually. Proposed Solution:
Reallocate current revenues and OPERATE WITHIN OUR MEANS.
Does not resolve long-range challenge
Long-Range: Ten-Year Capital Projects Challenge
County-wide capital infrastructure needs within the community in excess of $270 million.
Proposed Solution: One-cent sales tax
Also resolves short-term challenge Eliminates program cuts Eliminates draw down on reserves Relieves pressure on property taxes Addresses capital projects backlog Provides sustainable funding for long-
range community investment
Two Separate Funding Challenges