staples company valuation jackie phan latrisha searcy anna dai
TRANSCRIPT
STAPLES COMPANY VALUATIONJACKIE PHAN
LATRISHA SEARCY
ANNA DAI
STAPLES INC.
Founded in 1985 by Tom Stemberg
First store opened in 1986 to serve the needs of small businesses and consumers
Staples operates in over 26 countries in the retail, business to business, and e-commerce areas
Sells office supplies, furniture, computers, and technology products and services
INDUSTRY AND COMPETITORS
Staples is the leading office supply retailer
Office Depot, Amazon.com Inc., and United Stationers Inc., who all offer similar office supplies, furniture, and equipment
OfficeMax and Office Depot were the No. 2 and No. 3 office supply retailers behind Staples Inc. until the two companies merged
Customers now look beyond office supply superstores when buying office supplies
SWOT ANALYSIS
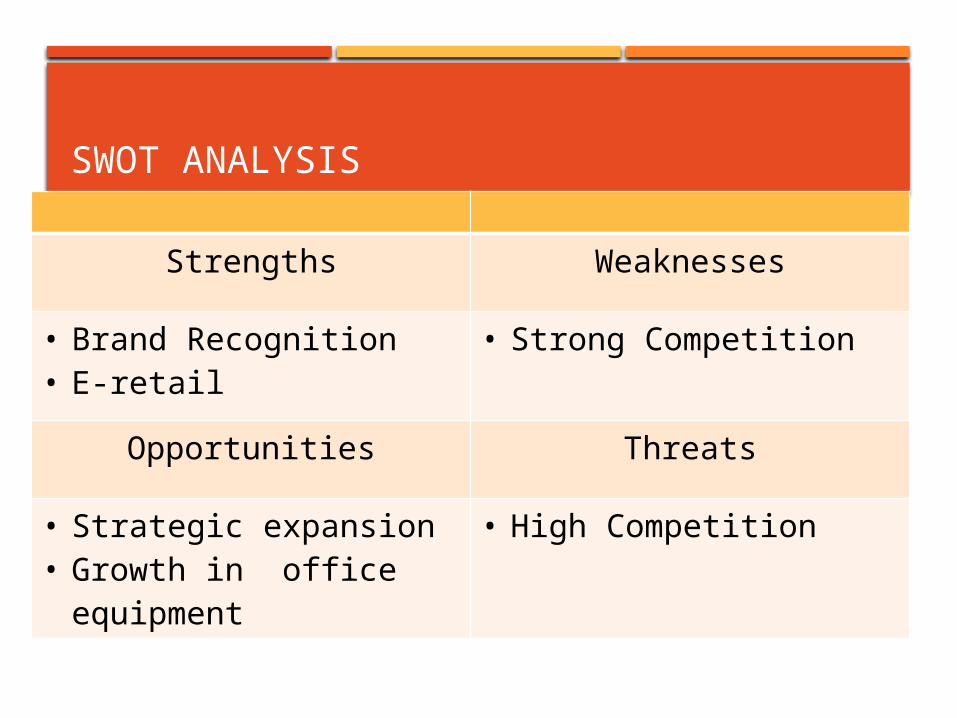
Strengths Weaknesses
• Brand Recognition• E-retail
• Strong Competition
Opportunities Threats
• Strategic expansion• Growth in office
equipment
• High Competition

VALUE DRIVERS
Staples refers to their key values as Staples Soul
Staples Soul is divided into four categories
Community, Environment, Diversity, and Ethics

FINANCIAL ANALYSIS Company Values Industry Values
2012 2011 2010 2012 2011 2010
Liquidity Ratio
Current 1.4 1.54 1.51 1.5 1.3 1.3
Quick 0.88 1.04 0.96 0.8 0.8 0.8
Asset Management Ratio
Inventory Turnover 10.54 10.29 10.4 3.72 3.77 3.6
Total Asset Turnover 1.99 3.98 1.76 1 1 1
DSO 27.18 days
29.67 29.3 110.95 94.53 106.57
Fixed Assets Turnover 12.42 12.03 11.43 6.58 7.3 5.75
Profitability Ratio
Net Profit Margin -1% 4% 4% 39.4 38.9 38.7
ROA -17% 7% 6% 3.9 3.5 2.3
ROE -3% 14% 13% 14.8 10.2 5.8
Debt Management Ratio
Total Debt Ratio 50.03% 47.71% 50.03%
77.6% 73.5% 71.9%
Times Interest Earned 3.14 9.37 7.32 2.8 2.9 1.9
Market Value Ratio
P/E Ratio -54.85 11.25 17.9
Market/Book Ratio 9.17 10.11 9.71

LIQUIDITY
In conclusion, Staples does not have as good ability to use assets to cover the cost of liabilities as they come due.
Not as good as others in industry
2012 2011 2010 2012
Liquidity Ratio
Current 1.4 1.54 1.51 1.5
Quick 0.88 1.04 0.96 0.8
ASSETS MANAGEMENT RATIO
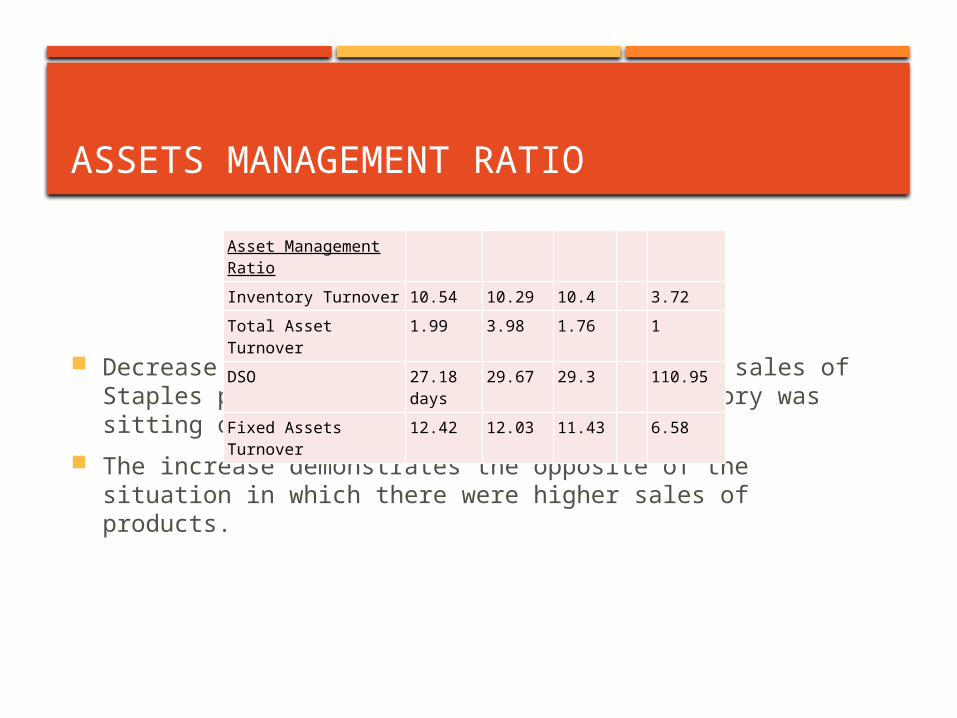
Decrease in 2010 to 2011 shows decreases in sales of Staples products or that more of the inventory was sitting on shelves or warehouses.
The increase demonstrates the opposite of the situation in which there were higher sales of products.
Asset Management Ratio
Inventory Turnover 10.54 10.29 10.4 3.72
Total Asset Turnover 1.99 3.98 1.76 1
DSO 27.18 days
29.67 29.3 110.95
Fixed Assets Turnover 12.42 12.03 11.43 6.58

TOTAL ASSET TURNOVER
This 2.22 point increase measures the company’s efficiency at using their assets to generate sales or revenue.
However in 2012 the ratio shows that there was a decrease of 1.99 from 3.98. therefore reducing their revenue or sales.
Had a net loss
Asset Management Ratio
Inventory Turnover 10.54 10.29 10.4 3.72
Total Asset Turnover 1.99 3.98 1.76 1
DSO 27.18 days
29.67 29.3 110.95
Fixed Assets Turnover 12.42 12.03 11.43 6.58
DSO
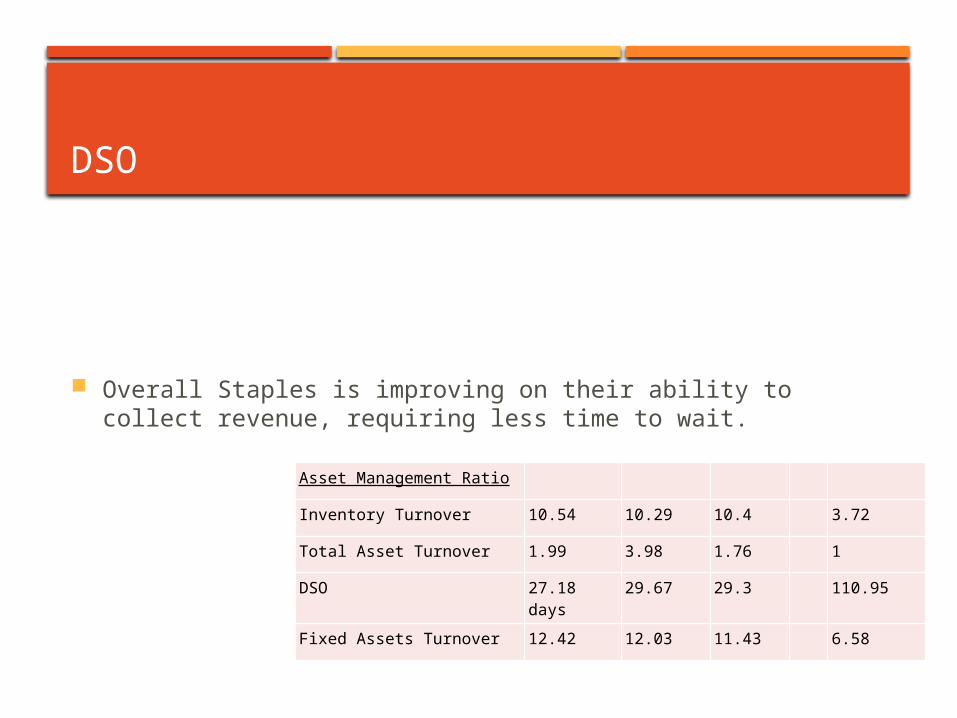
Overall Staples is improving on their ability to collect revenue, requiring less time to wait.
Asset Management Ratio
Inventory Turnover 10.54 10.29 10.4 3.72
Total Asset Turnover 1.99 3.98 1.76 1
DSO 27.18 days 29.67 29.3 110.95
Fixed Assets Turnover 12.42 12.03 11.43 6.58
FIXED ASSET TURNOVER
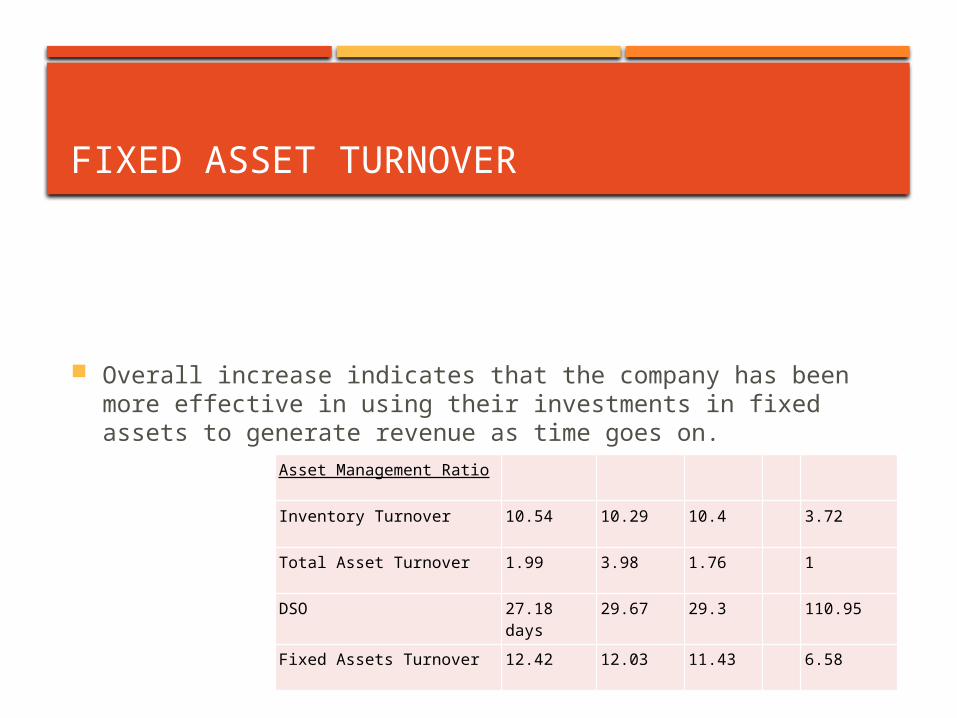
Overall increase indicates that the company has been more effective in using their investments in fixed assets to generate revenue as time goes on.
Asset Management Ratio
Inventory Turnover 10.54 10.29 10.4 3.72
Total Asset Turnover 1.99 3.98 1.76 1
DSO 27.18 days
29.67 29.3 110.95
Fixed Assets Turnover 12.42 12.03 11.43 6.58
PROFITABILITY RATIO
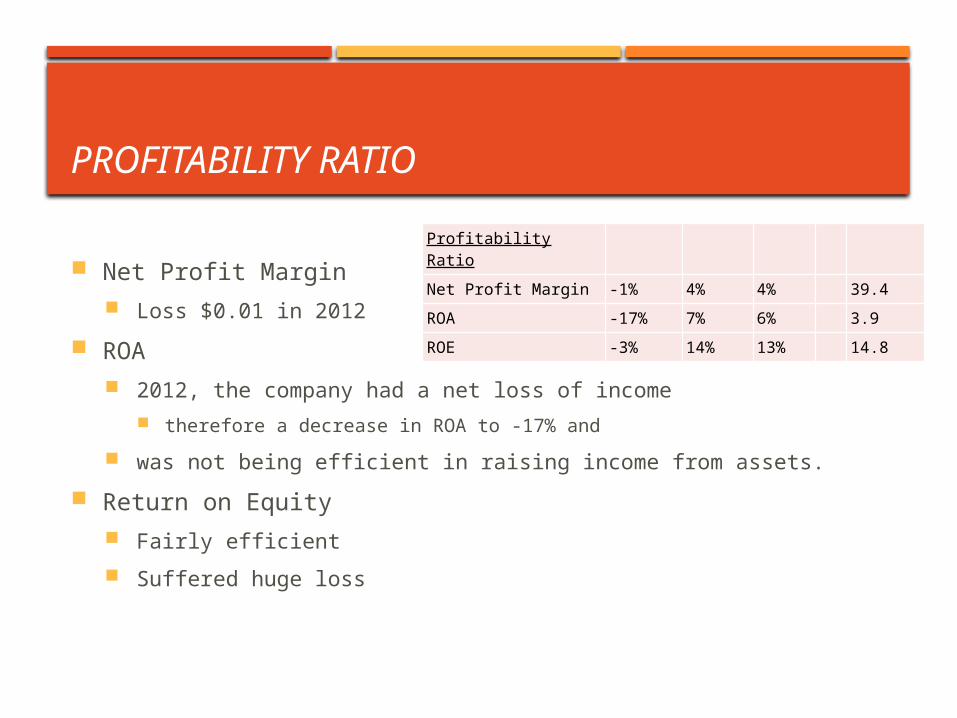
Net Profit Margin Loss $0.01 in 2012
ROA 2012, the company had a net loss of income
therefore a decrease in ROA to -17% and
was not being efficient in raising income from assets.
Return on Equity Fairly efficient
Suffered huge loss
Profitability Ratio
Net Profit Margin -1% 4% 4% 39.4
ROA -17% 7% 6% 3.9
ROE -3% 14% 13% 14.8

DEBT MANAGEMENT RATIO
total debt ratio staying constant.
debt ratio of less than 1,
More assets than debt, not much risk
Time Interest Earned ratio High Times Interest Earned ratio
does not have much debt or is paying down too much debt with earnings that could be used for other projects.
With a significantly lower ratio, Staples may perhaps have invested their earnings in other projects or has taken on more debt.
Debt Management Ratio
Total Debt Ratio 50.03% 47.71% 50.03%
77.6%
Times Interest Earned 3.14 9.37 7.32 2.8
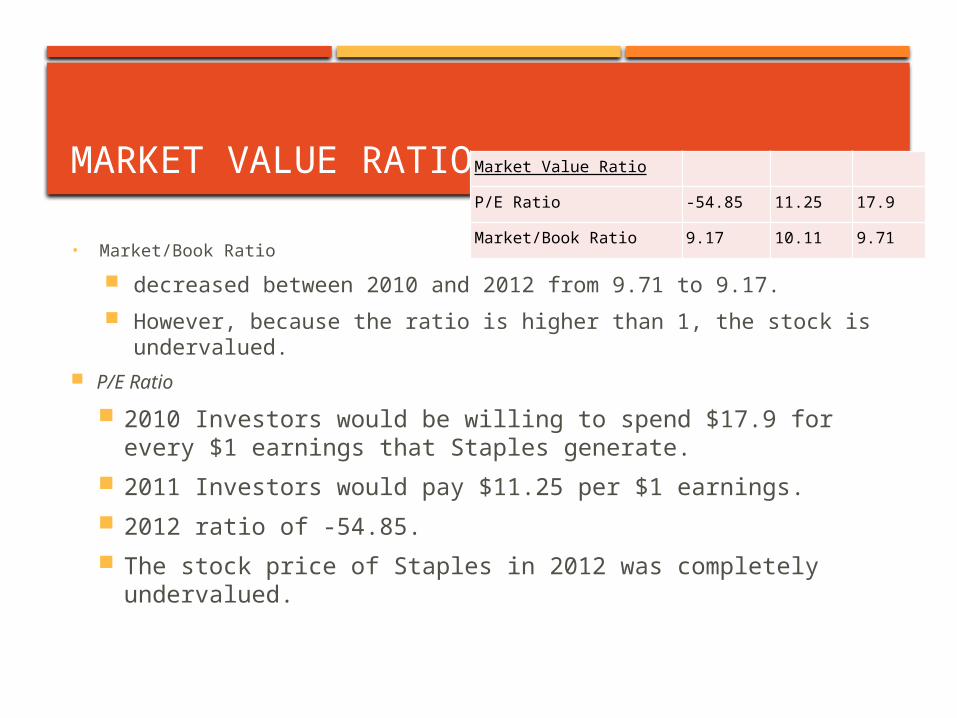
MARKET VALUE RATIO
• Market/Book Ratio
decreased between 2010 and 2012 from 9.71 to 9.17.
However, because the ratio is higher than 1, the stock is undervalued.
P/E Ratio
2010 Investors would be willing to spend $17.9 for every $1 earnings that Staples generate.
2011 Investors would pay $11.25 per $1 earnings.
2012 ratio of -54.85.
The stock price of Staples in 2012 was completely undervalued.
Market Value Ratio
P/E Ratio -54.85 11.25 17.9
Market/Book Ratio 9.17 10.11 9.71

FIRM RISKINESS
Consumer base is relatively staple The growth rate can be limited
Vulnerabilities of the supply chain Low level of cost efficiency and low profit margins
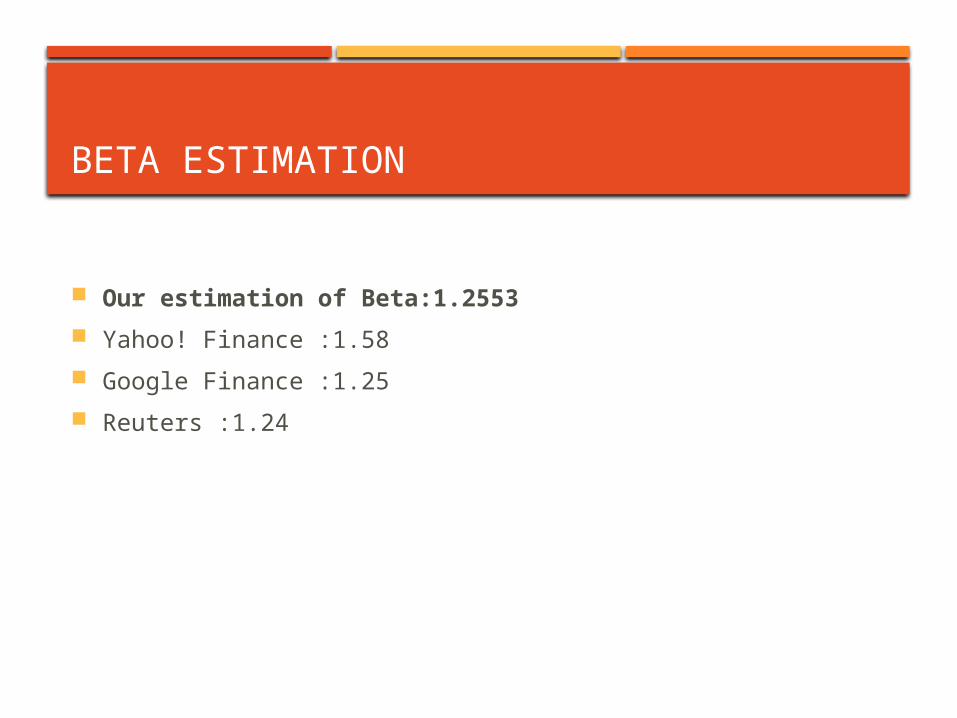
BETA ESTIMATION
Our estimation of Beta:1.2553
Yahoo! Finance :1.58
Google Finance :1.25
Reuters :1.24
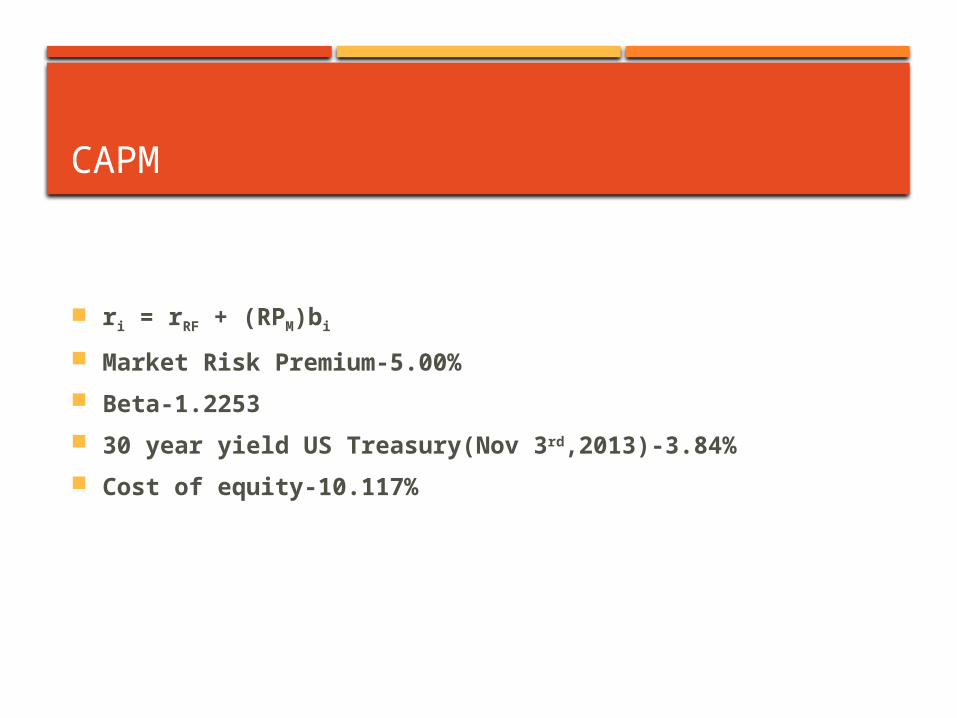
CAPM
ri = rRF + (RPM)bi
Market Risk Premium-5.00%
Beta-1.2253
30 year yield US Treasury(Nov 3rd,2013)-3.84%
Cost of equity-10.117%

DDM
Historical Perspective
Year 2012 2011 2010 2009 2008
Annual
Dividend
0.39 0.36 0.33 0.33 0.29
Dividend
Growth Rate
8.33% 9.09
%
3.13
%
0.00% 13.79
%

DDM
Analyst report dividend growth rates Yahoo Finance 3.10%
Bloomberg 3.10%
Google Finance 3.12%
ROE*plowback Since Staples run a loss in terms of the net income, our ROE became -
0.0343, which make our dividend growth rate -8.22%.

DDM
Forecasted dividends
Forecasted Dividends
2013 2014 2015 2016 2017 2018 2019 2020 2021 202
2
2023
0.4532
0.466796
0.4808
0.495224
0.510081
0.525383
0.541145
0.557379
0.5741
0.591323
0.609063

DDM
Dividend Discounted Model
Constant growth rate 5.00%
Dividend growth rate 5.75%
Length of growth
period
10 years
Cost of capital 10.12%
Horizon Value 12.8205
Price 7.84
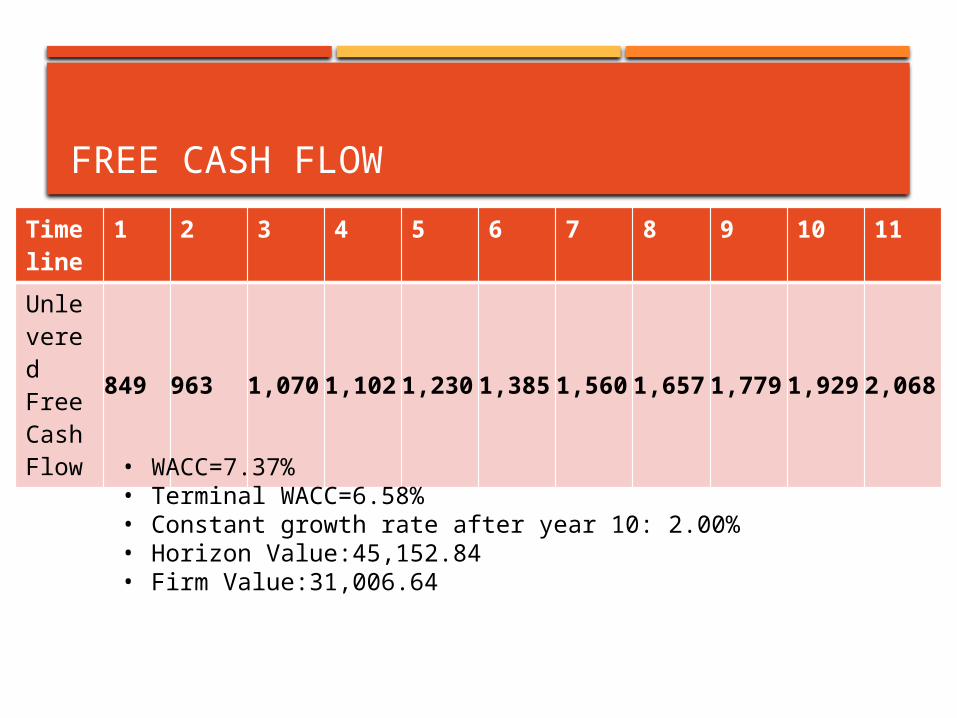
FREE CASH FLOW
Timeline
1 2 3 4 5 6 7 8 9 10 11
Unlevered Free Cash Flow
849 963 1,070 1,102 1,230 1,385 1,560 1,657 1,779 1,929 2,068
• WACC=7.37%• Terminal WACC=6.58%• Constant growth rate after year 10: 2.00%• Horizon Value:45,152.84• Firm Value:31,006.64

FREE CASH FLOW
Firm value $31,006.64
Add Cash and marketable securities $1,334.30
Subtract long term debt $1,733.23
Equity Value $
30,607.72
Final Stock price $46.82

Fiscal year 2012 2011 2010 2009 2008 2007
Total revenues25,002,1
9224,545,
11324,275,
45123,083,
77519,372,
68218,160,
789 Revenue growth rate ([Revenue(t)-Revenue(t-1)]/Revenue(t-1)] 1.86% 1.11% 5.16%19.16% 6.67%
2-year average 1.49%
6-year average 6.79%6-year average (2006-2001 excluding 2004) 6.79%
Conclusion
Because negative growth in revenue in 2004 was caused by discountinued operations, one can exclude from calculations as being non-representative
Conservative estimate 6.79%Aggressive estimate (assuming recent growth will persist) 1.49%
Yahoo analyst forecast for 2015-0.70%
See Yahoo Data

WACC calculation
Cost of equity 10.117% = Rrf +(Market risk premium)*beta = 3.84% + 5.00%* 1.2553 Beta 1.2553Source: Yahoo Market risk premium 5.00%Our assumption 10-year yield on a US Treasury 3.84% 21-Nov-13
Cost of debt 4.64% = 3.84% + 0.80% 10-year yield on a US Treasury 3.84% Credit rating BBB spread 0.80%
Debt to Value 37.92% Equity to Value 62.08%
Market value of equity 10,070 in million
Number of shares outstanding 653.68Need to use diluted shares
Market price per share 15.36Source: Yahoo Market value of debt 6,151 Assume that it equals book value of debt
Value 16,221
a
WACC 7.37% = rE*(E/V)+rD*(1-t)*(D/V)
It is reasonable to assume that when Target enters a constant growth phaze, its beta will approach 1 Terminal WACC 7.25% Terminal cost of equity 8.8400% Terminal growth rate 2.00%

MULTIPLE VALUATION
Multiply Staples’ most recent earnings per share (EPS) of 0.74 as of December 2, 2013 by the industry’s P/E ratio of 49.20 to get an answer of $36.41.
weighted average of the stock price
($7.84 +$46.82+ $36.41)
3
$30.35

RECOMMENDATION
Worth to invest
Compare with the current stock price of $15.7 from yahoo finance
The Staples stock price is undervalued