star conference 2018 - landirenzogroup.com meeting... · landi renzo group promotes, designs and...
TRANSCRIPT
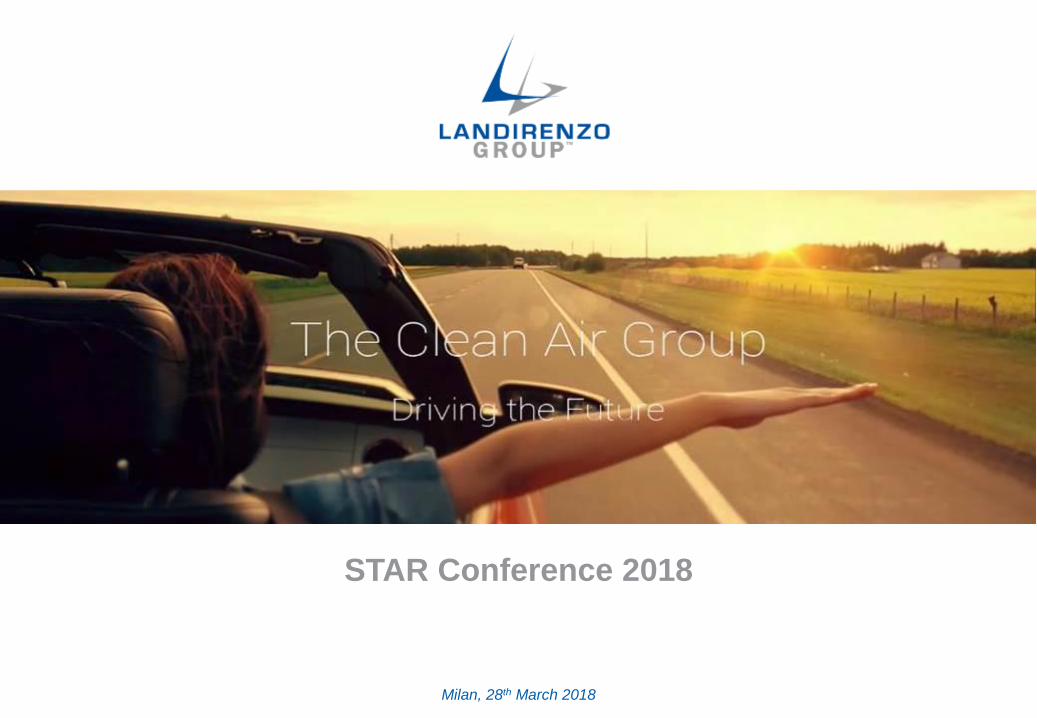
Milan, 28th March 2018
STAR Conference 2018
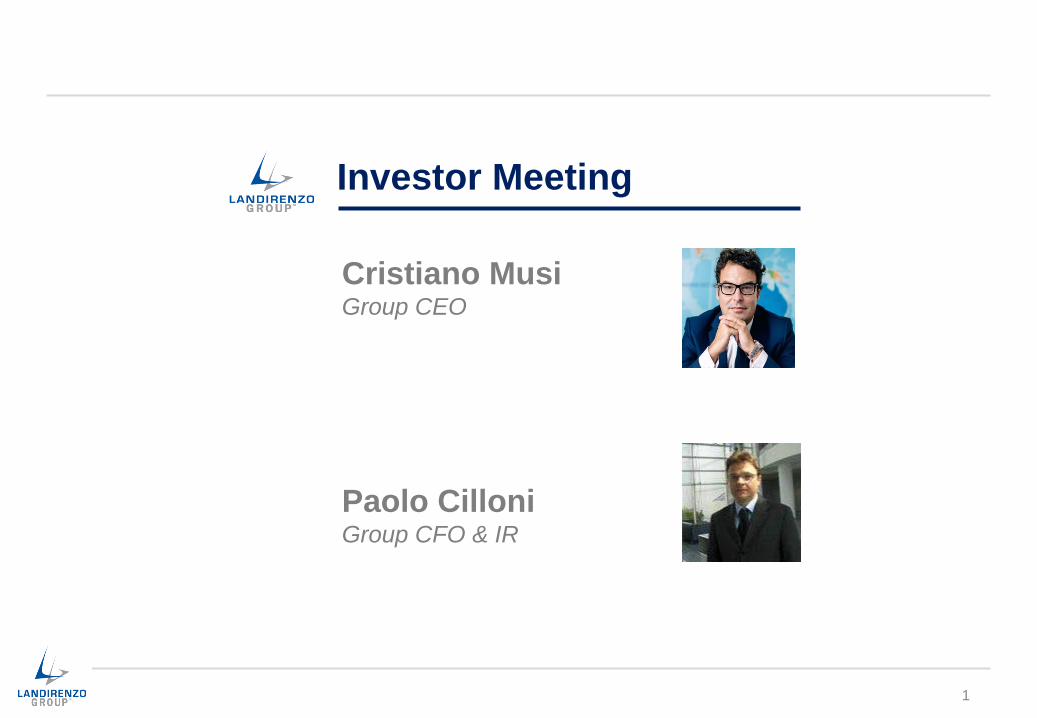
Investor Meeting
Cristiano MusiGroup CEO
Paolo CilloniGroup CFO & IR
1
‣ Landi Renzo Group
‣ Re-launch program: Achieved Results and 2017 FY Financials
‣ Market trends and Landi Renzo Group 2018 – 2022 Strategic Plan
‣ “G-Mobility Way” – Landi Renzo Group Forward Looking Integrated Strategy
‣ SAFE – Clean Energy Compression merger
Agenda
2

Landi Renzo Group promotes, designs and produces highly advanced integrated solutions, from gas distribution infrastructures to alternative fuel systems
3
Automotive sector Gas Distribution and
Compressed Natural Gas
SectorOEM After Market
• Full CNG and LPG systems
• LPG, CNG and LNG components
• R&D to support AF evolution
• Full CNG and LPG conversion kits
• Components and systems for CNG
and LPG conversion
• DDF technology for M&HD
• Equipment for CNG/RNG distribution
stations and infrastructure
• Agreement signed on Nov, 27th to
merge fully owned SAFE with Clean
Energy Fuels, setting up a new
leading Group with an estimated
turnover of approximately €58 million
at the end of 2018
• Landi Renzo owns 51% of the new
Joint Venture
Landi Renzo Group
LPG: Liquid Propane Gas; CNG: Compressed Natural Gas; LNG: Liquid Natural Gas; RNG: Renewable Natural Gas
Not consolidated
Europe
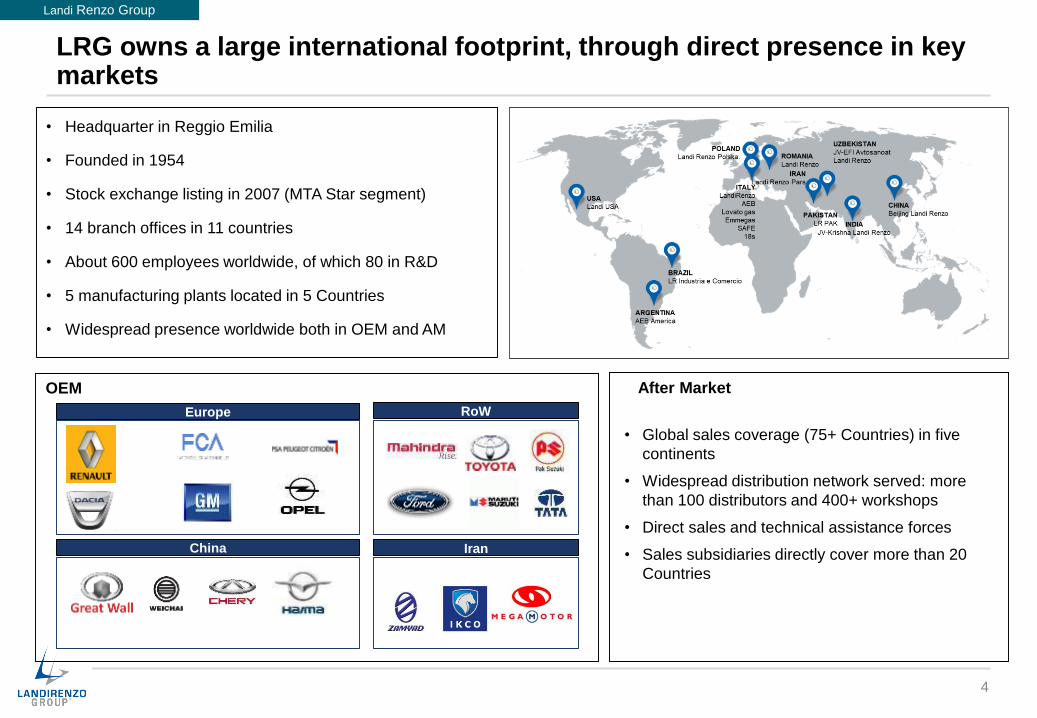
LRG owns a large international footprint, through direct presence in key markets
• Headquarter in Reggio Emilia
• Founded in 1954
• Stock exchange listing in 2007 (MTA Star segment)
• 14 branch offices in 11 countries
• About 600 employees worldwide, of which 80 in R&D
• 5 manufacturing plants located in 5 Countries
• Widespread presence worldwide both in OEM and AM
OEM After Market
• Global sales coverage (75+ Countries) in five
continents
• Widespread distribution network served: more
than 100 distributors and 400+ workshops
• Direct sales and technical assistance forces
• Sales subsidiaries directly cover more than 20
Countries
Europe
Europe
Europe
China Iran
Europe
RoW
Landi Renzo Group
4
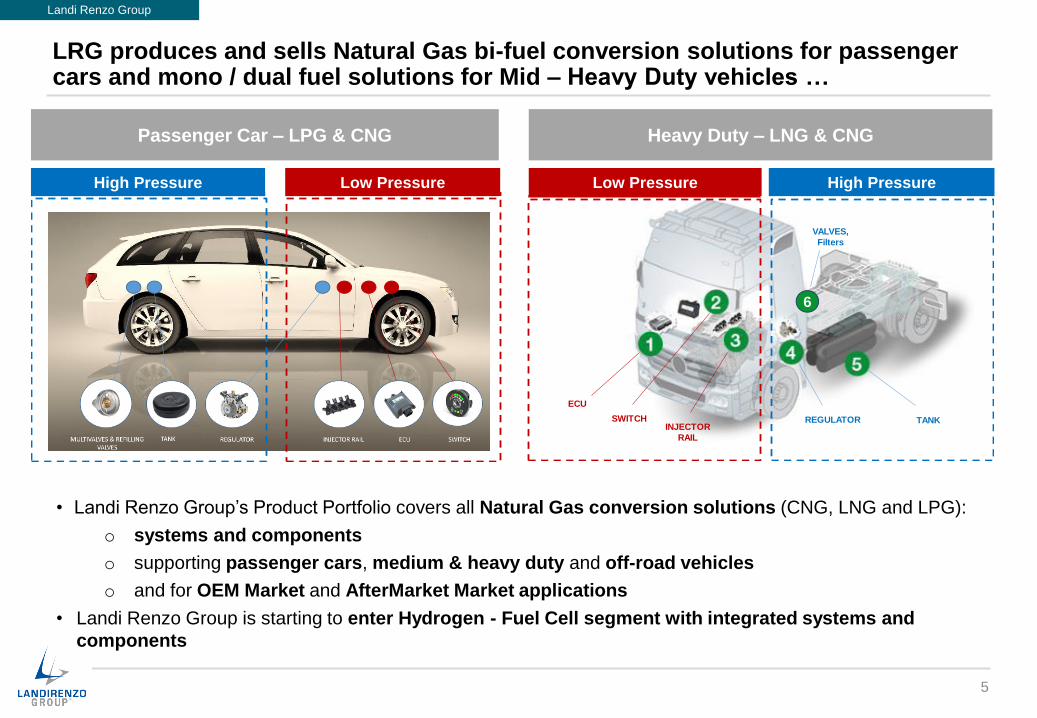
LRG produces and sells Natural Gas bi-fuel conversion solutions for passenger cars and mono / dual fuel solutions for Mid – Heavy Duty vehicles …
High Pressure Low Pressure Low Pressure High Pressure
ECU
INJECTOR
RAIL
REGULATOR TANKSWITCH
6
VALVES,
Filters
Passenger Car – LPG & CNG Heavy Duty – LNG & CNG
Landi Renzo Group
• Landi Renzo Group’s Product Portfolio covers all Natural Gas conversion solutions (CNG, LNG and LPG):
o systems and components
o supporting passenger cars, medium & heavy duty and off-road vehicles
o and for OEM Market and AfterMarket Market applications
• Landi Renzo Group is starting to enter Hydrogen - Fuel Cell segment with integrated systems and
components
Low PressureHigh Pressure Low Pressure High Pressure
5

… providing expertise and knowledge on components and integrated solutions
6
Inte
gra
ted
so
luti
on
s
Product Portfolio Components
Hig
h P
res
su
re C
om
po
ne
nts
Lo
w P
res
su
re C
om
po
ne
nts
Pressure Regulators
Rail & Injectors
Electronic solutions
(ECU and Switch)
Valves
& multi-valves
Filling receptacles
Tanks and hoses
• Landi Renzo Group core products
• Tailor-made solutions for CNG, LNG and
LPG:
o Internal R&D centre covering all core
product development
o specifically designed for OEM
customers and AM markets
o Highly suitable for Hydrogen
applications
• Manufactured in Landi Renzo plants
• Core products (multi-valves and filling
receptacles)
o Internally designed and produced for
CNG and LPG solutions
• Purchased parts (tanks, hoses and valves)
o Supplied on LRG specifications
• Integrated
solutions for OEM
• Integrated
solutions for AM
markets (LPG /
CNG passenger
cars with different
technologies,
Dual fuel for
M&HD)
• Applications for
Medium & Heavy
Duty vehicles
• Integrated
solutions for
North American
QVM market
(Light & Medium
Duty)
Integrated solutions
Landi Renzo Group

‣ Landi Renzo Group
‣ Re-launch program: Achieved Results and 2017 FY Financials
‣ Market trends and Landi Renzo Group 2018 – 2022 Strategic Plan
‣ “G-Mobility Way” – Landi Renzo Group Forward Looking Integrated Strategy
‣ SAFE – Clean Energy Compression merger
Agenda
7
Re-L
au
nc
h P
rog
ram
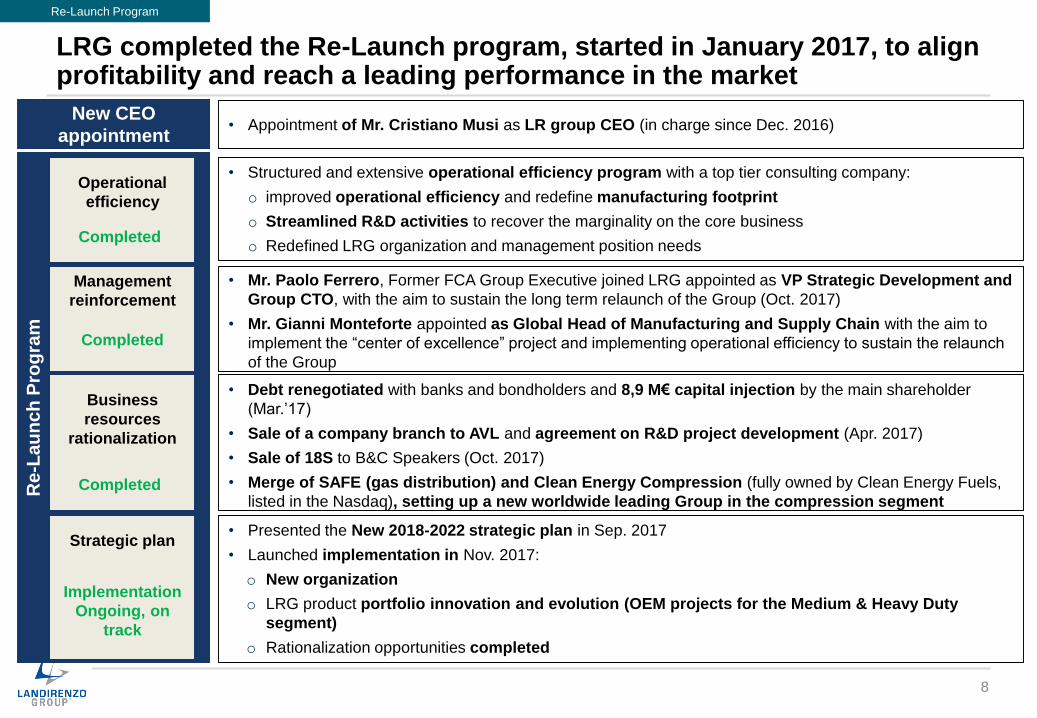
LRG completed the Re-Launch program, started in January 2017, to align profitability and reach a leading performance in the market
• Presented the New 2018-2022 strategic plan in Sep. 2017
• Launched implementation in Nov. 2017:
o New organization
o LRG product portfolio innovation and evolution (OEM projects for the Medium & Heavy Duty
segment)
o Rationalization opportunities completed
• Structured and extensive operational efficiency program with a top tier consulting company:
o improved operational efficiency and redefine manufacturing footprint
o Streamlined R&D activities to recover the marginality on the core business
o Redefined LRG organization and management position needs
• Appointment of Mr. Cristiano Musi as LR group CEO (in charge since Dec. 2016)New CEO
appointment
Management
reinforcement
Business
resources
rationalization
Strategic plan
Operational
efficiency
Re-Launch Program
8
• Mr. Paolo Ferrero, Former FCA Group Executive joined LRG appointed as VP Strategic Development and
Group CTO, with the aim to sustain the long term relaunch of the Group (Oct. 2017)
• Mr. Gianni Monteforte appointed as Global Head of Manufacturing and Supply Chain with the aim to
implement the “center of excellence” project and implementing operational efficiency to sustain the relaunch
of the Group
• Debt renegotiated with banks and bondholders and 8,9 M€ capital injection by the main shareholder
(Mar.’17)
• Sale of a company branch to AVL and agreement on R&D project development (Apr. 2017)
• Sale of 18S to B&C Speakers (Oct. 2017)
• Merge of SAFE (gas distribution) and Clean Energy Compression (fully owned by Clean Energy Fuels,
listed in the Nasdaq), setting up a new worldwide leading Group in the compression segment
Completed
Completed
Completed
Implementation
Ongoing, on
track
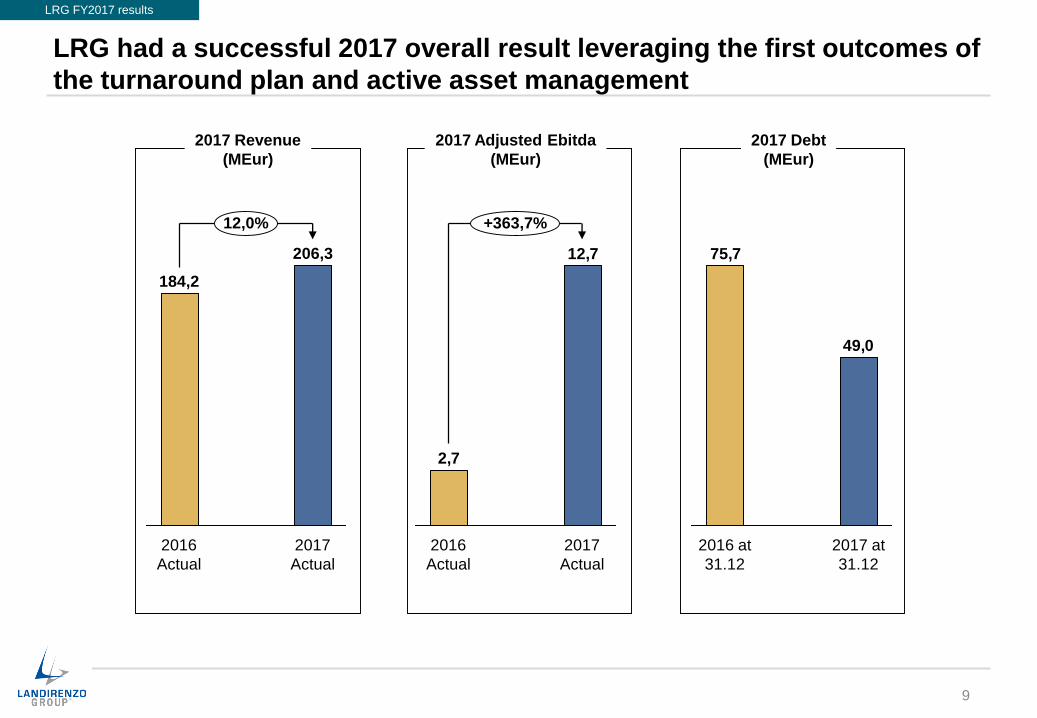
LRG had a successful 2017 overall result leveraging the first outcomes of
the turnaround plan and active asset management
2017 Revenue
(MEur)
2017
Actual
206,3
184,2
12,0%
2016
Actual
12,7
2,7
2017
Actual
2016
Actual
+363,7%
2017 Adjusted Ebitda
(MEur)
2017 Debt
(MEur)
49,0
75,7
2017 at
31.12
2016 at
31.12
LRG FY2017 results
9

FY 2017 P&L improves in all financial indicators - Automotive business, net
of Labs and extraordinary effect, has reached break-even (adj. Ebit 0,1M€)
M€ FY 2017 FY 2016 Delta M€ Delta %
Revenues 206,3 184,2 22,1 12,0%
EBITDA Adj. 12,7 2,7 10,0 363,7%
% on Revenues 6,2% 1,5%
EBITDA 4,7 -2,9 7,6 262,0%
% on Revenues 2,3% -1,6%
EBIT Adj. -1,5 -13,3 11,8 88,7%
% on Revenues -0,7% -7,2%
EBIT -11,5 -18,9 7,4 39,3%
% on Revenues -5,6% -10,3%
Capital Gain 21,1 0,0 21,1
Financials -6,1 -4,2 -1,9 46,3%
EBT 3,5 -23,1 26,6 115,2%
Taxes 0,2 -2,9 3,1 107,9%
Net Income 3,7 -26,0 29,7 114,2%
% on Revenues 1,8% -14,1%
LRG FY2017 results
10All extraordinary costs are included in Automotive sector P&L (11,0M€)
11,028,1167,2
206,3
Automotive
SectorLR GroupSound
Sector
Gas Distrib.
and
Compr.Nat.Gas
Sector
1,00,910,812,7
LR GroupSound
Sector
Gas Distrib.
and
Compr.Nat.Gas
Sector
Automotive
Sector
-1,9
-1,5
0,3
Gas Distrib.
and
Compr.Nat.Gas
Sector
0,0
Automotive
Sector
-1,8
0,1
Labs
activities
LR GroupSound
Sector
Revenue Adj. Ebitda Adj. EbitAuto
w/o Labs
• Revenue increased by 22,1M€ (+12%), thanks to
outstanding performance of the automotive sector
• Adjusted EBITDA improved 10,0M€ (+364%) due to
increased volumes and first results of restructuring
activities
• EBITDA is impacted by Extraordinary costs (11,0M€)
to support restructuring activities (less than 1 year
payback) and Extraordinary profit due to the sales of
the Chinese building (+3,0M€)
• EBIT also impacted by capital loss due to the tech
lab. to AVL (-2,0M€)
• Capital gain due to the merger of SAFE with Clean
Energy Compressor (plus) and the sale of 18sound
(minus)
• First positive Net Income since 2012
Highlights
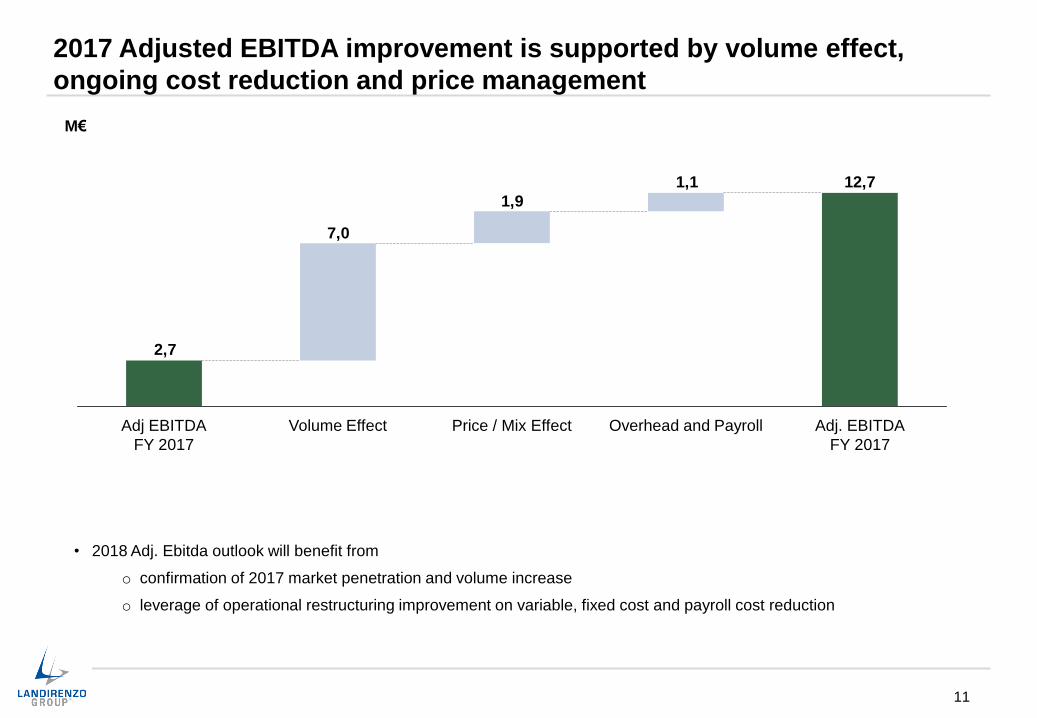
2017 Adjusted EBITDA improvement is supported by volume effect,
ongoing cost reduction and price management
11
M€
• 2018 Adj. Ebitda outlook will benefit from
o confirmation of 2017 market penetration and volume increase
o leverage of operational restructuring improvement on variable, fixed cost and payroll cost reduction
12,71,1
1,9
7,0
2,7
Volume EffectAdj EBITDA
FY 2017
Price / Mix Effect Overhead and Payroll Adj. EBITDA
FY 2017
Dec.
2017
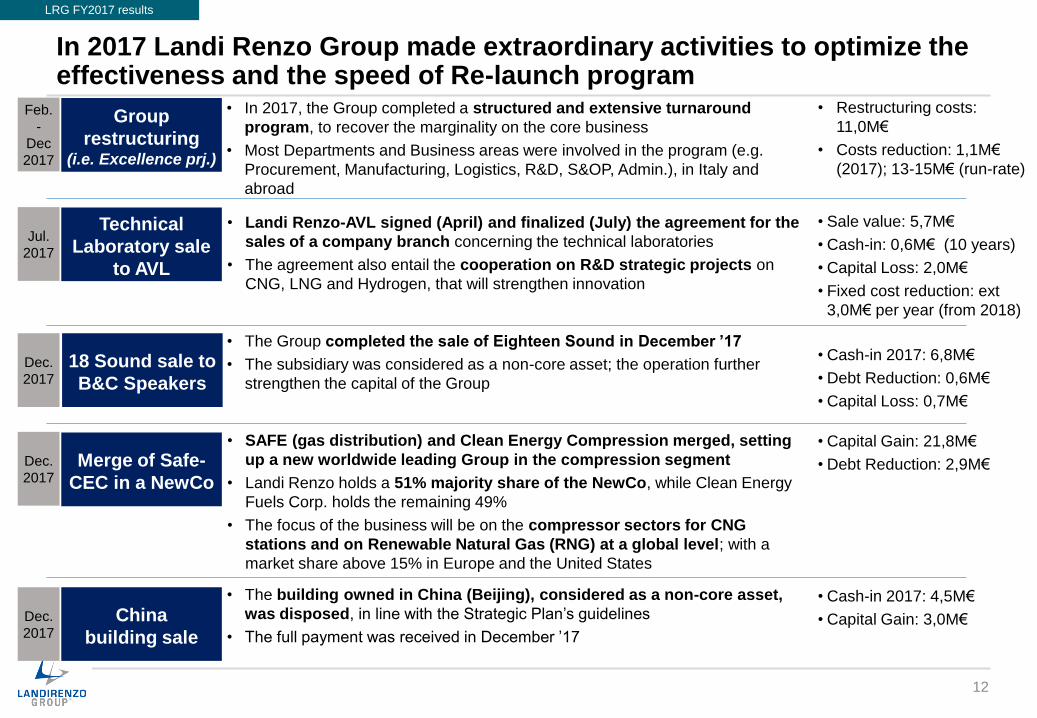
In 2017 Landi Renzo Group made extraordinary activities to optimize the effectiveness and the speed of Re-launch program
12
Technical
Laboratory sale
to AVL
• Landi Renzo-AVL signed (April) and finalized (July) the agreement for the
sales of a company branch concerning the technical laboratories
• The agreement also entail the cooperation on R&D strategic projects on
CNG, LNG and Hydrogen, that will strengthen innovation
• Sale value: 5,7M€
• Cash-in: 0,6M€ (10 years)
• Capital Loss: 2,0M€
• Fixed cost reduction: ext
3,0M€ per year (from 2018)
Merge of Safe-
CEC in a NewCo
• SAFE (gas distribution) and Clean Energy Compression merged, setting
up a new worldwide leading Group in the compression segment
• Landi Renzo holds a 51% majority share of the NewCo, while Clean Energy
Fuels Corp. holds the remaining 49%
• The focus of the business will be on the compressor sectors for CNG
stations and on Renewable Natural Gas (RNG) at a global level; with a
market share above 15% in Europe and the United States
• Capital Gain: 21,8M€
• Debt Reduction: 2,9M€
18 Sound sale to
B&C Speakers
• The Group completed the sale of Eighteen Sound in December ’17
• The subsidiary was considered as a non-core asset; the operation further
strengthen the capital of the Group
• Cash-in 2017: 6,8M€
• Debt Reduction: 0,6M€
• Capital Loss: 0,7M€
China
building sale
• The building owned in China (Beijing), considered as a non-core asset,
was disposed, in line with the Strategic Plan’s guidelines
• The full payment was received in December ’17
• Cash-in 2017: 4,5M€
• Capital Gain: 3,0M€
LRG FY2017 results
Dec.
2017
Dec.
2017
Jul.
2017
Group
restructuring(i.e. Excellence prj.)
Feb.
-
Dec
2017
• Restructuring costs:
11,0M€
• Costs reduction: 1,1M€
(2017); 13-15M€ (run-rate)
• In 2017, the Group completed a structured and extensive turnaround
program, to recover the marginality on the core business
• Most Departments and Business areas were involved in the program (e.g.
Procurement, Manufacturing, Logistics, R&D, S&OP, Admin.), in Italy and
abroad
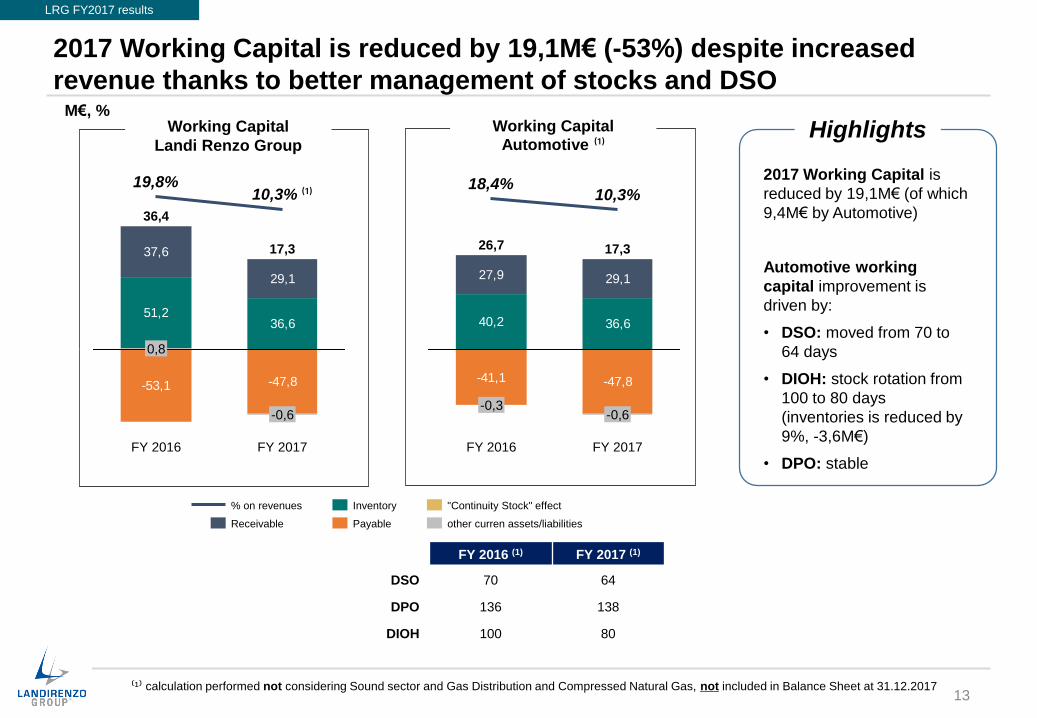
2017 Working Capital is reduced by 19,1M€ (-53%) despite increased
revenue thanks to better management of stocks and DSOM€, %
*
-53,1 -47,8
51,236,6
37,6
29,1
0
FY 2017
17,3
-0,6
10,3% ⁽¹⁾
FY 2016
36,4
0,8
19,8%
"Continuity Stock" effect
Payable
Inventory
Receivable
% on revenues
other curren assets/liabilities
FY 2016 (1) FY 2017 (1)
DSO 70 64
DPO 136 138
DIOH 100 80
Highlights
⁽¹⁾ calculation performed not considering Sound sector and Gas Distribution and Compressed Natural Gas, not included in Balance Sheet at 31.12.2017
-41,1 -47,8
40,2 36,6
27,9 29,1
0
FY 2017
10,3%
-0,3
18,4%
FY 2016
26,7 17,3
-0,6
Working Capital
Landi Renzo Group
Working CapitalAutomotive ⁽¹⁾
2017 Working Capital is
reduced by 19,1M€ (of which
9,4M€ by Automotive)
Automotive working
capital improvement is
driven by:
• DSO: moved from 70 to
64 days
• DIOH: stock rotation from
100 to 80 days
(inventories is reduced by
9%, -3,6M€)
• DPO: stable
LRG FY2017 results
13
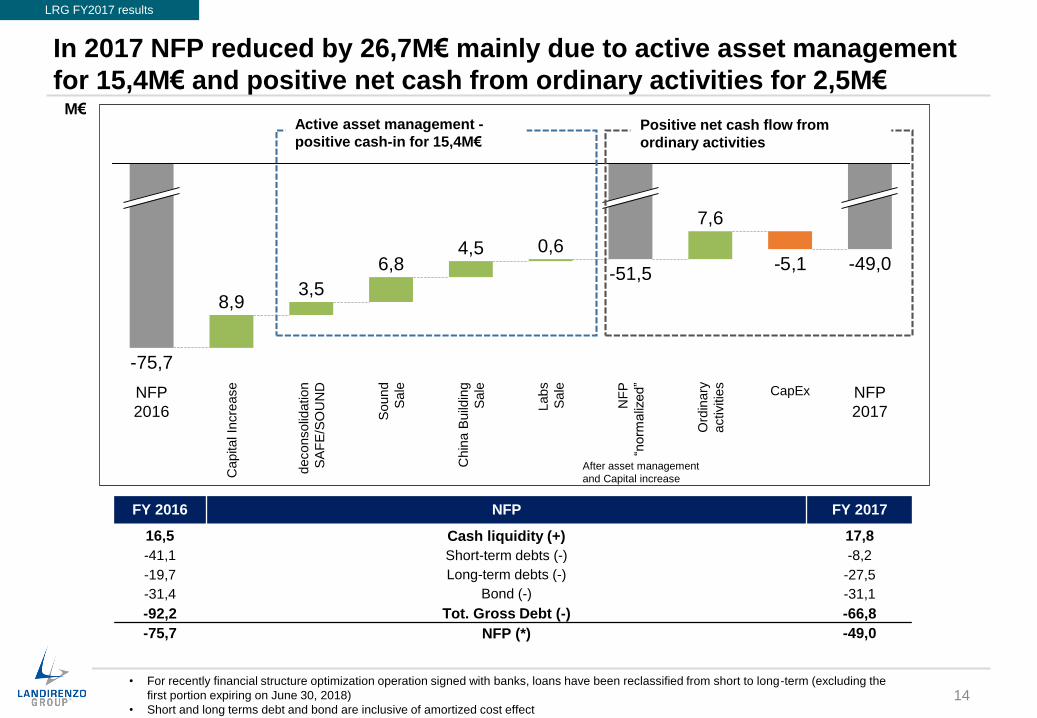
In 2017 NFP reduced by 26,7M€ mainly due to active asset management
for 15,4M€ and positive net cash from ordinary activities for 2,5M€M€
FY 2016 NFP FY 2017
16,5 Cash liquidity (+) 17,8
-41,1 Short-term debts (-) -8,2
-19,7 Long-term debts (-) -27,5
-31,4 Bond (-) -31,1
-92,2 Tot. Gross Debt (-) -66,8
-75,7 NFP (*) -49,0
• For recently financial structure optimization operation signed with banks, loans have been reclassified from short to long-term (excluding the
first portion expiring on June 30, 2018)
• Short and long terms debt and bond are inclusive of amortized cost effect
-5,1 -49,0
CapEx NFP
2017
6,8
deconsolid
ation
SA
FE
/SO
UN
D
3,5
Capital In
cre
ase
8,9
NFP
2016
-75,7
Ord
inary
activitie
s
7,6
NF
P
“norm
aliz
ed”
-51,5
Labs
Sale
0,6
Chin
a B
uild
ing
Sale
4,5
Sound
Sale
Active asset management -
positive cash-in for 15,4M€Positive net cash flow from
ordinary activities
After asset management
and Capital increase
LRG FY2017 results
14

2018 Outlook confirms 2018-2022 Strategic Plan with ~ 25M€ of Adj. Ebitda
2018 Revenue outlook
(MEur)
2017A
165-170
2018E
167,3
10,8
2018E
~ 25
2017A
2018 Adjusted Ebitda outlook
(MEur)
57-6048,3
2018E2017
Pro-forma
0,0
2018E2017
pro-forma
~ 5
LRG
---
Automotive
SAFE &
CEC
Group (1)
• 2018 revenue outlook is
expected to confirm Strategic Plan
guidelines
• 2018 Adj. Ebitda outlook is
expected to achieve ~25M€ (~
+130%) in line with 2018-2022
Strategic Plan, thanks to cost
reduction implementation:
o Direct Costs optimization
o Personnel cost alignment
o Fixed costs structure
review
6,5% ~ 15%
⁽¹⁾ joint ventures consolidated based on equity method
2018 Revenue outlook
(MEur)
2018 Adjusted Ebitda outlook
(MEur)
0% ~ 8%
• 2018 revenue outlook is
expected to increase vs. 2017
pro-forma results
• 2018 Adj. Ebitda is expected to
be in line with M&A Strategic
Plan guidelines
LRG 2018 outlook
15

‣ Landi Renzo Group
‣ Re-launch program: Achieved Results and 2017 FY Financials
‣ Market trends and Landi Renzo Group 2018 – 2022 Strategic Plan
‣ “G-Mobility Way” – Landi Renzo Group Forward Looking Integrated Strategy
‣ SAFE – Clean Energy Compression merger
Agenda
16
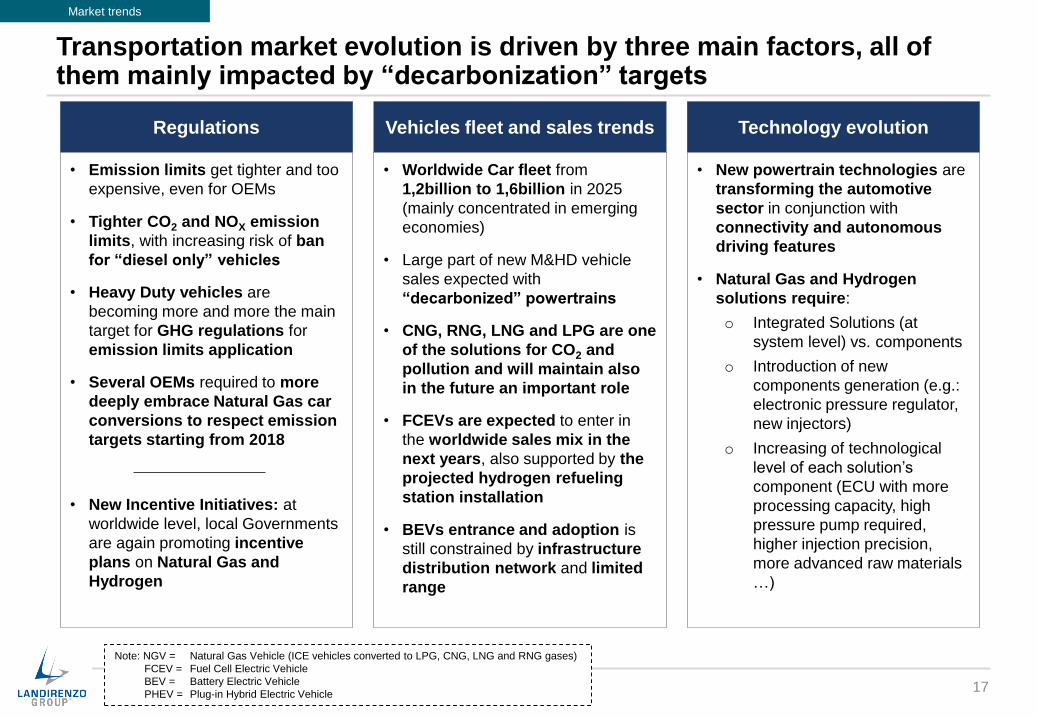
• Worldwide Car fleet from
1,2billion to 1,6billion in 2025
(mainly concentrated in emerging
economies)
• Large part of new M&HD vehicle
sales expected with
“decarbonized” powertrains
• CNG, RNG, LNG and LPG are one
of the solutions for CO2 and
pollution and will maintain also
in the future an important role
• FCEVs are expected to enter in
the worldwide sales mix in the
next years, also supported by the
projected hydrogen refueling
station installation
• BEVs entrance and adoption is
still constrained by infrastructure
distribution network and limited
range
Vehicles fleet and sales trends
• New powertrain technologies are
transforming the automotive
sector in conjunction with
connectivity and autonomous
driving features
• Natural Gas and Hydrogen
solutions require:
o Integrated Solutions (at
system level) vs. components
o Introduction of new
components generation (e.g.:
electronic pressure regulator,
new injectors)
o Increasing of technological
level of each solution’s
component (ECU with more
processing capacity, high
pressure pump required,
higher injection precision,
more advanced raw materials
…)
Technology evolution
• Emission limits get tighter and too
expensive, even for OEMs
• Tighter CO2 and NOX emission
limits, with increasing risk of ban
for “diesel only” vehicles
• Heavy Duty vehicles are
becoming more and more the main
target for GHG regulations for
emission limits application
• Several OEMs required to more
deeply embrace Natural Gas car
conversions to respect emission
targets starting from 2018
• New Incentive Initiatives: at
worldwide level, local Governments
are again promoting incentive
plans on Natural Gas and
Hydrogen
Regulations
Transportation market evolution is driven by three main factors, all of them mainly impacted by “decarbonization” targets
17
Market trends
Note: NGV = Natural Gas Vehicle (ICE vehicles converted to LPG, CNG, LNG and RNG gases)
FCEV = Fuel Cell Electric Vehicle
BEV = Battery Electric Vehicle
PHEV = Plug-in Hybrid Electric Vehicle

2018 – 2022 LRG Strategic Plan has set clear directions to drive LRG towards a “virtuous” journey inside NG and Hydrogen alternative fuels …
18
Market Focalization and Business
Development
Targeted Partnerships for
accelerating results achievement
Operations and R&D processes
-----
Continuous Improvement
• Become one of the leading
companies in M&HD and Off-road
segments
• Benefit from current M&HD
demand / opportunities to
establish LRG presence in high
growth markets
• Develop M&HD new Product
Portfolio also leveraging EU6
discontinuity
• Consolidate leading global
market position in Passenger Cars
LPG (AM and OEM) with current
Product Portfolio
• Enrich Passenger Cars CNG
offering for OEMs with advanced
products
• Increase market share in AM
emerging growing markets both
with LPG and CNG
• Evaluate sales and technical
synergies to
o Leverage LRG sales &
manufacturing network
o Accelerate new M&HD product
portfolio go-to-market
o Improve current Passenger
Cars CNG product portfolio
with “ready-to-use” advanced
products
o Provide vehicle integration
service solutions in M&HD
segments
o Leverage LRG Hydrogen
capabilities to provide FCEV
solutions
• Assure the adoption of
“continuous improvement” as
structured approach to maintain the
focus on efficiency
• Manufacturing Centre of
Excellence
o Started the adoption of WCM in
Reggio Operation
o Focusing on having assembly
facilities worldwide with the higher
standard of quality, efficiency with
performance aligned to top
players
• Purchasing optimization
o Full adoption of Sourcing
effectiveness improvement
o Strong connection between R&D
and purchasing
o Continuous spending containment
Note: M&HD: Mid & Heady Duty Vehicles, PC: Passenger Cars, EPC: Engineering Procurement Construction;
LCC: Low Cost Countries
2018-2022 Strategic Plan

Product Portfolio evolution
• Develop / launch new products in
the next 18 -24 months, incl.
• M&HD components / solutions
• Passenger cars CNG new
solutions
• Modularize product architecture
• Develop Hydrogen’s solutions
starting from existing
capabilities and product features
Market development
• Enlarge presence in China by
entering the M&HD segment and
developing the AM business
• Leverage LPG position in OEM
market to consolidate relationships
with clients and target CNG
development
• Increase the focus on 2nd Tier
OEMs, starting through the
understanding their needs to
provide a reliable offer
• Defend market share in mature AM
markets
• Expand presence in new markets
R&D and Innovation
• Become a center of excellence in
powertrain electronics by leveraging
existing expertise
• Evolve After Market solutions with
connectivity features to improve
customer experience
• Introduce new advanced
components (e.g.: electronic
pressure reducer, top feed injectors,
mono-fuel ECU, …)
• Make the first step in new
segments (Hydrogen)
Increase revenues and
profitability of new productsAdd new markets
Smart R&D design, Electronic
capabilities. new material
knowledge as main elements
for product innovation
… stating an articulated vision both on strategic elements …
19
2018-2022 Strategic Plan
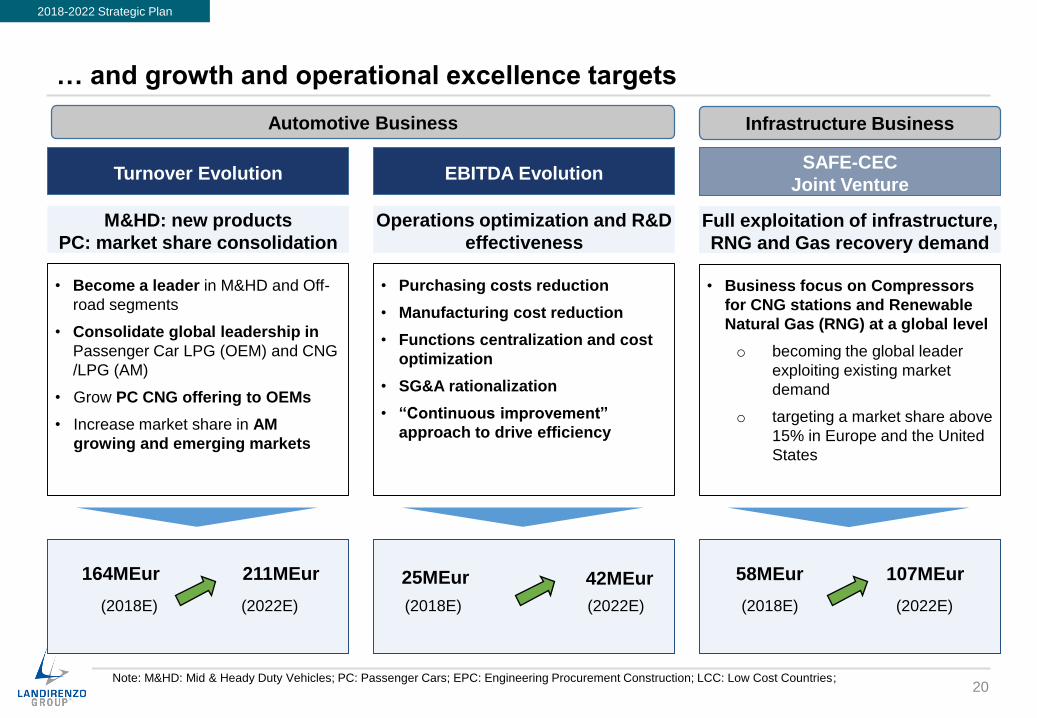
… and growth and operational excellence targets
20
M&HD: new products
PC: market share consolidation
Full exploitation of infrastructure,
RNG and Gas recovery demand
Operations optimization and R&D
effectiveness
• Become a leader in M&HD and Off-
road segments
• Consolidate global leadership in
Passenger Car LPG (OEM) and CNG
/LPG (AM)
• Grow PC CNG offering to OEMs
• Increase market share in AM
growing and emerging markets
• Business focus on Compressors
for CNG stations and Renewable
Natural Gas (RNG) at a global level
o becoming the global leader
exploiting existing market
demand
o targeting a market share above
15% in Europe and the United
States
• Purchasing costs reduction
• Manufacturing cost reduction
• Functions centralization and cost
optimization
• SG&A rationalization
• “Continuous improvement”
approach to drive efficiency
Note: M&HD: Mid & Heady Duty Vehicles; PC: Passenger Cars; EPC: Engineering Procurement Construction; LCC: Low Cost Countries;
Turnover EvolutionSAFE-CEC
Joint VentureEBITDA Evolution
164MEur 211MEur 58MEur 107MEur
2018-2022 Strategic Plan
(2018E) (2022E) (2018E) (2022E)
Automotive Business
25MEur 42MEur
(2018E) (2022E)
Infrastructure Business
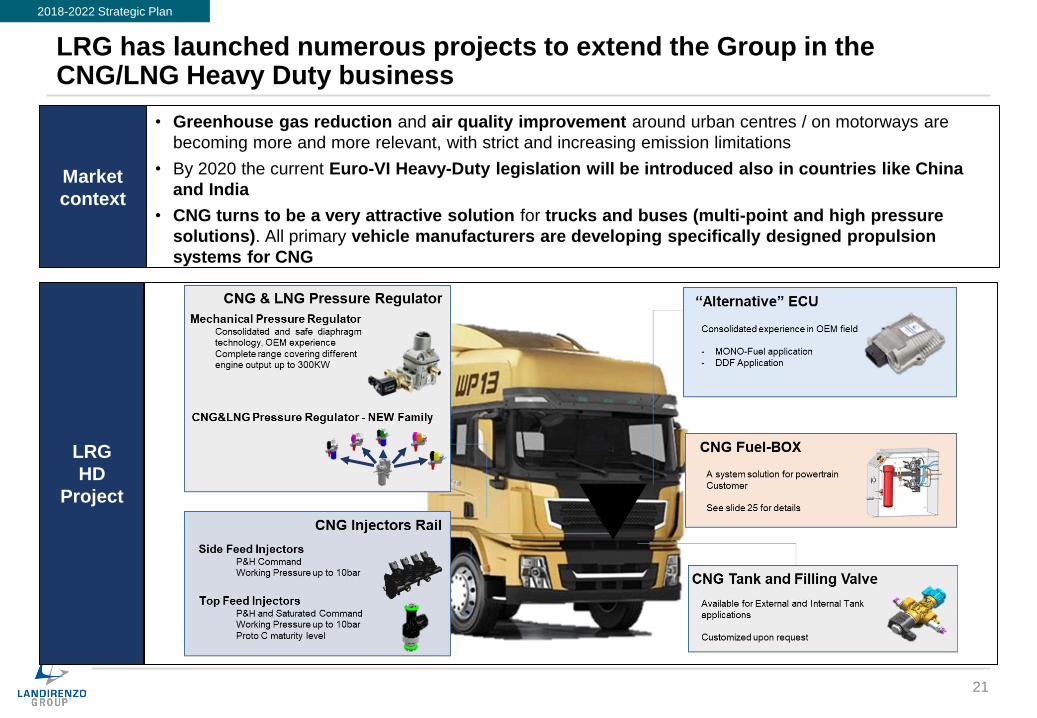
LRG has launched numerous projects to extend the Group in the CNG/LNG Heavy Duty business
• Greenhouse gas reduction and air quality improvement around urban centres / on motorways are
becoming more and more relevant, with strict and increasing emission limitations
• By 2020 the current Euro-VI Heavy-Duty legislation will be introduced also in countries like China
and India
• CNG turns to be a very attractive solution for trucks and buses (multi-point and high pressure
solutions). All primary vehicle manufacturers are developing specifically designed propulsion
systems for CNG
Market
context
LRG
HD
Project
2018-2022 Strategic Plan
21
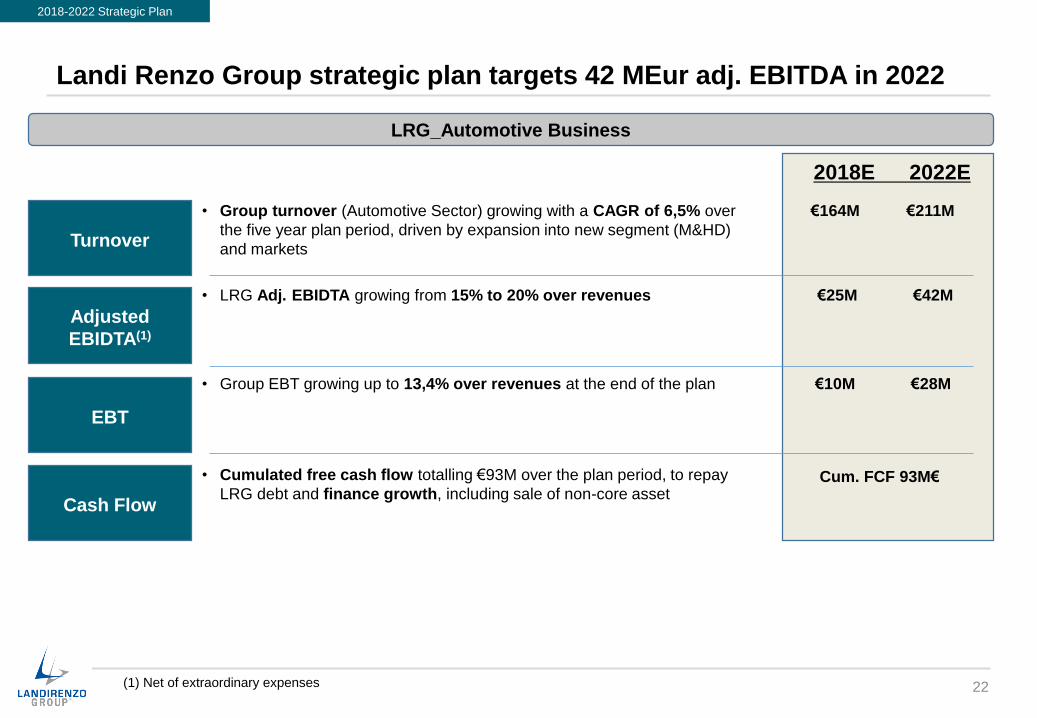
Landi Renzo Group strategic plan targets 42 MEur adj. EBITDA in 2022
22
Turnover
• Group turnover (Automotive Sector) growing with a CAGR of 6,5% over
the five year plan period, driven by expansion into new segment (M&HD)
and markets
Adjusted
EBIDTA(1)
• LRG Adj. EBIDTA growing from 15% to 20% over revenues
(1) Net of extraordinary expenses
2018E 2022E
€25M €42M
Cash Flow
• Cumulated free cash flow totalling €93M over the plan period, to repay
LRG debt and finance growth, including sale of non-core assetCum. FCF 93M€
€164M €211M
EBT
• Group EBT growing up to 13,4% over revenues at the end of the plan €10M €28M
2018-2022 Strategic Plan
LRG_Automotive Business

SAFE-CEC join venture targets more than 100MEur of revenue and 20% of Adj. Ebitda in 2022
23
Turnover
Adjusted
EBIDTA(1)
• EBITDA positively impacted by synergies between SAFE and Clean
Energy Compression
• In 2022, Adj.EBITDA on revenues growing up to 20% (from 8% in 2018)
(1) Net of extraordinary expenses
2018E 2022E
€5M €22M
Cash Flow
• Cumulated free cash flow totalling €34M over the plan period
• Possibility to pay dividends to shareholder
€58M €107M
2018-2022 Strategic Plan
• SAFE-CEC revenues (CAGR: 16,6%) leveraging on market
penetration
SAFE – CEC join venture
Cum. FCF 34M€
‣ Landi Renzo Group
‣ Re-launch program: Achieved Results and 2017 FY Financials
‣ Market trends and Landi Renzo Group 2018 – 2022 Strategic Plan
‣ “G-Mobility Way” – Landi Renzo Group Forward Looking Integrated Strategy
‣ SAFE – Clean Energy Compression merger
Agenda
24

5 year plan
2017 2018 2019 2020 2021 2022
Mid-long term
2023
Operational
excellence
Gas solutions as an affordable bridge to
electrification and the only real solution for
Heavy Duty
Develop multi-disciplinary skills to navigate the “new era of automotive” alongside
Electric Vehicles
Enlarge technology capabilities to all alternative fuels developments, with strong
focus on Hydrogen
Exploit the opportunity to become a center of excellence to investigate new Alternative
Fuels technologies, such as LNG-battery series solutions and off-road applications
Forward looking: extend our leadership in the
gas-mobility by enlarging our offering
In a transformational environment and while implementing the Strategic Plan, Landi Renzo Group is forward looking …
25
LRG Forward Looking Strategy
… to affirm its own “G-Mobility Way” integrated Strategy to complement BEVs technology in the next decades for transportation decarbonization
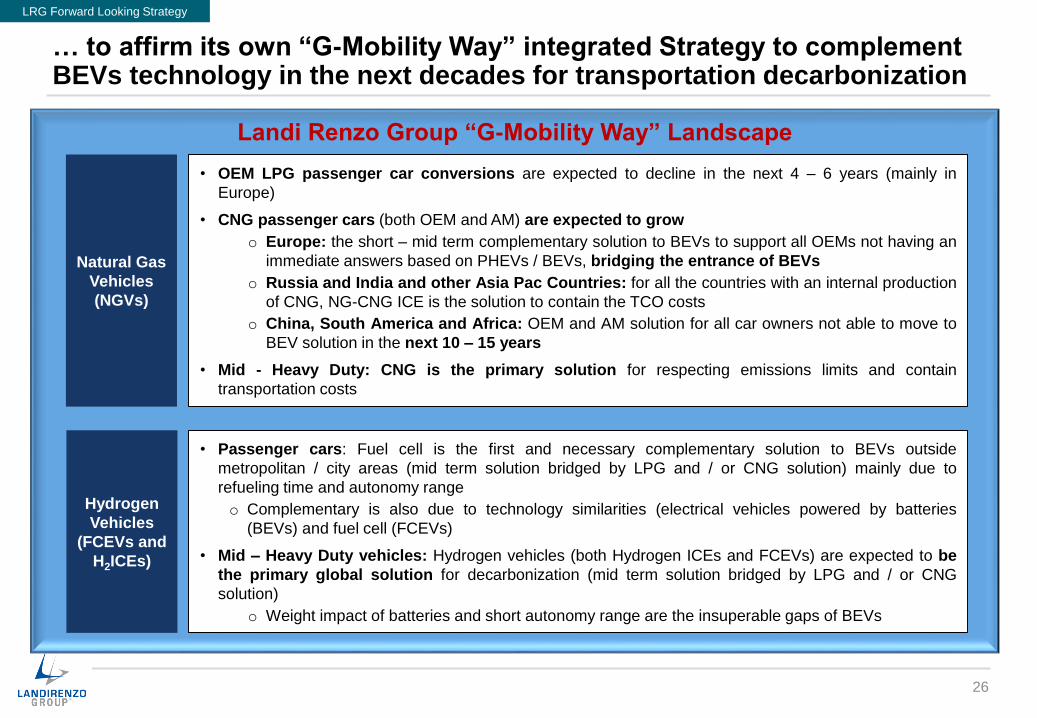
26
Landi Renzo Group “G-Mobility Way” Landscape
Natural Gas
Vehicles
(NGVs)
• OEM LPG passenger car conversions are expected to decline in the next 4 – 6 years (mainly in
Europe)
• CNG passenger cars (both OEM and AM) are expected to grow
o Europe: the short – mid term complementary solution to BEVs to support all OEMs not having an
immediate answers based on PHEVs / BEVs, bridging the entrance of BEVs
o Russia and India and other Asia Pac Countries: for all the countries with an internal production
of CNG, NG-CNG ICE is the solution to contain the TCO costs
o China, South America and Africa: OEM and AM solution for all car owners not able to move to
BEV solution in the next 10 – 15 years
• Mid - Heavy Duty: CNG is the primary solution for respecting emissions limits and contain
transportation costs
Hydrogen
Vehicles
(FCEVs and
H2ICEs)
• Passenger cars: Fuel cell is the first and necessary complementary solution to BEVs outside
metropolitan / city areas (mid term solution bridged by LPG and / or CNG solution) mainly due to
refueling time and autonomy range
o Complementary is also due to technology similarities (electrical vehicles powered by batteries
(BEVs) and fuel cell (FCEVs)
• Mid – Heavy Duty vehicles: Hydrogen vehicles (both Hydrogen ICEs and FCEVs) are expected to be
the primary global solution for decarbonization (mid term solution bridged by LPG and / or CNG
solution)
o Weight impact of batteries and short autonomy range are the insuperable gaps of BEVs
LRG Forward Looking Strategy
Landi Renzo Group “G-Mobility Way” integrated Strategy embraces all Alternative Gas Fuel to concretely make real transportation decarbonization …
27
“G-Mobility Way” LRG’s Strategy
“G-Mobility Way” is the Forward Looking Integrated Strategy to make Landi Renzo Group
providing full alternative fuel solutions for supporting transportation decarbonization
CNG, LNG, RNG, LPG
Integrated Portfolio for providing Passenger Cars and Heavy Duty
• Components
• Full Solutions
• Vehicle solution integration services
Hydrogen(1)
(1) FCE and H2ICE solutions
LRG Forward Looking Strategy
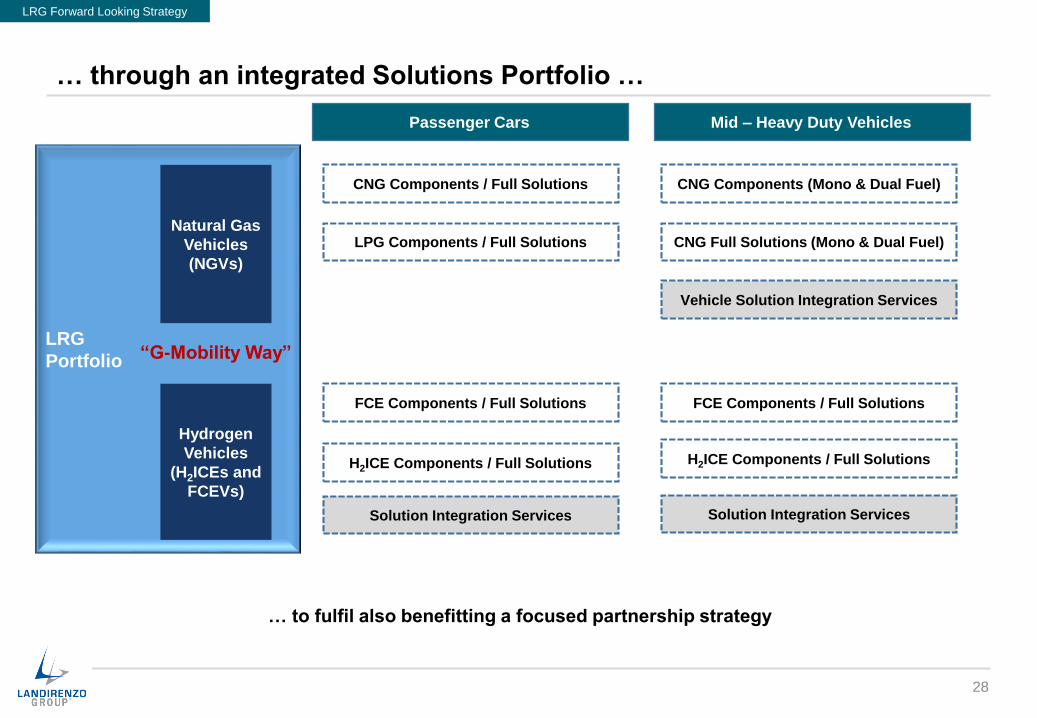
LRG
Portfolio
… through an integrated Solutions Portfolio …
28
Natural Gas
Vehicles
(NGVs)
Hydrogen
Vehicles
(H2ICEs and
FCEVs)
Passenger Cars Mid – Heavy Duty Vehicles
LRG Forward Looking Strategy
CNG Components / Full Solutions
LPG Components / Full Solutions
CNG Components (Mono & Dual Fuel)
CNG Full Solutions (Mono & Dual Fuel)
Vehicle Solution Integration Services
FCE Components / Full Solutions FCE Components / Full Solutions
H2ICE Components / Full Solutions H2ICE Components / Full Solutions
Solution Integration Services Solution Integration Services
“G-Mobility Way”
… to fulfil also benefitting a focused partnership strategy
‣ Landi Renzo Group
‣ Re-launch program: Achieved Results and 2017 FY Financials
‣ Market trends and Landi Renzo Group 2018 – 2022 Strategic Plan
‣ “G-Mobility Way” – Landi Renzo Group Forward Looking Integrated Strategy
‣ SAFE – Clean Energy Compression merger
Agenda
29

Landi Renzo Group and Clean Energy Fuel merged their wholly owned subsidiaries SAFE and Clean Energy Compression into a new company
30
• Landi Renzo Group and Clean Energy Fuel (CLNE – NASDAC) merged their wholly owned
subsidiaries SAFE and Clean Energy Compression into a new company
• Closing occurred on 31st December 2017
• On Safe side the deal accelerates turnover growth and international development, with few
overlapping in terms of market coverage and product portfolio
• The deal created the second largest player world-wide in the natural gas compression market, with
significant opportunities for further market expansion
Deal
NewCo
Strategy
and
Expected
Results
LRG Value
Creation
• Fully integration is expected to be completed by 3Q 2018, with very few overlapping
• SAFE-CEC NewCo will have a market leading position in Europe and America and will benefit from
cross selling of products and potential market growth in the next years
• Thanks to «immediate» expected synergy effect (from ~2,6M€ in 2018 to more than 7M€ and in 2020)
NewCo will be able to create higher value for shareholders starting from 2018 (expected adj. EBITDA:
4,9M€ in 2018, 16M€ in 2020), with dividends distribution along the years
• Landi Renzo Group took benefit from a «non monetary» capital gain of 24,2M€ at closing
• With deal completion LRG deconsolidated 3,4M€ net debt
• Based on LRG assumptions, the book value of NewCo on LRG Assets will be significantly higher than
the book value of SAFE stand alone, starting from 2018
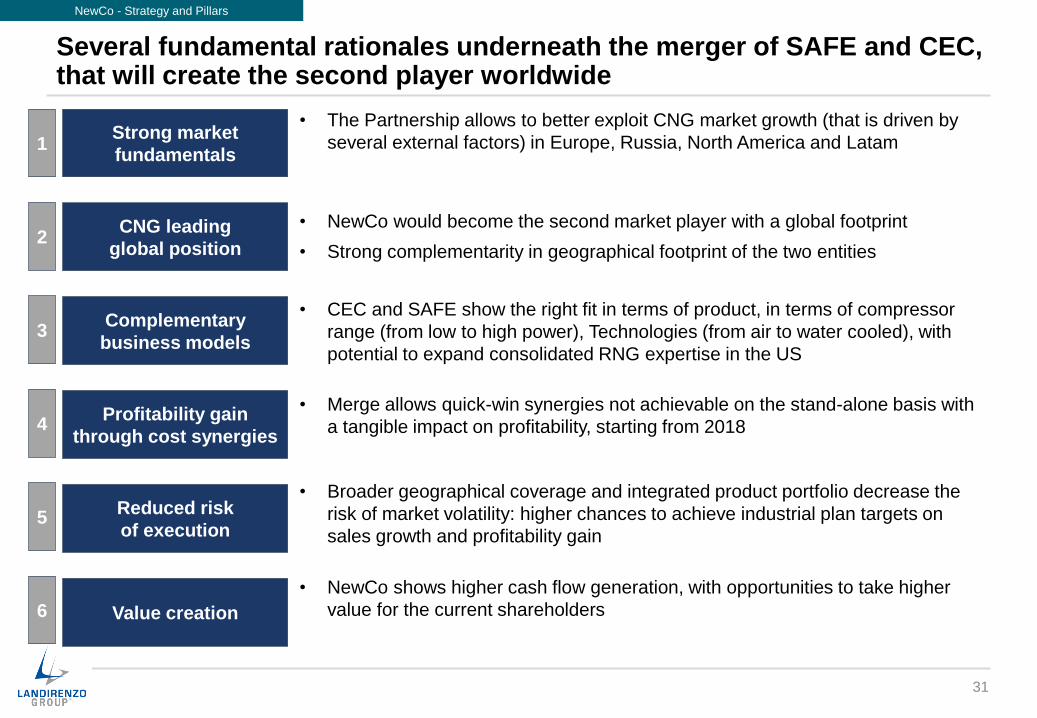
Several fundamental rationales underneath the merger of SAFE and CEC, that will create the second player worldwide
31
CNG leading
global position
Complementary
business models
Profitability gain
through cost synergies
Value creation
• NewCo would become the second market player with a global footprint
• Strong complementarity in geographical footprint of the two entities
• CEC and SAFE show the right fit in terms of product, in terms of compressor
range (from low to high power), Technologies (from air to water cooled), with
potential to expand consolidated RNG expertise in the US
• Merge allows quick-win synergies not achievable on the stand-alone basis with
a tangible impact on profitability, starting from 2018
• NewCo shows higher cash flow generation, with opportunities to take higher
value for the current shareholders
Reduced risk
of execution
• Broader geographical coverage and integrated product portfolio decrease the
risk of market volatility: higher chances to achieve industrial plan targets on
sales growth and profitability gain
Strong market
fundamentals
• The Partnership allows to better exploit CNG market growth (that is driven by
several external factors) in Europe, Russia, North America and Latam
NewCo - Strategy and Pillars
1
2
3
4
5
6

NewCo strategy is based on quickly achieving market leadership position that will lead to a value increase for both shareholders
• Reinforce leadership market positioning: leverage on acquired
efficiency and market presence to gain market share and become the first
player in the market
• Explore further consolidation: smaller players might not be able to
operate stand-alone in a more competitive market (opportunities for M&A)
• Assess best strategy to maximize value for shareholder: explore new
plans to increase the value of the NewCo – and thus the value for the
shareholders
• Achieve full integration of SAFE and CEC:
NewCo operating at its full capacity and
potential, exploiting all synergies to increase
competitiveness
• Consolidate market positioning: focus effort
on core CNG segment, and expand existing
market share in key markets (Americas and
Europe)
• Expand in RNG growing market: strengthen
commercial network on RNG growing market
segment
• Operational improvement: achieve product
components standardization and review key
operations processes to reduce direct cost and
ODT
• After sales: leverage on large installed
compressor base to implement international-
based after sales service
Source: LRG-CE internal analysis and assessment 32
Quick-win actions
Deploy NewCo full potential
Consolidation phase
Create long-term value
5-year plan
20192018 20212020 2022
1 2
NewCo - Strategy and Pillars
The presentation has not been prepared
or approved by Clean Energy

33www.landirenzogroup.com
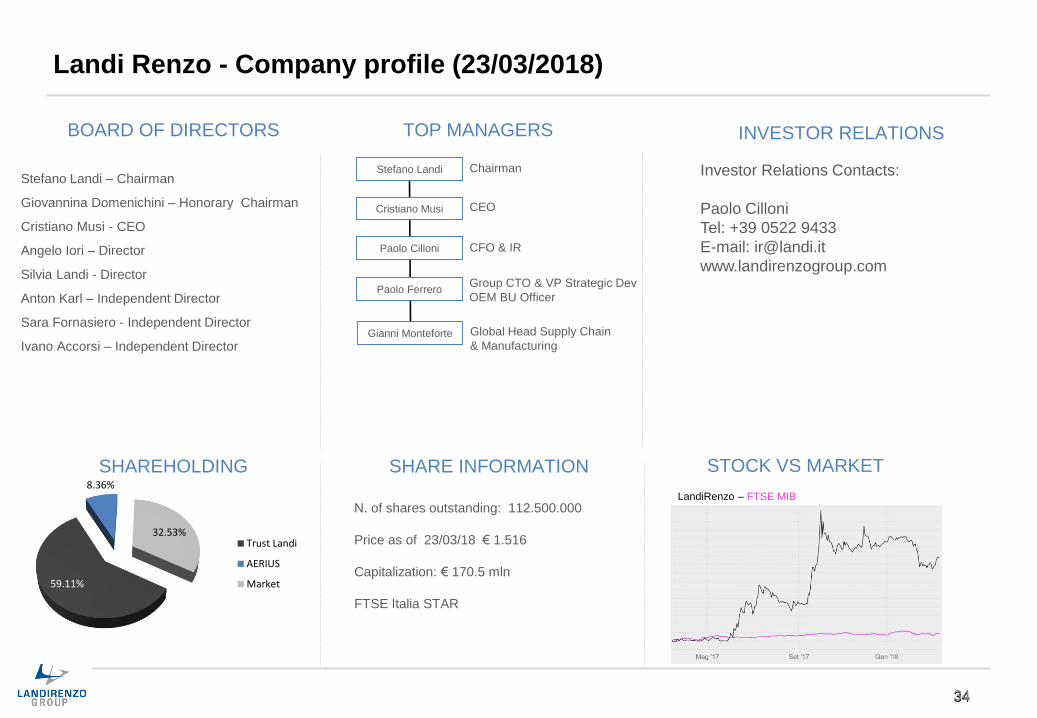
59.11%
8.36%
32.53%Trust Landi
AERIUS
Market
34
INVESTOR RELATIONSTOP MANAGERS
Paolo Cilloni CFO & IR
SHAREHOLDING SHARE INFORMATION
BOARD OF DIRECTORS
Stefano Landi – Chairman
Giovannina Domenichini – Honorary Chairman
Cristiano Musi - CEO
Angelo Iori – Director
Silvia Landi - Director
Anton Karl – Independent Director
Sara Fornasiero - Independent Director
Ivano Accorsi – Independent Director
Stefano Landi Chairman
Cristiano Musi CEO
STOCK VS MARKET
Investor Relations Contacts:
Paolo Cilloni
Tel: +39 0522 9433
E-mail: [email protected]
www.landirenzogroup.com
Landi Renzo - Company profile (23/03/2018)
LandiRenzo – FTSE MIBN. of shares outstanding: 112.500.000
Price as of 23/03/18 € 1.516
Capitalization: € 170.5 mln
FTSE Italia STAR
Paolo FerreroGroup CTO & VP Strategic Dev
OEM BU Officer
Gianni Monteforte Global Head Supply Chain
& Manufacturing
34
35
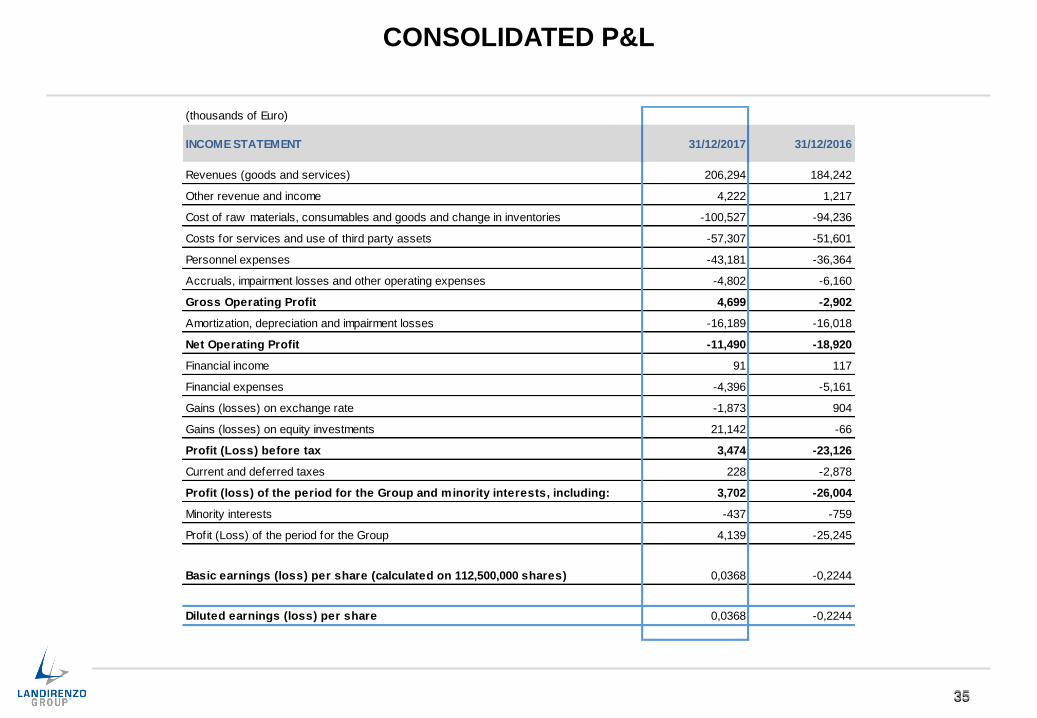
CONSOLIDATED P&L
(thousands of Euro)
INCOME STATEMENT 31/12/2017 31/12/2016
Revenues (goods and services) 206,294 184,242
Other revenue and income 4,222 1,217
Cost of raw materials, consumables and goods and change in inventories -100,527 -94,236
Costs for services and use of third party assets -57,307 -51,601
Personnel expenses -43,181 -36,364
Accruals, impairment losses and other operating expenses -4,802 -6,160
Gross Operating Profit 4,699 -2,902
Amortization, depreciation and impairment losses -16,189 -16,018
Net Operating Profit -11,490 -18,920
Financial income 91 117
Financial expenses -4,396 -5,161
Gains (losses) on exchange rate -1,873 904
Gains (losses) on equity investments 21,142 -66
Profit (Loss) before tax 3,474 -23,126
Current and deferred taxes 228 -2,878
Profit (loss) of the period for the Group and minority interests, including: 3,702 -26,004
Minority interests -437 -759
Profit (Loss) of the period for the Group 4,139 -25,245
Basic earnings (loss) per share (calculated on 112,500,000 shares) 0,0368 -0,2244
Diluted earnings (loss) per share 0,0368 -0,2244
35

36
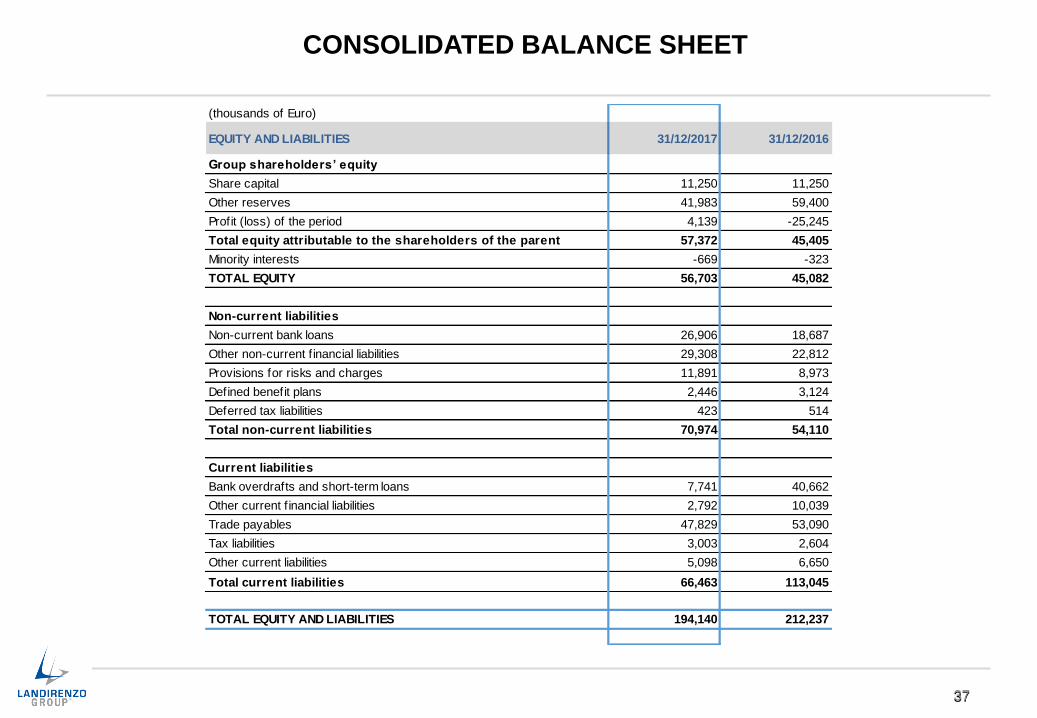
CONSOLIDATED BALANCE SHEET
(thousands of Euro)
ASSETS 31/12/2017 31/12/2016
Non-current assets
Property, plant and equipment 14,583 30,500
Development expenditure 5,401 8,420
Goodw ill 30,094 30,094
Other intangible assets w ith f inite useful lives 15,769 20,359
Equity investments consolidated using the equity method 24,301 43
Other non-current f inancial assets 428 664
Other non-current assets 4,560 0
Deferred tax assets 8,016 6,887
Total non-current assets 103,152 96,967
Current assets
Trade receivables 29,118 37,551
Inventories 36,562 49,872
Contract w orks in progress 0,000 1,281
Other receivables and current assets 7,529 10,082
Cash and cash equivalents 17,779 16,484
Total current assets 90,988 115,270
TOTAL ASSETS 194,140 212,237
36
37
CONSOLIDATED BALANCE SHEET
(thousands of Euro)
EQUITY AND LIABILITIES 31/12/2017 31/12/2016
Group shareholders’ equity
Share capital 11,250 11,250
Other reserves 41,983 59,400
Profit (loss) of the period 4,139 -25,245
Total equity attributable to the shareholders of the parent 57,372 45,405
Minority interests -669 -323
TOTAL EQUITY 56,703 45,082
Non-current liabilities
Non-current bank loans 26,906 18,687
Other non-current f inancial liabilities 29,308 22,812
Provisions for risks and charges 11,891 8,973
Defined benefit plans 2,446 3,124
Deferred tax liabilities 423 514
Total non-current liabilities 70,974 54,110
Current liabilities
Bank overdrafts and short-term loans 7,741 40,662
Other current f inancial liabilities 2,792 10,039
Trade payables 47,829 53,090
Tax liabilities 3,003 2,604
Other current liabilities 5,098 6,650
Total current liabilities 66,463 113,045
TOTAL EQUITY AND LIABILITIES 194,140 212,237
37

DISCLAIMER
38
This presentation has been prepared by Landi Renzo S.p.A. for information purposes only and for use in presentations of the
Group’s results and strategies.
This presentation contains forward-looking statements regarding future events and the future results of Landi Renzo S.p.A. that are
based on current expectations, estimates, forecasts, and projections about the industries in which Landi Renzo operates and the
beliefs and assumptions of the management of Landi Renzo. Words such as ‘expects’, ‘anticipates’, ‘targets’, ‘goals’, ‘projects’,
‘intends’, ‘plans’, ‘believes’, ‘seeks’, ‘estimates’, variations of such words, and similar expressions are intended to identify such
forward-looking statements. These forward-looking statements are only predictions and are subject to risks, uncertainties, and
assumptions that are difficult to predict because they relate to events and depend on circumstances that will occur in the future.
Therefore, Landi Renzo’s actual results may differ materially and adversely from those expressed or implied in any forward-looking
statements. Factors that might cause or contribute to such differences include, but are not limited to, economic conditions globally,
political, economic and regulatory developments in Italy and internationally. Any forward-looking statements made by or on behalf of
Landi Renzo speak only as of the date they are made.
Any reference to past performance of the Landi Renzo shall not be taken as an indication of future performance.
This document does not constitute an offer or invitation to purchase or subscribe for any shares, for any other financial instruments
and no part of it shall form the basis of or be relied upon in connection with any contract or commitment whatsoever.