state of arizona - gao.az.gov
TRANSCRIPT

STATE OF ARIZONA COMPREHENSIVE ANNUAL FINANCIAL REPORT
For the Fiscal Year Ended June 30, 2014
Douglas A. Ducey GOVERNOR

PREPARED BY ARIZONA DEPARTMENT OF ADMINISTRATION
GENERAL ACCOUNTING OFFICE

STATE OF ARIZONA COMPREHENSIVE ANNUAL FINANCIAL REPORT
i
TABLE OF CONTENTS
INTRODUCTORY SECTION (Not Covered by the Independent Auditors’ Report)
Page Letter of Transmittal ..................................................................................................................................................... 1 Arizona State Government Organization ....................................................................................................................... 9 Principal State Officials ................................................................................................................................................ 10
FINANCIAL SECTION
INDEPENDENT AUDITORS' REPORT .................................................................................................................. 15
MANAGEMENT’S DISCUSSION AND ANALYSIS ............................................................................................... 21 BASIC FINANCIAL STATEMENTS Government-Wide Financial Statements: Statement of Net Position ................................................................................................................................... 38 Universities - Affiliated Component Units – Statement of Financial Position....................................................... 40 Statement of Activities ....................................................................................................................................... 42 Universities - Affiliated Component Units – Statement of Activities ................................................................... 44
Governmental Funds Financial Statements: Balance Sheet .................................................................................................................................................... 45 Reconciliation of the Governmental Funds Balance Sheet to the Statement of Net Position ................................. 46 Statement of Revenues, Expenditures and Changes in Fund Balances ................................................................. 47 Reconciliation of the Statement of Revenues, Expenditures and Changes in Fund Balances of Governmental Funds to the Statement of Activities ........................................................................................... 48
Proprietary Funds Financial Statements: Statement of Net Position ................................................................................................................................... 50 Statement of Revenues, Expenses and Changes in Fund Net Position .................................................................. 52 Statement of Cash Flows .................................................................................................................................... 54
Fiduciary Funds Financial Statements: Statement of Fiduciary Net Position ................................................................................................................... 56 Statement of Changes in Fiduciary Net Position.................................................................................................. 57
Component Units Financial Statements: Combining Statement of Net Position ................................................................................................................. 58 Combining Statement of Activities ..................................................................................................................... 60
Universities – Affiliated Component Units Financial Statements: Combining Statement of Financial Position ........................................................................................................ 62 Combining Statement of Activities ..................................................................................................................... 63
Notes to the Financial Statements ......................................................................................................................... 64
REQUIRED SUPPLEMENTARY INFORMATION
Budgetary Comparison Schedule, Expenditures – General Fund ............................................................................... 131 Budgetary Comparison Schedule, Expenditures – Transportation and Aviation Planning, Highway Maintenance and Safety Fund ................................................................................................................................ 141 Notes to Required Supplementary Information – Budgetary Comparison Schedules ................................................. 142 Infrastructure Assets ................................................................................................................................................ 145 Agent Benefit Plans’ Funding Progress .................................................................................................................... 149

STATE OF ARIZONA COMPREHENSIVE ANNUAL FINANCIAL REPORT
ii
TABLE OF CONTENTS (CONTINUED)
FINANCIAL SECTION - CONCLUDED COMBINING FINANCIAL STATEMENTS AND SCHEDULES
Non-major Governmental Funds: Page Combining Balance Sheet .................................................................................................................................. 154 Combining Statement of Revenues, Expenditures and Changes in Fund Balances ............................................... 155
Non-major Special Revenue Funds: Combining Balance Sheet............................................................................................................................ 158 Combining Statement of Revenues, Expenditures and Changes in Fund Balances ........................................ 160 Budgetary Comparison Schedule, Expenditures ........................................................................................... 162
Land Endowments Fund: Budgetary Comparison Schedule, Expenditures ........................................................................................... 168
Non-major Debt Service Funds: Combining Balance Sheet............................................................................................................................ 170 Combining Statement of Revenues, Expenditures and Changes in Fund Balances ........................................ 171
Non-major Capital Projects Funds: Combining Balance Sheet............................................................................................................................ 174 Combining Statement of Revenues, Expenditures and Changes in Fund Balances........................................ 175 Non-major Proprietary Funds: Non-major Enterprise Funds: Combining Statement of Net Position .......................................................................................................... 178 Combining Statement of Revenues, Expenses and Changes in Fund Net Position ......................................... 180 Combining Statement of Cash Flows ........................................................................................................... 182
Internal Service Funds: Combining Statement of Net Position .......................................................................................................... 186 Combining Statement of Revenues, Expenses and Changes in Fund Net Position ......................................... 188 Combining Statement of Cash Flows ........................................................................................................... 190 Fiduciary Funds: Pension and Other Employee Benefit Trust Funds: Combining Statement of Fiduciary Net Position ........................................................................................... 194 Combining Statement of Changes in Fiduciary Net Position ........................................................................ 196
Investment Trust Funds: Combining Statement of Fiduciary Net Position ........................................................................................... 200 Combining Statement of Changes in Fiduciary Net Position ........................................................................ 202
Agency Funds: Combining Statement of Assets and Liabilities ........................................................................................... 207 Combining Statement of Changes in Assets and Liabilities .......................................................................... 208
Non-major Component Units: Combining Statement of Net Position ................................................................................................................. 212 Combining Statement of Activities ..................................................................................................................... 214 Non-major Universities – Affiliated Component Units: Combining Statement of Financial Position ........................................................................................................ 218 Combining Statement of Activities ..................................................................................................................... 220

STATE OF ARIZONA COMPREHENSIVE ANNUAL FINANCIAL REPORT
iii
TABLE OF CONTENTS (CONCLUDED)
STATISTICAL SECTION (Not Covered by the Independent Auditors' Report)
Financial Trends: Page Schedule 1 – Net Position by Component for the Last Ten Fiscal Years ................................................................... 226 Schedule 2 – Changes in Net Position for the Last Ten Fiscal Years ......................................................................... 228 Schedule 3 – Fund Balances, Governmental Funds for the Last Ten Fiscal Years ..................................................... 232 Schedule 4 – Changes in Fund Balances, Governmental Funds for the Last Ten Fiscal Years.................................... 234 Revenue Capacity: Schedule 5 – Net Taxable Sales by Classification for the Last Ten Fiscal Years ....................................................... 238 Schedule 6 – Sales Tax Revenue Payers by Classification, Current Year and Nine Years Ago .................................. 241 Schedule 7 – Personal Income by Industry for the Last Ten Calendar Years ............................................................. 242 Schedule 8 – Personal Income Tax Rates for the Last Ten Calendar Years ............................................................... 244 Schedule 9 – Personal Income Tax Filers and Liability by Income Level for the Taxable Years 2011 and 2004 ........ 244 Debt Capacity: Schedule 10 – Ratios of Outstanding Debt by Type for the Last Ten Fiscal Years ..................................................... 246 Schedule 11 – Legal Debt Margin Information, Arizona Transportation Board Highway Revenue Bonds for the Last Ten Fiscal Years ........................................................................................................... 248 Schedule 12 – Legal Debt Margin Information, Arizona State University, for the Last Nine Fiscal Years ................. 248 Schedule 13 – Legal Debt Margin Information, University of Arizona, for the Last Eight Fiscal Years .................... 249 Schedule 14 – Legal Debt Margin Information, Northern Arizona University, for the Last Eight Fiscal Years ........... 249 Schedule 15 – Pledged-Revenue Coverage, Arizona Transportation Board Highway Revenue Bonds for the Last Ten Fiscal Years ........................................................................................................... 250 Schedule 16 – Pledged-Revenue Coverage, Arizona Transportation Board Transportation Excise Tax Revenue Bonds for the Last Ten Fiscal Years .................................................................................. 250 Schedule 17 – Pledged-Revenue Coverage, School Facilities Board State School Improvement Revenue Bonds for the Last Ten Fiscal Years ........................................................................................................... 251 Schedule 18 – Pledged-Revenue Coverage, School Facilities Board State School Trust Revenue Bonds for the Last Ten Fiscal Years ........................................................................................................... 251 Schedule 19 – Pledged-Revenue Coverage, Lottery Revenue Bonds for the Last Four Fiscal Years .......................................................................................................... 252 Schedule 20 – Pledged-Revenue Coverage, Arizona State University Revenue Bonds for the Last Ten Fiscal Years ........................................................................................................... 252 Schedule 21 – Pledged-Revenue Coverage, University of Arizona Revenue Bonds for the Last Ten Fiscal Years ........................................................................................................... 253 Schedule 22 – Pledged-Revenue Coverage, Northern Arizona University Revenue Bonds for the Last Ten Fiscal Years ........................................................................................................... 253 Demographic and Economic Information: Schedule 23 – Demographic and Economic Statistics for the Last Ten Calendar Years ............................................. 255 Schedule 24 – Principal Employers, Current Year and Nine Years Ago .................................................................... 255 Operating Information: Schedule 25 – State Employees by Function for the Last Ten Fiscal Years ............................................................... 256 Schedule 26 – Operating Indicators by Function for the Last Ten Fiscal Years ......................................................... 258 Schedule 27 – Capital Asset Statistics by Function for the Last Ten Fiscal Years ..................................................... 260


INTRODUCTORY SECTION

INTRODUCTORY SECTION

- 1 -
Douglas A. Ducey
Governor
Kathy Peckardt Interim Director
ARIZONA DEPARTMENT OF ADMINISTRATION OFFICE OF THE DIRECTOR
100 NORTH FIFTEENTH AVENUE i SUITE 401 PHOENIX, ARIZONA 85007
(602) 542-1500
March 9, 2015
The Honorable Douglas A. Ducey, Governor of the State of Arizona; Members of the Legislature; Scott Bales, Chief Justice of the Supreme Court; and Citizens and Taxpayers of the State of Arizona Ladies and Gentlemen: It is our pleasure to transmit to you the Comprehensive Annual Financial Report (CAFR) of the State of Arizona for the fiscal year ended June 30, 2014. Responsibility for the accuracy of data, as well as the completeness and fairness of presentation, including all disclosures, rests with the State's management. The data presented in this report, to the best of our knowledge and belief, is accurate in all material respects and is reported in a manner which fairly presents the financial position and results of operations of the major and non-major funds of the State. All disclosures needed for the reader to gain a reasonable understanding of the State's financial activities have been included. U.S. generally accepted accounting principles (GAAP) require that management provides a narrative introduction, overview, and analysis to accompany the basic financial statements in the form of the Management's Discussion and Analysis (MD&A). This letter of transmittal is designed to complement the MD&A and should be read in conjunction with it. The State's MD&A can be found immediately following the Independent Auditors' Report. INTERNAL CONTROLS The State is responsible for establishing and maintaining an internal control structure designed to ensure that the assets of the State are protected from loss, theft, or misuse and to ensure that adequate accounting data is compiled to allow for the preparation of financial statements in conformity with U.S. GAAP. Internal accounting controls are designed to provide reasonable, but not absolute, assurance that these objectives are met. The concept of reasonable assurance recognizes that: (1) the cost of a control should not exceed the benefits likely to be derived and (2) the valuation of costs and benefits requires estimates and judgments by management. In the opinion of management, the State's internal controls are adequate to provide reasonable assurance that these objectives are met. INDEPENDENT AUDIT In compliance with State statute, an annual financial audit of the financial reporting entity of the State is completed each year by the State of Arizona, Office of the Auditor General in conjunction with other audit firms. Their audit was conducted in accordance with U.S. generally accepted auditing standards and the standards applicable to financial audits contained in Government Auditing Standards, issued by the Comptroller General of the United States. Their report on the basic financial statements has been included in the financial section of this report. In addition, A.R.S. § 41-1279.03 requires at least a biennial single audit by the Office of the Auditor General. The Single Audit will be issued as a separate report at a later date.

- 2 -
FINANCIAL REPORTING ENTITY OF THE STATE The accompanying CAFR includes all funds of the State (primary government), as well as its component units. Blended component units, although legally separate entities, are in substance part of a government's operations. Therefore, data from these units is combined with data of the primary government. Discretely presented component units are shown separately to emphasize that they are legally separate from the primary government and to differentiate their financial position and results of operations from those of the primary government. Discretely presented component units prepared in accordance with the Governmental Accounting Standards Board (GASB) are reported in a separate column in the government-wide financial statements. Discretely presented component units prepared in accordance with the Financial Accounting Standards Board are presented as separate financial statements immediately following the government-wide financial statements to emphasize that they are prepared in accordance with accounting standards other than those promulgated by the GASB. The criteria for inclusion in the financial reporting entity and presentation are defined by the Codification of Governmental Accounting and Financial Reporting Standards, issued by the GASB, (Section 2100). Note 1 of the Notes to the Financial Statements explains which component units are included in the financial reporting entity of the State. ARIZONA The State of Arizona was admitted to the Union as the 48th state in 1912. Arizona is the sixth largest state by area, with 113,909 square miles. Arizona is known for the Grand Canyon, one of the Seven Wonders of the World, and its cacti and other desert landscape. A number of national forests, four national parks, eighteen national monuments, and over 20 million acres of Native American reservations and tribal communities are located in Arizona. PROFILE OF THE GOVERNMENT The State has three branches of government: Executive, Legislative, and Judicial. The Executive branch is headed by a Governor elected for a four-year term. Arizona's Legislative branch is bicameral, consisting of a thirty-member Senate and a sixty-member House of Representatives. Legislators are elected for two-year terms. The Judicial branch consists of the Arizona Supreme Court, Court of Appeals (with two divisions), Superior Court, justice of the peace courts, and municipal courts. The Superior Court, justice of the peace courts, and municipal courts are excluded from the financial reporting entity of the State as these entities do not meet GASB criteria for inclusion. The Supreme Court is the highest court in the State and is comprised of five justices. Article 6, Section 5 of the Arizona State Constitution describes the types of cases and matters handled by the Supreme Court. The services provided by the State are administered through various agencies, departments, boards, commissions, councils, administrations, offices, and institutions of higher learning. These services include: (1) General Government, (2) Health and Welfare, (3) Inspection and Regulation, (4) Education, (5) Protection and Safety, (6) Transportation, and (7) Natural Resources. BUDGETARY CONTROLS Budgetary control is maintained through Legislative appropriation and the Executive branch allotment process. The Governor is required to submit an annual budget to the Legislature. The budget is legally required to be adopted through the passage of appropriation bills by the Legislature and approved by the Governor. The appropriated funds are controlled by the Executive branch through an allotment process. This process generally allocates the appropriation into quarterly allotments by legal appropriation level. The State also maintains an encumbrance accounting system to further enhance budgetary control. Encumbered amounts generally lapse as of the end of the fiscal year, with the exception of capital outlay and other continuing appropriations that continue from year to year. The State's budgetary policies are explained in detail in the Required Supplementary Information.

- 3 -
GENERAL FUND BALANCE Graph 1 summarizes the General Fund revenues and expenditures for the last five fiscal years. This graph does not include transfer amounts relating to other fund types and other financing sources (uses), which affect the ending fund balance. Graph 1
General Fund Revenues and Expenditures for last 5 fiscal years (Dollars in billions)
$19
$20
$21
$22
2010 2011 2012 2013 2014
Revenues Expenditures
The General Fund ended the June 30, 2014 fiscal year with a total fund balance of $24.6 million. This compares to the previous year’s total fund balance of $423.2 million.
Graph 2 summarizes the General Fund Balance (Deficit) for the last five fiscal years: Graph 2
General Fund Balance (Deficit) for last 5 fiscal years (Dollars in millions)
($800)($600)($400)($200)
$0$200$400$600
2010 2011 2012 2013 2014

- 4 -
ECONOMIC CONDITION AND OUTLOOK The following economic summary is based on the Forecast Report issued by the Office of Employment and Population Statistics (EPS) within the Arizona Department of Administration, for calendar years 2015-2016, released on February 26, 2015. Overview The overall employment situation in Arizona continues to improve. This is consistent with improvement seen in many economic indicators including population growth. Compared to 2013, population grew faster in 2014 at 1.31 percent based on the EPS’ internal preliminary numbers. Population is projected to grow at 1.65 percent in 2015 and 1.99 percent in 2016. Although Arizona economy continues to have some after effects of various policies that were enacted post-recession (sequestration cuts in 2011 and payroll tax increase in 2013), the major impacts of these policies are behind us and the federal government does not appear to be a strong drag on the economy. Compared to prior recessions, the weak employment recovery is in large part due to lack of new construction. However, the economic fundamentals continue to improve. Both, the U.S. and Arizona’s unemployment rate continue to decline. Two economic changes worth noting are the lower oil prices and the rising dollar. The U.S. and Arizona households are expected to receive the benefits of a higher disposable income resulting from lower oil prices. On the negative side, the rising dollar could hurt exports. On the positive side, it is expected to make imports cheaper and help control inflation. A higher dollar effectively transfers demand from the U.S. economy to economies around the world. Economies such as Japan, emerging Asia, and Europe could benefit with a boost to their exports. In the long run, this should lead to a healthier and more balanced global economy. Arizona’s nonfarm employment is forecast for modest growth in 2015 with mild acceleration in 2016. An over-the-year gain of 56,600 nonfarm jobs is expected in 2015 and 63,100 in 2016. In the current forecast, the rate of growth projected for total nonfarm employment is 2.2 percent in 2015 and 2.4 percent in 2016. A total of 119,700 nonfarm jobs are forecast to be gained over the two projected years (2015 and 2016). All eleven major sectors are expected to grow in 2015 and 2016. However, Arizona has historically seen stronger nonfarm employment growth rate than what has been observed in recent years. The following factors support Arizona’s economic growth:
i Continued improvement in real Gross Domestic Product, real personal income, employment, and retail sales at the state and national levels.
i Continued private sector employment gains, increasing private domestic investment, increases in the index of industrial production and rate of capacity utilization, high levels of corporate profit, and a gradual resurgence in private residential construction permits. In 2015, the increase in domestic investment spending is anticipated to begin reducing the amounts of accumulated corporate cash holdings.
i Household net worth and U.S. exports continue to increase. i Residential real estate market in Arizona and Phoenix metropolitan area has shown improvement. Home
prices have improved but are still way off peak. Increase in the construction of primarily apartments, office buildings, and limited single family homes have been observed. Commercial real estate is gradually improving with lower vacancy rates, higher rental rates and lower rates of default and delinquency in mortgage loans.
i Growth in non-revolving consumer credit levels have been serving as an impetus to expanding economic activity. Consumer sentiment and consumer spending have improved. Banks are gradually loosening up their lending requirements. Mortgage rates are low. Bank delinquency and default rates on consumer credit are declining.
Some factors that could further dampen the growth of the local economy are given below. However, the positive factors listed above outweigh the uncertainties in the sections described below in support of the EPS’ forecast:
i Despite some increase in disposable income from lower gas prices, constrained budgets persist for a large majority of households. Real median household income in the U.S. and Arizona is below the peak level prior to the 2007 recession.
i Population growth in the State (1.3 percent in 2014) has been below the growth rate observed historically, limiting the additional demand for goods and services. Arizona’s annualized population growth rate for the decade of 1980 was 3.0 percent. This rate increased to 3.4 percent for the decade of the 1990’s and then

- 5 -
decreased to 2.2 percent for the first decade of the 21st century. In-migration, both domestic and international to the State has declined over time.
i Although there has been some improvement in the residential real estate market, up to 20.0 percent of potential buyers are unable to enter the housing market because of negative or low home equity. Reduction in FHA loan limit, higher FICO score requirement, prior home foreclosure or short sales, and millennials living at home has further inhibited potential buyers from entering the housing market.
i Although real business investment continues to grow, the rate of growth has slowed as a consequence of demand uncertainty. However, the rate of growth of business investment is expected to increase in 2015 and 2016.
i In the public sector, cuts in the federal, state and local budgets would require spending cuts, tax increases, or a mixture of the two which could slow the growth in aggregate demand in the U.S. and Arizona economy, thus limiting employment growth.
i Arizona is vulnerable to federal government expenditure changes due to a larger share of military spending in the State’s economy. Real federal, civilian, and military expenditures continued to decline in 2014. Operating at a lower level of federal government expenditures is projected to impact some industry sectors more than others: Manufacturing; Retail Trade; Professional and Business Services; and Government.
In addition to the factors aforementioned, there are some grounds for limited optimism and concern on the international front:
i Although Arizona exports could have a slight stimulating effect with a gradual improvement in the overall world economy, a rising dollar could negatively hurt exports.
i China’s deceleration in growth could impact other regions. China's national economy grew an annual 7.4 percent in 2014, the slowest since 1990. It is unclear as to how China will extricate itself from its debt induced housing bubble and industrial capacity glut.
i The global economy continues to be in low gear, and hope that the tailwinds of lower oil prices and international monetary stimulus would provide a modest boost to growth this year.
Individual Sectors The Educational and Health Services sector is forecast to gain 13,800 jobs (3.5 percent) in 2015 and 16,100 jobs (4.0 percent) in 2016 for a total of 29,900 jobs over two years. Increases are expected in all subsectors of Health Care and Social Assistance with the largest projected employment increase in Ambulatory Health Care Services. With the Affordable Care Act (ACA) expansion, both Medicaid and Medicare enrollment has increased. Population growth coupled with state and federal spending associated with the ACA is likely to increase employment growth in these subsectors. Private Educational Services are expected to slow as the economy improves and people re-enter the workforce foregoing higher education and the accumulation of student debt. The Leisure and Hospitality sector is projected to gain 11,100 jobs (3.9 percent) in 2015 and 12,100 jobs (4.1 percent) in 2016 for a total of 23,200 jobs over two years. The largest projected job gain is expected in the Food Services and Drinking Places sub-sector. Fewer gains are forecast in the sub-sectors of Accommodations and Arts, Entertainment, and Recreation. An improving economy, tourism, and population increases are expected to bolster employment in the Leisure and Hospitality sector. The Trade, Transportation, and Utilities sector is forecast to gain 10,000 jobs (2.1 percent) in 2015 and 11,100 jobs (2.2 percent) in 2016 for a total of 21,100 jobs over two years. Retail Trade is expected to have the most employment gains with all subsectors forecasting gains. Fewer gains are forecast in Wholesale Trade, Transportation, Warehousing, and Utilities. Utilities is expected to remain flat over the two-year period and Transportation and Warehousing is forecast to gain jobs as a result of overall economic growth. The Professional and Business Services sector is projected to have an increase of 9,600 jobs (2.5 percent) in 2015 and 8,900 jobs (2.3 percent) in 2016 for a total of 18,500 jobs over two years. The Administrative and Waste Services sub-sectors are expected to have the largest job gains over the projection period which includes Employment Services, Business Support Services, and Services to Buildings and Dwellings. Employment Services growth is expected to slow over the two-year period as firms move away from lower-cost contingent labor to more stable hires with an improving economy. Job gains are forecast in the subsectors of Professional, Scientific, and Technical Services and Management of Companies and Enterprises.

- 6 -
The Financial Activities sector’s projected employment growth over the two-year period is expected to slow to an increase of 6,400 jobs (3.3 percent) in 2015 and 5,900 jobs (3.0 percent) in 2016 for a total of 12,400 jobs over two years. Gradual rise in interest rates and a slow growing Construction sector could hinder employment growth in this sector. Securities, Commodities Contracts, Investments, Credit Intermediation and Monetary Authorities, Real Estate, Rental, and Leasing, are forecast to gain jobs with the largest gains projected in Insurance, Funds, and Trusts. The Manufacturing sector is projected to have an employment increase of 1,600 jobs (1.1 percent) in 2015 and 2,900 jobs (1.8 percent) in 2016 for a total of 4,500 jobs over two years. Growth is forecast in both Durable Goods and Nondurable Goods. Gains in Durable Goods are expected from Fabricated Metal Products and other unreported sectors; Aerospace Products and Parts and Computer and Electronic Products are forecast to shed jobs. The U.S. production index has expanded for eleven consecutive months. New orders index also indicates forward momentum in the economy. However, with Arizona’s dependence on defense related industries, staffing levels for defense related manufacturing industries in Arizona are expected to decline due to reduced civilian and military funding. The Government sector is forecast to have a small gain of 1,300 jobs (0.3 percent) in 2015 and 1,500 jobs (0.4 percent) in 2016 for a total of 2,800 jobs over two years. All subsectors (Federal, State, and Local Government) are expected to have gains over the two-year period. All gains in State and Local Government are expected in Education related subsectors. The Construction sector is forecast to gain 600 jobs (0.5 percent) in 2015 and 2,200 jobs (1.8 percent) in 2016 for a total of 2,800 jobs over the two years. Heavy Construction is expected to have the largest employment gain. Specialty Trade is expected to increase but could be dampened until housing overall makes a meaningful recovery. Multi-family private residence construction has grown in the State. Home repair and maintenance activities and population growth are factors that support some growth in this sector. Building Construction is the only Construction sub-sector with projected job losses from 2014 to 2016. The Information sector is projected to have a gain in employment of 400 jobs in both 2015 (0.9 percent) and 2016 (1.0 percent) for a total of 800 jobs over two years. Job gains are forecast in the Telecommunications and Non-Telecommunications sub-sectors of Information. The Natural Resources and Mining sector is forecast to gain 200 jobs (1.3 percent) in 2015 and 200 jobs (1.8 percent) in 2016 for a total of 400 jobs over two years. The Other Services sector is forecast to gain 1,600 jobs (1.8 percent) in 2015 and 1,700 jobs (1.9 percent) in 2016 for a total of 3,300 jobs over two years. An improving economy with gradually rising levels of business and consumer spending is forecast to bolster the demand and employment for the services provided by this sector. MAJOR INITIATIVES The Major Initiatives for the year ended June 30, 2014, were as follows:
i The Legislature restored Medicaid eligibility for childless adults and expanded coverage to 133 percent of the federal poverty level in fiscal year 2014. The federal government provides between 85 percent and 100 percent of the cost of the Medicaid restoration, depending on the population, and the remaining cost is funded by an assessment on hospitals. The majority of the Medicaid expansion had been approved by voters in two previous ballot initiatives.
i Fiscal year 2014 saw approximately $67 million set aside for several statewide IT projects, including the second year of the four-year project to replace Arizona’s financial and accounting system, a new inmate database, a new statewide e-licensing platform, a new student learning and accountability system, and to update tax collection and reporting systems.
i Arizona State University received $24 million and Northern Arizona University $6 million to align their per pupil funding with that of the University of Arizona.
i Another notable investment in higher education was an increase of $8 million to University of Arizona Phoenix Medical School to complete the establishment of the 320-student medical school.
i The fiscal year 2014 budget also included $5 million to activate 500 medium-security private prison beds to address the State’s growing prison population.


* ELECTED OFFICIALS
ARIZONA STATE GOVERNMENT ORGANIZATION
ELECTORATE
LEGISLATIVEBRANCH
EXECUTIVEBRANCH
JUDICIALBRANCH
GOVERNOR*STATE SENATE*
STATE HOUSE OF
REPRESENTATIVES*
LEGISLATIVECOUNCIL
AUDITORGENERAL
STATE LIBRARY, ARCHIVES AND
PUBLIC RECORDS
JOINT LEGISLATIVE BUDGET COMM.
CORPORATION COMMISSION*
SUPERINTENDENT OF
PUBLIC INSTRUCTION*STATE
TREASURER*
SUPREME COURT
COURT OFAPPEALS
SUPERIORCOURTS
JUSTICE OFTHE PEACE COURTS*
MUNICIPALCOURTS
SECRETARY OF
STATE*
ATTORNEYGENERAL*
STATE MINE INSPECTOR*
NORTHERN ARIZONA UNIVERSITY
OTHER BOARDS, COMMISSIONS, AND
AGENCIES
BOARD OFREGENTS
ARIZONA STATE UNIVERSITY
UNIVERSITYOF
ARIZONA
DEPARTMENT OF
CORRECTIONS
DEPARTMENTOF
LAW
DEPARTMENT OF
EDUCATION
DEPARTMENT OF
ADMINISTRATION
DEPARTMENT OF
PUBLIC SAFETY
DEPARTMENT OF
REVENUE
AHCCCSDEPARTMENT OF
TRANSPORTATION
DEPARTMENTOF
ECONOMIC SECURITY
DEPARTMENT OF
HEALTH SERVICES
DEPARTMENT OF
CHILD SAFETY
- 9 -

- 10 -
STATE OF ARIZONA PRINCIPAL STATE OFFICIALS JUNE 30, 2014 ELECTED OFFICIALS – as of June 30, 2014
Janice K. Brewer, Governor John Huppenthal, Superintendent of Public Instruction Senator Andy Biggs, President of the Senate Bob Stump, Chairman – Corporation Commission Representative Andy Tobin, Speaker of the House Bob Burns, Commissioner – Corporation Commission Ken Bennett, Secretary of State Brenda Burns, Commissioner – Corporation Commission Tom Horne, Attorney General Gary Pierce, Commissioner – Corporation Commission Joe Hart, State Mine Inspector Susan Bitter Smith, Commissioner – Corporation Douglas A. Ducey, State Treasurer Commission
APPOINTED OFFICIALS – as of June 30, 2014
Executive Officials Judicial Officials Brian C. McNeil, Director – Department of Administration Rebecca White Berch, Chief Justice – Supreme Court Charles L. Ryan, Director – Department of Corrections Legislative Officials Clarence H. Carter, Director – Department of Economic Michael E. Braun, Executive Director – Legislative Council Security Richard Stavneak, Director – Joint Legislative Budget Charles Flanagan, Director – Department of Child Safety Committee David Raber, Director – Department of Revenue Debra K. Davenport, CPA, Auditor General – Office of the Robert Halliday, Director – Department of Public Safety Auditor General Will Humble, Director – Department of Health Services University Officials Tom Betlach, Director – Arizona Health Care Cost Dr. Michael M. Crow, President – Arizona State University Containment System Dr. John D. Haeger, President – Northern Arizona University John Halikowski, Director – Department of Transportation Dr. Ann W. Hart, President – University of Arizona
ELECTED OFFICIALS – as of March 9, 2015
Douglas A. Ducey, Governor Diane Douglas, Superintendent of Public Instruction Senator Andy Biggs, President of the Senate Susan Bitter Smith, Chairman – Corporation Commission Representative David M. Gowan Sr., Speaker of the House Tom Forese, Commissioner – Corporation Commission Michele Reagan, Secretary of State Doug Little, Commissioner – Corporation Commission Mark Brnovich, Attorney General Bob Stump, Commissioner – Corporation Commission Joe Hart, State Mine Inspector Bob Burns, Commissioner – Corporation Commission Jeff DeWit, State Treasurer
APPOINTED OFFICIALS – as of March 9, 2015
Executive Officials Judicial Officials Kathy Peckardt, Interim Director – Department of Scott Bales, Chief Justice – Supreme Court Administration Legislative Officials Charles L. Ryan, Director – Department of Corrections Michael E. Braun, Executive Director – Legislative Council Timothy Jeffries, Director – Department of Economic Richard Stavneak, Director – Joint Legislative Budget Security Committee Greg McKay, Director – Department of Child Safety Debra K. Davenport, CPA, Auditor General – Office of the David Raber, Director – Department of Revenue Auditor General Frank Milstead, Director – Department of Public Safety University Officials Cory Nelson, Interim Director – Department of Health Dr. Michael M. Crow, President – Arizona State University Services Tom Betlach, Director – Arizona Health Care Cost Dr. Rita Cheng, President – Northern Arizona University Containment System Dr. Ann W. Hart, President – University of Arizona John Halikowski, Director – Department of Transportation

FINANCIAL SECTION

FINANCIAL SECTION

INDEPENDENT AUDITORS’ REPORT

INDEPENDENT AUDITORS’ REPORT

2910 NORTH 44th STREET • SUITE 410 • PHOENIX, ARIZONA 85018 • (602) 553-0333 • FAX (602) 553-0051
Independent Auditors’ Report
The Honorable Doug Ducey, Governor State of Arizona The Honorable Andy Biggs, President Arizona State Senate The Honorable David Gowan, Speaker Arizona House of Representatives The Honorable Scott Bales, Chief Justice Arizona Supreme Court
Report on the Financial Statements We have audited the accompanying financial statements of the governmental activities, business-type activities, aggregate discretely presented component units, each major fund, and aggregate remaining fund information of the State of Arizona as of and for the year ended June 30, 2014, and the related notes to the financial statements, which collectively comprise the State’s basic financial statements as listed in the table of contents. Management’s Responsibility for the Financial Statements Management is responsible for the preparation and fair presentation of these financial statements in accordance with U.S. generally accepted accounting principles; this includes the design, implementation, and maintenance of internal control relevant to the preparation and fair presentation of financial statements that are free from material misstatement, whether due to fraud or error. Auditors’ Responsibility Our responsibility is to express opinions on these financial statements based on our audit. We did not audit the financial statements of certain departments, the State’s retirement plans, and the aggregate discretely presented component units, which account for the following percentages of the assets and deferred outflows of resources and revenues, additions, and other financing sources, as applicable, of the opinion units affected:
Opinion Unit/Department
Assets/Deferred Outflows of Resources
Revenues/Additions/ Other Financing
Sources
Government-wide Statements
Governmental activities:
Arizona Department of Transportation 63.34% 11.08%
Arizona Health Care Cost Containment System 3.45% 18.93%
Early Childhood Development and Health Board 1.21% 0.51%
Business-type activities:
Arizona Correctional Industries 0.23% 0.68%
Arizona Department of Transportation 1.05% 0.10%

Opinion Unit/Department
Assets/Deferred Outflows of Resources
Revenues/Additions/ Other Financing
Sources
Arizona Health Care Cost Containment System 0.09% 0.21%
Arizona State Lottery 0.92% 12.92%
Aggregate discretely presented component units 100.00% 100.00% Fund Statements Major Governmental Funds:
General Fund—Arizona Health Care Cost Containment System 33.65% 21.08%
Transportation and Aviation Planning, Highway Maintenance and Safety Fund—
Arizona Department of Transportation 100.00% 100.00%
Aggregate Remaining Fund Information:
Arizona Correctional Industries 0.03% 0.27% Arizona Department of Transportation 0.85% 2.52% Arizona Health Care Cost Containment System 0.11% 2.02% Arizona State Lottery 0.13% 5.07% Arizona State Retirement System 66.56% 55.40%
Corrections Officer Retirement Plan 3.16% 2.32%
Early Childhood Development and Health Board 0.75% 0.94%
Elected Officials’ Retirement Plan 0.67% 0.57%
Public Safety Personnel Retirement System 12.36% 9.40% Those statements were audited by other auditors whose reports have been furnished to us, and our opinions, insofar as they relate to the amounts included for those departments, retirement plans, and component units, are based solely on the reports of the other auditors. We conducted our audit in accordance with U.S. generally accepted auditing standards and the standards applicable to financial audits contained in Government Auditing Standards, issued by the Comptroller General of the United States. Those standards require that we plan and perform the audit to obtain reasonable assurance about whether the financial statements are free from material misstatement. The financial statements of the Arizona Power Authority, the University of Arizona Health Network and Subsidiaries, and the Universities—Affiliated Component Units, except for those of the ASU Preparatory Academy, Inc., which were reported as discretely presented component units, were not audited by the other auditors in accordance with Government Auditing Standards. An audit involves performing procedures to obtain audit evidence about the amounts and disclosures in the financial statements. The procedures selected depend on the auditors’ judgment, including the assessment of the risks of material misstatement of the financial statements, whether due to fraud or error. In making those risk assessments, the auditors consider internal control relevant to the State’s preparation and fair presentation of the financial statements in order to design audit procedures that are appropriate in the circumstances, but not for the purpose of expressing an opinion on the effectiveness of the State’s internal control. Accordingly, we express no such opinion. An audit also includes evaluating the appropriateness of accounting policies used and the reasonableness of significant accounting estimates made by management, as well as evaluating the overall presentation of the financial statements. We believe that the audit evidence we have obtained is sufficient and appropriate to provide a basis for our audit opinions. Opinions In our opinion, based on our audit and the reports of the other auditors, the financial statements referred to above present fairly, in all material respects, the respective financial position of the governmental activities, business-type activities, aggregate discretely presented component units, each major fund, and aggregate remaining fund information of the State of Arizona as of June 30, 2014, and the respective changes in financial position and, where applicable, cash flows thereof for the year then ended in accordance with U.S. generally accepted accounting principles.

Other Matters Required Supplementary Information U.S. generally accepted accounting principles require that the Management’s Discussion and Analysis on pages 21 through 33, the Budgetary Comparison Schedules on pages 131 through 144, the Infrastructure Assets information on pages 145 through 148, and Agent Benefit Plans’ Funding Progress on page 149 be presented to supplement the basic financial statements. Such information, although not a part of the basic financial statements, is required by the Governmental Accounting Standards Board who considers it to be an essential part of financial reporting for placing the basic financial statements in an appropriate operational, economic, or historical context. We and the other auditors have applied certain limited procedures to the required supplementary information in accordance with U.S. generally accepted auditing standards, which consisted of inquiries of management about the methods of preparing the information and comparing the information for consistency with management’s responses to our inquiries, the basic financial statements, and other knowledge we obtained during our audit of the basic financial statements. We do not express an opinion or provide any assurance on the information because the limited procedures do not provide us with sufficient evidence to express an opinion or provide any assurance. Supplementary and Other Information Our audit was conducted for the purpose of forming opinions on the financial statements that collectively comprise the State’s basic financial statements. The combining and individual fund statements and schedules and the introductory and statistical sections listed in the table of contents are presented for purposes of additional analysis and are not required parts of the basic financial statements. The combining and individual fund statements and schedules are the responsibility of management and were derived from and relate directly to the underlying accounting and other records used to prepare the basic financial statements. Such information has been subjected to the auditing procedures applied in the audit of the basic financial statements and certain additional procedures, including comparing and reconciling such information directly to the underlying accounting and other records used to prepare the basic financial statements or to the basic financial statements themselves, and other additional procedures in accordance with U.S. generally accepted auditing standards by us and the other auditors. In our opinion, based on our audit, the procedures performed as described above, and the reports of the other auditors, the combining and individual fund statements and schedules are fairly stated, in all material respects, in relation to the basic financial statements as a whole. The introductory and statistical sections have not been subjected to the auditing procedures applied in the audit of the basic financial statements, and accordingly, we do not express an opinion or provide any assurance on them.
Other Reporting Required by Government Auditing Standards
In accordance with Government Auditing Standards, we will issue our report on our consideration of the State’s internal control over financial reporting and on our tests of its compliance with certain provisions of laws, regulations, contracts, and grant agreements and other matters at a future date. The purpose of that report is to describe the scope of our testing of internal control over financial reporting and compliance and the results of that testing, and not to provide an opinion on internal control over financial reporting or on compliance. That report is an integral part of an audit performed in accordance with Government Auditing Standards in considering the State’s internal control over financial reporting and compliance.
Debbie Davenport Auditor General
March 9, 2015


MANAGEMENT’S DISCUSSION
AND ANALYSIS

MANAGEMENT’S DISCUSSION AND ANALYSIS

- 21 -
MANAGEMENT’S DISCUSSION AND ANALYSIS
The following is a discussion and analysis of the State of Arizona’s (the State’s) financial performance, providing an overview of the activities for the fiscal year ended June 30, 2014. Please read it in conjunction with the transmittal letter at the front of this report and with the State’s financial statements, which follow this section. The completeness and fairness of the following information is the responsibility of the State’s officials and management.
FINANCIAL HIGHLIGHTS Government-wide: i The assets and deferred outflows of resources of the State exceeded liabilities at the close of the fiscal year by
$25.7 billion (reported as net position). Of this amount, a deficit of $1.4 billion exists for unrestricted net position, $7.5 billion is restricted for specific purposes (restricted net position), and $19.6 billion is net investment in capital assets.
i The State’s total net position increased in fiscal year 2014 by $1.6 billion. Net position of governmental activities increased by $1.2 billion, while net position of the business-type activities increased by $361.0 million.
Fund Level: i As of the close of the fiscal year, the State’s governmental funds reported combined ending fund balances of $7.3
billion, an increase of $270.2 million from the beginning of the year. After accounting for non-spendable, restricted, and committed fund balances of $4.9 billion, $1.9 billion, and $814.3 million, respectively, the State’s unassigned fund balance had a deficit of $219.0 million, or (3%) of combined fund balances.
i As of the close of the fiscal year, unassigned fund balance for the General Fund had a deficit of $189.2 million, which is approximately (1%) of total General Fund expenditures.
i The Land Endowments Fund reported fund balance at fiscal year-end of $4.8 billion, an increase of $715.1 million during the year. The Land Endowments Fund is used to help finance public education within the State as required by the federal government and the State’s Constitution.
i The enterprise funds reported net position at fiscal year-end of $3.4 billion, an increase of $341.4 million during the year.
Long-term Debt: i The State’s total long-term primary government debt decreased during the fiscal year to $10.1 billion, a decrease of
$353.9 million or (3%). Changes during the year included the addition of revenue bonds, certificates of participation, and capital leases of $144.9 million, $305.8 million, and $115.8 million, respectively. Also, the State retired $281.1 million of revenue bonds and $504.1 million of certificates of participation. Included in the decrease in long-term primary government debt is a decrease in net issuance premiums of $64.2 million.
More detailed information regarding the government-wide financial statements, fund level financial statements, and long-term debt activity can be found beginning on page 38.
OVERVIEW OF THE FINANCIAL STATEMENTS
This discussion and analysis is an introduction to the State’s basic financial statements, which are comprised of three components: (1) government-wide financial statements, (2) fund financial statements, and (3) notes to the financial statements. Required Supplementary Information and other supplementary information are included in addition to the basic financial statements.
Government-wide Statements (Reporting the State as a Whole)
The government-wide financial statements provide a broad overview of the State of Arizona’s finances in a manner similar to private sector business. The financial statements report information about the State, as a whole, and about its activities that should help answer this question: Is the State, as a whole, better or worse off as a result of this year’s activities? These statements include all non-fiduciary assets, deferred outflows of resources, liabilities, and deferred inflows of resources using the accrual basis of accounting. The current year’s revenues and expenses are taken into account regardless of when cash is received or paid. The government-wide financial statements include the following:

- 22 -
The Statement of Net Position (pages 38-39) presents the State’s assets, deferred outflows of resources, liabilities, deferred inflows of resources, and net position. The total of assets and deferred outflows of resources, minus the total of liabilities and deferred inflows of resources, is reported as net position. Over time, increases and decreases in net position measure whether the State’s financial position is improving or deteriorating.
The Statement of Financial Position (page 40) presents the State’s Universities-affiliated component units’ assets and liabilities, with the difference between the two reported as net assets.
The Statements of Activities (pages 42-44) present information showing how the State’s net position/net assets changed during the most recent fiscal year. All changes in net position/net assets are reported as soon as the underlying events giving rise to the change occur, regardless of the timing of related cash flows. Therefore, revenues and expenses are reported in these statements for some items that will only result in cash flows in future fiscal periods (e.g., uncollected taxes and earned, but unused vacation leave).
Government-wide statements report three activities:
i Governmental Activities – Most of the State’s basic services are reported under this category. Taxes and intergovernmental revenues generally fund these services. The Legislature, the Judiciary, and the general operations of the Executive departments fall within the governmental activities.
i Business-type Activities – The State charges fees to customers to help it cover all or most of the cost of certain services it provides. The Industrial Commission Special Fund and the State’s three universities are examples of business-type activities.
i Discretely Presented Component Units – Component units are legally separate entities for which the State is considered to be financially accountable, or organizations that raise and hold economic resources for the direct benefit of the State. The Water Infrastructure Finance Authority, the University of Arizona Health Network and Subsidiaries, the Arizona Power Authority, the Rio Nuevo Multipurpose Facilities District, the Greater Arizona Development Authority, and the Arizona Commerce Authority are discretely presented component units reported by the State. The State has included component units affiliated with the Universities whose financial statements are prepared in conformity with U.S. generally accepted accounting principles (U.S. GAAP), as adopted by the Financial Accounting Standards Board. These organizations include the Arizona State University Foundation, the University of Arizona Foundation, the Arizona Capital Facilities Finance Corporation, and other non-major component units affiliated with the Universities. Financial statements for these organizations are presented immediately following the government-wide statements to emphasize that they are prepared in accordance with accounting standards other than those promulgated by the Governmental Accounting Standards Board (GASB), and include a statement of financial position (page 40) and a statement of activities (page 44). See pages 65-69 and 118-128 for more information on discretely presented component units.
Fund Financial Statements (Reporting the State’s Major Funds)
The fund financial statements begin on page 45 and provide detailed information about the major individual funds. A fund is a fiscal and accounting entity with a self-balancing set of accounts that the State uses to keep track of specific sources of funding and spending for a particular purpose. In addition to the major funds, page 154 begins the individual fund data for the non-major funds. The State’s funds are divided into three categories – governmental, proprietary, and fiduciary – each category uses different accounting approaches.
i Governmental funds – Most of the State’s basic services are reported in the governmental funds, which focus on how money flows into and out of those funds and the balances left at year end that are available for future spending. The governmental fund financial statements provide a detailed short-term view of the State’s general government operations and the basic services it provides. Governmental fund information helps determine whether there are more or fewer financial resources that can be spent in the near future to finance the State’s programs. These funds are reported using modified accrual accounting, which measures cash and all other financial assets that can readily be converted to cash. Governmental funds include the general, special revenue, capital projects, debt service, and permanent funds. Because the focus of governmental funds is narrower than that of the government-wide financial statements, it is useful to compare the information presented for governmental funds with similar information

- 23 -
presented for governmental activities in the government-wide financial statements. By doing so, readers may better understand the long-term impact of the government’s near-term financing decisions. This report includes two schedules (pages 46 and 48-49) that reconcile the amounts reported on the governmental fund financial statements (modified accrual accounting) with governmental activities (accrual accounting) reported on the appropriate government-wide statement.
Governmental fund financial statements can be found on pages 45 and 47 of this report.
i Proprietary funds – When the State charges customers for the services it provides, whether to outside customers or to other agencies within the State, these services are generally reported in proprietary funds. Proprietary funds (enterprise and internal service) utilize accrual accounting; the same method used by private sector businesses. Enterprise funds report activities that provide supplies and services to the general public – such as the Industrial Commission Special Fund and Universities. Internal service funds report activities that provide supplies and services for the State’s other programs and activities – such as the State’s Risk Management Fund. Internal service fund operations primarily benefit governmental funds and are reported as governmental activities on the government-wide statements. The reconciliation between the government-wide financial statements for business-type activities and the proprietary fund financial statements is presented at the end of the propriety fund financial statements on pages 51-52.
Proprietary fund financial statements can be found on pages 50-55 of this report.
i Fiduciary funds – The State acts as a trustee or fiduciary for its employee pension plans. It is also responsible for other assets that, because of a trust arrangement, can be used only for the trust beneficiaries. The State’s fiduciary activities are reported in separate Statements of Fiduciary Net Position and Changes in Fiduciary Net Position beginning on page 56. These funds are reported using accrual accounting and include pension and other employee benefit trust, investment trust, and agency funds. The government-wide statements exclude fiduciary fund activities and balances because these assets are restricted in purpose and do not represent discretionary assets of the State to finance its operations.
Fiduciary fund financial statements can be found on pages 56-57 of this report.
Notes to the Financial Statements
The Notes to the Financial Statements provide additional information that is essential to a full understanding of the data provided in the government-wide and fund financial statements.
The notes can be found beginning on page 65 of this report.
Required Supplementary Information
Following the basic financial statements is additional Required Supplementary Information that further explains and supports the information in the financial statements. The Required Supplementary Information includes budgetary expenditure comparison schedules for the General Fund and each major special revenue fund and a reconciliation of the schedules of statutory and U.S. GAAP expenditures for the fiscal year. This section also includes schedules of condition and maintenance data regarding certain portions of the State’s infrastructure and agent benefit plans’ funding progress schedules.
Required supplementary information begins on page 131 of this report.
Other Supplementary Information
Other supplementary information includes combining financial statements for non-major governmental, non-major enterprise, all internal service funds, all fiduciary funds, non-major component units, and non-major universities – affiliated component units. These funds are added together, by fund type, and presented in single columns in the basic financial statements, but are not reported individually, as are major funds on the governmental funds and proprietary

- 24 -
funds financial statements. Budgetary expenditure comparison schedules for the non-major special revenue funds and the land endowment funds are also included.
Other supplementary information begins on page 154 of this report.
GOVERNMENT-WIDE FINANCIAL ANALYSIS
The State’s overall financial position and operations for the past year for the primary government are summarized, as follows, based on the information included in the government-wide financial statements.
State of Arizona-Primary Government Net Position as of June 30, 2014 and 2013
(expressed in thousands) Governmental Activities Business-type Activities Primary Government Total
2014 2013 2014 2013, as
restated 2014 2013, as restated
Current assets $ 5,746,818 $ 6,450,486 $ 1,317,866 $ 1,358,352 $ 7,064,684 $ 7,808,838 Capital assets 21,624,109 20,993,786 4,493,718 4,327,392 26,117,827 25,321,178 Other non-current assets 6,339,643 5,699,132 2,005,169 1,771,658 8,344,812 7,470,790 Total Assets 33,710,570 33,143,404 7,816,753 7,457,402 41,527,323 40,600,806 Deferred outflows of
resources 26,361 * 19,945 51,779 58,361 78,140 78,306 Current liabilities 4,598,785 * 4,846,629 694,889 756,253 5,293,674 5,602,882 Non-current liabilities 6,944,022 * 7,318,023 3,704,494 3,651,370 10,648,516 10,969,393 Total Liabilities 11,542,807 12,164,652 4,399,383 4,407,623 15,942,190 16,572,275 Net position: Net investment in capital assets 18,027,844 17,410,055 1,581,436 1,524,964 19,609,280 18,935,019 Restricted 6,829,299 6,116,083 660,480 531,972 7,489,779 6,648,055 Unrestricted (2,663,019) (2,527,441) 1,227,233 1,051,204 (1,435,786) (1,476,237) Total Net Position $ 22,194,124 $ 20,998,697 $ 3,469,149 $ 3,108,140 $ 25,663,273 $ 24,106,837
* The fiscal year 2013 amounts have been reclassified for comparison with fiscal year 2014 amounts due to the implementation of GASB Statement No. 65.
For the year ended June 30, 2014, the State’s combined net position totaled $25.7 billion, reflecting an increase of $1.6 billion during the current fiscal year. The largest portion of the State’s net position (77%) represents net investment in capital assets of $19.6 billion. Additions to roads and bridges provided the majority of the governmental activities increase in net investment in capital assets of $617.8 million. The State uses these capital assets to provide services to citizens; consequently, these assets are not available for future spending. Although the State’s investment in its capital assets is reported net of accumulated depreciation and related debt, it should be noted that the resources needed to repay this debt are planned to be provided from other sources, since the capital assets themselves are not typically used to liquidate these liabilities.
The State’s net position also included $7.5 billion (29%) of resources that are subject to external restrictions on how they may be used. The governmental activities increase in restricted net position of $713.2 million is primarily the result of an increase of $723.4 million in the amount restricted by the State’s Constitution for basic education funded by the Land Endowments Fund.
After accounting for the above net position restrictions, the State has a remaining deficit of $1.4 billion (6%) reported as unrestricted net position.
More detailed information regarding beginning net position restatements is on page 112.

- 25 -
State of Arizona-Primary Government
Changes in Net Position for Fiscal Years June 30, 2014 and 2013 (expressed in thousands)
Governmental Activities Business-type Activities Primary Government Total
2014
2013 2014
2013, as restated
2014 2013, as restated
Revenues: Program revenues: Charges for services $ 936,923 $ 850,869 $ 3,381,353 $ 3,181,812 $ 4,318,276 $ 4,032,681 Operating grants and contributions 12,172,836 11,588,834 1,343,922 1,570,854 13,516,758 13,159,688 Capital grants and contributions 546,680 651,999 41,250 15,210 587,930 667,209 General revenues: Sales taxes 5,948,055 6,518,480 63,669 57,490 6,011,724 6,575,970 Income taxes 3,963,197 3,974,998 - - 3,963,197 3,974,998 Tobacco taxes 314,313 316,050 - - 314,313 316,050 Property taxes 41,215 27,429 - - 41,215 27,429 Motor vehicle and fuel taxes 1,650,579 1,592,911 - - 1,650,579 1,592,911 Other taxes 547,481 531,186 - - 547,481 531,186 Unrestricted investment earnings 79,215 18,705 108,296 62,017 187,511 80,722 Unrestricted grants and contributions 37,926 45,746 107 5 38,033 45,751 Gain on sale of trust land 83,695 174,095 - - 83,695 174,095 Miscellaneous revenue 176,035 144,403 78,837 148,743 254,872 293,146 Total Revenues 26,498,150 26,435,705 5,017,434 5,036,131 31,515,584 31,471,836 Expenses: General government 763,830 836,431 - - 763,830 836,431 Health and welfare 12,768,332 12,168,426 - - 12,768,332 12,168,426 Inspection and regulation 160,797 161,480 - - 160,797 161,480 Education 5,573,656 5,372,267 - - 5,573,656 5,372,267 Protection and safety 1,408,049 1,400,413 - - 1,408,049 1,400,413 Transportation 791,006 754,510 - - 791,006 754,510 Natural resources 200,868 204,179 - - 200,868 204,179 Intergovernmental revenue sharing 2,778,299 2,685,378 - - 2,778,299 2,685,378 Interest on long-term debt 279,525 355,975 - - 279,525 355,975 Universities - - 4,078,053 3,888,145 4,078,053 3,888,145 Industrial Commission Special Fund - - 36,895 38,614 36,895 38,614 Other business-type activities - - 1,130,299 1,329,816 1,130,299 1,329,816 Total Expenses 24,724,362 23,939,059 5,245,247 5,256,575 29,969,609 29,195,634
Excess (deficiency) before contributions, extraordinary item, and transfers
1,773,788 2,496,646 (227,813) (220,444) 1,545,975 2,276,202
Contributions to permanent endowments - - 6,561 3,192 6,561 3,192 Extraordinary item: Insurance recovery - - 3,900 - 3,900 - Transfers (578,361) (534,722) 578,361 534,722 - - Change in Net Position 1,195,427 1,961,924 361,009 317,470 1,556,436 2,279,394 Net Position - Beginning, as restated 20,998,697 19,036,773 3,108,140 2,790,670 24,106,837 21,827,443 Net Position - Ending $ 22,194,124 $ 20,998,697 $ 3,469,149 $ 3,108,140 $ 25,663,273 $ 24,106,837

- 26 -
Change in Net Position Governmental Activities – Net Position increased by $1.2 billion from fiscal year 2013, or a 6% increase from fiscal year 2013. Although net position increased, the amount of the increase was not as large as the prior fiscal year increase of $2.0 billion. Reported sales tax revenues decreased by $570.4 million, or 9%, from fiscal year 2013. The decrease in sales tax collections reflects the expiration of the 1% additional sales tax in May 2013. This decrease was partially offset by an increase in net taxable sales of approximately 6% from fiscal year 2013. The largest increases in net taxable sales during fiscal year 2014 were in retail sales, restaurants and bars, and contracting. During fiscal year 2014, operating grants and contributions increased by $584.0 million (5%) over fiscal year 2013. This increase primarily results from enhanced federal financial participation matching rates for increased enrollment in Arizona Health Care Cost Containment System (AHCCCS) programs due to implementation of the Patient Protection and Affordable Care Act of 2010 (ACA) beginning January 1, 2014. AHCCCS experienced an increase of 190,040 members (14.4%) over fiscal year 2013 as a result of ACA expansion and the simultaneous ending of the Childless Adult program enrollment freeze beginning January 1, 2014. Operating grants and contributions also increased because the fair market value of the Permanent Fund investment portfolio increased during fiscal year 2014. Furthermore, there were increases in health and welfare and education expenses of $599.9 million and $201.4 million, respectively. The increase in health and welfare expenses resulted primarily from the implementation of the ACA by AHCCCS, as discussed above. The increase in education expense generally reflects increases in Department of Education’s expenses due to increased enrollment growth and inflation. A comparison of the net cost (income) of services by function for the State’s governmental activities is shown below for fiscal years 2013 and 2014. Net cost (income) is the total cost less revenues generated by the activities and shows the financial burden placed upon the State’s taxpayers by each of these functions.
Governmental Activities (expressed in thousands)
Total Cost of Services Net Cost (Income) of Services 2014 2013 2014 2013
Functions/Programs: General government $ 763,830 $ 836,431 $ 482,170 $ 510,822 Health and welfare 12,768,332 12,168,426 2,640,807 2,623,946 Inspection and regulation 160,797 161,480 (17,184) (14,964) Education 5,573,656 5,372,267 3,723,347 3,602,369 Protection and safety 1,408,049 1,400,413 1,121,604 1,174,681 Transportation 791,006 754,510 (26,646) (185,586) Natural resources 200,868 204,179 86,001 94,736 Intergovernmental revenue sharing 2,778,299 2,685,378 2,778,299 2,685,378 Interest on long-term debt 279,525 355,975 279,525 355,975 Total Governmental Activities $ 24,724,362 $ 23,939,059 $ 11,067,923 $ 10,847,357

- 27 -
Business-type Activities – Net Position increased by $361.0 million from fiscal year 2013, or 12%. This increase is primarily due to increases in net position for the Universities and the Unemployment Compensation Fund of $186.7 million and $90.3 million, respectively. Non-operating revenues and transfers from the General Fund more than offset the Universities’ operating loss of $1.2 billion. The Universities’ operating revenues increased by $118.9 million over
$0
$1,000
$2,000
$3,000
$4,000
$5,000
$6,000
$7,000
$8,000
$9,000
$10,000
$11,000
$12,000
$13,000
Expenses and Program Revenues Governmental Activities for Fiscal Year 2014
(in millions of dollars)
Expenses
Revenues

- 28 -
fiscal year 2013 primarily due to approved student tuition and fee increases, increased enrollment, and increased auxiliary enterprise revenues. Also, State appropriation transfers to the Universities from the General Fund increased by $38.1 million over fiscal year 2013. This increase resulted primarily from increased parity funding to the Arizona State University and additional appropriations for expansion of the University of Arizona College of Medicine-Phoenix Campus. These increases were offset by increases in expenses for instruction, academic support, and scholarships and fellowships. Also, the Unemployment Compensation Fund’s cost of sales and benefits and intergovernmental revenue decreased $220.2 million and $185.7 million, respectively, as compared to the prior fiscal year. A comparison of the net cost (income) of services by function for the State’s business-type activities is shown below for fiscal years 2013 and 2014. Net cost (income) is the total cost less revenues generated by the activities and shows the financial burden placed upon the State’s taxpayers by each of these functions.
Business-type Activities (expressed in thousands)
Total Cost of Services Net Cost (Income) of Services
2014 2013, as restated 2014
2013, as restated
Functions/Programs: Universities $ 4,078,053 $ 3,888,145 $ 722,356 $ 679,497 Industrial Commission Special Fund 36,895 38,614 8,434 13,453 Other 1,130,299 1,329,816 (252,068) (204,251) Total Business-type Activities $ 5,245,247 $ 5,256,575 $ 478,722 $ 488,699
FINANCIAL ANALYSIS OF THE STATE’S FUNDS
The State uses fund accounting to ensure and demonstrate compliance with finance-related legal requirements.
Governmental funds – The general government functions are contained in the general, special revenue, debt service, capital projects, and permanent funds. The focus of the State’s governmental funds is to provide information on near-term inflows, outflows, and balances of spendable resources. Such information is useful in assessing the State’s financing requirements. In particular, unassigned fund balance may serve as a useful measure of a government’s net resources available for spending at the end of the fiscal year.
General Fund
The General Fund is the chief operating fund of the State. At June 30, 2014, unassigned fund balance of the General Fund had a deficit of $189.2 million, while total fund balance closed the year at $24.6 million. As a measure of the General Fund’s liquidity, it may be useful to compare both unassigned fund balance and total fund balance to total fund expenditures and other financing uses. Unassigned fund balance represents a negative 1% of total expenditures and other financing uses, while total fund balance is less than 1% of the same amount.
The fund balance of the State’s General Fund decreased $398.6 million during the fiscal year. Revenues exceeded expenditures by $51.9 million, before other financing sources and uses. However, other financing sources and uses more than offset this excess by $450.5 million which consist primarily of transfers to the Universities in support of higher education, offset by legislative transfers from other funds to the General Fund. Overall revenues decreased by $339.9 million (2%) and expenditures increased by $737.8 million (4%) from fiscal year 2013. Primary reasons for decreases in fund balance during the fiscal year are the expiration of the 1% additional sales tax in May 2013, increased health and welfare expenditures, and increased education expenditures. A primary reason for increases in fund balance during the year is increased intergovernmental revenue, including federal funding received as a result of the AHCCCS implementation of the ACA. These increases and decreases were discussed in the government-wide financial analysis beginning on page 24.

- 29 -
Transportation and Aviation Planning, Highway Maintenance and Safety Fund
The Transportation and Aviation Planning, Highway Maintenance and Safety Fund is responsible for the repair and maintenance of existing roads, paying the debt service for roads that are built from the issuance of revenue bonds and grant anticipation notes, and providing technical assistance with road construction provided by contractors hired by the Arizona Department of Transportation (ADOT). Total fund balance increased $95.2 million during fiscal year 2014. Although revenues exceeded expenditures by $354.0 million, transfers to non-major governmental funds of $303.0 million to primarily pay debt service largely offset this excess. Overall revenue remained stable, as compared to the prior fiscal year.
Land Endowments Fund
The Land Endowments Fund was established when the federal government granted Arizona statehood. Both the State’s Constitution and the federal government require that the land grants given to the State be maintained indefinitely, and the earnings from the land grants should be used for public education, primarily K-12. The Land Endowments Fund total fund balance increased $715.1 million during fiscal year 2014. Endowment investments increased $744.5 million, at fiscal year-end, primarily due to receipts from land sales of $86.3 million and a net increase in the fair value of investments of $598.6 million.
Proprietary funds
The business-type activities discussion for the fund level financial statements of the State’s enterprise funds provide the same type of information found in the government-wide financial analysis beginning on page 24.
GENERAL FUND BUDGETARY HIGHLIGHTS
During the fiscal year, the original budget was amended by various supplemental appropriations and appropriation revisions. Differences between the original budget and the final amended budget resulted in a $1.6 billion net increase in appropriations for the General Fund, before adjustments. Some of the significant changes in the General Fund appropriations were:
1. $311.3 million increase due to prior fiscal year obligations that were paid in the current fiscal year per A.R.S. § 35-191.
2. $727.0 million increase to the AHCCCS’ original budget is primarily due to supplemental appropriation increases for payments to specified hospitals funded by voluntary intergovernmental agreements with political subdivisions and to fund payments for the Medicaid restoration and ACA expansion populations.
3. $234.0 million increase to the Universities’ original budget is primarily due to payment deferrals from fiscal year 2013, which were budgeted in fiscal year 2014, and for lease purchase capital financing for research infrastructure facilities.
4. $169.4 million increase to the Department of Health Services’ original budget is primarily due a supplemental appropriation increase for Title XIX.
5. $47.5 million increase to the Department of Education’s original budget is primarily due to a supplemental appropriation increase for basic State aid entitlement.
6. $46.0 million increase to the Department of Economic Security’s original budget is primarily due to payment deferrals from fiscal year 2013, which were appropriated as a supplemental appropriation in the fiscal year 2014 budget.
The actual expenditures were less than the final budget by $1.2 billion, after adjustments. Of this amount, $65.8 million will continue as legislative multiple fiscal year spending authority for fiscal years 2015 and beyond, depending upon the budgetary guidelines of the Legislature. The remaining $1.1 billion represents the unused portion of the State’s legislatively authorized annual operating budget.
Additional budgetary information can be found on pages 131-144 of this report.

- 30 -
CAPITAL ASSETS AND DEBT ADMINISTRATION
Capital assets:
The State’s investment in capital assets for its governmental and business-type activities as of June 30, 2014 totaled $26.1 billion, net of accumulated depreciation. The total primary government increase in capital assets for the current period was 3%, with a 3% increase in capital assets used for governmental activities and a 4% increase for business-type activities. Depreciation charges of the governmental and business-type activities for the fiscal year totaled $392.1 million.
Major capital asset activity during the current fiscal year included the following:
i The Universities’ additions to capital assets totaled $487.6 million and included increased investments in buildings for instruction and research, building renewal, and other capital projects.
i The ADOT started or completed roads and bridges totaling $1.4 billion during the fiscal year.
For the government-wide financial statement presentation, all depreciable assets were depreciated from the acquisition date to the end of the current fiscal year. Capital asset purchases of the governmental funds are reported in the fund- level financial statements as expenditures.
Capital assets for the governmental and business-type activities as of June 30, 2014 are presented below (expressed in thousands):
Governmental Activities Business-type Activities Total
2014 2013 2014 2013, as restated 2014
2013, as restated
Land $ 3,046,110 $ 2,967,822 $ 229,637 $ 210,037 $ 3,275,747 $ 3,177,859 Buildings 2,315,821 2,161,715 5,321,874 5,027,319 7,637,695 7,189,034 Improvements other than
buildings 172,687 159,899 5,727 4,853 178,414 164,752 Equipment 826,478 811,035 1,553,841 1,505,988 2,380,319 2,317,023 Software and other intangibles 251,407 * 219,616 125,957 120,736 377,364 340,352 Collections (non-depreciable) - - 20,114 19,738 20,114 19,738 Infrastructure 13,801,205 12,973,088 478,015 460,711 14,279,220 13,433,799 Construction in progress 2,916,383 3,369,060 299,160 288,755 3,215,543 3,657,815 Development in progress 58,567 * 27,155 - - 58,567 27,155 Less: accumulated depreciation (1,764,549) (1,695,604) (3,540,607) (3,310,745) (5,305,156) (5,006,349) Total $ 21,624,109 $ 20,993,786 $ 4,493,718 $ 4,327,392 $ 26,117,827 $ 25,321,178 * The fiscal year 2013 amounts have been reclassified for comparison with fiscal year 2014 amounts.
As provided by GASB Statement No. 34, the State has elected to record its infrastructure assets, which the ADOT is responsible for maintaining, using the modified approach as described in Note 1G. Assets accounted for under the modified approach include 6,800 center lane miles of roads (21,390 travel lane miles) and 4,787 bridges.
The State manages its roads using the Present Serviceability Rating (PSR), which measures the condition of the pavement and its ability to serve the traveling public. The PSR uses a five-point scale (5 excellent, 0 impassable) to characterize the condition of the roadway. The State’s serviceability rating goal is 3.23 for the overall system. The most recent assessment indicated that an overall rating of 3.69 was achieved for fiscal year 2014.
The State manages its bridges using the Arizona Bridge Information and Storage System. The State determines the condition rating based on standards developed by the Federal Highway Administration and additional internal criteria. It is the policy of the State to maintain a Condition Rating Index (CRI) of 92.5% or better. In fiscal year 2014, a CRI of 93.8% was achieved.

- 31 -
In addition to many smaller projects, each of the following major highway construction projects in excess of $10.0 million were started during fiscal year 2014 (expressed in thousands): Contract Contract Current Year
Description Start Date Amount Expenditures Capacity additions-major widening at US 93 at Antelope Wash 12/8/2013 $ 19,395 $ 4,562 Capacity additions-major widening on Interstate 10 at Perryville Road traffic interchange 11/8/2013 18,798 13,002 System preservation-reconstruction at US 89 and State Route 64, Little Colorado River 10/11/2013 36,669 7,103 System preservation-reconstruction at Deep Well Ranch Road at South Chino Valley limits 2/14/2014 17,358 3,529 System preservation-restoration/rehab/resurface at Rattlesnake Wash at Junction 93 4/11/2014 11,249 1,113 Capacity additions-reconstruction on State Route 101L at Maryland Avenue HOV ramps 9/13/2013 11,725 11,697 Capacity additions (major bridge rehabilitation) on Interstate 15 Virgin River Bridge, structure #1619 1/17/2014 27,183 7,463
Furthermore, the following major highway construction projects had expenditures in excess of $15.0 million in fiscal year 2014. These project expenditures include payments made to construction contractors (as shown below) as well as utility, design, right-of-way, and landscaping costs (expressed in thousands): Contract Project
Location Description Start Date Expenditures State Route 202L; Santan to Ellsworth Road in Maricopa County 2/17/2012 $ 65,400 Traffic Interchange between Interstate 10 and State Route 303L in Maricopa County 9/16/2011 47,281 State Route 303L; Camelback Road to Glendale Avenue in Maricopa County 2/8/2013 30,917 Salt River to Baseline Road in Maricopa County NA 23,528 Ruthrauff to Prince Road in Pima County 7/15/2011 22,578 Interstate 10; Sarival to State Route 101L in Maricopa County 12/24/2007 18,900 US 89 to State Route 98 in Coconino County 5/9/2013 18,371 Interstate 10; Perryville Road traffic interchange in Maricopa County 11/8/2013 15,384
More detailed information regarding capital assets is on pages 92 and 93.
Long-term debt:
The State issues no general obligation debt instruments. The Arizona Constitution, under Article 9, Section 5, provides that the State may contract debts not to exceed $350 thousand. This provision has been interpreted to restrict the State from pledging its credit as a sole payment for debts incurred for the operation of the State government. As a result, the State pledges either dedicated revenue streams or the constructed building or equipment acquired as security for the repayment of long-term debt instruments.
Major long-term debt activity during the current fiscal year included the following:
i The School Facilities Board issued certificates of participation totaling $305.7 million to refinance existing debt to obtain debt service savings by taking advantage of lower market interest rates.
i The Universities issued revenue bonds for $144.9 million to fund the acquisition, construction, or renovation of capital facilities and infrastructure, and to refinance existing debt to obtain debt service savings by taking advantage of lower market interest rates.
i The State entered into lease-purchase contracts totaling $115.8 million primarily to acquire the Department of Corrections’ Red Rock facility.
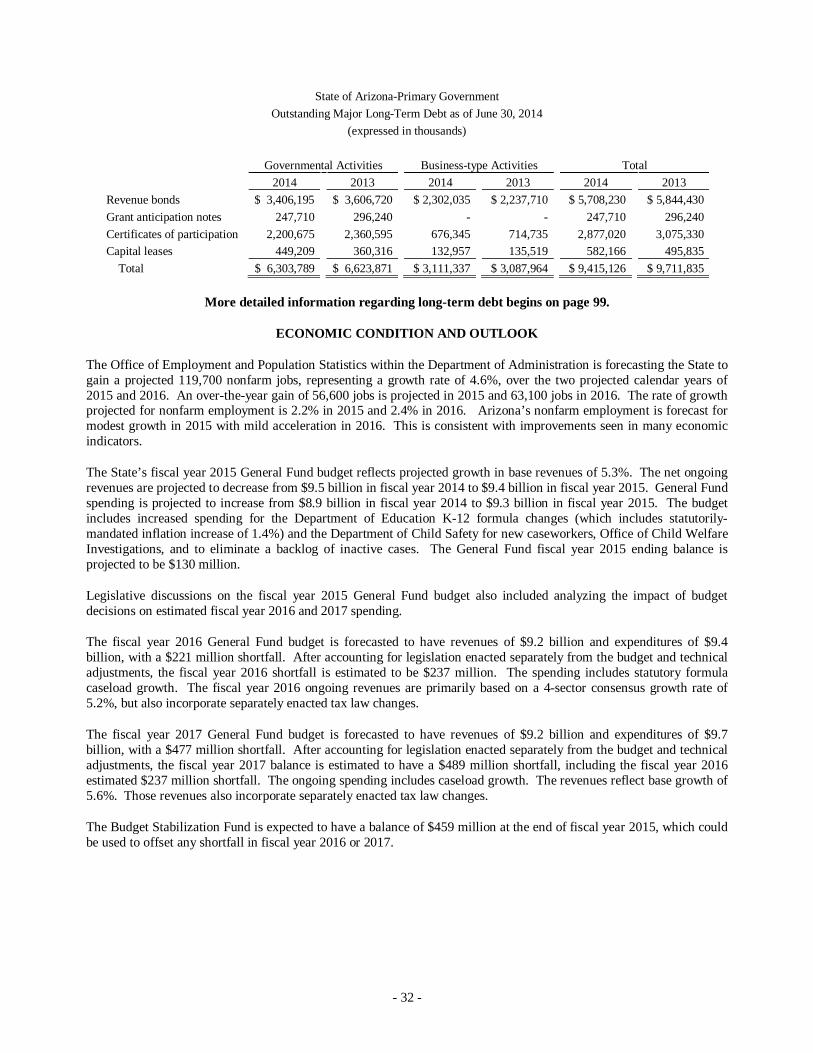
- 32 -
State of Arizona-Primary Government Outstanding Major Long-Term Debt as of June 30, 2014
(expressed in thousands)
Governmental Activities Business-type Activities Total 2014 2013 2014 2013 2014 2013
Revenue bonds $ 3,406,195 $ 3,606,720 $ 2,302,035 $ 2,237,710 $ 5,708,230 $ 5,844,430 Grant anticipation notes 247,710 296,240 - - 247,710 296,240 Certificates of participation 2,200,675 2,360,595 676,345 714,735 2,877,020 3,075,330 Capital leases 449,209 360,316 132,957 135,519 582,166 495,835 Total $ 6,303,789 $ 6,623,871 $ 3,111,337 $ 3,087,964 $ 9,415,126 $ 9,711,835
More detailed information regarding long-term debt begins on page 99.
ECONOMIC CONDITION AND OUTLOOK
The Office of Employment and Population Statistics within the Department of Administration is forecasting the State to gain a projected 119,700 nonfarm jobs, representing a growth rate of 4.6%, over the two projected calendar years of 2015 and 2016. An over-the-year gain of 56,600 jobs is projected in 2015 and 63,100 jobs in 2016. The rate of growth projected for nonfarm employment is 2.2% in 2015 and 2.4% in 2016. Arizona’s nonfarm employment is forecast for modest growth in 2015 with mild acceleration in 2016. This is consistent with improvements seen in many economic indicators.
The State’s fiscal year 2015 General Fund budget reflects projected growth in base revenues of 5.3%. The net ongoing revenues are projected to decrease from $9.5 billion in fiscal year 2014 to $9.4 billion in fiscal year 2015. General Fund spending is projected to increase from $8.9 billion in fiscal year 2014 to $9.3 billion in fiscal year 2015. The budget includes increased spending for the Department of Education K-12 formula changes (which includes statutorily-mandated inflation increase of 1.4%) and the Department of Child Safety for new caseworkers, Office of Child Welfare Investigations, and to eliminate a backlog of inactive cases. The General Fund fiscal year 2015 ending balance is projected to be $130 million.
Legislative discussions on the fiscal year 2015 General Fund budget also included analyzing the impact of budget decisions on estimated fiscal year 2016 and 2017 spending.
The fiscal year 2016 General Fund budget is forecasted to have revenues of $9.2 billion and expenditures of $9.4 billion, with a $221 million shortfall. After accounting for legislation enacted separately from the budget and technical adjustments, the fiscal year 2016 shortfall is estimated to be $237 million. The spending includes statutory formula caseload growth. The fiscal year 2016 ongoing revenues are primarily based on a 4-sector consensus growth rate of 5.2%, but also incorporate separately enacted tax law changes.
The fiscal year 2017 General Fund budget is forecasted to have revenues of $9.2 billion and expenditures of $9.7 billion, with a $477 million shortfall. After accounting for legislation enacted separately from the budget and technical adjustments, the fiscal year 2017 balance is estimated to have a $489 million shortfall, including the fiscal year 2016 estimated $237 million shortfall. The ongoing spending includes caseload growth. The revenues reflect base growth of 5.6%. Those revenues also incorporate separately enacted tax law changes.
The Budget Stabilization Fund is expected to have a balance of $459 million at the end of fiscal year 2015, which could be used to offset any shortfall in fiscal year 2016 or 2017.

- 33 -
CONTACTING THE STATE COMPTROLLER’S OFFICE
This financial report is designed to provide citizens, taxpayers, customers, investors, and creditors with a general overview of the State’s finances and to demonstrate the State’s accountability for the money it receives. If you have any questions about this report or need additional financial information, contact the Department of Administration, General Accounting Office, Financial Reporting Section at (602) 542-5405. You may also access and print this report at http://www.gao.az.gov/financials/.
The State’s component units issue their own separately issued audited financial statements. These statements may be obtained by directly contacting the component unit. Contact information regarding the component units begins on page 65.


BASIC FINANCIAL STATEMENTS

BASIC FINANCIAL STATEMENTS

(This page intentionally left blank)

STATE OF ARIZONASTATEMENT OF NET POSITION JUNE 30, 2014(Expressed in Thousands)
PRIMARY GOVERNMENT
GOVERNMENTAL BUSINESS-TYPE PRIMARY COMPONENTACTIVITIES ACTIVITIES GOVERNMENT UNITS
ASSETS Current Assets: Cash $ 3,261 $ 291,291 $ 294,552 $ 70,574 Cash with U.S. Treasury - 8,244 8,244 - Cash and pooled investments with State Treasurer 2,933,750 71,195 3,004,945 324,568 Restricted cash and pooled investments with State Treasurer 395,099 77,833 472,932 - Cash held by trustee - - - 11,533 Collateral investment pool 469,947 44,899 514,846 3,488 Short-term investments - 173,922 173,922 111,290 Restricted investments held by trustee - - - 28,017 Receivables, net of allowances: Taxes 423,888 96,088 519,976 2,672 Interest 214,718 2,419 217,137 8,561 Loans and notes 289,144 4,171 293,315 1,673 Patient accounts receivable - - - 161,330 Other 138,316 167,864 306,180 89,703 Internal balances (250,045) 250,045 - - Due from U.S. Government 815,022 86,935 901,957 - Due from local governments 150,564 - 150,564 - Due from others 132,680 - 132,680 - Inventories, at cost 24,830 22,144 46,974 21,171 Other current assets 5,644 20,816 26,460 2,394 Total Current Assets 5,746,818 1,317,866 7,064,684 836,974
Noncurrent Assets: Restricted assets: Cash 27 23,317 23,344 - Cash and pooled investments with State Treasurer 1,360,273 - 1,360,273 11,965 Cash held by trustee 27,151 254,390 281,541 17,342 Investments 3,274 - 3,274 153,342 Investments held by trustee - 81,360 81,360 35,881 Receivables, net of allowances: Loans and notes 36,808 33,071 69,879 1,117,445 Other - 10,411 10,411 7,512 Securities held in escheat 54,087 - 54,087 - Investments - 1,155,357 1,155,357 28,280 Endowment investments 4,858,023 429,865 5,287,888 - Other noncurrent assets - 17,398 17,398 2,852 Capital assets: Infrastructure, land, and other non-depreciable 19,799,389 548,911 20,348,300 39,167 Buildings, equipment, and other depreciable, net of accumulated depreciation 1,824,720 3,944,807 5,769,527 416,149 Total Noncurrent Assets 27,963,752 6,498,887 34,462,639 1,829,935
Total Assets 33,710,570 7,816,753 41,527,323 2,666,909
DEFERRED OUTFLOWS OF RESOURCES 26,361 51,779 78,140 59,699
The Notes to the Financial Statements are an integral part of this statement. (Continued)
TOTAL
- 38 -

STATE OF ARIZONASTATEMENT OF NET POSITION JUNE 30, 2014(Expressed in Thousands)
GOVERNMENTAL BUSINESS-TYPE PRIMARY COMPONENTACTIVITIES ACTIVITIES GOVERNMENT UNITS
LIABILITIES Current Liabilities: Accounts payable and other current liabilities $ 598,034 $ 149,621 $ 747,655 $ 109,782 Payable for securities purchased - 3,472 3,472 - Accrued liabilities 1,044,797 67,049 1,111,846 108,693 Obligations under securities loan agreements 469,947 44,899 514,846 3,488 Tax refunds payable 2,442 - 2,442 - Due to U.S. Government 7,482 13,025 20,507 - Due to local governments 1,249,019 - 1,249,019 - Due to others 387,999 72,345 460,344 - Due to component units - 260 260 - Unearned revenue 94,773 173,916 268,689 - Current portion of accrued insurance losses 59,786 25,501 85,287 9,710 Current portion of long-term debt 509,647 124,308 633,955 84,136 Current portion of other long-term liabilities 174,859 20,493 195,352 30,359 Total Current Liabilities 4,598,785 694,889 5,293,674 346,168
Noncurrent Liabilities: Unearned revenue 93,061 - 93,061 2,033 Accrued insurance losses 369,543 458,643 828,186 21,553 Funds held for others - 47,290 47,290 - Long-term debt 6,311,872 3,121,442 9,433,314 1,299,065 Derivative instrument - interest rate swap - 14,135 14,135 - Other long-term liabilities 169,546 62,984 232,530 4,255 Total Noncurrent Liabilities 6,944,022 3,704,494 10,648,516 1,326,906
Total Liabilities 11,542,807 4,399,383 15,942,190 1,673,074
NET POSITION Net investment in capital assets 18,027,844 1,581,436 19,609,280 106,715 Restricted for: General government 82,282 - 82,282 - Health and welfare 70,233 - 70,233 - Inspection and regulation 5,539 - 5,539 - Education 496,130 - 496,130 - Protection and safety 23,447 - 23,447 - Natural resources 12,706 - 12,706 - Unemployment Compensation - 57,585 57,585 - Capital projects 805,890 17,505 823,395 - Debt service 3 12,964 12,967 131,510 Permanent funds and University funds: Expendable 174,823 274,835 449,658 - Nonexpendable 5,158,246 219,758 5,378,004 - Loans and other financial assistance: Expendable - 77,833 77,833 529,164 Other purposes - - - 40,308 Unrestricted (deficit) (2,663,019) 1,227,233 (1,435,786) 245,837
Total Net Position $ 22,194,124 $ 3,469,149 $ 25,663,273 $ 1,053,534
The Notes to the Financial Statements are an integral part of this statement.
TOTALPRIMARY GOVERNMENT
- 39 -

STATE OF ARIZONASTATEMENT OF FINANCIAL POSITIONUNIVERSITIES - AFFILIATED COMPONENT UNITSJUNE 30, 2014(Expressed in Thousands)
ASSETS Cash and cash equivalent investments $ 53,867
Receivables: Pledges receivable 121,870 Other receivables 23,980 Total receivables 145,850
Investments: Investments in securities 1,688,006 Other investments 58,755 Total investments 1,746,761
Net direct financing leases 74,960 Property and equipment, net of accumulated depreciation 324,059 Other assets 56,154
Total Assets 2,401,651
LIABILITIES Accounts payable and accrued liabilities 35,009 Liability under endowment trust agreements 355,801 Long-term debt 516,021 Deferred revenue 25,964 Other liabilities 52,682
Total Liabilities 985,477
NET ASSETS Permanently restricted 928,428 Temporarily restricted 464,511 Unrestricted 23,235
Total Net Assets $ 1,416,174
The Notes to the Financial Statements are an integral part of this statement.
- 40 -

(This page intentionally left blank)

STATE OF ARIZONASTATEMENT OF ACTIVITIESFOR THE YEAR ENDED JUNE 30, 2014(Expressed in Thousands)
CHARGES FOR GRANTS AND GRANTS ANDEXPENSES SERVICES CONTRIBUTIONS CONTRIBUTIONS
FUNCTIONS/PROGRAMSPRIMARY GOVERNMENT: Governmental Activities: General government $ 763,830 $ 188,943 $ 92,717 $ - Health and welfare 12,768,332 222,173 9,905,352 - Inspection and regulation 160,797 157,149 20,832 - Education 5,573,656 60,981 1,789,328 - Protection and safety 1,408,049 128,814 157,631 - Transportation 791,006 113,267 157,705 546,680 Natural resources 200,868 65,596 49,271 - Intergovernmental revenue sharing 2,778,299 - - - Interest on long-term debt 279,525 - - - Total Governmental Activities 24,724,362 936,923 12,172,836 546,680
Business-type Activities: Universities 4,078,053 2,056,307 1,258,140 41,250 Industrial Commission Special Fund 36,895 28,461 - - Other 1,130,299 1,296,585 85,782 - Total Business-type Activities 5,245,247 3,381,353 1,343,922 41,250
Total Primary Government $ 29,969,609 $ 4,318,276 $ 13,516,758 $ 587,930
COMPONENT UNITS: Water Infrastructure Finance Authority $ 41,528 $ 35,929 $ 36,371 University of Arizona Health Network & Subsidiaries 1,364,116 1,295,884 - Other Component Units 60,147 29,964 8,072 Total Component Units $ 1,465,791 $ 1,361,777 $ 44,443
General Revenues: Taxes: Sales Income Tobacco Property Motor vehicle and fuel Other Unrestricted investment earnings Unrestricted grants and contributions Gain on sale of trust land Payments from State of Arizona Miscellaneous Contributions to permanent endowments Extraordinary Items: Insurance recovery Transfers
Total General Revenues, Contributions, Extraordinary Items, and Transfers Change in Net Position Net Position - Beginning, as restated
Net Position - Ending
The Notes to the Financial Statements are an integral part of this statement.
PROGRAM REVENUESOPERATING CAPITAL
- 42 -

GOVERNMENTAL BUSINESS-TYPE PRIMARY COMPONENTACTIVITIES ACTIVITIES GOVERNMENT UNITS
$ (482,170) $ (482,170) (2,640,807) (2,640,807)
17,184 17,184 (3,723,347) (3,723,347) (1,121,604) (1,121,604)
26,646 26,646 (86,001) (86,001)
(2,778,299) (2,778,299) (279,525) (279,525)
(11,067,923) (11,067,923)
$ (722,356) (722,356) (8,434) (8,434)
252,068 252,068 (478,722) (478,722)
(11,067,923) (478,722) (11,546,645)
$ 30,772 (68,232) (22,111) (59,571)
5,948,055 63,669 6,011,724 9,117 3,963,197 - 3,963,197 -
314,313 - 314,313 - 41,215 - 41,215 -
1,650,579 - 1,650,579 - 547,481 - 547,481 12,637
79,215 108,296 187,511 26,021 37,926 107 38,033 57 83,695 - 83,695 -
- - - 36,924 176,035 78,837 254,872 17
- 6,561 6,561 -
- 3,900 3,900 - (578,361) 578,361 - -
12,263,350 839,731 13,103,081 84,773 1,195,427 361,009 1,556,436 25,202
20,998,697 3,108,140 24,106,837 1,028,332
$ 22,194,124 $ 3,469,149 $ 25,663,273 $ 1,053,534
NET (EXPENSE) REVENUE AND CHANGES IN NET POSITIONPRIMARY GOVERNMENT
TOTAL
- 43 -

STATE OF ARIZONASTATEMENT OF ACTIVITIESUNIVERSITIES - AFFILIATED COMPONENT UNITSFOR THE YEAR ENDED JUNE 30, 2014(Expressed in Thousands)
REVENUES Contributions $ 23,812 $ 134,613 $ 37,890 $ 196,315 Rental revenue 46,289 - - 46,289 Sales and services 36,698 130 - 36,828 Net investment income 31,603 75,162 63,062 169,827 Grants and aid 11,846 - - 11,846 Other revenues 33,912 4,169 354 38,435 Net assets released from restrictions 181,176 (160,735) (20,441) -
Total Revenues 365,336 53,339 80,865 499,540
EXPENSES Program services: Payments to Universities 157,779 - - 157,779 Leasing related expenses 10,330 - - 10,330 Payments on behalf of Universities 20,163 - - 20,163 Other program services 7,178 - - 7,178 Management and general expenses 66,923 - - 66,923 Fundraising expenses 11,621 - - 11,621 Interest 22,804 - - 22,804 Depreciation and amortization 19,848 - - 19,848 Other expenses 16,085 - - 16,085
Total Expenses 332,731 - - 332,731
Increase in Net Assets, before extraordinary items 32,605 53,339 80,865 166,809
Extraordinary items (Primarily equity transfers) - (472) - (472)
Increase in Net Assets, after extraordinary items 32,605 52,867 80,865 166,337
Net Assets - Beginning, as restated (9,637) 411,987 847,487 1,249,837 Transfers 267 (343) 76 -
Net Assets - Ending $ 23,235 $ 464,511 $ 928,428 $ 1,416,174
The Notes to the Financial Statements are an integral part of this statement.
TEMPORARILY PERMANENTLYUNRESTRICTED RESTRICTED RESTRICTED TOTAL
- 44 -

STATE OF ARIZONABALANCE SHEETGOVERNMENTAL FUNDSJUNE 30, 2014(Expressed in Thousands)
AVIATION PLANNING,HIGHWAY LAND OTHER
GENERAL MAINTENANCE & ENDOWMENTS GOVERNMENTAL FUND SAFETY FUND FUND FUNDS TOTAL
ASSETS Cash $ 1,856 $ - $ 28 $ 1,377 $ 3,261 Cash and pooled investments with State Treasurer 1,515,259 83,448 92,737 816,195 2,507,639 Collateral investment pool 22,897 1,733 430,419 14,898 469,947 Receivables, net of allowances: Taxes 288,192 62,117 - 73,579 423,888 Interest 39 - 214,679 - 214,718 Loans and notes 35,783 3,772 286,397 - 325,952 Other 79,550 16,070 5,526 25,949 127,095 Due from U.S. Government 720,481 80,236 - 10,705 811,422 Due from local governments 150,564 - - - 150,564 Due from others 132,680 - - - 132,680 Due from other Funds 36,093 - 190 25,513 61,796 Inventories, at cost 14,824 6,833 - - 21,657 Restricted assets: Cash 27 - - - 27 Cash and pooled investments with State Treasurer 28,000 978,359 - 748,038 1,754,397 Cash held by trustee 15,580 - - 11,571 27,151 Investments 3,274 - - - 3,274 Securities held in escheat 54,087 - - - 54,087 Endowment investments - - 4,858,023 - 4,858,023 Other 112 - - - 112 Total Assets $ 3,099,298 $ 1,232,568 $ 5,887,999 $ 1,727,825 $ 11,947,690
LIABILITIES, DEFERRED INFLOWS OF RESOURCES, AND FUND BALANCES Liabilities: Accounts payable and other current liabilities $ 297,988 $ 120,081 $ 5,864 $ 37,698 $ 461,631 Accrued liabilities 667,749 6,883 - 47,555 722,187 Obligations under securities loan agreements 22,897 1,733 430,419 14,898 469,947 Tax refunds payable 2,442 - - - 2,442 Due to U.S. Government 7,482 - - - 7,482 Due to local governments 1,046,272 125,313 - 77,434 1,249,019 Due to others 377,562 - 1 10,436 387,999 Due to other Funds 212,375 7,287 7,050 26,945 253,657 Unearned revenue 75,857 - 111,596 381 187,834 Total Liabilities 2,710,624 261,297 554,930 215,347 3,742,198
Deferred Inflows of Resources 364,085 - 490,964 796 855,845
Fund Balances: Nonspendable 9,600 6,833 4,871,849 - 4,888,282 Restricted 124,390 793,713 - 947,961 1,866,064 Committed 79,837 170,725 - 563,721 814,283 Unassigned (189,238) - (29,744) - (218,982) Total Fund Balances 24,589 971,271 4,842,105 1,511,682 7,349,647 Total Liabilities, Deferred Inflows . of Resources, and Fund Balances $ 3,099,298 $ 1,232,568 $ 5,887,999 $ 1,727,825 $ 11,947,690
The Notes to the Financial Statements are an integral part of this statement.
TRANSPORTATION &
- 45 -

STATE OF ARIZONARECONCILIATION OF THE GOVERNMENTAL FUNDS BALANCE SHEET TO THE STATEMENT OF NET POSITIONJUNE 30, 2014(Expressed in Thousands)
Total fund balances - governmental funds $ 7,349,647
Amounts reported for governmental activities in the Statement of Net Position are different because:
Capital assets used in governmental activities are not financial resources and, therefore, are not reported in the governmental funds. 21,541,821
Certain receivables are not available to pay for current period expenditures and, therefore, are deferred inflows of resources in the governmental funds. 855,845
Internal service funds are used by management to charge the costs of certain activities to individual funds. The assets and liabilities of the internal service funds are included in governmental activities in the Statement of Net Position. (189,888)
The allocation of the internal service fund accumulated net gain results in an amount due to business-type activities, which is not reported in the governmental funds. (61,001)
Deferred outflows of resources for the loss on refunding of debt are not reported in the governmental funds. 26,361
Long-term debt is not due and payable from current financial resources and, therefore, is not reported in the governmental funds. These amounts consist of:
Revenue bonds (3,406,195) Grant anticipation notes (247,710) Certificates of participation (2,200,675) Capital leases (449,209) Notes payable (89,865) Premium on debt (427,865) (6,821,519)
Accrued liabilities for AHCCCS programmatic costs and reimbursements are not due and payable from current financial resources and, therefore, are not reported in the governmental funds. (293,349)
Accrued interest on long-term obligations is not due and payable from current financial resources and, therefore, is not reported in the governmental funds. (28,389)
Other long-term liabilities are not due and payable from current financial resources and, therefore, are not reported in the governmental funds. Those liabilities consist of:
Compensated absences (164,883) Pollution remediation obligations (20,521) (185,404)
Net position of governmental activities $ 22,194,124
The Notes to the Financial Statements are an integral part of this statement.
- 46 -

STATE OF ARIZONASTATEMENT OF REVENUES, EXPENDITURESAND CHANGES IN FUND BALANCESGOVERNMENTAL FUNDSFOR THE YEAR ENDED JUNE 30, 2014(Expressed in Thousands)
AVIATION PLANNING,HIGHWAY LAND OTHER
GENERAL MAINTENANCE & ENDOWMENTS GOVERNMENTALFUND SAFETY FUND FUND FUNDS TOTAL
REVENUES Taxes: Sales $ 5,156,987 $ 243,786 $ - $ 533,051 $ 5,933,824 Income 4,012,562 - - 41 4,012,603 Tobacco 68,043 - - 246,270 314,313 Property 26,240 12,975 - 2,000 41,215 Motor vehicle and fuel 8,534 1,487,934 - 154,111 1,650,579 Other 439,703 - - 107,778 547,481 Intergovernmental 10,952,638 704,408 - 95,665 11,752,711 Licenses, fees, and permits 89,352 98,402 3,182 284,897 475,833 Hospital and nursing facility assessments - - - 91,578 91,578 Earnings on investments 22,979 6,226 660,778 49,876 739,859 Sales and charges for services 100,409 1,170 60,793 23,310 185,682 Fines, forfeitures, and penalties 24,999 - - 146,162 171,161 Gaming 6,131 - - 80,195 86,326 Tobacco settlement 100,765 - - - 100,765 Proceeds from sale of trust land - - 86,319 - 86,319 Other 163,193 17,745 9,386 18,534 208,858 Total Revenues 21,172,535 2,572,646 820,458 1,833,468 26,399,107
EXPENDITURES Current: General government 618,964 - - 131,199 750,163 Health and welfare 12,290,325 - 5,401 347,729 12,643,455 Inspection and regulation 42,635 - - 118,683 161,318 Education 4,828,811 - 47,419 696,184 5,572,414 Protection and safety 1,108,806 - 2,351 249,230 1,360,387 Transportation 4 672,485 - 15,309 687,798 Natural resources 80,237 - 941 111,865 193,043 Intergovernmental revenue sharing 1,712,501 1,065,798 - - 2,778,299 Debt service: Principal 131,033 51,264 - 311,295 493,592 Interest and other fiscal charges 62,749 520 - 248,755 312,024 Capital outlay 244,589 428,545 12 156,484 829,630 Total Expenditures 21,120,654 2,218,612 56,124 2,386,733 25,782,123 Excess (Deficiency) of Revenues Over Expenditures 51,881 354,034 764,334 (553,265) 616,984
OTHER FINANCING SOURCES (USES) Transfers in 328,678 911 31 574,641 904,261 Transfers out (882,237) (303,030) (49,272) (162,793) (1,397,332) Proceeds from sale of capital assets - 900 - - 900 Capital lease and installment purchase contracts 100,678 13,236 - - 113,914 Refunding certificates of participation issued 305,675 - - - 305,675 Proceeds from notes and loans - 29,130 - - 29,130 Payment to refunded certificates of participation escrow agent (310,059) - - - (310,059) Premium on debt issued 6,770 - - - 6,770 Total Other Financing Sources (Uses) (450,495) (258,853) (49,241) 411,848 (346,741) Net Change in Fund Balances (398,614) 95,181 715,093 (141,417) 270,243 Fund Balances - Beginning 423,203 876,090 4,127,012 1,653,099 7,079,404
Fund Balances - Ending $ 24,589 $ 971,271 $ 4,842,105 $ 1,511,682 $ 7,349,647
The Notes to the Financial Statements are an integral part of this statement.
TRANSPORTATION &
- 47 -

STATE OF ARIZONARECONCILIATION OF THE STATEMENT OF REVENUES, EXPENDITURES AND CHANGESIN FUND BALANCES OF GOVERNMENTAL FUNDS TO THE STATEMENT OF ACTIVITIESFOR THE YEAR ENDED JUNE 30, 2014(Expressed in Thousands)
Net change in fund balances - total governmental funds $ 270,243
Amounts reported for governmental activities in the Statement of Activities are different because:
Capital outlays are reported as expenditures in governmental funds. However, in the Statement of Activities, the cost of assets is allocated over their estimated useful lives and reported as depreciation expense. Also, infrastructure was adjusted to primarily reflect reduction in construction in progress resulting from certain infrastructure projects being reclassified from capital outlay to non-capital. This is the amount by which capital outlays exceeded depreciation and infrastructure adjustments in the current period.
Capital outlay 829,630 Infrastructure adjustment (94,559) Depreciation expense (112,565) 622,506
The net expense of the internal service funds is included with governmental activities in the Statement of Activities. (36,467)
Net change in certain revenues reported in the Statement of Activities do not provide current financial resources and, therefore, are reported as deferred inflows in the governmental funds.
Sales taxes 14,231 Income taxes (49,406) Operating grants 118,712 Right-of-way lease revenue (1,026) Other revenue 2 82,513
Trust land sales are financed with long-term mortgages. In the Statement of Activities, the gain on sale of trust land is reported, whereas in the governmental funds, the proceeds from the collection of mortgage payments are reported. In fiscal year 2014, mortgage payments received exceeded gains resulting from current year land sales. In addition, accrued interest on land sales contracts are reported as revenues in the Statement of Activities but are not reported as revenues in the governmental funds.
Excess of mortgage receipts over gain on sale of land (2,624) Accrued interest on land sales' contracts 11,958 9,334
Certain expenses reported in the Statement of Activities do not require the use of current financial resources and, therefore, are not reported as expenditures in the governmental funds.
AHCCCS accrued programmatic costs (122,266) Compensated absences (8,503) Pollution remediation obligations 1,562 Interest on long-term obligations 6,536 Adjustment for deferred amounts (19,240) (141,911)
The Notes to the Financial Statements are an integral part of this statement. (Continued)
- 48 -

STATE OF ARIZONARECONCILIATION OF THE STATEMENT OF REVENUES, EXPENDITURES AND CHANGESIN FUND BALANCES OF GOVERNMENTAL FUNDS TO THE STATEMENT OF ACTIVITIESFOR THE YEAR ENDED JUNE 30, 2014(Expressed in Thousands)
Bond proceeds provide current financial resources to the governmental funds; however, issuing debt increases long-term liabilities in the Statement of Net Position. In the current period, proceeds were received from:
Refunding certificates of participation issued (305,675) Proceeds from notes and loans (29,130) Premium on debt issued (6,770) (341,575)
Repayment of long-term debt is reported as an expenditure in the governmental funds, but the repayment reduces long-term liabilities and deferred outflows of resources in the Statement of Net Position. In the current year, these amounts consist of:
Debt service principal 493,592 Payment to refunded certificates of participation escrow agent 310,059 Debt premium/discount amortization 44,243 Amortization of deferred losses on refundings (3,196) 844,698
Some capital asset additions were financed through capital leases and installment purchase contracts. Such financing arrangements are reported as an other financing source in the governmental funds; however, these amounts are reported as liabilities in the Statement of Net Position. (113,914)
Change in net position of governmental activities $ 1,195,427
The Notes to the Financial Statements are an integral part of this statement.
- 49 -

STATE OF ARIZONASTATEMENT OF NET POSITIONPROPRIETARY FUNDSJUNE 30, 2014(Expressed in Thousands)
TOTALCOMMISSION ENTERPRISE INTERNAL
UNIVERSITIES SPECIAL FUND OTHER FUNDS SERVICE FUNDSASSETS Current Assets: Cash $ 173,156 $ 113,842 $ 4,293 $ 291,291 $ - Cash with U.S. Treasury - - 8,244 8,244 - Cash and pooled investments with State Treasurer 1,789 888 68,518 71,195 426,111 Restricted cash and pooled investments with State Treasurer - - 77,833 77,833 - Collateral investment pool - 44,899 - 44,899 - Short-term investments 173,922 - - 173,922 - Receivables, net of allowances: Taxes - 4,182 91,906 96,088 - Interest 429 1,990 - 2,419 - Loans and notes 4,171 - - 4,171 - Other 136,250 1,260 30,354 167,864 11,221 Due from U.S. Government 86,862 - 73 86,935 3,600 Due from other Funds 218,059 3 144 218,206 2,831 Inventories, at cost 8,542 - 13,602 22,144 3,173 Other current assets 20,156 - 660 20,816 5,532 Total Current Assets 823,336 167,064 295,627 1,286,027 452,468
Noncurrent Assets: Restricted assets: Cash 23,317 - - 23,317 - Cash and pooled investments with State Treasurer - - - - 975 Cash held by trustee 254,390 - - 254,390 - Investments held by trustee 81,360 - - 81,360 - Receivables, net of allowances: Loans and notes 33,071 - - 33,071 - Other 10,411 - - 10,411 - Investments 754,386 400,971 - 1,155,357 - Endowment investments 429,865 - - 429,865 - Other noncurrent assets 7,536 - 9,862 17,398 - Capital assets: Land and other non-depreciable 543,030 2,997 2,884 548,911 76 Buildings, equipment, and other depreciable, net of accumulated depreciation 3,911,111 9,843 23,853 3,944,807 82,212 Total Noncurrent Assets 6,048,477 413,811 36,599 6,498,887 83,263 Total Assets 6,871,813 580,875 332,226 7,784,914 535,731
DEFERRED OUTFLOWS OF RESOURCES 51,779 - - 51,779 -
The Notes to the Financial Statements are an integral part of this statement. (Continued)
BUSINESS-TYPE ACTIVITIES - ENTERPRISE FUNDS GOVERNMENTALINDUSTRIAL ACTIVITIES -
- 50 -

STATE OF ARIZONASTATEMENT OF NET POSITIONPROPRIETARY FUNDSJUNE 30, 2014(Expressed in Thousands)
TOTALCOMMISSION ENTERPRISE INTERNAL
UNIVERSITIES SPECIAL FUND OTHER FUNDS SERVICE FUNDSLIABILITIES Current Liabilities: Accounts payable and other current liabilities $ 139,826 $ 4,506 $ 5,289 $ 149,621 $ 136,410 Payable for securities purchased - 3,472 - 3,472 - Accrued liabilities 37,110 - 29,939 67,049 865 Obligations under securities loan agreements - 44,899 - 44,899 - Due to U.S. Government - - 13,025 13,025 - Due to others 29,685 - 42,660 72,345 - Due to component units - - 260 260 - Due to other Funds - - 29,162 29,162 14 Unearned revenue 171,631 133 2,152 173,916 - Current portion of accrued insurance losses - 25,501 - 25,501 59,786 Current portion of long-term debt 124,308 - - 124,308 - Current portion of other long-term liabilities 18,620 - 1,873 20,493 10,172 Total Current Liabilities 521,180 78,511 124,360 724,051 207,247
Noncurrent Liabilities: Accrued insurance losses - 458,643 - 458,643 369,543 Funds held for others 47,290 - - 47,290 - Long-term debt 3,121,442 - - 3,121,442 - Derivative instrument - interest rate swap 14,135 - - 14,135 - Other long-term liabilities 62,911 - 73 62,984 148,829 Total Noncurrent Liabilities 3,245,778 458,643 73 3,704,494 518,372 Total Liabilities 3,766,958 537,154 124,433 4,428,545 725,619
NET POSITION Net investment in capital assets 1,541,859 12,840 26,737 1,581,436 82,288 Restricted for: Unemployment Compensation - - 57,585 57,585 - Capital projects 17,505 - - 17,505 - Debt service 12,964 - - 12,964 - Universities fund: Expendable 274,835 - - 274,835 - Nonexpendable 219,758 - - 219,758 - Loans and other financial assistance: Expendable - - 77,833 77,833 - Unrestricted (deficit) 1,089,713 30,881 45,638 1,166,232 (272,176)
Total Net Position $ 3,156,634 $ 43,721 $ 207,793 $ 3,408,148 $ (189,888)
Adjustment to reflect the consolidation of internal service fund activities related to enterprise funds. 61,001
Net position of business-type activities $ 3,469,149
The Notes to the Financial Statements are an integral part of this statement.
INDUSTRIAL ACTIVITIES -BUSINESS-TYPE ACTIVITIES - ENTERPRISE FUNDS GOVERNMENTAL
- 51 -

STATE OF ARIZONASTATEMENT OF REVENUES, EXPENSESAND CHANGES IN FUND NET POSITIONPROPRIETARY FUNDSFOR THE YEAR ENDED JUNE 30, 2014(Expressed in Thousands)
TOTALENTERPRISE INTERNAL
UNIVERSITIES SPECIAL FUND OTHER FUNDS SERVICE FUNDSOPERATING REVENUES Sales and charges for services: Student tuition and fees, net of scholarship allowances of $483,109 $ 1,570,546 $ - $ - $ 1,570,546 $ - Auxiliary enterprises, net of scholarship allowances of $21,531 382,991 - - 382,991 - Educational department 102,770 - - 102,770 - Other - - 838,728 838,728 1,006,504 Unemployment assessments - - 455,979 455,979 - Workers' compensation assessments - 22,391 - 22,391 - Intergovernmental 556,539 - 84,094 640,633 - Nongovernmental grants and contracts 127,500 - - 127,500 - Fines, forfeitures, and penalties - - 1,878 1,878 - Settlement income - 6,070 - 6,070 - Other 45,082 - 7,800 52,882 56 Total Operating Revenues 2,785,428 28,461 1,388,479 4,202,368 1,006,560
OPERATING EXPENSES Cost of sales and benefits 1,094,086 31,176 1,032,842 2,158,104 795,129 Scholarships and fellowships 232,278 - - 232,278 - Personal services 2,372,383 - 42,109 2,414,492 39,371 Contractual services - - 26,083 26,083 22,679 Depreciation and amortization 262,307 1,338 2,232 265,877 13,673 Insurance - - 726 726 82,940 Other - - 8,950 8,950 5,445 Total Operating Expenses 3,961,054 32,514 1,112,942 5,106,510 959,237 Operating Income (Loss) (1,175,626) (4,053) 275,537 (904,142) 47,323
NON-OPERATING REVENUES (EXPENSES) Share of State sales tax revenues 63,669 - - 63,669 - Intergovernmental 291,951 - - 291,951 - Gifts and donations 248,845 - - 248,845 - Gain (loss) on sale of capital assets (755) (7) (9) (771) 36 Investment income 48,356 59,020 2,608 109,984 4 Endowment earnings on investments 33,305 - - 33,305 - Other non-operating revenue 24,510 2,154 62 26,726 312 Distributions - - (14,763) (14,763) - Interest expense (126,966) - (2,538) (129,504) - Other non-operating expense (9,642) (4,381) (56) (14,079) - Total Non-Operating Revenues (Expenses) 573,273 56,786 (14,696) 615,363 352 Income (Loss) Before Contributions, Extraordinary Items, and Transfers (602,353) 52,733 260,841 (288,779) 47,675 Capital grants and contributions 41,250 - 107 41,357 20,757 Contributions to permanent endowments 6,561 - - 6,561 - Extraordinary Items: Insurance recovery 3,900 - - 3,900 - Transfers in 737,316 8,000 - 745,316 - Transfers out - - (166,955) (166,955) (85,290)
Change in Net Position 186,674 60,733 93,993 341,400 (16,858) Total Net Position - Beginning, as restated 2,969,960 (17,012) 113,800 3,066,748 (173,030)
Total Net Position - Ending $ 3,156,634 $ 43,721 $ 207,793 $ 3,408,148 $ (189,888)
Change in net position of enterprise funds $ 341,400 Adjustment to reflect the consolidation of internal service fund activities related to enterprise funds 19,609
Change in net position of business-type activities $ 361,009
The Notes to the Financial Statements are an integral part of this statement.
BUSINESS-TYPE ACTIVITIES - ENTERPRISE FUNDS GOVERNMENTALINDUSTRIAL ACTIVITIES -COMMISSION
- 52 -

(This page intentionally left blank)
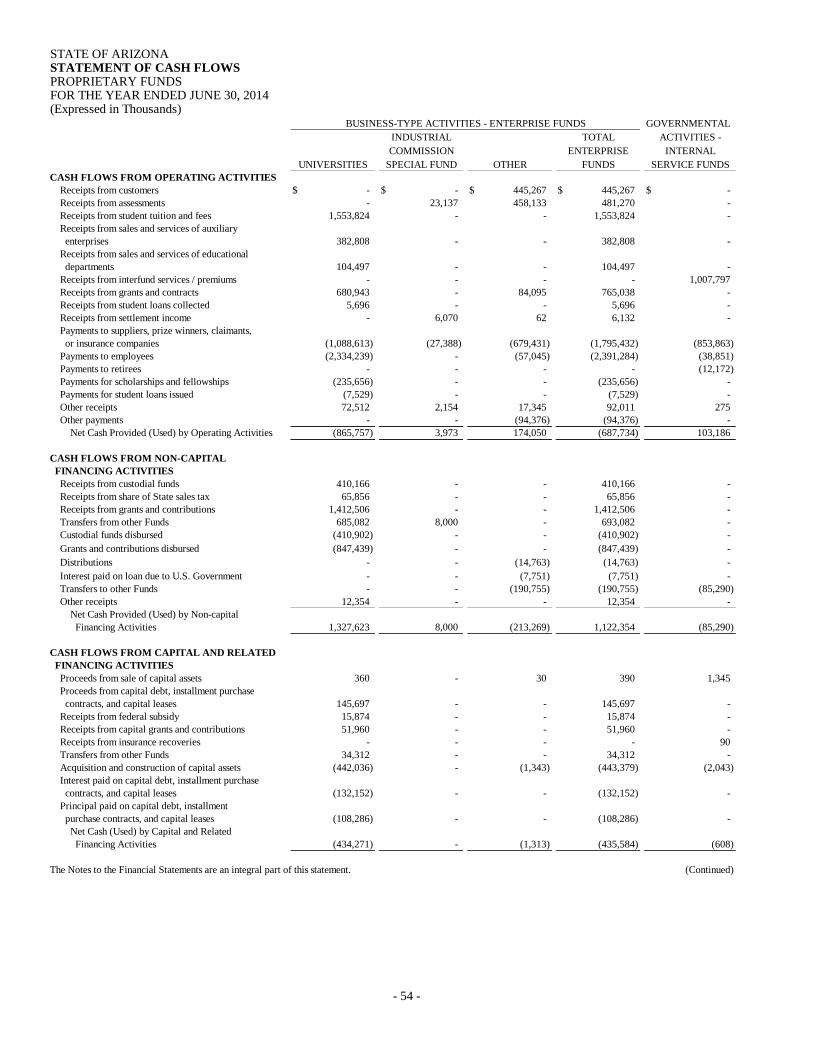
STATE OF ARIZONASTATEMENT OF CASH FLOWSPROPRIETARY FUNDSFOR THE YEAR ENDED JUNE 30, 2014(Expressed in Thousands)
TOTALENTERPRISE INTERNAL
SPECIAL FUND OTHER FUNDS SERVICE FUNDSCASH FLOWS FROM OPERATING ACTIVITIES Receipts from customers $ - $ - $ 445,267 $ 445,267 $ - Receipts from assessments - 23,137 458,133 481,270 - Receipts from student tuition and fees 1,553,824 - - 1,553,824 - Receipts from sales and services of auxiliary enterprises 382,808 - - 382,808 - Receipts from sales and services of educational departments 104,497 - - 104,497 - Receipts from interfund services / premiums - - - - 1,007,797 Receipts from grants and contracts 680,943 - 84,095 765,038 - Receipts from student loans collected 5,696 - - 5,696 - Receipts from settlement income - 6,070 62 6,132 - Payments to suppliers, prize winners, claimants, or insurance companies (1,088,613) (27,388) (679,431) (1,795,432) (853,863) Payments to employees (2,334,239) - (57,045) (2,391,284) (38,851) Payments to retirees - - - - (12,172) Payments for scholarships and fellowships (235,656) - - (235,656) - Payments for student loans issued (7,529) - - (7,529) - Other receipts 72,512 2,154 17,345 92,011 275 Other payments - - (94,376) (94,376) - Net Cash Provided (Used) by Operating Activities (865,757) 3,973 174,050 (687,734) 103,186
CASH FLOWS FROM NON-CAPITAL FINANCING ACTIVITIES Receipts from custodial funds 410,166 - - 410,166 - Receipts from share of State sales tax 65,856 - - 65,856 - Receipts from grants and contributions 1,412,506 - - 1,412,506 - Transfers from other Funds 685,082 8,000 - 693,082 - Custodial funds disbursed (410,902) - - (410,902) - Grants and contributions disbursed (847,439) - - (847,439) - Distributions - - (14,763) (14,763) - Interest paid on loan due to U.S. Government - - (7,751) (7,751) - Transfers to other Funds - - (190,755) (190,755) (85,290) Other receipts 12,354 - - 12,354 - Net Cash Provided (Used) by Non-capital Financing Activities 1,327,623 8,000 (213,269) 1,122,354 (85,290)
CASH FLOWS FROM CAPITAL AND RELATED FINANCING ACTIVITIES Proceeds from sale of capital assets 360 - 30 390 1,345 Proceeds from capital debt, installment purchase contracts, and capital leases 145,697 - - 145,697 - Receipts from federal subsidy 15,874 - - 15,874 - Receipts from capital grants and contributions 51,960 - - 51,960 - Receipts from insurance recoveries - - - - 90 Transfers from other Funds 34,312 - - 34,312 - Acquisition and construction of capital assets (442,036) - (1,343) (443,379) (2,043) Interest paid on capital debt, installment purchase contracts, and capital leases (132,152) - - (132,152) - Principal paid on capital debt, installment purchase contracts, and capital leases (108,286) - - (108,286) - Net Cash (Used) by Capital and Related Financing Activities (434,271) - (1,313) (435,584) (608)
The Notes to the Financial Statements are an integral part of this statement. (Continued)
BUSINESS-TYPE ACTIVITIES - ENTERPRISE FUNDS GOVERNMENTALINDUSTRIAL ACTIVITIES -COMMISSION
UNIVERSITIES
- 54 -

STATE OF ARIZONASTATEMENT OF CASH FLOWSPROPRIETARY FUNDSFOR THE YEAR ENDED JUNE 30, 2014(Expressed in Thousands)
TOTALENTERPRISE INTERNAL
SPECIAL FUND OTHER FUNDS SERVICE FUNDSCASH FLOWS FROM INVESTING ACTIVITIES Proceeds from sales and maturities of investments 244,441 328,796 - 573,237 - Interest and dividends from investments 38,092 13,389 2,596 54,077 6 Change in cash collateral received from securities lending transactions - 19 (44) (25) - Purchase of investments (322,085) (300,760) - (622,845) - Net Cash Provided (Used) by Investing Activities (39,552) 41,444 2,552 4,444 6
Net Increase (Decrease) in Cash and Cash Equivalents (11,957) 53,417 (37,980) 3,480 17,294 Cash and Cash Equivalents - Beginning 464,609 106,212 196,868 767,689 409,792
Cash and Cash Equivalents - Ending $ 452,652 $ 159,629 $ 158,888 $ 771,169 $ 427,086
RECONCILIATION OF OPERATING INCOME (LOSS) TO NET CASH PROVIDED (USED) BY OPERATING ACTIVITIES: Operating income (loss) $ (1,175,626) $ (4,053) $ 275,537 $ (904,142) $ 47,323 Adjustments to reconcile operating income (loss) to net cash provided (used) by operating activities: Depreciation and amortization 262,307 1,338 2,232 265,877 13,673 Provision for uncollectible accounts - - 13 13 - Miscellaneous income (expense) 25,279 (189) 62 25,152 221 Net changes in assets and liabilities: (Increase) decrease in receivables, net of allowances (32,106) 734 8,051 (23,321) (558) Decrease in due from U.S. Government - - 1 1 1,800 Decrease in due from other Funds - - 43 43 62 (Increase) decrease in inventories, at cost 870 - (2,485) (1,615) 549 (Increase) decrease in other assets 20 - (644) (624) 39 Increase (decrease) in accounts payable 18,193 (182) (3,450) 14,561 18,483 Increase in accrued liabilities 8,731 - 2,919 11,650 157 (Decrease) in due to U.S. Government - - (98,444) (98,444) - (Decrease) in due to other Funds - - (2) (2) (15,476) (Decrease) in due to others - - (7,271) (7,271) - Increase (decrease) in unearned revenue 26,575 28 (2,982) 23,621 (13) Increase in accrued insurance losses - 6,297 - 6,297 33,714 Increase in other liabilities - - 470 470 3,212
Net Cash Provided (Used) by Operating Activities $ (865,757) $ 3,973 $ 174,050 $ (687,734) $ 103,186
SCHEDULE OF NONCASH INVESTING, CAPITAL AND NON-CAPITAL FINANCING ACTIVITIES Contribution of capital assets from other Funds $ - $ - $ 107 $ 107 $ 20,757 Gifts and conveyances of capital assets 882 - - 882 - (Loss) on disposal of capital assets, net (1,319) (7) (9) (1,335) - Increase in fair value of investments 19,982 44,450 - 64,432 - Amortization of bond discount (2,400) - - (2,400) - Amortization of bond premium 9,953 - - 9,953 - Amortization of unearned rent 4,900 - - 4,900 - Refinancing long-term debt 16,315 - - 16,315 - Total Noncash Investing, Capital and Non-capital Financing Activities $ 48,313 $ 44,443 $ 98 $ 92,854 $ 20,757
The Notes to the Financial Statements are an integral part of this statement.
UNIVERSITIES
BUSINESS-TYPE ACTIVITIES - ENTERPRISE FUNDS GOVERNMENTALINDUSTRIAL ACTIVITIES -COMMISSION
- 55 -

STATE OF ARIZONASTATEMENT OF FIDUCIARY NET POSITIONFIDUCIARY FUNDSJUNE 30, 2014(Expressed in Thousands)
PENSION AND OTHEREMPLOYEE BENEFIT INVESTMENT AGENCY
TRUST FUNDS TRUSTS FUNDSASSETS Cash $ 355,172 $ - $ 50,315 Cash and pooled investments with State Treasurer - 21,000 69,880 Short-term investments - - 8,236
Receivables, net of allowances: Accrued interest and dividends 70,529 3,037 1 Securities sold 87,478 - - Forward contracts receivable 438,188 - - Contributions 94,532 - - Court fees 683 - - Due from other Funds 9,760 - - Other 39,842 - 2 Total receivables 741,012 3,037 3
Investments, at fair value: Temporary investments 1,749,791 - - Fixed income securities 7,790,204 2,720,310 - Corporate stocks 23,653,151 - - Global tactical asset allocation 4,212,886 - - Real assets 555,868 - - Real estate 2,969,305 - - Private equity 1,081,812 - - Opportunistic investments 714,557 - - Collateral investment pool 601,169 16,715 - Other investments 713,214 - - Total investments 44,041,957 2,737,025 -
Due from others - - 82,589 Custodial securities in safekeeping - - 3,846,490 Other assets - - 1,658 Property and equipment, net of accumulated depreciation 4,355 - -
Total Assets 45,142,496 2,761,062 4,059,171
LIABILITIES Accounts payable and other current liabilities 81,582 - - Payable for securities purchased 335,571 - - Management fee payable - 137 - Obligation under securities loan agreements 601,169 16,715 - Forward contracts payable 416,884 - - Due to local governments - - 1,012 Due to others - - 4,058,159 Due to other Funds 9,760 - -
Total Liabilities 1,444,966 16,852 4,059,171
NET POSITION Held in trust for: Pension benefits 41,440,778 - - Other post-employment benefits 2,256,752 - - Pool participants - 2,744,210 -
Total Net Position $ 43,697,530 $ 2,744,210 $ -
The Notes to the Financial Statements are an integral part of this statement.
- 56 -

STATE OF ARIZONASTATEMENT OF CHANGES IN FIDUCIARY NET POSITIONFIDUCIARY FUNDSFOR THE YEAR ENDED JUNE 30, 2014(Expressed in Thousands)
PENSION AND OTHEREMPLOYEE BENEFIT
TRUST FUNDSADDITIONS: Member contributions $ 1,218,175 $ - Employer contributions 1,576,220 - Non-employer entity contributions 5,000 - Member purchase of service credit 43,915 - Court fees 8,541 -
Investment income: Net increase in fair value of investments 6,394,466 3,018 Interest income 202,978 14,476 Dividends 410,304 - Other investment income 94,498 - Securities lending income 4,949 187 Total investment income 7,107,195 17,681
Less investment expenses: Investment activity expenses 313,515 1,639 Securities lending expenses 681 93 Net investment income 6,792,999 15,949
Capital share and individual account transactions: Shares sold - 4,353,027 Reinvested interest income - 11,831 Shares redeemed - (4,589,103) Net capital share and individual account transactions - (224,245)
Other additions 32,080 -
Total Additions 9,676,930 (208,296)
DEDUCTIONS: Retirement, disability, and survivor benefits 3,503,338 - Health insurance subsidy 17,566 - Refunds to withdrawing members, including interest 291,238 - Administrative expense 37,365 - Dividends to investors - 14,198 Other deductions 2,847 -
Total Deductions 3,852,354 14,198
Change in net position held in trust for: Pension benefits 5,522,970 - Other post-employment benefits 301,606 - Pool participants - (222,494) Net Position - Beginning 37,872,954 2,966,704
Net Position - Ending $ 43,697,530 $ 2,744,210
The Notes to the Financial Statements are an integral part of this statement.
INVESTMENTTRUSTS
- 57 -

STATE OF ARIZONACOMBINING STATEMENT OF NET POSITION COMPONENT UNITSJUNE 30, 2014(Expressed in Thousands)
TOTALASSETS Current Assets: Cash $ - $ 46,703 $ 23,871 $ 70,574 Cash and pooled investments with State Treasurer 196,574 - 127,994 324,568 Cash held by trustee 11,533 - - 11,533 Collateral investment pool 1,036 - 2,452 3,488 Short-term investments - 111,290 - 111,290 Restricted investments held by trustee - 22,674 5,343 28,017 Receivables, net of allowances: Taxes - - 2,672 2,672 Interest 8,546 - 15 8,561 Loans and notes - - 1,673 1,673 Patient accounts receivable - 161,330 - 161,330 Other 8,558 77,062 4,083 89,703 Inventories, at cost - 21,171 - 21,171 Other current assets - - 2,394 2,394 Total Current Assets 226,247 440,230 170,497 836,974
Noncurrent Assets: Restricted assets: Cash and pooled investments with State Treasurer - - 11,965 11,965 Cash held by trustee - - 17,342 17,342 Investments 85,996 67,346 - 153,342 Investments held by trustee - 28,124 7,757 35,881 Loans and notes receivable, net of allowances 1,094,306 - 23,139 1,117,445 Other receivables, net of allowances - 7,512 - 7,512 Investments 28,280 - - 28,280 Other noncurrent assets - 2,246 606 2,852 Capital assets: Land and other non-depreciable - 27,890 11,277 39,167 Buildings, equipment, and other depreciable, net of accumulated depreciation 18 390,125 26,006 416,149 Total Noncurrent Assets 1,208,600 523,243 98,092 1,829,935
Total Assets 1,434,847 963,473 268,589 2,666,909
DEFERRED OUTFLOWS OF RESOURCES 25,908 - 33,791 59,699
LIABILITIES Current Liabilities: Accounts payable and other current liabilities - 98,136 11,646 109,782 Accrued liabilities 9,479 98,564 650 108,693 Obligations under securities loan agreements 1,036 - 2,452 3,488 Current portion of accrued insurance losses - 9,710 - 9,710 Current portion of long-term debt 46,495 27,481 10,160 84,136 Current portion of other long-term liabilities 104 30,255 - 30,359 Total Current Liabilities 57,114 264,146 24,908 346,168
Noncurrent Liabilities: Unearned revenue 2,033 - - 2,033 Accrued insurance losses - 21,553 - 21,553 Long-term debt 846,252 335,805 117,008 1,299,065 Other long-term liabilities - 4,255 - 4,255 Total Noncurrent Liabilities 848,285 361,613 117,008 1,326,906
Total Liabilities 905,399 625,759 141,916 1,673,074
NET POSITION Net investment in capital assets 18 72,668 34,029 106,715 Restricted for: Debt service 85,996 10,195 35,319 131,510 Loans and other financial assistance 470,571 - 58,593 529,164 Other - 17,712 22,596 40,308 Unrestricted (1,229) 237,139 9,927 245,837
Total Net Position $ 555,356 $ 337,714 $ 160,464 $ 1,053,534
The Notes to the Financial Statements are an integral part of this statement.
UNIVERSITYWATER OF ARIZONA
INFRASTRUCTURE HEALTHFINANCE NETWORK & COMPONENT
AUTHORITY SUBSIDIARIES UNITS
OTHER
- 58 -

(This page intentionally left blank)

STATE OF ARIZONACOMBINING STATEMENT OF ACTIVITIESCOMPONENT UNITSFOR THE YEAR ENDED JUNE 30, 2014(Expressed in Thousands)
CHARGES FOR GRANTS ANDEXPENSES SERVICES CONTRIBUTIONS
FUNCTIONS/PROGRAMSWater Infrastructure Finance Authority $ 41,528 $ 35,929 $ 36,371 University of Arizona Health Network & Subsidiaries 1,364,116 1,295,884 - Other Component Units 60,147 29,964 8,072
Total $ 1,465,791 $ 1,361,777 $ 44,443
General Revenues: Taxes: Sales Other Unrestricted investment earnings Unrestricted grants and contributions Payments from State of Arizona Miscellaneous Change in Net Position Net Position - Beginning, as restated
Net Position - Ending
The Notes to the Financial Statements are an integral part of this statement.
PROGRAM REVENUES
OPERATING
- 60 -

WATERINFRASTRUCTURE OTHER
FINANCE NETWORK & COMPONENTAUTHORITY SUBSIDIARIES UNITS TOTAL
$ 30,772 $ - $ - $ 30,772 - (68,232) - (68,232) - - (22,111) (22,111)
- - 9,117 9,117 - - 12,637 12,637
5,998 18,754 1,269 26,021 - - 57 57 - - 36,924 36,924 - - 17 17
36,770 (49,478) 37,910 25,202 518,586 387,192 122,554 1,028,332
$ 555,356 $ 337,714 $ 160,464 $ 1,053,534
NET (EXPENSE) REVENUE AND CHANGES IN NET POSITIONUNIVERSITYOF ARIZONA
HEALTH
- 61 -
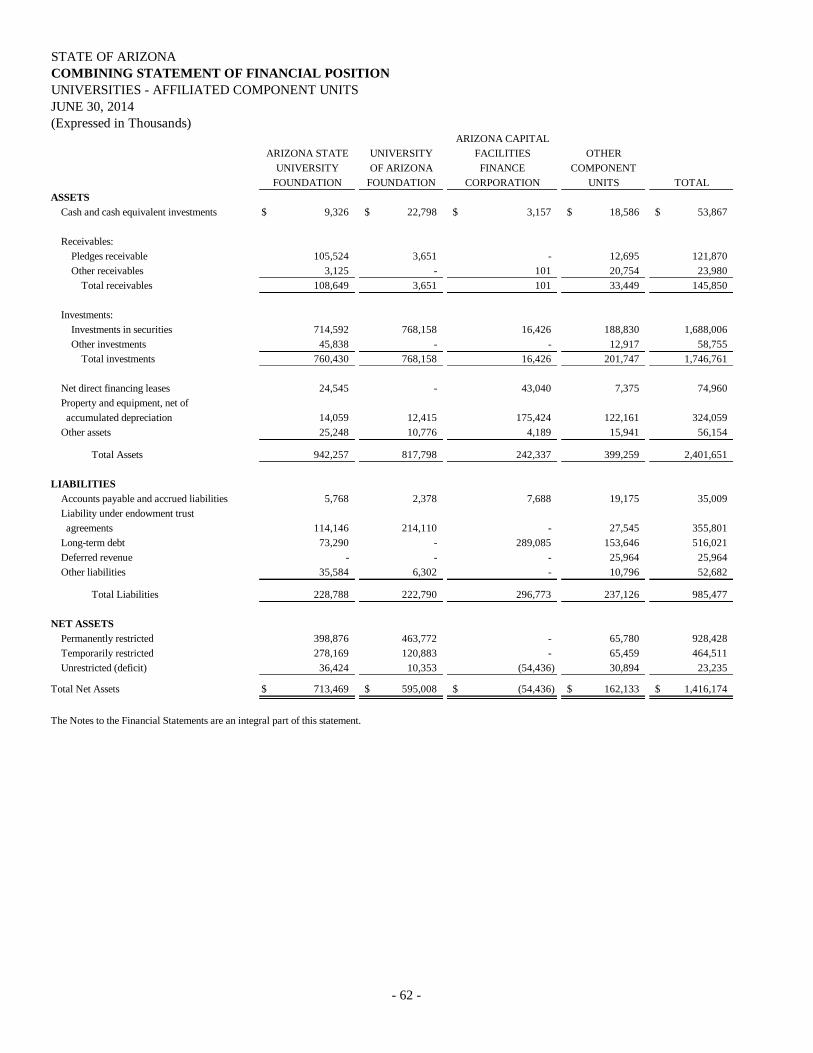
STATE OF ARIZONACOMBINING STATEMENT OF FINANCIAL POSITIONUNIVERSITIES - AFFILIATED COMPONENT UNITSJUNE 30, 2014(Expressed in Thousands)
ARIZONA CAPITALARIZONA STATE UNIVERSITY FACILITIES OTHER
UNIVERSITY OF ARIZONA FINANCE COMPONENTFOUNDATION FOUNDATION CORPORATION UNITS TOTAL
ASSETS Cash and cash equivalent investments $ 9,326 $ 22,798 $ 3,157 $ 18,586 $ 53,867
Receivables: Pledges receivable 105,524 3,651 - 12,695 121,870 Other receivables 3,125 - 101 20,754 23,980 Total receivables 108,649 3,651 101 33,449 145,850
Investments: Investments in securities 714,592 768,158 16,426 188,830 1,688,006 Other investments 45,838 - - 12,917 58,755 Total investments 760,430 768,158 16,426 201,747 1,746,761
Net direct financing leases 24,545 - 43,040 7,375 74,960 Property and equipment, net of accumulated depreciation 14,059 12,415 175,424 122,161 324,059 Other assets 25,248 10,776 4,189 15,941 56,154
Total Assets 942,257 817,798 242,337 399,259 2,401,651
LIABILITIES Accounts payable and accrued liabilities 5,768 2,378 7,688 19,175 35,009 Liability under endowment trust agreements 114,146 214,110 - 27,545 355,801 Long-term debt 73,290 - 289,085 153,646 516,021 Deferred revenue - - - 25,964 25,964 Other liabilities 35,584 6,302 - 10,796 52,682
Total Liabilities 228,788 222,790 296,773 237,126 985,477
NET ASSETS Permanently restricted 398,876 463,772 - 65,780 928,428 Temporarily restricted 278,169 120,883 - 65,459 464,511 Unrestricted (deficit) 36,424 10,353 (54,436) 30,894 23,235
Total Net Assets $ 713,469 $ 595,008 $ (54,436) $ 162,133 $ 1,416,174
The Notes to the Financial Statements are an integral part of this statement.
- 62 -

STATE OF ARIZONACOMBINING STATEMENT OF ACTIVITIESUNIVERSITIES - AFFILIATED COMPONENT UNITSFOR THE YEAR ENDED JUNE 30, 2014(Expressed in Thousands)
ARIZONA CAPITALARIZONA STATE UNIVERSITY FACILITIES OTHER
UNIVERSITY OF ARIZONA FINANCE COMPONENTFOUNDATION FOUNDATION CORPORATION UNITS TOTAL
REVENUES Contributions $ 59,971 $ 98,685 $ - $ 37,659 $ 196,315 Rental revenue 1,036 - 14,701 30,552 46,289 Sales and services 21,276 - 9,470 6,082 36,828 Net investment income 77,321 70,937 1 21,568 169,827 Grants and aid - - - 11,846 11,846 Other revenues 11,190 10,255 8,642 8,348 38,435
Total Revenues 170,794 179,877 32,814 116,055 499,540
EXPENSES Program services: Payments to Universities 71,263 73,409 24 13,083 157,779 Leasing related expenses - - - 10,330 10,330 Payments on behalf of Universities - 14,829 - 5,334 20,163 Other program services - - - 7,178 7,178 Management and general expenses 25,520 4,227 9,070 28,106 66,923 Fundraising expenses - 8,269 - 3,352 11,621 Interest 1,970 - 13,098 7,736 22,804 Depreciation and amortization 867 - 12,587 6,394 19,848 Other expenses 13,519 - 61 2,505 16,085
Total Expenses 113,139 100,734 34,840 84,018 332,731
Increase (decrease) in Net Assets, before extraordinary items 57,655 79,143 (2,026) 32,037 166,809
Extraordinary item (Primarily equity transfers) - - - (472) (472)
Increase (decrease) in Net Assets, after extraordinary items 57,655 79,143 (2,026) 31,565 166,337
Net Assets - Beginning, as restated 655,814 515,865 (52,410) 130,568 1,249,837
Net Assets - Ending $ 713,469 $ 595,008 $ (54,436) $ 162,133 $ 1,416,174
The Notes to the Financial Statements are an integral part of this statement.
- 63 -

STATE OF ARIZONA NOTES TO THE FINANCIAL STATEMENTS INDEX
- 64 -
Page Note 1. Summary of Significant Accounting Policies --------- 65
A. Reporting Entity ------------------------------------- 65 B. Basis of Presentation -------------------------------- 70 C. Measurement Focus and Basis of
Accounting ----------------------------------------- 71 D. Deposits and Investments -------------------------- 72 E. Taxes Receivable ------------------------------------ 73 F. Inventories ------------------------------------------- 73 G. Capital Assets ---------------------------------------- 73 H. Deferred Outflows of Resources ------------------ 74 I. Investment Earnings -------------------------------- 74 J. Scholarship Allowances ---------------------------- 74 K. Unearned Revenue ---------------------------------- 75 L. Compensated Absences ---------------------------- 75 M. Long-Term Obligations ---------------------------- 75 N. Deferred Inflows of Resources -------------------- 75 O. Net Position/Fund Balances------------------------ 75 P. New Accounting Pronouncements --------------- 77
Note 2. Deposits and Investments -------------------------------- 77 A. Deposits and Investment Policies ----------------- 77 B. Custodial Credit Risk –
Deposits and Investments ------------------------ 79 C. Interest Rate Risk ----------------------------------- 79 D. Credit Risk ------------------------------------------- 82 E. Concentration of Credit Risk ---------------------- 83 F. Foreign Currency Risk ----------------------------- 83 G. Securities Lending ---------------------------------- 84 H. Derivatives ------------------------------------------ 86 I. State Treasurer’s Separately Issued
Financial Statements ------------------------------ 90
Note 3. Receivables/Deferred Outflows and Inflows of Resources/Unearned Revenue ----------- 90
A. Taxes Receivable ----------------------------------- 90 B. Deferred Outflows of Resources and Deferred
Inflows of Resources ----------------------------- 90 C. Unearned Revenue ---------------------------------- 91
Note 4. Capital Assets --------------------------------------------- 92
Note 5. Pension Benefits ----------------------------------------- 93 A. Participating Employers ---------------------------- 93 B. Contributions, Benefits, and Refund Payments ---------------------------------- 93 C. Funding Policy -------------------------------------- 93 D. Annual Pension Cost ------------------------------- 94 E. Funded Status and Funding Progress ------------- 95 F. Actuarial Methods and Assumptions ------------- 95 G. Universities’ Retirement Plans -------------------- 95
Note 6. Other Post-Employment Benefits ----------------------- 96
A. Plan Description------------------------------------- 96
Page B. Contributions, Benefits, and Refund
Payments -------------------------------------- 97 C. Funding Policy ---------------------------------- 97 D. Annual OPEB Cost ----------------------------- 97 E. Funded Status and Funding Progress -------- 98 F. Actuarial Methods and Assumptions -------- 98
Note 7. Long-Term Obligations------------------------------ 99 A. Revenue Bonds --------------------------------- 99 B. Grant Anticipation Notes --------------------- 104 C. Certificates of Participation ------------------ 105 D. Leases ------------------------------------------- 109 E. Compensated Absences ----------------------- 110 F. Changes in Long-Term Obligations --------- 110
Note 8. Interfund Transactions ----------------------------- 111
Note 9. Accounting Changes ------------------------------- 112 A. Fund Financial Statements ------------------- 112 B. Government-wide Financial Statements ---- 112
Note 10. Governmental Fund Balances --------------------- 113
Note 11. Fund Deficit ----------------------------------------- 113 A. Risk Management Fund (RMF) ------------- 113 B. Retiree Accumulated
Sick Leave Fund (RASL) ------------------ 113
Note 12. Joint Ventures --------------------------------------- 114 A. Large Binocular Telescope Corporation ---- 114 B. Giant Magellan Telescope Organization --- 114
Note 13. Commitments, Contingencies, and Compliance ---------------------------------- 114
A. Insurance Losses ------------------------------- 114 B. Litigation --------------------------------------- 116 C. Accumulated Sick Leave --------------------- 116 D. Unclaimed Property --------------------------- 117 E. Construction Commitments ------------------ 117 F. Arizona State Lottery ------------------------- 117
Note 14. Tobacco Settlement -------------------------------- 117
Note 15. Subsequent Events --------------------------------- 118
Note 16. Discretely Presented Component Unit Disclosures ---------------------------------------- 118
A. Summary of Significant Accounting Policies ---------------------------------------- 118
B. Deposits and Investments -------------------- 120 C. Program Loans --------------------------------- 122 D. Pledges Receivable ---------------------------- 122 E. Direct Financing Lease Agreements -------- 123 F. Capital Assets ---------------------------------- 124 G. Long-Term Obligations ----------------------- 124 H. Conduit Debt ----------------------------------- 127 I. Subsequent Events ---------------------------- 128
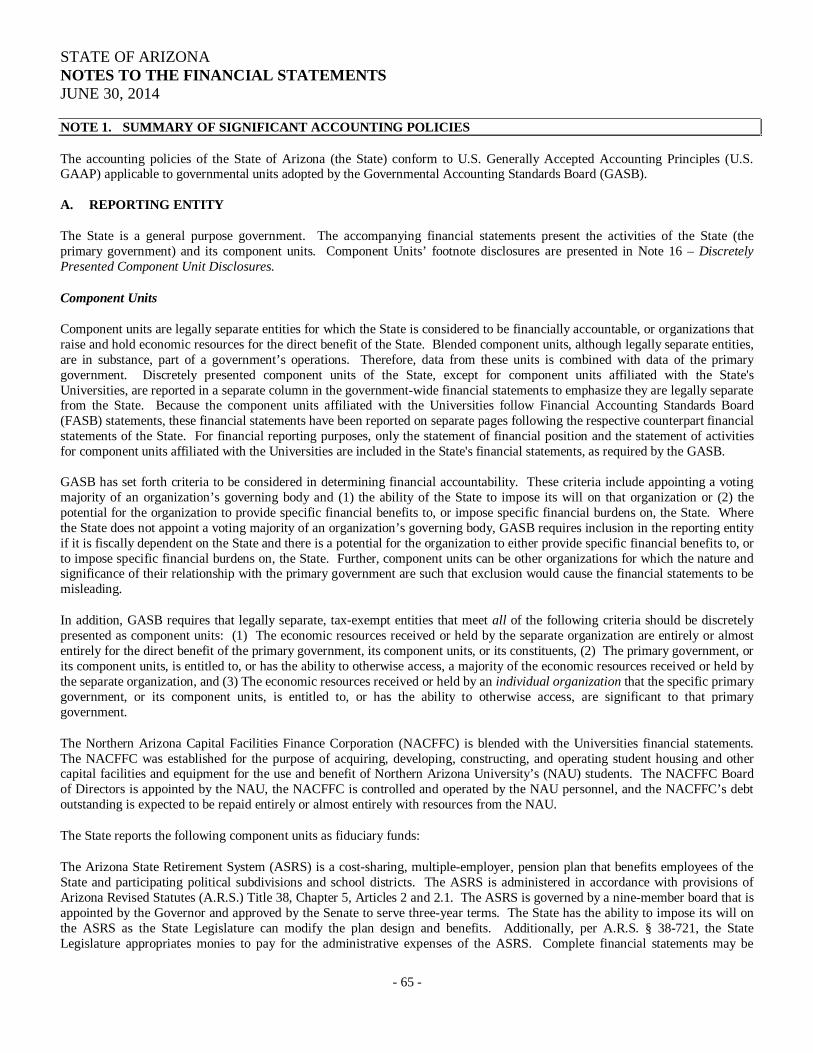
STATE OF ARIZONA NOTES TO THE FINANCIAL STATEMENTS JUNE 30, 2014
- 65 -
NOTE 1. SUMMARY OF SIGNIFICANT ACCOUNTING POLICIES The accounting policies of the State of Arizona (the State) conform to U.S. Generally Accepted Accounting Principles (U.S. GAAP) applicable to governmental units adopted by the Governmental Accounting Standards Board (GASB). A. REPORTING ENTITY
The State is a general purpose government. The accompanying financial statements present the activities of the State (the primary government) and its component units. Component Units’ footnote disclosures are presented in Note 16 – Discretely Presented Component Unit Disclosures.
Component Units
Component units are legally separate entities for which the State is considered to be financially accountable, or organizations that raise and hold economic resources for the direct benefit of the State. Blended component units, although legally separate entities, are in substance, part of a government’s operations. Therefore, data from these units is combined with data of the primary government. Discretely presented component units of the State, except for component units affiliated with the State's Universities, are reported in a separate column in the government-wide financial statements to emphasize they are legally separate from the State. Because the component units affiliated with the Universities follow Financial Accounting Standards Board (FASB) statements, these financial statements have been reported on separate pages following the respective counterpart financial statements of the State. For financial reporting purposes, only the statement of financial position and the statement of activities for component units affiliated with the Universities are included in the State's financial statements, as required by the GASB. GASB has set forth criteria to be considered in determining financial accountability. These criteria include appointing a voting majority of an organization’s governing body and (1) the ability of the State to impose its will on that organization or (2) the potential for the organization to provide specific financial benefits to, or impose specific financial burdens on, the State. Where the State does not appoint a voting majority of an organization’s governing body, GASB requires inclusion in the reporting entity if it is fiscally dependent on the State and there is a potential for the organization to either provide specific financial benefits to, or to impose specific financial burdens on, the State. Further, component units can be other organizations for which the nature and significance of their relationship with the primary government are such that exclusion would cause the financial statements to be misleading.
In addition, GASB requires that legally separate, tax-exempt entities that meet all of the following criteria should be discretely presented as component units: (1) The economic resources received or held by the separate organization are entirely or almost entirely for the direct benefit of the primary government, its component units, or its constituents, (2) The primary government, or its component units, is entitled to, or has the ability to otherwise access, a majority of the economic resources received or held by the separate organization, and (3) The economic resources received or held by an individual organization that the specific primary government, or its component units, is entitled to, or has the ability to otherwise access, are significant to that primary government.
The Northern Arizona Capital Facilities Finance Corporation (NACFFC) is blended with the Universities financial statements. The NACFFC was established for the purpose of acquiring, developing, constructing, and operating student housing and other capital facilities and equipment for the use and benefit of Northern Arizona University’s (NAU) students. The NACFFC Board of Directors is appointed by the NAU, the NACFFC is controlled and operated by the NAU personnel, and the NACFFC’s debt outstanding is expected to be repaid entirely or almost entirely with resources from the NAU.
The State reports the following component units as fiduciary funds:
The Arizona State Retirement System (ASRS) is a cost-sharing, multiple-employer, pension plan that benefits employees of the State and participating political subdivisions and school districts. The ASRS is administered in accordance with provisions of Arizona Revised Statutes (A.R.S.) Title 38, Chapter 5, Articles 2 and 2.1. The ASRS is governed by a nine-member board that is appointed by the Governor and approved by the Senate to serve three-year terms. The State has the ability to impose its will on the ASRS as the State Legislature can modify the plan design and benefits. Additionally, per A.R.S. § 38-721, the State Legislature appropriates monies to pay for the administrative expenses of the ASRS. Complete financial statements may be

STATE OF ARIZONA NOTES TO THE FINANCIAL STATEMENTS JUNE 30, 2014
- 66 -
obtained from the ASRS’s administrative office at P.O. Box 33910, Phoenix, AZ 85067-3910, (602) 240-2000, or its website at www.azasrs.gov.
The Public Safety Personnel Retirement System (PSPRS) is an agent, multi-employer public employee retirement system that benefits public safety employees of certain State and local governments. The PSPRS is jointly administered by the Board of Trustees (formerly Fund Manager) and 237 local boards according to the provisions of A.R.S. Title 38, Chapter 5, Article 4. The Board of Trustees is a seven-member board appointed by the Governor and approved by the Senate to serve a fixed five-year term. The State has the ability to impose its will on the PSPRS as the State Legislature can modify the plan design and benefits. Each eligible group participating in the system has a five-member local board. In general, all members serve a fixed four-year term. Complete financial statements may be obtained from the PSPRS’s administrative office at 3010 East Camelback Road, Suite 200, Phoenix, AZ 85016-4416, (602) 255-5575, or its website at www.psprs.com.
The Elected Officials’ Retirement Plan (EORP) is a cost-sharing, multi-employer public employee retirement plan that benefits elected officials and judges of certain State, county, and local governments. The Board of Trustees (formerly Fund Manager) of the PSPRS administers the EORP plan according to the provisions of A.R.S. Title 38, Chapter 5, Article 3. The State has the ability to impose its will on the EORP as the State Legislature can modify the plan design and benefits. Complete financial statements may be obtained from the PSPRS’s administrative office at 3010 East Camelback Road, Suite 200, Phoenix, AZ 85016-4416, (602) 255-5575, or its website at www.psprs.com.
The Corrections Officer Retirement Plan (CORP) is a multiple-employer public employee retirement plan that benefits prison and jail employees of certain state, county and local governments. CORP includes a cost-sharing multiple-employer plan for Administrative Office of the Courts (AOC) probation officers and an agent multiple-employer plan for all other members. The Board of Trustees (formerly Fund Manager) of the PSPRS, 26 local boards of the CORP, and 15 local boards of the AOC administer the plans according to the provisions of A.R.S. Title 38, Chapter 5, Article 6. The State has the ability to impose its will on the CORP and AOC as the State Legislature can modify the plans’ design and benefits. Complete financial statements may be obtained from the PSPRS’s administrative office at 3010 East Camelback Road, Suite 200, Phoenix, AZ 85016-4416, (602) 255-5575, or its website at www.psprs.com. The State reports the following discretely presented component units:
Major Component Units:
University of Arizona Health Network and Subsidiaries (UAHN) – The UAHN, an Arizona not-for-profit corporation, controls the University Medical Center Corporation and subsidiaries (UMC) and University Physicians Healthcare and subsidiaries (UPH). The UAHN is comprised of (i) a Hospital Division, which encompasses the University of Arizona Medical Center – University Campus, the University of Arizona Medical Center – South Campus, and more than 40 physician offices and clinics across southern Arizona, (ii) a faculty-physician Practice Plan Division known as the University of Arizona Physicians, which is the practice plan of the faculty-physicians of the University of Arizona College of Medicine, (iii) a Health Plans Division known as the University of Arizona Health Plans, which offers health care insurance plans, and (iv) the University Medical Center Foundation, which provides philanthropic support to the UAHN. The UAHN is governed by a seventeen-member board of directors whose appointments are approved by the Arizona Board of Regents. The State has the ability to impose its will on the UAHN as it must approve amendments to the articles of incorporation and bylaws of the board of directors. The UAHN must also receive approval from the State prior to entering any business transaction that may adversely affect the interest of the State. Complete financial statements may be obtained in writing from the UAHN at: The University of Arizona Health Network, Attn: Administration, 1501 N. Campbell Ave., Tucson, AZ 85724.
Water Infrastructure Finance Authority (WIFA) – The WIFA is authorized to administer the Clean Water Revolving Fund. The Clean Water Revolving Fund was created pursuant to the Federal Water Pollution Control Act, which required the State to establish the Clean Water Revolving Fund to accept federal capitalization grants for publicly owned wastewater treatment projects. The WIFA has also entered into an agreement with the Environmental Protection Agency to administer the Drinking Water Revolving Fund pursuant to the Safe Drinking Water Act. The WIFA is governed by a twelve-member board of directors. The seven Governor appointed directors serve staggered terms of five years and serve at the pleasure of the Governor; thus, the State has the ability to impose its will on WIFA. Complete financial statements may be obtained from the WIFA’s administrative offices at 1110 West Washington Street, Suite 290, Phoenix, AZ 85007, (602) 364-1324.

STATE OF ARIZONA NOTES TO THE FINANCIAL STATEMENTS JUNE 30, 2014
- 67 -
Non-major Component Units:
Greater Arizona Development Authority (GADA) – The purpose of the GADA is to provide cost-effective access to capital for local communities, certain special districts, and tribal governments for public infrastructure projects. The GADA was created by an Act of the Arizona Legislature in 1997 and is a body, corporate and politic, of the State. The GADA is governed by a nine- member Board of Directors consisting of four State of Arizona agency heads and five members, one of which shall be a representative of a tribal nation in Arizona, appointed by the Governor of the State. Members appointed by the Governor serve staggered five-year terms. A financial benefit/burden relationship exists between the State and GADA as its fund was originally capitalized with General Fund appropriations and the State Legislature has swept monies from its fund over the years to balance the State’s budget. Complete financial statements may be obtained from the GADA’s administrative office at 1110 West Washington Street, Suite 290, Phoenix, AZ 85007, (602) 364-1324.
Rio Nuevo Multipurpose Facilities District (Rio Nuevo) – The Rio Nuevo was established in 1999 with the passage of Proposition 400 by the voters in the Cities of Tucson and South Tucson. Under applicable A.R.S., the District can utilize tax incremental financing to help develop multipurpose facilities in the downtown Tucson area. The Rio Nuevo is governed by a nine-member board of directors, with five members appointed by the Governor, two members appointed by the President of the Senate, and the remaining two members appointed by the Speaker of the House of Representatives. All board of directors can be removed at will; thus, the State has the ability to impose its will on Rio Nuevo. Complete financial statements may be obtained from Rio Nuevo’s administrative office at 400 West Congress, Suite 152, Tucson, AZ 85701, (520) 623-7336, or its website at rionuevo.org.
Arizona Power Authority (APA) – The APA purchases the State’s allocation of power produced at the federally owned Boulder Canyon Project hydropower plant and resells it to Arizona entities that are eligible purchasers under federal and state laws. The APA is governed by a commission of five members appointed by the Governor and approved by the Senate. The term of office of each member is six years and the members select a chairman and vice-chairman from among their membership for a term of two years. The APA is required to follow specific State policies; thus, the State has the ability to impose its will on APA. Complete financial statements may be obtained from the APA’s administrative offices at 1810 West Adams Street, Phoenix, AZ 85007-2679, (602) 368-4265.
Arizona Commerce Authority (ACA) – The ACA is charged with the following responsibilities: job creation and expansion of capital investment through business attraction, expansion and retention, including business incubation and entrepreneurship; creation, monitoring, and execution of a comprehensive economic and workforce strategy; management and administration of economic development and workforce programs; providing statewide marketing leadership; utilization of all means necessary, prudent and practical to integrate private sector-based innovation, flexibility, focus and responsiveness; and advancement of public policy to meet the State’s economic development objectives. The ACA is governed by a nineteen member board of directors consisting of the Governor serving as Chairperson, a Chief Executive Officer, and seventeen members consisting of private sector business leaders serving staggered three-year terms, of which, nine are appointed by the Governor, four are appointed by the President of the Senate, and the other four are appointed by the Speaker of the House of Representatives. A financial benefit/burden relationship exists between the State and ACA as its primary funding source is the allocated State General Fund withholding tax revenues received in each fiscal year according to A.R.S. § 43-409. Complete financial statements may be obtained from the ACA’s administrative office at 333 North Central Avenue, Suite 1900, Phoenix, AZ 85004, (602) 845-1200.
Component units of the State affiliated with the Universities are legally separate, tax-exempt organizations controlled by separate boards of directors that meet the criteria established in GASB, with the exception of Downtown Phoenix Student Housing, LLC, the ASU Preparatory Academy, Inc. (ASU Prep) – formerly known as the University Public Schools, Inc., and Campus Research Corporation (CRC). The Downtown Phoenix Student Housing, LLC is included due to the nature and significance of the financial arrangement that it has with the State and that the State believes would be misleading to exclude. The ASU Prep is included because of its close affiliation to the State and that the State believes it would be misleading to exclude. The CRC is included because the U of A approves the budget and can access its resources.

STATE OF ARIZONA NOTES TO THE FINANCIAL STATEMENTS JUNE 30, 2014
- 68 -
The following discretely presented component units of the State affiliated with the Universities are reported as major component units:
Arizona State University Foundation for a New American University (ASU Foundation) – The ASU Foundation's resources are disbursed at the discretion of the Foundation's independent board of directors, in accordance with donor directions and Foundation policy. The directors of the ASU Foundation make all decisions regarding the ASU Foundation’s business affairs, including distributions made to the ASU. The economic resources held by the ASU Foundation are significant to the ASU and are entirely for the benefit of the ASU.
Arizona Capital Facilities Finance Corporation (ACFFC) – The ACFFC provides facilities for use by students of ASU or ASU itself. A fiscal dependency and financial benefit/burden relationship exists between the ACFFC and the ASU.
University of Arizona Foundation (U of A Foundation) – The U of A Foundation supports the U of A through various fund-raising activities and contributes funds to the U of A in support of various programs. The restricted resources held by the U of A Foundation are significant to the U of A and can only be used by, or for the benefit of, the U of A or its constituents.
The following discretely presented component units of the State affiliated with the Universities are reported as non-major component units:
Arizona State University Alumni Association, Sun Angel Foundation, and Sun Angel Endowment – These three component units of the State affiliated with the Universities receive funds primarily through donations, dues, and/or affinity partners and contribute funds to ASU for support of various programs. The economic resources held by these three component units are significant to the ASU and are entirely for the benefit of the ASU.
Arizona State University Research Park, Inc. (ASU Research Park) – ASU Research Park manages a research park to promote and support research activities in coordination with ASU. In developing the research park, bonds were issued that are guaranteed by ASU. A fiscal dependency and financial benefit/burden relationship exists between the ASU Research Park and the ASU.
Downtown Phoenix Student Housing, LLC – This component unit of the State affiliated with the Universities provides housing facilities for use by students of the ASU.
ASU Prep – The ASU Prep prepares Arizona K-12 students for success with a university-embedded academic program that empowers them to complete college, compete globally, and contribute to their communities.
University of Arizona Alumni Association (U of A Alumni Association) – The U of A Alumni Association was established to serve the U of A and its graduates, former students, and friends by attracting, organizing, and encouraging them to advance the U of A's missions - teaching, research, and public service. The economic resources held by the U of A Alumni Association are significant to the U of A and are entirely or almost entirely for the benefit of the U of A.
University of Arizona Law College Association (Law Association) – The Law Association was established to provide support and financial assistance to the College of Law at the U of A. The Law Association funds provide support to the College on many levels, from endowed student scholarships to named faculty professorships. The economic resources held by the Law Association are significant to the U of A and are entirely or almost entirely for the benefit of the U of A.
University of Arizona Campus Research Corporation (CRC) – The CRC was established to assist the U of A in the acquisition, improvement, and operation of the U of A Science and Technology Park (Park) and related properties. The CRC currently leases from the U of A the remaining 67% of building space of the Park not leased to the Arizona Research Park Authority. The CRC is responsible for assisting in the development of the presently undeveloped portions of the Park and for subleasing unoccupied space, newly developed space, and space now occupied by IBM or its subtenants once the current subleases expire. The U of A is responsible for payment of operational expenses associated with the space occupied by the U of A departments, offices, and programs.
University of Arizona Eller Executive Education (EEE) – The EEE was established to advance the missions of the Eller College of Management and the U of A through noncredit, non-degree programs for business, government, and nonprofit leaders. The U

STATE OF ARIZONA NOTES TO THE FINANCIAL STATEMENTS JUNE 30, 2014
- 69 -
of A president appoints all EEE board members and can remove any member at will; thus, the U of A can impose its will on the EEE.
Northern Arizona University Foundation, Inc. (NAU Foundation) – The NAU Foundation receives gifts and bequests, administers and invests securities and property, and disburses payments to and on behalf of NAU for advancement of its mission. The restricted resources of the NAU Foundation can only be used by, or for the benefit of NAU or its constituents.
Complete financial statements for each of the aforementioned component units, except for the U of A Foundation, may be obtained as follows:
ASU Foundation, ACFFC, ASU Alumni Association, Sun Angel Foundation, Sun Angel Endowment, ASU Research Park, LLC, Downtown Phoenix Student Housing, LLC, and the ASU Prep – contact ASU Financial Services at (480) 965-3601
U of A Alumni Association – Alumni Association, The University of Arizona, P.O. Box 210109, Tucson, AZ 85721-0109
Law Association – Law College Association, James E. Rogers College of Law at the University of Arizona, 1201 E. Speedway Blvd., Tucson, AZ 85721-0176
CRC – The University of Arizona Science and Technology Park, 9070 South Rita Road, Suite 1750, Tucson, AZ 85747
EEE – Eller Executive Education, 405 McClelland Hall, Tucson, AZ 85721
NAU Foundation and NACFFC – Northern Arizona University, Comptroller's Office, P.O. Box 4069, Flagstaff, AZ 86011
The financial statements of the U of A Foundation are not publicly available. For information regarding the U of A Foundation's financial statements, contact the U of A Comptroller at the following address: University of Arizona, Financial Services, 1303 E. University Blvd., Box 4, Tucson, AZ 85719-0521.
Related Organizations
Related organizations are legally separate entities for which the State is not considered to be financially accountable, and that do not meet the criteria established by GASB for inclusion. The State’s accountability for these organizations does not extend beyond making the appointments, nor are the economic resources accessible to the State. As a result, financial activity for the organizations described below is not included in the State’s financial statements.
Arizona Health Facilities Authority (the Authority) – A.R.S. § 36-482 established the Authority to issue tax-exempt bonds and loans for the purpose of improving health care for Arizona residents by providing less expensive financing for health care facilities. Proceeds from bond issues are loaned to various qualifying nonprofit health care organizations. The health care organizations reimburse the Authority for expenses for issuance of the bonds, pay fees of the Authority, and make payments under the loans for the benefit of the holders of the bonds. The Authority is governed by a seven-member board of directors that is appointed by the Governor and approved by the Senate. The directors serve staggered terms of seven years, and can be removed for cause or at will by the Governor with the consent of the Senate. The State cannot abrogate the rights of the Authority until all bonds, together with the interest thereon, are fully paid and discharged and all agreements are fully performed.
Arizona International Development Authority (the Authority) – A.R.S. § 41-4502 established the Authority to facilitate the development of international trade or commerce between Arizona and other countries. The Authority is governed by a seven-member board of directors appointed by the Governor and approved by the Senate for five-year terms, and can be removed only for cause.
Arizona Sports and Tourism Authority (the Authority) – A.R.S. § 5-802 established the Authority to construct, finance, furnish, maintain, improve, operate, market, and promote the use of a multipurpose facility and do all things necessary or convenient to accomplish those purposes. The Authority may issue revenue bonds in such principal amounts to accomplish the above stated purposes. The Authority is governed by a nine-member board of directors of which five are appointed by the Governor and approved by the Senate and two members each by the President of the Senate and the Speaker of the House. The directors serve terms of five years, may be re-appointed for one full subsequent term, and can be removed only for cause.

STATE OF ARIZONA NOTES TO THE FINANCIAL STATEMENTS JUNE 30, 2014
- 70 -
Arizona Housing Finance Authority (the Authority) – A.R.S. § 41-3902 established the Authority to issue bonds for residential dwelling units and multifamily residential rental projects in rural areas. The Authority may also establish mortgage credit certificate programs to finance residential dwelling units in rural areas. The Authority shall notify a city, town, county, tribal government, or existing corporation (as defined in A.R.S. § 35-701) that a multifamily residential rental project is planned for its jurisdiction and, before proceeding, shall obtain written consent from the governing body of the city, town, county, or tribal government. The Authority is governed by a seven-member board of directors that is appointed by the Governor and approved by the Senate. The directors serve terms of seven years, and can be removed only for cause.
Joint Ventures
As described in Note 12, the U of A participates in joint ventures. In accordance with U.S. GAAP, the financial activities of these joint ventures are not included in the State’s financial statements.
B. BASIS OF PRESENTATION
The basic financial statements include both government-wide statements and fund financial statements. The government-wide statements focus on the State as a whole, while the fund financial statements focus on major funds. Each presentation provides valuable information that can be analyzed and compared between years and between governments to enhance the usefulness of the information.
Government-wide statements provide information about the primary government and its component units. The statements include a statement of net position and a statement of activities. These statements report the financial activities of the overall government, except for fiduciary activities. They also distinguish between the governmental and business-type activities of the State and between the State and its discretely presented component units. Governmental activities generally are financed through taxes and intergovernmental revenues. Business-type activities are financed in whole or in part by fees charged to external parties.
The Statement of Net Position presents the State’s assets, deferred outflows of resources, liabilities, deferred inflows of resources, and net position. The total of assets and deferred outflows of resources, minus the total of liabilities and deferred inflows of resources, is reported as net position. Both the governmental and business-type activities are presented on a consolidated basis by column.
The Statement of Activities presents a comparison between direct expenses and program revenues for each function of the State’s governmental activities, and its different business-type activities. Direct expenses are those that are specifically associated with a program or function and, therefore, are clearly identifiable to a particular program or function. The State does not allocate indirect expenses to programs or functions.
Program revenues include:
i charges to customers or applicants for goods, services, privileges provided, and fines or forfeitures i operating grants and contributions i capital grants and contributions, including special assessments
Revenues that are not classified as program revenues, including internally dedicated resources and all taxes, are reported as general revenues.
Interfund balances have been eliminated from the government-wide financial statements to the extent that they occur within either the governmental or business-type activities. Balances between governmental and business-type activities are presented as internal balances and are eliminated in the total column. Revenues and expenses associated with reciprocal transactions within governmental or within business-type activities have not been eliminated.
Fund financial statements provide information about the State’s funds, including fiduciary funds. Separate statements are presented for the governmental, proprietary, and fiduciary fund categories. The emphasis of fund financial statements is on major governmental and enterprise funds, each displayed in a separate column. All remaining governmental and enterprise funds are aggregated and reported as non-major funds. Fiduciary funds are aggregated and reported by fund type.

STATE OF ARIZONA NOTES TO THE FINANCIAL STATEMENTS JUNE 30, 2014
- 71 -
Proprietary fund operating revenues, such as charges for services, result from exchange transactions associated with the principal activity of the fund. Exchange transactions are those in which each party receives and gives up essentially equal values. Operating expenses include the cost of sales and services, administrative expenses, and depreciation on capital assets. All revenues and expenses not meeting this definition are reported as non-operating revenues and expenses.
The State reports the following major governmental funds:
The General Fund – is the State’s primary operating fund. It accounts for all financial resources of the general government, except those required to be accounted for in another fund.
The Transportation and Aviation Planning, Highway Maintenance and Safety Fund – accounts for all financial transactions applicable to the general operations of the Arizona Department of Transportation (ADOT). The ADOT builds and maintains the State’s highway system and the Grand Canyon Airport. The fund primarily receives revenues from motor vehicle and fuel taxes and federal grants.
The Land Endowments Fund – holds lands granted to the State by the Federal government for the benefit of public schools and other public institutions. Principal is maintained intact and investment earnings and lease revenues are distributed to beneficiaries in accordance with State statute.
The State reports the following major enterprise funds:
The Universities – account for transactions of the State’s three universities, which comprise the State’s university system.
The Industrial Commission Special Fund (Special Fund) – accounts for the payment of workers’ compensation claims that are not covered by the Risk Management Division of the Department of Administration, private insurance carriers, and self-insured employers.
Additionally, the State reports the following fund types:
Internal Service Funds – account for insurance coverage, employee benefits, automotive maintenance and operation, highway equipment rentals, and data processing and telecommunication services provided to State agencies on a cost-reimbursement basis. It is the policy of the State to classify immaterial proprietary fund activities in governmental funds. This policy helps to reduce the number of funds reported in the financial statements to the minimum amount needed. These funds allocate a fixed rate payroll processing charge among all agencies, allocate postage and mailing costs among all agencies, or arrange for the sale of the State’s office equipment and motorized vehicles at public auctions.
Pension and Other Employee Benefit Trust Funds – account for the activities of the ASRS, the PSPRS, the EORP, and the CORP, for which the State acts as a trustee. These retirement and other post-employment benefit plans accumulate resources to pay pension, health insurance premium subsidies, and long-term disability benefits of State employees and employees of other governmental entities participating in the plans.
Investment Trust Funds – account for transactions by local governments and political subdivisions that elect to participate in the State Treasurer’s investment pools. The Treasurer acts as trustee for the original deposits made into the investment pools.
Agency Funds – account for the receipt and disbursement of various taxes, deposits, deductions, and property collected by the State.
C. MEASUREMENT FOCUS AND BASIS OF ACCOUNTING
The government-wide, proprietary fund, and fiduciary fund financial statements are presented using the economic resources measurement focus and the accrual basis of accounting. However, the agency funds are custodial in nature and do not have a measurement focus. Revenues are recorded when earned and expenses are recorded at the time liabilities are incurred, regardless of when the related cash flows take place. Grants and donations are recognized as revenues as soon as all eligibility requirements the provider imposed have been met.

STATE OF ARIZONA NOTES TO THE FINANCIAL STATEMENTS JUNE 30, 2014
- 72 -
Governmental funds in the fund financial statements are reported using the current financial resources measurement focus and the modified accrual basis of accounting. Under this method, revenues are recognized when measurable and available. The State considers all revenues reported in the governmental funds to be available if the revenues are collected within 31 days after year-end, except for the Department of Economic Security (DES) revenue, reported in the General Fund, and the Transportation and Aviation Planning, Highway Maintenance and Safety Major Fund, as well as certain non-major governmental funds administered by the DES and the ADOT, which consider revenues to be available if collected within 60 days after year-end. Those revenues susceptible to accrual are federal reimbursements, highway user revenue tax, and state sales tax. Expenditures are recorded when the related fund liability is incurred, except for principal and interest on long-term debt, claims and judgments, and compensated absences, which are recognized as expenditures to the extent they are due and payable. General capital asset acquisitions are reported as expenditures in governmental funds. Proceeds of long-term debt and acquisitions under capital leases are reported as other financing sources.
When an expense is incurred for purposes for which restricted and unrestricted net position are available, the State considers restricted and unrestricted amounts to have been spent in that order.
D. DEPOSITS AND INVESTMENTS
1. Cash and Cash Equivalents
On the Statement of Cash Flows, the amount reported as “Cash and Cash Equivalents” is equal to the total of the amounts on the Statement of Net Position (unrestricted/restricted) “Cash”, “Cash with U.S. Treasury”, “Cash and pooled investments with State Treasurer”, “Cash held by trustee” and “Collateral investment pool”. For purposes of the Statement of Cash Flows, the State considers only those highly liquid debt instruments with an original maturity of ninety days or less to be cash equivalents.
i Cash (not with State Treasurer) – includes un-deposited receipts, petty cash, bank accounts, non-negotiable certificates of deposit, and demand deposits with banking institutions other than the State Treasurer.
i Cash with U.S. Treasury – consists of unemployment compensation contributions from Arizona employers that are deposited in a trust fund maintained by the United States Treasury.
i Cash and pooled investments with State Treasurer – consists of a centralized management of most State cash resources maintained by the State Treasurer. From the perspective of the various State funds, the pool functions as both a cash management pool and a demand deposit account. The operations and investments of the State Treasurer’s pooled investments are described in Note 2.
i Cash held by trustee – consists of capital projects and bond debt service funds invested by the trustee in accordance with the applicable financing indenture, generally limited to United States Treasury securities and other Federal agency securities, certificates of deposit, commercial paper, and money market funds.
i Collateral investment pool – consists of cash received as collateral on securities lending transactions and investments made with that cash. The State records the collateral received as an asset. A corresponding liability is also recorded for such securities lending transactions.
2. Investment Valuation
Investments maintained by the State Treasurer are reported at fair value using State Street prices, as determined by independent, industry recognized data vendors who provide values that are either exchange based or matrix based. Equities are priced utilizing the primary exchange closing price. All bonds are priced using an evaluated bid, except securities with a remaining maturity of 90 days or less are priced at amortized cost (amortizing premium/accreting discount on a straight-line to maturity method). The evaluated bid is based on a compilation of primary observable market information or a broker quote in a non-active market.
The ASRS’ publicly traded investments are reported at fair value determined by the custodial agents. The agents’ determination of fair values includes, among other things, using pricing services or prices quoted by independent brokers at current exchange rates. ASRS’ derivative instruments, which consist of futures, forward contracts, options, swaps, rights, and warrants, are measured at fair value. Changes in fair values of derivative instruments are reported as net increase (decrease) in fair value of

STATE OF ARIZONA NOTES TO THE FINANCIAL STATEMENTS JUNE 30, 2014
- 73 -
investments. The fair value of limited partnership investments are based on estimated current values and accepted industry practice. Fair value is based on estimates and assumptions from information and representations provided by the respective general partners, in the absence of readily ascertainable market values. Short-term investments are reported at cost plus accrued interest, which approximates fair value. For investments where no readily ascertainable fair value exists, the ASRS, in consultation with its investment advisors, has determined the fair values for the individual investments based on anticipated maturity dates and current interest rates commensurate with the investment’s degree of risk. Interest income is recorded on the accrual basis and dividends are recorded on the ex-dividend date. Security transactions and any resulting gains or losses are accounted for on a trade date basis.
For the PSPRS, the EORP, and the CORP, investments are reported at fair market value. Short term investments are reported at cost plus accrued interest. Equity securities are valued at the last reported sales price. Fixed income securities are valued using the last reported sales price or the estimated fair market value as determined by the fixed income broker/dealers plus accrued interest. Investments in hedge funds are valued monthly at the last reported valuations. Limited partnership investments in credit opportunities, private equity, real assets, and real estate are valued on a quarterly or monthly basis at last reported valuations adjusted by any subsequent cash flows. Investment income is recognized as earned.
E. TAXES RECEIVABLE
Taxes receivable include amounts owed by taxpayers for prior periods including assessments for underpayments, penalties, and interest. In the government-wide financial statements, a corresponding amount is recorded as revenue using the accrual basis of accounting. In the governmental fund financial statements, revenue is recorded using the modified accrual basis of accounting. The remainder is recorded as deferred inflows of resources.
The income tax receivable is composed of individual and corporate estimated payments, withholding payments, and payments with final returns and assessments that relate to income earned through June 30, 2014. Sales and motor vehicle and fuel tax receivables represent amounts that are earned by the State in the fiscal period ended June 30, 2014, but not collected until the following month.
F. INVENTORIES
Inventories consist of expendable supplies held for consumption in all funds and merchandise intended for sale to customers in the proprietary funds. Inventories are stated at cost using the first-in, first-out method, weighted average, or lower of cost or market. In the governmental funds, inventories are accounted for using the consumption method. Under this method, inventories are recorded as expenditures as they are used.
G. CAPITAL ASSETS
Capital assets are stated at cost at the date of acquisition or, if donated, at the appraised or estimated fair market value at the date received. Interest incurred during the construction of capital assets is only capitalized in the proprietary funds.
Most capital assets are depreciated over their estimated useful lives. However, the State reports most infrastructure assets using the modified approach, as provided by the GASB. Under this approach, rather than being depreciated, costs to maintain and preserve these assets are expensed. This approach is discussed further in the Required Supplementary Information portion of this report. The State has adopted a general policy for capitalization thresholds, depreciation, and estimated useful lives of capital assets. In addition, the State has approved alternative policies for some State agencies.
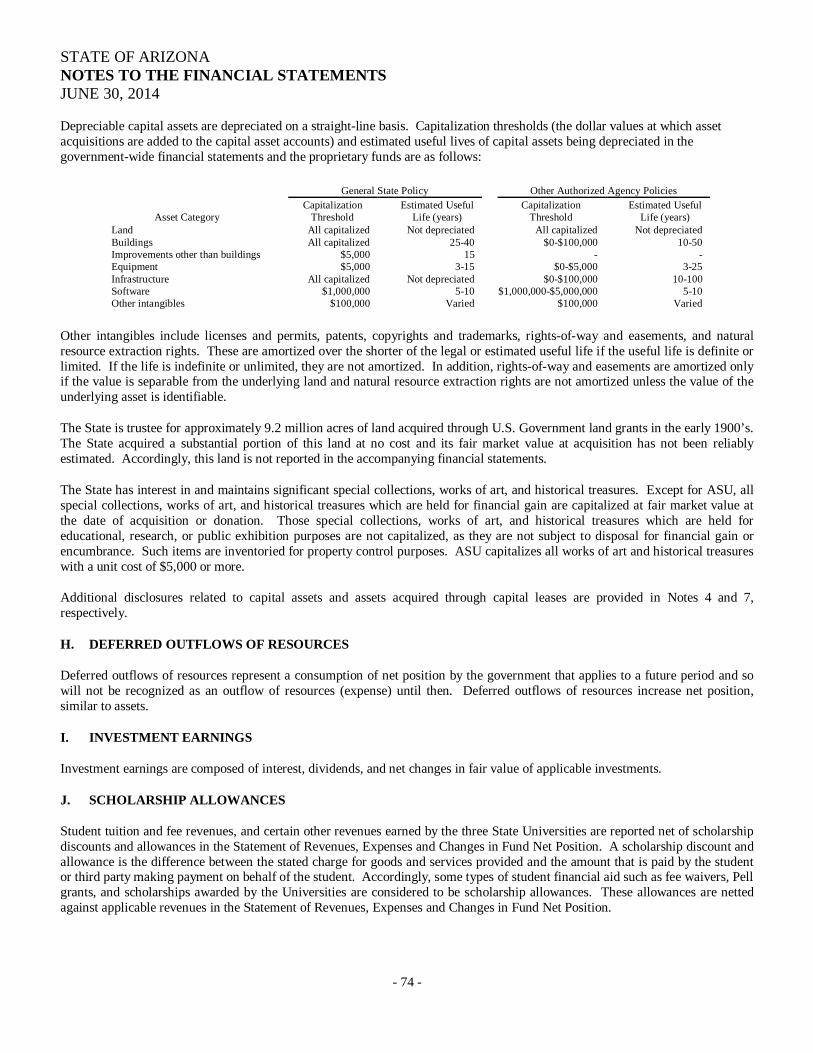
STATE OF ARIZONA NOTES TO THE FINANCIAL STATEMENTS JUNE 30, 2014
- 74 -
Depreciable capital assets are depreciated on a straight-line basis. Capitalization thresholds (the dollar values at which asset acquisitions are added to the capital asset accounts) and estimated useful lives of capital assets being depreciated in the government-wide financial statements and the proprietary funds are as follows:
Other intangibles include licenses and permits, patents, copyrights and trademarks, rights-of-way and easements, and natural resource extraction rights. These are amortized over the shorter of the legal or estimated useful life if the useful life is definite or limited. If the life is indefinite or unlimited, they are not amortized. In addition, rights-of-way and easements are amortized only if the value is separable from the underlying land and natural resource extraction rights are not amortized unless the value of the underlying asset is identifiable.
The State is trustee for approximately 9.2 million acres of land acquired through U.S. Government land grants in the early 1900’s. The State acquired a substantial portion of this land at no cost and its fair market value at acquisition has not been reliably estimated. Accordingly, this land is not reported in the accompanying financial statements.
The State has interest in and maintains significant special collections, works of art, and historical treasures. Except for ASU, all special collections, works of art, and historical treasures which are held for financial gain are capitalized at fair market value at the date of acquisition or donation. Those special collections, works of art, and historical treasures which are held for educational, research, or public exhibition purposes are not capitalized, as they are not subject to disposal for financial gain or encumbrance. Such items are inventoried for property control purposes. ASU capitalizes all works of art and historical treasures with a unit cost of $5,000 or more.
Additional disclosures related to capital assets and assets acquired through capital leases are provided in Notes 4 and 7, respectively.
H. DEFERRED OUTFLOWS OF RESOURCES
Deferred outflows of resources represent a consumption of net position by the government that applies to a future period and so will not be recognized as an outflow of resources (expense) until then. Deferred outflows of resources increase net position, similar to assets.
I. INVESTMENT EARNINGS
Investment earnings are composed of interest, dividends, and net changes in fair value of applicable investments.
J. SCHOLARSHIP ALLOWANCES
Student tuition and fee revenues, and certain other revenues earned by the three State Universities are reported net of scholarship discounts and allowances in the Statement of Revenues, Expenses and Changes in Fund Net Position. A scholarship discount and allowance is the difference between the stated charge for goods and services provided and the amount that is paid by the student or third party making payment on behalf of the student. Accordingly, some types of student financial aid such as fee waivers, Pell grants, and scholarships awarded by the Universities are considered to be scholarship allowances. These allowances are netted against applicable revenues in the Statement of Revenues, Expenses and Changes in Fund Net Position.
General State Policy Other Authorized Agency Policies
Asset Category Capitalization
Threshold Estimated Useful
Life (years) Capitalization
Threshold Estimated Useful
Life (years) Land All capitalized Not depreciated All capitalized Not depreciated Buildings All capitalized 25-40 $0-$100,000 10-50 Improvements other than buildings $5,000 15 - - Equipment $5,000 3-15 $0-$5,000 3-25 Infrastructure All capitalized Not depreciated $0-$100,000 10-100 Software $1,000,000 5-10 $1,000,000-$5,000,000 5-10 Other intangibles $100,000 Varied $100,000 Varied

STATE OF ARIZONA NOTES TO THE FINANCIAL STATEMENTS JUNE 30, 2014
- 75 -
K. UNEARNED REVENUE
In the government-wide, governmental fund, and proprietary fund financial statements, unearned revenue is recorded when cash, receivables, or other assets are received prior to their being earned.
L. COMPENSATED ABSENCES
In the government-wide and proprietary fund financial statements, the State accrues liabilities for compensated absences as required by the GASB. In the governmental fund financial statements, liabilities for compensated absences are not accrued, because they are not considered due and payable.
In general, State employees accrue vested annual leave at a variable rate based on years of service. Except for uncovered State employees and University employees, an employee generally forfeits accumulated annual leave in excess of 240 hours as of the last day of the last pay period for a calendar year, unless the Director of the Department of Administration authorizes an exception. Uncovered State employees shall forfeit accumulated annual leave in excess of 320 hours as of the end of each calendar year, unless an exception is authorized. University employees may accumulate up to 264 hours of vacation, and any vacation hours in excess of the maximum amount that are unused at December 31 are forfeited. Except for University employees, an employee who separates from State service is paid for all unused and unforfeited annual leave at the employee’s rate of pay at the time of separation. University employees, upon termination of employment, are paid all unused vacation benefits not exceeding 176 hours (annual accrual amount), depending on years of service and full-time equivalent employment status.
Some employees accumulate compensatory leave for time worked over 40 hours per week. An employee may accumulate up to 240 hours of compensatory leave (480 hours if working in a public safety activity or an emergency response activity). An employee who separates from State service is paid for all unused compensatory leave at either the employee’s average base salary during the last three years of employment or final base salary, whichever is higher. For sick leave policy, see Note 13.C.
M. LONG-TERM OBLIGATIONS In the government-wide and proprietary fund financial statements, long-term debt and long-term liabilities are reported as liabilities. Amounts due within one year are reported as current liabilities, and amounts due thereafter are reported as non-current liabilities. Premiums and discounts on revenue bonds and COPs are deferred and amortized over the life of the debt instrument using the straight-line method or the effective interest method. Bonds and COPs are reported net of the applicable premium or discount.
In the fund financial statements, governmental fund types recognize proceeds from revenue bonds, COPs, other issuances, and premiums and discounts on debt as other financing sources and uses in the current period. Long-term liabilities are more fully described in Note 7.
N. DEFERRED INFLOWS OF RESOURCES
Deferred inflows of resources represent an acquisition of fund balance that applies to a future period, and so will not be recognized as an inflow of resources (revenue) until that time. Deferred inflows of resources decrease fund balance, similar to liabilities.
O. NET POSITION/FUND BALANCES
The difference between (a) assets and deferred outflows of resources and (b) liabilities and deferred inflows of resources is “Net Position” on the government-wide, proprietary, and fiduciary fund financial statements. The difference between (a) fund assets and deferred outflows of resources and (b) liabilities and deferred inflows of resources is “Fund Balance” on the governmental fund financial statements.

STATE OF ARIZONA NOTES TO THE FINANCIAL STATEMENTS JUNE 30, 2014
- 76 -
Net position is reported in three categories:
Net investment in capital assets consist of capital assets, net of accumulated depreciation and reduced by outstanding balances for bonds, notes, and other debt that are attributed to the acquisition, construction, or improvement of those assets.
Restricted net position results when constraints placed on net position use are either externally imposed by creditors, grantors, contributors, or imposed by law through constitutional provisions, voter initiatives, or court orders.
Unrestricted net position consists of net position which does not meet the definition of the two preceding categories. Unrestricted net position often has constraints on resources, which are imposed by management, but can be removed or modified.
In the governmental fund financial statements, fund balances are reported in classifications that comprise a hierarchy based primarily on the extent to which the government is bound to honor constraints on the specific purposes for which amounts in those funds can be spent. Five classifications are available for reporting fund balances:
Nonspendable fund balance includes items that cannot be spent. This includes activity that is not in a spendable form (inventories, prepaid amounts, long-term portion of loans/notes receivable, or property held for resale unless the proceeds are restricted or committed) and activity that is legally or contractually required to remain intact, such as a principal balance in a permanent fund.
Restricted fund balances have constraints placed upon the use of the resources that are either externally imposed by creditors, grantors, and contributors, or imposed by law through constitutional provisions, voter initiatives, or court orders.
Committed fund balances can be used only for specific purposes pursuant to constraints imposed by a formal action of the Arizona State Legislature, the State’s highest level of decision-making authority. This formal action is the passage of law by the Legislature, creating, modifying, or rescinding fund balance commitments.
Assigned fund balance includes amounts that are constrained by the State’s intent to be used for a specific purpose, but are neither restricted nor committed. The State does not have policies or procedures comparable to the policies that underlie this classification and, accordingly, does not report assigned fund balances.
Unassigned fund balance is the residual amount of the General Fund not included in the four categories described above. Also, any deficit fund balances within the other governmental fund types are reported as unassigned.
When an expenditure is incurred for purposes for which restricted, committed, and unassigned fund balance is available, the State considers restricted, committed, and unassigned amounts to have been spent in that order. Budget Stabilization Fund The State’s Budget Stabilization Fund (BSF) was enacted in 1990 by A.R.S. § 35-144. The BSF is administered by the State Treasurer, who is responsible for transferring General Fund money into and out of the BSF as required by law. The BSF is designed to set revenue aside during times of above-trend economic growth and to utilize this revenue during times of below-trend growth. The BSF is also known as the “Rainy Day Fund.”
There is a statutory formula to calculate the amount to be appropriated to (deposit) or transferred out (withdrawal) of the BSF. The amount is based on calculations from the Arizona Economic Estimates Commission (EEC). The EEC compares the annual growth rate of inflation adjusted Arizona personal income (AZPI) for the calendar year ending in the fiscal year to the trend growth rate of inflation adjusted AZPI for the most recent 7 years. AZPI in the BSF formula is defined as total AZPI less transfer payments, adjusted by the gross domestic product price deflator index. If the annual growth rate exceeds the trend growth rate, the “excess” percent multiplied by General Fund revenue of the prior fiscal year would equal the amount to be deposited into the BSF. If the annual growth rate of AZPI is both less than 2% and less than the trend growth rate, the deficiency when multiplied

STATE OF ARIZONA NOTES TO THE FINANCIAL STATEMENTS JUNE 30, 2014
- 77 -
by the General Fund revenue of the prior year would equal the amount to be withdrawn from the BSF. The BSF's total fund balance cannot be larger than 7% of the current year’s General Fund revenues, excluding the beginning balance. The budgets developed by the Governor and the Joint Legislative Budget Committee and submitted to the State Legislature at the start of each regular session include estimates of the amount to be appropriated to or transferred from the BSF for the upcoming budget year. The final determination of the amount is done by the EEC on June 1 of the budget year. The EEC calculations, however, do not result in any automatic deposits or withdrawals, as they must be authorized by legislative action. Additionally, by a two-thirds majority, the State Legislature, with the concurrence of the Governor, can decrease a deposit or increase a withdrawal. The BSF’s fund balance, including earnings on investments, as of June 30, 2014, was $455.3 million.
P. NEW ACCOUNTING PRONOUNCEMENTS
GASB Statement No. 65, Items Previously Reported as Assets and Liabilities. This statement establishes accounting and financial reporting standards that reclassify, as deferred outflows of resources or deferred inflows of resources, certain items that were previously reported as assets and liabilities and recognizes, as outflows of resources or inflows of resources, certain items that were previously reported as assets and liabilities. The provisions of this Statement are effective for periods beginning after December 15, 2012. The State has implemented the requirements of this standard and, as a result, beginning net position was restated for the business-type activities and component units.
GASB Statement No. 66, Technical Corrections – 2012 – an amendment of GASB Statements No. 10 and No. 62. The requirements of this Statement resolve conflicting accounting and financial reporting guidance that could diminish the consistency of financial reporting and thereby enhance the usefulness of the financial reports. The provisions of this Statement are effective for financial statements for periods beginning after December 15, 2012. The State has implemented the requirements of this standard but they had no effect on the financial statements.
GASB Statement No. 67, Financial Reporting for Pension Plans – an amendment of GASB Statements No. 25. The objective of this Statement is to improve financial reporting by state and local governmental pension plans. This Statement replaces the requirements of Statements No. 25 and No. 50 as they relate to pension plans that are administered through trusts or equivalent arrangements that meet certain criteria. This Statement is effective for financial statements for fiscal years beginning after June 15, 2013. The State has implemented the requirements of this standard but they had no effect on the financial statements.
GASB Statement No. 70, Accounting and Financial Reporting for Nonexchange Financial Guarantees. The requirements of this Statement will enhance comparability of financial statements among governments by requiring consistent reporting by those governments that extend nonexchange financial guarantees and by those governments that receive nonexchange financial guarantees. The provisions of this Statement are effective for reporting periods beginning after June 15, 2013. The State has implemented the requirements of this standard but they had no effect on the financial statements.
NOTE 2. DEPOSITS AND INVESTMENTS
A. DEPOSITS AND INVESTMENT POLICIES
The State’s deposits and investments are primarily under the control of the State Treasurer, the Retirement Systems, the Universities, and the Industrial Commission (the Commission). These entities maintain the majority of the deposits and investments of the primary government. The investment policies of these organizations are defined according to State statutes, or a governing board, or both, and are described below.
A.R.S. § 35-312, § 35-313, and § 35-314 authorize the State Treasurer to invest operating, trust, and permanent endowment fund monies. Monies deposited with the State Treasurer by State agencies are invested by the State Treasurer in a pooled fund. Any interest earned is allocated monthly into each respective fund based on average daily cash balances. There is no income from investments associated with one fund that is assigned to another fund.
The State statutes and the State Treasurer’s investment policies designed to administer these statutes restrict investments to obligations of the U.S. Government and its agencies, obligations or other evidence of indebtedness of the State and certain local

STATE OF ARIZONA NOTES TO THE FINANCIAL STATEMENTS JUNE 30, 2014
- 78 -
government subdivisions, negotiable certificates of deposit, bonds, debentures and notes issued by entities which are U.S. dollar denominated, commercial paper issued by entities which are U.S. dollar denominated, bankers acceptances, collateralized repurchase agreements, money market mutual funds, exchange traded funds, equities, and other securities. The State Treasurer is not allowed to invest in foreign investments unless the investment is denominated in U.S. dollars.
The State Treasurer maintains external investment pools [the Local Government Investment Pool (LGIP), Local Government Investment Pool - FF&C, Local Government Investment Pool – Medium Term, and Local Government Investment Pool – Medium Term FF&C]. The pools are not required to register (and are not registered) with the Securities and Exchange Commission under the 1940 Investment Advisors Act. The activity and performance of the pools are reviewed monthly by the State Board of Investment in accordance with A.R.S. § 35-311.
In September 2008, the State agencies’ and an external investment pool’s share of the Lehman Brothers bond value of $39.4 million was transferred to the Lehman Brothers Pool due to Lehman Brothers filing for Chapter 11 bankruptcy protection on September 15, 2008. The transfer was made to provide for the decline in fair value of the Lehman Brothers securities.
In December 2011, the United States Bankruptcy Court for the Southern District of New York entered an order confirming the Modified Third Amended Lehman Brothers Joint Plan of Liquidation. During the current year, approximately $4.8 million was received as payout of funds being held by the Indenture Trustee for Lehman Brothers securities. The payout received was allocated to participants based on the participant’s share balance and then transferred to the LGIP, reducing the carry or cost basis in the Lehman Brothers Pool. As of June 30, 2014, the carry or cost basis and the fair value for the Lehman Brothers Pool were $28.8 million and $5.4 million, respectively. There was a distribution in October 2014, and future distributions are generally expected every six months thereafter. The remaining amount to be recovered is unknown.
The fair value of investments is measured on a monthly basis. Participant shares are purchased and sold based on the Net Position Value (NPV) of the shares. The NPV is determined by dividing the fair value of the portfolio by the total shares outstanding. The State Treasurer does not contract with an outside insurer in order to guarantee the value of the portfolio or the price of shares redeemed.
The Central Arizona Water Conservation District is an individual investment account.
The State Treasurer’s deposits and investments disclosures include the amounts reported by the State’s component units as (unrestricted/restricted) “Cash and pooled investments with State Treasurer” in the accompanying financial statements, as applicable.
State statutes authorize the retirement systems to make investments in accordance with the “Prudent Person” rule. As such, investment management shall discharge the duties of their position with the care, skill, prudence, and diligence, under the circumstances then prevailing, that a “prudent person” acting in a like capacity and familiar with the same matters would use in the conduct of an enterprise of a like character and with like aims as that of the system.
The ASRS invests in short-term securities, obligations of the U.S. government or agencies of the U.S. government, corporate bonds, common and preferred stocks (domestic and foreign), mortgages, derivatives, commodities, real estate, private equity, and opportunistic debt and equity investments. Per A.R.S. § 38-718, no more than 80% of the ASRS’ assets may be invested at any given time in equities, measured at market value. No more than 40% of the ASRS’ assets may be in non-U.S. public investments, measured at market value. No more than 60% of the ASRS’ assets may be invested internally, measured at market value. No more than 10% of the ASRS’ assets may be invested in bonds or other evidences of indebtedness of those multinational development banks in which the U.S. is a member nation, including the International Bank for Reconstruction and Development, the African Development Bank, the Asian Development Bank, and the Inter-American Development Bank, measured at market value. Subject to the limitations noted above, the ASRS Board may authorize the ASRS Director to make investments that are designated by the ASRS Board and that do not exceed 60% of the assets of the investment account measured at cost. The ASRS Board has not formally adopted more restrictive policies for the various types of risks.
Per A.R.S. § 38-848D, § 38-803A(4), and § 38-883A(4), the PSPRS, the EORP, and the CORP, respectively, may not invest at any given time more than 80% of the combined assets of the system or other plans that the Board of Trustees manages in corporate stocks, based on cost value of such stocks irrespective of capital appreciation. In addition, the PSPRS, the EORP, and the CORP investments shall be restricted to stocks and exchange traded funds that, except for bank and insurance stocks and

STATE OF ARIZONA NOTES TO THE FINANCIAL STATEMENTS JUNE 30, 2014
- 79 -
membership interests in limited liability companies, are either: 1) listed or approved on issuance for listing on an exchange registered under the Securities Exchange Act of 1934, as amended, 2) designated or approved on notice of issuance for designation on the national market system of a national securities association registered under the Securities Exchange Act of 1934, as amended, 3) listed or approved on issuance for listing on an exchange registered under the laws of this State or any other State, 4) listed or approved on issuance for listing on an exchange registered of a foreign country with which the U.S. is maintaining diplomatic relations at the time of purchase, except that no more than 20% of the combined assets of the system or other plans that the board manages shall be invested in foreign securities, based on the cost value of the stocks irrespective of capital appreciation, or 5) an exchange traded fund that is recommended by the chief investment officer of the system, that is registered under the Investment Company Act of 1940, and that is both traded on a public exchange and based on a publicly recognized index. Not more than 5% of the combined assets of the system or other plans that the board manages shall be invested in corporate stock issued by any one corporation, other than corporate stock issued by corporations chartered by the U.S. government or corporate stock issued by a bank or insurance company. Not more than 5% of the voting stock of any one corporation shall be owned by the system and other plans that the board administers, except that this limitation does not apply to membership interests in limited liability companies.
The ABOR governs the investment policies of the Universities. The Universities are generally limited to investing their pooled operating funds in collateralized certificates of deposit and repurchase agreements, U.S. Treasury securities, Federal agency securities, investment grade corporate bonds, or in the LGIP administered by the State Treasurer. Investment of capital project funds is also governed by the financing indenture agreements. For endowment investments, ABOR policy dictates that these funds are to be invested under the direction of an investment committee designated by the president of each university. The investment committee is responsible for advising on the definition, development, and implementation of investment objectives, policies, and restrictions. However, if donors restrict the investments, ABOR policy requires the University to invest those funds separately as directed by the donor, and the individual endowments bear all changes in value.
Per A.R.S. § 23-1065, the Commission’s investment committee is responsible for prescribing investment policies and supervising the investment activities of the Commission. The Commission requires that their investment policy be responsive to the unpredictable nature of the incidence and severity of claims, the long periods over which losses may be paid, and the effect on both claims and losses of increases in treatment and rehabilitation costs. The investment committee may invest in any legal investment authorized under A.R.S. § 38-718.
B. CUSTODIAL CREDIT RISK – DEPOSITS AND INVESTMENTS
Custodial credit risk for deposits is the risk that, in the event of the failure of a depository financial institution, the deposits or collateral securities may not be recovered from an outside party. The State Treasurer’s, the Retirement Systems’, and the Universities’ deposits of State treasury monies with financial institutions are required by State statutes to be entirely covered by the Federal Depository Insurance Corporation (FDIC) or, alternatively, collateralized for amounts in excess of the amount insured. Surety collateral for the Universities and the Retirement Systems must be equal to at least 100% of the bank balance required to be collateralized (102% for the State Treasurer). Beyond this requirement, these organizations do not have a formal policy specifically addressing custodial credit risk on deposits, except for the State Treasurer. The State statutes require surety collateral for the State Treasurer to consist of either: 1) U.S. Government obligations, State obligations, or obligations of counties or municipalities within the State, 2) State Treasurer’s warrant notes, or 3) the safekeeping receipt of the financial institution accepting the deposit. As of June 30, 2014, the State had uninsured and uncollateralized deposits in the amount of $62.7 million and $14.9 million in deposits that were uninsured with collateral held by the pledging financial institution’s trust department or agent, but not in the State’s name.
Custodial credit risk for investments is the risk that, in the event of the failure of the counterparty to a transaction, the value of the investment or collateral securities that are in the possession of an outside party may not be recovered. The State does not have a formal policy in regards to custodial credit risk for investments. As of June 30, 2014, the State had $117.4 million in securities that were uninsured, not registered in the State’s name, and held by either the counterparty or counterparty’s trust department or agent, but not in the State’s name.
C. INTEREST RATE RISK
Interest rate risk is the risk that changes in interest rates will adversely affect the fair value of an investment. The State manages interest rate risk using the segmented time distribution, weighted average maturity, and effective duration methods.

STATE OF ARIZONA NOTES TO THE FINANCIAL STATEMENTS JUNE 30, 2014
- 80 -
The State Treasurer manages interest rate risk by incorporating A.R.S. limitations into their investment policy and setting forth various thresholds or parameters relating to interest rate risk in accordance with each investment pool’s portfolio structure. The State Treasurer’s policy provides either maturity or duration limitations for the various investment pools. The interest rate risk inherent in the portfolio is monitored monthly by measuring the weighted average maturity and/or duration.
The ASU’s policy for the operating funds limits the final maturity of any fixed-rate security or variable-rate security to five years from the settlement date of the purchase. The endowment funds portfolio has no such limitations. The capital projects fund’s portfolio is not limited as to the overall maturity of its investments, with the funds invested per the financing indentures to coincide with capital spending needs and debt service requirements, which are typically less than three years, with the additional limitation that certificates of deposit and commercial paper have maximum maturities of 360 days and 270 days, respectively.
The Commission approves and contracts with different investment managers of fixed income securities in order to manage the exposure to interest rate risk with each different manager focusing on different goals of yield periods or duration of maturities of their particular portion of the investment pool.
The following table presents the State Treasurer’s, the ASU’s, and the Commission’s weighted average maturity in years by investment type as of June 30, 2014 (expressed in thousands):
Weighted Average Investment Type Fair Value Maturity (in years) Asset backed securities $ 614,520 1.95 Certificates of deposit (negotiable) 207,661 0.05 Commercial mortgage backed securities 104,095 28.21 Commercial paper 1,067,517 0.10 Corporate notes & bonds 1,899,909 3.26 FDIC certificates of deposit 188,817 0.13 Government bonds 339,336 4.05 Money market mutual funds 189,580 0.07 Repurchase agreements 1,925,000 0.00 U.S. agency mortgage backed securities 1,310,155 21.22 U.S. agency mortgage backed securities – full faith 500,867 19.29 U.S. agency securities 1,151,936 2.49 U.S. agency securities – full faith 60,316 2.96 U.S. Treasury securities 1,500,637 2.19 Other 160 32.00 Total $ 11,060,506 5.03
The ASRS has not adopted a specific formal policy for interest rate risk, but does set more restrictive requirements in its contracts with money managers. The ASRS utilizes effective duration to identify and manage its interest rate risk. Effective duration measures the expected change in value of a fixed income security for a given change in interest rate. This method takes into account the likely timing and amounts of variable cash flows for bonds with call options and prepayment provisions.

STATE OF ARIZONA NOTES TO THE FINANCIAL STATEMENTS JUNE 30, 2014
- 81 -
The following table presents ASRS’ effective duration by investment type as of June 30, 2014 (expressed in thousands):
Effective Duration
Investment Type Fair Value (in years) Asset backed securities $ 5,363 1.60 Commercial mortgage backed securities 67,075 1.50 Corporate bonds 1,563,343 4.60 Emerging market debt 417,186 * Fixed income mutual funds 735,857 * Government agency CMOs 785,487 2.80 Government bonds 1,103,905 6.30 Government mortgage backed securities 76,120 3.80 Government related bonds 256,568 5.40 Opportunistic debt 930,906 * Private debt 1,201,508 * U.S. Treasury securities 760,704 0.30 Total $ 7,904,022 3.97
* Duration calculations for some securities are not available.
The PSPRS, the EORP, and the CORP do not have a formal policy in regards to interest rate risk. The NAU’s and the U of A’s investment policies for their operating funds limit the maximum maturity of any fixed-rate or variable-rate security to five years from the settlement date of purchase. The NAU’s and the U of A’s endowment funds have no such limitation.
The following table presents the interest rate risk for the PSPRS, the EORP, the CORP, the NAU, the U of A, and other State agencies utilizing the segmented time distribution as of June 30, 2014 (expressed in thousands):
Investment Maturities (in years) Investment Type Fair Value Less than 1 1-5 6-10 11-15 16-20 More than 20 Certificates of deposit (negotiable) $ 27,691 $ 6,878 $ 20,813 $ - $ - $ - $ - Collateralized bond obligations (CBOs) 22,093 - 12,350 - - - 9,743 Corporate notes & bonds 880,240 13,147 198,704 17,932 12,979 3,858 633,620 Fixed income mutual funds 15,256 5,316 3,791 5,999 150 - - Government bonds 3,649 1,100 2,549 - - - - Money market mutual funds 155,534 155,534 - - - - - U.S. agency securities 253,844 143,444 81,107 189 - 10,531 18,573 U.S. Treasury securities 31,420 - 31,347 73 - - - Total $ 1,389,727 $ 325,419 $ 350,661 $ 24,193 $ 13,129 $ 14,389 $ 661,936

STATE OF ARIZONA NOTES TO THE FINANCIAL STATEMENTS JUNE 30, 2014
- 82 -
The following table presents the State’s investments at fair value that are considered to be highly sensitive to interest rate changes as of June 30, 2014 (expressed in thousands):
Corporate Notes & U.S. Agency
Interest Rate Terms Securities Securities Other Total Investments (including full faith) with coupon tied to the London Interbank Offered Rate (LIBOR) plus/minus a fixed basis point which resets monthly, quarterly, or semi-annually. $ 567,937 $ 207,321 $ 29,558 $ 804,816 Asset backed securities (including full faith) with coupon tied to the LIBOR plus/minus a fixed basis point which resets from monthly to quarterly. 196,802 - - 196,802 Mortgage backed securities (including full faith) - when interest rates fall, mortgages are refinanced and paid off early and the reduced stream of future interest payments diminishes fair value of the investment. 97,343 1,811,022 - 1,908,365 Other investments with high sensitivity to rate changes. - 150,348 64,999 215,347 Total $ 862,082 $ 2,168,691 $ 94,557 $ 3,125,330
D. CREDIT RISK
Credit risk is the risk that an issuer or other counterparty to an investment will not fulfill its obligations to the holder of the investment.
State statutes and the State Treasurer’s investment policy require that commercial paper must be rated by at least two nationally recognized statistical rating organizations (NRSROs) and that the ratings assigned by at least two of the NRSROs be of the two highest rating categories for short-term obligations. Corporate bonds, debentures, notes, and negotiable certificates of deposit must carry a minimum Baa or better rating from Moody’s Investor Service (Moody’s) or a BBB or better rating from Standard and Poor’s Rating Service (S & P) or their successors. For securities of, or any other interests in, any open-end management type investment company or investment trust, including exchange traded funds, the underlying investments must be securities which are allowable under State statutes. For investments not rated by Moody’s, Fitch rating information is used. There is no statute or investment policy on ratings or credit quality for obligations issued by the U.S. Government or its agencies or repurchase agreements. The underlying securities for repurchase agreements are implicitly guaranteed by the U.S. Government, as some are collateralized with U.S. agency securities.
The ASRS has not adopted a formal policy with respect to credit risk.
The PSPRS’, the EORP’s, and the CORP’s investment policies are specific as to permissible credit quality ranges, exposure levels within individual quality tiers, and the average credit quality of the overall portfolios. The fixed income portfolio must have a minimum weighted average quality rating of A3 by Moody’s and A- by S & P. Fixed income securities must have a minimum quality rating of Baa3 by Moody’s and BBB- by S & P at the time of purchase. The portion of the bond portfolio in securities rated Baa3 through Baa1 by Moody’s and BBB- through BBB+ by S & P must be 20% or less of the fair value of the fixed income portfolio. Commercial paper must have a minimum quality rating of P-1 by Moody’s and A-1 by S & P at the time of purchase.
The Universities’ policies mirror that of the ABOR, which requires that negotiable certificates of deposit, corporate bonds, debentures and notes, bankers acceptances, and State of Arizona bonds carry a minimum BBB or better rating by S & P or Baa or better rating by Moody’s; and that commercial paper be rated by at least two NRSROs and be of the two highest rating categories for short-term obligations of at least two of the NRSROs. In addition, the Universities do not have formal policies that specifically address credit risk over endowment funds. The Universities’ endowment funds are primarily invested in their Foundations’ endowment pools, which are not rated. The Foundations’ investment committees manage the credit risk of the pools’ investments. Also, the ASU’s capital projects and bond debt service funds are invested by the bond trustee in accordance with the applicable financing indenture.
The Commission’s investment policy requires that purchases of fixed income securities will consist of U.S. Treasury or Federal agency obligations or those bonds rated not less than Baa3 by Moody’s or BBB- by S & P, except for fixed income managers who have been hired to manage funds in a specialized manner (high yield).

STATE OF ARIZONA NOTES TO THE FINANCIAL STATEMENTS JUNE 30, 2014
- 83 -
The following table presents the State’s investments which were rated by S & P and/or an equivalent national rating organization as of June 30, 2014. The ratings are presented using S & P’s rating scale (expressed in thousands):
Investment Type Fair Value AAA AA A BBB BB B CCC
Thru D A-1 Not Rated Asset backed securities $ 568,249 $ 441,208 $ 1,564 $ 14,024 $ - $ - $ - $ - $ 106,869 $ 4,584 CBOs 22,093 - - - - - - - - 22,093 Certificates of deposit (negotiable) 217,911 - 28,237 20,921 - - - - 158,503 10,250 Commercial mortgage backed securities 171,065 160,844 - 5,391 4,024 - - - - 806 Commercial paper 1,067,517 - - - - - - - 1,067,517 - Corporate notes & bonds 4,343,492 69,962 509,428 1,278,776 712,425 329,215 541,184 222,628 - 679,874 Emerging market debt 417,186 - - - - - - - - 417,186 Fixed income mutual funds 751,113 - - - - - - - - 751,113 Government agency CMOs 785,487 - 785,487 - - - - - - - Government bonds 1,433,996 36,786 1,021,088 92,140 203,233 14,931 - - 24,034 41,784 Government mortgage backed securities 76,120 - 76,120 - - - - - - - Government related bonds 256,568 26,025 221,217 9,326 - - - - - - Money market mutual funds 345,114 345,114 - - - - - - - - Opportunistic debt 930,906 - - - - - - - - 930,906 Private debt 1,201,508 - - - - - - - - 1,201,508 Repurchase agreements 600,000 - 600,000 - - - - - - - U.S. agency mortgage backed securities 1,288,801 - 1,285,489 - - - - - - 3,312 U.S. agency securities 1,376,676 19,986 1,356,690 - - - - - - - Other 113,919 - - - - - - - - 113,919
Total $15,967,721 $1,099,925 $5,885,320 $1,420,578 $919,682 $344,146 $541,184 $222,628 $1,356,923 $4,177,335
E. CONCENTRATION OF CREDIT RISK
Concentration of credit risk is the risk of loss attributed to the magnitude of a government’s investment in a single issuer. The State Treasurer’s, the ASRS’, the Universities’, and the Commission’s investment policies provide that no more than 5% of their investments shall be invested in securities issued by a single corporation and its subsidiaries/affiliates. However, securities issued by the U.S. government or its agencies, sponsored agencies, corporations, sponsored corporations or instrumentalities are exempt. The State Treasurer also exempts from this policy the purchase of Treasurer Warrant Notes for the State Agencies Diversified pool, provided the maximum amount of the notes purchased shall not exceed 50% of the market value of the pool, bonds issued by an agency of the State, and pre-refunded municipal bonds issued by any entity that are invested in obligations issued or guaranteed by the U.S. government or any of its agencies, sponsored agencies, corporations, sponsored corporations or instrumentalities. The PSPRS’, the EORP’s, and the CORP’s investment policies state that no more than 5% of the Fund or its fixed income portfolio at fair value shall be invested in bonds issued by any one institution, agency, or corporation other than bonds issued as direct obligations of, and fully guaranteed by, the U.S. Government. At June 30, 2014, investments in any one issuer, that were more than 5% of the primary government’s total investments, are as follows: (i) Federal Home Loan Mortgage Corporation (fair value of $683.6 million, or 5.6%) and (ii) Federal National Mortgage Association (fair value of $924.0 million, or 7.6%). F. FOREIGN CURRENCY RISK
Foreign currency risk is the risk that changes in the foreign exchange rate will adversely impact the fair value of an investment or deposit. The State does not have a formal policy regarding foreign currency risk. The ASRS, the PSPRS, the EORP, and the CORP are the primary State agencies that have foreign currency risk. Per A.R.S. § 38-718, no more than 40% of the ASRS' assets may be invested in foreign securities and those investments shall be made only by investment managers with expertise in

STATE OF ARIZONA NOTES TO THE FINANCIAL STATEMENTS JUNE 30, 2014
- 84 -
those investments. The ASRS has not adopted a formal policy that is more restrictive. According to State statutes, the PSPRS, the EORP, and the CORP shall not invest more than 20% of the combined assets of the system or other plans that the Board of Trustees manages in foreign securities. The following table summarizes the State’s foreign currency risk as of June 30, 2014 (expressed in thousands):
Foreign Currency Risk by Investment Type at Fair Value Other Currency Short Term Fixed Income Equities Investments Total Australian Dollar $ 14 $ - $ 74,954 $ - $ 74,968 Brazilian Real 186 53,587 27,975 - 81,748 British Pound Sterling 1,646 - 540,463 40,731 582,840 Canadian Dollar (5,716) - 108,344 - 102,628 Columbian Peso 67 17,951 4,172 - 22,190 Danish Krone 163 - 30,168 - 30,331 Euro Currency 59,219 - 647,753 344,628 1,051,600 Hong Kong Dollar 552 - 80,769 - 81,321 Hungarian Forint - 6,421 - - 6,421 Indonesian Rupiah 127 22,071 6,602 - 28,800 Israeli Shekel 87 - 7,500 - 7,587 Japanese Yen 4,046 - 432,529 - 436,575 Malaysian Ringgit 13 23,344 6,409 - 29,766 Mexican Peso 10 30,504 9,954 104,057 144,525 New Romanian Leu 79 4,337 - - 4,416 New Russian Ruble - 26,409 - - 26,409 New Taiwan Dollar 426 - 21,420 - 21,846 New Zealand Dollar 34 - 3,586 - 3,620 Nigerian Naira 228 6,192 - - 6,420 Norwegian Krone 256 - 12,954 - 13,210 Peruvian Nouveau Sol - 5,609 - - 5,609 Philippine Peso - 1,991 1,621 - 3,612 Polish Zloty 14 25,507 2,765 - 28,286 Singapore Dollar 417 - 24,121 - 24,538 South African Rand 45 36,909 12,461 - 49,415 South Korean Won 37 - 40,900 - 40,937 Swedish Krona 95 - 41,928 - 42,023 Swiss Franc 272 - 161,714 - 161,986 Thailand Baht - 6,873 2,481 - 9,354 Turkish Lira 58 27,436 2,773 - 30,267
Total $ 62,375 $ 295,141 $ 2,306,316 $ 489,416 $ 3,153,248 G. SECURITIES LENDING Cash received as collateral on securities lending transactions and investments made with that cash are reported as assets. A corresponding liability is also recorded for such securities lending transactions.
1. Industrial Commission
State statutes and the Commission’s policies permit the Commission to enter into securities lending transactions with its custodial bank. There were no significant violations of legal or contractual provisions, and there were no borrower or lending agent default losses to the securities lending agent. The custodial bank, The Northern Trust Company, manages the securities lending operations through a contractual agreement with the Commission and splits the fees received with the Commission. There was no credit risk (i.e., lender’s exposure to the borrowers of its securities) related to the securities lending transactions at June 30, 2014. The Northern Trust Company’s indemnification responsibilities include performing appropriate borrower and collateral investment credit analysis, demanding adequate types and levels of collateral, and complying with applicable Department of Labor and Federal Financial Institutions Examinations Council regulations concerning securities lending. Securities are loaned

STATE OF ARIZONA NOTES TO THE FINANCIAL STATEMENTS JUNE 30, 2014
- 85 -
for collateral that may include cash, U.S. Government securities, and irrevocable letters of credit. U.S. securities are loaned for collateral valued at 102% of the market value of securities plus any accrued interest. International securities are loaned for collateral valued at 105% of the market value of securities plus any accrued interest. The market value at June 30, 2014 for loaned securities collateralized by cash and non-cash collateral was $44.0 million and $28 thousand, respectively. As part of the securities lending transactions, The Northern Trust Company received cash and non-cash collateral valued at $44.9 million and $29 thousand, respectively, at June 30, 2014. Non-cash collateral cannot be pledged or sold unless the borrower defaults.
All securities loans can be terminated on demand by either the lender or the borrower although the average term of the Commission’s loans was approximately 55 days as of June 30, 2014. Cash open collateral is invested in a short-term investment pool, the Core USA Collateral Section, which had an interest sensitivity of 37 days as of June 30, 2014. There are no dividends or coupon payments owing on securities lent. Securities lending earnings are credited to the Commission on approximately the fifteenth day of the following month. Investments made with cash collateral received are classified as an asset on the Statement of Net Position. A corresponding liability is recorded as the Commission must return the cash collateral to the borrower upon expiration of the loan. At June 30, 2014, the Commission had $44.9 million outstanding as payable for securities lending. A maximum restriction on the amount of securities that can be lent out at any one time of $43.976 million was set by the Commission on September 29, 2008.
2. Arizona State Retirement System
The ASRS is permitted by A.R.S. § 38-718(G) to enter into securities lending transactions. The ASRS’ custodial bank enters into agreements with borrowers to loan securities and have the same securities redelivered at a later date. Securities eligible for loan include U.S. fixed income securities, U.S. equities, and international equities. The ASRS currently receives as collateral at least 102% of the market value of the loaned securities and maintains collateral at no less than 100% for the duration of the loan. At year-end, the ASRS had limited counter party risk to borrowers because the amount the ASRS owes the borrowers exceeds the amount the borrowers owe the ASRS. Securities loaned are initially fully collateralized by cash (USD and Euro), U.S. Government or agency securities, sovereign debt, corporate bonds and equities. Cash collateral may be reinvested (under certain constraints) in: a) instruments issued or fully guaranteed by the U.S. Government, Federal agencies, or sponsored agencies or sponsored corporations, b) instruments issued by domestic corporations including corporate notes and floating rate notes, c) obligations of approved domestic and foreign banks, d) U.S. dollar-denominated instruments issued by sovereigns, sovereign supported credits, and instruments of foreign banks and corporations, e) repurchase agreements, f) insurance company funding agreements, guaranteed investment contracts and bank investment contracts, and g) money market mutual funds. The ASRS records the collateral received as an asset and the same amount as an obligation for securities on loan. The maturities of the investments are closely matched to those of the security loans to avoid interest rate exposure. The ASRS receives a spread for its lending activities. Investments made with cash collateral are classified as an asset on the Statement of Fiduciary Net Position. A corresponding liability is recorded as the ASRS must return the cash collateral to the borrower upon expiration of the loan. At June 30, 2014, the fair value of securities on loan was $95.8 million; of which $15.0 million were cash collateralized loans. Cash of $15.4 million received as collateral for securities loaned was reinvested and had a net position value of $15.0 million, as of June 30, 2014. The securities lending payable at June 30, 2014 was $15.4 million. The ASRS does not have the ability to pledge or sell the collateral unless there is a borrower default. There are no restrictions on the dollar amount of security loans that may be made by the ASRS. The ASRS is indemnified against gross negligence and borrower default by the lending agents, but is not indemnified against cash collateral reinvestment risk.
3. Public Safety Personnel Retirement System, Elected Officials’ Retirement Plan, and Corrections Officer Retirement Plan
The PSPRS, the EORP, and the CORP are permitted by A.R.S. Title 38, Chapter 5, Articles 4, 3, and 6, respectively, to enter into securities lending transactions. The PSPRS, the EORP, and the CORP are parties to securities lending agreements with a bank. The bank, on behalf of the PSPRS, the EORP, and the CORP, enters into agreements with brokers to loan securities and have the same securities returned at a later date. The loans are fully collateralized, primarily by cash. Collateral is marked-to-market on a daily basis. Non-cash collateral can be sold only upon borrower default. The PSPRS, the EORP, and the CORP require collateral of at least 102% of the fair value of the loaned U.S. Government or corporate security. Securities on loan are carried at fair value. As of June 30, 2014, the fair values of securities on loan for the PSPRS, the EORP, and the CORP were $433.8 million, $23.4 million, and $112.0 million, respectively. At June 30, 2014, the fair value of the associated collateral for the PSPRS, the EORP, and the CORP were $446.4 million, $24.1 million, and $115.3 million, respectively. The PSPRS, the EORP, and the CORP are

STATE OF ARIZONA NOTES TO THE FINANCIAL STATEMENTS JUNE 30, 2014
- 86 -
indemnified for broker default by the securities lending agent. The PSPRS, the EORP, and the CORP have no credit risk because the amounts owed to the borrowers exceed the amounts the borrowers owe to the retirement system or plan.
4. State Treasurer
The State Treasurer is permitted under A.R.S. § 35-313 and § 35-324 to enter into securities lending transactions. The State Treasurer’s custodial bank manages the securities lending program through a contractual agreement. At fiscal year-end, the State Treasurer had no credit risk exposure to borrowers because the amount the State Treasurer owes to the borrowers exceeds the amount the borrowers owe the State Treasurer. All securities are eligible for loan, but equities and U.S. Treasuries comprise a majority of securities that are on loan. There are no restrictions on the dollar amount of security loans that may be made by the State Treasurer. Securities are loaned for collateral that may include cash (U.S. currency), U.S. and international equities, and other assets permissible under Rule 15c3-3 under the Securities Exchange Act of 1934. Securities are loaned for collateral valued at not less than 102% of the market value of the securities loaned at the close of trading on the preceding business day. Investments made with cash collateral are done on an individual investment pool basis and are restricted to the limitations for that investment pool set forth in the State Treasurer’s investment policy, except for investments made for certain endowment equity pools. Permitted investments for these equity pools include those investments authorized in section IV of the State Treasurer’s investment policy. Cash collateral investments include: a) obligations issued or guaranteed by the United States or any of its agencies, sponsored agencies, corporations, sponsored corporations, or instrumentalities including repurchase and tri-party repurchase agreements collateralized at no less than 102% by securities, 100% by cash, and 102% by mortgage-backed securities, and b) U.S. 2a-7 money market mutual funds which are regulated by the Securities and Exchange Commission and rated in the highest category by at least one NRSRO.
The State Treasurer records the cash collateral received as an asset and the same amount as obligations under securities loan agreements. As of June 30, 2014, the fair value of securities on loan was $819.0 million. The associated fair value of the invested collateral was $853.4 million, of which $490.1 million was invested cash collateral. All securities loans can be terminated on demand by either the State Treasurer or the borrower. For the cash collateral investments, the weighted average maturity was one day. The State Treasurer does not have the ability to pledge or sell the non-cash collateral unless there is a borrower default. The State Treasurer is indemnified against gross negligence, bad faith, or willful misconduct and borrower default by the lending agent. There were no borrower defaults during the current fiscal year. At June 30, 2014, the State Treasurer had $490.1 million outstanding as payable for securities lending, and the following securities on loan were uninsured and held by the bank trust department not in the Treasurer’s name:
Corporate notes $ 2,775,351 Equities 99,111,998 U.S. Treasury securities 236,451,992
Total Fair Value $ 338,339,341
H. DERIVATIVES
A derivative instrument is a financial instrument or other contract with all three of the following characteristics:
i Settlement factors: It has one or more reference rates and one or more notional amounts or payment provisions or both. Those terms determine the amount of the settlement or settlements, and in some cases, whether or not a settlement is required.
i Leverage: It requires no initial net investment or an initial net investment that is smaller than would be required for other types of contracts that would be expected to have a similar response to changes in market factors.
i Net Settlement: Its terms require or permit net settlement, it can readily be settled net by means outside the contract, or it provides for delivery of an asset that puts the recipient in a position not substantially different from net settlement.
The ASRS is the primary State agency that has investment derivatives. The ASRS’s derivatives are considered “Investment Derivative Instruments” as defined in GASB Statement No. 53, Accounting and Financial Reporting for Derivative Instruments. All funds are considered fiduciary funds.

STATE OF ARIZONA NOTES TO THE FINANCIAL STATEMENTS JUNE 30, 2014
- 87 -
The ASRS’s derivative instruments, which consist of futures contracts, forward contracts, options, swaps, rights, and warrants, are measured at fair value and reported on the Statement of Fiduciary Net Position. Changes in fair values of derivative instruments are reported as net increase (decrease) in fair value of investments on the Statement of Changes in Fiduciary Net Position. The fair value balances and notional amounts of derivative instruments outstanding at June 30, 2014, classified by type, and the changes in fair value of derivative instruments for the year then ended as reported in the June 30, 2014 financial statements are as follows (expressed in thousands):
Investment Derivatives by Type Changes in Fair Value (1) Fair Value at June 30, 2014
Investment Derivatives Classification Amount (2) Classification Amount (3) Notional (4)
Commodity futures long Net increase (decrease) in fair value of investments $ 83,877 Not applicable $ - $ 262,560
Commodity futures short Net increase (decrease) in fair value of investments (1,924) Not applicable - (50)
Credit default swaps bought Net increase (decrease) in fair value of investments (993) Not applicable - -
Credit default swaps written Net increase (decrease) in fair value of investments 70 Not applicable - -
Fixed income futures long Net increase (decrease) in fair value of investments 602 Not applicable - -
Fixed income futures short Net increase (decrease) in fair value of investments (926) Not applicable -
(11,300)
Fixed income options written Net increase (decrease) in fair value of investments 629 Not applicable - -
Foreign currency options bought
Net increase (decrease) in fair value of investments 25 Fixed income securities - 650
Foreign currency options written
Net increase (decrease) in fair value of investments 241 Fixed income securities
(29)
(10,678)
Foreign currency forwards Net increase (decrease) in fair value of investments (3,176)
Forward contracts receivable 857 239,400
Futures options written Net increase (decrease) in fair value of investments 72 Not applicable - -
Index futures long Net increase (decrease) in fair value of investments 6,314 Not applicable - 11
Pay fixed interest rate swaps Net increase (decrease) in fair value of investments (419) Not applicable - -
Receive fixed interest rate swaps
Net increase (decrease) in fair value of investments
(406) Fixed income securities
(62) 9,645
Rights Net increase (decrease) in fair value of investments 556 Equity securities - -
Warrants Net increase (decrease) in fair value of investments 2,061 Equity securities - -
Total $ 86,603 $ 766 $ 490,238 (1) Excludes futures margin payments. (2) Negative values refer to losses. (3) Negative values refer to liabilities. (4) Notional may be a dollar amount or size of underlying futures and options; negative values refer to short positions.

STATE OF ARIZONA NOTES TO THE FINANCIAL STATEMENTS JUNE 30, 2014
- 88 -
The fair value of derivative instruments reported by the ASRS is based on quoted market prices off national exchanges. The fair value of foreign currency forward contracts is based on mathematical models and is valued using a pricing service, which uses published Reuter’s foreign currency rates as the primary source for the calculation. The credit quality ratings of counterparties as described by NRSROs and the counterparties’ related risk concentration, as of June 30, 2014, are as follows (expressed in thousands):
Counterparty Risk and Ratings Total Risk Ratings
Counterparty Name Net Exposure Concentration S&P Fitch Moody's Barclay’s Bank $ 188 8.08% A A A2 BNP Paribas, S.A. 18 0.76% A+ A+ A1 Citibank N.A. 58 2.47% A A A2 Credit Suisse 351 15.09% A A A1 Deutsche Bank London 71 3.03% A A+ A3 Goldman Sachs 4 0.19% A- A Baa1 HSBC Bank USA 51 2.18% AA- AA- A1 JP Morgan Chase Bank N.A. 927 39.84% A+ A+ Aa3 Morgan Stanley and Co. Inc. 27 1.17% A A A3 Societe Generale 27 1.16% A A+ A2 Standard Chartered Bank 279 11.99% AA- AA- A1 USB AG 327 14.04% A A A2
Total $ 2,328 100.00%
The maximum amount of loss due to credit risk that the ASRS would incur if the counterparties to the derivative instrument failed to perform according to the terms of the contract, without respect to any collateral or other security or netting arrangement, is the total unrealized gain of derivatives at the end of the reporting period. The ASRS has no general investment policy requiring collateral or other security to support derivative instruments. Each investment manager hired has discretion with respect to derivative investments and risk control. Each investment manager is governed by its Investment Manager Agreement. The ASRS has no general investment policy with respect to netting arrangements. The ASRS’s investment managers have master netting arrangements to allow net settlement with the same counterparty in the event the counterparty defaults on its obligations. The aggregate fair value of investment derivative instruments in asset positions at June 30, 2014 was $2.3 million. This represents the maximum amount of loss in case of default of all counterparties of over-the-counter positions as of June 30, 2014. There was no collateral received or netting arrangements in place at June 30, 2014 with counterparties that would reduce this exposure.

STATE OF ARIZONA NOTES TO THE FINANCIAL STATEMENTS JUNE 30, 2014
- 89 -
The ASRS has exposure to interest rate risk due to the investment in an interest rate swap agreement. The required risk disclosures are included in the Interest Rate Risk schedule in Note 2.C. The fair value balance and notional amount of the interest rate swap outstanding as of June 30, 2014, for the year then ended, as reported in the June 30, 2014 financial statements are as follows (expressed in thousands):
Derivative Instruments Subject to Interest Rate Risk Investment Maturities Investment Maturities (in years)
Investment Type Fair Value Less Than 1 1-5 6-10 10+ Receive fixed interest rate swaps $ (62) $ - $ (41) $ (21) $ - Total $ (62) $ - $ (41) $ (21) $ -
Derivative Instruments Highly Sensitive to Interest Rate Changes
Asset ID Asset Description Interest Rate Fair Value Notional PAY FIXED INTEREST RATE SWAPS ADI07VSP2 US 10YR NOTE (CBT) SEP 14 0.00% $ - $ (11,300)
Total Pay Fixed Interest Rate Swaps $ - $ (11,300)
RECEIVE FIXED INTEREST RATE SWAPS 99S0EIJN8/ SWU002S11 IRS ZAR R F 6.50000 / 6.50% $ (51) $ 931 99S0EIJO6 SWU002S11 IRS ZAR P V 03MJHBRG 99S0EM2K3/ SWU023WC8 IRS BRL R F 8.65000 / 8.65% (46) 817 99S0EM2L1 SWU023WC8 IRS BRL P V 00MCETIP 99S0FZ5T1/ SWU004PQ5 IRS BRL R F 10.91000 / 10.91% (4) 4,356 99S0FZ5U8 SWU004PQ5 IRS BRL P V 00MBRCDI 99S0HFQQ6/ SWU005W76 IRS BRL R F 11.32000 / 11.32% 6 544 99S0HFQR4 SWU005W76 IRS BRL P V 00MCETIP 99S0HQRT5/ SWU006FE8 IRS THB R F 3.34000 / 3.34% 3 123 99S0HQRU2 SWU006FE8 IRS THB P V 06MLIBOR 99S0IA423/ SWU006VU4 IRS THB R F 3.41000 / 3.41% 3 259 99S0IA431 SWU006VU4 IRS THB P V 06MTHFX 99S0IAEK2/ SWU006X81 IRS THB R F 3.42000 / 3.42% 10 759 99S0IAEL0 SWU006X81 IRS THB P V 06MTHFX 99S0IAWE6/ SWU006XQ1 IRS THB R F 3.41500 / 3.42% 5 381 99S0IAWF3 SWU006XQ1 IRS THB P V 06MTHFX 99S0IAWN6/ SWU006XR9 IRS THB R F 3.41000 / 3.41% 5 380 99S0IAWO4 SWU006XR9 IRS THB P V 06MTHFX 99S0IXAH3/ SWU007VO6 IRS COP R F 6.20000 / 6.20% 4 558 99S0IXAI1 SWU007VO6 IRS COP P V 00MCOOVI 99S0IXAT7/ SWU007VN8 IRS COP R F 6.20000 / 6.20% 3 537 99S0IXAU4 SWU007VN8 IRS COP P V 00MCOOVI Total Receive Fixed Interest Rate Swaps $ (62) $ 9,645
The ASRS is exposed to foreign currency risk on its foreign currency forward contracts and futures contracts. The required risk disclosures are included in the Foreign Currency Risk schedule in Note 2.F. Refer to Note 7.A.4.c. for information on debt derivatives utilized by the ASU.

STATE OF ARIZONA NOTES TO THE FINANCIAL STATEMENTS JUNE 30, 2014
- 90 -
I. STATE TREASURER’S SEPARATELY ISSUED FINANCIAL STATEMENTS
The State Treasurer issues separately published Annual Audited Financial Statements. These financial statements provide additional information relating to the State Treasurer’s total investing activities, including the investment trust funds. A copy of the State Treasurer’s Office Annual Audited Financial Statements can be obtained from their office at: Office of the Arizona State Treasurer, 1700 W. Washington Street, Phoenix, AZ 85007, (602) 542-7800, or their website at www.aztreasurer.gov.
NOTE 3. RECEIVABLES/DEFERRED OUTFLOWS AND INFLOWS OF RESOURCES/UNEARNED REVENUE
A. TAXES RECEIVABLE
The following table summarizes taxes receivable at June 30, 2014 (expressed in thousands):
Type of Tax General
Fund
Transportation & Aviation Planning,
Highway Maintenance
& Safety Fund
Industrial Commission
Special Fund
Non-major Governmental
Funds
Non-major Enterprise
Funds Government-wide
Total Sales $ 524,895 $ - $ - $ 52,335 $ - $ 577,230 Income – individual and corporate 116,318 - - - - 116,318 Motor vehicle and fuel - 62,117 - - - 62,117 Luxury 6,777 - - 18,045 - 24,822 Unemployment - - - - 91,906 91,906 Other - - 4,182 3,199 - 7,381 Gross taxes receivable 647,990 62,117 4,182 73,579 91,906 879,774 Allowance for uncollectible taxes (359,798) - - - - (359,798) Net Taxes Receivable $ 288,192 $ 62,117 $ 4,182 $ 73,579 $ 91,906 $ 519,976
B. DEFERRED OUTFLOWS OF RESOURCES AND DEFERRED INFLOWS OF RESOURCES
At June 30, 2014, the components of deferred outflows of resources were as follows (expressed in thousands):
Governmental Business-type Primary Activities Activities Government
Deferred Outflows of Resources Interest rate swap $ - $ 14,135 $ 14,135 Loss on debt refundings 26,361 37,644 64,005 Total Deferred Outflows of Resources $ 26,361 $ 51,779 $ 78,140
At June 30, 2014, the components of deferred inflows of resources were as follows (expressed in thousands):
General Land
Endowments Other
Governmental Total
Governmental Fund Fund Funds Funds
Governmental funds: Deferred Inflows of Resources: Unavailable Revenues: Delinquent sales and income tax $ 29,780 $ - $ - $ 29,780 Tobacco settlement 50,000 - - 50,000 Child support administrative reimbursements 4,347 - - 4,347 Federal grants 182,209 - - 182,209 Drug Rebates 93,826 - - 93,826 Land sales receivable - 487,552 - 487,552 Land leases receivable - 3,412 - 3,412 Other 3,923 - 796 4,719 Total Deferred Inflows of Resources $ 364,085 $ 490,964 $ 796 $ 855,845

STATE OF ARIZONA NOTES TO THE FINANCIAL STATEMENTS JUNE 30, 2014
- 91 -
C. UNEARNED REVENUE
At June 30, 2014, the components of unearned revenue were as follows (expressed in thousands):
Total Unearned Unearned Revenue for Governmental Funds: Current Noncurrent Revenue General Fund: Advance insurance premium taxes $ 45,407 $ - $ 45,407 Advance land lease payments 291 3,679 3,970 Advance county acute and long term care payments 21,256 - 21,256 Vaccine and commodity food supplement 5,224 - 5,224 Land Endowments Fund: Advance land lease payments 22,214 89,382 111,596 Non-Major Funds: Advance payments for Hawaii/Arizona PMMIS Alliance 381 - 381 Total Unearned Revenue for Governmental Funds $ 94,773 $ 93,061 $ 187,834
Unearned Revenue for Proprietary Funds: Current Universities: Unexpended cash advances received $ 57,815 Auxiliary sales and services 6,960 IBM lease related to acquisition of research park 470 Student tuition and fees 95,837 Deposits 1,103 Other 9,446 Industrial Commission Special Fund: Other 133 Non-Major Funds: Magazine subscriptions 2,040 Other 112 Total Unearned Revenue for Proprietary Funds $ 173,916

STATE OF ARIZONA NOTES TO THE FINANCIAL STATEMENTS JUNE 30, 2014
- 92 -
NOTE 4. CAPITAL ASSETS Capital asset activities for the fiscal year ended June 30, 2014 were as follows (expressed in thousands):
Primary Government
Beginning Adjustments & Ending Balance Additions Retirements Reclassifications Balance
Governmental Activities: Non-depreciable capital assets: Land $ 2,967,822 $ 81,412 $ (3,300) $ 176 $ 3,046,110 Construction in progress 3,369,060 498,155 (907,031) (43,801) 2,916,383 Development in progress 27,155 62,057 (30,644) (1) 58,567 Infrastructure 12,951,192 827,735 (598) - 13,778,329 Total Non-depreciable Capital Assets 19,315,229 1,469,359 (941,573) (43,626) 19,799,389
Depreciable capital assets: Buildings 2,161,715 116,722 (263) 37,647 2,315,821 Improvements other than buildings 159,899 3,446 - 9,342 172,687 Equipment 811,035 63,804 (58,257) 9,896 826,478 Software and other intangibles 219,616 30,998 (86) 879 251,407 Infrastructure 21,896 302 - 678 22,876 Total Depreciable Capital Assets 3,374,161 215,272 (58,606) 58,442 3,589,269
Less accumulated depreciation for: Buildings (778,628) (56,157) 224 - (834,561) Improvements other than buildings (93,642) (4,647) - 13 (98,276) Equipment (616,132) (58,158) 56,661 308 (617,321) Software and other intangibles (195,169) (6,685) 86 - (201,768) Infrastructure (12,033) (591) - 1 (12,623) Total Accumulated Depreciation (1,695,604) (126,238) 56,971 322 (1,764,549)
Total Depreciable Capital Assets, Net 1,678,557 89,034 (1,635) 58,764 1,824,720
Total Governmental Activities Capital Assets, Net $ 20,993,786 $ 1,558,393 $ (943,208) $ 15,138 $ 21,624,109 Beginning Balance
(as restated) Additions Retirements Adjustments &
Reclassifications Ending Balance
Business-type Activities: Non-depreciable capital assets: Land $ 210,037 $ 19,600 $ - $ - $ 229,637 Construction in progress 288,755 205,220 (53,649) (141,166) 299,160 Development in progress - - - - - Collections 19,738 397 (21) - 20,114 Total Non-depreciable Capital Assets 518,530 225,217 (53,670) (141,166) 548,911
Depreciable capital assets: Buildings 5,027,319 170,359 (1,902) 126,098 5,321,874 Improvements other than buildings 4,853 874 - - 5,727 Equipment 1,505,988 86,040 (38,187) - 1,553,841 Software and other intangibles 120,736 - - 5,221 125,957 Infrastructure 460,711 7,458 (3) 9,849 478,015 Total Depreciable Capital Assets 7,119,607 264,731 (40,092) 141,168 7,485,414
Less accumulated depreciation for: Buildings (1,950,014) (152,781) 966 3 (2,101,826) Improvements other than buildings (3,450) (192) - - (3,642) Equipment (1,111,266) (86,299) 35,045 - (1,162,520) Software and other intangibles (61,230) (11,168) - - (72,398) Infrastructure (184,785) (15,437) 1 - (200,221) Total Accumulated Depreciation (3,310,745) (265,877) 36,012 3 (3,540,607)
Total Depreciable Capital Assets, Net 3,808,862 (1,146) (4,080) 141,171 3,944,807
Total Business-type Activities Capital Assets, Net $ 4,327,392 $ 224,071 $ (57,750) $ 5 $ 4,493,718 * For beginning balance restatement detail, see Note 9.B.

STATE OF ARIZONA NOTES TO THE FINANCIAL STATEMENTS JUNE 30, 2014
- 93 -
Depreciation expense was charged to governmental functions as follows (expressed in thousands):
General government $ 20,901 Health and welfare 19,382 Inspection and regulation 875
Education 2,257 Protection and safety 56,101 Transportation 18,344 Natural resources 8,378
Total Governmental Activities $ 126,238
Depreciation expense was charged to business-type activities as follows (expressed in thousands):
Industrial Commission Special Fund $ 1,338 Universities 262,307 Other 2,232
Total Business-type Activities $ 265,877
NOTE 5. PENSION BENEFITS The State participates in the ASRS, the PSPRS, the EORP, and the CORP’s agent plan. Benefits are established by State statutes and provide retirement, death, and survivor benefits to State employees, public school employees and employees of counties, municipalities, and other State political subdivisions. The State does not participate in the AOC and, therefore, is not further described in these notes. A. PARTICIPATING EMPLOYERS
The number of participating government employer groups as of June 30, 2014 for each pension plan is shown below:
ASRS PSPRS EORP CORP 585 237 38 26
B. CONTRIBUTIONS, BENEFITS, AND REFUND PAYMENTS For the ASRS, contributions are recognized as revenues when due, pursuant to statutory and contractual requirements. Pension benefits and refunds are recognized when due and payable and expenses are recorded when the corresponding liabilities are incurred, regardless of when contributions are received or payments is made.
For the PSPRS, the EORP, and the CORP, member and employer contributions are recognized when due, pursuant to formal commitments, as well as statutory or contractual requirements. Pension benefits are recognized when due and payable in accordance with the terms of the plan. Refunds are due and payable by state law within 20 days of receipt of a written application for a refund. Refunds are recorded when paid. C. FUNDING POLICY
The contribution requirements of plan members and the State are established by Title 38, Chapter 5 of the A.R.S. These contribution requirements may be amended by the Arizona State Legislature.
Cost-sharing plans
For the year ended June 30, 2014, active ASRS members and the State were each required by statute to contribute at the actuarially determined rate of 11.30% and 10.70% of the members' annual covered payroll, respectively. The State's contributions to the ASRS for the years ended June 30, 2014, 2013, and 2012 were $202.0 million, $185.5 million, and $180.8 million, respectively, for the primary government which were equal to the required contributions for these years.

STATE OF ARIZONA NOTES TO THE FINANCIAL STATEMENTS JUNE 30, 2014
- 94 -
As part of 2013 Fifty-first legislature, House Bill 2608 effectively closed EORP and created the Elected Officials' Defined Contribution Retirement System (EODCRS), with an effective date of January 1, 2014. Elected Officials who are elected, appointed, or hired on or after January 1, 2014, have one of three different paths that may be available to them: If a person has EORP time on account or is elected, appointed, or hired on or before December 31, 2013, they are required to be in EORP; If a person is elected, appointed, or hired on or after January 1, 2014, and does not have prior EORP time, but has ASRS time, that person has the option to either return to ASRS by electing to do so within 30 days or participate in the EODCRS; or, if a person is elected, appointed, or hired on or after January 1, 2014, does not have time on account with EORP, and does not timely opt out of EODCRS to return to ASRS, they’re automatically enrolled in EODCRS.
Active EORP members were required by statute to contribute 13% of the members' annual covered payroll. The State was required to contribute a designated portion of certain fees collected by the Supreme Court plus additional contributions of 38.06% of the members' annual covered payroll, as determined by actuarial valuation until December 31, 2013. Beginning January 1, 2014 employer contributions are 23.50% with an additional $5.0 million appropriated from the Arizona State Budget (Section 133 of fiscal year General Appropriations Act). The $5.0 million from the State is considered a non-employer entity and is listed separately on the Statement of Changes in Fiduciary Net Position. The State's contributions to EORP for the years ended June 30, 2014, 2013, and 2012 were $3.1 million, $2.5 million, and $2.2 million, respectively, which were equal to the required contributions for these years.
Agent plans
For the year ended June 30, 2014, active PSPRS members were required by statute to contribute 10.35% of the members' annual covered payroll and the participating State agencies were required to contribute at actuarially determined rates of 21.79 – 107.07%. Active CORP members were required by statute to contribute 7.96% (Dispatchers) and 8.41% (Non-Dispatchers) of the members' annual covered payroll and the participating State agencies were required to contribute at actuarially determined rates of 12.07 – 13.87%.
D. ANNUAL PENSION COST
The State’s annual pension costs and required contributions made to each of the agent, multiple-employer defined benefit pension plans for the year ended June 30, 2014, is as follows (expressed in thousands):
Annual Pension Costs
Required Contributions
PSPRS $ 43,200 $ 43,200 CORP 50,860 50,860
The State's annual pension costs, the percentage of annual pension cost contributed to the plan, and the net pension (refer to Note 6.A. for explanation) for the current and preceding year for each of the agent, multiple-employer defined benefit pension plans, is as follows (expressed in thousands):
Fiscal Year
Ended
Annual
Pension Costs
Percentage of Annual Cost Contributed
Net Pension PSPRS 6/30/2014 $ 43,200 100% $ - 6/30/2013 36,833 101% 3,175 6/30/2012 31,253 102% 2,627
CORP 6/30/2014 50,860 100% - 6/30/2013 39,537 108% 15,874 6/30/2012 32,058 109% 12,854

STATE OF ARIZONA NOTES TO THE FINANCIAL STATEMENTS JUNE 30, 2014
- 95 -
E. FUNDED STATUS AND FUNDING PROGRESS
The State’s funded status for each of the agent, multiple-employer defined benefit pension plans, as of the most recent actuarial valuation, is as follows (expressed in thousands):
(Unfunded) AAL as a Actuarial Actuarial Actuarial Annual Percentage Valuation Value of Accrued (Unfunded) Funded Covered of Covered
Plan Date Plan Assets Liability (AAL) AAL Ratio Payroll Payroll PSPRS 6/30/2014 $ 450,284 $ 1,240,343 $ (790,059) 36.3% $ 85,973 (919.0)% CORP 6/30/2014 852,041 1,520,026 (667,985) 56.1% 350,313 (190.7)%
The required schedule of funding progress immediately following the notes to the financial statements presents multi-year trend information about whether the actuarial value of the plan assets is increasing or decreasing over time relative to the actuarial accrued liability for benefits.
F. ACTUARIAL METHODS AND ASSUMPTIONS
The State’s actuarial methods and significant assumptions for each of the agent, multiple-employer defined benefit pension plans for the most recent actuarial valuation as of 6/30/2014 and actuarial valuation as of 6/30/2012 that was used to determine the fiscal year 2014 annual required contribution are as follows:
PSPRS CORP PSPRS CORP Actuarial valuation date 6/30/2012 6/30/2012 6/30/2014 6/30/2014 Actuarial cost method entry age normal entry age normal entry age normal entry age normal Actuarial assumptions: Investment rate of return 8.0% 8.0% 7.85% 7.85% Projected salary increases 5.0 – 9.0% 5.0 – 8.25% 4.0 – 8.0% 4.0 – 7.25% Payroll growth 5.0% 5.0% 4.0% 4.0% Cost-of-living adjustments none none n/a (1) Amortization method level percent-of-pay
closed level percent-of-pay
closed level percent-of-pay
closed level percent-of-
pay closed Remaining amortization period
24 years for unfunded, 20 years
for overfunded
24 years for unfunded, 20 years
for overfunded
22 years for unfunded, 20 years
for overfunded
22 years for unfunded, 20 years
for overfunded Asset valuation method 7-year smoothed
market 7-year smoothed
market 7-year smoothed
market 7-year smoothed
market 80%/120% market 80%/120% market 80%/120% market 80%/120% market Permanent Benefit Increases (PBI) n/a n/a (2) n/a (1) Members Retired on or before July 1, 2011: 2.25% of benefit. Members Retired on or after August 1, 2011: 0.5% of benefit. (2) Members Retired on or before July 1, 2011: 2.0% compounded on average. Members Retired on or after August 1, 2011: 0.5% compounded on average. Since all current retirees receive the same dollar increase amount, approximation techniques were used to develop the assumed PBI for each member. G. UNIVERSITIES’ RETIREMENT PLANS
Faculty, academic professionals, service professionals, and administrative staff at the three universities (the ASU, the NAU, and the U of A) may select one of three retirement plans: the Teachers Insurance Annuity Association/College Retirement Equities Fund (TIAA/CREF), Fidelity Investments Tax-Exempt Services Company (Fidelity), or the ASRS. The ASRS is a defined benefit plan and the other two plans are defined contribution plans. The two defined contribution plans are administered by independent insurance and annuity companies approved by the ABOR. In addition, the U of A employees hired before July 1, 1972, have the option to participate in the defined contribution plan administered by the ASRS. In a defined contribution plan, benefits depend solely on the contributed amounts and the returns earned on investments of those contributions. Contributions made by employees vest immediately and the Universities' contributions vest no later than after five years of full-time employment. Employees and Universities' contributions and associated returns earned on investments may be withdrawn starting

STATE OF ARIZONA NOTES TO THE FINANCIAL STATEMENTS JUNE 30, 2014
- 96 -
upon termination of employment, death, or retirement. The distribution of employee contributions and associated investment earnings are made in accordance with the employee's contract with the applicable insurance and annuity company. The Arizona State Legislature establishes and may amend active plan members' and the Universities' contribution rates. For the year ended June 30, 2014, plan members and the three Universities were each required by statute to contribute an amount equal to 7.00% of an employee's compensation, except for a 7.00% member contribution and a 7.59% University contribution for the ASRS defined contribution plan.
Contributions to these plans for the year ended June 30, 2014, were as follows (expressed in thousands):
Plan University
Contributions Employee
Contributions Total
Contributions TIAA/CREF $ 31,590 $ 31,590 $ 63,180 Fidelity 22,550 22,550 45,100 ASRS 13 12 25
NOTE 6. OTHER POST-EMPLOYMENT BENEFITS
A. PLAN DESCRIPTION
Cost-sharing plans In addition to the pension benefits described, the ASRS provides health insurance premium supplemental benefits and disability benefits to retired members, disabled members, and eligible dependents through the Health Benefit Supplement Fund (HBS) and the Long Term Disability Fund (LTD), which are cost-sharing, multiple-employer defined benefit post-employment plans. Title 38, Chapter 5 of the A.R.S. assigns the authority to establish and amend the benefit provisions of the HBS plan and the LTD plan to the Arizona State Legislature. The ASRS issues a publicly available financial report that includes the financial information and disclosure requirements for the HBS plan and the LTD plan. Information on how to obtain this report is included in Note 1.A.
In addition to the pension benefits described, the EORP provides health insurance premium subsidy benefits to retired members, which is a cost-sharing, multiple employer defined benefit post-employment plan. Title 38, Chapter 5 of the A.R.S. assigns the authority to establish and amend the health insurance subsidy benefit provisions to the Arizona State Legislature. As of July 1, 2013, the EORP administers a separate healthcare plan as defined under IRC § 401(h). In addition, the EORP is statutorily authorized, by A.R.S. § 38-817, to maintain a separate account for the health insurance subsidy assets and benefit payments. The health insurance subsidy assets are accounted for by employer and are available to pay only the health insurance benefit. Information on how to obtain the EORP's publicly available financial report is included in Note 1.A. However, the EORP OPEB benefit is relatively insignificant to the State's financial statements and, therefore, is not further described in these notes.
Agent plans
In addition to pension benefits described, the PSPRS and the CORP each provide a health insurance premium subsidy benefit to retired members and survivors, which are agent, multiple-employer defined benefit post-employment plans. Title 38, Chapter 5 of the A.R.S. assigns the authority to establish and amend the health insurance premium subsidy benefit provisions to the Arizona State Legislature. As of July 1, 2013, the PSPRS and the CORP each administers a separate healthcare plan as defined under IRC § 401(h). In addition, the PSPRS and the CORP are statutorily authorized, by A.R.S. § 38-857 and A.R.S. § 38-906, respectively, to maintain a separate account for the health insurance premium subsidy assets and benefit payments. The health insurance premium subsidy assets are accounted for by employer and are available to pay only the health insurance premium benefit. In prior fiscal years, the health insurance premium subsidy benefit was not administered as a trust or equivalent arrangement and in accordance with GASB Statement No. 43, was reported as an agency fund. As a result of this treatment, contributions in excess of the health insurance subsidy benefit payments were reported as an OPEB obligation and as excess pension contributions in the pension benefit plan. In fiscal year 2014, the plans transferred prior year health insurance premium subsidy contributions that exceeded benefit payments from each plan’s pension fund to the new health insurance fund. The PSPRS and the CORP each issue publicly available financial reports that include the financial information and disclosure requirements for the health insurance subsidy benefits. Information on how to obtain these reports is included in Note 1.A.

STATE OF ARIZONA NOTES TO THE FINANCIAL STATEMENTS JUNE 30, 2014
- 97 -
B. CONTRIBUTIONS, BENEFITS, AND REFUND PAYMENTS Cost-sharing plan The ASRS recognition of contributions, benefits, and refund payments for the HBS plan and the LTD plan are the same as the pension benefit in Note 5.B.
Agent plans
The PSPRS and the CORP recognition of employer contributions and refunds for the health insurance subsidy benefit are the same as the pension benefit in Note 5.B. Health insurance subsidy benefits are recognized when due and payable in accordance with the terms of the plan. C. FUNDING POLICY
The contribution requirements of plan members and the State are established by Title 38, Chapter 5 of the A.R.S. These contribution requirements are established and may be amended by the Arizona State Legislature.
Cost-sharing plan
For the year ended June 30, 2014, active ASRS members and the State were each required by statute to contribute at the actuarially determined rate of 0.24% of the members' annual covered payroll for LTD. In addition, the State also contributed 0.60% for the HBS. The State's contributions for LTD to the ASRS for the years ended June 30, 2014, 2013, and 2012 were $4.5 million, $4.3 million, and $4.4 million, respectively, for the primary government which were equal to the required contributions for these years. The State's contributions for the HBS to the ASRS for the years ended June 30, 2014, 2013, and 2012 were $11.3 million, $11.8 million, and $11.5 million, respectively, for the primary government which were equal to the required contributions for these years.
Agent plans
For the year ended June 30, 2014, the PSPRS participating State agencies were required to contribute at actuarially determined rates of 1.28 – 4.60% of covered payroll. The CORP participating State agencies were required to contribute at actuarially determined rates of 0.92 – 1.52% of covered payroll.
D. ANNUAL OPEB COST
The State's annual OPEB cost and OPEB contributions made to each of the agent, multiple-employer defined benefit post-employment plans for the year ended June 30, 2014, is as follows (expressed in thousands):
Annual OPEB Costs
OPEB Contributions Made
PSPRS $ 2,070 $ 2,070 CORP 4,838 4,838
The State's annual OPEB costs, the percentage of annual OPEB cost contributed to the plan, and the net OPEB obligation (refer to Note 6.A. for explanation) for the current and preceding year for each of the agent, multiple-employer defined benefit post-employment plans, is as follows (expressed in thousands):
Fiscal Year
Ended Annual OPEB
Costs
Percentage of Annual Cost Contributed
Net OPEB Obligation
PSPRS 6/30/2014 $ 2,070 100.0% $ - 6/30/2013 2,158 74.6% 3,175 6/30/2012 2,225 77.6% 2,627 CORP 6/30/2014 4,838 100.0% - 6/30/2013 5,179 41.7% 15,874 6/30/2012 5,213 42.7% 12,854

STATE OF ARIZONA NOTES TO THE FINANCIAL STATEMENTS JUNE 30, 2014
- 98 -
E. FUNDED STATUS AND FUNDING PROGESS
The State’s funded status for each of the agent, multiple-employer defined benefit post-employment plans, as of the year ended June 30, 2014, is as follows (expressed in thousands):
Funded AAL as a Actuarial Actuarial Actuarial Annual Percentage Valuation Value of Accrued Funded Funded Covered of Covered
Plan Date Plan Assets Liability (AAL) AAL Ratio Payroll Payroll PSPRS 6/30/2014 $ 35,607 $ 29,668 $ 5,939 120.0% $ 85,973 6.9% CORP 6/30/2014 72,713 62,623 10,090 116.1% 350,313 2.9%
Actuarial valuations of an ongoing plan involve estimates of the value of reported amounts and assumptions about the probability of occurrence of events far into the future. Examples include assumptions about future employment, mortality, and healthcare cost trends. Actuarially determined amounts are subject to continual revision as actual results are compared with past expectations and new estimates are made about the future. The required schedule of funding progress immediately following the notes to the financial statements presents multi-year trend information about whether the actuarial value of the plan assets is increasing or decreasing over time relative to the actuarial accrued liability for benefits.
F. ACTUARIAL METHODS AND ASSUMPTIONS
Projections of benefits for financial reporting purposes are based on the plan and include the types of benefits provided at the time of each valuation. The actuarial methods and assumptions used include techniques that are designed to reduce short-term volatility in actuarial accrued liabilities and the actuarial value of assets, consistent with the long-term perspective of the calculations.
The State’s actuarial methods and significant assumptions for each of the agent, multiple-employer defined benefit post-employment plans for the most recent actuarial valuation as of 6/30/2014 and actuarial valuation as of 6/30/2012 that was used to determine the fiscal year 2014 annual required contribution are as follows:
PSPRS CORP PSPRS CORP Actuarial valuation date 6/30/2012 6/30/2012 6/30/2014 6/30/2014 Actuarial cost method entry age normal entry age normal entry age normal entry age normal Actuarial assumptions: Investment rate of return 8.0% 8.0% 7.85% 7.85% Projected salary increases 5.0 – 9.0% 5.0 – 8.25% 4.0 – 8.0% 4.0 – 7.25% Payroll growth 5.0% 5.0% 4.0% 4.0% Cost-of-living adjustments none none n/a (1) Amortization method level percent-of-pay
closed level percent-of-pay
closed level percent-of-pay
closed level percent-of-
pay closed Remaining amortization period
24 years for unfunded, 20 years
for overfunded
24 years for unfunded, 20 years
for overfunded
22 years for unfunded, 20 years
for overfunded
22 years for unfunded, 20 years
for overfunded Asset valuation method 7-year smoothed
market 7-year smoothed
market 7-year smoothed
market 7-year smoothed
market 80%/120% market 80%/120% market 80%/120% market 80%/120% market Permanent Benefit Increases n/a n/a (2) n/a (1) Members Retired on or before July 1, 2011: 2.25% of benefit Members Retired on or after August 1, 2011: 0.5% of benefit. (2) Members Retired on or before July 1, 2011: 2.0% compounded on average Members Retired on or after August 1, 2011: 0.5% compounded on average. Since all current retirees receive the same dollar increase amount, approximation techniques were used to develop the assumed PBI for each member.

STATE OF ARIZONA NOTES TO THE FINANCIAL STATEMENTS JUNE 30, 2014
- 99 -
NOTE 7. LONG-TERM OBLIGATIONS
A. REVENUE BONDS
Governmental Activities
1. Department of Administration
The State has pledged portions of its revenues towards the payment of debt service on the State Lottery Revenue Bonds Series 2010A. These bonds provide additional working capital to the State to pay appropriated expenditures of the State’s General Fund. The bonds are payable solely from and secured by pledged revenues consisting of, until July 1, 2012, amounts distributable to the State’s General Fund from the State Lottery pursuant to Lottery law, and from and after July 1, 2012, all Lottery revenues deposited to the Lottery Fund net of operating expenses of the Lottery. At June 30, 2014, pledged revenues totaled $174.4 million, of which 21.5% ($37.5 million) was required to cover debt service. Future pledged revenues required to pay all remaining debt service for the bonds through final maturity of July 1, 2029 is $562.5 million.
2. Arizona Department of Transportation
The ADOT has issued Senior and Subordinated Lien Highway Revenue Bonds to provide funds for acquisition of right-of-way, design, and construction of federal and state highways. The balance of Highway Revenue Bonds issued in prior years and outstanding at the start of the fiscal year was $1.7 billion. During the year, no new Highway Revenue Bonds were issued.
The Highway Revenue Bonds are secured by a prior lien on and a pledge of motor vehicle and related fuel fees and taxes. On September 21, 2006, House Bill 2206 became effective and eliminated the restriction that limited the principal amount of the Highway Revenue Bonds that could be outstanding at any time to $1.3 billion. Also during fiscal year 2007, the ADOT received legislative authority to begin issuing Highway Revenue Bonds with maturities of up to 30 years in length, replacing the 20 year maturity requirement that had been in place since 1980.
The ADOT has pledged future motor vehicle and related fuel fees and taxes to repay $1.7 billion in outstanding Highway Revenue Bonds issued since 2001. Proceeds from the bonds finance portions of the ADOT’s Five Year Transportation Facilities Construction Program. The bonds are payable solely from motor vehicle and related fuel fees and taxes and are payable through 2038. The total principal and interest remaining to be paid on the bonds is $2.6 billion. Principal and interest paid for the current year and total pledged revenues were $139.0 million and $537.8 million, respectively. The annual principal and interest payments on the bonds required 25.8% of the pledged revenues.
The Maricopa County Regional Area Road Construction Fund is used to record all payments of principal and interest for Transportation Excise Tax Revenue Bonds issued by the ADOT. These bonds are secured by a portion of transportation excise taxes collected by the Arizona Department of Revenue on behalf of Maricopa County. The balance of Transportation Excise Tax Revenue Bonds issued in prior years and outstanding at the start of the fiscal year was $926.0 million.
The ADOT has pledged future transportation excise taxes to repay $867.4 million in outstanding Transportation Excise Tax Revenue Bonds issued since 2007. Proceeds from the bonds pay the costs of design, right-of-way purchase, or construction of certain freeways and other routes within Maricopa County, AZ. The bonds are payable solely from transportation excise taxes and are payable through 2025. The total principal and interest remaining to be paid on the bonds is $1.1 billion. Principal and interest paid for the current year and total pledged revenues were $103.6 million and $243.8 million, respectively. The annual principal and interest payments on the bonds required 42.5% of the pledged revenues.
In prior fiscal years, the ADOT refinanced various bond issues through advance-refunding arrangements. Under the terms of the refunding bond issues, sufficient assets to pay all principal, redemption premium, if any, and interest on the refunded bond issues have been placed in irrevocable trust accounts at commercial banks and invested in U.S. Government securities which, together with interest earned thereon, will provide amounts sufficient for future payment of principal and interest of the issues refunded. The assets, liabilities, and financial transactions of these trust accounts and the liability for the defeased bonds are not reflected in the accompanying financial statements. Refunded bonds for the ADOT at June 30, 2014 totaled $709.3 million.
STATE OF ARIZONA NOTES TO THE FINANCIAL STATEMENTS JUNE 30, 2014
- 100 -
3. School Facilities Board
In prior fiscal years, the School Facilities Board (SFB) refinanced various bond issues through advance-refunding arrangements. Under the terms of the refunding bond issues, sufficient assets to pay all principal, redemption premium, if any, and interest on the refunded bond issues have been placed in irrevocable trust accounts at commercial banks and invested in U.S. Government securities which, together with interest earned thereon, will provide amounts sufficient for future payment of principal and interest of the issues refunded. The assets, liabilities, and financial transactions of these trust accounts and the liability for these legally defeased bonds are not reflected in the accompanying financial statements.
The SFB has pledged portions of its gross revenues towards payment of debt related to State school improvement revenue bonds, State school improvement revenue refunding bonds, State school trust revenue bonds, and State school trust revenue refunding bonds outstanding at June 30, 2014. These bonds finance the correction of existing deficiencies in school facilities in the State of Arizona. These pledged revenues include Education Transaction Privilege Taxes approved by voters as part of Proposition 301 and expendable State School Trust Revenues. Expendable State School Trust Revenues include State Trust Lands’ land lease revenue, interest earnings on land sales financed over time, and a formula distribution from the State’s Permanent Fund prescribed by the State’s Constitution. Pledged revenues do not include sales of State Trust Lands, sales of natural products derived from State Trust Lands, or royalties from minerals extracted from State Trust Lands. These revenues are held in perpetuity for the benefit of various beneficiaries of the State Land Trust and are not available to pay debt service. Expendable State School Revenues in excess of $72.263 million are not available to pay debt service on the State school trust revenue bonds and State school trust revenue refunding bonds per the debt documents. At June 30, 2014, pledged revenues totaled $659.2 million, of which 12.2% ($80.5 million) was required to cover current year debt service. Future pledged revenues required to pay all future debt service on these bonds through final maturity of July 1, 2020 is $504.6 million.
Business-Type Activities
4. Universities
a. University of Arizona
The U of A’s bonded debt consists of various issues of system revenue bonds and Stimulus Plan for Economic and Educational Development (SPEED) revenue bonds that are generally callable with interest payable semi-annually. Bond proceeds are used to pay for acquiring or constructing capital facilities and infrastructure and for refunding obligations from previously issued bonds.
For all outstanding SPEED revenue bonds, up to 80% of the debt service payments are payable from the U of A’s SPEED revenue bond account monies, which are derived from certain revenues of the Lottery. To the extent SPEED revenue bond account monies are not sufficient to make debt service payments, the SPEED revenue bonds are secured by a pledge of certain gross revenues, such as student tuition and fees, but that pledge is subordinate to the pledge of those gross revenues for the U of A’s system revenue bonds.
In fiscal year 2013, the U of A refunded, in advance of maturity, a portion of the outstanding System Revenue Bonds Series 2005A. At June 30, 2014, the outstanding principal balance on the refunded bonds was $26.5 million, which will be paid by investments held in an irrevocable trust with a fair value of $27.7 million. Accordingly, the trust account assets and liability for the defeased bonds are not included in the accompanying financial statements.
The U of A’s outstanding Series 2010 SPEED Revenue Bonds were issued as designated Build America Bonds under the provisions of the American Recovery and Reinvestment Act (ARRA). As such, the U of A is eligible to receive direct payments from the U.S. Treasury Department equal to 35% of the interest payments on such bonds on each interest payment date. In order to receive such payments, the U of A must file certain required information with the Federal government between 90 and 45 days prior to the interest payment date. The amount paid to the U of A by the Federal government may be reduced or eliminated due to such issues as failure by the U of A to submit the required information, any amounts owed by the U of A to the Federal government, or changes in the law that would reduce or eliminate such payments. Due to the federal sequestration, the U of A will receive a 7.2% reduction (totaling $116 thousand) in the federal interest subsidy for the August 1, 2014 debt service payment. There is no guidance from the Internal Revenue Service on sequestration reductions for February 1 and August 1, 2015 debt service payments.

STATE OF ARIZONA NOTES TO THE FINANCIAL STATEMENTS JUNE 30, 2014
- 101 -
The U of A has pledged portions of its gross revenues towards the payment of debt related to all system revenue bonds, system revenue refunding bonds, and SPEED revenue bonds outstanding at June 30, 2014. The bonds generally provide financing for various capital projects of the U of A. These pledged revenues include student tuition and fees, auxiliary enterprise revenue, sales and service revenue, and other operating revenues such as indirect cost recovery and certain investment income. Pledged revenues do not include State appropriations, gifts, endowment income, or other restricted revenues. For fiscal year 2014, pledged revenues totaled $1.0 billion, of which 5.9% ($60.8 million) was required to cover current year debt service. Future annual principal and interest payments on the bonds are expected to require approximately 4% of pledged revenues. Future pledged revenues required to pay all remaining debt service for the bonds through final maturity of August 1, 2048 is $1.4 billion.
b. Northern Arizona University
The NAU’s bonded debt consists of various issues that are generally callable at a prescribed date with interest payable semi-annually. All issues are at a fixed rate. Bond proceeds primarily pay for acquiring, constructing, or renovating capital facilities. System revenue bonds are repaid from pledged gross revenues that primarily consist of student tuition and fees and certain auxiliary revenues.
On May 8, 2014, the NAU sold $67.3 million of Systems Revenue and Refunding Bonds Series 2014 (2014 Bonds) for the purpose of the construction and equipping approximately 120,000 square feet of regulation indoor aquatic and tennis spaces for athletic and intramural activities, 90,000 square feet of regulation outdoor tennis courts and a recreation field, renovation of approximately 254,000 gross square feet of existing residential units containing five residential properties to current fire codes, and improvements to infrastructure, including installation of new water supply piping through rock, roads, and existing landscaping. The 2014 Bonds include serial bonds of $43.0 million, with interest rates ranging from 3.00% to 5.00%. The 2014 Bonds also include two term bonds that are subject to annual sinking fund contributions. The first term bond is for $14.9 million with an interest rate of 5.00% that matures June 1, 2040. The second term bond is for $9.4 million with an interest rate of 5.00% that matures June 1, 2044. Refunded were $6.9 million of the 2004 Systems Revenue Bonds for maturities from June 1, 2018 to June 1, 2031, and $9.4 million from the Systems Revenue Bonds Series 2005 for maturities from June 1, 2016 through June 1, 2029 and June 1, 2036 through June 1, 2040. The refunding set aside $17.4 million into escrow that purchased SLGS Certificates with maturities between June 1, 2014 and June 1, 2015. The present value of the refunded debt prior to May 8, 2014 was $18.6 million and the net present value savings was $938 thousand. The advance refunding decreases the NAU’s debt service by $377 thousand in year one. In addition, annual debt service decreases by an average of $33 thousand in years two through twenty-seven.
In the current and prior years, the NAU defeased certain revenue bonds by either placing the proceeds of new bonds, or cash and investments accumulated in a sinking fund, in an irrevocable trust to provide for all future debt service payments on the refunded bonds. Accordingly, the trust account assets and the liability for the defeased bonds are not included in the accompanying financial statements. At June 30, 2014, $24.6 million of such bonds outstanding are considered defeased.
The Series 2009A and 2010 Bonds were issued as designated Build America Bonds under the provisions of the ARRA. As such, the NAU is eligible to receive direct payments from the U.S. Treasury Department equal to 35% of the interest payments on such bonds on each interest payment date. In order to receive such payments, the NAU must file certain required information with the Federal government between 90 and 45 days prior to the interest payment date. The amount paid to the NAU by the Federal government may be reduced or eliminated due to such issues as failure by the NAU to submit the required information, any amounts owed by the NAU to the Federal government, or changes in the law that would reduce or eliminate such payments. During fiscal year 2014, the Federal government reduced federal direct payment claims filed between December 1, 2013 and September 1, 2014 by 7.2% due to the federal budget sequestration resulting in a $271 thousand reduction in direct payments to the NAU. For accounting purposes, any direct payments received from the U.S. Treasury Department are recorded as non-operating revenue.
For the 2010 and 2013 revenue bonds, up to 80% of the debt service payments are payable from the NAU’s SPEED revenue bond account monies, which are derived from certain revenues of the Lottery. To the extent SPEED revenue bond account monies are not sufficient to make debt service payments, the SPEED revenue bonds are secured by a pledge of certain gross revenues, such as student tuition and fees, but that pledge is subordinate to the pledge of those gross revenues for the NAU’s system revenue bonds.
STATE OF ARIZONA NOTES TO THE FINANCIAL STATEMENTS JUNE 30, 2014
- 102 -
The NAU has pledged portions of its gross revenues towards the payment of debt related to system revenue bonds, system revenue refunding bonds, and SPEED revenue bonds outstanding at June 30, 2014. The bonds generally provide financing for various capital projects of the NAU. These pledged revenues include student tuition and fees, certain auxiliary enterprises revenue, investment income, and indirect cost recovery revenue. Pledged revenues do not include State appropriations, gifts, endowment income, or other restricted revenues. Pledged revenues have averaged $214.1 million for the prior five years. For fiscal year 2014, pledged revenues totaled $252.2 million, of which 10.1% ($25.4 million) was required to cover current year debt service. Future annual principal and interest payments on the bonds are expected to require approximately 12% of pledged revenues. Future pledged revenues required to pay all remaining related debt service for the bonds through final maturity of June 1, 2044 are $904.5 million.
c. Arizona State University
At June 30, 2014, the ASU had issued a combination of fixed and variable rate bonds. The ASU’s long-term obligations generally are structured with level debt service, semi-annual interest, and call options at a prescribed date. Certain revenue bonds of the ASU have been defeased through advance refundings by depositing sufficient U.S. Government securities in an irrevocable trust to pay all future debt service. Accordingly, the liabilities for these defeased bonds are not included in the accompanying financial statements. The principal amount of all defeased bonds outstanding at June 30, 2014 totaled $16.5 million.
The ASU has pledged gross revenues as defined in the bond indentures towards the payment of debt related to various senior lien system revenue bonds outstanding at June 30, 2014. These related system revenue bonds are primarily for new academic and research facilities, academic and laboratory renovations, and infrastructure improvements. The pledged revenues include student tuition and fees, certain auxiliary enterprises revenue, investment income, and indirect cost recovery revenue. Pledged revenues do not include State appropriations, gifts, endowment income, or other restricted revenues. For the year ended June 30, 2014, pledged revenues totaled $1.2 billion, of which 7.3% ($84.4 million, net of federal direct payments) was required to cover current year debt service. Future pledged revenues required to pay all remaining debt service for senior and subordinate revenue bonds through final maturity of August 1, 2044 is $1.6 billion. In addition to a senior pledge of revenues for the ASU system revenue bonds, the ASU has pledged the same revenues on a subordinated basis to secure the ASU SPEED revenue bonds and the Series 2006 Arizona State University Research Park, Inc. Development Refunding Bonds. Research Park bonds outstanding at June 30, 2014 were $7.0 million with annual debt service payments of approximately $1.2 million through July 1, 2021.
In June 2008, the Legislature approved the SPEED which provides the ASU with capital improvement funds for critical construction and deferred maintenance projects. SPEED projects are debt financed with revenue bonds, repaid primarily with Lottery revenues. Specifically, up to 80% of SPEED debt service is paid from Lottery revenues, with the balance being the responsibility of the ASU as evidenced by the subordinated pledge of the ASU revenues.
In April 2014, the ASU issued $77.6 million in SPEED revenue bonds, Series 2014, with an average maturity of 13.9 years and an average interest rate of 3.72%. The bonds were issued to fund classroom and laboratory renovations, building and infrastructure enhancements and modifications, and a portion of the construction costs for the College Avenue Commons, a new Tempe campus mixed-use facility.
The Taxable Series 2010A System Revenue Bonds and the Taxable Series 2010A SPEED Revenue Bonds were issued as Build America Bonds under the provisions of the ARRA. As such, the ASU is eligible to receive Federal Direct Payments from the U.S. Treasury equal to 35% of the interest owed on each interest payment date. The amount paid to the ASU by the Federal government may be reduced or limited due to such issues as failure by the ASU to submit the required information, offsets to reflect any amounts owed by the ASU to the Federal government, or changes in the law that would reduce or eliminate such payments. During fiscal year 2014, the Federal government reduced federal direct payment claims by 7.2% due to federal budget sequestration resulting in a $300 thousand reduction in direct payments to the ASU. For accounting purposes, any direct payments received from the U.S. Treasury are recorded as nonoperating revenue.
The ASU has outstanding two series of variable rate demand system revenue refunding bonds, Series 2008A and Series 2008B, totaling $94.3 million with final maturities of July 1, 2034. The interest rate in effect on June 30, 2014 was 0.04% for the Series 2008A Bonds and 0.07% for the Series 2008B Bonds. To provide credit and liquidity support for the bonds, on March 1, 2012, the ASU entered into an Irrevocable Transferable Direct-Pay Letter of Credit (LOC) with JPMorgan Chase Bank, N.A. (JPMorgan), under which the ASU has agreed to a commitment fee for the LOC of 0.38% per annum. Should the Series 2008A/B bond rating change, the commitment fee could increase according to the fee agreement. Assuming all of the $47.14

STATE OF ARIZONA NOTES TO THE FINANCIAL STATEMENTS JUNE 30, 2014
- 103 -
million Series 2008A and $47.14 million Series 2008B bonds are not resold within 365 days, the ASU would be responsible to make quarterly installment principal payments, with the last payment on the fourth anniversary of JPMorgan acquiring the bonds, plus interest to be calculated as established in the LOC.
Securities and cash restricted for bonds debt service held by the trustee at June 30, 2014 totaled $63.6 million.
The ASU presently plans to issue up to $170.4 million in system revenue bonds prior to calendar year end 2015.
Effective January 1, 2007, the ASU entered into a $103.0 million notional amount swap agreement (hedging derivative instrument) expiring on July 1, 2034, in conjunction with the 2008 variable rate demand system revenue refunding bonds (2008 Bonds). The $103.0 million notional amount is not exchanged; it is only the basis on which the interest payments are calculated and it decreases as principal payments are made on the 2008 Bonds. The intention of the swap is to effectively convert the variable rate interest on the 2008 Bonds to a synthetic fixed rate. Under the terms of the swap agreement, the ASU pays the counterparty interest calculated at a fixed rate of 3.91% and receives payments from the counterparty based on the Securities Industry and Financial Markets Association (SIFMA) Municipal Swap Index set weekly. The SIFMA rate at June 30, 2014 was 0.06%. At June 30, 2014, the synthetic fixed interest rate on the bonds was:
Interest Rate Swap Terms Rates (%) Fixed payment to counterparty Fixed 3.91 Variable payment from counterparty SIFMA (0.06) Net interest rate swap payments 3.85 Variable-rate bond coupon payments Spread to SIFMA 0.06 Synthetic fixed interest rate on bonds 3.91
The ASU continues to pay interest to the bondholders at the variable rate provided by the bonds. However, during the term of the swap agreement, the ASU effectively pays a fixed rate on the debt. If the counterparty defaults or if the swap is terminated, the ASU will revert to paying a variable rate. A termination of the swap agreement may also result in the ASU making or receiving a termination payment.
The ASU is exposed to interest rate risk based on the SIFMA indexed variable payment received from the counterparty versus the variable rate paid to bondholders. The swap exposes the ASU to basis risk should the weekly SIFMA rate paid by the counterparty fall below the weekly interest rate due on the bonds.
As of June 30, 2014, the ASU was not exposed to credit risk because the swap had a negative fair value. However, should interest rates change and the fair value of the swap become positive, the ASU would be exposed to credit risk in the amount of the derivative's fair value. The swap counterparty was rated A by Fitch, A by S&P and A2 by Moody's as of June 30, 2014. Based on current ratings, the counterparty was not required to provide collateral. In the event a rating downgrade occurs, the counterparty may be required to provide collateral if the ASU's overall exposure exceeds predetermined levels. Collateral may be held by the ASU or a third party custodian.
As of June 30, 2014, the swap had a fair value of $(14.1) million, which represents the cost to the ASU to terminate the swap. The June 30, 2013 fair value was $(14.1) million. The fair value was developed by an independent third party, with no vested interest in the transaction, using the zero-coupon discounting method. This method calculates the future payments required by the swap, assuming the current forward rates implied by the yield curve are the market's best estimate of future spot interest rates. These payments are then discounted using the spot rates implied by the current yield curve for a hypothetical zero-coupon rate bond due on the date of each future net settlement on the swaps. In accordance with GASB 53, as amended by GASB 63, the fair value of the ASU's hedging derivative instrument is reported on the statement of net position as a deferred outflow of resources (interest rate swap) and a liability (derivative instrument - interest rate swap).

STATE OF ARIZONA NOTES TO THE FINANCIAL STATEMENTS JUNE 30, 2014
- 104 -
Summary of Revenue Bonds
The following schedule summarizes revenue bonds outstanding at June 30, 2014 (expressed in thousands):
Revenue Bonds Outstanding
Dates Issued
Maturity Dates
Interest Rates
Outstanding Balance at
June 30, 2014
Governmental Activities: Department of Transportation 2001-2013 2015-2038 .60-5.25% $ 2,542,175 School Facilities Board 2002-2013 2015-2020 .14-5.00% 472,835 Department of Administration 2010 2015-2029 3.00-5.00% 391,185 Business-type Activities: University Revenue Bonds 1992-2014 2015-2049 .06-6.64% 2,302,035
Principal and interest debt service payments on revenue bonds outstanding at June 30, 2014 are as follows (expressed in thousands):
B. GRANT ANTICIPATION NOTES
Grant Anticipation Notes (GANs) are issued by the ADOT and secured by revenues received from the Federal Highway Administration under grant agreements and certain other federal-aid revenues. The balance of GANs issued in prior years and outstanding at the start of the fiscal year was $296.2 million.
In prior fiscal years, the ADOT refinanced various GAN issues through advance-refunding arrangements. Under the terms of the refunding GAN issues, sufficient assets to pay all principal, redemption premium, if any, and interest on the refunded GAN issues have been placed in irrevocable trust accounts at commercial banks and invested in U.S. Government securities which, together with interest earned thereon, will provide amounts sufficient for future payment of principal and interest of the issues refunded. The assets, liabilities, and financial transactions of these trust accounts and the liability for the defeased GANs are not reflected in the accompanying financial statements. Refunded GANs for the ADOT at June 30, 2014 totaled $25.7 million.
The ADOT has pledged federal revenues to repay $247.7 million in outstanding GANs issued since 2004. Proceeds from the GANs pay the costs of design, right-of-way purchase, or construction of certain freeways and other routes within Arizona. The GANs are payable solely from federal revenues and are payable through 2026. The total principal and interest remaining to be paid on the GANs is $313.4 million. Principal and interest paid for the current year and total pledged revenues were $64.9 million and $688.1 million, respectively. The annual principal and interest payments on the GANs required 9.4% of the pledged revenues.
Annual Debt Service Governmental Activities Business-type Activities
Fiscal Year
Total Principal
Total Interest
Total
Total Principal
Total Interest
Net Payments (Receipts) on
Swap Agreement
Total 2015 $ 217,970 $ 149,585 $ 367,555 $ 75,010 $ 108,916 $ 3,507 $ 187,433 2016 240,260 140,677 380,937 76,730 105,791 3,401 185,922 2017 242,020 132,565 374,585 90,440 102,352 3,290 196,082 2018 271,085 123,493 394,578 83,945 99,137 3,173 186,255 2019 236,790 114,411 351,201 85,180 95,610 3,050 183,840
2020-2024 1,067,185 432,378 1,499,563 454,945 416,911 13,181 885,037 2025-2029 707,660 200,615 908,275 501,360 298,184 9,048 808,592 2030-2034 323,075 66,608 389,683 412,420 185,088 3,773 601,281 2035-2039 100,150 11,649 111,799 314,605 95,400 - 410,005 2040-2044 - - - 167,275 27,782 - 195,057 2045-2049 - - - 40,125 3,586 - 43,711
Total $ 3,406,195 $ 1,371,981 $ 4,778,176 $ 2,302,035 $ 1,538,757 $ 42,423 $ 3,883,215

STATE OF ARIZONA NOTES TO THE FINANCIAL STATEMENTS JUNE 30, 2014
- 105 -
Grant Anticipation Notes currently outstanding are as follows (expressed in thousands):
Grant Anticipation Notes Outstanding
Dates Issued
Maturity Dates
Interest Rates
Outstanding Balance at
June 30, 2014 Governmental Activities: Department of Transportation 2004-2012 2015-2026 3.00-5.25% $ 247,710
Future debt service principal and interest payments on Grant Anticipation Notes issues for fiscal years ended June 30 are summarized below (expressed in thousands):
Annual Debt Service
Governmental Activities
Fiscal Year Total
Principal Total
Interest Total Debt
Service
2015 $ 53,040 $ 11,855 $ 64,895
2016 47,350 9,552 56,902
2017 11,770 7,393 19,163
2018 12,325 6,838 19,163
2019 12,925 6,240 19,165
2020-2024 74,785 21,035 95,820
2025-2026 35,515 2,816 38,331
Total $ 247,710 $ 65,729 $ 313,439 C. CERTIFICATES OF PARTICIPATION
Governmental Activities
1. Department of Administration
The State has issued COPs to finance construction or improvements of various capital assets. Additionally, the State issued COPs Series 2010A and 2010B to finance the acquisition of certain property from the State by the trustee, with which the proceeds of were deposited to the State’s General Fund to pay appropriated expenditures of the State. The COPs Series 2010A and 2010B sale-leaseback transactions are nominal sales, with the State retaining all rights of ownership and control of the properties. Accordingly, they are accounted for under the financing method since the State has such an extensive continuing involvement in the properties for the entire duration of the agreement. The State’s obligation to make lease payments and any other obligations of the State under the lease are subject to, and dependent upon, annual appropriations made by the Legislature and annual allocations of such appropriations being made by the Department of Administration for such purpose. The Department of Administration agrees to use its best efforts to budget, obtain, allocate, and maintain sufficient appropriated monies to make lease payments. In the event any such appropriation and allocation is not made, the leases will terminate and there can be no assurance that the proceeds for the re-leasing or sale of the projects will be sufficient to pay principal and interest with respect to the then outstanding COPs. The scheduled payments of principal and interest with respect to the COPs are guaranteed under certificate insurance policies. The State’s obligation to make lease payments does not constitute a debt or liability of the State within the meaning of any constitutional or statutory limitation. Neither the full faith and credit nor the general taxing power of the State is pledged to make payments of principal or interest due with respect to the COPs. Such payments will be made solely from amounts derived under the terms of the lease, including lease payments, and amounts from time to time on deposit under the terms of the declaration of trust.
In prior fiscal years, the State refinanced various COPs through advance-refunding arrangements. Under the terms of the refundings, sufficient assets to pay all principal, redemption premiums, if any, and interest on the refunded COPs have been placed in irrevocable trust accounts at commercial banks and invested in U.S. securities which, together with interest earned thereon, will provide amounts sufficient for future payment of principal and interest of the issues refunded. The assets, liabilities, and financial transactions of these trust accounts and the liability for these legally defeased COPs are not reflected in the accompanying financial statements.

STATE OF ARIZONA NOTES TO THE FINANCIAL STATEMENTS JUNE 30, 2014
- 106 -
2. School Facilities Board
On December 19, 2013, the SFB issued Refunding Certificates of Participation Series 2013A-1 and 2013A-2 (2013A-1 COPs and 2013A-2 COPs) for $29.9 million and $49.6 million, respectively. The 2013A-1 COPs include $29.9 million of serial certificates with interest rates ranging from 2.00% to 5.00% and maturity dates ranging from 2015 to 2020. The 2013A-1 COPs are not subject to optional redemption prior to maturity, however, these COPs are subject to defeasance pursuant to the debt documents. The SFB realized net proceeds from the 2013A-1 COPs of $32.5 million, after receipt of $2.8 million issue premium and payment of $173 thousand for underwriters’ discount and issuance costs. The net proceeds of the 2013A-1 COPs were used to advance-refund the Series 2003B COPs with an outstanding principal balance of $15.2 million, and to advance-refund $16.3 million of the Series 2004A COPs with an outstanding principal balance of $19.9 million. The advance-refundings resulted in combined debt service savings of $1.3 million and a combined net present value economic gain of $1.6 million (difference between the present values of the old debt and new debt service payments). The advance-refundings also resulted in an immaterial difference between the reacquisition price and the net carrying amount of the old debt of $162 thousand. This difference is reported as a reduction of interest expense in the accompanying financial statements. The refunded Series 2003B COPs were redeemed on January 21, 2014. The refunded Series 2004A COPs will be redeemed on September 1, 2014 by investments in United States government obligations held in an irrevocable trust. The 2013A-2 COPs include $49.6 million of serial certificates with interest rates ranging from 2.00% to 5.00% and maturity dates ranging from 2015 to 2019. The 2013A-2 COPs are not subject to optional redemption prior to maturity; however, these COPs are subject to defeasance pursuant to the debt documents. The SFB realized net proceeds from the 2013A-2 COPs of $53.3 million, after receipt of $4.0 million issue premium and payment of $273 thousand for underwriters’ discount and issuance costs. The net proceeds of the 2013A-2 COPs were used to advance-refund $29.5 million of the Series 2004B COPs with an outstanding principal balance of $43.2 million, and to advance-refund $21.3 million of the Series 2004C COPs with an outstanding principal balance of $24.9 million. The advance-refunding resulted in a debt service savings of $3.9 million and a net present value economic gain of $3.6 million (difference between the present values of the old debt and new debt service payments). The advance-refunding resulted in an immaterial difference between the reacquisition price and the net carrying amount of the old debt of $40 thousand. This difference was charged to interest expense in the accompanying financial statements. The refunded Series 2004B and 2004C COPs will be redeemed on September 1, 2014 by investments in United States government obligations held in an irrevocable trust.
On June 19, 2014, the SFB issued Taxable Refunding Certificates of Participation Series 2014A-1, 2014A-2, and 2014A-3 (2014 COPs) for a combined total of $226.1 million. The 2014 COPs include $226.1 million of serial certificates with interest rates ranging from .32% to 2.38% and maturity dates ranging from 2016 to 2020. The 2014 COPs are subject to optional prepayment prior to maturity pursuant to the debt documents. The SFB realized net proceeds from the 2014 COPs of $224.2 million, after payment of $767 thousand for underwriters’ discount and issuance costs and payment of $1.1 million for accrued interest. The net proceeds of the 2014 COPs were used to advance-refund $208.9 million of the Series 2005A-1, 2005A-2, and 2005A-3 COPs with a combined outstanding principal balance of $320.0 million. The advance-refunding resulted in a combined debt service savings of $8.3 million and a combined net present value economic gain of $8.2 million (difference between the present values of the old debt and new debt service payments). The advance-refunding resulted in a difference between the reacquisition price and the net carrying amount of the old debt of $9.6 million. This difference, reported as a deferred outflow of resources in the accompanying financial statements, is being amortized to interest expense on a straight-line basis through fiscal year 2020. The refunded Series 2005A-1, 2005A-2, and 2005A-3 COPs will be redeemed on September 1, 2015 by investments in United States government obligations held in an irrevocable trust.
The SFB Series 2010 COPs are not subject to mandatory sinking fund prepayment. However, as a means to provide a source of funds that will be available to pay the principal with respect to the Series 2010 COPs at maturity, the lease agreement with the trustee for the 2010 COPs will provide for mandatory sinking fund payments to be made as part of the base rent due under the lease. The SFB Series 2010 COPs are subject to extraordinary mandatory prepayment from unexpended proceeds pursuant to the debt documents. On February 6, 2014, the SFB redeemed $9.5 million of the Series 2010 COPs pursuant to the extraordinary mandatory prepayment provisions in the debt documents. Beginning August 15, 2012, annual deposits to the sinking fund were scheduled to be made on August 15 of each year through August 15, 2027, at which time, the accumulated balance (including investment earnings and losses) in the sinking fund will be sufficient to retire the Series 2010 COPs on their stated maturity date of September 1, 2027. The sinking fund deposit requirements were adjusted to reflect the extraordinary mandatory prepayment redemption which occurred on February 6, 2014. In current and prior fiscal years, the SFB refinanced various COPs through advance-refunding arrangements. Under the terms of the refundings, sufficient assets to pay all principal, redemption premiums, if any, and interest on the refunded COPs have been placed in irrevocable trust accounts at commercial banks and invested in U.S. securities which, together with interest earned thereon, will provide amounts sufficient for future payment of principal and interest of the issues refunded. The assets, liabilities,

STATE OF ARIZONA NOTES TO THE FINANCIAL STATEMENTS JUNE 30, 2014
- 107 -
and financial transactions of these trust accounts and the liability for these legally defeased COPs are not reflected in the accompanying financial statements. Business-Type Activities 3. Universities
a. University of Arizona
The U of A utilizes COPs and various capital leases to acquire buildings, equipment, and land. The COPs are generally callable and are subject to prepayment.
b. Northern Arizona University The NAU’s COPs consist of various issues that are generally callable at a prescribed date with interest payable semiannually. All issues are at a fixed rate. In prior fiscal years, the NAU defeased certain COPs by either placing the proceeds of new COPs, or cash and investments accumulated in a sinking fund, in an irrevocable trust to provide for all future debt service payments on the refunded COPs. Accordingly, the trust account assets and liability for the defeased COPs are not included in the accompanying financial statements. At June 30, 2014, $46.0 million of such outstanding COPs are considered defeased. c. Arizona State University At June 30, 2014, the ASU has issued fixed rate COPs. The ASU’s long-term obligations generally are structured with level debt service, semi-annual interest, and call options at a prescribed date. Certain COPs of the ASU have been defeased through advance refundings by depositing sufficient U.S. Government securities in an irrevocable trust to pay all future debt service. Accordingly, the liabilities for these defeased COPs are not included in the accompanying financial statements. The principal amount of all such COPs outstanding at June 30, 2014 was $67.4 million.
Securities and cash restricted for COP debt service held by the trustee at June 30, 2014 totaled $7.2 million.
A summary of the COPs issued as of June 30, 2014 is as follows (expressed in thousands):
Issue Final Original Outstanding Interest Project Date Maturity Date Amount Issued Balance Rates
Governmental Activities: Department of Administration: 4000 Bed Prison, Wastewater Upgrades, Forensic Unit 2008A 2008 2028 $ 238,990 $ 190,345 3.75 – 5.00 General Fund Budget Reconciliation 2010A 2010 2030 709,090 657,545 3.00 – 5.25 General Fund Budget Reconciliation 2010B 2010 2030 289,705 268,070 3.00 – 5.00 Refund 2001 PLTO, 2002A/2004B COPs 2013 2029 62,630 51,585 2.00 – 5.00 School Facilities Board: New School Construction 2004A 2004 2015 47,160 3,585 5.00 New School Construction 2004B 2005 2015 190,040 13,680 4.25 – 5.25 New School Construction 2004C 2005 2015 47,585 3,600 5.00 Refunding Certificates of 2003A 2005 2016 201,125 92,885 5.00 Refunding Certificates of 2003B 2005 2016 80,055 17,795 3.50 – 5.00 Refunding Certificates of 2004B 2005 2016 53,045 435 3.50 – 3.63 New School Construction 2008 2009 2024 580,035 454,870 4.00 – 5.75 Refunding Certificates of 2003B 2011 2020 11,100 11,100 3.00 – 3.50 Refunding Certificates of 2004B 2011 2020 10,000 10,000 3.00 – 5.00 Refunding Certificates of 2008 2011 2020 37,685 37,685 3.00 – 5.00 Qualified School Construction 2010 2011 2028 91,325 81,820 6.00 Refunding Certificates of 2003B and 2004A 2014 2020 29,945 29,945 2.00 – 5.00 Refunding Certificates of 2004B and 2004C 2014 2020 49,605 49,605 2.00 – 5.00 Refunding Certificates of 2005A-1 2014 2018 110,695 110,695 .32 – 1.47 Refunding Certificates of 2005A-2 2014 2019 60,390 60,390 .95 – 2.08 Refunding Certificates of 2005A-3 2014 2020 55,040 55,040 .95 – 2.38 Total Governmental Activities $ 2,955,245 $ 2,200,675

STATE OF ARIZONA NOTES TO THE FINANCIAL STATEMENTS JUNE 30, 2014
- 108 -
Principal and interest debt service requirements on COPs outstanding at June 30, 2014 are as follows (expressed in thousands):
Annual Debt Service Governmental Activities Business-type Activities Total Total
Fiscal Total Total Amount Total Total Amount Year Principal Interest Required Principal Interest Required
2015 $ 169,870 $ 96,652 $ 266,522 $ 32,234 $ 31,687 $ 63,921
2016 188,955 89,273 278,228 36,795 28,468 65,263
2017 196,540 81,620 278,160 42,820 27,822 70,642
2018 203,090 74,891 277,981 48,265 25,858 74,123
2019 174,635 67,946 242,581 50,870 23,755 74,625
2020-2024 682,045 235,703 917,748 239,926 82,629 322,555
2025-2029 503,490 91,819 595,309 161,060 34,334 195,394
2030-2031 82,050 2,049 84,099 64,375 3,186 67,561
Total $ 2,200,675 $ 739,953 $ 2,940,628 $ 676,345 $ 257,739 $ 934,084
Issue Final Original Outstanding Interest Project Date Maturity Date Amount Issued Balance Rates
Business-type Activities: Arizona State University:
2002 Certificates of Participation 2002 2019 $ 103,800 $ 935 4.76 2004 Certificates of Participation 2005 2031 80,275 23,330 4.89 2005A Certificates of Participation 2005 2031 110,115 63,430 4.36 2006 Certificates of Participation 2006 2031 15,810 12,525 4.53 2006 Refunding Certificates of Participation 2007 2027 65,890 64,580 4.15 2011A Mercado Refunding Certificates of Participation 2011 2025 8,465 7,365 4.27 2013 Refunding Certificates of Participation 2013 2027 64,780 63,340 3.09
University of Arizona: Fixed Student Union 1999 2020 21,607 2,305 5.13 – 5.30 Chem.Bldg./Res.Life/Highland Pkg.Garage/Rfnd. COPS 1994A 2004 2015 42,020 275 5.25 Refund COPs 1999A 2005 2024 12,660 12,660 4.00 – 5.00 Refund COPs 1999 2005 2024 14,825 14,825 5.00 Refund COPs 2001A 2005 2022 16,330 14,715 4.13 – 5.00 Refund COPs 1999A&B, 2000A, 2001A&B, 2002A&B,
2003A&B, 2004A 2006 2025 25,905 14,405 4.00 – 4.50 Refund COPs 1999A&B, 2000A, 2001A&B, 2002A&B,
2003A&B, 2004A 2006 2025 58,650 53,460 4.13 – 5.00 Biomedical Research Collaborative Bldg. Project 2006 2031 18,240 14,655 4.00 – 5.00 Refund COPs 2001A, 2001B, 2002A, 2004B 2007 2031 105,080 96,030 4.00 – 4.50
Refund COPs 2003A 2012 2022 10,190 9,380 1.71 – 3.42 Refund COPs 2002B 2012 2023 20,600 20,340 3.00 – 5.00 Refund COPs 2003B & 2004A 2012 2031 124,940 124,940 3.00 – 5.00 Northern Arizona University:
2004 Certificates of Participation 2005 2031 37,585 2,425 4.85 2005 Certificates of Participation 2006 2031 40,255 23,145 4.65 2006 Certificates of Participation 2006 2018 12,445 1,275 4.35 2013 Refunding Certificates of Participation 2013 2031 36,005 36,005 4.78
Total Business-type Activities $ 1,046,472 $ 676,345

STATE OF ARIZONA NOTES TO THE FINANCIAL STATEMENTS JUNE 30, 2014
- 109 -
D. LEASES
1. Leases
The State has entered into capital lease agreements for the acquisition of buildings and equipment. Capital lease assets and liabilities are reported on the government-wide Statement of Net Position. A lease is reported as a capital lease if one or more of the following criteria are met:
i Title to or ownership of the asset is transferred to the State at the end of the lease.
i The lease contains a bargain purchase option.
i The lease term is equal to 75% or more of the useful life of the leased asset. (This criterion does not apply if the beginning lease term falls within the last 25% of the total useful life of the asset.)
i The present value of the minimum lease payments at the inception of the lease, excluding executory costs, equals at least 90% of the fair market value of the leased asset. (This criterion does not apply if the beginning lease term falls within the last 25% of the total useful life of the asset.)
The future minimum lease payments for long-term capital leases as of June 30, 2014 are summarized below (expressed in thousands):
Annual Debt Service Governmental Business-type
Fiscal Year Activities Activities 2015 $ 56,295 $ 11,423 2016 56,476 11,129 2017 54,493 10,764 2018 52,930 10,333 2019 50,198 10,200
2020-2024 241,105 51,359 2025-2029 125,883 49,667 2030-2034 31,240 43,025 2035-2039 - 8,522 2040-2072 - 2,191
Total minimum lease payments 668,620 208,613 Less: amount representing interest (170,291) (75,656) Less: amount representing executory costs (49,120) -
Present Value of Net Minimum Lease Payments $ 449,209 $ 132,957 2. Capital Assets Financed through Capital Leases
The following table summarizes the historical costs of assets acquired under capital leases (expressed in thousands):
Governmental Business-type Activities Activities Land $ 445 $ 5,175 Buildings 463,650 156,620 Equipment 40,607 1,857 504,702 163,652 Less: accumulated depreciation (73,626) (36,369) Carrying Value $ 431,076 $ 127,283

STATE OF ARIZONA NOTES TO THE FINANCIAL STATEMENTS JUNE 30, 2014
- 110 -
E. COMPENSATED ABSENCES
Compensated absences are paid from various funds in the same proportion that those funds pay payroll costs. The compensated absence liability attributable to governmental activities will be liquidated primarily by the General Fund. During fiscal year 2014, the State paid for compensated absences as follows: 74.53% from the General Fund, 18.49% from other funds, and 6.98% from other major funds.
F. CHANGES IN LONG-TERM OBLIGATIONS
The following is a summary of changes in Long-term Obligations (expressed in thousands): Balance
July 1, 2013, as restated Increases Decreases
Balance June 30, 2014
Due Within One Year
Due Thereafter
Governmental Activities: Long-term Debt: Revenue bonds $ 3,606,720 $ - $ (200,525) $ 3,406,195 $ 217,970 $ 3,188,225
Grant anticipation notes 296,240 - (48,530) 247,710 53,040 194,670
Certificates of participation 2,360,595 305,675 (465,595) 2,200,675 169,870 2,030,805
Capital leases 360,316 113,914 (25,021) 449,209 30,332 418,877
Notes payable 105,817 29,130 (45,082) 89,865 - 89,865
Premiums and discounts on debt 474,747 6,770 (53,652) 427,865 38,435 389,430
Total Long-term Debt 7,204,435 455,489 (838,405) 6,821,519 509,647 6,311,872
Other Long-term Liabilities:
Compensated absences 311,850 216,533 (204,499) 323,884 169,663 154,221 Pollution remediation
obligations 22,083 - (1,562) 20,521 5,196 15,325
Total Other Long-term Liabilities 333,933 216,533 (206,061) 344,405 174,859 169,546
Total Long-term Obligations $ 7,538,368 $ 672,022 $ (1,044,466) $ 7,165,924 $ 684,506 $ 6,481,418
Business-type Activities:
Long-term Debt:
Revenue bonds $ 2,237,710 $ 144,880 $ (80,555) $ 2,302,035 $ 75,010 $ 2,227,025
Certificates of participation 714,735 145 (38,535) 676,345 32,234 644,111
Capital leases 135,519 1,847 (4,409) 132,957 5,142 127,815
Installment purchase contracts 5,758 - (1,660) 4,098 1,292 2,806
Premiums and discounts on debt 123,014 17,801 (10,500) 130,315 10,630 119,685
Total Long-term Debt 3,216,736 164,673 (135,659) 3,245,750 124,308 3,121,442
Other Long-term Liabilities:
Compensated absences 78,293 93,203 (88,019) 83,477 20,493 62,984
Total Other Long-term Liabilities 78,293 93,203 (88,019) 83,477 20,493 62,984 Total Long-term Obligations $ 3,295,029 $ 257,876 $ (223,678) $ 3,329,227 $ 144,801 $ 3,184,426 The above long-term obligations relating to governmental activities include internal service funds. Amounts for compensated absences differ from those in the Reconciliation of the Governmental Funds Balance Sheet to the Statement of Net Position because $159.001 million of compensated absences are attributable to internal service funds. These amounts are included in the reconciliation as part of internal service fund net position.
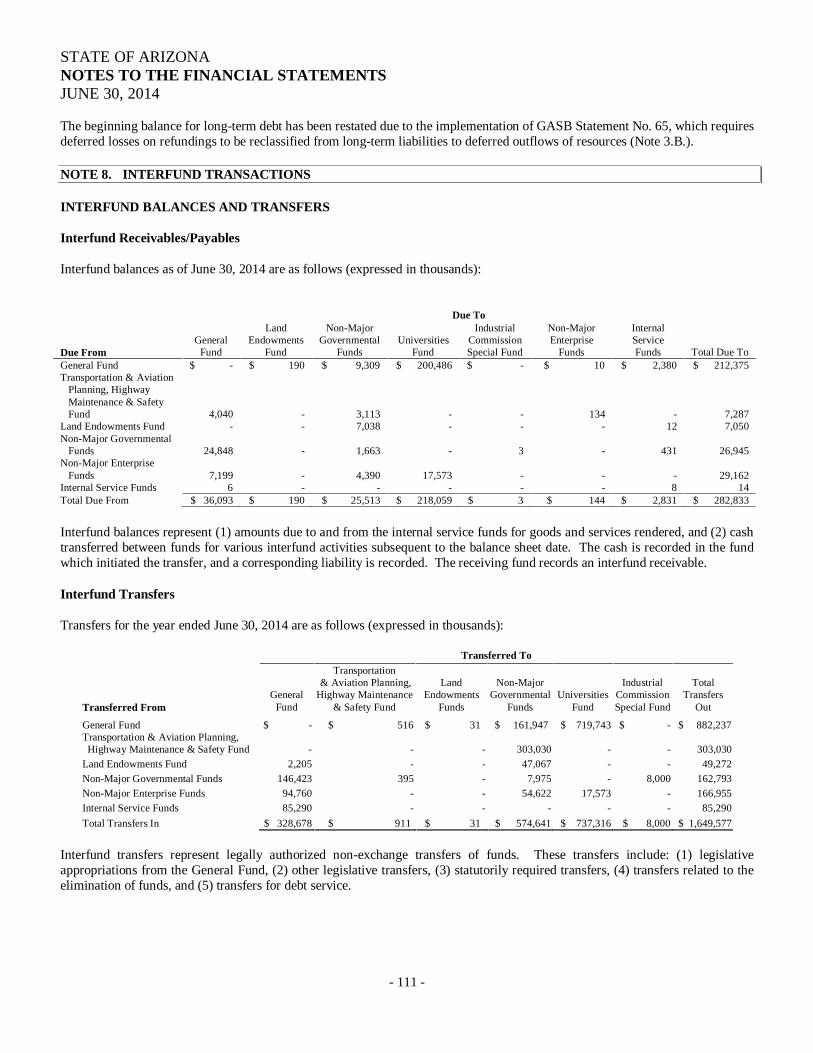
STATE OF ARIZONA NOTES TO THE FINANCIAL STATEMENTS JUNE 30, 2014
- 111 -
The beginning balance for long-term debt has been restated due to the implementation of GASB Statement No. 65, which requires deferred losses on refundings to be reclassified from long-term liabilities to deferred outflows of resources (Note 3.B.).
NOTE 8. INTERFUND TRANSACTIONS
INTERFUND BALANCES AND TRANSFERS
Interfund Receivables/Payables
Interfund balances as of June 30, 2014 are as follows (expressed in thousands):
Due To
Due From General
Fund
Land Endowments
Fund
Non-Major Governmental
Funds Universities
Fund
Industrial Commission Special Fund
Non-Major Enterprise
Funds
Internal Service Funds Total Due To
General Fund $ - $ 190 $ 9,309 $ 200,486 $ - $ 10 $ 2,380 $ 212,375 Transportation & Aviation Planning, Highway Maintenance & Safety Fund 4,040 - 3,113 - - 134 - 7,287 Land Endowments Fund - - 7,038 - - - 12 7,050 Non-Major Governmental Funds 24,848 - 1,663 - 3 - 431 26,945 Non-Major Enterprise Funds 7,199 - 4,390 17,573 - - - 29,162 Internal Service Funds 6 - - - - - 8 14 Total Due From $ 36,093 $ 190 $ 25,513 $ 218,059 $ 3 $ 144 $ 2,831 $ 282,833
Interfund balances represent (1) amounts due to and from the internal service funds for goods and services rendered, and (2) cash transferred between funds for various interfund activities subsequent to the balance sheet date. The cash is recorded in the fund which initiated the transfer, and a corresponding liability is recorded. The receiving fund records an interfund receivable.
Interfund Transfers
Transfers for the year ended June 30, 2014 are as follows (expressed in thousands):
Transferred From
Transferred To
General Fund
Transportation & Aviation Planning, Highway Maintenance
& Safety Fund
Land Endowments
Funds
Non-Major Governmental
Funds Universities
Fund
Industrial Commission Special Fund
Total Transfers
Out
General Fund $ - $ 516 $ 31 $ 161,947 $ 719,743 $ - $ 882,237 Transportation & Aviation Planning, Highway Maintenance & Safety Fund - - - 303,030 - - 303,030 Land Endowments Fund 2,205 - - 47,067 - - 49,272 Non-Major Governmental Funds 146,423 395 - 7,975 - 8,000 162,793 Non-Major Enterprise Funds 94,760 - - 54,622 17,573 - 166,955 Internal Service Funds 85,290 - - - - - 85,290 Total Transfers In $ 328,678 $ 911 $ 31 $ 574,641 $ 737,316 $ 8,000 $ 1,649,577
Interfund transfers represent legally authorized non-exchange transfers of funds. These transfers include: (1) legislative appropriations from the General Fund, (2) other legislative transfers, (3) statutorily required transfers, (4) transfers related to the elimination of funds, and (5) transfers for debt service.

STATE OF ARIZONA NOTES TO THE FINANCIAL STATEMENTS JUNE 30, 2014
- 112 -
NOTE 9. ACCOUNTING CHANGES A. FUND FINANCIAL STATEMENTS
Net Position has been restated as follows (expressed in thousands):
Proprietary Funds
Universities Net Position, as previously reported $ 2,991,239Prior period adjustment (21,279)Net Position, as restated $ 2,969,960
B. GOVERNMENT-WIDE FINANCIAL STATEMENTS
Government-wide Net Position has been restated as follows (expressed in thousands):
Business-type Activities
Net Position, as previously reported $ 3,129,419Prior period adjustment (21,279)Net Position, as restated $ 3,108,140
Prior Period Adjustment In fiscal year 2014, the State implemented GASB Statement No. 65. This Statement required debt issuance costs, except any portion related to prepaid insurance costs, to be expensed in the period incurred rather than amortized annually. Additionally, for ASU, the capital assets were restated as a result of the write-off of debt issuance costs that had been previously capitalized and depreciated.

STATE OF ARIZONA NOTES TO THE FINANCIAL STATEMENTS JUNE 30, 2014
- 113 -
NOTE 10. GOVERNMENTAL FUND BALANCES
Detail of the fund balance categories and classifications shown in the aggregate on the governmental funds balance sheet for the year ended June 30, 2014 are as follows (expressed in thousands):
Transportation & Aviation Planning, Highway Land Non-Major General Maintenance Endowments Governmental Fund & Safety Fund Fund Funds Total Fund Balances: Nonspendable: Inventory $ 9,600 $ 6,833 $ - $ - $ 16,433 Permanent fund principal - - 4,871,849 - 4,871,849 Restricted for: General government 16,565 - - 65,717 82,282 Health and welfare 57,204 - - 13,029 70,233 Inspection and regulation 5,539 - - - 5,539 Education 3,761 - - 491,771 495,532 Protection and safety 23,447 - - - 23,447 Natural resources 3,615 - - 9,091 12,706 Debt service - - - 57,342 57,342 Capital projects - 793,713 - 311,011 1,104,724 School facilities improvements 14,259 - - - 14,259 Committed to: General government - - - 134,861 134,861 Health and welfare 21,982 - - 149,773 171,755 Inspection and regulation 2,204 - - 118,023 120,227 Education 14,047 - - - 14,047 Protection and safety 11,155 - - 89,921 101,076 Transportation - 170,725 - - 170,725 Natural resources 13,716 - - 71,143 84,859 School facilities improvements 16,733 - - - 16,733 Unassigned: (189,238) - (29,744) - (218,982) Total Fund Balances $ 24,589 $ 971,271 $ 4,842,105 $ 1,511,682 $ 7,349,647
NOTE 11. FUND DEFICIT
A. RISK MANAGEMENT FUND (RMF)
The RMF, an internal service fund, had a deficit of $353.9 million primarily due to the RMF receiving annual funding only for expected paid insurance losses (including loss adjustment expenditures) within the State’s self-insured retention for the specific fiscal year. Accrued insurance losses of the RMF are not considered when determining funding for each fiscal year.
B. RETIREE ACCUMULATED SICK LEAVE FUND (RASL)
The RASL, an internal service fund, pays retirees for their accumulated sick leave upon retirement from State service when they meet certain criteria. Beginning with fiscal year 2008, the State applied the provisions of GASB Statement No. 16, Accounting for Compensated Absences to the RASL. This results in a liability in the RASL which is significantly greater than the actual funding of the RASL, because the liability is based upon an estimate of the total RASL benefit earned by existing employees at the balance sheet date; however, State agencies pay for only one year based on a 0.40% charge on gross payroll. The $153.9 million fund deficit is primarily due to the above funding mechanism.

STATE OF ARIZONA NOTES TO THE FINANCIAL STATEMENTS JUNE 30, 2014
- 114 -
NOTE 12. JOINT VENTURES
A. LARGE BINOCULAR TELESCOPE CORPORATION
The U of A is a participant in the Large Binocular Telescope Corporation (LBT). The LBT was formally incorporated as a nonprofit corporation in August 1992 pursuant to a Memorandum of Understanding, as amended, executed on February 24, 1989, between the U of A and the Arcetri Astrophysical Observatory in Florence, Italy. The purpose of the joint venture is to design, develop, construct, own, operate, and maintain a binocular telescope located in Arizona. The current members of the LBT are the U of A, INAF Astrophysical Observatory, Research Corporation, Ohio State University, and LBT Beteiligungsgesellschaft. The U of A has committed resources equivalent to 25% of the LBT’s construction costs and annual operating costs. As of June 30, 2014, the U of A has made cash contributions of $18.2 million toward the project’s construction costs, which were recorded as noncurrent investments on the Statement of Net Position. The U of A’s financial interest represents its future viewing/observation rights. As of December 31, 2007, the assets had been substantially completed and the telescope entered the commissioning phase. During calendar year 2007, the telescope became operational for research purposes; thus, depreciation of the property and equipment has commenced. The U of A recorded its proportionate share of the use of the viewing/observation rights, $815 thousand in calendar year 2013, as a reduction in its investment. At June 30, 2014, the investment totaled $12.8 million. According to the most recent draft financial statements of the LBT for the year ended December 31, 2013, assets, liabilities, revenues, and expenses totaled $125.0 million, $3.0 million, $13.0 million, and $16.0 million, respectively. Information regarding the LBT’s financial statements can be obtained from the University of Arizona Comptroller at the University of Arizona, Financial Services, 1303 E. University Blvd., Box 4, Tucson, AZ 85719-0521. B. GIANT MAGELLAN TELESCOPE ORGANIZATION
The Giant Magellan Telescope Organization (GMTO) is a non-stock, nonprofit, jointly governed corporation founded to own and administer the planning, design, construction, and operation of the 25-meter Giant Magellan Telescope, a proposed astronomical telescope and its associated buildings, equipment and instrumentation, to be located in northern Chile. The GMTO is jointly governed by several leading educational and research institutions from the United States, South Korea, and Australia, including the U of A. The U of A comprises two of the fifteen members of the GMTO Board of Directors, and is one of eleven founders and participants. The GMTO will hold all rights, title and interest to and in the telescope. Although the U of A does not have a defined equity interest, as a founder the U of A will receive viewing rights to the telescope in proportion to their voluntary contributions to the project. Although no contributions were made during the current fiscal year, the U of A has contributed $9.8 million to the GMTO as of June 30, 2014, and future contributions are expected. The U of A will also be responsible for manufacturing the telescope’s mirrors and will receive compensation from other GMTO founders and participants based on individual contractual agreements. As of June 30, 2014, the U of A has received payment on nine contracts related to the project: $24.3 million from Observatories of the Carnegie Institution of Washington for mirror construction and process development; $13.5 million from the GMTO for mirror construction; $8.6 million from the GMTO for acquisition of glass and mold materials; $3.8 million from the GMTO for acquisition of glass; $2.5 million from the Observatories of the Carnegie Institution of Washington to develop mirror testing systems; $1.7 million from the GMTO for acquisition of glass; $371 thousand from the GMTO to develop mirror testing systems; $270 thousand from the GMTO for design study; and $37 thousand from the GMTO for engineering support. NOTE 13. COMMITMENTS, CONTINGENCIES, AND COMPLIANCE
A. INSURANCE LOSSES
The Department of Administration – Risk Management Division manages the State’s property, environmental, general liability, and workers’ compensation losses. The State has determined that the management of these losses can be performed effectively and efficiently through the Risk Management Division. Consequently, all agencies are required to participate in this program. The State’s Risk Management Division evaluates the proper mix of purchased commercial insurance and self-insurance annually. The Special Fund provides payment of workers’ compensation benefits in the following areas: claims against uninsured employers; continuing benefits in claims against insolvent workers compensation insurance carriers and bankrupt self-insured

STATE OF ARIZONA NOTES TO THE FINANCIAL STATEMENTS JUNE 30, 2014
- 115 -
employers; payment for vocational rehabilitation; continuing medical benefits for pre-1973 workers compensation claims; and, partial coverage of benefits for second injury claims (apportionment claims). The State records claims liability when the reported loss is probable and reasonably estimated. On an annual basis, independent actuarial firms are engaged to estimate the State’s total year-end outstanding claims liability, which takes into account recorded claims and related allocated claims adjustment expenditures, loss development factors, and an estimate for incurred but not reported claims. There were no non-incremental claims adjustment expenses included in the liability for claims and adjustments. The management and payment of these losses is accomplished through the funding mechanism of the Risk Management Fund and the Special Fund. As discussed in the above paragraph, an independent annual actuarial analysis is performed to evaluate the needed funding. The Risk Management Division will assess each agency an annual portion of the necessary funding for the Risk Management Fund based on their exposures and prior loss experience. Investment earnings (including interest, dividends, and securities lending income) and assessments on gross premium revenues primarily fund the Special Fund. To provide funding for the payment of these workers’ compensation benefits, the Special Fund may direct the payment of assessments into the State Treasury under A.R.S. § 23-1065(A) (general liability assessment – not to exceed 1.5%), A.R.S. § 23-1065(F) (apportionment assessment - not to exceed .5%), and A.R.S. § 23-966(D) (insolvency assessment - not to exceed .5%), in a total amount not to exceed 2.5% of all premiums received by private insurance carriers and what would have been paid by self-insured employers if they had been fully insured by an insurance carrier authorized to transact workers compensation insurance during the immediately preceding calendar year. The Special Fund levied the following assessment taxes for calendar year 2014: 1.14% assessment under A.R.S. § 23-1065(A), .25% assessment under A.R.S. § 23-1065(F), and .36% assessment under A.R.S. § 23-966(D). AMI Risk Consultants, Inc. was retained to evaluate the medical and compensation related liabilities of the Special Fund as of June 30, 2014. The total estimated loss reserve of $484.1 million increased by less than 2%, or $6.3 million, over the prior year estimated loss reserve of $477.8 million. Reserves were strengthened for uninsured claims in the amount of $6.6 million, but otherwise there were no major shifts in any award categories. A confidence level of 80% was used in calculating medical and compensation related liabilities. A confidence level of 80% indicates a confidence that the estimated liability will be adequate to cover actual costs 80 out of 100 years. The reserves were discounted at an assumed rate of .64% for the compensation benefits and zero percent for the medical benefits. For medical benefits, it was assumed that the inflation in medical costs will equal the investment return earned by the Special Fund on those reserves. During fiscal year 2014, the Legislature passed Senate Bill 1181 (S. B. 1181), which will transfer all insolvent workers’ compensation insurance carrier administration and related liabilities from the Special Fund to the Arizona Property and Casualty Guaranty Fund managed by the Department of Insurance effective July 1, 2015. The liability for bankrupt self-insured employers will remain a liability of the Special Fund. Additionally, as a result of the passage of S. B. 1181, the assessment authority for the Special Fund liability was reduced by 1%. Effective July 1, 2015, the Special Fund assessment that can be levied may not exceed 1.5%, which is allocated as follows: 1% under A.R.S. § 23-1065(A) (reduced from 1.5%) and .5% percent under A.R.S. § 23-1065(F). The A.R.S. § 23-966(D) assessment was eliminated. The Special Fund has filed proofs of claim with ancillary receivers and liquidators regarding the recovery of statutory deposits and other monies for insolvencies. Since the actual amount that will ultimately be received cannot be determined, the Special Fund will continue to recognize receipt of insolvent carrier deposits as revenue at the time received rather than recording a receivable. Occasionally, the Risk Management Division agrees with claimants to purchase an annuity contract to settle specific claims when it is determined that it is in the best interest of the State to do so. In these instances, the State obtains a release agreement from the claimant and transfers its obligation to make future periodic payments to an assignment company. The State requires a secondary guarantor which is obtained when the assignment company transfers the obligation to make the payments through the use of a qualified assignment (typically a life insurance company with an approved rating). As a result of these requirements, the likelihood that the State will be required to make future payments on these claims is remote. There have been no significant reductions in the current fiscal year insurance coverage. There have been no settlements that have exceeded insurance premium coverage in the last three fiscal years.

STATE OF ARIZONA NOTES TO THE FINANCIAL STATEMENTS JUNE 30, 2014
- 116 -
The following table presents the changes in claims liabilities balances (short- and long-term combined) during fiscal years ended June 30, 2013 and June 30, 2014 (expressed in thousands):
Fiscal Year Beginning Balance
Current Year Claims and Changes in Estimates
Claims Payments
Ending Balance
Risk Management Fund: 2013 $ 364,763 $ 80,719 $ 49,867 $ 395,615 2014 395,615 92,284 58,570 429,329
Industrial Commission Special Fund:
2013 468,933 33,555 24,641 477,847 2014 477,847 31,177 24,880 484,144
B. LITIGATION
In Cave Creek Unified School District vs. State of Arizona, plaintiffs claimed that A.R.S. § 15-901.01, which the voters had enacted by referendum and required the Legislature to appropriate funds to adjust school equalization assistance funding for inflation by increasing both the base level and the transportation components of the revenue control limit each fiscal year by a statutorily defined growth rate, had been violated with the Legislature’s fiscal year 2010-2011 K-12 education budget reconciliation bill because only the transportation component of the revenue control limit was increased. The plaintiffs further asserted that because the voters enacted A.R.S. § 15-901.01 by referendum, the bill also violated the Arizona Constitution’s Voter Protection Act (VPA) provisions, which prohibit the Legislature from eliminating voter-enacted measures and from altering them except as the VPA allows. The Trial Court denied the plaintiff’s application for declaratory judgment and injunctive relief and granted the State’s motion to dismiss the amended complaint for failure to state a claim for which relief could be granted. The Court of Appeals reversed the Trial Court’s decision. The State petitioned the Supreme Court for review, which it granted. The Supreme Court considered whether the voters could constitutionally impose a mandate on the Legislature to increase appropriations. The Supreme Court has found that the voters could impose restrictions on the Legislature’s discretion through voter-protected statutes and that the Legislature must fund, on a go-forward basis, all components of the base level A.R.S. § 15-901.01. The Supreme Court remanded the case to Superior Court for further proceedings. The Superior Court then bi-furcated the post-judgment proceedings and has determined that the base level should be recalculated as though the Legislature had never stopped funding the inflation adjustments. This decision is now on appeal by the State. The State’s opening brief has been stayed pending court-supervised mediation that began in February, 2015. The Superior Court also set a one week evidentiary hearing to determine whether the State should or could retroactively pay schools for the inflationary increases that it did not make. The Superior Court has stayed issuance of a decision on this issue pending court-supervised mediation. If the appellate court affirms the Superior Court’s declaration that the Legislature must recalculate the revenue control limit by compounding the inflation increases that were not made in the past, it is possible that the State would have to appropriate approximately $320.0 million more in educational spending for fiscal year 2014-2015 to pay the cost of increasing inflation adjustments to the base level. The potential outcome of retroactive payment of unpaid past inflationary increase is uncertain at this time, but if there were an unfavorable outcome, it is possible that the State could incur losses of approximately $1.2 billion.
The State has a variety of claims pending against it that arose during the normal course of its activities. Management believes, based on advice of legal counsel, losses, if any, resulting from settlement of these claims will not have a material effect on the financial position of the State. All losses for any unsettled litigation or contingencies involving workers’ compensation, medical malpractice, construction and design, highway operations, employment practices, criminal justice, fidelity and surety, environmental property damage, general liability, environmental liability, building and contracts, auto liability, or auto physical damage are determined on an actuarial basis and included in the Accrued Insurance Losses of the internal service funds and the Industrial Commission Special Fund.
C. ACCUMULATED SICK LEAVE
Sick leave includes any approved period of paid absence granted an employee due to illness, injury, or disability. Most State employees accrue sick leave at the rate of eight hours per month without an accumulation limit. State employees are eligible to receive payment for an accumulated sick leave balance of at least 500 hours, with a maximum of 1,500 hours, upon retirement

STATE OF ARIZONA NOTES TO THE FINANCIAL STATEMENTS JUNE 30, 2014
- 117 -
directly from State service. The benefit value is calculated by taking the State employee’s hourly rate of pay at the retirement date, multiplied by the number of sick hours at the retirement date times the eligibility percentage. The eligibility percentage varies based upon the number of accumulated sick hours from 25% for 500 hours to a maximum of 50% for 1,500 hours. The maximum benefit value is $30 thousand. The benefit shall be paid either in a lump sum or in installments over a three-year period. The RASL Fund is accounted for in the financial statements as an internal service fund and accounts for the retiree accumulated sick leave liability of $156.7 million at June 30, 2014.
D. UNCLAIMED PROPERTY
The State of Arizona’s Uniform Unclaimed Property Act requires the deposit of certain unclaimed assets into a managed agency fund. A total of approximately $1.1 billion (net of refunds issued) has been collected since the inception of the fund. The State is also holding securities valued at $44.0 million and mutual funds valued at $10.1 million. In accordance with A.R.S. § 44-313 and A.R.S. § 44-314, for fiscal year 2014, $24.5 million was deposited in the Department of Revenue Administrative Fund, $2.5 million was deposited in the Housing Trust Fund, $2.0 million was deposited in the Seriously Mentally Ill Housing Trust Fund, $49.2 million was deposited in the General Fund, and $1.2 million was deposited in other funds as required by State statute. The remittances to the General Fund and the holdings by the State represent contingencies, as claims for refunds can be made by the owners of the property. The GASB requires that a liability be reported to the extent that it is probable that escheat property will be reclaimed and paid to claimants. This liability is also reported as a reduction of revenue. At June 30, 2014, $373.7 million of this liability is reported in the General Fund because it is the fund to which the property ultimately escheats in Arizona.
E. CONSTRUCTION COMMITMENTS
The ADOT had outstanding commitments under construction contracts of $632.2 million at June 30, 2014.
(in thousands)
Expenditures
to Date Remaining
Commitments Construction contracts: Rural roadways $ 366,707 $ 167,821 Small urban roadways 72,543 20,656 Urban roadways 127,473 51,015 Large urban roadways 156,870 123,207 General roadways 109,946 64,614 Sub-total 833,539 427,313 Design contracts 346,306 89,679 Other commitments 347,787 115,179 Total $ 1,527,632 $ 632,171
F. ARIZONA STATE LOTTERY
Annuities are purchased for all prizes over $400 thousand for which winners will receive the jackpot in annual installments for The Pick on-line game. The annuities are purchased from qualifying insurance companies which have the highest ratings from among A.M. Best Company, S & P, Moody’s, Duff & Phelps, or Weiss. Purchases of annuities transfer liabilities for prizes to the insurance company. However, the Lottery may incur liabilities for prizes in the event of a default of an insurance company. Aggregate future payments to prize winners on existing annuities totaled $42.5 million at June 30, 2014. Approximately $38.2 million of the total aggregate future payments at June 30, 2014 relate to annuities purchased from five separate insurance companies, of which approximately $12.4 million relates to a single insurance company.
NOTE 14. TOBACCO SETTLEMENT
The State is one of many states participating in the settlement of litigation with the tobacco industry over the reimbursement of healthcare costs. The settlement money is intended to compensate the State for costs it has incurred in providing health and other

STATE OF ARIZONA NOTES TO THE FINANCIAL STATEMENTS JUNE 30, 2014
- 118 -
services to its citizens that were necessitated by the use of tobacco products. The State expects to receive settlement payments through 2025.
The State recorded tobacco settlement revenue of $100.8 million in the fund statements and the government-wide statements in fiscal year 2014. Future settlement payments are subject to several adjustments, but the amounts are not presently determinable. These adjustments include a volume adjustment, which could reflect any decreasing cigarette production under a formula that also takes into account increased operating income from sales. Other factors that might affect the amounts of future payments include ongoing and future litigation against the tobacco industry and the future financial health of the tobacco manufacturers. Because the net realizable value of the future settlement payments is not measurable and there is no obligation for the tobacco companies to make settlement payments until cigarettes are shipped, the State did not record a receivable for the future payments related to cigarette sales after June 30, 2014.
NOTE 15. SUBSEQUENT EVENTS
In December 2014, the ADOT issued $376.8 million in Transportation Excise Tax Revenue Refunding Bonds (Maricopa County Regional Area Road Fund) 2014 Series (2014 Bonds) to: (1) refund, in advance of maturity, the 2007 Series, 2009 Series, and 2010 Series, and (2) pay the costs of issuance. The 2014 Bonds include serial bonds with interest rates ranging from 4.00% to 5.00%, and maturity dates ranging from July 1, 2015 to July 1, 2025. The 2014 Bonds are subject to optional redemption prior to their respective maturity dates. The bonds being refunded will be paid by investments held in a trust account with U.S. Bank National Association. In December 2014, the U of A issued $129.2 million in SPEED Revenue Bonds, Series 2014 (2014 Bonds), to: (1) acquire, construct, equip and improve the Bioscience Partnership Building project and the Bioscience Research Laboratories project, and (2) pay costs of issuance. The 2014 Bonds include both serial and term bonds with interest rates ranging from 3.00% to 5.00% and maturity dates ranging from 2017 to 2045. The 2014 Bonds are subject to optional and mandatory redemption prior to their stated maturity dates pursuant to the debt documents. The sources for payment of the 2014 Bonds debt service will be derived from certain revenues of the State Lottery and monies of the U of A. In January 2015, the ADOT issued $377.5 million in Highway Revenue Refunding Bonds, Series 2015 (2015 Bonds), to: (1) refund, in advance of maturity, the Series 2005B, Series 2006, Series 2008A, and Series 2008B, and (2) pay costs of issuance. The 2015 Bonds include serial bonds with interest rates ranging from 2.00% to 5.00%, and maturity dates ranging from July 1, 2015 to July 1, 2033. The 2015 Bonds are subject to optional redemption prior to maturity pursuant to the debt documents. The bonds being refunded will be paid by investments held in a trust account with U.S. Bank National Association.
NOTE 16. DISCRETELY PRESENTED COMPONENT UNIT DISCLOSURES
The accounting policies of the State’s component units conform to U.S. GAAP applicable to governmental units adopted by the GASB, except for those component units affiliated with the State's Universities. Because the component units affiliated with the Universities are not governmental entities, they follow FASB statements for not-for-profit organizations for financial reporting purposes. Each component unit has a June 30 year-end.
A. SUMMARY OF SIGNIFICANT ACCOUNTING POLICIES
1. Measurement Focus and Basis of Accounting
The State's component units and component units affiliated with the Universities are presented using the economic resources measurement focus and the accrual basis of accounting.
2. Net Assets
Component units affiliated with the Universities classify net assets, revenues, expenses, gains and losses based on the existence or absence of donor-imposed restrictions. Accordingly, the net assets of the component units affiliated with the Universities and changes therein are classified and reported as follows:

STATE OF ARIZONA NOTES TO THE FINANCIAL STATEMENTS JUNE 30, 2014
- 119 -
i Unrestricted net assets include assets and contributions that are not restricted by donors or for which such restrictions have expired.
i Temporarily restricted net assets include contributions for which donor imposed restrictions have not been met (either by the passage of time or by actions of the Foundations), charitable remainder unitrusts, pooled income funds, gift annuities, and pledges receivable for which the ultimate purpose of the proceeds is not permanently restricted. Donor-restricted contributions are classified as temporarily restricted even if the restrictions are satisfied in the same reporting period in which the contributions are received.
i Permanently restricted net assets include contributions, charitable remainder unitrusts, pooled income funds, gift annuities, and pledges receivable which require by donor restriction that the corpus be invested in perpetuity.
3. Cash and Cash Equivalents
Cash and cash equivalents includes monies held in certificates of deposit, overnight money market accounts, and U.S. Government or U.S. Treasury money market funds with original maturities of three months or less. Cash equivalents are stated at cost, which approximates fair value.
4. Investments
The fair values of publicly traded securities are based on quoted market prices and exchange rates, if applicable. Absolute return limited partnership interests are recorded at fair value based on quoted market prices (where the underlying investment is a mutual fund) or as determined by the fund manager. Purchases and sales of investment securities are reflected on a trade-date basis. Realized gains and losses are calculated using the average cost for securities sold. Investment securities, in general, are exposed to various risks, such as interest rate, credit, and overall market volatility. Investment income or loss comprises the sum of realized and unrealized gains and losses on investments and interest and dividends, less an investment management fee. In addition, investments include Universities’ endowment funds totaling $335.4 million managed by the Foundations. These funds are primarily held in pooled endowment funds managed for the Universities under service contracts with the Foundations and invested in the Foundations’ endowment pools.
5. Income Taxes
The Universities-affiliated component units qualify as tax-exempt organizations under Section 501(c)(3) of the Internal Revenue Code, except for the ACFFC and, accordingly, there is no provision for income taxes in the accompanying financial statements. In addition, they qualify for the charitable contribution deduction and have been classified as organizations that are not private foundations. Any unrelated business income would be taxable. The ACFFC is exempt from taxes under the provisions of Section 501(c)(4) of the Internal Revenue Code. The ACFFC does not qualify for the charitable contribution deduction.
6. Contributions
Contributions received are recorded as unrestricted, temporarily restricted, or permanently restricted support, depending on the existence and/or nature of any donor restrictions. All donor-restricted support is reported as an increase in temporarily or permanently restricted net assets depending on the nature of the restriction.
7. Net Assets Released from Restriction
The major Universities-affiliated component units' expenses are not incurred in the temporarily restricted or permanently restricted net asset categories. As the restrictions on these net assets are met, the net assets are reclassified to unrestricted net assets. The total net assets reclassified are reported as net assets released from restriction in the accompanying Statement of Activities.
8. Deferred Outflows of Resources
Deferred outflows of resources represent a consumption of net position by the component units that applies to a future period and so will not be recognized as an outflow of resources (expense) until then. Deferred outflows of resources increase net position, similar to assets. The component units’ deferred outflows of resources represent losses resulting from debt refundings.

STATE OF ARIZONA NOTES TO THE FINANCIAL STATEMENTS JUNE 30, 2014
- 120 -
9. Endowments
The management of the ASU Foundation and the U of A Foundation endowments is governed by laws in the State of Arizona created under the Arizona Management of Charitable Funds Act. The ASU Foundation has interpreted State statute as requiring the preservation of the fair value of the original gifts at the gift date of the donor restricted endowment funds. As a result of this interpretation, the ASU Foundation classifies as permanently restricted net assets: (a) the original value of gifts donated to the permanent endowment; (b) the original value of subsequent gifts to the permanent endowment; and (c) accumulations to the permanent endowment made in accordance with the direction of the applicable donor gift instrument at the time the accumulation is added to the fund. The ASU Foundation's investment policies are reviewed periodically. The long-term financial objectives are to produce a relatively predictable and stable payout stream that increases over time at least as fast as the general rate of inflation and to preserve intergenerational equity by achieving growth of the investments at a rate that at least keeps pace with the general rate of inflation, net of spending. The U of A Foundation endowment payout rate is a percentage (4% of the average fair value at the three previous calendar year-ends) of the fair value of each endowment account, as determined from time to time by the U of A Foundation’s Board. The U of A Foundation considers the following factors in making a determination to appropriate donor-restricted endowment funds: the net rate of return earned by each endowment account in each of the five most recent fiscal years; the net real rate of return (as measured by the Higher Education Price Index) earned by the endowment in each of the five most recent fiscal years (i.e., the duration and preservation of the endowment fund); payout rates established by other university endowments as published in the Commonfund and National Association of College and University Business Officers survey; any unusual or extraordinary circumstances impacting the U of A flow of funds from other sources (i.e., tuition revenues, State appropriations, etc.); the extent to which programs benefiting from the payout rate rely on these funds to achieve their goals and objectives; general economic conditions; the possible effect of inflation or deflation; and the expected total return from income and appreciation of investments per the most recent asset allocation study. The U of A Foundation’s goal is to manage endowment assets such that the annual nominal return exceeds the annual “hurdle rate” (the sum of the payout and the cost recovery fee) so the endowment principal is able to grow and continue to fund in perpetuity the set of activities envisioned by the donor at the time of the gift. The U of A Foundation expects its endowment funds to provide an annual average rate of return of 8.9% with a standard deviation of 8.8%.
10. Use of Estimates
The preparation of the Universities-affiliated component units' financial statements in conformity with U.S. GAAP requires management to make estimates and assumptions that affect the reported amount of assets and liabilities, disclosure of contingent assets and liabilities at the date of the financial statements, and the reported amount of revenues and expenses during the reporting period. Actual results could differ from those estimates. B. DEPOSITS AND INVESTMENTS
1. Component Units
a. Deposits and Investment Policies
The investments of the WIFA are stated at fair value, except guaranteed investment contracts, which are stated at cost since they are non-participating contracts. The investments of the UAHN are stated at fair value.
b. Custodial Credit Risk - Deposits and Investments
Custodial credit risk for deposits is the risk that, in the event of the failure of a depository financial institution, the deposits or collateral securities may not be recovered from the outside party. The WIFA and the UAHN do not have a formal policy regarding custodial credit risk for deposits.
Custodial credit risk for investments is the risk that, in the event of the failure of the counterparty to a transaction, the value of the investment or collateral securities that are in the possession of an outside party may not be recovered. The WIFA and the UAHN do not have a formal policy regarding custodial credit risk for investments. The investments of the UAHN are uninsured and held by brokers in the UAHN’s name.

STATE OF ARIZONA NOTES TO THE FINANCIAL STATEMENTS JUNE 30, 2014
- 121 -
c. Interest Rate Risk
Interest rate risk is the risk that changes in interest rates will adversely affect the fair value of an investment. The WIFA does not have a formal policy regarding interest rate risk. The following table presents the interest rate risk for the WIFA utilizing the segmented time distribution method as of June 30, 2014 (expressed in thousands):
Investment Maturities (in years) Investment Type Fair Value Less than 1 1-5 6-10 More than 10 Guaranteed investment contracts $ 80,104 $ 2,109 $ 38,477 $ - $ 39,518 Money market mutual funds 11,533 11,533 - - - U.S. agency securities 33,928 - 23,977 - 9,951 U.S. Treasury securities 244 - 244 - - Total $ 125,809 $ 13,642 $ 62,698 $ - $ 49,469
The UAHN’s investment policy limits the portfolio duration related to debt securities to the Lehman Brothers Intermediate Government/Credit Index. This is an index based on all publicly issued intermediate government and corporate debt securities with average maturities of four to five years. The following table presents the estimated maturities of the UAHN’s investments, utilizing the segmented time distribution method as of June 30, 2014 (expressed in thousands):
Investment Maturities (in years) Investment Type Fair Value Less than 1 1-5 6-10 More than 10 Commercial paper $ 4,013 $ 4,013 $ - $ - $ - Global fixed income debt securities 2,782 502 1,673 607 - Money market mutual funds 40,577 40,577 - - - U.S. fixed income debt securities 39,044 3,551 20,684 5,463 9,346 U.S. Treasury securities 6,208 6,208 - - - Total $ 92,624 $ 54,851 $ 22,357 $ 6,070 $ 9,346
d. Credit Risk
Credit risk is the risk that an issuer or other counterparty to an investment will not fulfill its obligations to the holder of the investment. The WIFA does not have a formal policy regarding credit risk but their investments are in accordance with the master bond indenture. The following table presents the WIFA’s investments which were rated by S & P and/or an equivalent national rating organization. The ratings are presented using S & P’s rating scale as of June 30, 2014 (expressed in thousands):
Investment Type Fair Value AAA AA Guaranteed investment contracts $ 80,104 $ 40,586 $ 39,518 Money market mutual funds 11,533 11,533 - U.S. agency securities 33,928 - 33,928 Total $ 125,565 $ 52,119 $ 73,446
The UAHN’s investment in fixed income securities is limited to investment grade securities with a credit rating of BBB, or equivalent, or better. The following table presents the UAHN’s investments which were rated by S & P and/or an equivalent national rating organization. The ratings are presented using S & P’s rating scale as of June 30, 2014 (expressed in thousands):
Investment Type Fair
Value AAA AA A BBB CCC
Thru D A-1 Not Rated Commercial paper $ 4,013 $ - $ - $ - $ - $ - $ 4,013 $ - Global fixed income debt securities 2,782 - 1,752 807 223 - - - Money market mutual funds 40,577 - - - - - - 40,577 U.S. fixed income debt securities 39,044 16,410 7,257 5,390 8,130 4 - 1,853 Total $ 86,416 $ 16,410 $ 9,009 $ 6,197 $ 8,353 $ 4 $ 4,013 $ 42,430

STATE OF ARIZONA NOTES TO THE FINANCIAL STATEMENTS JUNE 30, 2014
- 122 -
e. Concentration of Credit Risk
Concentration of credit risk is the risk of loss attributed to the magnitude of a government’s investment in a single issuer. The WIFA’s investment policy contains no limitations on the amount that can be invested in any one issuer. At June 30, 2014, investments in any one issuer, that were more than 5% of the WIFA’s total investments, are as follows: (i) Bayerische Landesbank (fair value of $40.6 million, or 12.6%), (ii) Royal Bank of Canada (fair value of $31.4 million, or 9.7%), and (iii) Federal Home Loan (fair value of $33.9 million, or 10.5%). 2. Universities-Affiliated Component Units
Investments of the Universities-affiliated component units include the following amounts at June 30, 2014. Investments are stated at fair value (expressed in thousands):
ASU U of A Foundation Foundation Money market funds and cash equivalents $ 40,526 $ - Domestic/international equity securities and mutual funds 542,429 256,670 U.S. fixed income obligations and mutual funds 107,687 135,719 Absolute return limited partnerships and funds - 213,644 Other investments 69,788 162,125
Total Investments $ 760,430 $ 768,158
C. PROGRAM LOANS
The WIFA has made loans to local governments and others in Arizona to finance various projects pursuant to the requirements of the Clean Water and Safe Drinking Water Acts. The loans are generally payable in semi-annual installments due January 1 and July 1 of each year, including interest. However, several loans are payable monthly or quarterly. Changes in the program loans during fiscal year 2014 are as follows (expressed in thousands):
Beginning Ending Balance Increases Decreases Balance Clean Water Fund $ 769,097 $ 25,611 $ (47,099) $ 747,609 Drinking Water Fund 346,215 34,497 (34,015) 346,697 Total $ 1,115,312 $ 60,108 $ (81,114) $ 1,094,306
Repayment of these loans will be made from pledged property taxes, net revenues from the systems, transaction privilege taxes, or from special assessments. Most loans have a .30% to 3.00% annual administrative fee. When loans have been repaid, the principal and interest for the pledged loans are placed in restricted accounts used to make bond payments. For loans that are not pledged, the money is placed in a fund from which additional loans are made.
Some program loans require a monthly or quarterly payment into a debt service reserve to assure payments of the loans. The debt service reserve is a liability of the WIFA to the borrowers and interest on the reserve accrues to the borrowers. As of June 30, 2014, the debt service reserve was $69 thousand and $2.0 million for the Clean Water and Drinking Water funds, respectively, and no allowance for loan loss was recorded. D. PLEDGES RECEIVABLE
Pledges receivable (unconditional promises to give) are recorded at their net realizable value, which is net of a discount and loss allowance. The ASU Foundation’s pledges are discounted using the applicable risk free rate at the date the pledge was recognized. The discount rates range from 1.20% to 10.90%. An allowance for uncollectible pledges is estimated based on the ASU Foundation’s collection history and is recorded as a reduction to contribution support and revenue and an increase in the allowance for uncollectible pledges.

STATE OF ARIZONA NOTES TO THE FINANCIAL STATEMENTS JUNE 30, 2014
- 123 -
Pledges receivable, as of June 30, 2014, include the following (expressed in thousands):
ASU Foundation Gross pledges receivable $ 155,621 Present value discount (10,289) Allowance for uncollectible pledges (39,808) Net Pledges Receivable $ 105,524
E. DIRECT FINANCING LEASE AGREEMENTS
1. ASU Foundation
The ASU Foundation leases a portion of the Fulton Center building (the ASU Foundation's headquarters) to the ASU under a direct financing lease. At the end of lease, the ASU Foundation and affiliates will gift their portion of the building to the ASU and the ASU will receive title to the building. The ASU Foundation's net investment in this direct financing lease at June 30, 2014 is $24.5 million.
2. ACFFC
Pursuant to a Sublease Agreement, dated April 7, 2004 and amended on April 1, 2009 (the Sublease), Nanotechnology Research, LLC, a wholly-owned subsidiary of the ACFFC, leases its interest in the Research Park to the ASU. The ASU will make lease payments at times in amounts sufficient to pay all principal and interest on the Series 2009A and 2009B Bonds. The Sublease has successive annual renewals without action from either party through the period ending March 31, 2034. The Sublease is subject to early termination by Nanotechnology or the ASU upon the payment in full of the Series 2009A and 2009B Bonds. Upon termination or expiration of the Sublease, the ACFFC's interest in the premises, including all buildings and improvements on the leased premises, transfers to the ASU without further consideration. The ACFFC's net investment in the Nanotechnology facility direct financing lease is $31.0 million at June 30, 2014.
Pursuant to the ASU Lease Agreement, dated July 1, 2005, McAllister Academic Village, LLC, a wholly-owned subsidiary of the ACFFC, leases its interest in the non-residential portion of Hassayampa Academic Village (Hassayampa, HAV) to the ASU which consists of the academic, tutorial, retail, and food service facilities. The lease was amended effective September 1, 2008 to change the annual renewal period through June 30, 2039 to correspond with the maturity of the Hassayampa 2008 Bonds. Any right, title, or interest of Hassayampa in and to the academic portions of the Hassayampa project will pass to the ASU without further cost upon payment in full of the Hassayampa 2008 Bonds. Lease payments are based on the fixed interest rates determined by the Hassayampa 2008 Bonds maturity schedule. The ACFFC's net investment in the McAllister (HAV) direct financing lease is $12.1 million at June 30, 2014.

STATE OF ARIZONA NOTES TO THE FINANCIAL STATEMENTS JUNE 30, 2014
- 124 -
F. CAPITAL ASSETS
Capital asset activity for the UAHN for the fiscal year ended June 30, 2014 was as follows (expressed in thousands):
University of Arizona Health Network and Subsidiaries
Beginning Adjustments & Ending Balance Additions Retirements Reclassifications Balance
Non-depreciable capital assets: Land $ 14,819 $ - $ - $ (16) $ 14,803 Construction in progress 43,942 58,275 - (89,130) 13,087 Total Non-depreciable Capital Assets 58,761 58,275 - (89,146) 27,890
Depreciable capital assets: Buildings 455,456 13 - 6,125 461,594 Improvements other than buildings 1,210 - - 16 1,226 Equipment 314,872 - (852) 83,005 397,025 Total Depreciable Capital Assets 771,538 13 (852) 89,146 859,845
Less accumulated depreciation for: Buildings (185,869) (14,562) - - (200,431) Improvements other than buildings (997) (120) - - (1,117) Equipment (236,959) (31,855) 642 - (268,172) Total Accumulated Depreciation (423,825) (46,537) 642 - (469,720)
Total Depreciable Capital Assets, Net 347,713 (46,524) (210) 89,146 390,125
Total UAHN Capital Assets, Net $ 406,474 $ 11,751 $ (210) $ - $ 418,015
Capital assets for the Universities-affiliated component units for the fiscal year ended June 30, 2014 include the following (expressed in thousands):
ACFFC CRC Downtown Phoenix
Student Housing Buildings and improvements $ 185,011 $ 22,279 $ 114,091 Furniture, fixtures, and equipment 80,768 5,272 10,447 Total cost or donated value 265,779 27,551 124,538 Less: Accumulated Depreciation (90,355) (8,931) (26,375) Total Property and Equipment, Net $ 175,424 $ 18,620 $ 98,163
G. LONG-TERM OBLIGATIONS
1. Component Units a. Water Infrastructure Finance Authority The WIFA’s bonds are callable and interest is payable semiannually. The bonds are special obligations of the WIFA payable solely from and secured by the WIFA’s assets. The bonds are not obligations, general, specific, or otherwise, of the State or any other political subdivision, thereof, other than the WIFA.
In prior fiscal years, the WIFA refinanced various bond issues through advance-refunding arrangements. Under the terms of the refunding bond issues, sufficient assets to pay all principal, redemption premium, if any, and interest on the refunded bond issues have been placed in irrevocable trust accounts at commercial banks and invested in U.S. Government securities which, together with interest earned thereon, will provide amounts sufficient for future payment of principal and interest of the issues refunded. The assets, liabilities, and financial transactions of these trust accounts and the liability for the defeased bonds are not reflected in

STATE OF ARIZONA NOTES TO THE FINANCIAL STATEMENTS JUNE 30, 2014
- 125 -
the accompanying financial statements. The amount outstanding on the refunded bonds for the WIFA at June 30, 2014 totaled $271.7 million.
During fiscal year 2014, bond issuance premiums and deferred losses on refunding of bonds were amortized on a straight-line basis based on the term of the underlying bonds payable. In fiscal year 2014, the remaining balance of the deferred bond issuance costs of $4.2 million was written off per GASB 65. Amortization expense as of June 30, 2014 for bond issuance premiums and deferred losses on refunding of bonds was $7.7 million and $3.5 million, respectively.
The security for the bonds includes a pledge of monies and investments in the accounts held by the Trustee and the Financial Assistance accounts held for the WIFA by the State Treasurer and all pledged loans.
At the end of fiscal year 2014, the amount of money and investments held by the Trustee and the monies held by the State Treasurer was $323.6 million. The principal and interest repayments received on pledged loans in fiscal year 2014 were $103.7 million. The principal and interest paid on the outstanding bonds in fiscal year 2014 was $84.0 million.
b. University of Arizona Health Network and Subsidiaries
The UMC is subject to certain financial covenants under the Master Trust Indenture (the Indenture). In addition, the Indenture places certain restrictions on the incurrence of additional indebtedness and the sale or acquisition of property. The UMC is the only member of the obligated group responsible for the public debt offerings of the UMC. For the year ended June 30, 2014, the UMC violated the debt service coverage ratio covenant included in the Indenture. The Indenture requires management to perform certain actions during the year immediately following the year of violation. If management performs these actions, an event of default is avoided. Management intends to fulfill these actions. At June 30, 2014, the bonds subject to the Indenture are not in default; accordingly, their maturities have not been adjusted from the original maturities. The UPH is also subject to certain financial and nonfinancial covenants under its bond agreements. The UPH was in violation of certain covenants as of June 30, 2014; however, these covenant violations have been waived by the holder of the debt; accordingly, their maturities have not been adjusted from the original maturities. The UAHN has established and maintains separate funds as a bond reserve fund on outstanding bonds payable. These funds, which totaled $24.9 million at June 30, 2014, are held by the trustee and are reflected in assets held by trustee in the accompanying financial statements. The bonds or other obligations of the UAHN do not constitute general obligations of the ABOR, the U of A, the State, or any political subdivision thereof.
Summary of Revenue Bonds
The following schedule summarizes revenue bonds outstanding at June 30, 2014 (expressed in thousands):
Revenue Bonds Outstanding Dates Issued Maturity Dates Interest Rates
Outstanding Balance at
June 30, 2014 Component Units: Water Infrastructure Finance Authority 2004-2012 2015-2031 .2-5.00% $ 818,750 University of Arizona Health Network
and Subsidiaries 2004-2014 2015-2042 4.08-6.48% 336,597

STATE OF ARIZONA NOTES TO THE FINANCIAL STATEMENTS JUNE 30, 2014
- 126 -
Principal and interest debt service payments on revenue bonds outstanding at June 30, 2014 are as follows (expressed in thousands):
c. Changes in Long-Term Obligations
The following is a summary of changes in long-term obligations for the component units (expressed in thousands):
Balance July 1, 2013 as restated Increases Decreases
Balance June 30, 2014
Due Within One Year
Due Thereafter
Water Infrastructure Finance Authority: Long-term Debt: Revenue bonds $ 863,900 $ - $ (45,150) $ 818,750 $ 46,495 $ 772,255 Revenue bond premium 81,071 - (7,074) 73,997 - 73,997
Total Long-term Debt 944,971 - (52,224) 892,747 46,495 846,252 Other Long-term Liabilities: Compensated absences 93 96 (85) 104 104 -
Total Other Long-term Liabilities 93 96 (85) 104 104 -
Total Long-term Obligations $ 945,064 $ 96 $ (52,309) $ 892,851 $ 46,599 $ 846,252 University of Arizona Health Network and Subsidiaries: Long-term Debt: Revenue bonds $ 310,128 $ 32,808 $ (6,339) $ 336,597 $ 6,947 $ 329,650 Revenue bond premium and discount (2,201) 155 (129) (2,175) - (2,175)
Notes payable 9,737 - (873) 8,864 534 8,330 Capital leases 640 - (640) - - - Line of credit 19,734 20,000 (19,734) 20,000 20,000 - Total Long-term Debt 338,038 52,963 (27,715) 363,286 27,481 335,805 Other Long-term Liabilities: Compensated absences 27,916 33,862 (27,916) 33,862 30,255 3,607 Other 281 1,487 (1,120) 648 - 648 Total Other Long-term Liabilities 28,197 35,349 (29,036) 34,510 30,255 4,255
Total Long-term Obligations $ 366,235 $ 88,312 $ (56,751) $ 397,796 $ 57,736 $ 340,060
Annual Debt Service University of Arizona Health Network and Subsidiaries
Fiscal Year Principal Interest Total 2015 $ 6,947 $ 17,921 $ 24,868 2016 7,295 17,572 24,867 2017 7,670 17,195 24,865 2018 8,070 16,794 24,864 2019 8,490 16,374 24,864
2020-2024 49,635 74,687 124,322 2025-2029 64,210 60,115 124,325 2030-2034 83,515 40,815 124,330 2035-2039 85,005 16,551 101,556 2040-2042 15,760 485 16,245
Total $ 336,597 $ 278,509 $ 615,106
Annual Debt Service Water Infrastructure Finance Authority
Fiscal Year Principal Interest Total 2015 $ 46,495 $ 36,742 $ 83,237 2016 49,990 34,695 84,685 2017 49,110 32,881 81,991 2018 52,300 31,077 83,377 2019 53,045 29,014 82,059
2020-2024 289,365 104,797 394,162 2025-2029 234,550 37,374 271,924 2030-2031 43,895 1,924 45,819
Total $ 818,750 $ 308,504 $ 1,127,254

STATE OF ARIZONA NOTES TO THE FINANCIAL STATEMENTS JUNE 30, 2014
- 127 -
2. Universities-Affiliated Component Units A summary of bonds payable as of June 30, 2014 include the following (expressed in thousands):
Final
Maturity Amount
ASU Foundation: Series 2014A Revenue Refunding Bonds 2034 $ 39,050 Series 2014B Revenue Refunding Bonds 2016 4,360 Series 2004A Variable Rate Revenue Bonds 2034 22,420 Series 2004B Variable Rate Revenue Bonds 2022 7,460
ACFFC: Series 2011 Tax-Exempt Revenue Refunding Bonds 2018 13,475 Series 2009 Revenue Bonds 2024 34,475 Series 2009A Lease Revenue Refunding Bonds 2034 22,955 Series 2009B Lease Revenue Refunding Bonds 2022 8,310 Series 2008 Revenue Bonds 2028 14,010 Series 2008 Revenue Refunding Bonds 2039 142,125 Series 2008 Variable Rate Demand Revenue Refunding Bonds 2030 37,095 Series 2005 Tax-Exempt Refunding Bonds 2035 15,580 Deferred Cost of Refunding (299) Unamortized Bond Premium 1,359 Downtown Phoenix Student Housing: Series 2007A&C Revenue Bonds 2042 118,140 Series 2007D Tax-Exempt Revenue Bonds 2042 22,700 Unamortized Bond Discount (1,057)
Scheduled future maturities of Universities-affiliated component units' bonds payable are as follows (expressed in thousands):
Fiscal Year ASU Foundation ACFFC
Downtown Phoenix Student
Housing
2015 $ 2,600 $ 9,300 $ 610 2016 2,195 9,865 810
2017 2,275 10,555 1,025 2018 2,365 11,275 1,245 2019 2,480 12,040 1,480
Thereafter 61,375 236,050 134,613
Total $ 73,290 $ 289,085 $ 139,783 H. CONDUIT DEBT
The purpose of the GADA is to provide cost-effective capital for local communities, certain special districts, and tribal governments for public infrastructure projects. The GADA’s bond structure allows it to lower borrowing costs for Arizona’s communities by issuing and selling bonds tax-exempt and by sharing financing costs among several borrowers. Principal and interest are payable semi-annually. Loans are secured by the Pledged Collateral Reserve Fund, a requirement that is calculated and deposited by the GADA from the GADA Fund, which is held by the State Treasurer. Some borrowers also have separate, additional reserve funds, which are held by the Trustee. An intercept mechanism of state-shared revenues for political subdivisions enhances the security of the GADA bonds. In previous years, the State appropriated a total of $20.0 million to the GADA for the express purpose of securing bonds issued by the GADA. Although issued in the name of the GADA, loans funded through the GADA bonds are solely the obligation of the underlying borrowers and are documented by loan repayment agreements. Pursuant to A.R.S. § 41-2259, the GADA’s bonds

STATE OF ARIZONA NOTES TO THE FINANCIAL STATEMENTS JUNE 30, 2014
- 128 -
do not constitute nor create a general, special, or other obligation or other indebtedness of the State or any governmental unit within the meaning of any constitutional or statutory debt limitation. The bonds do not constitute a legal debt of the State and are not enforceable against the State. The only exposure to the State is related to the restricted net position of $12.0 million in the Pledged Collateral Reserve Fund. At June 30, 2014, the total outstanding face value of all bonds issued by the GADA was $408.4 million.
I. SUBSEQUENT EVENTS
In June 2014, the UAHN and the U of A executed a Principles of Agreement document with Banner Health, to create a statewide health care organization and a comprehensive new model for academic medicine. This merger is expected to close on February 27, 2015.
In December 2014, the WIFA issued $342.6 million of Water Quality Revenue Refunding Bonds, Series 2014A (2014A Bonds) to refund portions of the WIFA’s outstanding bonds and to pay costs of issuance. The 2014A Bonds include serial bonds with interest rates ranging from 2.00% to 5.00% and maturity dates ranging from 2016 to 2031. The 2014A Bonds are subject to optional redemption prior to their stated maturity dates pursuant to the debt documents. The bonds being refunded will be paid by investments held in an irrevocable trust.

REQUIRED SUPPLEMENTARY
INFORMATION

REQUIRED SUPPLEMENTARY INFORMATION

STATE OF ARIZONAREQUIRED SUPPLEMENTARY INFORMATIONBUDGETARY COMPARISON SCHEDULE, EXPENDITURESGENERAL FUNDFOR THE YEAR ENDED JUNE 30, 2014 ORIGINAL FINAL ACTUAL(Expressed in Dollars) BUDGET BUDGET EXPENDITURE
(Appropriations) (Appropriations) AMOUNTS
ADMINISTRATION, ARIZONA DEPARTMENT OF500 BED MAXIMUM SECURITY FY12-13 $ 18,942,751 $ 18,942,751 $ 14,904,399 500 BED MAXIMUM SECURITY FY13-14 30,000,000 30,000,000 16,607,301 ADMINISTRATIVE ADJUSTMENTS - 994,697 994,697 ADULT INFORMATION MANAGEMENT SYSTEM 8,000,000 8,000,000 - AFIS REPLACEMENT ERP 28,638,000 28,638,000 15,999,187 ANNUAL REV PERSONNEL DIV FUND ARS41-764C - 2,037,041 2,037,041 AUTOMATION AND INFORMATION TECH PROJECTS 11,500,000 11,500,000 5,523,643 AUTOMATION PROJECTS GF 18,400,000 18,400,000 18,400,000 BUILDING RENEWAL FY09-10 - 1,321 - BUILDING RENEWAL FY10-11 15,568 15,568 200 BUILDING RENEWAL FY11-12 1,142,917 1,142,917 1,129,487 BUILDING RENEWAL FY12-13 8,657,616 8,657,616 5,057,944 BUILDING RENEWAL FY13-14 9,000,000 9,000,000 1,066,172 CAPITOL MALL FIRE SYSTEM REPLACE FY08-09 6,764 6,764 - CAPITOL MALL SECURITY SYSTEM 2,000,000 2,000,000 231,339 CASH TRANSFER BETWEEN FUNDS 2,400 2,400 2,400 CASH TRANSFER TO AUTOMATION PROJECTS FUND 11,530,700 11,530,700 11,530,700 COP DEBT SERVICE 2009 3RD SS CH 6 SEC 32 60,107,800 60,107,800 60,107,800 COP DEBT SERVICE 2009 6TH SS CH 4 SEC 2A 24,012,000 24,012,000 24,012,000 CORRECTIONS BUILDING RENEWAL FY11-12 1,630,500 2,066,906 - COUNTY ATTORNEYS IMMIGRATION ENFORCEMENT FY12-13 60,981 60,981 - COUNTY ATTORNEYS IMMIGRATION ENFORCEMENT FY13-14 1,213,200 1,213,200 973,719 COUNTY SERVICES DISTRIBUTION 7,150,500 7,150,500 7,150,500 DATA SECURITY AND ENCRYPTION DOR 4,900,000 4,900,000 253,489 E LICENSING DEQ 5,000,000 5,000,000 4,483,524 HB1464 PERSONNEL REFORM FY98-99 273,045 45 - IMPLEMENT UPGRADE TAXPAYER ACCTG SYSTEM 1,700,000 1,700,000 1,071,329 OPERATING LUMP SUM APPROPRIATION 39,986,900 40,853,400 35,467,006 OPERATING LUMP SUM APPROPRIATION - ST BD 212,500 231,000 228,743 PUBLIC SAFETY COMMUNICATIONS 549,700 549,700 261,243 RELIEF BILL CASH TRANSFER FY14 - 1,430 1,430 RELOCATION FY99-00 4,520 4,520 - RELOCATION FY00-01 55,301 55,301 - RELOCATION FY01-02 59,026 59,026 - RELOCATION FY02-03 58,149 58,149 - STATE SURPLUS PROPERTY SALES PROCEEDS 1,260,000 1,835,000 1,734,925 STATEWIDE INFO SECURITY AND PRIVACY OFC 857,800 857,800 784,044 STUDENT LONGITUDINAL DATA SYSTEM 7,000,000 7,000,000 7,000,000 UTILITIES 8,275,600 8,275,600 7,554,795 WHITE MOUNTAIN APACHE TRIBES WATER RIGHT 2,000,000 2,000,000 -
ADMINISTRATIVE HEARINGS, OFFICE OFOPERATING LUMP SUM APPROPRIATION 821,400 874,500 874,500
AGRICULTURE, ARIZONA DEPARTMENT OFADMINISTRATIVE ADJUSTMENTS - 12,443 12,443 AGRICULTURAL EMPLOYMENT RELATIONS BOARD 23,300 23,300 23,300 AGRICULTURE CONSULTING AND TRAINING PARI-MUTUEL 128,500 128,500 128,500 ANIMAL DAMAGE CONTROL 65,000 65,000 47,814 OFFSITE NUCLEAR EMERGENCY RESPONSE PLANS - 198,434 198,434 OPERATING LUMP SUM APPROPRIATION 7,595,000 7,881,800 7,878,499 RED IMPORTED FIRE ANT 23,200 23,200 23,200
AHCCCS - ARIZONA HEALTH CARE COST CONTAINMENT SYSTEMACA ADULT EXPANSION - 65,931,900 40,385,589 ADMINISTRATIVE ADJUSTMENTS - 160,641,023 160,641,023 ALTCS SERVICES 1,220,006,600 1,220,006,600 1,192,101,604 CHILDREN'S REHABILITATIVE SERVICES 111,736,400 159,150,000 156,367,982 CHIP - SERVICES 12,081,300 12,081,300 9,469,104 DES ELIGIBILITY 53,799,300 120,774,100 88,533,292 DISPROPORTIONATE SHARE PAYMENTS 13,487,100 13,487,100 4,202,300
The Notes to Required Supplementary Information are an integral part of this schedule. (continued)
-131 -

STATE OF ARIZONAREQUIRED SUPPLEMENTARY INFORMATIONBUDGETARY COMPARISON SCHEDULE, EXPENDITURESGENERAL FUNDFOR THE YEAR ENDED JUNE 30, 2014 ORIGINAL FINAL ACTUAL(Expressed in Dollars) BUDGET BUDGET EXPENDITURE
(Appropriations) (Appropriations) AMOUNTS
DSH - VOLUNTARY 28,457,100 43,318,000 25,806,951 GRADUATE MEDICAL EDUCATION 160,184,900 186,490,100 159,376,439 KIDSCARE II FED 20,924,000 37,772,000 36,263,719 KIDSCARE II LOCAL GOVT MATCH 5,901,700 10,450,700 9,835,449 OPERATING LUMP SUM APPROPRIATION 75,747,800 91,696,600 82,821,585 PROP 204 AHCCCS ADMINISTRATION 6,635,800 8,831,800 8,080,305 PROP 204 DES ELIGIBILITY 37,793,600 26,393,100 24,106,805 PROPOSITION 204 SERVICES 1,029,647,500 1,331,828,200 1,272,319,321 RURAL HOSPITAL REIMBURSEMENT 13,858,100 13,858,100 13,008,100 SAFETY NET CARE POOL 166,000,000 487,953,400 476,367,179 TRADITIONAL MEDICAID SERVICES 3,593,266,500 3,446,490,100 3,152,899,036
ARIZONA STATE UNIVERSITYBIOMEDICAL INFORMATICS 1,955,200 1,955,200 1,955,200 DOWNTOWN PHOENIX CAMPUS 15,661,000 22,445,000 22,445,000 OPERATING LUMP SUM APPROPRIATION-EAST 12,511,400 18,289,400 18,289,400 OPERATING LUMP SUM APPROPRIATION-MAIN 143,370,400 211,828,600 211,828,600 OPERATING LUMP SUM APPROPRIATION-WEST 23,224,600 33,328,100 33,328,100 PARITY FUNDING POLY 3,497,800 3,497,800 3,497,800 PARITY FUNDING TEMPE 20,444,400 20,444,400 20,444,400 RESEARCH INFRASTRUCTURE LEASE-PURCHASE PAYMENT - 13,555,000 13,553,615 RESEARCH INFRASTRUCTURE LEASE-PURCHASE PAYMENT-POLY - 917,000 917,000
ATTORNEY GENERAL - DEPARTMENT OF LAWADMINISTRATIVE ADJUSTMENTS - 26,230 26,230 CAPITAL POSTCONVICTION PROSECUTION 500,000 500,000 488,099 LEGAL ARIZONA WORKERS ACT FY07-08 100,000 100,000 - MILITARY INSTALLATION/PLANNING FY11-12 206 206 - MILITARY INSTALLATION/PLANNING FY12-13 316 316 - MILITARY INSTALLATION/PLANNING FY13-14 - 85,800 85,800 OPERATING LUMP SUM APPROPRIATION 36,730,400 37,814,200 36,909,181 STATE GRAND JURY 177,500 177,500 177,344
AUDITOR GENERALOPERATING LUMP SUM APPROPRIATION FY10-11 425,540 425,540 - OPERATING LUMP SUM APPROPRIATION FY11-12 1,821,473 1,821,473 141,934 OPERATING LUMP SUM APPROPRIATION FY12-13 3,597,444 3,597,444 1,727,043 OPERATING LUMP SUM APPROPRIATION FY13-14 17,240,100 17,989,700 15,264,933
CHARTER SCHOOLS, STATE BOARD FORADMINISTRATIVE ADJUSTMENTS - 5,185 5,185 OPERATING LUMP SUM APPROPRIATION 748,100 822,400 787,798
COMMISSION ON UNIFORM STATE LAWSDUES AND TRAVEL EXPENSES 75,000 75,000 75,000
CORPORATION COMMISSIONOPERATING LUMP SUM APPROPRIATION 639,350 659,800 560,407 RAILROAD WARNING SYSTEMS FY00-01 47,510 47,510 -
CORRECTIONS, STATE DEPARTMENT OFADMINISTRATIVE ADJUSTMENTS - 852,713 852,713 ASPC YUMA CHEYENNE REPAIRS 8,000,000 8,000,000 791,475 BUILDING RENEWAL FUND EXPENDITURES FY11-12 490,044 490,044 490,044 BUILDING RENEWAL FUND EXPENDITURES FY12-13 2,248,495 2,248,495 1,574,510 BUILDING RENEWAL FUND EXPENDITURES FY13-14 5,000,000 5,000,000 888,673 CASH TRANSFER TO AUTOMATION PROJECTS FUND 28,800 28,800 28,800 INMATE HEALTH CARE CONTRACTED SERVICES 115,274,900 116,274,900 116,239,900 OPERATING LUMP SUM APPROPRIATION 745,641,700 751,586,100 749,744,286 PRIVATE PRISON PER DIEM 106,884,100 106,884,100 106,843,959
COURT OF APPEALS DIVISION IADMINISTRATIVE ADJUSTMENTS - 15,689 15,689 OPERATING LUMP SUM APPROPRIATION - DIVISION I 9,640,000 9,896,900 9,875,070
COURT OF APPEALS DIVISION IIOPERATING LUMP SUM APPROPRIATION - DIVISION II 4,227,600 4,289,800 4,289,797
The Notes to Required Supplementary Information are an integral part of this schedule. (continued)
-132 -

STATE OF ARIZONAREQUIRED SUPPLEMENTARY INFORMATIONBUDGETARY COMPARISON SCHEDULE, EXPENDITURESGENERAL FUNDFOR THE YEAR ENDED JUNE 30, 2014 ORIGINAL FINAL ACTUAL(Expressed in Dollars) BUDGET BUDGET EXPENDITURE
(Appropriations) (Appropriations) AMOUNTS
DEAF AND BLIND, ARIZONA SCHOOLS FOR THEADMINISTRATION STATEWIDE 3,591,400 4,926,480 4,682,272 ADMINISTRATIVE ADJUSTMENTS - 1,248,795 1,248,795 PHOENIX DAY SCHOOL FOR THE DEAF 3,503,700 3,648,142 3,316,447 PRESCHOOL AND OUTREACH PROGRAMS 1,845,900 1,978,776 1,900,137 REGIONAL COOPERATIVES 798,600 832,400 832,400 SCHOOL BUS REPLACEMENT 738,000 738,000 737,915 TUCSON CAMPUS 10,108,500 9,671,503 8,700,591 TUCSON CAMPUS DORM RENOVATIONS 1,000,000 1,000,000 1,000,000
ECONOMIC SECURITY, DEPARTMENT OFADMINISTRATIVE ADJUSTMENTS - 128,840,142 128,840,142 ADOPTION SERVICES 177,554,600 177,554,600 76,960,934 ADULT SERVICES 6,924,100 7,924,100 7,540,474 AGENCYWIDE OPERATING LUMP SUM APPROPRIATION 215,622,000 231,026,100 194,308,944 ATTORNEY GENERAL LEGAL SERVICES 10,830,500 10,867,300 9,006,503 AZ TRAINING PROGRAM COOLIDGE-TITLE XIX 20,327,100 22,302,000 19,486,974 CASE MANAGEMENT-STATE ONLY 3,846,000 3,926,600 3,798,089 CASE MANAGEMENT-TITLE XIX 49,143,800 61,900,800 54,806,949 CHILDREN SUPPORT SERVICES 143,293,700 159,852,200 84,614,748 COMMUNITY AND EMERGENCY SERVICES 3,724,000 3,724,000 3,018,028 CONTINGENCY FUNDING 10,500,000 10,500,000 10,500,000 COORDINATED HOMELESS PROGRAM 2,522,600 2,522,600 2,121,230 COORDINATED HUNGER 1,754,600 1,754,600 1,164,095 COUNTY PARTICIPATION 8,600,200 8,600,200 5,347,854 CPS EMERGENCY AND RESIDENTIAL PLACEMENT 84,219,300 81,869,300 37,394,335 DAY CARE SUBSIDY 130,396,600 126,396,600 110,191,082 DCYF ATTORNEY GENERAL LEGAL SERVICES 20,068,700 20,446,700 12,684,400 DCYF OPERATING LUMP SUM 165,648,500 179,890,800 121,874,487 DOMESTIC VIOLENCE PREVENTION 9,903,700 9,903,700 8,637,695 FOSTER CARE PLACEMENT 50,351,200 50,351,200 25,651,430 GRANDPARENT STIPENDS 1,000,000 1,000,000 339,978 HOME AND COMMUNITY BASED SERVICES-STATE ONLY 33,443,400 19,343,200 12,568,399 HOME AND COMMUNITY BASED SERVICES-TITLE XIX 982,631,300 964,697,500 887,592,888 INDEPENDENT LIVING MAINTENANCE 3,469,300 2,969,300 2,219,300 INDEPENDENT LIVING REHABILITATION SERVICES 166,000 116,000 116,000 INSTITUTIONAL SERVICES-TITLE XIX 25,712,300 28,795,500 24,688,694 INTENSIVE FAMILY SERVICES 5,000,000 5,000,000 5,000,000 JOBS 11,894,700 11,924,700 9,865,098 MEDICAL CLAWBACK 3,072,000 3,072,000 3,072,000 MEDICAL SERVICES-TITLE XIX 188,890,200 176,460,500 169,053,244 PERMANENT GUARDIAN SUBSIDY 11,215,300 11,715,300 10,330,943 REHABILITATION SERVICES 3,594,400 2,594,400 2,594,400 SPECIAL SUPPLEMENTAL APPROPRIATION 28,500,000 63,500,000 63,500,000 STATE FUNDED LONG-TERM CARE SERVICES 26,528,100 28,328,100 25,012,206 TANF CASH BENEFITS 44,999,400 40,499,400 40,467,478 TRIBAL PASS-THRU FUNDING 4,680,300 4,680,300 4,680,300 WORKFORCE INVESTMENT ACT SERVICES 51,654,600 51,654,600 39,130,167
EDUCATION, DEPARTMENT OFACHIEVEMENT TESTING 3,218,400 3,223,600 3,223,600 ADDITIONAL STATE AID TO SCHOOLS 339,269,300 339,269,300 336,776,400 ADMINISTRATIVE ADJUSTMENTS - 15,591,276 15,591,276 ADULT EDUCATION 4,500,000 4,500,000 4,500,000 ARIZONA STRUCTURED ENGLISH IMMERSION 8,791,400 8,791,400 8,791,400 BASIC STATE AID DEFERRED PAYMENT FY13 952,627,700 952,627,700 929,332,067 BASIC STATE AID ENTITLEMENT 2,228,951,900 2,275,951,900 2,275,464,511 CASH TRANSFER TO AUTOMATION PROJECTS FUND 1,998,242 1,998,242 1,982,176 EMPOWERMENT SCHOLARSHIP ACCOUNT 137,843 137,843 36,857 ENGLISH LANGUAGE ACQUISITION FY06-07 2,827 2,827 - ENGLISH LEARNER ADMINISTRATION 3,967,700 4,016,200 4,016,200
The Notes to Required Supplementary Information are an integral part of this schedule. (continued)
-133 -

STATE OF ARIZONAREQUIRED SUPPLEMENTARY INFORMATIONBUDGETARY COMPARISON SCHEDULE, EXPENDITURESGENERAL FUNDFOR THE YEAR ENDED JUNE 30, 2014 ORIGINAL FINAL ACTUAL(Expressed in Dollars) BUDGET BUDGET EXPENDITURE
(Appropriations) (Appropriations) AMOUNTS
ENGLISH LEARNER TEACHER FY04-05 477,154 477,154 - K-3 READING 40,000,000 40,007,600 40,007,600 OPERATING LUMP SUM APPROPRIATION-ADMINISTRATION 8,163,800 8,461,000 8,459,599 OPERATING LUMP SUM APPROPRIATION-STATE BOARD 1,213,600 1,234,700 1,234,700 OTHER STATE AID TO DISTRICTS FY07 983,900 983,900 56,440 PERFORMANCE INCENTIVE FUND DEPOSIT 2,400,000 2,400,000 2,400,000 READING FIRST INITIATIVE FY07-08 97,003 97,003 97,003 SCHOOL SAFETY PROGRAM 3,646,400 3,646,400 2,972,278 SPECIAL EDUCATION FUND 33,242,100 33,242,100 33,242,100 STATE BLOCK GRANT FOR VOCATIONAL EDUCATION 11,494,500 11,575,400 11,575,400
EMERGENCY AND MILITARY AFFAIRS, DEPARTMENT OFADMINISTRATION 1,706,000 1,822,900 1,814,754 COCONINO COUNTY CAMPBELL FLOOD FY11-12 25,358 25,358 25,358 DISASTER DECLARATION - 4,000,000 4,000,000 EMERGENCY MANAGEMENT 709,900 729,900 729,329 EUZ701 SEARCH AND RESCUE FY11-12 7,220 7,220 7,219 EUZ701 SEARCH AND RESCUE FY12-13 4,022 4,022 4,022 FEBRUARY 2005 WINTER STORMS FY07-08 92,475 92,475 62,379 FEBRUARY 2005 WINTER STORMS FY10-11 34,039 34,039 1,067 GREENLEE COUNTY FLOODING 58,451 58,451 58,450 HAZARD MATERIALS CONTINGENCY FY03-04 3,539 3,539 3,539 HAZARD MATERIALS CONTINGENCY FY07-08 48,358 48,358 46,461 JANUARY 2010 WINTER STORM FY09-10 3,452 3,452 3,452 MILITARY AFFAIRS 1,199,500 1,194,800 1,183,808 MILITARY AFFAIRS COMMISSION FY10-11 39,649 39,649 - MILITARY AFFAIRS COMMISSION FY11-12 23,218 23,218 - MILITARY AFFAIRS COMMISSION FY12-13 38,605 38,605 - MILITARY AFFAIRS COMMISSION FY13-14 - 90,000 90,000 NORTHERN ARIZONA WINTER STORM FY10-11 261,084 261,084 8,207 NORTHERN GREENLEE COUNTY FLOODING FY11-12 24,752 24,752 24,752 NORTHERN GREENLEE COUNTY FLOODING FY12-13 100,000 100,000 100,000 NUCLEAR EMERGENCY MANAGEMENT FUND-BUCKEYE GF TRF - 69,909 69,909 NUCLEAR EMERGENCY MANAGEMENT FUND-GF TSF - 524,008 524,008 NUCLEAR EMERGENCY MANAGEMENT FUND-MARICOPA-GF TRF - 665,916 665,916 POST-GLADIATOR FIRE FLOODING 36,243 36,243 36,242 SCHULTZ FIRE POST-FIRE FLOOD FY10-11 1 1 (69,460) SERVICE CONTRACTS FY12-13 642,098 642,098 407,744 SERVICE CONTRACTS FY13-14 1,215,000 1,215,000 578,495 SUMMER 2006 MONSOONS AND FLOODING FY07-08 3,539 3,539 3,539 SUMMER 2006 MONSOONS AND FLOODING FY11-12 166,035 166,035 6,271
ENVIRONMENTAL QUALITY, DEPARTMENT OFADMINISTRATIVE ADJUSTMENTS - 59,555 59,555 CASH TRANSFER TO AUTOMATION PROJECTS FUND 93,700 93,700 93,700 OPERATING LUMP SUM APPROPRIATION 13,008,700 13,308,500 2,958,305
EQUAL OPPORTUNITY, GOVERNOR'S OFFICE OFADMINISTRATIVE ADJUSTMENTS - 41 41 OPERATING LUMP SUM APPROPRIATION 187,100 188,500 188,423
EQUALIZATION, STATE BOARD OFADMINISTRATIVE ADJUSTMENTS - 742 742 OPERATING LUMP SUM APPROPRIATION 629,500 639,500 520,422
EXECUTIVE CLEMENCY, BOARD OFOPERATING LUMP SUM APPROPRIATION 821,500 838,400 824,733
FINANCIAL INSTITUTIONS, DEPARTMENT OFOPERATING LUMP SUM APPROPRIATION 2,912,800 3,019,100 3,011,159
FIRE, BUILDING AND LIFE SAFETY, DEPARTMENT OFOPERATING LUMP SUM APPROPRIATION 1,969,100 2,026,000 1,945,413
FORESTER, OFFICE OF THE STATEADMINISTRATIVE ADJUSTMENTS - 169,532 169,532 ENVIRONMENTAL COUNTY GRANTS 175,000 175,000 175,000
The Notes to Required Supplementary Information are an integral part of this schedule. (continued)
-134 -

STATE OF ARIZONAREQUIRED SUPPLEMENTARY INFORMATIONBUDGETARY COMPARISON SCHEDULE, EXPENDITURESGENERAL FUNDFOR THE YEAR ENDED JUNE 30, 2014 ORIGINAL FINAL ACTUAL(Expressed in Dollars) BUDGET BUDGET EXPENDITURE
(Appropriations) (Appropriations) AMOUNTS
FIRE SUPPRESSION SLI 1,000,000 1,000,000 1,000,000 GENERAL FUND TRANSFER TO FIRE SUPPRESSION - 3,000,000 3,000,000 INMATE FIRE CREWS 695,700 695,700 669,899 OPERATING LUMP SUM APPROPRIATION 2,291,700 2,365,700 2,334,670 RESOURCE MANAGEMENT PLAN GRANTS 100,000 100,000 -
GENERAL ACCOUNTING OFFICECAPITAL OUTLAY STATE AID COCHISE 450,400 450,400 450,400 CAPITAL OUTLAY STATE AID COCONINO 147,500 147,500 147,500 CAPITAL OUTLAY STATE AID GILA 50,000 50,000 50,000 CAPITAL OUTLAY STATE AID GRAHAM 218,100 218,100 218,100 CAPITAL OUTLAY STATE AID MOHAVE 211,700 211,700 211,700 CAPITAL OUTLAY STATE AID NAVAJO 122,600 122,600 122,600 CAPITAL OUTLAY STATE AID PINAL 257,700 257,700 257,700 CAPITAL OUTLAY STATE AID SANTA CRUZ 16,700 16,700 16,700 CAPITAL OUTLAY STATE AID YAVAPAI 248,600 248,600 248,600 CAPITAL OUTLAY STATE AID YUMA LA PAZ 276,700 276,700 276,700 EQUALIZATION AID - COCHISE 4,712,400 4,712,400 4,712,400 EQUALIZATION AID - GRAHAM 16,075,100 16,075,100 16,075,100 EQUALIZATION AID - NAVAJO 5,514,200 5,514,200 5,514,200 HR PRORATA ADJUSTMENTS 1,605,400 71,300 - LEASE PURCHASE ADJUSTMENTS 67,800 - - NAMED CLAIMANTS BILL - 193,632 193,632 OPERATING STATE AID - COCHISE 5,710,100 5,710,100 5,710,100 OPERATING STATE AID - COCONINO 1,840,400 1,840,400 1,840,400 OPERATING STATE AID - GILA 370,700 370,700 370,700 OPERATING STATE AID - GRAHAM 2,345,700 2,345,700 2,345,700 OPERATING STATE AID - MARICOPA 7,913,300 7,913,300 7,913,300 OPERATING STATE AID - MOHAVE 1,659,400 1,659,400 1,659,400 OPERATING STATE AID - NAVAJO 1,646,600 1,646,600 1,646,600 OPERATING STATE AID - PIMA 7,136,600 7,136,600 7,136,600 OPERATING STATE AID - PINAL 2,135,000 2,135,000 2,135,000 OPERATING STATE AID - SANTA CRUZ 58,700 58,700 58,700 OPERATING STATE AID - YAVAPAI 893,900 893,900 893,900 OPERATING STATE AID - YUMA LA PAZ 2,754,400 2,754,400 2,754,400 RETENTION PAYMENT ADJUSTMENTS 23,500,000 119,200 - RISK MANAGEMENT ADJUSTMENTS 327,100 5,400 - RURAL COUNTY REIMBURSEMENT SUBSIDY 848,800 848,800 848,800 WOOLSEY FLOOD DISTRICT - 117,597 117,597
GEOLOGICAL SURVEY, ARIZONAOPERATING LUMP SUM APPROPRIATION 853,600 941,400 941,400
GOVERNOR, OFFICE OF THEOPERATING LUMP SUM APPROPRIATION FY10-11 110,493 110,493 110,493 OPERATING LUMP SUM APPROPRIATION FY11-12 747,616 747,616 747,616 OPERATING LUMP SUM APPROPRIATION FY12-13 3,137,461 3,137,461 1,071,345 OPERATING LUMP SUM APPROPRIATION FY13-14 6,586,600 6,926,000 4,673,019 OPERATING LUMP SUM APPROPRIATION-OSPB FY10-11 1,251,613 1,251,613 281,839 OPERATING LUMP SUM APPROPRIATION-OSPB FY11-12 124,535 124,535 - OPERATING LUMP SUM APPROPRIATION-OSPB FY12-13 38,412 38,412 22,418 OPERATING LUMP SUM APPROPRIATION-OSPB FY13-14 1,871,700 1,993,200 1,919,976
HEALTH SERVICES, DEPARTMENT OFADMINISTRATIVE ADJUSTMENTS - 934,727 934,727 ADULT CYSTIC FIBROSIS 105,200 105,200 78,900 AGENCYWIDE OPERATING LUMP SUM APPROPRIATION 115,612,200 117,586,700 102,362,761 AIDS REPORTING AND SURVEILLANCE 1,000,000 1,000,000 902,745 ALZHEIMER DISEASE RESEARCH 125,000 125,000 125,000 ASH CORRECTIVE ACTION PLAN SUPPLEMENTAL FY04-05 398,060 398,060 - BREAST AND CERVICAL CANCER SCREENING 1,346,700 1,346,700 844,167 CASH TRANSFER TO AUTOMATION PROJECTS FUND 64,000 64,000 64,000 COMMUNITY PLACEMENT TREATMENT 1,130,700 1,130,700 -
The Notes to Required Supplementary Information are an integral part of this schedule. (continued)
-135 -

STATE OF ARIZONAREQUIRED SUPPLEMENTARY INFORMATIONBUDGETARY COMPARISON SCHEDULE, EXPENDITURESGENERAL FUNDFOR THE YEAR ENDED JUNE 30, 2014 ORIGINAL FINAL ACTUAL(Expressed in Dollars) BUDGET BUDGET EXPENDITURE
(Appropriations) (Appropriations) AMOUNTS
COUNTY TUBERCULOSIS PROVIDER CARE AND CONTROL 590,700 590,700 522,297 CRISIS SERVICES 14,141,100 14,141,100 14,132,767 HIGH RISK PERINATAL SERVICES 2,093,400 2,093,400 1,487,870 MEDICAID BEHAVIORAL HEALTH - PROP 204 105,251,500 255,251,500 84,573,800 MEDICAID BEHAVIORAL HEALTH - TRADITIONAL 843,287,300 693,287,300 206,465,900 MEDICAID BEHAVIORAL HEALTH COMPREHENSIVE AND DENTAL 140,896,200 140,896,200 46,684,300 MEDICAID INSURANCE PREMIUM PAYMENTS 22,487,100 22,487,100 7,450,800 MEDICARE CLAWBACK PAYMENTS 14,925,100 14,925,100 14,925,100 MENTAL HEALTH FIRST AID 250,000 250,000 167,214 NON MEDICAID SERIOUSLY MENTAL ILL SVS 78,846,900 78,846,900 76,261,062 NON RENAL DISEASE MANAGEMENT 198,000 198,000 44,322 ONE TIME ELECTRONIC MED RECORDS START UP 3,850,000 3,850,000 - POISON CONTROL CENTER FUNDING 990,000 990,000 742,500 PROP 204 ADMINISTRATION TITLE XIX MATCH 6,446,700 6,446,700 2,131,400 REG HA DISPENSERS-AUDIOL PATHOL FY03-04 62,243 62,243 - RURAL HOSPITAL EMERGENCY AND TRAUMA SVS 300,000 300,000 300,000 SUPPORTED HOUSING 5,324,800 5,324,800 5,249,535 TANF PERINATAL SERVICES FY99-00 47,270 47,270 - TITLE XIX SUPPLEMENTAL - 167,439,300 28,636,191
HISTORICAL SOCIETY OF ARIZONA, PRESCOTTADMINISTRATIVE ADJUSTMENTS - 42,567 42,567 OPERATING LUMP SUM APPROPRIATION 804,200 826,000 751,824
HISTORICAL SOCIETY, ARIZONAARIZONA EXPERIENCE MUSEUM 410,500 428,300 428,300 FIELD SERVICES AND GRANTS 65,100 66,000 66,000 OPERATING LUMP SUM APPROPRIATION 2,033,800 2,116,500 2,116,500 PAPAGO PARK MUSEUM 532,700 544,200 544,200
HOUSE OF REPRESENTATIVESOPERATING LUMP SUM APPROPRIATION FY09-10 2,778,308 2,778,308 124,243 OPERATING LUMP SUM APPROPRIATION FY10-11 1,353,951 1,353,951 - OPERATING LUMP SUM APPROPRIATION FY11-12 1,087,704 1,087,704 - OPERATING LUMP SUM APPROPRIATION FY12-13 1,285,746 1,285,746 - OPERATING LUMP SUM APPROPRIATION FY13-14 13,067,100 13,422,200 12,376,524
INDEPENDENT REDISTRICTING COMMISSIONOPERATING EXPENDITURES - 1,462,701 279,173 OPERATING LUMP SUM APPROPRIATION FY12-13 60 60 60 OPERATING LUMP SUM APPROPRIATION FY13-14 1,100,000 1,115,100 1,115,100
INDIAN AFFAIRS, ARIZONA COMMISSION OFADMINISTRATIVE ADJUSTMENTS - 91 91 OPERATING LUMP SUM APPROPRIATION 53,700 56,900 53,992
INSURANCE, DEPARTMENT OFOPERATING LUMP SUM APPROPRIATION 5,169,600 5,364,900 5,334,710
JOINT LEGISLATIVE BUDGET COMMITTEEOPERATING LUMP SUM APPROPRIATION FY11-12 676,598 676,598 676,598 OPERATING LUMP SUM APPROPRIATION FY12-13 2,455,474 2,455,474 1,348,165 OPERATING LUMP SUM APPROPRIATION FY13-14 2,418,800 2,492,000 905
JUVENILE CORRECTIONS, DEPARTMENT OFADMINISTRATIVE ADJUSTMENTS - 66,796 66,796 CASH TRANSFER TO AUTOMATION PROJECTS FUND 16,300 16,300 16,300 OPERATING LUMP SUM APPROPRIATION 46,084,400 46,118,900 41,683,683
LAND DEPARTMENT, STATECAP USER FEES 513,300 641,600 641,520 CASH TRANSFER TO AUTOMATION PROJECTS FUND 3,600 3,600 3,600 DUE DILIGENCE FUND 500,000 500,000 7,339 NATURAL RESOURCE CONSERVATION DISTRICTS 390,000 390,000 377,000 OPERATING LUMP SUM APPROPRIATION 11,134,800 11,442,100 11,407,384
LEGISLATIVE COUNCILOMBUDSMAN-CITIZENS AID OFFICE FY09-10 17 17 - OMBUDSMAN-CITIZENS AID OFFICE FY10-11 6,241 6,241 6,188
The Notes to Required Supplementary Information are an integral part of this schedule. (continued)
-136 -

STATE OF ARIZONAREQUIRED SUPPLEMENTARY INFORMATIONBUDGETARY COMPARISON SCHEDULE, EXPENDITURESGENERAL FUNDFOR THE YEAR ENDED JUNE 30, 2014 ORIGINAL FINAL ACTUAL(Expressed in Dollars) BUDGET BUDGET EXPENDITURE
(Appropriations) (Appropriations) AMOUNTS
OMBUDSMAN-CITIZENS AID OFFICE FY11-12 61,487 61,487 61,428 OMBUDSMAN-CITIZENS AID OFFICE FY12-13 41,262 41,262 14,358 OMBUDSMAN-CITIZENS AID OFFICE FY13-14 608,000 629,034 522,041 OPERATING LUMP SUM APPROPRIATION FY09-10 1 1 - OPERATING LUMP SUM APPROPRIATION FY11-12 28 28 21 OPERATING LUMP SUM APPROPRIATION FY12-13 2,358,644 2,358,644 1,927,702 OPERATING LUMP SUM APPROPRIATION FY13-14 7,276,700 7,417,466 3,825,327
LIBRARY, ARCHIVES, AND PUBLIC RECORDS, ARIZONA STATEGRANTS-IN-AID FY09-10 31,309 31,309 31,309
LIQUOR, LICENSES, AND CONTROL, DEPARTMENT OFADMINISTRATIVE ADJUSTMENTS - 3,115 3,115 CASH TRANSFER TO AUTOMATION PROJECTS FUND 20,500 20,500 20,500 IMPROVEMENT OF DATA PROCESSING SYSTEM FY06-07 98,265 98,265 18,539 OPERATING LUMP SUM APPROPRIATION 2,850,400 2,932,300 2,932,179
MEDICAL STUDENT LOANS, BOARD OFMEDICAL STUDENT FINANCIAL ASSISTANCE FY06-07 346,555 346,555 - MEDICAL STUDENT FINANCIAL ASSISTANCE FY08-09 309,800 309,800 -
MINE INSPECTOR, STATEABANDONED MINES SAFETY FUND DEPOSIT 189,000 194,700 175,978 ADMINISTRATIVE ADJUSTMENTS - 4,394 4,394 OPERATING LUMP SUM APPROPRIATION 994,600 1,028,600 1,016,563
NAVIGABLE STREAM ADJUDICATION COMMISSION, ARIZONAADMINISTRATIVE ADJUSTMENTS - 701 701 LEGAL EXPENSES SUPPLEMENTAL - 150,000 82,334 OPERATING LUMP SUM APPROPRIATION 126,200 129,200 124,127
NORTHERN ARIZONA UNIVERSITYNAU - YUMA 3,066,700 3,066,700 3,066,700 OPERATING LUMP SUM APPROPRIATION 60,887,700 91,382,500 91,382,500 PARITY FUNDING 6,605,200 6,605,200 6,605,200 RESEARCH INFRASTRUCTURE LEASE-PURCHASE PAYMENT - 5,900,000 5,900,000 TEACHER TRAINING 2,290,600 2,290,600 2,290,600
NURSING, STATE BOARD OFGF SUPPLEMENTAL APPROPRIATION FOR CNA PROGRAM - 150,000 150,000
OCCUPATIONAL SAFETY AND HEALTH REVIEW BOARDOPERATING LUMP SUM APPROPRIATION 13,989 13,989 2,292
PARKS BOARD, ARIZONA STATEADMINISTRATIVE ADJUSTMENTS - 200,790 200,790 CASH TRANSFER TO AUTOMATION PROJECTS FUND 91,100 91,100 91,100 GF C/O YARNELL HILL MEMORIAL SITE ACQUIS - 500,000 - KARTCHNER CAVERNS STATE PARK 2,197,700 2,228,700 2,098,862 OPERATING LUMP SUM APPROPRIATION 10,451,800 10,592,400 10,099,880 SPRF BSF STATE PARKS CAPITAL IMPROVEMENT - 1,000,000 190,144
PERSONNEL BOARDADMINISTRATIVE ADJUSTMENTS - 281 281 CASH TRANSFER TO AUTOMATION PROJECTS FUND 2,600 2,600 2,600 OPERATING LUMP SUM APPROPRIATION 364,500 374,900 311,933
PIONEERS' HOME, ARIZONAADMINISTRATIVE ADJUSTMENTS - 2,296 2,296 OPERATING LUMP SUM APPROPRIATION 1,604,800 1,602,800 1,602,799
POSTSECONDARY EDUCATION, COMMISSION FORLEVERAGING EDUCATIONAL ASSISTANCE PARTNERSHIP 1,220,800 1,220,800 1,220,800 MATH AND SCIENCE TEACHER INITIATIVE 176,000 176,000 176,000
PUBLIC SAFETY, DEPARTMENT OFCASH TRANSFER TO AUTOMATION PROJECTS FUND 25,500 25,500 25,500 GIITEM 21,303,600 21,304,100 20,560,792 GIITEM IMPACT APPROPRIATION FY11-12 1,142 1,142 - GIITEM IMPACT APPROPRIATION FY12-13 365,489 365,489 362,115 GIITEM IMPACT APPROPRIATION FY13-14 2,603,400 2,603,400 2,165,512 GIITEM SUBACCOUNT 2,390,000 2,390,000 2,240,912
The Notes to Required Supplementary Information are an integral part of this schedule. (continued)
-137 -

STATE OF ARIZONAREQUIRED SUPPLEMENTARY INFORMATIONBUDGETARY COMPARISON SCHEDULE, EXPENDITURESGENERAL FUNDFOR THE YEAR ENDED JUNE 30, 2014 ORIGINAL FINAL ACTUAL(Expressed in Dollars) BUDGET BUDGET EXPENDITURE
(Appropriations) (Appropriations) AMOUNTS
GITTEM-GANG INTELLIGENCE TEAM ENFORCEMENT FY09-10 15 15 - MICROWAVE COMMUNICATION SYSTEM FY06-07 265,760 265,760 168,364 MOTOR VEHICLE FUEL 3,704,200 3,704,200 3,688,758 OPERATING LUMP SUM APPROPRIATION 28,336,100 28,048,600 28,048,175
RACING, ARIZONA DEPARTMENT OFARIZONA BREEDERS AWARD 250,000 250,000 250,000 COUNTY FAIR LIVESTOCK AND AGRICULTURAL 1,779,500 1,779,500 1,779,500
RADIATION REGULATORY AGENCYCASH TRANSFER TO AUTOMATION PROJECTS FUND 4,100 4,100 4,100 NUCLEAR EMERGENCY MANAGEMENT FUND - 695,250 695,250 OPERATING LUMP SUM APPROPRIATION 1,308,600 1,352,900 1,352,153
REAL ESTATE DEPARTMENT, STATEADMINISTRATIVE ADJUSTMENTS - 4,188 4,188 OPERATING LUMP SUM APPROPRIATION 2,902,200 2,988,700 2,608,281
REGENTS, ARIZONA BOARD OFARIZONA TEACHERS INCENTIVE PROGRAM 90,000 90,000 90,000 ARIZONA TRANSFER ARTICULATION SUPPORT SYSTEM 213,700 213,700 213,700 OPERATING LUMP SUM APPROPRIATION 2,350,300 2,349,300 2,349,300 PERFORMANCE FUNDING 5,000,000 5,000,000 5,000,000 STUDENT FINANCIAL ASSISTANCE 10,041,200 10,041,200 10,041,200 WESTERN INTERSTATE COMMISSION OFFICE 125,000 131,000 131,000 WICHE STUDENT SUBSIDIES 4,106,000 4,100,000 4,077,394
REVENUE, DEPARTMENT OFADMINISTRATIVE ADJUSTMENTS - 282,002 282,002 BRITS OPERATIONAL SUPPORT 7,452,200 7,452,200 7,426,563 CASH TRANSFER TO AUTOMATION PROJECTS FUND 187,700 187,700 187,700 OPERATING LUMP SUM APPROPRIATION 62,358,500 63,870,500 62,337,626 UNCLAIMED PROPERTY ADMINISTRATION/AUDIT 1,770,000 1,770,000 1,497,068
SCHOOL FACILITIES BOARDADMINISTRATIVE ADJUSTMENTS - 477 477 BUILDING RENEWAL GRANT 16,667,900 16,667,900 16,667,900 NEW SCHOOL CONSTRUCTION 672,000 672,000 672,000 NEW SCHOOL FACILITIES DEBT SERVICE 174,165,000 172,719,800 172,719,800 OPERATING LUMP SUM APPROPRIATION 1,610,700 1,676,500 1,598,936
SECRETARY OF STATEBUILDING RENOVATION AND CODE COMPLIANCE - 228,700 106,882 CASH TRANSFER TO AUTOMATION PROJECTS FUND 4,100 4,100 4,100 ELECTION SERVICES 1,000,000 1,000,000 997,208 HELP AMERICA VOTE ACT FY12-13 877,521 877,521 (356) HELP AMERICA VOTE ACT FY13-14 2,934,500 2,941,000 2,697,876 LIBRARY GRANTS-IN-AID FY11-12 3,438 3,438 - LIBRARY GRANTS-IN-AID FY12-13 121,400 121,400 85,900 LIBRARY GRANTS-IN-AID FY13-14 651,400 651,400 531,691 OPERATING LUMP SUM APPROPRIATION 10,450,500 10,628,100 10,574,278 STATEWIDE RADIO READING SERVICE FOR BLIND 97,000 97,000 97,000
SENATEBORDER SECURITY TRUST FUND 263,667 263,667 - OPERATING LUMP SUM APPROPRIATION FY11-12 784,184 784,184 - OPERATING LUMP SUM APPROPRIATION FY12-13 206,625 206,625 76,061 OPERATING LUMP SUM APPROPRIATION FY13-14 8,036,300 8,333,800 8,254,217
SUPREME COURTADMINISTRATIVE ADJUSTMENTS - 6,103 6,103 ADOA BUILDING RENEWAL FUND FY09-10 1,321 1,321 1,321 ADULT INTENSIVE PROBATION 10,741,200 10,654,500 10,649,447 ADULT STANDARD PROBATION 13,526,700 13,443,200 13,420,985 AUTOMATION 3,332,600 3,352,800 2,955,806 CASE AND CASH MANAGEMENT SYSTEM 139,400 139,400 - CASH TRANSFER BETWEEN FUNDS 11,700 11,700 11,700 COMMISSION ON JUDICIAL CONDUCT 506,800 522,300 521,981
The Notes to Required Supplementary Information are an integral part of this schedule. (continued)
-138 -

STATE OF ARIZONAREQUIRED SUPPLEMENTARY INFORMATIONBUDGETARY COMPARISON SCHEDULE, EXPENDITURESGENERAL FUNDFOR THE YEAR ENDED JUNE 30, 2014 ORIGINAL FINAL ACTUAL(Expressed in Dollars) BUDGET BUDGET EXPENDITURE
(Appropriations) (Appropriations) AMOUNTS
COUNTY REIMBURSEMENTS 187,900 187,900 187,900 COURT APPOINTED SPECIAL ADVOCATE 102,000 102,000 102,000 DOMESTIC RELATIONS 640,300 655,400 634,076 DRUG COURT 1,013,600 1,013,600 1,013,599 DRUG COURT FY06-07 61,322 61,322 - FOSTER CARE REVIEW BOARD 3,532,000 3,617,100 3,616,999 INTERSTATE COMPACT 641,800 648,000 647,616 JUDGES COMPENSATION 7,488,200 8,199,500 8,180,120 JUDICIAL NOMINATION AND PERFORMANCE REVIEW 417,200 428,400 427,566 JUVENILE DIVERSION CONSEQUENCES 9,024,900 9,024,900 9,024,900 JUVENILE FAMILY COUNSELING 660,400 660,400 653,416 JUVENILE INTENSIVE PROBATION 9,166,500 8,858,600 8,809,251 JUVENILE STANDARD PROBATION 4,600,500 4,606,200 4,574,951 JUVENILE TREATMENT SERVICES 22,314,900 22,341,400 22,245,005 MENTAL HEALTH COURT REPORT 90,000 90,000 18,724 MODEL COURT 447,600 447,600 447,429 OPERATING LUMP SUM APPROPRIATION 10,695,700 10,761,500 10,532,208 SPECIAL WATER MASTER 94,000 94,000 94,000
TAX APPEALS, STATE BOARD OFADMINISTRATIVE ADJUSTMENTS - 213 213 OPERATING LUMP SUM APPROPRIATION 254,800 264,700 262,809
TOURISM, OFFICE OFADMINISTRATIVE ADJUSTMENTS - 1,010,268 1,010,268 TOURISM FUND DEPOSIT 7,000,000 7,102,600 7,102,600
TRANSPORTATION, DEPARTMENT OFOPERATING LUMP SUM APPROPRIATION 50,500 50,400 4,137
TREASURER, STATEADMINISTRATIVE ADJUSTMENTS - 269,595 269,595 BUDGET STABILIZATION INTEREST TRANSFERS - 2,000,000 2,000,000 CASH TRANSFER TO AUTOMATION PROJECTS FUND 19,300 19,300 19,300 COMMUNITY COLLEGE REIMBURSEMENT ARS 15-1469.01 - 3,273,119 3,273,119 CORPORATE INCOME TAX TRANSFER - 7,000,000 7,000,000 JUSTICE OF THE PEACE SALARIES 1,205,100 1,205,100 937,912 OPERATING LUMP SUM APPROPRIATION 2,731,000 2,820,900 2,714,896
UNIVERSITY OF ARIZONAAGRICULTURE 28,540,300 30,608,300 30,608,300 ARIZONA COOPERATIVE EXTENSION 11,079,800 11,268,200 11,268,200 CLINICAL RURAL ROTATION 357,600 362,600 362,600 CLINICAL TEACHING SUPPORT 8,587,000 8,587,000 8,587,000 FREEDOM CENTER 500,000 500,000 500,000 LIVER RESEARCH INSTITUTE 458,500 448,900 448,900 OPERATING LUMP SUM APPROPRIATION - MAIN 90,254,200 142,745,400 142,745,400 OPERATING LUMP SUM APPROPRIATION-HSC 18,860,500 40,468,200 40,468,200 PHOENIX MEDICAL CAMPUS 22,691,100 23,475,300 23,475,300 RESEARCH INFRASTRUCTURE FACILITIES - 14,253,000 14,253,000 SIERRA VISTA CAMPUS 2,858,100 3,515,000 3,515,000 TELEMEDICINE NETWORK 1,853,900 1,854,400 1,854,400
VETERANS' SERVICES, DEPARTMENT OFADMINISTRATIVE ADJUSTMENTS - 9,265 9,265 MILITARY FAMILY RELIEF FUND 15,291 15,291 - OPERATING LUMP SUM APPROPRIATION 2,089,100 2,177,662 2,128,260 SOUTHERN ARIZONA CEMETERY 275,600 288,162 288,160 TUCSON VETERAN HOME CONSTRUCTION FY09-10 37,858 37,858 10,000 VETERANS BENEFIT COUNSELING 2,848,100 2,970,476 2,712,445
WATER RESOURCES, DEPARTMENT OFADJUDICATION SUPPORT 1,212,900 1,256,700 1,208,949 ADMINISTRATIVE ADJUSTMENTS - 4,338 4,338 ASSURED AND ADEQUATE WATER SUPPLY ADMIN 1,662,700 1,723,100 1,722,433 AUTOMATED GROUNDWATER MONITORING 401,100 410,200 403,546
The Notes to Required Supplementary Information are an integral part of this schedule. (continued)
-139 -
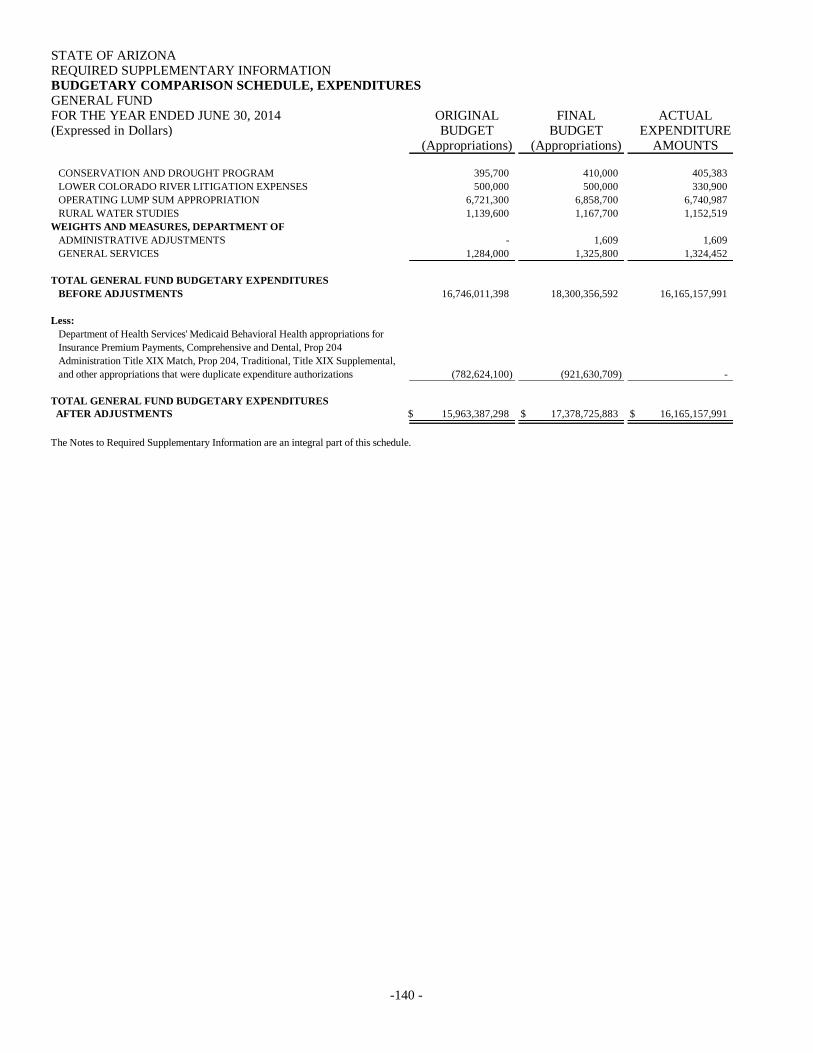
STATE OF ARIZONAREQUIRED SUPPLEMENTARY INFORMATIONBUDGETARY COMPARISON SCHEDULE, EXPENDITURESGENERAL FUNDFOR THE YEAR ENDED JUNE 30, 2014 ORIGINAL FINAL ACTUAL(Expressed in Dollars) BUDGET BUDGET EXPENDITURE
(Appropriations) (Appropriations) AMOUNTS
CONSERVATION AND DROUGHT PROGRAM 395,700 410,000 405,383 LOWER COLORADO RIVER LITIGATION EXPENSES 500,000 500,000 330,900 OPERATING LUMP SUM APPROPRIATION 6,721,300 6,858,700 6,740,987 RURAL WATER STUDIES 1,139,600 1,167,700 1,152,519
WEIGHTS AND MEASURES, DEPARTMENT OFADMINISTRATIVE ADJUSTMENTS - 1,609 1,609 GENERAL SERVICES 1,284,000 1,325,800 1,324,452
TOTAL GENERAL FUND BUDGETARY EXPENDITURES BEFORE ADJUSTMENTS 16,746,011,398 18,300,356,592 16,165,157,991
Less: Department of Health Services' Medicaid Behavioral Health appropriations for Insurance Premium Payments, Comprehensive and Dental, Prop 204 Administration Title XIX Match, Prop 204, Traditional, Title XIX Supplemental, and other appropriations that were duplicate expenditure authorizations (782,624,100) (921,630,709) -
TOTAL GENERAL FUND BUDGETARY EXPENDITURES AFTER ADJUSTMENTS $ 15,963,387,298 $ 17,378,725,883 $ 16,165,157,991
The Notes to Required Supplementary Information are an integral part of this schedule.
-140 -

STATE OF ARIZONAREQUIRED SUPPLEMENTARY INFORMATIONBUDGETARY COMPARISON SCHEDULE, EXPENDITURESTRANSPORTATION AND AVIATION PLANNING,HIGHWAY MAINTENANCE AND SAFETY FUNDFOR THE YEAR ENDED JUNE 30, 2014 ORIGINAL FINAL ACTUAL(Expressed in Dollars) BUDGET BUDGET EXPENDITURE
(Appropriations) (Appropriations) AMOUNTS
TRANSPORTATION, DEPARTMENT OFADMINISTRATIVE ADJUSTMENTS $ - $ 798,524 $ 798,524 AIRPORT PLANNING AND DEVELOPMENT FY07-08 8,665,445 8,665,445 - AIRPORT PLANNING AND DEVELOPMENT FY09-10 17,671,756 17,671,756 - AIRPORT PLANNING AND DEVELOPMENT FY10-11 10,765,318 10,765,318 - AIRPORT PLANNING AND DEVELOPMENT FY11-12 13,097,765 13,097,765 - AIRPORT PLANNING AND DEVELOPMENT FY12-13 6,555,574 6,555,574 - AIRPORT PLANNING AND DEVELOPMENT FY13-14 21,123,700 36,123,700 14,667,836 ASBESTOS AND LEAD INSPECTIONS FY01-02 94,798 94,798 - ASBESTOS AND LEAD INSPECTIONS FY02-03 589,466 589,466 - ATTORNEY GENERAL LEGAL SERVICES 2,895,600 2,895,600 2,895,600 BUILDING RENEWAL FY11-12 33,931 33,931 33,931 BUILDING RENEWAL FY12-13 930,784 930,784 800,730 BUILDING RENEWAL FY13-14 3,188,200 3,188,200 867,974 CASH TRANSFER TO AUTOMATION PROJECTS FUND 2,397,400 2,397,400 2,397,400 DE ICER BUILDINGS 2,280,000 2,280,000 538,731 FRAUD INVESTIGATION 755,400 773,300 770,477 HIGHWAY MAINTENANCE FY12-13 2,926,663 2,926,663 2,920,866 HIGHWAY MAINTENANCE FY13-14 131,195,400 132,716,500 127,133,228 HIGHWAY TO DPS TRANSFER - DOUBLE LOAD 6,780,000 6,743,800 6,743,800 HURF TO DPS TRANSFER - DOUBLE LOAD 119,961,000 119,247,100 119,247,100 LIE TO WMA TRANSFER 319,200 330,000 330,000 MOTOR CARRIER TOWING REGULATION FY04-05 11,108 11,108 - MVD SECURITY ENHANCEMENT ISSUES FY02-03 715,687 715,687 - NEW THIRD PARTY FUNDING 943,700 971,100 965,551 OPERATING LUMP SUM APPROPRIATION 203,223,500 206,902,200 203,548,180 SEF TO DPS TRANSFER - DOUBLE LOAD 1,574,700 1,566,300 1,566,300 STATEWIDE HIGHWAY CONSTRUCTION FY09-10 75,207,460 75,207,460 - STATEWIDE HIGHWAY CONSTRUCTION FY10-11 510,131 510,131 - STATEWIDE HIGHWAY CONSTRUCTION FY11-12 40,590,578 40,590,578 - STATEWIDE HIGHWAY CONSTRUCTION FY12-13 65,367,932 65,367,932 - STATEWIDE HIGHWAY CONSTRUCTION FY13-14 220,293,000 220,293,000 141,918,862 VEHICLE WASH SYSTEMS 3,000,000 3,000,000 85,467
TOTAL TRANSPORTATION AND AVIATION PLANNING, HIGHWAY MAINTENANCE AND SAFETY FUND BUDGETARY EXPENDITURES $ 963,665,196 $ 983,961,120 $ 628,230,557 The Notes to Required Supplementary Information are an integral part of this schedule
-141 -

- 142 -
STATE OF ARIZONA REQUIRED SUPPLEMENTARY INFORMATION NOTES TO REQUIRED SUPPLEMENTARY INFORMATION – BUDGETARY COMPARISON SCHEDULES JUNE 30, 2014 A. RECONCILIATION OF BUDGETARY TO GAAP EXPENDITURES The accompanying Budgetary Comparison Schedules for the General Fund and the Transportation and Aviation Planning, Highway Maintenance and Safety Fund present comparisons of the legally adopted budget with actual expenditure data on the budgetary basis. The original budget represents any appropriation bills passed by June 30, 2013 that affect available appropriations during fiscal year 2014. The final budget represents any appropriation bills passed during fiscal year 2014 for fiscal year 2014 plus the original budget. Appropriation bills passed after the end of fiscal year 2014 for fiscal year 2014 would also be included in the final budget. The Budgetary Comparison Schedules present actual amounts on the State’s budgetary basis for expenditures only. The Schedules include appropriations authorized in one fund and transferred, by legislation, to another fund. The State does not have a legally adopted budget for revenues; therefore, only expenditures are presented on the Budgetary Comparison Schedule, Expenditures for the General Fund and the Transportation and Aviation Planning, Highway Maintenance and Safety Fund. As the budgetary and GAAP presentations of actual data differ, a reconciliation of the two follows (amounts expressed in thousands):
Transportation & Aviation Planning, Highway General Maintenance & Fund Safety Fund Uses/outflows of resources Actual expenditure amounts (budgetary basis) “total charges to appropriations” from the budgetary comparison schedule $ 16,165,158 $ 628,231 Differences – budget to GAAP: Increase in unpaid incurred expenditures from fiscal year end 2013 to fiscal year end 2014. 3,200 468,776 Increase in unpaid payroll expenditures from fiscal year end 2013 to fiscal year end 2014. For budgetary reporting, final June 2013 payroll expenditures were charged to fiscal year 2014 budget and final June 2014 payroll expenditures were charged to fiscal year 2015 budget. 4,940 - Distributions to counties and cities of sales taxes are recognized as expenditures on the modified accrual basis, but have no effect on budgetary expenditures. 1,120,000 - Distribution to counties and cities for Urban Revenue Sharing, derived from the State’s income tax collections, is recognized as an expenditure on the modified accrual basis, but has no effect on budgetary expenditures. 592,501 - Capital leases and installment purchase contracts initiated during the fiscal year, which are not reported in budgetary expenditures. 100,678 13,236 Programs which are not controlled by legislative appropriations but have disbursed cash or incurred obligations during fiscal year 2014. 4,016,414 1,411,399 Transfers to other funds are outflows of budgetary resources but are not expenditures for financial reporting purposes. (882,237) (303,030) Total expenditures, as reported on the Statement of Revenues, Expenditures and Changes in Fund Balances $ 21,120,654 $ 2,218,612
There were no expenditures in excess of appropriations or allotments in the individual budget accounts for the year.

STATE OF ARIZONA REQUIRED SUPPLEMENTARY INFORMATION NOTES TO REQUIRED SUPPLEMENTARY INFORMATION – BUDGETARY COMPARISON SCHEDULES JUNE 30, 2014
- 143 -
B. BUDGETARY BASIS OF ACCOUNTING Formulation of the budget begins with the preparation of estimates of expenditure requirements by the head of each budgeted agency and institution. These estimates are submitted no later than September 1 of each year to the Governor’s Office of Strategic Planning and Budgeting (OSPB), unless an extension is granted for up to an additional 30 days by the OSPB Director. The budget is prepared by line item and/or program elements for each agency. The budget document, as finally developed by the Governor, must be submitted to the Legislature no later than five days after the regular session convenes. The Legislature must approve the budget by passing a general and a capital outlay appropriation bill and various omnibus reconciliation bills, which are used for statutory adjustments that must be implemented to carry out the budget. The Governor may veto any item in an appropriation bill. Such vetoes are subject to legislative overrides. The budget can be amended throughout the year by special legislative appropriations and/or budget transfers. The State’s Constitution prohibits the appropriation of certain state revenues (primarily tax and fee collections) from exceeding 7.41% of Arizona personal income as estimated by the Economic Estimates Commission. The State prepares its operating budget on the cash basis of accounting. Encumbrances as of June 30 can be liquidated during an administrative period of up to four weeks known as the 13th month. At the time of the appropriation bill’s passage, estimates prepared by legislative and executive branch professional staff assure the State Legislature that adequate revenues will be available to meet the level of appropriations approved. Anticipated revenue is estimated on the cash basis but is not part of the legally adopted budget. Consequently, the accompanying Budgetary Comparison Schedules only present budget to actual expenditure comparisons. The Budgetary Comparison Schedules present all appropriation line items as passed by the State Legislature in order to demonstrate compliance with the legal level of budgetary control. The State budgets on an annual basis. The budget format used by the State Legislature determines how an agency’s appropriation appears in the General Appropriation Act. A less detailed format provides an agency with more discretion in implementing the budget. Conversely, a more detailed format may require an agency to use formal processes for redirecting appropriated funds. Among the choices are the following: Lump Sum – The appropriation of an agency for each fiscal year consists of a single dollar amount, thereby allowing the
agency to shift funds among line items, programs, and subprograms without further Legislative or Executive Branch review. Lump Sum with Special Line Items – The appropriation of an agency for each fiscal year consists of a dollar amount for an
operating budget and dollar amounts for individual special line items. Special line items are particular programs for which the Legislature has a specific policy interest. These line items may or may not include Full Time Equivalent positions. Agencies are permitted to shift funds among line items, programs, and subprograms without further Legislative or Executive Branch review, though footnotes may place additional restrictions or notifications upon the agency prior to or associated with transfers between special line items or to or from the operating budget.
During the fiscal year, $1.6 billion in supplemental appropriations, net of mid-year reversions and adjustments, were provided to the General Fund. The Transportation and Aviation Planning, Highway Maintenance and Safety Fund appropriations increased by $20.3 million. These amounts are included in the Budgetary Comparison Schedules. State agencies are responsible for exercising budgetary control and ensuring that expenditures do not exceed appropriations. The ADOA’s General Accounting Office exercises oversight and does not disburse funds in excess of appropriations. The Governor shall have in continuous process of preparation and revision a tentative budget report for the next fiscal year for which a budget report is required to be prepared. Whenever the expenses of any fiscal year shall exceed the income, the Legislature may provide for levying a tax for the ensuing fiscal year sufficient, with other sources of income, to pay the deficiency, as well as the estimated expenses of the ensuing fiscal year.

STATE OF ARIZONA REQUIRED SUPPLEMENTARY INFORMATION NOTES TO REQUIRED SUPPLEMENTARY INFORMATION – BUDGETARY COMPARISON SCHEDULES JUNE 30, 2014
- 144 -
All expenditures of the State’s money must be authorized by law. Authorization can be granted directly by law or contingent upon appropriation from the State Legislature. Periodically, the State Legislature may appropriate monies for program expenditures already authorized by law, resulting in duplicate spending authority. In appropriating monies, the State Legislature has, in some cases, included external funding sources as a portion of an agency’s total program expenditure authorization (budget) and has identified the external funding sources as an offset against the program appropriations total in order to reflect the State funding amount. An example of this is found in the final budget amount of $693.3 million for the Department of Health Services’ Medicaid Behavioral Health - Traditional on page 136, which includes $486.8 million of duplicate expenditure authorizations. Accordingly, sometimes program expenditures may not exhaust specific legislative appropriations. To properly present the total budget (appropriation) information, in relationship to “actual” expenditure amounts, duplicate expenditure authorizations have been eliminated from the General Fund’s budget (appropriation) totals on page 140.

STATE OF ARIZONA REQUIRED SUPPLEMENTARY INFORMATION INFRASTRUCTURE ASSETS JUNE 30, 2014
- 145 -
Information About Infrastructure Assets Reported Using the Modified Approach As allowed by Governmental Accounting Standards Board (GASB) Statement No. 34, Basic Financial Statements – and Management’s Discussion and Analysis – for State and Local Governments (GASB 34), as amended, the State of Arizona reports its roads and bridges using the modified approach. Assets accounted for under the modified approach include 6,800 center lane miles (21,390 travel lane miles) of roads and 4,787 bridges that the State is responsible to maintain. In order to utilize the modified approach, the State is required to:
i Maintain an asset management system that includes an up to date inventory of eligible infrastructure assets i Perform condition assessments of eligible assets and summarize the results using a measurement scale i Estimate each year the annual amount to maintain and preserve the assets at the condition level established
and disclosed by the State i Document that the assets are being preserved approximately at or above the established condition level
As adopted by the State Transportation Board on an annual basis, the Five-Year Transportation Facilities Construction Program (Program) contains estimated expenditures for highway system improvements and the preservation of existing roadways and bridges. Both of these factors impact the condition assessment of the roads and bridges as described in the following sections. The Program in effect for fiscal year 2014 and beyond was adopted by the Transportation Board on June 25, 2013. This Program is a dynamic instrument and adjustments are made to the annual plans based on the needs of the State to maintain the condition level of the roads and bridges at a level equal to, or greater than, the goals established by the State. In addition, not only are adjustments made during the life of the Program, circumstances may require that refinements to the individual components of the Program be made during the fiscal year. In comparing Estimated to Actual Expenditures in the tables that follow, significant variances can occur. These variances are primarily due to the methodology used in the preparation of the Program. In this Program, the Estimated Expenditures for the current year are based on “programmed” projects which may or may not be spent in the current year of the Program. Programmed expenditures consist of those items that are planned for the future, with contracts that have not yet been awarded. Furthermore, the Actual Expenditures will include projects that were programmed for a prior year’s Estimated Expenditures but which did not occur, or were not completed, in the prior year. The following information pertains to the condition assessment and maintenance of infrastructure assets and reflects the State’s success in achieving condition levels that exceed the established levels. Roads The mission of the Arizona Department of Transportation’s (ADOT) Pavement Management Section (PMS) is to develop and provide a cost effective pavement rehabilitation construction program that preserves the State’s investment in its highway system and enhances public transportation and safety. The requirements of GASB 34 and the PMS both work toward the same basic goal, the efficient, effective management of the State’s assets to produce long-term benefits, while minimizing expenditures. The PMS has developed performance goals for the condition level of the pavement in the State’s highway system. These goals require periodic assessment of pavement conditions and the budget level needed to meet that goal. The goal is expressed as a measure called “Serviceability”, which can be defined as the ability of a pavement to serve the traveling public (as documented in 1961 after the American Association of State Highway and Transportation Officials (AASHTO) Road Test, 1956-1961). Serviceability is based on detailed measurements of objective features of the pavement. Many surveys since the original road test have shown that these measurements closely track the subjective opinion of the traveling public. Most commonly, this number is called the “Present Serviceability Rating” (PSR). PSR is a five-point scale (5 excellent, 0 impassable), similar to the Weaver/AASHTO Scale shown as follows:

STATE OF ARIZONA REQUIRED SUPPLEMENTARY INFORMATION INFRASTRUCTURE ASSETS JUNE 30, 2014
- 146 -
Numerical Rating PSR Weaver/AASHTO Scale 5 Excellent Perfect 4 Good Very Good 3 Fair Good 2 Poor Fair 1 Very Poor Poor 0 Impassable Very Poor
The goal of the State is to maintain a condition level (PSR) rating of 3.23 or better for all roads in the State’s highway system. Annually, Transportation Material Technicians drive over the system with inertial profiling equipment and measure the roughness of the pavement. This process is continuous throughout the year in order to assess the condition level of all pavement on an annual basis. As of the end of fiscal year 2014, an overall rating of 3.69 was achieved, as shown in the following graph:
Figure 1
Preservation of the roads is accomplished through programs managed primarily by the ADOT’s PMS, as well as other units within the ADOT. The estimated (as specified in the Program as programmed amounts) and actual expenditures for fiscal years 2010 through 2014 were as follows:
Fiscal Year
Estimated Expenditures (in millions)
Actual Expenditures (in millions)
2010 $227.4 $220.9 2011 $265.7 $373.4 2012 $261.9 $373.6 2013 $276.3 $291.3 2014 $271.2 $287.2
0
1
2
3
4
5
2010 2011 2012 2013 2014
PSR
Fiscal Year
Condition Levels - Roads
Actual
Goal

STATE OF ARIZONA REQUIRED SUPPLEMENTARY INFORMATION INFRASTRUCTURE ASSETS JUNE 30, 2014
- 147 -
Bridges The State’s bridge assets constitute a significant portion of all infrastructure assets in Arizona. As of June 30, 2014, the State owned and maintained 4,787 bridges with an approximate total deck area of 49,066,801 square feet. Bridges, for purposes of this report, include all structures erected over an opening or depression with a centerline of 20 feet or more. Information related to these bridges is stored and updated in the Arizona Bridge Information and Storage System (ABISS). This system is used to efficiently manage the bridge inventory through storing all bridge related data and assisting bridge engineers in arriving at appropriate bridge preservation decisions. Also, ABISS is used for reporting bridge inventory and condition, on a biennial basis, to the Federal Highway Administration (FHWA). A Condition Rating Index (CRI) is used to track the condition of the bridge network. The CRI is based on four selected bridge inspection condition ratings, which in turn are based on standards established in the FHWA’s “Recording and Coding Guide for the Structural Inventory of the Nation’s Bridges.” The four selected condition ratings that are included in the CRI computation are: the bridge joints condition, the deck condition, the super-structure condition, and the sub-structure condition. The bridge joints condition rating is an Arizona specific rating item not included in the FHWA condition rating guidelines, whereas the other three condition ratings are federally mandated condition ratings. The CRI is computed by subtracting from one, the ratio of the sum of the deck areas of all bridges with a condition rating of four or less, which indicates that the rated element is at best in a poor condition, to the total sum of the deck areas. The rating system in this guide is as follows:
Numerical Rating Condition Rating 9 Excellent 8 Very Good 7 Good 6 Satisfactory 5 Fair 4 Poor 3 Serious 2 Critical 1 Imminent Failure
Management of the bridge inventory is a major function of the ADOT’s Bridge Group and regularly scheduled biennial inspections are made of all bridges. A civil or structural engineer, licensed to practice in Arizona, performs these inspections. It is the policy of the State to maintain State highway bridges so that the CRI exceeds 92.5%. In fiscal year 2014, the CRI was computed at 93.8%.
Figure 2
90%
91%
92%
93%
94%
95%
2010 2011 2012 2013 2014
CRI
Fiscal Year
Condition Levels - Bridges
Actual
Goal

STATE OF ARIZONA REQUIRED SUPPLEMENTARY INFORMATION INFRASTRUCTURE ASSETS JUNE 30, 2014
- 148 -
Bridges represent a major public investment, and their inspection and maintenance is an essential function of the State in its mission of providing products and services for a safe, efficient, and cost effective transportation system. Figure 3 indicates that approximately 56% of the bridges in the State were constructed prior to the 1970s while only 14% have been constructed since 2000.
Figure 3
Preservation of the bridges is accomplished through programs managed by the Bridge Group. The estimated (as specified in the Program as programmed amounts) and actual expenditures for fiscal years 2010 through 2014 were as follows:
Fiscal Year
Estimated Expenditures (in millions)
Actual Expenditures (in millions)
2010 $16.1 $22.4 2011 $11.8 $26.0 2012 $12.5 $20.6 2013 $14.7 $10.7 2014 $21.2 $20.5
0%
5%
10%
15%
20%
25%
30%
<1930 30s 40s 50s 60s 70s 80s 90s 2000s 2010s
Age of the State's Bridge Population
% of bridges built incorresponding decade

STATE OF ARIZONA REQUIRED SUPPLEMENTARY INFORMATION AGENT BENEFIT PLANS’ FUNDING PROGRESS JUNE 30, 2014
- 149 -
Analysis of the funding progress for each of the agent, multiple-employer defined benefit pension plans, as of the most recent actuarial valuations, is as follows (expressed in thousands):
(Unfunded) Actuarial AAL as a Actuarial Actuarial Accrued Annual Percentage Valuation Value of Liability (Unfunded) Funded Covered of Covered
Plan Date Plan Assets (AAL) AAL Ratio Payroll Payroll PSPRS 6/30/2014 $ 450,284 $ 1,240,343 $ (790,059) 36.3% $ 85,973 (919.0)%
6/30/2013 505,249 1,067,721 (562,472) 47.3% 82,363 (682.9)% 6/30/2012 522,980 1,043,064 (520,084) 50.1% 82,352 (631.5)%
CORP 6/30/2014 852,041 1,520,026 (667,985) 56.1% 350,313 (190.7)% 6/30/2013 900,160 1,289,715 (389,555) 69.8% 346,980 (112.3)% 6/30/2012 888,879 1,244,672 (355,793) 71.4% 370,041 (96.1)%
Analysis of the funding progress for each of the agent, multiple-employer defined benefit post-employment plans, as of the most recent actuarial valuations, is as follows (expressed in thousands):
Funded/
(Unfunded) Actuarial AAL as a Actuarial Actuarial Accrued Funded/ Annual Percentage Valuation Value of Liability (Unfunded) Funded Covered of Covered
Plan Date Plan Assets (AAL) AAL Ratio Payroll Payroll PSPRS 6/30/2014 $ 35,607 $ 29,668 $ 5,939 120.0% $ 85,973 6.9%
6/30/2013 - 29,165 (29,165) 0.0% 82,363 (35.4)% 6/30/2012 - 29,183 (29,183) 0.0% 82,352 (35.4)%
CORP 6/30/2014 72,713 62,623 10,090 116.1% 350,313 2.9% 6/30/2013 - 59,723 (59,723) 0.0% 346,980 (17.2)% 6/30/2012 - 58,596 (58,596) 0.0% 370,041 (15.8)%
As described in Note 6.A., due to a change in statute, the PSPRS and CORP established separate funds for the health insurance premium subsidy benefit contributions. As a result, the plans transferred prior year health insurance premium subsidy benefit contributions that exceeded benefit payments from each plan’s pension fund to the new health insurance fund.


COMBINING FINANCIAL STATEMENTS AND
SCHEDULES

COMBINING FINANCIAL STATEMENTS AND SCHEDULES

NON-MAJOR GOVERNMENTAL FUNDS
Special Revenue Funds Special Revenue Funds account for the proceeds of specific revenue sources (other than major capital projects) that are legally restricted to expenditures for specified purposes.
Debt Service Funds The Debt Service Funds account for the accumulation of resources for, and the payment of, long-term debt principal, interest, and related costs.
Capital Projects Funds Capital Projects Funds account for financial resources used to acquire or construct major capital facilities (other than those financed by Proprietary Funds, Pension Trust Funds or Component Units).

STATE OF ARIZONACOMBINING BALANCE SHEETNON-MAJOR GOVERNMENTAL FUNDSJUNE 30, 2014(Expressed in Thousands)
SPECIAL DEBTREVENUE SERVICE PROJECTS
FUNDS FUNDS FUNDS TOTALASSETS Cash $ 1,377 $ - $ - $ 1,377 Cash and pooled investments with State Treasurer 814,913 1,282 - 816,195 Collateral investment pool 14,898 - - 14,898 Receivables, net of allowances: Taxes 73,579 - - 73,579 Other 25,949 - - 25,949 Due from U.S. Government 10,705 - - 10,705 Due from other Funds 21,763 3,750 - 25,513 Restricted assets: Cash and pooled investments with State Treasurer 395,962 41,065 311,011 748,038 Cash held by trustee - 11,571 - 11,571
Total Assets $ 1,359,146 $ 57,668 $ 311,011 $ 1,727,825
LIABILITIES, DEFERRED INFLOWS OF RESOURCES, AND FUND BALANCES Liabilities: Accounts payable and other current liabilities $ 37,372 $ 326 $ - $ 37,698 Accrued liabilities 47,555 - - 47,555 Obligations under securities loan agreements 14,898 - - 14,898 Due to local governments 77,434 - - 77,434 Due to others 10,436 - - 10,436 Due to other Funds 26,945 - - 26,945 Unearned revenue 381 - - 381 Total Liabilities 215,021 326 - 215,347
Deferred Inflows of Resources 796 - - 796
Fund Balances: Restricted 579,608 57,342 311,011 947,961 Committed 563,721 - - 563,721 Total Fund Balances 1,143,329 57,342 311,011 1,511,682
Total Liabilities, Deferred Inflows of Resources, and Fund Balances $ 1,359,146 $ 57,668 $ 311,011 $ 1,727,825
CAPITAL
- 154 -

STATE OF ARIZONACOMBINING STATEMENT OF REVENUES,EXPENDITURES AND CHANGES IN FUND BALANCESNON-MAJOR GOVERNMENTAL FUNDSFOR THE YEAR ENDED JUNE 30, 2014(Expressed in Thousands)
REVENUE SERVICE PROJECTSFUNDS FUNDS FUNDS TOTAL
REVENUES Taxes: Sales $ 476,826 $ 56,225 $ - $ 533,051 Income 41 - - 41 Tobacco 246,270 - - 246,270 Property 2,000 - - 2,000 Motor vehicle and fuel 154,111 - - 154,111 Other 107,778 - - 107,778 Intergovernmental 95,665 - - 95,665 Licenses, fees, and permits 284,897 - - 284,897 Hospital and nursing facility assessments 91,578 - - 91,578 Earnings on investments 44,293 1,752 3,831 49,876 Sales and charges for services 23,310 - - 23,310 Fines, forfeitures, and penalties 146,162 - - 146,162 Gaming 80,195 - - 80,195 Other 18,513 21 - 18,534 Total Revenues 1,771,639 57,998 3,831 1,833,468
EXPENDITURES Current: General government 131,199 - - 131,199 Health and welfare 347,729 - - 347,729 Inspection and regulation 118,683 - - 118,683 Education 696,184 - - 696,184 Protection and safety 249,230 - - 249,230 Transportation - - 15,309 15,309 Natural resources 111,865 - - 111,865 Debt service: Principal 9,795 301,500 - 311,295 Interest and other fiscal charges 15,918 232,837 - 248,755 Capital outlay 21,589 - 134,895 156,484 Total Expenditures 1,702,192 534,337 150,204 2,386,733 Excess (Deficiency) of Revenues Over Expenditures 69,447 (476,339) (146,373) (553,265)
OTHER FINANCING SOURCES (USES) Transfers in 90,274 484,367 - 574,641 Transfers out (151,847) (10,680) (266) (162,793) Total Other Financing Sources (Uses) (61,573) 473,687 (266) 411,848 Net Change in Fund Balances 7,874 (2,652) (146,639) (141,417) Fund Balances - Beginning 1,135,455 59,994 457,650 1,653,099
Fund Balances - Ending $ 1,143,329 $ 57,342 $ 311,011 $ 1,511,682
SPECIAL DEBT CAPITAL
- 155 -


NON-MAJOR GOVERNMENTAL FUNDS SPECIAL REVENUE FUNDS
The Public Safety and Correctional Programs Fund accounts for law enforcement, military, custody, and related services provided to the general public. The Environmental Protection Fund accounts for the protection of the State’s public health by administering the State’s environmental quality laws and delegating federal programs to prevent, control, and abate pollution of our air, water, and land resources. The Healthcare and Social Services Fund accounts for health and welfare services provided to the general public. The Tobacco Tax and Healthcare Fund accounts for the receipt of monies levied on tobacco products. The monies are used for health education programs; research, prevention and treatment of tobacco related diseases; to increase the quality of, and access to, the early childhood development and health system that ensures a child entering school comes healthy and ready to succeed; and for medically needy healthcare programs. The Judicial and Legal Services Fund accounts for the anti-racketeering, consumer protection, consumer fraud, anti-trust, and collections enforcement programs of the Attorney General’s Office and statewide court improvement functions supervised by the Arizona Supreme Court. The Regulating and Licensing Fund accounts for inspection and regulatory services provided to the general public. The Game and Fish Fund accounts for the receipt of monies collected by the Department of Game and Fish for various hunting and fishing licenses, for the purpose of conserving, enhancing, and restoring Arizona’s diverse wildlife resources and habitats, as well as providing safe watercraft and off-highway vehicle recreation. The State Parks Development Fund accounts for the receipt of monies collected by the State Parks Fund for the purpose of acquiring and developing State park lands, sites and facilities. The Business Development Fund accounts for the promotion of statewide economic and community development, which supports a globally competitive Arizona. The Educational Programs Fund accounts for supplemental building needs and instructional improvement programs specifically identified in a voter initiative that enacted a six-tenth of one percent statewide sales tax dedicated to education functions. The Educational Programs Fund supports programs from the kindergarten through university educational levels. The Groundwater Protection and Conservation Fund accounts for strategic water resources planning, Colorado River water management, drought management planning, dam safety, flood mitigation, administration of the Arizona Groundwater Management Code, and administration of water rights. These programs are the responsibility of the Department of Water Resources. The Clean Elections System Fund accounts for fines and fees collected to pay for campaign expenses of statewide candidates and State legislative candidates who choose not to accept private source campaign funds. The fund was established as a result of a voter initiative.

STATE OF ARIZONACOMBINING BALANCE SHEETNON-MAJOR SPECIAL REVENUE FUNDSJUNE 30, 2014(Expressed in Thousands)
ENVIRONMENTAL & SOCIAL TAX & REGULATINGPROTECTION SERVICES HEALTHCARE & LICENSING
ASSETS Cash $ 1,329 $ - $ - $ - $ - $ 18 Cash and pooled investments with State Treasurer 125,938 103,608 79,373 20,221 139,536 129,295 Collateral investment pool - - - 13,239 1,659 - Receivables, net of allowances: Taxes 4,732 - 4,091 14,308 - - Other 2 - 7,127 1,317 7 3,154 Due from U.S. Government - - 10,702 3 - - Due from other Funds 4,366 5,121 1,939 870 1,599 272 Restricted assets: Cash and pooled investments with State Treasurer - - 863 395,099 - -
Total Assets $ 136,367 $ 108,729 $ 104,095 $ 445,057 $ 142,801 $ 132,739
LIABILITIES, DEFERRED INFLOWS OF RESOURCES, AND FUND BALANCES Liabilities: Accounts payable and other current liabilities $ 21,119 $ 3,992 $ 2,244 $ 1,180 $ 3,303 $ 2,217 Accrued liabilities 4,724 444 37,951 345 595 2,038 Obligations under securities loan agreements - - - 13,239 1,659 - Due to local governments - - - - - - Due to others - - - 10,237 - 199 Due to other Funds 669 93 1,303 14,398 7 10,262 Unearned revenue - - 381 - - - Total Liabilities 26,512 4,529 41,879 39,399 5,564 14,716
Deferred Inflows of Resources - - 796 - - -
Fund Balances: Restricted - - 13,029 405,658 41,313 - Committed 109,855 104,200 48,391 - 95,924 118,023 Total Fund Balances 109,855 104,200 61,420 405,658 137,237 118,023
Total Liabilities, Deferred Inflows of Resources, and Fund Balances $ 136,367 $ 108,729 $ 104,095 $ 445,057 $ 142,801 $ 132,739
PROGRAMS SERVICESCORRECTIONAL & LEGAL
JUDICIALPUBLIC
SAFETY & HEALTHCARE TOBACCO
- 158 -

GAME &FISH DEVELOPMENT TOTAL
$ 30 $ - $ - $ - $ - $ - $ 1,377
46,054 12,239 22,073 94,008 19,103 23,465 814,913 - - - - - - 14,898
- - - 50,448 - - 73,579 2,047 - 7 12,288 - - 25,949
- - - - - - 10,705 207 351 - 7,038 - - 21,763
- - - - - - 395,962
$ 48,338 $ 12,590 $ 22,080 $ 163,782 $ 19,103 $ 23,465 $ 1,359,146
$ 2,870 $ 301 $ 4 $ 95 $ - $ 47 $ 37,372 1,110 87 95 139 17 10 47,555
- - - - - - 14,898 - - - 77,434 - - 77,434 - - - - - - 10,436
205 6 1 1 - - 26,945 - - - - - - 381
4,185 394 100 77,669 17 57 215,021
- - - - - - 796
9,091 - 996 86,113 - 23,408 579,608 35,062 12,196 20,984 - 19,086 - 563,721 44,153 12,196 21,980 86,113 19,086 23,408 1,143,329
$ 48,338 $ 12,590 $ 22,080 $ 163,782 $ 19,103 $ 23,465 $ 1,359,146
SYSTEMDEVELOPMENT PROGRAMS CONSERVATION
GROUNDWATER CLEANSTATE PARKS BUSINESS EDUCATIONAL PROTECTION & ELECTIONS
- 159 -

STATE OF ARIZONACOMBINING STATEMENT OF REVENUES, EXPENDITURES AND CHANGES IN FUND BALANCESNON-MAJOR SPECIAL REVENUE FUNDSFOR THE YEAR ENDED JUNE 30, 2014(Expressed in Thousands)
ENVIRONMENTAL & SOCIAL TAX & REGULATINGPROTECTION SERVICES HEALTHCARE & LICENSING
REVENUES Taxes: Sales $ 17,105 $ - $ 4,903 $ - $ - $ - Income - - - - - - Tobacco 5,931 - 7,953 232,386 - - Property - - 2,000 - - - Motor vehicle and fuel 127,568 16,441 - - - 330 Other 53,714 2,428 - - - 51,636 Intergovernmental 19,863 - 41,700 2,263 1,443 174 Licenses, fees, and permits 21,024 68,912 18,237 - 25,965 95,734 Hospital and nursing facility assessments - - 91,578 - - - Earnings on investments 269 519 116 9,343 1,414 130 Sales and charges for services 11,470 - 3,337 - 491 2,540 Fines, forfeitures, and penalties 73,625 - 10,845 - 50,782 2,176 Gaming - - 21,455 - - 9,698 Other 2,635 395 2,710 827 2,707 2,115 Total Revenues 333,204 88,695 204,834 244,819 82,802 164,533
EXPENDITURES Current: General government 27,471 1,217 3,131 575 77,780 1,750 Health and welfare - 77,401 193,226 69,187 - 7,915 Inspection and regulation - 1,504 - - 31 117,148 Education - - - 158,906 - - Protection and safety 249,230 - - - - - Natural resources 27,119 358 - - - - Debt service: Principal 9,235 - - - - - Interest and other fiscal charges 15,150 - - - - - Capital outlay 13,200 132 496 28 479 756 Total Expenditures 341,405 80,612 196,853 228,696 78,290 127,569 Excess (Deficiency) of Revenues Over Expenditures (8,201) 8,083 7,981 16,123 4,512 36,964
OTHER FINANCING SOURCES (USES) Transfers in 37,249 7,000 6,822 1,418 3,107 2,592 Transfers out (27,638) (4,387) (2,595) (37,045) (58,904) (16,497) Total Other Financing Sources (Uses) 9,611 2,613 4,227 (35,627) (55,797) (13,905) Net Change in Fund Balances 1,410 10,696 12,208 (19,504) (51,285) 23,059 Fund Balances - Beginning 108,445 93,504 49,212 425,162 188,522 94,964
Fund Balances - Ending $ 109,855 $ 104,200 $ 61,420 $ 405,658 $ 137,237 $ 118,023
PUBLIC SAFETY & HEALTHCARE TOBACCO JUDICIAL
CORRECTIONAL & LEGAL PROGRAMS SERVICES
- 160 -

GAME &FISH DEVELOPMENT TOTAL
$ - $ - $ - $ 454,818 $ - $ - $ 476,826 - - - 41 - - 41 - - - - - - 246,270 - - - - - - 2,000
900 8,580 - 292 - - 154,111 - - - - - - 107,778
27,223 - 1,907 1,092 - - 95,665 37,977 3,181 4,181 2,836 6,850 - 284,897
- - - - - - 91,578 342 87 185 31,759 129 - 44,293
3,039 - 301 2,124 8 - 23,310 131 - - - 10 8,593 146,162
6,131 - - 42,911 - - 80,195 1,271 - 3,086 87 2,447 233 18,513
77,014 11,848 9,660 535,960 9,444 8,826 1,771,639
- 1,932 10,661 - - 6,682 131,199 - - - - - - 347,729 - - - - - - 118,683 - - 14 537,264 - - 696,184 - - - - - - 249,230
70,516 7,143 - - 6,729 - 111,865
560 - - - - - 9,795 768 - - - - - 15,918
4,798 1,033 11 621 - 35 21,589 76,642 10,108 10,686 537,885 6,729 6,717 1,702,192
372 1,740 (1,026) (1,925) 2,715 2,109 69,447
10,058 - 212 21,516 300 - 90,274 (3,819) (62) (586) (151) (64) (99) (151,847) 6,239 (62) (374) 21,365 236 (99) (61,573) 6,611 1,678 (1,400) 19,440 2,951 2,010 7,874
37,542 10,518 23,380 66,673 16,135 21,398 1,135,455
$ 44,153 $ 12,196 $ 21,980 $ 86,113 $ 19,086 $ 23,408 $ 1,143,329
SYSTEM
GROUNDWATER CLEANSTATE PARKS BUSINESS EDUCATIONAL PROTECTION & ELECTIONS
DEVELOPMENT PROGRAMS CONSERVATION
- 161 -

STATE OF ARIZONABUDGETARY COMPARISON SCHEDULE, EXPENDITURESNON-MAJOR SPECIAL REVENUE FUNDSFOR THE YEAR ENDED JUNE 30, 2014(Expressed in Dollars) FINAL ACTUAL
BUDGET EXPENDITURE(Appropriations) AMOUNTS
ACCOUNTANCY, ARIZONA STATE BOARD OFOPERATING LUMP SUM APPROPRIATION $ 1,933,700 $ 1,522,758
ACUPUNCTURE BOARD OF EXAMINERSADMINISTRATIVE ADJUSTMENTS 262 262 OPERATING LUMP SUM APPROPRIATION 150,200 143,137
ADMINISTRATION, ARIZONA DEPARTMENT OFADMINISTRATIVE ADJUSTMENTS 65,977 65,977 CASH TRANSFER TO AUTOMATION PROJECTS FUND 9,100 9,100 OPERATING LUMP SUM APPROPRIATION 1,500,000 1,146,229
AHCCCS - ARIZONA HEALTH CARE COST CONTAINMENT SYSTEMALTCS SERVICES 51,567,500 49,771,727 PROPOSITION 204 SERVICES 93,284,500 93,284,500 TRADITIONAL MEDICAID SERVICES 37,389,300 32,864,685
APPRAISAL, STATE BOARD OFADMINISTRATIVE ADJUSTMENTS 38,027 38,027 OPERATING LUMP SUM APPROPRIATION 808,700 777,093 REGISTERED TRAINEE AND SUPERVISORY APPRAISALS 42,880 -
ATHLETIC TRAINING, BOARD OFADMINISTRATIVE ADJUSTMENTS 297 297 OPERATING LUMP SUM APPROPRIATION 118,200 118,200
ATTORNEY GENERAL - DEPARTMENT OF LAWADMINISTRATIVE ADJUSTMENTS 74,935 74,935 CASH TRANSFER TO AUTOMATION PROJECTS FUND 117,200 117,200 OPERATING LUMP SUM APPROPRIATION 9,738,200 9,386,773 PAD NATIONAL MORTGAGE SETTLEMENT 47,762,938 7,610,577 VICTIMS RIGHTS 3,997,800 3,971,552
AUTOMOBILE THEFT AUTHORITYAUTOMOBILE THEFT AUTHORITY GRANTS 4,607,700 4,567,361 CASH TRANSFER TO AUTOMATION PROJECTS FUND 30,800 30,800 OPERATING LUMP SUM APPROPRIATION 639,900 530,306 REIMBURSABLE PROGRAMS 50,000 15,000
BARBERS, BOARD OFADMINISTRATIVE ADJUSTMENTS 4,495 4,495 OPERATING LUMP SUM APPROPRIATION 333,800 316,112
BEHAVIORAL HEALTH EXAMINERS, BOARD OFADMINISTRATIVE ADJUSTMENTS 7,190 7,190 OPERATING LUMP SUM APPROPRIATION 1,758,100 1,447,232
BOARD OF MASSAGE THERAPYOPERATING LUMP SUM APPROPRIATION 457,200 451,240
CHIROPRACTIC EXAMINERS, STATE BOARD OFADMINISTRATIVE ADJUSTMENTS 1,682 1,682 OPERATING LUMP SUM APPROPRIATION 469,400 362,664
CONTRACTORS, REGISTRAR OFOFFICE OF ADMINISTRATIVE HEARINGS COSTS 1,017,600 221,200 OPERATING LUMP SUM APPROPRIATION 11,175,700 7,746,895 RESIDENTIAL CONTRACTOR'S RECOVERY FUND 2,700,000 2,700,000
CORPORATION COMMISSIONADMINISTRATIVE ADJUSTMENTS 128,606 128,606 CASH TRANSFER TO AUTOMATION PROJECTS FUND 179,300 179,300 CORPORATION FILINGS, SAME DAY SERVICE 400,400 - OPERATING LUMP SUM APPROPRIATION 25,452,000 24,962,041 UTILITIES, AUDITS, STUDIES, INVEST, HEAR FY09-10 380,000 336,050 UTILITIES, AUDITS, STUDIES, INVEST, HEAR FY10-11 380,000 40 UTILITIES, AUDITS, STUDIES, INVEST, HEAR FY11-12 380,000 - UTILITIES, AUDITS, STUDIES, INVEST, HEAR FY12-13 380,000 - UTILITIES, AUDITS, STUDIES, INVEST, HEAR FY13-14 380,000 -
CORRECTIONS, STATE DEPARTMENT OFADMINISTRATIVE ADJUSTMENTS 26,408 26,408 CASH TRANSFER TO AUTOMATION PROJECTS FUND 284,900 284,900
(continued)
-162 -

STATE OF ARIZONABUDGETARY COMPARISON SCHEDULE, EXPENDITURESNON-MAJOR SPECIAL REVENUE FUNDSFOR THE YEAR ENDED JUNE 30, 2014(Expressed in Dollars) FINAL ACTUAL
BUDGET EXPENDITURE(Appropriations) AMOUNTS
CASH TRANSFER TO BUILDING RENEWAL FUND 9,250,000 9,250,000 INMATE HEALTH CARE CONTRACTED SERVICES 10,000,000 9,930,242 OPERATING LUMP SUM APPROPRIATION 6,054,400 4,793,303 PRIVATE PRISON PER DIEM 24,517,000 23,631,873
COSMETOLOGY, BOARD OFADMINISTRATIVE ADJUSTMENTS 680 680 OPERATING LUMP SUM APPROPRIATION 1,784,500 1,701,319
CRIMINAL JUSTICE COMMISSION, ARIZONACASH TRANSFER BETWEEN FUNDS 83,500 83,500 CASH TRANSFER TO ATTORNEY GENERAL 500,000 500,000 CASH TRANSFER TO AUTOMATION PROJECTS FUND 83,500 83,500 OPERATING LUMP SUM APPROPRIATION 888,100 676,137 STATE AID TO COUNTY ATTORNEYS 973,600 973,600 VICTIM COMPENSATION AND ASSISTANCE 4,092,500 3,478,992
DEAF AND HARD OF HEARING, COMMISSION FOR THEADMINISTRATIVE ADJUSTMENTS 14,984 14,984 CASH TRANSFER TO AUTOMATION PROJECTS FUND 27,000 27,000 INTERPRETER FOR CERTIFICATION AND LICENSURE FY04-05 255,313 - OPERATING LUMP SUM APPROPRIATION 3,776,400 3,462,912
DENTAL EXAMINERS, STATE BOARD OFOPERATING LUMP SUM APPROPRIATION 1,214,800 1,114,805
ECONOMIC SECURITY, DEPARTMENT OFADMINISTRATIVE ADJUSTMENTS 1,411,217 1,411,217 AGENCYWIDE OPERATING LUMP SUM APPROPRIATION 2,601,000 441,975 ATTORNEY GENERAL LEGAL SERVICES 91,600 2,628 CASH TRANSFER TO AUTOMATION PROJECTS FUND 39,000 39,000 CHILDREN SUPPORT SERVICES 1,459,100 - DCYF OPERATING LUMP SUM 207,700 55,997 DOMESTIC VIOLENCE PREVENTION 2,220,000 2,220,000 INDEPENDENT LIVING REHABILITATION SERVICES 1,123,400 1,088,647 JOBS 1,110,900 - REHABILITATION SERVICES 204,700 10,368
EDUCATION, DEPARTMENT OFACCOUNTABILITY-SCHOOL SAFETY-PROP 301 FY11-12 - (3,400) ACCOUNTABILITY-SCHOOL SAFETY-PROP 301 FY12-13 7,716 7,716 ACCOUNTABILITY-SCHOOL SAFETY-PROP 301 FY13-14 7,800,000 7,739,956 ACHIEVEMENT TESTING-PROP 301 FY10-11 693,131 693,130 ACHIEVEMENT TESTING-PROP 301 FY11-12 3,089,185 1,367,944 ACHIEVEMENT TESTING-PROP 301 FY12-13 6,999,871 1,424,458 ACHIEVEMENT TESTING-PROP 301 FY13-14 7,000,000 - ADDITIONAL SCHOOL DAYS-PROP 301 FY12-13 1 1 ADDITIONAL SCHOOL DAYS-PROP 301 FY13-14 86,280,500 86,280,500 CHARACTER EDUCATION-PROP 301 FY11-12 30 30 CHARACTER EDUCATION-PROP 301 FY12-13 85,853 85,853 CHARACTER EDUCATION-PROP 301 FY13-14 200,000 108,994 FAILING SCHOOL TUTORING-PROP 301 FY12-13 211,024 211,025 FAILING SCHOOL TUTORING-PROP 301 FY13-14 1,500,000 1,306,335 OPERATING LUMP SUM APPROPRIATION-ADMINISTRATION 138,100 134,705 OPERATING LUMP SUM APPROPRIATION-STATE BOARD 379,700 307,362 SCHOOL ACCOUNTABILITY-PROP 301 FY08-09 8,881 8,882 SCHOOL ACCOUNTABILITY-PROP 301 FY09-10 121,803 - TEACHER CERTIFICATION 1,841,900 1,691,742
EMERGENCY AND MILITARY AFFAIRS, DEPARTMENT OFCASH TRANSFER TO AUTOMATION PROJECTS FUND 1,000 1,000 EMERGENCY MANAGEMENT 132,700 111,507
ENVIRONMENTAL QUALITY, DEPARTMENT OFADMINISTRATIVE ADJUSTMENTS 1,112,142 1,112,142 AIR QUALITY FEE FUND STATE TRANSFERS 400,000 400,000 AIR QUALITY PROGRAM - CONTINUING FY01-02 186,035 -
(continued)
-163 -

STATE OF ARIZONABUDGETARY COMPARISON SCHEDULE, EXPENDITURESNON-MAJOR SPECIAL REVENUE FUNDSFOR THE YEAR ENDED JUNE 30, 2014(Expressed in Dollars) FINAL ACTUAL
BUDGET EXPENDITURE(Appropriations) AMOUNTS
AIR QUALITY PROGRAM - CONTINUING FY02-03 182,451 - CASH TRANSFER TO AUTOMATION PROJECTS FUND 5,386,200 5,386,200 EMISSIONS CAP AND TRADING PROGRAM FY01-02 70,576 - EMISSIONS CAP AND TRADING PROGRAM FY02-03 266,582 - EMISSIONS CONTROL - CONTRACTOR PAYMENTS 21,919,500 21,500,204 OPERATING LUMP SUM APPROPRIATION 32,106,000 22,229,926 POLITICAL SUBDIVISION ASSISTANCE FY01-02 18,500 - ROADSIDE DIESEL EMISSIONS TEST FY01-02 200,000 - UNDERGROUND STORAGE TANK APPEALS FY00-01 7,500 - VISIBILITY INDEX DEVELOPMENT FY01-02 80,589 -
FINANCIAL INSTITUTIONS, DEPARTMENT OFOPERATING LUMP SUM APPROPRIATION 936,700 882,508
FUNERAL DIRECTORS AND EMBALMERS, STATE BOARD OFADMINISTRATIVE ADJUSTMENTS 717 717 OPERATING LUMP SUM APPROPRIATION 353,600 327,766
GAME AND FISH DEPARTMENT, ARIZONAADMINISTRATIVE ADJUSTMENTS 1,135 1,135 BECKER LAKE FACILITY IMPROVEMENT FY07-08 9,094 - BELLEMONT SHOOTING RANGE FY04-05 191 - BEN AVERY IMPROVEMENTS FY09-10 1 - BEN AVERY IMPROVEMENTS FY10-11 77,026 75,000 BLACK CANYON DAM MODIFICATIONS FY05-06 579,181 210,860 BLACK CANYON DAM MODIFICATIONS FY06-07 183,613 183,612 BLACK CANYON DAM MODIFICATIONS FY13-14 327,200 327,200 BOAT SHADE CANOPIES FY07-08 8,947 8,947 BOAT SHADE CANOPIES FY08-09 58,458 1,923 BUILDING RENEWAL FY12-13 523,300 446,557 BUILDING RENEWAL FY13-14 547,600 - CASH TRANSFER TO AUTOMATION PROJECTS FUND 39,900 39,900 DAM MAINTENANCE FY11-12 434,294 - DAM MAINTENANCE FY12-13 500,000 - FLAGSTAFF SHOOTING RANGE PLANNING FY02-03 2,673 - HEADQUARTERS SECURITY SYSTEM FY03-04 1 - LAKE HAVASU SHOOTING RANGE FY03-04 4,722 - LOWER COLORADO MULTI-SPECIES CONSERVATION 350,000 350,000 MIGRATORY WATERFOWL DEVELOPMENT FY01-02 151 - MIGRATORY WATERFOWL DEVELOPMENT FY02-03 6,426 - MIGRATORY WATERFOWL DEVELOPMENT FY03-04 16,715 500 MIGRATORY WATERFOWL HABITAT FY10-11 65,505 19,500 OPERATING LUMP SUM APPROPRIATION 33,927,800 30,460,668 PERFORMANCE INCENTIVE PAY FY12-13 346,100 - PERFORMANCE INCENTIVE PAY FY13-14 346,100 - PITTMAN-ROBERTSON/DINGELL-JOHNSON ACT 3,808,000 2,558,000 PROPERTY MAINTENANCE FY11-12 131,261 - PROPERTY MAINTENANCE FY12-13 326,412 287,637 RADIO TOWER FY09-10 250,000 - RADIO TOWER FY10-11 250,000 - REGIONAL KINGMAN OFFICE REMODEL FY09-10 885,736 62,550 SHOOTING RANGE ACCESS IMPROVEMENTS FY09-10 1 - SHOOTING RANGE ACCESS IMPROVEMENTS FY10-11 1 - SILVER CREEK HATCHERY REMODEL FY09-10 1,650,933 - SILVER CREEK HATCHERY REMODEL FY10-11 1,000,000 - STATEWIDE PREVENTATIVE MAINTENANCE FY09-10 1 - STATEWIDE PREVENTATIVE MAINTENANCE FY11-12 1 - STATEWIDE PREVENTATIVE MAINTENANCE FY12-13 1 - TRI-STATE SHOOTING RANGE DEVELOPMENT FY04-05 112,606 17,221 WATERCRAFT GRANT PROGRAM 1,000,000 - WATERCRAFT SAFETY EDUCATION PROGRAM 250,000 241,003
(continued)
-164 -

STATE OF ARIZONABUDGETARY COMPARISON SCHEDULE, EXPENDITURESNON-MAJOR SPECIAL REVENUE FUNDSFOR THE YEAR ENDED JUNE 30, 2014(Expressed in Dollars) FINAL ACTUAL
BUDGET EXPENDITURE(Appropriations) AMOUNTS
GAMING, DEPARTMENT OFADDITIONAL OPERATING EXPENSES 800,400 - CASINO OPERATION CERTIFICATION 2,104,000 1,938,715 OPERATING LUMP SUM APPROPRIATION 8,329,900 7,944,658 PROBLEM GAMBLING 2,262,700 1,990,564
GOVERNOR, OFFICE OF THEOPERATING LUMP SUM APPROPRIATION 192,300 -
HEALTH SERVICES, DEPARTMENT OFADMINISTRATIVE ADJUSTMENTS 179,951 179,951 AGENCYWIDE OPERATING LUMP SUM APPROPRIATION 18,640,300 15,717,942 ALZHEIMER DISEASE RESEARCH 1,000,000 1,000,000 CASH TRANSFER BETWEEN FUNDS 300 300 CASH TRANSFER TO AUTOMATION PROJECTS FUND 165,200 165,200 CRISIS SERVICES 2,250,000 2,250,000 FOLIC ACID 400,000 379,824 HIGH RISK PERINATAL SERVICES 450,000 341,382 MEDICAID BEHAVIORAL HEALTH - TRADITIONAL 34,767,000 34,767,000 NEWBORN SCREENING PROGRAM 6,307,000 5,785,331 NURSING FACILITY STUDY 90,000 58,725 RENAL DENTAL CARE AND NUTRITION SUPPLEMT 300,000 975
HOMEOPATHIC AND INTEGRATED MEDICINE EXAMINERS, BOARD OFADMINISTRATIVE ADJUSTMENTS 219 219 OPERATING LUMP SUM APPROPRIATION 102,100 81,058
HOUSING, ARIZONA DEPARTMENT OFOPERATING LUMP SUM APPROPRIATION 313,800 313,800
INDUSTRIAL COMMISSION OF ARIZONAADMINISTRATIVE ADJUSTMENTS 53,110 53,110 CASH TRANSFER TO AUTOMATION PROJECTS FUND 142,500 142,500 OPERATING LUMP SUM APPROPRIATION 19,989,500 19,421,487
JUVENILE CORRECTIONS, DEPARTMENT OFADMINISTRATIVE ADJUSTMENTS 3,003 3,003 CASH TRANSFER TO AUTOMATION PROJECTS FUND 3,800 3,800 OPERATING LUMP SUM APPROPRIATION 530,600 332,296
LAND DEPARTMENT, STATENATURAL RESOURCE CONSERVATION DISTRICTS 260,000 173,669
MEDICAL EXAMINERS BOARDADMINISTRATIVE ADJUSTMENTS 6,273 6,273 CREDENTIALS VERIFICATION CONTRACT 855,000 - OPERATING LUMP SUM APPROPRIATION 5,738,700 5,654,161 PERFORMANCE BASED INCENTIVE PROGRAM 150,000 86,782
MINE INSPECTOR, STATEADMINISTRATIVE ADJUSTMENTS 62 62 AGGREGATE MINED LAND RECLAMATION 112,500 28,805 CASH TRANSFER BETWEEN FUNDS 600 600 CASH TRANSFER TO AUTOMATION PROJECTS FUND 800 800
NATUROPATHIC PHYSICIANS MEDICAL BOARDADMINISTRATIVE ADJUSTMENTS 14,478 14,478 OPERATING LUMP SUM APPROPRIATION 174,700 152,706
NURSING CARE INSTITUTION ADMINISTRATORS AND ASSISTED LIVING FACILITY MANAGERS, BOARD OF EXAMINERS OF
OPERATING LUMP SUM APPROPRIATION 420,200 345,538 NURSING, STATE BOARD OF
ADMINISTRATIVE ADJUSTMENTS 17,207 17,207 OPERATING LUMP SUM APPROPRIATION 4,275,600 4,269,690
OCCUPATIONAL THERAPY EXAMINERS, BOARD OFADMINISTRATIVE ADJUSTMENTS 1,016 1,016 OPERATING LUMP SUM APPROPRIATION 172,500 172,413
OPTICIANS, STATE BOARD OF DISPENSINGADMINISTRATIVE ADJUSTMENTS 297 297
(continued)
-165 -

STATE OF ARIZONABUDGETARY COMPARISON SCHEDULE, EXPENDITURESNON-MAJOR SPECIAL REVENUE FUNDSFOR THE YEAR ENDED JUNE 30, 2014(Expressed in Dollars) FINAL ACTUAL
BUDGET EXPENDITURE(Appropriations) AMOUNTS
OPERATING LUMP SUM APPROPRIATION 135,800 131,454 OPTOMETRY, STATE BOARD OF
ADMINISTRATIVE ADJUSTMENTS 760 760 OPERATING LUMP SUM APPROPRIATION 206,000 199,373
OSTEOPATHIC EXAMINERS, ARIZONA BOARD OFOPERATING LUMP SUM APPROPRIATION 775,500 744,202
PEST MANAGEMENT, OFFICE OFOPERATING LUMP SUM APPROPRIATION 2,039,000 1,264,740
PHARMACY, ARIZONA STATE BOARD OFADMINISTRATIVE ADJUSTMENTS 1,694 1,694 AZ POISON AND DRUG INFORMATION CENTER 200,000 200,000 CONTROLLED SUBSTANCE PRESCRIPTION MONITORING PROGRAM 350,000 350,000 OPERATING LUMP SUM APPROPRIATION 2,103,700 1,901,485
PHYSICAL THERAPY EXAMINERS, BOARD OFADMINISTRATIVE ADJUSTMENTS 2,469 2,469 OPERATING LUMP SUM APPROPRIATION 432,600 411,375
PODIATRY EXAMINERS, STATE BOARD OFADMINISTRATIVE ADJUSTMENTS 181 181 OPERATING LUMP SUM APPROPRIATION 147,300 124,871
POSTSECONDARY EDUCATION, COMMISSION FORADMINISTRATIVE ADJUSTMENTS 3,915 3,915 ARIZONA COLLEGE AND CAREER GUIDE 21,300 16,145 AZ MINORITY ED POLICY ANALYSIS CENTER 100,000 18,996 LEVERAGING EDUCATIONAL ASSISTANCE PARTNERSHIP 1,098,700 1,098,700 OPERATING LUMP SUM APPROPRIATION FY08-09 - (143,635) OPERATING LUMP SUM APPROPRIATION FY13-14 184,800 104,784 TWELVE PLUS PARTNERSHIP 130,500 44,037
PRIVATE POSTSECONDARY EDUCATION, STATE BOARD FOROPERATING LUMP SUM APPROPRIATION 641,200 616,373
PSYCHOLOGIST EXAMINERS, STATE BOARD OFADMINISTRATIVE ADJUSTMENTS 3,998 3,998 OPERATING LUMP SUM APPROPRIATION 375,500 359,970
PUBLIC SAFETY, DEPARTMENT OFADMINISTRATIVE ADJUSTMENTS 5,708 5,708 CASH TRANSFER TO AUTOMATION PROJECTS FUND 1,296,600 1,296,600 DNA TESTING 38,680 - DNA TESTING FY02-03 1,258,331 - DNA TESTING FY03-04 678,704 - DNA TESTING FY07-08 938,531 - MOTOR VEHICLE FUEL 231,300 231,300 OPERATING LUMP SUM APPROPRIATION 176,867,600 174,827,073 PUBLIC SAFETY EQUIPMENT FY09-10 2,728,719 - PUBLIC SAFETY EQUIPMENT FY11-12 244,856 - PUBLIC SAFETY EQUIPMENT FY12-13 277,463 192,895 PUBLIC SAFETY EQUIPMENT FY13-14 1,200,000 1,123,615 PUBLIC SAFETY EQUIPMENT SURCHARGE 2,390,000 2,086,210
RACING, ARIZONA DEPARTMENT OFCASH TRANSFER TO AUTOMATION PROJECTS FUND 20,400 20,400 OPERATING LUMP SUM APPROPRIATION 2,895,900 2,815,860
RADIATION REGULATORY AGENCYCASH TRANSFER TO AUTOMATION PROJECTS FUND 1,900 1,900 OPERATING LUMP SUM APPROPRIATION 273,300 235,993
RESIDENTIAL UTILITY CONSUMER OFFICEADMINISTRATIVE ADJUSTMENTS 727 727 CASH TRANSFER TO AUTOMATION PROJECTS FUND 9,400 9,400 OPERATING LUMP SUM APPROPRIATION 1,189,400 1,000,716 PROFESSIONAL WITNESSES FY08-09 234 234 PROFESSIONAL WITNESSES FY09-10 2,625 2,625 PROFESSIONAL WITNESSES FY10-11 57,817 57,622
(continued)
-166 -

STATE OF ARIZONABUDGETARY COMPARISON SCHEDULE, EXPENDITURESNON-MAJOR SPECIAL REVENUE FUNDSFOR THE YEAR ENDED JUNE 30, 2014(Expressed in Dollars) FINAL ACTUAL
BUDGET EXPENDITURE(Appropriations) AMOUNTS
PROFESSIONAL WITNESSES FY11-12 125,871 81,075 PROFESSIONAL WITNESSES FY12-13 134,923 - PROFESSIONAL WITNESSES FY13-14 145,000 31,274
RESPIRATORY CARE EXAMINERS, BOARD OFADMINISTRATIVE ADJUSTMENTS 1,243 1,243 OPERATING LUMP SUM APPROPRIATION 297,100 294,934
REVENUE, DEPARTMENT OFADMINISTRATIVE ADJUSTMENTS 1,048 1,048 OPERATING LUMP SUM APPROPRIATION 679,300 574,345
SUPREME COURTAUTOMATION 7,991,800 6,432,217 CASE AND CASH MANAGEMENT SYSTEM 3,187,100 2,501,691 CASH TRANSFER BETWEEN FUNDS 171,900 171,900 CASH TRANSFER TO AUTOMATION PROJECTS FUND 283,700 283,700 CASH TRANSFER TO GENERAL FUND 675,000 675,000 COMMUNITY PUNISHMENT 2,310,100 1,451,393 COURT APPOINTED SPECIAL ADVOCATE 2,940,900 2,550,706 JUVENILE CRIME REDUCTION 5,192,100 3,883,257 OPERATING LUMP SUM APPROPRIATION 3,311,100 2,620,021 PROBATION SURCHARGE 6,029,200 6,019,161 STATE AID 5,949,100 4,653,657
TECHNICAL REGISTRATION, STATE BOARD OFADMINISTRATIVE ADJUSTMENTS 2,908 2,908 OPERATING LUMP SUM APPROPRIATION 2,119,500 1,774,737
TREASURER, STATELAW ENFORCEMENT AND BOATING SAFETY DIST 2,183,800 1,931,590
VETERANS' SERVICES, DEPARTMENT OFADMINISTRATIVE ADJUSTMENTS 1,484 1,484 OPERATING LUMP SUM APPROPRIATION 906,300 526,709
VETERINARY MEDICAL EXAMINING BOARD, ARIZONA STATEADMINISTRATIVE ADJUSTMENTS 7,459 7,459 OPERATING LUMP SUM APPROPRIATION 483,400 435,810
WATER RESOURCES, DEPARTMENT OFASSURED AND ADEQUATE WATER SUPPLY ADMIN 266,400 5,076 CASH TRANSFER TO AUTOMATION PROJECTS FUND 2,900 2,900 OPERATING LUMP SUM APPROPRIATION 640,400 82,779
WEIGHTS AND MEASURES, DEPARTMENT OFADMINISTRATIVE ADJUSTMENTS 67,582 67,582 CASH TRANSFER TO AUTOMATION PROJECTS FUND 12,500 12,500 GENERAL SERVICES 330,000 329,999 OXYGENATED FUEL 845,200 845,043 VAPOR RECOVERY 618,600 616,951
TOTAL NON-MAJOR SPECIAL REVENUE FUNDS BUDGETARY EXPENDITURES $ 963,005,010 $ 832,855,897
-167 -

STATE OF ARIZONABUDGETARY COMPARISON SCHEDULE, EXPENDITURESLAND ENDOWMENTS FUNDFOR THE YEAR ENDED JUNE 30, 2014(Expressed in Dollars) FINAL ACTUAL
BUDGET EXPENDITURE(Appropriations) AMOUNTS
CORRECTIONS, STATE DEPARTMENT OFCASH TRANSFER TO BUILDING RENEWAL FUND $ 1,250,000 $ 1,250,000 OPERATING LUMP SUM APPROPRIATION 360,000 359,880 PRIVATE PRISON PER DIEM 979,200 892,271
DEAF AND BLIND, ARIZONA SCHOOLS FOR THECASH TRANSFER TO AUTOMATION PROJECTS FUND 97,800 97,800 PHOENIX DAY SCHOOL FOR THE DEAF 5,700,000 5,700,000 PRESCHOOL AND OUTREACH PROGRAMS 3,575,500 2,173,363 TUCSON CAMPUS 4,020,600 4,020,600 VOUCHER FUND ADJUSTMENT 289,400 275,093
EDUCATION, DEPARTMENT OFBASIC STATE AID ENTITLEMENT 46,475,500 46,475,500
HEALTH SERVICES, DEPARTMENT OFADMINISTRATIVE ADJUSTMENTS 396,000 396,000 AGENCYWIDE OPERATING LUMP SUM APPROPRIATION 650,000 623,680
JUVENILE CORRECTIONS, DEPARTMENT OFOPERATING LUMP SUM APPROPRIATION 1,098,600 1,098,600
LAND DEPARTMENT, STATEOPERATING LUMP SUM APPROPRIATION 3,174,500 1,155,588
PIONEERS' HOME, ARIZONAADMINISTRATIVE ADJUSTMENTS 6 6 OPERATING LUMP SUM APPROPRIATION 4,456,600 4,254,911 PRESCRIPTION DRUGS 200,000 139,239
TOTAL LAND ENDOWMENTS FUNDS BUDGETARY EXPENDITURES $ 72,723,706 $ 68,912,531
-168 -

NON-MAJOR GOVERNMENTAL FUNDS DEBT SERVICE FUNDS
The Lottery Fund administers the payment of principal and interest on the Lottery Revenue Bonds issued by the State of Arizona (acting by and through the Director of the Department of Administration). The Department of Transportation Fund administers the payment of principal and interest on the Highway Revenue Bonds, Transportation Excise Tax Revenue Bonds, and Grant Anticipation Notes issued by the Arizona Department of Transportation Board. The Certificates of Participation Fund administers the payment of principal and interest on the certificates of participation issued by the State of Arizona (acting by and through the Director of the Department of Administration) and the retirement of previously issued certificates of participation. The School Facilities Debt Instrument Fund administers the payment of principal and interest on revenue bonds issued by the State of Arizona’s School Facilities Board and the retirement of previously issued revenue bonds.

STATE OF ARIZONACOMBINING BALANCE SHEETNON-MAJOR DEBT SERVICE FUNDSJUNE 30, 2014(Expressed in Thousands)
DEPARTMENT OF CERTIFICATES OF DEBT
LOTTERY TRANSPORTATION PARTICIPATION INSTRUMENT TOTALASSETS Cash and pooled investments with State Treasurer $ - $ - $ 1,002 $ 280 $ 1,282 Due from other Funds 3,750 - - - 3,750 Restricted assets: Cash and pooled investments with State Treasurer - 179 - 40,886 41,065 Cash held by trustee - - 155 11,416 11,571
Total Assets $ 3,750 $ 179 $ 1,157 $ 52,582 $ 57,668
LIABILITIES AND FUND BALANCES Liabilities: Accounts payable and other current liabilities $ - $ - $ 326 $ - $ 326 Total Liabilities - - 326 - 326
Fund Balances: Restricted $ 3,750 $ 179 $ 831 $ 52,582 $ 57,342
Total Liabilities and Fund Balances $ 3,750 $ 179 $ 1,157 $ 52,582 $ 57,668
SCHOOLFACILITIES
- 170 -

STATE OF ARIZONACOMBINING STATEMENT OF REVENUES,EXPENDITURES AND CHANGES IN FUND BALANCESNON-MAJOR DEBT SERVICE FUNDSFOR THE YEAR ENDED JUNE 30, 2014(Expressed in Thousands)
DEPARTMENT OF CERTIFICATES OF DEBTLOTTERY TRANSPORTATION PARTICIPATION INSTRUMENT TOTAL
REVENUES Sales taxes $ - $ - $ - $ 56,225 $ 56,225 Earnings on investments - 868 - 884 1,752 Other - - 21 - 21 Total Revenues - 868 21 57,109 57,998
EXPENDITURES Debt service: Principal 17,445 165,615 52,445 65,995 301,500 Interest and other fiscal charges 20,055 139,805 58,429 14,548 232,837 Total Expenditures 37,500 305,420 110,874 80,543 534,337 (Deficiency) of Revenues Over Expenditures (37,500) (304,552) (110,853) (23,434) (476,339)
OTHER FINANCING SOURCES (USES) Transfers in 37,500 303,030 112,275 31,562 484,367 Transfers out - - (10,680) - (10,680) Total Other Financing Sources 37,500 303,030 101,595 31,562 473,687 Net Change in Fund Balances - (1,522) (9,258) 8,128 (2,652) Fund Balances - Beginning 3,750 1,701 10,089 44,454 59,994
Fund Balances - Ending $ 3,750 $ 179 $ 831 $ 52,582 $ 57,342
SCHOOLFACILITIES
- 171 -


NON-MAJOR GOVERNMENTAL FUNDS CAPITAL PROJECTS FUNDS
The Department of Transportation Financed Fund administers the proceeds from the Highway Revenue Bonds, Transportation Excise Tax Revenue Bonds, and Grant Anticipation Notes issued by the Arizona Department of Transportation Board. These monies are expended for the construction of projects in the Five-Year Transportation Facilities Construction Program. The Certificates of Participation Financed Fund administers the proceeds from the certificates of participation issued by the State of Arizona (acting by and through the Director of the Department of Administration). These monies are expended on various projects including new building construction.

STATE OF ARIZONACOMBINING BALANCE SHEETNON-MAJOR CAPITAL PROJECTS FUNDSJUNE 30, 2014(Expressed in Thousands)
DEPARTMENT OFTRANSPORTATION
FINANCEDASSETS Restricted assets: Cash and pooled investments with State Treasurer $ 311,011
Total Assets $ 311,011
FUND BALANCES Fund Balances: Restricted $ 311,011 Total Fund Balances 311,011
Total Fund Balances $ 311,011
- 174 -

STATE OF ARIZONACOMBINING STATEMENT OF REVENUES, EXPENDITURES AND CHANGES IN FUND BALANCESNON-MAJOR CAPITAL PROJECTS FUNDSFOR THE YEAR ENDED JUNE 30, 2014(Expressed in Thousands)
CERTIFICATES OFTRANSPORTATION PARTICIPATION
FINANCED FINANCED TOTALREVENUES Earnings on investments $ 3,830 $ 1 $ 3,831 Total Revenues 3,830 1 3,831
EXPENDITURES Current: Transportation 15,309 - 15,309 Capital outlay 134,883 12 134,895 Total Expenditures 150,192 12 150,204 (Deficiency) of Revenues Over Expenditures (146,362) (11) (146,373)
OTHER FINANCING (USES) Transfers out - (266) (266) Total Other Financing (Uses) - (266) (266) Net Change in Fund Balances (146,362) (277) (146,639) Fund Balances - Beginning 457,373 277 457,650
Fund Balances - Ending $ 311,011 $ - $ 311,011
DEPARTMENT OF
- 175 -


NON-MAJOR ENTERPRISE FUNDS Enterprise Funds account for operations (a) financed and operated in a manner similar to private business enterprises, where the State intends that the cost of providing goods or services to the general public be financed or recovered primarily through service charges, or (b) where the State decides that periodic determination of revenues earned, expenses incurred, and/or net income is appropriate for capital maintenance, public policy, management control, accountability, or other purposes. The Arizona Industries for the Blind Fund accounts for the manufacturing, sale, distribution, and marketing of products manufactured by employees at training centers, workshops, business enterprises and home industries programs for the training and employment of adaptable visually impaired persons. The Lottery Fund accounts for the revenues received from the sale of lottery tickets, the receipt of license fees, prize payments, operational expenses, including consulting, promotional, and advertising expenses, and transfers of monies to other State Funds. The Arizona Correctional Industries Fund employs prison inmates in its manufacturing, service, and agricultural operations for the sale of goods and services primarily to other State agencies (including the Arizona Department of Corrections) and political subdivisions. The Arizona Highways Magazine Fund publishes and markets the Arizona Highways Magazine and various other products that promote the State of Arizona. The Coliseum & Exposition Center Fund provides rental space to a variety of entertainment and promotional lessees, and sponsors the annual State Fair. The Unemployment Compensation Fund pays claims for unemployment to eligible recipients from employer contributions and reimbursements. The Highway Expansion & Extension Loan Program provides the State and communities in Arizona a new financing mechanism to stretch limited transportation dollars and bridge the gap between needs and available revenues. The Healthcare Group of Arizona administers prepaid medical coverage primarily to small, uninsured businesses with 50 or fewer employees and employees of political subdivisions. The Healthcare Group of Arizona processes premium billing, collections and fund disbursements, performs data analysis, and is responsible for the regulatory oversight of the health plans. The Other Enterprise Funds consist of the Veterans Administration Reimbursement Fund, the State Home for Veterans Trust Fund and the Tonto Natural Bridge Publications and Souvenirs Revolving Fund.
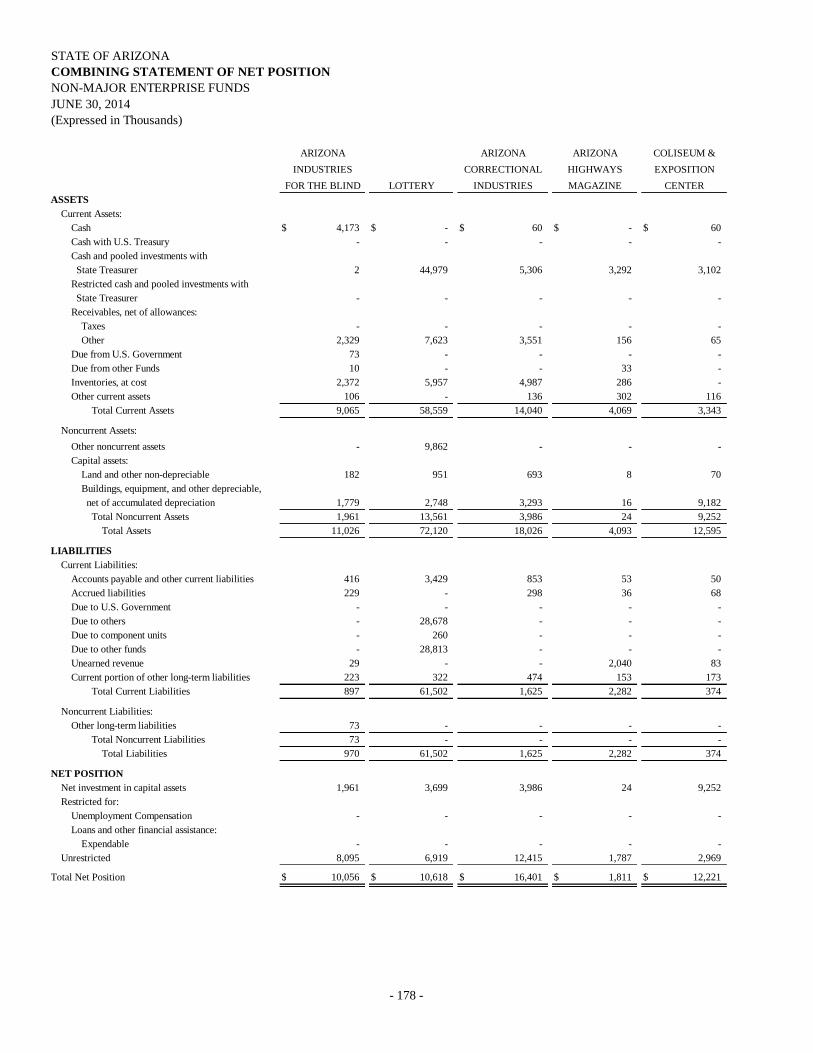
STATE OF ARIZONACOMBINING STATEMENT OF NET POSITIONNON-MAJOR ENTERPRISE FUNDSJUNE 30, 2014(Expressed in Thousands)
INDUSTRIES CORRECTIONAL HIGHWAYS EXPOSITIONFOR THE BLIND LOTTERY INDUSTRIES MAGAZINE CENTER
ASSETS Current Assets: Cash $ 4,173 $ - $ 60 $ - $ 60 Cash with U.S. Treasury - - - - - Cash and pooled investments with State Treasurer 2 44,979 5,306 3,292 3,102 Restricted cash and pooled investments with State Treasurer - - - - - Receivables, net of allowances: Taxes - - - - - Other 2,329 7,623 3,551 156 65 Due from U.S. Government 73 - - - - Due from other Funds 10 - - 33 - Inventories, at cost 2,372 5,957 4,987 286 - Other current assets 106 - 136 302 116 Total Current Assets 9,065 58,559 14,040 4,069 3,343
Noncurrent Assets: Other noncurrent assets - 9,862 - - - Capital assets: Land and other non-depreciable 182 951 693 8 70 Buildings, equipment, and other depreciable, net of accumulated depreciation 1,779 2,748 3,293 16 9,182 Total Noncurrent Assets 1,961 13,561 3,986 24 9,252 Total Assets 11,026 72,120 18,026 4,093 12,595
LIABILITIES Current Liabilities: Accounts payable and other current liabilities 416 3,429 853 53 50 Accrued liabilities 229 - 298 36 68 Due to U.S. Government - - - - - Due to others - 28,678 - - - Due to component units - 260 - - - Due to other funds - 28,813 - - - Unearned revenue 29 - - 2,040 83 Current portion of other long-term liabilities 223 322 474 153 173 Total Current Liabilities 897 61,502 1,625 2,282 374
Noncurrent Liabilities: Other long-term liabilities 73 - - - - Total Noncurrent Liabilities 73 - - - - Total Liabilities 970 61,502 1,625 2,282 374
NET POSITION Net investment in capital assets 1,961 3,699 3,986 24 9,252 Restricted for: Unemployment Compensation - - - - - Loans and other financial assistance: Expendable - - - - - Unrestricted 8,095 6,919 12,415 1,787 2,969
Total Net Position $ 10,056 $ 10,618 $ 16,401 $ 1,811 $ 12,221
ARIZONA ARIZONA ARIZONA COLISEUM &
- 178 -

EXPANSIONUNEMPLOYMENT & EXTENSION GROUP OFCOMPENSATION LOAN PROGRAM ARIZONA OTHER TOTAL
$ - $ - $ - $ - $ 4,293 8,244 - - - 8,244
- - 7,257 4,580 68,518
- 77,833 - - 77,833
91,906 - - - 91,906 13,684 - - 2,946 30,354
- - - - 73 - - - 101 144 - - - - 13,602 - - - - 660
113,834 77,833 7,257 7,627 295,627
- - - - 9,862
- - - 980 2,884
- - - 6,835 23,853 - - - 7,815 36,599
113,834 77,833 7,257 15,442 332,226
19 - 3 466 5,289 28,874 - 1 433 29,939 13,025 - - - 13,025 13,982 - - - 42,660
- - - - 260 349 - - - 29,162
- - - - 2,152 - - - 528 1,873
56,249 - 4 1,427 124,360
- - - - 73 - - - - 73
56,249 - 4 1,427 124,433
- - - 7,815 26,737
57,585 - - - 57,585
- 77,833 - - 77,833 - - 7,253 6,200 45,638
$ 57,585 $ 77,833 $ 7,253 $ 14,015 $ 207,793
HIGHWAYHEALTHCARE
- 179 -

STATE OF ARIZONACOMBINING STATEMENT OF REVENUES,EXPENSES AND CHANGES IN FUND NET POSITIONNON-MAJOR ENTERPRISE FUNDSFOR THE YEAR ENDED JUNE 30, 2014(Expressed in Thousands)
COLISEUM &CORRECTIONAL EXPOSITION
FOR THE BLIND LOTTERY INDUSTRIES CENTEROPERATING REVENUES Sales and charges for services $ 17,820 $ 723,955 $ 37,997 $ 4,507 $ 11,050 Unemployment assessments - - - - - Intergovernmental - - - - - Fines, forfeitures, and penalties - - - - - Other 260 340 - 657 963 Total Operating Revenues 18,080 724,295 37,997 5,164 12,013
OPERATING EXPENSES Cost of sales and benefits 8,411 525,492 32,135 2,511 1,827 Personal services 6,200 5,890 4,064 1,563 4,251 Contractual services 2,236 15,594 - 618 3,729 Depreciation and amortization 355 275 623 7 633 Insurance - 40 - - 276 Other 877 1,488 - 86 1,275 Total Operating Expenses 18,079 548,779 36,822 4,785 11,991 Operating Income 1 175,516 1,175 379 22
NON-OPERATING REVENUES (EXPENSES) (Loss) on sale of capital assets - - (9) - - Investment income 9 104 36 27 11 Other non-operating revenue - - - - - Distributions - (14,763) - - - Interest expense - - - - - Other non-operating expense - - - (3) - Total Non-Operating Revenues (Expenses) 9 (14,659) 27 24 11 Income Before Contributions and Transfers 10 160,857 1,202 403 33 Capital grants and contributions - - - - 107 Transfers out - (160,858) (1,303) (34) (80)
Change in Net Position 10 (1) (101) 369 60 Total Net Position - Beginning 10,046 10,619 16,502 1,442 12,161
Total Net Position - Ending $ 10,056 $ 10,618 $ 16,401 $ 1,811 $ 12,221
ARIZONA ARIZONA ARIZONAINDUSTRIES HIGHWAYS
MAGAZINE
- 180 -

HEALTHCAREUNEMPLOYMENT GROUP OFCOMPENSATION ARIZONA OTHER TOTAL
$ - $ - $ 11,747 $ 31,652 $ 838,728 455,979 - - - 455,979
84,094 - - - 84,094 1,878 - - - 1,878 5,507 - - 73 7,800
547,458 - 11,747 31,725 1,388,479
452,025 - 10,396 45 1,032,842 - - 586 19,555 42,109 - - 79 3,827 26,083 - - 1 338 2,232 - - - 410 726 - - 107 5,117 8,950
452,025 - 11,169 29,292 1,112,942 95,433 - 578 2,433 275,537
- - - - (9) 1,688 664 59 10 2,608
- - 62 - 62 - - - - (14,763)
(2,538) - - - (2,538) - (46) (7) - (56)
(850) 618 114 10 (14,696)
94,583 618 692 2,443 260,841 - - - - 107
(4,279) - - (401) (166,955)
90,304 618 692 2,042 93,993 (32,719) 77,215 6,561 11,973 113,800
$ 57,585 $ 77,833 $ 7,253 $ 14,015 $ 207,793
HIGHWAYEXPANSION
& EXTENSIONLOAN PROGRAM
- 181 -

STATE OF ARIZONACOMBINING STATEMENT OF CASH FLOWSNON-MAJOR ENTERPRISE FUNDSFOR THE YEAR ENDED JUNE 30, 2014(Expressed in Thousands)
ARIZONAINDUSTRIES HIGHWAYS EXPOSITION
LOTTERY MAGAZINE CENTERCASH FLOWS FROM OPERATING ACTIVITIES Receipts from customers $ 17,862 $ 333,644 $ 38,094 $ 4,486 $ 11,050 Receipts from assessments - - - - - Receipts from grants and contracts 1 - - - - Receipts from settlement income - - - - - Payments to suppliers, prize winners, claimants, or insurance companies (7,906) (174,741) (19,028) (3,135) (7,084) Payments to employees (6,189) (5,906) (19,568) (1,565) (4,233) Other receipts 258 15,394 - 657 963 Other payments (3,114) - - - - Net Cash Provided (Used) by Operating Activities 912 168,391 (502) 443 696
CASH FLOWS FROM NON-CAPITAL FINANCING ACTIVITIES Distributions - (14,763) - - - Interest paid on loan due to U.S. Government - - - - - Transfers to other Funds - (184,683) (1,303) (34) (80) Net Cash (Used) by Non-capital Financing Activities - (199,446) (1,303) (34) (80)
CASH FLOWS FROM CAPITAL AND RELATED FINANCING ACTIVITIES Proceeds from sale of capital assets - - 30 - - Acquisition and construction of capital assets - (61) (799) - (370) Net Cash (Used) by Capital and Related Financing Activities - (61) (769) - (370)
CASH FLOWS FROM INVESTING ACTIVITIES Interest and dividends from investments 10 94 35 25 11 Change in cash collateral received from securities lending transactions - - - - - Net Cash Provided by Investing Activities 10 94 35 25 11
Net Increase (Decrease) in Cash and Cash Equivalents 922 (31,022) (2,539) 434 257 Cash and Cash Equivalents - Beginning 3,253 76,001 7,905 2,858 2,905
Cash and Cash Equivalents - Ending $ 4,175 $ 44,979 $ 5,366 $ 3,292 $ 3,162
Reconciliation of operating income to net cash provided (used) by operating activities: Operating income $ 1 $ 175,516 $ 1,175 $ 379 $ 22 Adjustments to reconcile operating income to net cash provided (used) by operating activities: Depreciation and amortization 355 275 623 7 633 Provision for uncollectible accounts - - 13 - - Miscellaneous income - - - - - Net changes in assets and liabilities: (Increase) decrease in receivables, net of allowances 12 (1,227) 90 22 (31) Decrease in due from U.S. Government 1 - - - - (Increase) decrease in due from other Funds (1) - - - - (Increase) decrease in inventories, at cost 572 (2,009) (1,110) 62 - (Increase) decrease in other assets (94) (558) (7) 42 (27) Increase (decrease) in accounts payable 61 (2,193) (1,369) (24) 50 Increase (decrease) in accrued liabilities (22) (1,413) 82 6 11 (Decrease) in due to U.S. Government - - - - - (Decrease) in due to other Funds - - - - - (Decrease) in due to others - - - - - Increase (decrease) in unearned revenue 29 - - (43) 31 Increase (decrease) in other liabilities (2) - 1 (8) 7
Net Cash Provided (Used) by Operating Activities $ 912 $ 168,391 $ (502) $ 443 $ 696
SCHEDULE OF NONCASH INVESTING, CAPITAL AND NON-CAPITAL FINANCING ACTIVITIES Contribution of capital assets from other Funds $ - $ - $ - $ - $ 107 (Loss) on disposal of capital assets, net - - (9) - - Total Noncash Investing, Capital and Non-capital Financing Activities $ - $ - $ (9) $ - $ 107
CORRECTIONALFOR THE BLIND INDUSTRIES
ARIZONA ARIZONA COLISEUM &
- 182 -

HEALTHCAREGROUP OFARIZONA OTHER TOTAL
$ - $ - $ 8,748 $ 31,383 $ 445,267 458,133 - - - 458,133 84,094 - - - 84,095
- - 62 - 62
(447,350) - (10,836) (9,351) (679,431) - - (642) (18,942) (57,045) - - - 73 17,345
(91,262) - - - (94,376) 3,615 - (2,668) 3,163 174,050
- - - - (14,763) (7,751) - - - (7,751) (4,254) - - (401) (190,755)
(12,005) - - (401) (213,269)
- - - - 30 - - (7) (106) (1,343)
- - (7) (106) (1,313)
1,690 662 59 10 2,596
- (44) - - (44) 1,690 618 59 10 2,552
(6,700) 618 (2,616) 2,666 (37,980) 14,944 77,215 9,873 1,914 196,868
$ 8,244 $ 77,833 $ 7,257 $ 4,580 $ 158,888
$ 95,433 $ - $ 578 $ 2,433 $ 275,537
- - 1 338 2,232 - - - - 13 - - 62 - 62
9,498 - - (313) 8,051 - - - - 1 - - - 44 43 - - - - (2,485) - - - - (644) - - (25) 50 (3,450)
4,399 - (229) 85 2,919 (98,444) - - - (98,444)
- - - (2) (2) (7,271) - - - (7,271)
- - (2,999) - (2,982) - - (56) 528 470
$ 3,615 $ - $ (2,668) $ 3,163 $ 174,050
$ - $ - $ - $ - $ 107 - - - - (9)
$ - $ - $ - $ - $ 98
UNEMPLOYMENT & EXTENSIONCOMPENSATION LOAN PROGRAM
HIGHWAYEXPANSION
- 183 -


INTERNAL SERVICE FUNDS Internal Service Funds account for the financing of goods and services provided by one State department or agency to other State departments or agencies on a cost-reimbursement basis. The Risk Management Fund provides insurance coverage to all State agencies using an optimal combination of self-insurance and private excess insurance. It includes the Workers' Compensation section that receives monies from State agencies and uses these monies to pay for insurance and risk management services including loss control services and self-insured liability losses. The Transportation Equipment Fund administers the purchase, storage and distribution of supplies, equipment and furniture for other Department of Transportation Funds. The Employee Benefits Fund (HITF) administers the State’s benefits program available to State employees and retirees. The Telecommunication Fund receives monies from State agencies for services related to administering the State’s contracts for the installation and maintenance of telecommunications equipment through the Telecommunications Program Office. The Automation Operations Fund receives monies from State agencies for services related to the implementation and operation of automation programs throughout the State. The Retiree Accumulated Sick Leave Fund accounts for monies paid out to retirees for their accumulated sick leave. The Motor Pool Fund receives monies from State agencies for the use of State vehicles and uses these monies for operation of the State Motor Pool.

STATE OF ARIZONACOMBINING STATEMENT OF NET POSITIONINTERNAL SERVICE FUNDSJUNE 30, 2014(Expressed in Thousands)
RISK TRANSPORTATION EMPLOYEE TELE-MANAGEMENT EQUIPMENT BENEFITS COMMUNICATION
ASSETS Current Assets: Cash and pooled investments with State Treasurer $ 74,193 $ - $ 333,561 $ 894 Receivables, net of allowances: Other 40 - 9,637 149 Due from U.S. Government - - 3,600 - Due from other Funds 5 - 1 - Inventories, at cost - 3,122 - - Other current assets 4,202 - 8 - Total Current Assets 78,440 3,122 346,807 1,043
Noncurrent Assets: Restricted assets: Cash and pooled investments with State Treasurer - 975 - - Capital assets: Land and other non-depreciable - - - - Buildings, equipment, and other depreciable, net of accumulated depreciation 93 66,447 23 52 Total Noncurrent Assets 93 67,422 23 52 Total Assets 78,533 70,544 346,830 1,095
LIABILITIES Current Liabilities: Accounts payable and other current liabilities 2,141 - 132,096 226 Accrued liabilities 281 297 53 25 Due to other Funds 7 - 7 - Current portion of accrued insurance losses 59,786 - - - Current portion of other long-term liabilities 705 577 160 66 Total Current Liabilities 62,920 874 132,316 317
Noncurrent Liabilities: Accrued insurance losses 369,543 - - - Other long-term liabilities - 229 - - Total Noncurrent Liabilities 369,543 229 - - Total Liabilities 432,463 1,103 132,316 317
NET POSITION Net investment in capital assets 93 66,447 23 52 Unrestricted (deficit) (354,023) 2,994 214,491 726
Total Net Position $ (353,930) $ 69,441 $ 214,514 $ 778
- 186 -

MOTOR SICK LEAVE POOL TOTAL
$ 14,048 $ 2,803 $ 612 $ 426,111
970 - 425 11,221 - - - 3,600
2,155 - 670 2,831 - - 51 3,173
1,307 - 15 5,532 18,480 2,803 1,773 452,468
- - - 975
76 - - 76
3,879 - 11,718 82,212 3,955 - 11,718 83,263
22,435 2,803 13,491 535,731
1,365 - 582 136,410 194 - 15 865
- - - 14 - - - 59,786
479 8,143 42 10,172 2,038 8,143 639 207,247
- - - 369,543 - 148,600 - 148,829 - 148,600 - 518,372
2,038 156,743 639 725,619
3,955 - 11,718 82,288 16,442 (153,940) 1,134 (272,176)
$ 20,397 $ (153,940) $ 12,852 $ (189,888)
AUTOMATIONOPERATIONS
RETIREEACCUMULATED
- 187 -

STATE OF ARIZONACOMBINING STATEMENT OF REVENUES,EXPENSES AND CHANGES IN FUND NET POSITIONINTERNAL SERVICE FUNDSFOR THE YEAR ENDED JUNE 30, 2014(Expressed in Thousands)
RISK TRANSPORTATION TELE-MANAGEMENT EQUIPMENT COMMUNICATION
OPERATING REVENUES Sales and charges for services $ 103,733 $ 27,326 $ 823,774 $ 1,347 Other - 54 - 2 Total Operating Revenues 103,733 27,380 823,774 1,349
OPERATING EXPENSES Cost of sales and benefits - 13,949 755,161 2 Personal services 12,950 13,389 2,603 1,010 Contractual services 18,900 200 1,286 339 Depreciation and amortization 41 10,080 5 525 Insurance 81,285 - 757 19 Other 1,482 859 299 452 Total Operating Expenses 114,658 38,477 760,111 2,347 Operating Income (Loss) (10,925) (11,097) 63,663 (998)
NON-OPERATING REVENUES Gain on sale of capital assets - 26 - 5 Investment income - 4 - - Other non-operating revenue - 91 - - Total Non-Operating Revenues - 121 - 5 Income (Loss) Before Contributions and Transfers (10,925) (10,976) 63,663 (993) Capital grants and contributions - 19,121 - - Transfers out (2,454) (192) (73,761) (52)
Change in Net Position (13,379) 7,953 (10,098) (1,045) Total Net Position - Beginning (340,551) 61,488 224,612 1,823
Total Net Position - Ending $ (353,930) $ 69,441 $ 214,514 $ 778
EMPLOYEEBENEFITS
- 188 -

MOTORPOOL TOTAL
$ 28,298 $ 13,095 $ 8,931 $ 1,006,504 - - - 56
28,298 13,095 8,931 1,006,560
5,975 14,941 5,101 795,129 8,472 68 879 39,371 1,802 4 148 22,679 1,531 - 1,491 13,673
368 - 511 82,940 1,667 - 686 5,445
19,815 15,013 8,816 959,237 8,483 (1,918) 115 47,323
5 - - 36 - - - 4 - - 221 312 5 - 221 352
8,488 (1,918) 336 47,675 844 - 792 20,757
(8,671) (88) (72) (85,290)
661 (2,006) 1,056 (16,858) 19,736 (151,934) 11,796 (173,030)
$ 20,397 $ (153,940) $ 12,852 $ (189,888)
AUTOMATIONRETIREE
OPERATIONS SICK LEAVEACCUMULATED
- 189 -

STATE OF ARIZONACOMBINING STATEMENT OF CASH FLOWSINTERNAL SERVICE FUNDSFOR THE YEAR ENDED JUNE 30, 2014(Expressed in Thousands)
EMPLOYEE TELE-BENEFITS COMMUNICATION
CASH FLOWS FROM OPERATING ACTIVITIES Receipts from interfund services / premiums $ 103,737 $ 27,346 $ 824,336 $ 1,349 Payments to suppliers or insurance companies (84,783) (14,365) (738,966) (827) Payments to employees (12,470) (13,339) (2,642) (997) Payments to retirees - - - - Other receipts - 54 - - Net Cash Provided (Used) by Operating Activities 6,484 (304) 82,728 (475)
CASH FLOWS FROM NON-CAPITAL FINANCING ACTIVITIES Transfers to other Funds (2,454) (192) (73,761) (52) Net Cash (Used) by Non-capital Financing Activities (2,454) (192) (73,761) (52)
CASH FLOWS FROM CAPITAL AND RELATED FINANCING ACTIVITIES Proceeds from sale of capital assets - 968 - 47 Receipts from insurance recoveries - 90 - - Acquisition and construction of capital assets - (6) (10) - Net Cash Provided (Used) by Capital and Related Financing Activities - 1,052 (10) 47
CASH FLOWS FROM INVESTING ACTIVITIES Interest and dividends from investments - 6 - - Net Cash Provided by Investing Activities - 6 - -
Net Increase (Decrease) in Cash and Cash Equivalents 4,030 562 8,957 (480) Cash and Cash Equivalents - Beginning 70,163 413 324,604 1,374
Cash and Cash Equivalents - Ending $ 74,193 $ 975 $ 333,561 $ 894
Reconciliation of operating income (loss) to net cash provided (used) by operating activities: Operating income (loss) $ (10,925) $ (11,097) $ 63,663 $ (998) Adjustments to reconcile operating income (loss) to net cash provided (used) by operating activities: Depreciation and amortization 41 10,080 5 525 Miscellaneous income - - - - Net changes in assets and liabilities: (Increase) decrease in receivables, net of allowances - 20 (1,240) - Decrease in due from U.S. Government - - 1,800 - (Increase) decrease in due from other Funds 4 - 2 - (Increase) decrease in inventories, at cost - 567 - - (Increase) decrease in other assets (109) - 4 - Increase (decrease) in accounts payable (1,384) (4) 18,529 105 Increase (decrease) in accrued liabilities 51 63 - 8 Increase (decrease) in due to other Funds (15,337) - 4 (120) (Decrease) in unearned revenues - - - - Increase in accrued insurance losses 33,714 - - - Increase (decrease) in other liabilities 429 67 (39) 5
Net Cash Provided (Used) by Operating Activities $ 6,484 $ (304) $ 82,728 $ (475)
SCHEDULE OF NONCASH INVESTING, CAPITAL AND NON-CAPITAL FINANCING ACTIVITIES Contribution of capital assets from other Funds $ - $ 19,121 $ - $ - Total Noncash Investing, Capital and Non-capital Financing Activities $ - $ 19,121 $ - $ -
RISK TRANSPORTATIONMANAGEMENT EQUIPMENT
- 190 -

RETIREEMOTOR
SICK LEAVE POOL TOTAL
$ 29,045 $ 13,095 $ 8,889 $ 1,007,797 (8,645) (4) (6,273) (853,863) (8,444) (68) (891) (38,851)
- (12,172) - (12,172) - - 221 275
11,956 851 1,946 103,186
(8,671) (88) (72) (85,290) (8,671) (88) (72) (85,290)
109 - 221 1,345 - - - 90
(76) - (1,951) (2,043)
33 - (1,730) (608)
- - - 6 - - - 6
3,318 763 144 17,294 10,730 2,040 468 409,792
$ 14,048 $ 2,803 $ 612 $ 427,086
$ 8,483 $ (1,918) $ 115 $ 47,323
1,531 - 1,491 13,673 - - 221 221
649 - 13 (558) - - - 1,800
111 - (55) 62 - - (18) 549
141 - 3 39 1,030 - 207 18,483
37 - (2) 157 (4) - (19) (15,476)
(13) - - (13) - - - 33,714
(9) 2,769 (10) 3,212
$ 11,956 $ 851 $ 1,946 $ 103,186
$ 844 $ - $ 792 $ 20,757
$ 844 $ - $ 792 $ 20,757
AUTOMATIONOPERATIONS
ACCUMULATED
- 191 -


PENSION AND OTHER EMPLOYEE BENEFIT TRUST FUNDS
Pension Trust Funds account for transactions of the four public employee retirement systems for which the State acts as trustee. The Arizona State Retirement System (ASRS) is a cost-sharing, multiple-employer pension system that benefits employees of public schools, the State and its political subdivisions. The Public Safety Personnel Retirement System (PSPRS) is an agent multiple-employer pension system that benefits fire fighters and police officers employed by the State and its political subdivisions. The Elected Officials' Retirement Plan (EORP) is a cost-sharing, multiple-employer pension plan that benefits all elected State and county officials and judges and certain elected city officials. The Corrections Officer Retirement Plan (CORP) is an agent multiple-employer pension plan that benefits town, city and county detention officers and certain employees of the State’s Department of Corrections and Department of Juvenile Corrections. The Administrative Office of the Courts Probation Officers (AOC) is a cost-sharing, multiple-employer pension plan within CORP that benefits county probation officers. Other Employee Benefit Trust Funds account for health insurance premium subsidies paid by the ASRS, PSPRS, EORP, CORP, and AOC, as well as long-term disability benefits paid by the ASRS to State employees and employees of other governmental entities participating in the plans. The ASRS Health Benefit Supplement Fund is a benefit cost-sharing, multiple-employer post-employment benefit plan that provides for health insurance premium subsidies to eligible retired and disabled members. The ASRS Long-Term Disability Fund is a benefit cost-sharing, multiple-employer post-employment benefit plan that provides for long term disability benefits to eligible participants. The PSPRS Health Benefit Supplement Fund is a benefit agent multiple-employer post-employment benefit plan that provides for health insurance premium subsidies to eligible retired and disabled members. The EORP Health Benefit Supplement Fund is a benefit cost-sharing, multiple-employer post-employment benefit plan that provides for health insurance premium subsidies to eligible retired and disabled members. The CORP Health Benefit Supplement Fund is a benefit agent multiple-employer post-employment benefit plan that provides for health insurance premium subsidies to eligible retired and disabled members. The AOC Health Benefit Supplement Fund is a benefit cost-sharing, multiple-employer post-employment benefit plan that provides for health insurance premium subsidies to eligible retired and disabled members.
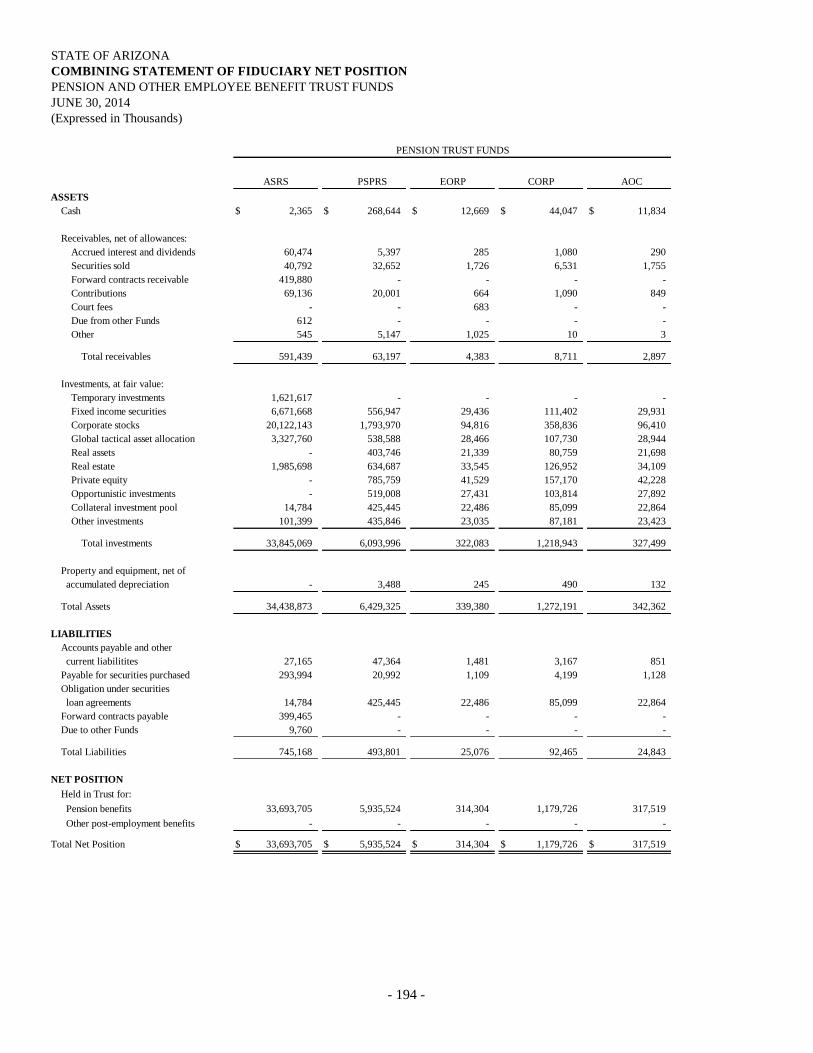
STATE OF ARIZONACOMBINING STATEMENT OF FIDUCIARY NET POSITIONPENSION AND OTHER EMPLOYEE BENEFIT TRUST FUNDSJUNE 30, 2014(Expressed in Thousands)
PENSION TRUST FUNDS
ASRS PSPRS EORP CORP AOCASSETS Cash $ 2,365 $ 268,644 $ 12,669 $ 44,047 $ 11,834
Receivables, net of allowances: Accrued interest and dividends 60,474 5,397 285 1,080 290 Securities sold 40,792 32,652 1,726 6,531 1,755 Forward contracts receivable 419,880 - - - - Contributions 69,136 20,001 664 1,090 849 Court fees - - 683 - - Due from other Funds 612 - - - - Other 545 5,147 1,025 10 3
Total receivables 591,439 63,197 4,383 8,711 2,897
Investments, at fair value: Temporary investments 1,621,617 - - - - Fixed income securities 6,671,668 556,947 29,436 111,402 29,931 Corporate stocks 20,122,143 1,793,970 94,816 358,836 96,410 Global tactical asset allocation 3,327,760 538,588 28,466 107,730 28,944 Real assets - 403,746 21,339 80,759 21,698 Real estate 1,985,698 634,687 33,545 126,952 34,109 Private equity - 785,759 41,529 157,170 42,228 Opportunistic investments - 519,008 27,431 103,814 27,892 Collateral investment pool 14,784 425,445 22,486 85,099 22,864 Other investments 101,399 435,846 23,035 87,181 23,423
Total investments 33,845,069 6,093,996 322,083 1,218,943 327,499
Property and equipment, net of accumulated depreciation - 3,488 245 490 132
Total Assets 34,438,873 6,429,325 339,380 1,272,191 342,362
LIABILITIES Accounts payable and other current liabilitites 27,165 47,364 1,481 3,167 851 Payable for securities purchased 293,994 20,992 1,109 4,199 1,128 Obligation under securities loan agreements 14,784 425,445 22,486 85,099 22,864 Forward contracts payable 399,465 - - - - Due to other Funds 9,760 - - - -
Total Liabilities 745,168 493,801 25,076 92,465 24,843
NET POSITION Held in Trust for: Pension benefits 33,693,705 5,935,524 314,304 1,179,726 317,519 Other post-employment benefits - - - - -
Total Net Position $ 33,693,705 $ 5,935,524 $ 314,304 $ 1,179,726 $ 317,519
- 194 -
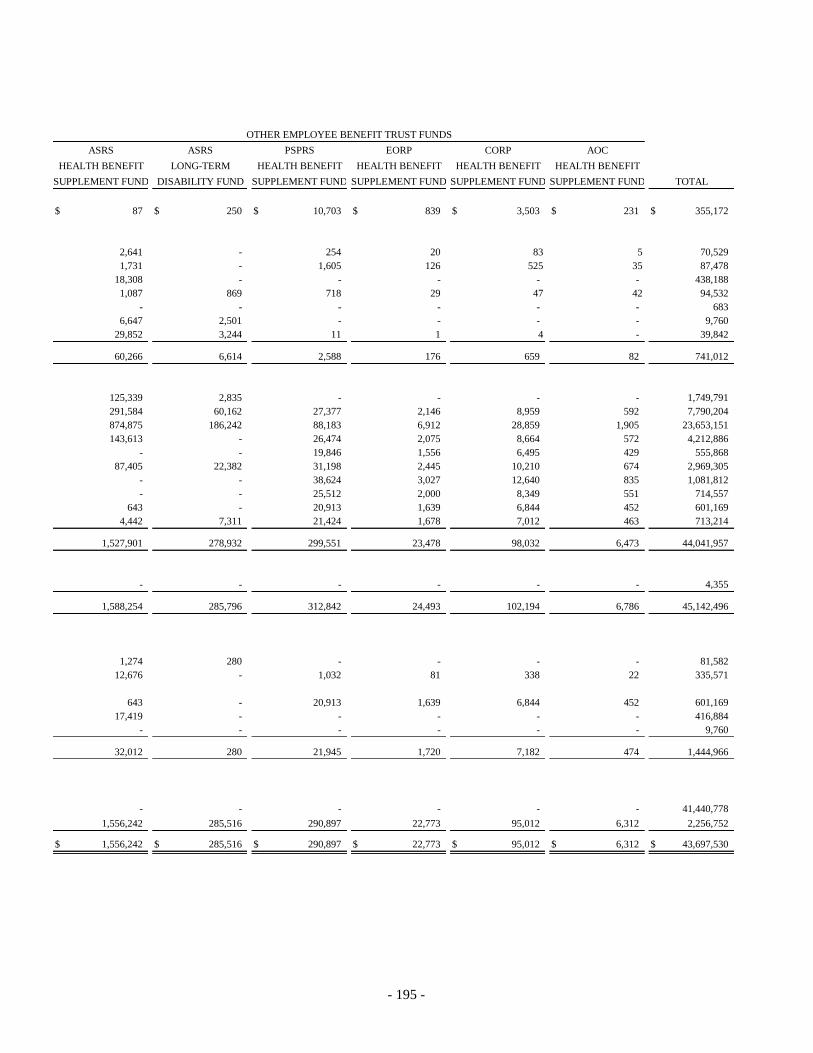
TOTAL
$ 87 $ 250 $ 10,703 $ 839 $ 3,503 $ 231 $ 355,172
2,641 - 254 20 83 5 70,529 1,731 - 1,605 126 525 35 87,478
18,308 - - - - - 438,188 1,087 869 718 29 47 42 94,532
- - - - - - 683 6,647 2,501 - - - - 9,760
29,852 3,244 11 1 4 - 39,842
60,266 6,614 2,588 176 659 82 741,012
125,339 2,835 - - - - 1,749,791 291,584 60,162 27,377 2,146 8,959 592 7,790,204 874,875 186,242 88,183 6,912 28,859 1,905 23,653,151 143,613 - 26,474 2,075 8,664 572 4,212,886
- - 19,846 1,556 6,495 429 555,868 87,405 22,382 31,198 2,445 10,210 674 2,969,305
- - 38,624 3,027 12,640 835 1,081,812 - - 25,512 2,000 8,349 551 714,557
643 - 20,913 1,639 6,844 452 601,169 4,442 7,311 21,424 1,678 7,012 463 713,214
1,527,901 278,932 299,551 23,478 98,032 6,473 44,041,957
- - - - - - 4,355
1,588,254 285,796 312,842 24,493 102,194 6,786 45,142,496
1,274 280 - - - - 81,582 12,676 - 1,032 81 338 22 335,571
643 - 20,913 1,639 6,844 452 601,169 17,419 - - - - - 416,884
- - - - - - 9,760
32,012 280 21,945 1,720 7,182 474 1,444,966
- - - - - - 41,440,778 1,556,242 285,516 290,897 22,773 95,012 6,312 2,256,752
$ 1,556,242 $ 285,516 $ 290,897 $ 22,773 $ 95,012 $ 6,312 $ 43,697,530
SUPPLEMENT FUNDHEALTH BENEFIT LONG-TERM HEALTH BENEFIT HEALTH BENEFIT HEALTH BENEFIT HEALTH BENEFIT
SUPPLEMENT FUND DISABILITY FUND SUPPLEMENT FUND SUPPLEMENT FUND SUPPLEMENT FUND
OTHER EMPLOYEE BENEFIT TRUST FUNDSASRS ASRS PSPRS EORP CORP AOC
- 195 -

STATE OF ARIZONACOMBINING STATEMENT OF CHANGES IN FIDUCIARY NET POSITIONPENSION AND OTHER EMPLOYEE BENEFIT TRUST FUNDSFOR THE YEAR ENDED JUNE 30, 2014(Expressed in Thousands)
PENSION TRUST FUNDS
ASRS PSPRS EORP CORP AOCADDITIONS: Member contributions $ 995,284 $ 141,066 $ 8,938 $ 42,697 $ 9,039 Employer contributions 965,969 413,846 16,287 62,246 15,552 Non-employer entity contributions - - 5,000 - - Member purchase of service credit 32,441 10,957 51 373 93 Court fees - - 8,541 - -
Investment income: Net increase in fair value of investments 5,114,686 736,692 39,564 148,194 38,129 Interest income 185,226 7,074 379 1,423 366 Dividends 338,194 41,812 2,237 8,414 2,165 Other investment income 17,949 55,200 2,956 11,094 2,854 Securities lending income 2,196 1,937 103 390 100 Total investment income 5,658,251 842,715 45,239 169,515 43,614
Less investment expenses: Investment activity expenses 143,731 118,998 6,319 24,023 6,181 Securities lending expenses 274 290 15 58 15 Net investment income 5,514,246 723,427 38,905 145,434 37,418
Other additions 1,044 775 116 44 253
Total Additions 7,508,984 1,290,071 77,838 250,794 62,355
DEDUCTIONS: Retirement, disability, and survivor benefits 2,566,372 612,105 53,984 91,319 15,768 Health insurance subsidy - - - - - Refunds to withdrawing members, including interest 246,201 14,435 155 29,132 1,315 Administrative expense 26,107 5,826 316 1,143 294 Other deductions 2,029 50 23 437 61
Total Deductions 2,840,709 632,416 54,478 122,031 17,438
Change in net position held in trust for: Pension benefits 4,668,275 657,655 23,360 128,763 44,917 Other post-employment benefits - - - - - Net Position - Beginning 29,025,430 5,277,869 290,944 1,050,963 272,602
Net Position - Ending $ 33,693,705 $ 5,935,524 $ 314,304 $ 1,179,726 $ 317,519
- 196 -

TOTAL
$ - $ 21,151 $ - $ - $ - $ - $ 1,218,175 53,405 21,628 19,534 1,072 5,477 1,204 1,576,220
- - - - - - 5,000 - - - - - - 43,915 - - - - - - 8,541
223,003 45,231 34,372 2,708 11,186 701 6,394,466 8,040 - 330 26 107 7 202,978
14,703 - 1,951 153 635 40 410,304 779 - 2,575 202 837 52 94,498 95 - 90 7 29 2 4,949
246,620 45,231 39,318 3,096 12,794 802 7,107,195
6,071 281 5,552 432 1,813 114 313,515 11 - 13 1 4 - 681
240,538 44,950 33,753 2,663 10,977 688 6,792,999
29,848 - - - - - 32,080
323,791 87,729 53,287 3,735 16,454 1,892 9,676,930
101,746 62,044 - - - - 3,503,338 - - 13,578 951 2,728 309 17,566
- - - - - - 291,238 1,137 2,542 - - - - 37,365
- 247 - - - - 2,847
102,883 64,833 13,578 951 2,728 309 3,852,354
- - - - - - 5,522,970 220,908 22,896 39,709 2,784 13,726 1,583 301,606
1,335,334 262,620 251,188 19,989 81,286 4,729 37,872,954
$ 1,556,242 $ 285,516 $ 290,897 $ 22,773 $ 95,012 $ 6,312 $ 43,697,530
SUPPLEMENT FUNDHEALTH BENEFIT LONG-TERM HEALTH BENEFIT HEALTH BENEFIT HEALTH BENEFIT HEALTH BENEFIT
SUPPLEMENT FUND DISABILITY FUND SUPPLEMENT FUND SUPPLEMENT FUND SUPPLEMENT FUND
OTHER EMPLOYEE BENEFIT TRUST FUNDSASRS ASRS PSPRS EORP CORP AOC
- 197 -

INVESTMENT TRUST FUNDS Investment Trust Funds account for assets held by the State Treasurer in a trustee capacity for local governments and political subdivisions of the State of Arizona which have elected to invest cash with the State Treasurer’s Office. Central Arizona Water Conservation District is an Investment Trust Account composed of corporate debt, money market mutual funds, and United States Government securities. The Central Arizona Water Conservation District is the only participant in the account. Local Government Investment Pool is an Investment Trust Account composed of corporate debt, money market mutual funds, certificates of deposit, repurchase agreements, and United States Government securities. Local Government Investment Pool – Medium-Term is an Investment Trust Account for participants who want to invest their monies for a longer time period composed of corporate notes, money market mutual funds, certificates of deposit, repurchase agreements, and United States Government securities. Local Government Investment Pool – FF&C is an Investment Trust Account composed of corporate notes, repurchase agreements, and United States Government securities. All investments of the fund are backed by the full faith and credit of the United States Government. Local Government Investment Pool – Medium-Term FF&C is an Investment Trust Account for participants who want to invest their monies for a longer time period composed of corporate notes, money market mutual funds, certificates of deposit, repurchase agreements, and United States Government securities. All investments of the fund are backed by the full faith and credit of the United States Government. Lehman Brothers Pool is an Investment Trust Account composed of the Local Government Investment Pool’s share of the Lehman Brothers bond value that was transferred to this pool due to Lehman Brothers filing for Chapter 11 bankruptcy. The transfer was made to provide for the decline in fair value of the Lehman Brothers securities held by the Local Government Investment Pool.

STATE OF ARIZONACOMBINING STATEMENT OF FIDUCIARY NET POSITIONINVESTMENT TRUST FUNDSJUNE 30, 2014(Expressed in Thousands)
ASSETS Cash and pooled investments with State Treasurer $ - $ 19,000 $ - $ 2,000 $ -
Receivables, net of allowances: Accrued interest and dividends 1,088 453 619 519 358
Investments, at fair value: Fixed income securities 301,130 1,060,944 254,201 934,704 164,856 Collateral investment pool 5,150 86 11,479 - - Total investments 306,280 1,061,030 265,680 934,704 164,856
Total Assets 307,368 1,080,483 266,299 937,223 165,214
LIABILITIES Management fee payable 13 58 11 47 8 Obligations under securities loan agreements 5,150 86 11,479 - -
Total Liabilities 5,163 144 11,490 47 8
NET POSITION Held in trust for pool participants $ 302,205 $ 1,080,339 $ 254,809 $ 937,176 $ 165,206
Net position consist of: Participant shares outstanding 299,310 1,080,339 246,505 937,176 164,085
Participants' net position value (net position/shares outstanding) $ 1.01 $ 1.00 $ 1.03 $ 1.00 $ 1.01
LOCALCENTRAL LOCAL LOCAL GOVERNMENTARIZONA LOCAL GOVERNMENT GOVERNMENT INVESTMENTWATER GOVERNMENT INVESTMENT INVESTMENT POOL -
CONSERVATION INVESTMENT POOL - POOL - MEDIUM-TERMDISTRICT POOL MEDIUM-TERM FF&C FF&C
- 200 -
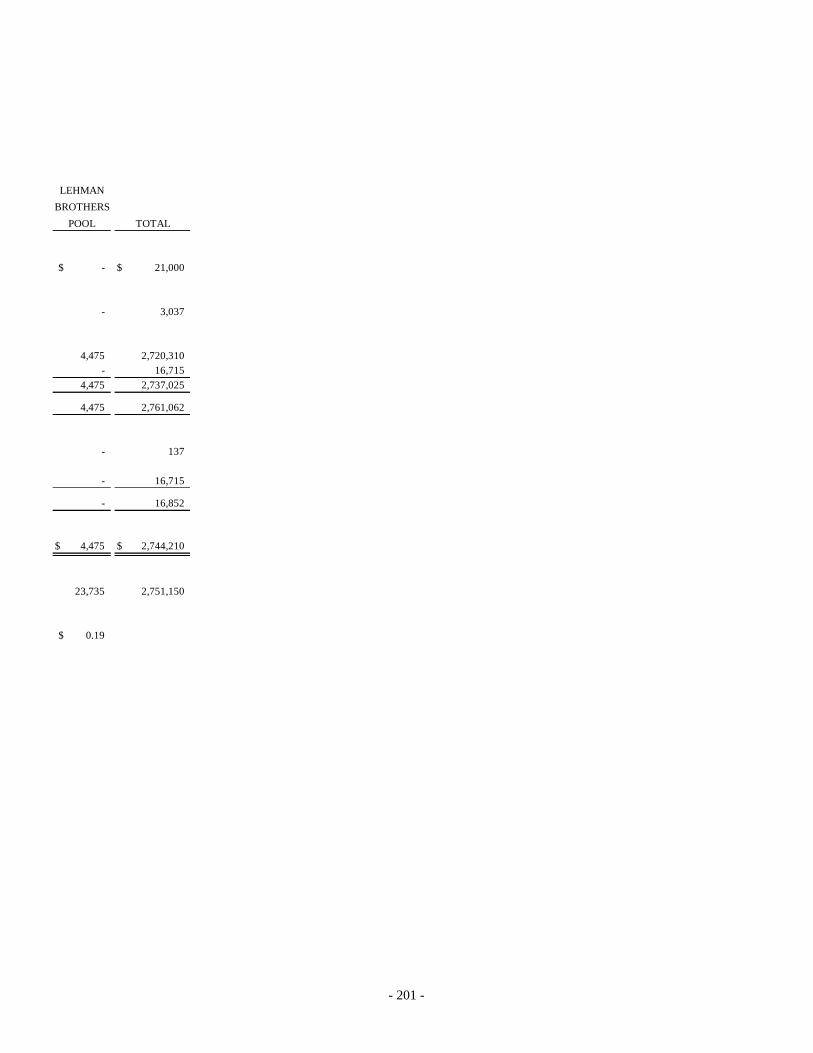
TOTAL
$ - $ 21,000
- 3,037
4,475 2,720,310 - 16,715
4,475 2,737,025
4,475 2,761,062
- 137
- 16,715
- 16,852
$ 4,475 $ 2,744,210
23,735 2,751,150
$ 0.19
LEHMAN
POOLBROTHERS
- 201 -

STATE OF ARIZONACOMBINING STATEMENT OF CHANGES IN FIDUCIARY NET POSITIONINVESTMENT TRUST FUNDSFOR THE YEAR ENDED JUNE 30, 2014(Expressed in Thousands)
ADDITIONS: Investment income: Net increase (decrease) in fair value of investments $ (93) $ 39 $ 982 $ 6 $ 333 Interest income 5,400 2,102 3,548 979 2,447 Securities lending income 15 1 14 153 4 Total investment income 5,322 2,142 4,544 1,138 2,784
Less: Investment activity expenses Investment activity expenses 159 707 137 538 98 Securities lending expenses 7 - 7 77 2 Net investment income 5,156 1,435 4,400 523 2,684
Capital share and individual account transactions: Shares sold 35,336 2,590,664 55,317 1,666,128 5,582 Reinvested interest income 5,414 1,403 2,866 500 1,648 Shares redeemed (25,510) (2,678,445) (47,216) (1,818,401) (19,531) Transfers in (out) - 3,962 - - - Net capital share and individual account transactions 15,240 (82,416) 10,967 (151,773) (12,301)
Total Additions 20,396 (80,981) 15,367 (151,250) (9,617)
DEDUCTIONS: Dividends to investors 5,156 1,435 4,400 523 2,684
Total Deductions 5,156 1,435 4,400 523 2,684
Change in net position held in trust for pool participants 15,240 (82,416) 10,967 (151,773) (12,301) Net Position - Beginning 286,965 1,162,755 243,842 1,088,949 177,507
Net Position - Ending $ 302,205 $ 1,080,339 $ 254,809 $ 937,176 $ 165,206
DISTRICT POOL MEDIUM-TERM POOL - FF&C FF&C
ARIZONA WATER GOVERNMENT INVESTMENT GOVERNMENT POOL -CONSERVATION INVESTMENT POOL - INVESTMENT MEDIUM-TERM
LOCALLOCAL GOVERNMENT
CENTRAL LOCAL GOVERNMENT LOCAL INVESTMENT
- 202 -

$ 1,751 $ 3,018 - 14,476 - 187
1,751 17,681
- 1,639 - 93
1,751 15,949
- 4,353,027 - 11,831 - (4,589,103)
(3,962) -
(3,962) (224,245)
(2,211) (208,296)
- 14,198
- 14,198
(2,211) (222,494) 6,686 2,966,704
$ 4,475 $ 2,744,210
TOTALPOOLBROTHERS
LEHMAN
- 203 -


AGENCY FUNDS Agency Funds account for the receipt and disbursement of various taxes, deposits, deductions, property collected by the State, where the State acts as an agent for distribution to other governmental units or organizations. The Treasurer Custodial Securities Fund consists of securities held by the State Treasurer for various State agencies as required by statute. The Other Treasurer Funds account for other various deposits that are required to be made by other governmental units or organizations with the State Treasurer. The Other Funds consist of various funds where the State acts as an agent for distribution to other governmental units or organizations.


STATE OF ARIZONACOMBINING STATEMENT OF ASSETS AND LIABILITIESAGENCY FUNDSJUNE 30, 2014(Expressed in Thousands)
TREASURER OTHERCUSTODIAL TREASURER OTHER
SECURITIES FUND FUNDS FUNDS TOTALASSETS Cash $ - $ - $ 50,315 $ 50,315 Cash and pooled investments with State Treasurer - 11,685 58,195 69,880 Short-term investments - - 8,236 8,236 Receivables, net of allowances: Accrued interest - - 1 1 Other - - 2 2 Due from others - - 82,589 82,589 Custodial securities in safekeeping 3,805,147 - 41,343 3,846,490 Other assets - - 1,658 1,658
Total Assets $ 3,805,147 $ 11,685 $ 242,339 $ 4,059,171
LIABILITIES Due to local governments $ - $ 48 $ 964 $ 1,012 Due to others 3,805,147 11,637 241,375 4,058,159
Total Liabilities $ 3,805,147 $ 11,685 $ 242,339 $ 4,059,171
- 207 -

STATE OF ARIZONACOMBINING STATEMENT OF CHANGES IN ASSETS AND LIABILITIESAGENCY FUNDSFOR THE YEAR ENDED JUNE 30, 2014(Expressed in Thousands)
ADDITIONS DELETIONS JUNE 30, 2014
TREASURER CUSTODIAL SECURITIES FUND Assets: Custodial securities in safekeeping $ 3,560,332 $ 6,173,677 $ 5,928,862 $ 3,805,147
Total Assets $ 3,560,332 $ 6,173,677 $ 5,928,862 $ 3,805,147
Liabilities: Due to others $ 3,560,332 $ 6,173,677 $ 5,928,862 $ 3,805,147
Total Liabilities $ 3,560,332 $ 6,173,677 $ 5,928,862 $ 3,805,147
OTHER TREASURER FUNDS Assets: Cash and pooled investments with State Treasurer $ 15,001 $ 108,586 $ 111,902 $ 11,685
Total Assets $ 15,001 $ 108,586 $ 111,902 $ 11,685
Liabilities: Due to local governments $ 48 $ 93,145 $ 93,145 $ 48 Due to others 14,953 24,998 28,314 11,637
Total Liabilities $ 15,001 $ 118,143 $ 121,459 $ 11,685
OTHER FUNDS Assets: Cash $ 53,684 $ 790,520 $ 793,889 $ 50,315 Cash and pooled investments with State Treasurer 213,836 1,802,067 1,957,708 58,195 Short-term investments 3,392 8,236 3,392 8,236 Receivables, net of allowances: Accrued interest 1 - - 1 Other 2 2 2 2 Due from others 82,552 82,589 82,552 82,589 Custodial securities in safekeeping 39,905 41,343 39,905 41,343 Other assets 1,782 1,658 1,782 1,658
Total Assets $ 395,154 $ 2,726,415 $ 2,879,230 $ 242,339
Liabilities: Due to local governments $ 153,475 $ 2,512,876 $ 2,665,387 $ 964 Due to others 241,679 1,119,762 1,120,066 241,375
Total Liabilities $ 395,154 $ 3,632,638 $ 3,785,453 $ 242,339
(Continued)
BALANCE BALANCEJULY 1, 2013
- 208 -

STATE OF ARIZONACOMBINING STATEMENT OF CHANGES IN ASSETS AND LIABILITIESAGENCY FUNDSFOR THE YEAR ENDED JUNE 30, 2014(Expressed in Thousands)
ADDITIONS DELETIONSCOMBINED TOTAL ALL AGENCY FUNDS Assets: Cash $ 53,684 $ 790,520 $ 793,889 $ 50,315 Cash and pooled investments with State Treasurer 228,837 1,910,653 2,069,610 69,880 Short-term investments 3,392 8,236 3,392 8,236 Receivables, net of allowances: Accrued interest 1 - - 1 Other 2 2 2 2 Due from others 82,552 82,589 82,552 82,589 Custodial securities in safekeeping 3,600,237 6,215,020 5,968,767 3,846,490 Other assets 1,782 1,658 1,782 1,658
Total Assets $ 3,970,487 $ 9,008,678 $ 8,919,994 $ 4,059,171
Liabilities: Due to local governments $ 153,523 $ 2,606,021 $ 2,758,532 $ 1,012 Due to others 3,816,964 7,318,437 7,077,242 4,058,159
Total Liabilities $ 3,970,487 $ 9,924,458 $ 9,835,774 $ 4,059,171
JULY 1, 2013 JUNE 30, 2014BALANCE BALANCE
- 209 -


NON-MAJOR COMPONENT UNITS
Component units are legally separate entities for which the State is considered to be financially accountable. GASB has set forth criteria to be considered in determining financial accountability. These criteria include appointing a voting majority of an organization’s governing body and (1) the ability of the State to impose its will on that organization or (2) the potential for the organization to provide specific financial benefits to, or impose specific financial burdens on, the State. The Arizona Power Authority purchases the State’s allocation of power produced at the federally owned Boulder Canyon Project hydropower plant and resells it to Arizona entities that are eligible purchasers under federal and state laws.
The Rio Nuevo Multipurpose Facilities District (Rio Nuevo) utilizes tax incremental financing to help develop multipurpose facilities in the downtown Tucson area.
The Greater Arizona Development Authority provides cost-effective access to capital for local communities, certain special districts, and tribal governments for public infrastructure projects.
The Arizona Commerce Authority is charged with the following responsibilities: job creation and expansion of capital investment through business attraction, expansion and retention, including business incubation and entrepreneurship; creation, monitoring, and execution of a comprehensive economic and workforce strategy; management and administration of economic development and workforce programs; providing statewide marketing leadership; utilization of all means necessary, prudent and practical to integrate private sector-based innovation, flexibility, focus and responsiveness; and advancement of public policy to meet the State’s economic development objectives.

STATE OF ARIZONACOMBINING STATEMENT OF NET POSITIONNON-MAJOR COMPONENT UNITSJUNE 30, 2014(Expressed in Thousands)
ARIZONA GREATER AZ ARIZONAPOWER RIO DEVELOPMENT COMMERCE
AUTHORITY NUEVO AUTHORITY AUTHORITY TOTALASSETS Current Assets: Cash $ - $ 13,926 $ - $ 9,945 $ 23,871 Cash and pooled investments with State Treasurer 5,908 - 1,306 120,780 127,994 Collateral investment pool - - - 2,452 2,452 Restricted investments held by trustee 5,343 - - - 5,343 Receivables, net of allowances: Taxes - 2,672 - - 2,672 Interest - - 15 - 15 Loans and notes - - - 1,673 1,673 Other 3,151 45 - 887 4,083 Other current assets 922 1,032 - 440 2,394 Total Current Assets 15,324 17,675 1,321 136,177 170,497
Noncurrent Assets: Restricted assets: Cash and pooled investments with State Treasurer - - 11,965 - 11,965 Cash held by trustee - 17,342 - - 17,342 Investments held by trustee 7,757 - - - 7,757 Loans and notes receivable, net of allowances - 16,482 - 6,657 23,139 Other noncurrent assets 599 - - 7 606 Capital assets: Land and other non-depreciable - 11,277 - - 11,277 Buildings, equipment, and other depreciable, net of accumulated depreciation 93 25,155 - 758 26,006 Total Noncurrent Assets 8,449 70,256 11,965 7,422 98,092
Total Assets 23,773 87,931 13,286 143,599 268,589
DEFERRED OUTFLOWS OF RESOURCES 33,791 - - - 33,791
LIABILITIES Current Liabilities: Accounts payable and other current liabilities 2,583 8,332 - 731 11,646 Accrued liabilities 613 30 7 - 650 Obligations under securities loan agreements - - - 2,452 2,452 Current portion of long-term debt 5,330 4,830 - - 10,160 Total Current Liabilities 8,526 13,192 7 3,183 24,908
Noncurrent Liabilities: Long-term debt 44,397 72,611 - - 117,008 Total Noncurrent Liabilities 44,397 72,611 - - 117,008
Total Liabilities 52,923 85,803 7 3,183 141,916
NET POSITION Net investment in capital assets 93 33,178 - 758 34,029 Restricted for: Debt service 13,100 10,254 11,965 - 35,319 Loans and other financial assistance - - - 58,593 58,593 Other - - - 22,596 22,596 Unrestricted (8,552) (41,304) 1,314 58,469 9,927
Total Net Position $ 4,641 $ 2,128 $ 13,279 $ 140,416 $ 160,464
- 212 -

(This page intentionally left blank)

STATE OF ARIZONACOMBINING STATEMENT OF ACTIVITIESNON-MAJOR COMPONENT UNITSFOR THE YEAR ENDED JUNE 30, 2014(Expressed in Thousands)
CHARGES FOR GRANTS ANDEXPENSES SERVICES CONTRIBUTIONS
FUNCTIONS/PROGRAMSArizona Power Authority $ 28,411 $ 27,744 $ - Rio Nuevo 6,687 1,376 - Greater Arizona Development Authority 90 - - Arizona Commerce Authority 24,959 844 8,072
Total $ 60,147 $ 29,964 $ 8,072
General Revenues: Taxes: Sales Other Unrestricted investment earnings Unrestricted grants and contributions Payments from State of Arizona Miscellaneous Change in Net Position Net Position - Beginning, as restated
Net Position - Ending
PROGRAM REVENUESOPERATING
- 214 -

ARIZONA GREATER AZ ARIZONAPOWER DEVELOPMENT COMMERCE
AUTHORITY RIO NUEVO AUTHORITY AUTHORITY TOTAL
$ (667) $ - $ - $ - $ (667) - (5,311) - - (5,311) - - (90) - (90) - - - (16,043) (16,043)
- 9,117 - - 9,117 - - - 12,637 12,637 8 54 210 997 1,269 - - - 57 57 - - - 36,924 36,924
17 - - - 17 (642) 3,860 120 34,572 37,910
5,283 (1,732) 13,159 105,844 122,554
$ 4,641 $ 2,128 $ 13,279 $ 140,416 $ 160,464
NET (EXPENSE) REVENUE AND CHANGES IN NET POSITION
- 215 -


NON-MAJOR UNIVERSITIES – AFFILIATED COMPONENT UNITS
Component units of the State affiliated with the Universities are legally separate, tax-exempt organizations controlled by separate boards of directors that meet the criteria established in GASB, with the exception of Downtown Phoenix Student Housing, LLC, the ASU Preparatory Academy, Inc. (ASU Prep) – formerly known as the University Public Schools, Inc., and Campus Research Corporation (CRC). The Downtown Phoenix Student Housing, LLC is included due to the nature and significance of the financial arrangement that it has with the State and that the State believes would be misleading to exclude. The ASU Prep is included because of its close affiliation to the State and that the State believes it would be misleading to exclude. The CRC is included because the U of A approves the budget and can access its resources.
The Northern Arizona University Foundation receives gifts and bequests, administers and invests securities and property, and disburses payments to and on behalf of the NAU for advancement of its mission.
Sun Angel Foundation receives funds primarily through donations, and contributes funds to the ASU for support of various athletic programs.
Sun Angel Endowment receives funds primarily through donations, with the annual earnings being used for support of various athletic programs at the ASU.
Arizona State University Research Park, Inc. manages a research park to promote and support research activities in coordination with the ASU.
The Arizona State University Alumni Association receives funds primarily through donations, dues, and affinity partners and contributes funds to the ASU for support of various programs.
Downtown Phoenix Student Housing, LLC provides facilities for use by students of the ASU.
The Arizona State University Preparatory Academy, Inc. participates with the ASU faculty and staff in implementing various educational innovations in the form of teaching methods, teacher preparation, curriculum, and educational research.
The University of Arizona Law College Association (Law Association) was established to provide support and financial assistance to the College of Law at the U of A. The Law Association funds provide support to the College on many levels, from endowed student scholarships to named faculty professorships.
The University of Arizona Campus Research Corporation was established to assist the U of A in the acquisition, improvement, and operation of the U of A Science and Technology Park and related properties.
The University of Arizona Alumni Association was established to serve the U of A and its graduates, former students, and friends by attracting, organizing and encouraging them to advance the U of A's missions - teaching, research, and public service.
The University of Arizona Eller Executive Education was established to advance the missions of the Eller College of Management and the U of A through noncredit, non-degree programs for business, government, and nonprofit leaders.

STATE OF ARIZONACOMBINING STATEMENT OF FINANCIAL POSITIONNON-MAJOR UNIVERSITIES - AFFILIATED COMPONENT UNITSJUNE 30, 2014(Expressed in Thousands)
ARIZONA STATE ARIZONA STATENORTHERN ARIZONA UNIVERSITY UNIVERSITY
UNIVERSITY SUN ANGEL SUN ANGEL RESEARCH ALUMNIFOUNDATION FOUNDATION ENDOWMENT PARK, INC. ASSOCIATION
ASSETS Cash and cash equivalent investments $ 1,290 $ 2,849 $ 396 $ 1,817 $ 253
Receivables: Pledges receivable 7,059 5,025 - - 78 Other receivables 537 183 - 17,535 108 Total receivables 7,596 5,208 - 17,535 186
Investments: Investments in securities 129,783 - 8,545 1,291 16,357 Other investments 12,065 - 664 - - Total investments 141,848 - 9,209 1,291 16,357
Net direct financing leases 7,375 - - - - Property and equipment, net of accumulated depreciation - 10 - 5,029 - Other assets 964 172 31 2,554 42
Total Assets 159,073 8,239 9,636 28,226 16,838
LIABILITIES Accounts payable and accrued liabilities 146 443 5 130 106 Liability under endowment trust agreements 27,545 - - - - Long term debt - - - 7,000 - Deferred revenue 5,422 20 - 13,303 33 Other liabilities 2,001 - 4,000 1,546 12
Total Liabilities 35,114 463 4,005 21,979 151
NET ASSETS Permanently restricted 59,295 - 1,842 - - Temporarily restricted 52,378 7,287 841 - 302 Unrestricted (deficit) 12,286 489 2,948 6,247 16,385
Total Net Assets $ 123,959 $ 7,776 $ 5,631 $ 6,247 $ 16,687
- 218 -

DOWNTOWN ARIZONA STATE UNIVERSITY UNIVERSITY UNIVERSITYPHOENIX UNIVERSITY OF ARIZONA OF ARIZONA OF ARIZONASTUDENT PREPARATORY LAW COLLEGE CAMPUS RESEARCH ALUMNIHOUSING ACADEMY, INC. ASSOCIATION CORPORATION ASSOCIATION TOTAL
$ 1,398 $ 3,355 $ 804 $ 4,803 $ 1,354 $ 267 $ 18,586
- - 425 - 108 - 12,695 107 554 - 961 726 43 20,754 107 554 425 961 834 43 33,449
14,675 - 11,339 - 6,840 - 188,830 - - 188 - - - 12,917
14,675 - 11,527 - 6,840 - 201,747
- - - - - - 7,375
98,163 286 - 18,620 53 - 122,161 5,761 17 7 6,294 79 20 15,941
120,104 4,212 12,763 30,678 9,160 330 399,259
16,025 859 212 1,069 180 - 19,175
- - - - - - 27,545 139,783 181 - 6,654 28 - 153,646
11 1,523 - 3,267 2,385 - 25,964 1,961 500 11 765 - - 10,796
157,780 3,063 223 11,755 2,593 - 237,126
- - 4,643 - - - 65,780 - - 4,459 - - 192 65,459
(37,676) 1,149 3,438 18,923 6,567 138 30,894
$ (37,676) $ 1,149 $ 12,540 $ 18,923 $ 6,567 $ 330 $ 162,133
UNIVERSITYOF ARIZONA
ELLER EXECUTIVEEDUCATION
- 219 -

STATE OF ARIZONACOMBINING STATEMENT OF ACTIVITIESNON-MAJOR UNIVERSITIES - AFFILIATED COMPONENT UNITSFOR THE YEAR ENDED JUNE 30, 2014(Expressed in Thousands)
ARIZONA STATE ARIZONA STATENORTHERN ARIZONA UNIVERSITY UNIVERSITY
UNIVERSITY SUN ANGEL SUN ANGEL RESEARCH ALUMNIFOUNDATION FOUNDATION ENDOWMENT PARK, INC. ASSOCIATION
REVENUES Contributions $ 13,468 $ 15,068 $ - $ - $ 2,649 Rental revenue - - - 8,854 - Sales and services - 506 - - 2,321 Net investment income 16,538 10 655 5 2,173 Grants and aid - - - - - Other revenues 4,001 30 - 67 71
Total Revenues 34,007 15,614 655 8,926 7,214
EXPENSES Program services: Payments to Universities - 10,871 - 2,046 - Leasing related expenses - - - - - Payments on behalf of Universities - - - - - Other program services 7,178 - - - - Management and general expenses 517 1,426 113 1,023 5,340 Fundraising expenses 3,074 - - - - Interest - - 173 328 - Depreciation and amortization 1,176 - - 411 - Other expenses - 1,343 - 151 194
Total Expenses 11,945 13,640 286 3,959 5,534
Increase (decrease) in Net Assets, before extraordinary items 22,062 1,974 369 4,967 1,680
Extraordinary items (Primarily equity transfers) (472) - - - -
Increase (decrease) in Net Assets, after extraordinary items 21,590 1,974 369 4,967 1,680
Net Assets - Beginning, as restated 102,369 5,802 5,262 1,280 15,007
Net Assets - Ending $ 123,959 $ 7,776 $ 5,631 $ 6,247 $ 16,687
- 220 -
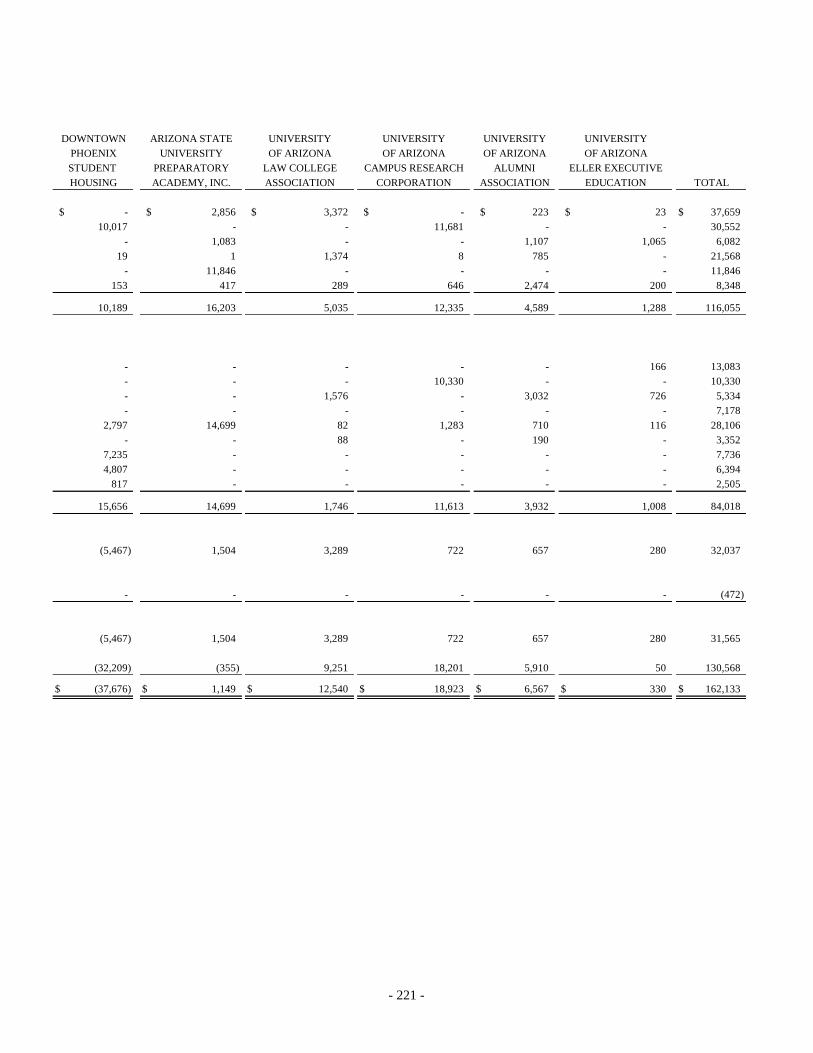
DOWNTOWN ARIZONA STATE UNIVERSITY UNIVERSITY UNIVERSITYPHOENIX UNIVERSITY OF ARIZONA OF ARIZONA OF ARIZONASTUDENT PREPARATORY LAW COLLEGE CAMPUS RESEARCH ALUMNIHOUSING ACADEMY, INC. ASSOCIATION CORPORATION ASSOCIATION TOTAL
$ - $ 2,856 $ 3,372 $ - $ 223 $ 23 $ 37,659 10,017 - - 11,681 - - 30,552
- 1,083 - - 1,107 1,065 6,082 19 1 1,374 8 785 - 21,568
- 11,846 - - - - 11,846 153 417 289 646 2,474 200 8,348
10,189 16,203 5,035 12,335 4,589 1,288 116,055
- - - - - 166 13,083 - - - 10,330 - - 10,330 - - 1,576 - 3,032 726 5,334 - - - - - - 7,178
2,797 14,699 82 1,283 710 116 28,106 - - 88 - 190 - 3,352
7,235 - - - - - 7,736 4,807 - - - - - 6,394
817 - - - - - 2,505
15,656 14,699 1,746 11,613 3,932 1,008 84,018
(5,467) 1,504 3,289 722 657 280 32,037
- - - - - - (472)
(5,467) 1,504 3,289 722 657 280 31,565
(32,209) (355) 9,251 18,201 5,910 50 130,568
$ (37,676) $ 1,149 $ 12,540 $ 18,923 $ 6,567 $ 330 $ 162,133
UNIVERSITYOF ARIZONA
ELLER EXECUTIVEEDUCATION
- 221 -


STATISTICAL SECTION (Not Covered by the Independent Auditors’ Report)

STATISTICAL SECTION

STATISTICAL SECTION This part of the State of Arizona’s Comprehensive Annual Financial Report presents detailed information as a context for understanding what the information in the financial statements, note disclosures, and required supplementary information says about the State’s overall financial health. Financial Trends – Schedules 1 thru 4 contain trend information to help the reader understand how the State’s financial performance and well-being have changed over time. Revenue Capacity – Schedules 5 thru 9 contain information to help the reader assess the State’s most significant own-source revenues, the sales tax, and personal income tax. Debt Capacity – Schedules 10 thru 22 present information to help the reader assess the affordability of the State’s current levels of outstanding debt and the State’s ability to issue additional debt in the future. Demographic and Economic Information – Schedules 23 and 24 offer demographic and economic indicators to help the reader understand the environment within which the State’s financial activities take place and to help make comparisons over time and among other governments. Operating Information – Schedules 25 thru 27 contain service and infrastructure data to help the reader understand how the information in the State’s financial report relates to the services the State provides and the activities it performs.

STATE OF ARIZONASCHEDULE 1NET POSITION BY COMPONENT (1)FOR THE LAST TEN FISCAL YEARSFISCAL YEAR ENDED JUNE 30, 2014(Expressed in Thousands)
GOVERNMENTAL ACTIVITIES: Net investment in capital assets $ 18,027,844 $ 17,410,055 $ 16,940,512 $ 16,326,569 $ 15,738,121 Restricted (3) 6,829,299 6,116,083 5,447,576 5,125,527 4,648,280 Unrestricted (2,663,019) (2,527,441) (3,351,315) (4,243,824) (4,155,346)
Total Governmental Activities Net Position $ 22,194,124 $ 20,998,697 $ 19,036,773 $ 17,208,272 $ 16,231,055
BUSINESS-TYPE ACTIVITIES: Net investment in capital assets (4) $ 1,581,436 $ 1,526,777 $ 1,483,416 $ 1,397,683 $ 1,352,658 Restricted 660,480 531,972 496,444 501,437 550,102 Unrestricted (2,4) 1,227,233 1,049,391 810,810 695,862 576,426
Total Business-type Activities Net Position $ 3,469,149 $ 3,108,140 $ 2,790,670 $ 2,594,982 $ 2,479,186
PRIMARY GOVERNMENT: Net investment in capital assets (4) $ 19,609,280 $ 18,936,832 $ 18,423,928 $ 17,724,252 $ 17,090,779 Restricted (3) 7,489,779 6,648,055 5,944,020 5,626,964 5,198,382 Unrestricted (2,4) (1,435,786) (1,478,050) (2,540,505) (3,547,962) (3,578,920)
Total Primary Government Net Position $ 25,663,273 $ 24,106,837 $ 21,827,443 $ 19,803,254 $ 18,710,241
(1) This schedule reports using the accrual basis of accounting.(2) Fiscal year 2012 unrestricted net position was restated as a result of GASB Statement No. 61 in which Northern Arizona Capital Facilities Corporation was reclassified from a discrete non-major university component unit to a blended university component unit.(3) Fiscal year 2012 restricted net position was restated as a result of an agency fund being reclassified to a special revenue fund.(4) Fiscal year 2013 unrestricted net position for the Universities was restated as a result of GASB Statement No. 65 to expense debt issuance costs.
2014 restated restated 2011 2010
Fiscal Year2013, as 2012, as
- 226 -

$ 15,094,719 $ 14,530,867 $ 13,500,218 $ 12,878,151 $ 11,825,9613,990,594 4,987,365 4,734,039 3,560,868 2,938,288
(2,984,628) (1,105,246) 614,606 733,455 (463,515)
$ 16,100,685 $ 18,412,986 $ 18,848,863 $ 17,172,474 $ 14,300,734
$ 1,328,658 $ 1,387,655 $ 1,186,177 $ 1,146,618 $ 1,172,6131,085,399 1,581,212 1,575,991 1,400,455 1,232,016
376,908 188,354 295,377 179,524 84,248
$ 2,790,965 $ 3,157,221 $ 3,057,545 $ 2,726,597 $ 2,488,877
$ 16,423,377 $ 15,918,522 $ 14,686,395 $ 14,024,769 $ 12,998,574 5,075,993 6,568,577 6,310,030 4,961,323 4,170,304
(2,607,720) (916,892) 909,983 912,979 (379,267)
$ 18,891,650 $ 21,570,207 $ 21,906,408 $ 19,899,071 $ 16,789,611
restated restated2006, as 2005, as
2009 2008 restated
Fiscal Year2007, as
- 227 -

STATE OF ARIZONASCHEDULE 2CHANGES IN NET POSITION (1)FOR THE LAST TEN FISCAL YEARSFISCAL YEAR ENDED JUNE 30, 2014(Expressed in Thousands)
EXPENSESGovernmental Activities: General government $ 763,830 $ 836,431 $ 840,189 $ 929,107 $ 941,813 Health and welfare 12,768,332 12,168,426 11,992,408 12,558,119 13,090,357 Inspection and regulation 160,797 161,480 151,937 149,649 157,786 Education 5,573,656 5,372,267 5,331,848 5,467,543 5,706,667 Protection and safety 1,408,049 1,400,413 1,380,999 1,299,205 1,451,571 Transportation (2) 791,006 754,510 808,967 857,194 511,397 Natural resources 200,868 204,179 213,339 196,210 183,535 Intergovernmental revenue sharing 2,778,299 2,685,378 2,473,881 2,462,178 2,585,683 Interest on long-term debt 279,525 355,975 350,483 341,801 261,518 Total Governmental Activities Expenses 24,724,362 23,939,059 23,544,051 24,261,006 24,890,327
Business-type Activities: Universities (8) 4,078,053 3,888,145 3,629,568 3,533,977 3,343,377 Unemployment Compensation (6) - - 1,069,531 1,655,364 2,103,028 Industrial Commission Special Fund (3) 36,895 38,614 83,290 27,196 67,750 Lottery (6) - - 496,830 439,069 432,150 Other 1,130,299 1,329,816 113,347 115,442 126,029 Total Business-type Activities Expenses 5,245,247 5,256,575 5,392,566 5,771,048 6,072,334
Total Primary Government Expenses $ 29,969,609 $ 29,195,634 $ 28,936,617 $ 30,032,054 $ 30,962,661
PROGRAM REVENUESGovernmental Activities: Charges for services: General government $ 188,943 $ 188,462 $ 189,175 $ 191,738 $ 208,316 Inspection and regulation 157,149 156,164 150,557 149,890 143,329 Transportation (4) 113,267 119,862 108,877 114,453 123,372 Other activities 477,564 386,381 398,893 381,633 402,496 Operating grants and contributions 12,172,836 11,588,834 11,357,470 12,580,013 13,735,263 Capital grants and contributions 546,680 651,999 778,572 745,559 576,027 Total Governmental Activities Program Revenues 13,656,439 13,091,702 12,983,544 14,163,286 15,188,803
Business-type Activities: Charges for services: Universities 2,056,307 1,892,356 1,752,509 1,601,077 1,432,055 Lottery (6) - - 646,675 583,537 551,492 Other activities 1,325,046 1,289,456 584,240 560,502 509,254 Operating grants and contributions 1,343,922 1,570,854 1,705,773 2,212,673 2,260,071 Capital grants and contributions 41,250 15,210 53,571 14,799 12,563 Total Business-type Activities Program Revenues 4,766,525 4,767,876 4,742,768 4,972,588 4,765,435 Total Primary Government Program Revenues $ 18,422,964 $ 17,859,578 $ 17,726,312 $ 19,135,874 $ 19,954,238
NET (EXPENSE) REVENUEGovernmental activities $ (11,067,923) $ (10,847,357) $ (10,560,507) $ (10,097,720) $ (9,701,524) Business-type activities (478,722) (488,699) (649,798) (798,460) (1,306,899)
Total Primary Government Net (Expense) $ (11,546,645) $ (11,336,056) $ (11,210,305) $ (10,896,180) $ (11,008,423)
Fiscal Year2013, as 2012, as
2014 restated restated 2011 2010
- 228 -

$ 928,485 $ 982,382 $ 802,659 $ 781,542 $ 646,452 12,055,439 10,884,297 9,789,699 9,057,733 8,494,206
176,354 185,996 175,609 159,766 149,238 6,084,342 6,242,173 5,984,196 5,304,555 4,853,458 1,514,282 1,510,615 1,401,513 1,279,129 1,171,340
695,070 670,173 583,304 386,777 589,966 228,430 250,258 193,862 187,947 184,538
2,755,710 3,023,836 2,864,543 2,658,636 2,335,828 222,851 179,795 191,674 172,439 182,852
24,660,963 23,929,525 21,987,059 19,988,524 18,607,878
3,290,033 3,227,481 2,960,790 2,762,557 2,540,193 1,086,330 356,333 248,111 226,171 292,127
30,055 14,824 23,669 (18,300) 106,295 395,950 372,740 363,508 377,104 317,226 142,229 162,300 176,486 136,894 120,629
4,944,597 4,133,678 3,772,564 3,484,426 3,376,470
$ 29,605,560 $ 28,063,203 $ 25,759,623 $ 23,472,950 $ 21,984,348
$ 199,011 $ 190,374 $ 200,495 $ 161,664 $ 139,486 153,642 159,857 158,022 146,191 133,073 138,520 149,560 158,019 134,068 88,296 315,660 318,776 281,796 279,836 256,804
10,620,642 9,190,910 8,536,030 7,941,223 7,544,370 553,198 523,898 354,255 388,646 497,140
11,980,673 10,533,375 9,688,617 9,051,628 8,659,169
1,272,694 1,167,696 1,069,339 962,967 863,042 484,486 472,937 462,200 468,697 397,561 439,010 485,242 518,922 474,801 440,646
1,243,697 898,441 883,373 852,788 834,421 14,710 38,029 27,981 30,056 19,774
3,454,597 3,062,345 2,961,815 2,789,309 2,555,444
$ 15,435,270 $ 13,595,720 $ 12,650,432 $ 11,840,937 $ 11,214,613
$ (12,680,290) $ (13,396,150) $ (12,298,442) $ (10,936,896) $ (9,948,709) (1,490,000) (1,071,333) (810,749) (695,117) (821,026)
$ (14,170,290) $ (14,467,483) $ (13,109,191) $ (11,632,013) $ (10,769,735)
(Continued)
Fiscal Year2007, as 2006, as
2009 2008 restated restated 2005
- 229 -

STATE OF ARIZONASCHEDULE 2CHANGES IN NET POSITION (1)FOR THE LAST TEN FISCAL YEARSFISCAL YEAR ENDED JUNE 30, 2014(Expressed in Thousands) Fiscal Year
GENERAL REVENUES AND OTHER CHANGES IN NET POSITIONGovernmental Activities: Taxes: Sales $ 5,948,055 $ 6,518,480 $ 6,296,151 $ 5,942,250 $ 5,029,050 Income 3,963,197 3,974,998 3,706,698 3,366,783 2,809,995 Tobacco 314,313 316,050 317,369 320,657 332,893 Property 41,215 27,429 30,656 32,038 31,417 Motor vehicle and fuel (4) 1,650,579 1,592,911 1,581,909 1,565,525 1,583,790 Other 547,481 531,186 522,510 550,430 535,435 Unrestricted investment earnings (5) 79,215 18,705 79,190 29,183 37,665 Unrestricted grants and contributions 37,926 45,746 40,678 16,468 13,213 Miscellaneous general revenues (7) 176,035 144,403 265,214 140,854 204,295 Gain (loss) on sale of trust land 83,695 174,095 125,479 (154,359) 64,005 Transfers (578,361) (534,722) (576,846) (734,892) (809,864) Total Governmental Activities 12,263,350 12,809,281 12,389,008 11,074,937 9,831,894
Business-type Activities: Sales taxes 63,669 57,490 55,309 52,913 52,318 Unrestricted investment earnings 108,296 62,017 49,501 68,401 70,766 Unrestricted grants and contributions 107 5 3,468 - - Miscellaneous general revenues 78,837 148,743 155,757 50,510 52,072 Contributions to permanent endowments 6,561 3,192 3,270 3,656 3,020 Special items - - - - - Extraordinary items 3,900 - - 3,884 7,080 Transfers 578,361 534,722 576,846 734,892 809,864 Total Business-type Activities 839,731 806,169 844,151 914,256 995,120
Total Primary Government $ 13,103,081 $ 13,615,450 $ 13,233,159 $ 11,989,193 $ 10,827,014
CHANGE IN NET POSITIONGovernmental activities $ 1,195,427 $ 1,961,924 $ 1,828,501 $ 977,217 $ 130,370 Business-type activities 361,009 317,470 194,353 115,796 (311,779)
Total Primary Government $ 1,556,436 $ 2,279,394 $ 2,022,854 $ 1,093,013 $ (181,409)
(1) This schedule reports using the accrual basis of accounting.(2) For fiscal year 2006, net position for governmental activities were increased by the capitalization of $302,375 of capital assets that were previously recorded as transportation expenses.(3) The Industrial Commission Special Fund's cost of sales and benefits expense decreased $125,828 during fiscal year 2006, primarily due to a decrease in insolvent carrier liabilities. During fiscal year 2005, insolvent carrier liability increased, primarily as the result of $67,423 in Arizona workers' compensation claims from the defunct California domiciled Fremont Companies.(4) $31,804 of transportation's charges for services for fiscal year 2005 were classified as motor vehicle and fuel tax revenues.(5) Fiscal year 2007 unrestricted investment earnings were reduced by $17,771 due to reclassifying the Greater Arizona Development Authority from the primary government to a component unit.(6) For fiscal year 2013, Unemployment Compensation and Lottery changed from major to non-major funds.(7) Fiscal year 2012 miscellaneous general revenues was restated as a result of an agency fund being reclassified to a special revenue fund. (8) Fiscal year 2013 expenses for the Universities were restated as a result of GASB Statement No. 65 to expense debt issuance costs.
2013, as 2012, as2014 restated restated 2011 2010
- 230 -

Fiscal Year
$ 5,442,563 $ 6,270,419 $ 6,537,584 $ 6,322,311 $ 5,421,949 3,126,076 4,205,426 4,636,447 4,548,843 3,562,916
370,073 413,333 358,205 248,122 237,430 32,564 36,732 43,736 43,035 46,148
1,643,276 1,800,920 1,826,893 1,857,293 1,758,950 574,030 559,440 529,629 575,946 493,501
92,957 243,160 243,328 172,311 106,362 12,440 13,574 11,711 12,293 11,624
222,712 214,751 212,253 235,610 387,269 (165,696) 196,953 451,501 567,364 288,483 (983,006) (994,435) (876,456) (774,492) (707,597)
10,367,989 12,960,273 13,974,831 13,808,636 11,607,035
58,528 72,945 79,223 54,550 57,584 22,450 39,763 103,362 49,050 40,311
- - - - 5 45,786 64,564 77,841 58,816 26,017
4,014 3,927 4,815 3,803 2,955 7,240 (20,100) - (7,874) - 2,720 15,475 - - -
983,006 994,435 876,456 774,492 707,597 1,123,744 1,171,009 1,141,697 932,837 834,469
$ 11,491,733 $ 14,131,282 $ 15,116,528 $ 14,741,473 $ 12,441,504
$ (2,312,301) $ (435,877) $ 1,676,389 $ 2,871,740 $ 1,658,326 (366,256) 99,676 330,948 237,720 13,443
$ (2,678,557) $ (336,201) $ 2,007,337 $ 3,109,460 $ 1,671,769
20052006, as
2009 2008 restated 2007, as
restated
- 231 -

STATE OF ARIZONASCHEDULE 3FUND BALANCES, GOVERNMENTAL FUNDS (1)FOR THE LAST TEN FISCAL YEARSFISCAL YEAR ENDED JUNE 30, 2014(Expressed in Thousands)
GENERAL FUND: Reserved for: Budget stabilization fund $ - $ - $ - $ - $ - School facilities improvements - - - - 14,764 Continuing appropriations - - - - 55,354 Other fund balance reservations - - - - 232 Unreserved - - - - (817,348) Nonspendable (2) 9,600 844 891 716 - Restricted (2) 124,390 192,187 246,977 317,471 - Committed (2) 79,837 73,237 109,469 141,183 - Unassigned (2) (189,238) 156,935 (437,035) (1,162,531) -
Total General Fund $ 24,589 $ 423,203 $ (79,698) $ (703,161) $ (746,998)
ALL OTHER GOVERNMENTAL FUNDS: Reserved for: Highway construction $ - $ - $ - $ - $ 809,497 Other construction - - - - 45,403 School facilities improvements - - - - - Permanent funds - - - - 2,674,953 Continuing appropriations - - - - 116,350 Debt service - - - - 26,389 Other fund balance reservations - - - - 40,327 Unreserved, reported in: Special revenue funds - - - - 821,491 Capital projects funds - - - - - Nonspendable (2) 4,878,682 4,160,485 3,472,005 3,244,080 - Restricted (2,3) 1,741,674 1,860,872 1,762,356 1,531,992 - Committed (2) 734,446 661,110 514,085 452,447 - Unassigned (2) (29,744) (26,266) (33,861) (39,009) -
Total All Other Governmental Funds $ 7,325,058 $ 6,656,201 $ 5,714,585 $ 5,189,510 $ 4,534,410
(1) This schedule reports using the modified accrual basis of accounting.(2) Beginning in fiscal year 2011, the fund balance categories were reclassified as a result of implementing GASB Statement No. 54. Additionally, as a result of the reclassification, fund balance for fiscal year 2010 was restated.(3) Fiscal year 2012 restricted fund balance was restated as a result of an agency fund being reclassified to a special revenue fund.
2014 2013 restated 2011 restated (2)
Fiscal Year2012, as 2010, as
- 232 -
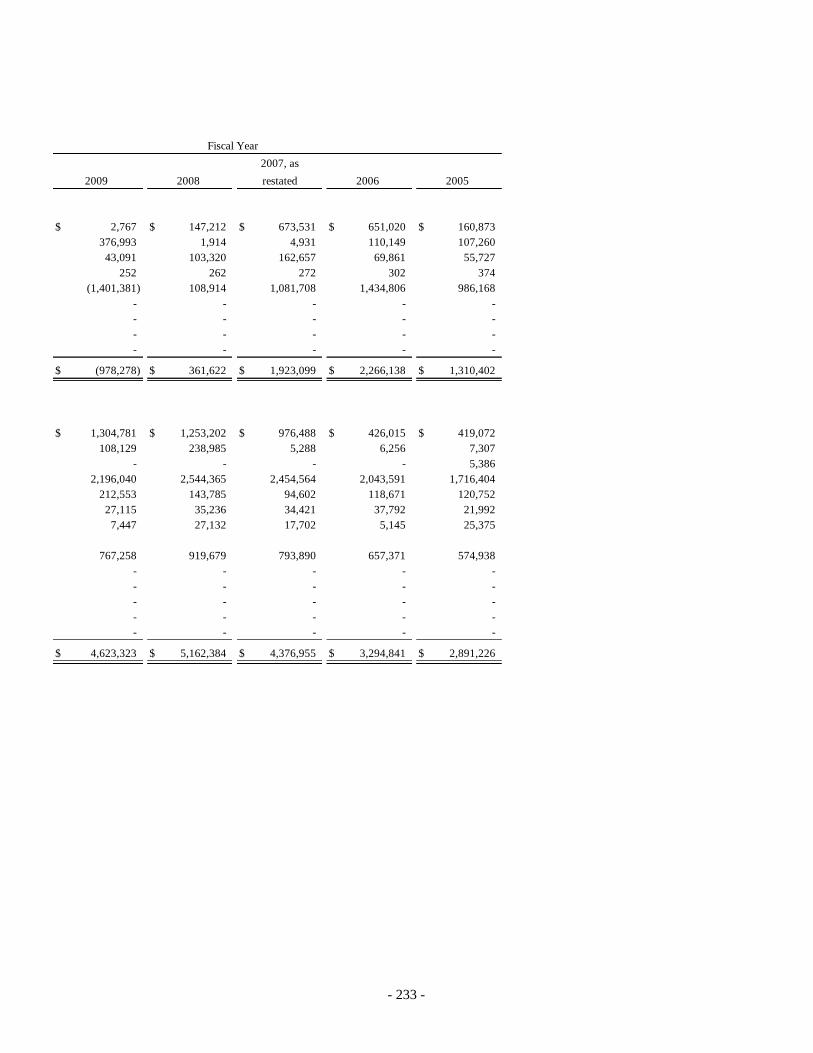
$ 2,767 $ 147,212 $ 673,531 $ 651,020 $ 160,873376,993 1,914 4,931 110,149 107,260
43,091 103,320 162,657 69,861 55,727252 262 272 302 374
(1,401,381) 108,914 1,081,708 1,434,806 986,168- - - - - - - - - - - - - - - - - - - -
$ (978,278) $ 361,622 $ 1,923,099 $ 2,266,138 $ 1,310,402
$ 1,304,781 $ 1,253,202 $ 976,488 $ 426,015 $ 419,072 108,129 238,985 5,288 6,256 7,307
- - - - 5,386 2,196,040 2,544,365 2,454,564 2,043,591 1,716,404
212,553 143,785 94,602 118,671 120,752 27,115 35,236 34,421 37,792 21,992
7,447 27,132 17,702 5,145 25,375
767,258 919,679 793,890 657,371 574,938 - - - - - - - - - - - - - - - - - - - - - - - - -
$ 4,623,323 $ 5,162,384 $ 4,376,955 $ 3,294,841 $ 2,891,226
2006 20052009 2008 restated
Fiscal Year2007, as
- 233 -

STATE OF ARIZONASCHEDULE 4CHANGES IN FUND BALANCES, GOVERNMENTAL FUNDS (1)FOR THE LAST TEN FISCAL YEARSFISCAL YEAR ENDED JUNE 30, 2014(Expressed in Thousands)
REVENUES Taxes: Sales $ 5,933,824 $ 6,530,609 $ 6,312,870 $ 5,971,141 $ 5,017,977 Income 4,012,603 4,034,631 3,715,082 3,398,972 2,805,426 Tobacco (2) 314,313 316,050 317,369 320,657 332,893 Property 41,215 27,429 30,656 32,038 31,417 Motor vehicle and fuel 1,650,579 1,592,911 1,581,909 1,565,525 1,585,919 Other 547,481 531,186 522,510 550,430 535,435 Intergovernmental 11,752,711 11,592,676 11,843,908 13,019,744 13,562,547 Licenses, fees, and permits 475,833 476,972 477,344 452,629 425,526 Earnings (loss) on investments (3,5) 739,859 499,919 190,055 438,068 422,564 Sales and charges for services (7) 185,682 182,075 188,806 186,325 203,725 Fines, forfeitures, and penalties 171,161 181,216 168,240 184,950 224,000 Gaming 86,326 86,507 85,535 80,455 77,554 Tobacco settlement 100,765 149,125 101,067 99,130 105,394 Proceeds from sale of trust land (6) 86,319 225,659 137,405 95,500 78,564 Other (8) 300,436 169,119 297,065 164,658 230,223 Total Revenues 26,399,107 26,596,084 25,969,821 26,560,222 25,639,164
EXPENDITURES Current: General government (7) 750,163 812,770 838,776 933,313 923,977 Health and welfare 12,643,455 12,216,622 12,029,530 12,818,468 13,054,472 Inspection and regulation 161,318 160,636 153,947 153,718 157,461 Education 5,572,414 5,369,538 5,332,141 5,467,695 5,702,963 Protection and safety 1,360,387 1,349,146 1,351,251 1,288,577 1,417,428 Transportation (4) 687,798 683,607 745,306 820,417 584,363 Natural resources 193,043 194,714 202,677 191,429 175,568 Intergovernmental revenue sharing 2,778,299 2,685,168 2,473,535 2,459,934 2,574,539 Debt service: Principal 493,592 412,617 386,027 383,591 288,172 Interest and other fiscal charges 312,024 329,773 344,903 357,754 286,027 Capital outlay (4) 829,630 765,339 769,716 824,417 1,291,341 Total Expenditures 25,782,123 24,979,930 24,627,809 25,699,313 26,456,311 Excess (Deficiency) of Revenues Over Expenditures 616,984 1,616,154 1,342,012 860,909 (817,147)
2014 2013 restated 2011 restated
Fiscal Year2012, as 2010, as
- 234 -

$ 5,429,453 $ 6,278,181 $ 6,527,968 $ 6,313,090 $ 5,410,383 3,137,794 4,174,966 4,629,220 4,535,492 3,528,565
370,073 413,333 358,205 248,122 237,430 32,564 36,732 43,736 43,035 46,148
1,672,151 1,802,572 1,828,701 1,857,293 1,758,950 574,030 559,440 529,629 575,946 493,501
11,316,023 9,499,419 8,313,720 8,019,509 7,714,012 410,002 447,090 442,236 410,069 335,760
(318,321) 135,879 510,253 247,250 190,499 154,671 167,329 158,318 162,048 154,251 203,337 167,309 183,923 138,354 121,123
84,140 94,004 94,771 84,794 67,658 125,571 115,587 90,258 86,231 93,933 143,674 - - - - 253,868 263,443 264,440 269,411 430,097
23,589,030 24,155,284 23,975,378 22,990,644 20,582,310
913,266 966,512 879,519 861,373 758,149 11,959,640 10,874,581 9,679,226 8,995,430 8,419,913
174,633 184,451 173,897 157,401 146,523 6,031,605 6,240,862 5,983,513 5,302,942 4,852,099 1,460,692 1,447,372 1,358,439 1,247,508 1,132,473
608,631 630,283 524,318 373,603 564,574 220,030 242,893 185,592 178,832 175,593
2,764,776 3,026,563 2,863,218 2,661,894 2,335,828
235,971 261,228 220,473 261,277 381,512 238,430 210,856 195,317 176,933 200,731
1,295,530 1,106,951 992,000 1,066,815 710,688 25,903,204 25,192,552 23,055,512 21,284,008 19,678,083
(2,314,174) (1,037,268) 919,866 1,706,636 904,227
(Continued)
2006 20052009 2008 restated
Fiscal Year2007, as
- 235 -

STATE OF ARIZONASCHEDULE 4CHANGES IN FUND BALANCES, GOVERNMENTAL FUNDS (1)FOR THE LAST TEN FISCAL YEARSFISCAL YEAR ENDED JUNE 30, 2014(Expressed in Thousands)
2014 2013 restated 2011 restated
Fiscal Year2012, as 2010, as
OTHER FINANCING SOURCES (USES) Transfers in 904,261 782,420 821,072 862,040 1,106,250 Transfers out (1,397,332) (1,256,408) (1,323,778) (1,574,406) (1,872,212) Proceeds from sale of trust land (6) - - - - - Proceeds from sale of capital assets 900 1,636 1,815 3,712 3,088 Capital lease and installment purchase contracts 113,914 15,158 8,166 4,583 187,836 Proceeds from notes and loans 29,130 51,550 9,541 11,113 32,628 Refunding bonds issued - 837,340 455,900 - - Payment to refunded bond escrow agent - (954,372) (560,228) - - Bonds issued - 194,295 259,460 180,000 425,420 Refunding grant anticipation notes issued - - 43,825 - - Grant anticipation notes issued - - - 158,585 - Refunding certificates of participation issued 305,675 62,630 - - - Payment to refunded certificates of participation escrow agent (310,059) (42,096) - - - Certificates of participation issued - - - 150,110 998,795 Premium on debt issued 6,770 136,210 90,753 42,291 77,709 Total Other Financing Sources (Uses) (346,741) (171,637) (193,474) (161,972) 959,514
NET CHANGE IN FUND BALANCES $ 270,243 $ 1,444,517 $ 1,148,538 $ 698,937 $ 142,367
DEBT SERVICE AS A PERCENTAGE OF NONCAPITAL EXPENDITURES 3.2% 3.1% 3.1% 3.0% 2.3%
(1) This schedule reports using the modified accrual basis of accounting.(2) Increase in tobacco tax revenue from fiscal year 2006 to fiscal year 2007 primarily due to Proposition 203, implemented December 2006.(3) Increase from fiscal year 2006 to fiscal year 2007 primarily due to increase in Land Endowment fair market value of investments, larger cash balances available to invest, and market interest rates.(4) For fiscal year 2006, transportation expenditures were reduced and capital outlay was increased by $302,375 for addition of capital assets that were previously recorded as transportation expenditures.(5) In fiscal year 2008, the Greater Arizona Development Authority Fund was reclassified from a special revenue fund to a component unit. Fiscal year 2007 earnings on investments has been restated to reflect this change.(6) In fiscal year 2009, "Proceeds from sale of trust land" was moved from "Other financing sources (uses)" to "Revenues."(7) In fiscal year 2010, amounts were restated as a result of implementing GASB Statement No. 54.(8) Fiscal year 2012 other revenues was restated as a result of an agency fund being reclassified to a special revenue fund.
- 236 -

2006 20052009 2008 restated
Fiscal Year2007, as
1,248,267 897,771 910,605 812,083 1,011,456 (2,168,964) (1,874,084) (1,784,833) (1,585,754) (1,714,562)
- 249,970 199,089 284,293 274,127 2,127 28,233 10,162 11,118 -
4,056 23,556 132,985 3,543 5,350 23,139 19,529 - - -
- 82,880 - 596,160 224,283 - (86,547) - (646,689) (247,417)
621,050 563,950 325,000 118,250 210,577 - - - - -
55,420 68,000 - - 104,385
- - - - 334,225
- - - - (363,052) 580,035 238,990 - - 237,625
70,083 48,972 26,201 59,711 100,509 435,213 261,220 (180,791) (347,285) 177,506
$ (1,878,961) $ (776,048) $ 739,075 $ 1,359,351 $ 1,081,733
1.9% 2.0% 1.9% 2.2% 3.1%
- 237 -

STATE OF ARIZONASCHEDULE 5NET TAXABLE SALES BY CLASSIFICATION (1) FOR THE LAST TEN FISCAL YEARS FISCAL YEAR ENDED JUNE 30, 2014(Expressed in Thousands)
2014 2013 2012 2011 2010 2009CLASSIFICATION (5)Transporting (2) 54,981$ 41,324$ 52,137$ 41,555$ 41,990$ 37,920$ Mining, oil and gas 116,678 115,775 105,614 96,514 102,900 175,743 Mining severance 1,047,580 1,193,176 1,623,111 1,609,451 1,164,231 729,482 Utilities 9,923,490 9,900,238 9,474,521 9,394,361 9,354,244 9,236,366 Communications 2,965,233 3,061,730 3,190,962 2,853,538 3,618,208 2,928,433 Private car and pipelines 5,616 6,250 1,186 1,908 1,640 7,743 Publishing 101,751 84,673 92,505 98,343 103,681 102,457 Job printing 321,225 235,349 252,603 266,564 236,985 307,581 Restaurants and bars 11,085,652 10,544,419 9,996,825 9,311,826 9,020,795 9,094,485 Amusements 1,096,945 1,051,581 1,037,059 994,092 1,051,919 1,053,048 Commercial lease (3) 2 2 1 2 141 1 Personal property rentals 3,355,048 3,254,822 3,257,588 3,056,386 3,127,828 3,552,696 Contracting 11,269,503 10,092,876 9,543,335 8,983,261 9,311,612 14,882,706 Retail 55,257,510 51,276,108 48,178,714 45,898,838 42,913,933 46,174,068 Hotel/motel 2,334,373 2,221,059 2,156,864 2,039,283 1,949,718 2,117,242 Rental occupancy tax (7) - - (3) 43 (62) (25) Use tax 4,749,508 5,186,464 5,302,844 4,610,921 5,464,504 5,882,942 Use tax-utilities (6) 62,511 10,283 10,022 10,040 (35,594) 38,653 Membership camping (7) - - - 1 10 11
Total 103,747,606$ 98,276,129$ 94,275,888$ 89,266,927$ 87,428,683$ 96,321,552$
Direct sales tax rate (4) 5.60% 6.60% 6.60% 6.60% 5.60% 5.60%
(1) Net taxable sales are based upon tax receipts.(2) The transporting/towing and railroads/aircraft business classifications have been combined into one category and renamed "transporting."(3) Commercial lease rate dropped to 0% effective July 1, 1997.(4) A significant portion of the revenue base was subject to a sales tax rate of 5.6% for fiscal years 2005 through 2010, and 2014. The sales tax rate was 6.6% for fiscal years 2011 through 2013. For fiscal years 2005 through 2014, the tax rate for non-metal mining, oil and gas was 3.125%, the mining severence was 2.5%, and the jet fuel and jet fuel use tax was $.0305 per gallon. The hotel/motel tax rate was 5.5% for fiscal years 2005 through 2010, and 2014. The hotel/motel tax rate was 6.5% for fiscal years 2011 through 2013. Per the Arizona Constitution, Article 9, Section 22, the Legislature can raise tax rates with an affirmative vote of two-thirds of the members of each house. The 1.00% rate increase approved under Proposition 100 on May 18, 2010 increased the state transaction privilege and use rate by one percentage point beginning June 1, 2010 and ending May 31, 2013, which is reflected in this table.(5) The names of the ten largest revenue payers are not available. Therefore, the categories are intended to provide alternative information regarding the sources of the State's revenue.(6) Use tax-utilities was not reported prior to fiscal year 2008. Fiscal years 2005 through 2008 were reported beginning in fiscal year 2008.(7) Effective November 1, 2006, membership camping and rental occupancy were repealed. Source: Arizona Department of Revenue Annual Reports for fiscal years 2014 and prior.
Fiscal Year
- 238 -

2008 2007 2006 2005
48,713$ 43,351$ 59,801$ 53,371$ 216,675 255,531 321,538 317,202
1,752,522 1,743,361 1,219,984 656,631 9,237,779 8,609,034 7,679,982 6,828,179 3,669,683 3,513,667 3,220,062 2,934,858
16,021 19,679 25,751 14,832 122,652 129,681 133,680 134,925 391,038 397,802 403,686 367,010
9,663,959 9,619,785 8,933,459 7,939,964 1,146,344 1,086,364 998,767 872,520
(443) (2) (120) 919 3,995,697 3,927,824 3,633,374 3,242,363
20,156,299 22,415,051 20,487,917 16,044,847 52,626,993 55,009,403 53,147,971 46,378,344
2,405,705 2,411,634 2,268,776 2,063,973 (2,669) 1,065 3,471 2,414
6,837,880 6,091,507 6,155,959 5,218,535 12,461 12,154 16,582 234
52 12 2,785 2,897
112,297,361$ 115,286,903$ 108,713,425$ 93,074,018$
5.60% 5.60% 5.60% 5.60%
Fiscal Year
- 239 -

(This page intentionally left blank)

STATE OF ARIZONASCHEDULE 6SALES TAX REVENUE PAYERS BY CLASSIFICATION CURRENT YEAR AND NINE YEARS AGO(Expressed in Thousands)
Tax TaxCollections Collections
CLASSIFICATIONTransporting (1) 2,749$ 0.05 % 2,662$ 0.05 %Non-metal mining, oil and gas 3,646 0.06 9,899 0.19 Mining severance 26,190 0.45 16,399 0.32 Timbering severance - ponderosa (2) - - 40 - Utilities 496,174 8.59 340,918 6.59 Communications 148,262 2.57 146,523 2.83 Private car and pipelines 281 - 741 0.01 Publishing 5,088 0.09 6,735 0.13 Job Printing 16,061 0.28 18,323 0.35 Restaurants and bars 554,283 9.60 396,430 7.66 Amusements 54,847 0.95 43,562 0.84 Commercial lease (3) - - 31 - Personal property rentals 167,755 2.90 161,861 3.13 Contracting 563,368 9.75 797,215 15.41 Retail 2,762,875 47.85 2,315,028 44.76 Hotel/motel 128,390 2.22 113,372 2.19 Rental occupancy tax (2) - - 72 - Use tax utilities 3,126 0.05 12 - Use tax 235,985 4.09 259,616 5.02 License fees 567 0.01 377 0.01 Membership camping (2) - - 145 - Jet fuel tax 3,190 0.06 5,341 0.10 Jet fuel use tax 382 0.01 890 0.02 Non sufficient funds 72 - 10 - Telecommunications service - assistance - - (292) (0.01) Mandatory EFT fees 179 - - - Other - - - - Amnesty - - - - Education tax (4) 601,854 10.42 538,346 10.40 Education Amnesty tax (4) - - - -
Total 5,775,324$ 100.00 % 5,174,256$ 100.00 %
(1) Transporting/towing was combined with railroads/aircraft for confidentiality purposes beginning in fiscal year 2004.(2) Effective November 1, 2006 these rates were repealed.(3) Commercial lease rate dropped to 0% effective July 1, 1997.(4) The education tax is .6% of net taxable sales for most classifications. The ones that do not collect the education tax are non-metal mining, oil and gas, mining and timbering severances, hotel/motel, rental occupancy, and jet fuel taxes. The Arizona Department of Revenue's annual report does not include the amount of education tax collected from each classification; rather it reports the total collected from all classifications. The education tax became effective June 1, 2001.
Source: Arizona Department of Revenue Annual Reports for fiscal years 2014 and 2005.
Fiscal Year 2014 Fiscal Year 2005Percentage Percentageof Total of Total
- 241 -
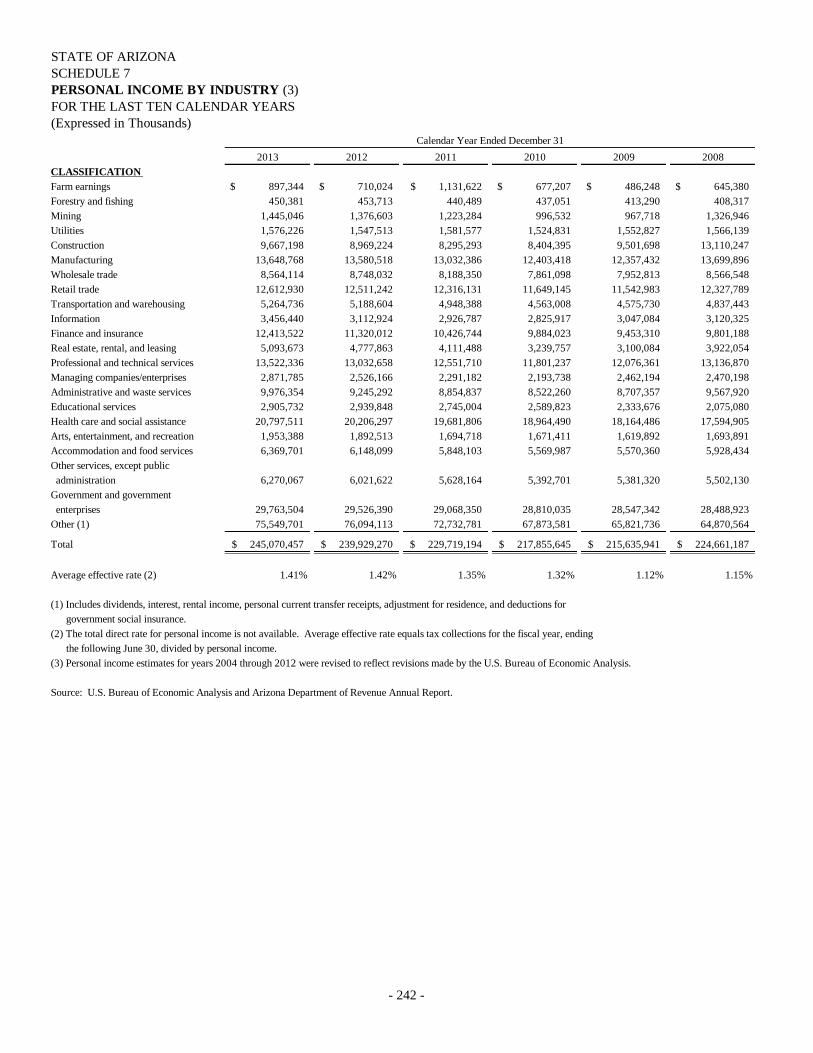
STATE OF ARIZONASCHEDULE 7PERSONAL INCOME BY INDUSTRY (3)FOR THE LAST TEN CALENDAR YEARS (Expressed in Thousands)
2013 2012 2011 2010 2009 2008CLASSIFICATION Farm earnings 897,344$ 710,024$ 1,131,622$ 677,207$ 486,248$ 645,380$ Forestry and fishing 450,381 453,713 440,489 437,051 413,290 408,317 Mining 1,445,046 1,376,603 1,223,284 996,532 967,718 1,326,946 Utilities 1,576,226 1,547,513 1,581,577 1,524,831 1,552,827 1,566,139 Construction 9,667,198 8,969,224 8,295,293 8,404,395 9,501,698 13,110,247 Manufacturing 13,648,768 13,580,518 13,032,386 12,403,418 12,357,432 13,699,896 Wholesale trade 8,564,114 8,748,032 8,188,350 7,861,098 7,952,813 8,566,548 Retail trade 12,612,930 12,511,242 12,316,131 11,649,145 11,542,983 12,327,789 Transportation and warehousing 5,264,736 5,188,604 4,948,388 4,563,008 4,575,730 4,837,443 Information 3,456,440 3,112,924 2,926,787 2,825,917 3,047,084 3,120,325 Finance and insurance 12,413,522 11,320,012 10,426,744 9,884,023 9,453,310 9,801,188 Real estate, rental, and leasing 5,093,673 4,777,863 4,111,488 3,239,757 3,100,084 3,922,054 Professional and technical services 13,522,336 13,032,658 12,551,710 11,801,237 12,076,361 13,136,870 Managing companies/enterprises 2,871,785 2,526,166 2,291,182 2,193,738 2,462,194 2,470,198 Administrative and waste services 9,976,354 9,245,292 8,854,837 8,522,260 8,707,357 9,567,920 Educational services 2,905,732 2,939,848 2,745,004 2,589,823 2,333,676 2,075,080 Health care and social assistance 20,797,511 20,206,297 19,681,806 18,964,490 18,164,486 17,594,905 Arts, entertainment, and recreation 1,953,388 1,892,513 1,694,718 1,671,411 1,619,892 1,693,891 Accommodation and food services 6,369,701 6,148,099 5,848,103 5,569,987 5,570,360 5,928,434 Other services, except public administration 6,270,067 6,021,622 5,628,164 5,392,701 5,381,320 5,502,130 Government and government enterprises 29,763,504 29,526,390 29,068,350 28,810,035 28,547,342 28,488,923 Other (1) 75,549,701 76,094,113 72,732,781 67,873,581 65,821,736 64,870,564
Total 245,070,457$ 239,929,270$ 229,719,194$ 217,855,645$ 215,635,941$ 224,661,187$
Average effective rate (2) 1.41% 1.42% 1.35% 1.32% 1.12% 1.15%
(1) Includes dividends, interest, rental income, personal current transfer receipts, adjustment for residence, and deductions for government social insurance.(2) The total direct rate for personal income is not available. Average effective rate equals tax collections for the fiscal year, ending the following June 30, divided by personal income. (3) Personal income estimates for years 2004 through 2012 were revised to reflect revisions made by the U.S. Bureau of Economic Analysis. Source: U.S. Bureau of Economic Analysis and Arizona Department of Revenue Annual Report.
Calendar Year Ended December 31
- 242 -

2007 2006 2005 2004
837,363$ 709,433$ 994,693$ 1,023,936$ 457,453 461,631 399,051 405,671 991,202 854,763 677,482 602,636
1,455,783 1,325,521 1,150,823 1,042,553 15,562,946 16,395,985 13,912,787 11,757,853 13,674,920 13,432,145 12,365,657 12,021,366
8,624,381 7,718,890 6,990,167 6,436,540 13,128,380 12,816,987 11,678,494 10,565,203
5,055,292 4,797,771 4,291,039 4,013,891 3,067,970 3,063,223 2,900,864 2,975,891
10,409,468 10,282,521 9,477,950 8,283,193 3,858,585 4,683,954 4,388,068 3,754,621
12,490,540 11,469,765 9,884,137 8,667,998 2,426,609 2,020,026 1,650,697 1,863,600 9,617,313 9,208,807 8,142,287 7,058,323 1,844,838 1,706,338 1,565,536 1,436,933
16,010,696 14,677,313 13,076,104 12,044,387 1,659,932 1,608,229 1,409,468 1,382,374 6,014,942 5,624,322 5,141,305 4,736,028
5,782,401 5,597,351 4,900,222 4,392,104
26,957,426 25,039,926 23,302,238 21,715,202 61,247,018 56,405,799 50,981,563 44,658,533
221,175,458$ 209,900,700$ 189,280,632$ 170,838,836$
1.54% 1.75% 1.93% 1.67%
Calendar Year Ended December 31
- 243 -

STATE OF ARIZONASCHEDULE 8PERSONAL INCOME TAX RATESFOR THE LAST TEN CALENDAR YEARS (Expressed in Thousands)
2013 2012 2011 2010 2009AVERAGE EFFECTIVE RATE (3)Personal Income Tax Revenue (1) 3,463,272$ 3,398,902$ 3,099,177$ 2,870,765$ 2,423,215$ Personal Income (2) 245,070,457$ 239,929,270$ 229,719,194$ 217,855,645$ 215,635,941$ Average Effective Rate (3) 1.41% 1.42% 1.35% 1.32% 1.12%
TAX RATES ON THE PORTION OFTAXABLE INCOME IN RANGES (4)$0 - $10 2.59% 2.59% 2.59% 2.59% 2.59%$10 - $25 2.88% 2.88% 2.88% 2.88% 2.88%$25 - $50 3.36% 3.36% 3.36% 3.36% 3.36%$50 - $150 4.24% 4.24% 4.24% 4.24% 4.24%$150 and over 4.54% 4.54% 4.54% 4.54% 4.54%
(1) Personal income tax revenue includes income tax collections and refunds, on a cash basis, for the fiscal year ending the following June 30.(2) Personal income is reported on a calendar basis. Years 2004 through 2012 have been revised to reflect revisions made by the U.S. Bureau of Economic Analysis.(3) The total direct rate for personal income is not available. Average effective rate equals tax collections for the fiscal year, ending the following June 30, divided by personal income. (4) Amounts shown are for single and married filing separate returns. For all other filing status returns, double the amounts for the income tax ranges. Per the Arizona Constitution, Article 9, Section 22, the Legislature can raise tax rates with a vote of two-thirds of the members of each house.
Source: Arizona Department of Revenue Annual Reports/Tax Tables and the U.S. Bureau of Economic Analysis.
STATE OF ARIZONASCHEDULE 9PERSONAL INCOME TAX FILERS AND LIABILITY BY INCOME LEVELFOR THE TAXABLE YEARS 2011 AND 2004 (1)(Expressed in Thousands, Except Number of Filers)
Number of Percentage PercentageFilers of Total Liability (2) of Total
FEDERAL ADJUSTED GROSSINCOME LEVEL (3)$50 and under 1,821,103 68.13% 426,558$ 14.18%$50 - $100 541,104 20.24% 690,581 22.94%$100 - $500 298,888 11.18% 1,209,916 40.18%$500 and over 12,025 0.45% 683,357 22.70%
Total 2,673,120 100.00% 3,010,412$ 100.00%
(1) The taxable year 2011 is the most recent year for which data is available, and combines the number of filers of the Arizona Forms 140, 140A, 140NR (nonresident), and 140PY (part year resident) Individual Income tax returns.(2) Liability, as reported on Arizona Forms 140, 140A, 140NR (nonresident), and 140PY (part year resident) Individual Income tax returns for tax year 2011, filed from January 2012 forward (or 2004, filed from January 2005 forward).(3) The names of the ten largest revenue payers are not available. Therefore, the categories are intended to provide alternative information regarding the sources of the State's revenue.
Source: Arizona Department of Revenue Annual Reports.
Taxable Year Ended December 31, 2011
Calendar Year Ended December 31
- 244 -
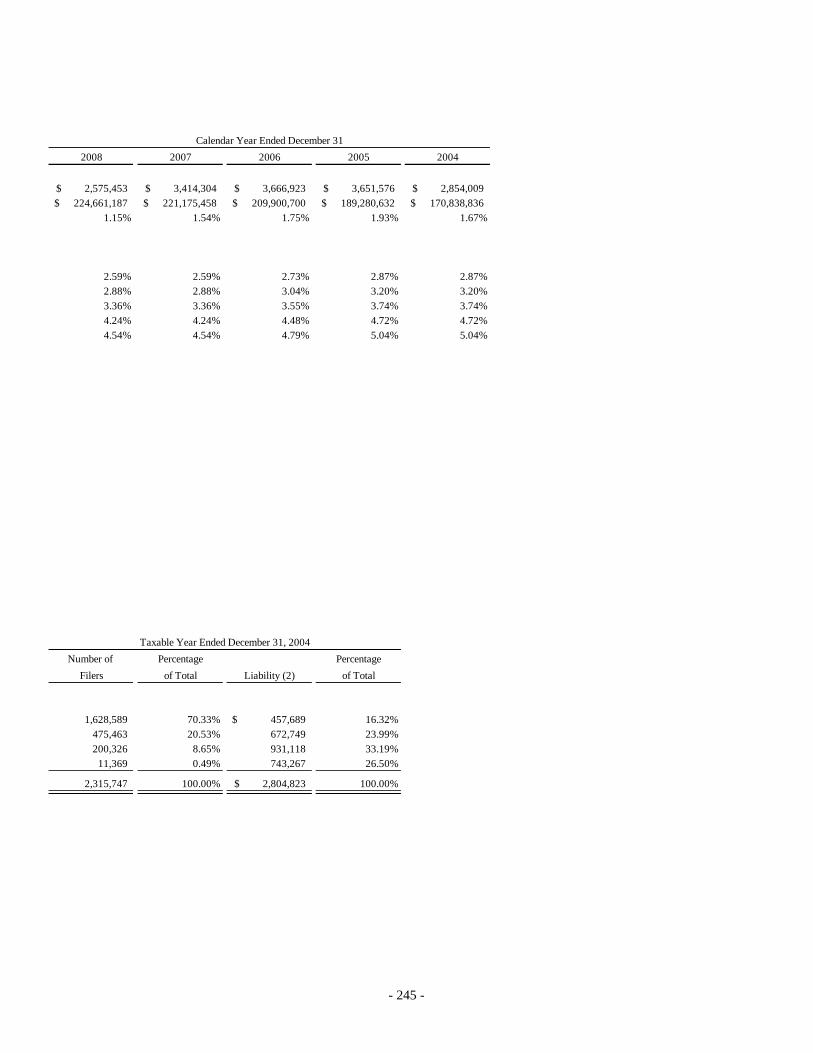
2008 2007 2006 2005 2004
2,575,453$ 3,414,304$ 3,666,923$ 3,651,576$ 2,854,009$ 224,661,187$ 221,175,458$ 209,900,700$ 189,280,632$ 170,838,836$
1.15% 1.54% 1.75% 1.93% 1.67%
2.59% 2.59% 2.73% 2.87% 2.87%2.88% 2.88% 3.04% 3.20% 3.20%3.36% 3.36% 3.55% 3.74% 3.74%4.24% 4.24% 4.48% 4.72% 4.72%4.54% 4.54% 4.79% 5.04% 5.04%
Number of Percentage PercentageFilers of Total Liability (2) of Total
1,628,589 70.33% 457,689$ 16.32%475,463 20.53% 672,749 23.99%200,326 8.65% 931,118 33.19%
11,369 0.49% 743,267 26.50%
2,315,747 100.00% 2,804,823$ 100.00%
Taxable Year Ended December 31, 2004
Calendar Year Ended December 31
- 245 -

STATE OF ARIZONASCHEDULE 10RATIOS OF OUTSTANDING DEBT BY TYPEFOR THE LAST TEN FISCAL YEARS FISCAL YEAR ENDED JUNE 30, 2014(Expressed in Thousands, Except Amount of Debt per Capita)
GOVERNMENTAL ACTIVITIES: Revenue bonds $ 3,406,195 $ 3,606,720 $ 3,593,420 $ 3,529,115 $ 3,522,605 $ 3,251,580 Grant anticipation notes 247,710 296,240 335,230 392,495 304,480 329,650 Certificates of participation 2,200,675 2,360,595 2,495,825 2,611,255 2,571,125 1,649,870 Capital leases 449,209 360,316 391,184 400,540 412,919 236,125 Installment purchase contracts - - 177 245 901 6,343 Notes payable 89,865 105,817 55,666 59,891 60,712 42,668 Premiums and discounts on debt 427,865 474,747 396,465 342,602 334,721 285,613 Deferred amount on refundings (2) - (19,945) (813) (1,221) (5,197) (9,171) Total Governmental Activities 6,821,519 7,184,490 7,267,154 7,334,922 7,202,266 5,792,678
BUSINESS-TYPE ACTIVITIES: Revenue bonds 2,302,035 2,237,710 1,942,755 1,742,125 1,692,825 1,239,675 Certificates of participation 676,345 714,735 756,980 812,706 840,719 872,829 Capital leases 132,957 135,519 163,637 167,841 171,448 175,453 Installment purchase contracts 4,098 5,758 8,397 10,511 13,043 16,418 Notes payable - - 12,643 292 360 674 Premiums and discounts on debt 130,315 123,051 87,993 41,393 39,705 43,112 Deferred amount on refundings (2) - (46,096) (33,391) (20,875) (23,100) (25,294) Total Business-type Activities 3,245,750 3,170,677 2,939,014 2,753,993 2,735,000 2,322,867
Total Primary Government $ 10,067,269 $ 10,355,167 $ 10,206,168 $ 10,088,915 $ 9,937,266 $ 8,115,545
Debt as a Percentage of Personal Income (1) 4.1% 4.3% 4.4% 4.6% 4.6% 3.6%
Amount of Debt per Capita (1) $ 1,519 $ 1,581 $ 1,578 $ 1,574 $ 1,567 $ 1,292
Note: Details regarding the State's outstanding debt can be found in the notes to the financial statements.
(1) See Schedule 23 for personal income and population data. These ratios are calculated using personal income and population data for the calendar year that ends during that fiscal year. For example, fiscal year 2014 contains data for the calendar year ending December 31, 2013.
(2) Implementation of GASB Statement No. 65 in fiscal year 2014 required the amortization of deferred amount on refundings to be reported as deferred outflows of resources.
Fiscal Year
2014 2013 2012 2011 2010 2009
- 246 -

$ 2,759,070 $ 2,328,840 $ 2,106,700 $ 2,170,845 298,280 282,860 325,430 363,970
1,135,640 959,865 1,020,810 1,054,677 249,876 242,209 129,808 126,676
8,908 10,644 6,815 6,926 22,838 3,309 - -
242,816 225,071 219,958 197,479 (13,145) (14,266) (17,832) -
4,704,283 4,038,532 3,791,689 3,920,573
902,255 868,565 802,600 768,000 903,843 935,127 946,766 860,759 179,052 166,780 113,388 120,361
13,024 9,544 10,279 7,276 1,022 1,354 - 30
38,211 39,582 38,331 36,133 (27,711) (29,211) (21,606) (20,821)
2,009,696 1,991,741 1,889,758 1,771,738
$ 6,713,979 $ 6,030,273 $ 5,681,447 $ 5,692,311
3.0% 2.9% 3.0% 3.3%
$ 1,089 $ 1,000 $ 973 $ 1,007
Fiscal Year
2008 2007 2006 2005
- 247 -

STATE OF ARIZONASCHEDULE 11LEGAL DEBT MARGIN INFORMATION ARIZONA TRANSPORTATION BOARD HIGHWAY REVENUE BONDSFOR THE LAST TEN FISCAL YEARSFISCAL YEAR ENDED JUNE 30, 2014(Expressed in Thousands)
Total Principal Outstanding Debt Limit (1)Total Principal
Total Applicable to Principal the Limit as
Fiscal Applicable Legal Debt a PercentageYear to Limit Margin of Debt Limit2014 $ - $ - $ - - %2013 - - - - 2012 - - - - 2011 - - - - 2010 - - - - 2009 - - - - 2008 - - - - 2007 - - - - 2006 1,300,000 1,223,425 76,575 94.112005 1,300,000 1,161,355 138,645 89.34
(1) As stated in House Bill 2206 of the Second Regular Session of the Forty-seventh Legislature, the $1.3 billion debt limit is eliminated from A.R.S. § 28-7510. The general effective date of this change was September 21, 2006. Prior to September 21, 2006, Arizona Revised Statutes restricted the total principal amount of Arizona Highway Revenue Bonds that could be outstanding at any time, excluding refunded bonds, from exceeding $1.3 billion.
STATE OF ARIZONASCHEDULE 12LEGAL DEBT MARGIN INFORMATION ARIZONA STATE UNIVERSITYFOR THE LAST NINE FISCAL YEARS (1)FISCAL YEAR ENDED JUNE 30, 2014(Expressed in Thousands)
Projected Amount of Debt Service Projected Debt
Fiscal Limit (8% of Service Applicable LegalYear (2) Expenditures) (3) to Limit Debt Margin
2014 $ 1,844,828 $ 147,586 $ 107,000 $ %2013 1,710,909 136,873 94,100 %2012 1,612,000 128,960 80,600 %2011 1,606,250 128,500 77,100 %2010 1,894,737 151,579 108,000 %2009 1,865,385 149,231 97,000 %2008 2,017,544 161,404 115,000 %2007 1,880,769 150,462 97,800 %2006 1,724,528 137,962 91,400 %
(1) Ten years of data is not available, but will be accumulated over time.(2) For fiscal years 2006 through 2014, projections are based upon the University's fiscal years 2008-2010, 2009-2011, 2010-2012, 2011-2013, 2012-2014, 2013-2015, 2014-2016, 2015-2017, and 2016-2018 capital improvement plans, respectively.(3) Per A.R.S. § 15-1683, the projected debt service on bonds and certificates of participation outstanding and proposed to be issued, as shown in the University's most recent capital improvement plan reported to the Arizona Board of Regents, may not exceed, in any fiscal year shown in such capital improvement plan, more than eight percent of the University's total projected expenditures and mandatory transfers.
Total Projected
Debt Limit
Projected Debt Service asTotal a Percentage of
Expenditures Debt Service Limit40,586 5.8042,773 5.5048,360 5.0051,400 4.8043,579 5.7052,231 5.2046,404 5.7052,662 5.2046,562 5.30
- 248 -

STATE OF ARIZONASCHEDULE 13LEGAL DEBT MARGIN INFORMATION UNIVERSITY OF ARIZONAFOR THE LAST EIGHT FISCAL YEARS (1)FISCAL YEAR ENDED JUNE 30, 2014(Expressed in Thousands)
Projected Amount of Debt Service Projected Debt
Fiscal Limit (8% of Service Applicable LegalYear (2) Expenditures) (3) to Limit Debt Margin
2014 $ 1,739,216 $ 139,137 $ 88,700 $ %2013 1,683,019 134,642 89,2002012 1,611,765 128,941 82,2002011 1,556,364 124,509 85,6002010 1,817,647 145,412 92,7002009 1,681,818 134,545 92,5002008 1,681,132 134,491 89,100 2007 1,657,971 132,638 114,400
(1) Ten years of data is not available, but will be accumulated over time.(2) For fiscal years 2007 through 2014, projections are based upon the University's fiscal years 2009-2011, 2010-2012, 2011-2013, 2012-2014, 2013-2015, 2014-2016, 2015-2017, and 2016-2018 capital improvement plans, respectively.(3) Per A.R.S. § 15-1683, the projected debt service on bonds and certificates of participation outstanding and proposed to be issued, as shown in the University's most recent capital improvement plan reported to the Arizona Board of Regents, may not exceed, in any fiscal year shown in such capital improvement plan, more than eight percent of the University's total projected expenditures and mandatory transfers.
STATE OF ARIZONASCHEDULE 14LEGAL DEBT MARGIN INFORMATION NORTHERN ARIZONA UNIVERSITYFOR THE LAST EIGHT FISCAL YEARS (1)FISCAL YEAR ENDED JUNE 30, 2014(Expressed in Thousands)
Projected Amount of Debt Service Projected Debt
Fiscal Limit (8% of Service Applicable LegalYear (2) Expenditures) (3) to Limit Debt Margin
2014 $ 485,265 $ 38,821 $ 24,700 $ %2013 453,039 36,243 24,600 2012 427,586 34,207 24,800 2011 405,109 32,409 22,200 2010 423,601 33,888 28,000 2009 419,448 33,556 28,900 2008 430,360 34,429 27,500 2007 410,811 32,865 30,400
(1) Ten years of data is not available, but will be accumulated over time.(2) For fiscal years 2007 through 2014, projections are based upon the University's fiscal years 2009-2011, 2010-2012, 2011-2013, 2012-2014, 2013-2015, 2014-2016, 2015-2017, and 2016-2018 capital improvement plans, respectively.(3) Per A.R.S. § 15-1683, the projected debt service on bonds and certificates of participation outstanding and proposed to be issued, as shown in the University's most recent capital improvement plan reported to the Arizona Board of Regents, may not exceed, in any fiscal year shown in such capital improvement plan, more than eight percent of the University's total projected expenditures and mandatory transfers.
Expenditures Debt Service Limit
Total ProjectedProjected Debt Service as
Total a Percentage of
50,437 5.1045,442 5.3046,741 5.10
Projected Debt Service as
38,909 5.5052,712 5.1042,045 5.5045,391 5.3018,238 6.90
Total Projected
Total a Percentage ofExpenditures Debt Service Limit
14,121 5.0911,643 5.43
9,407 5.8010,209 5.48
2,465 7.40
5,888 6.614,656 6.896,929 6.39
- 249 -

STATE OF ARIZONASCHEDULE 15PLEDGED-REVENUE COVERAGE ARIZONA TRANSPORTATION BOARD HIGHWAY REVENUE BONDSFOR THE LAST TEN FISCAL YEARSFISCAL YEAR ENDED JUNE 30, 2014(Expressed in Thousands)
FiscalYear Principal Interest Total Coverage2014 $ 537,768 $ 58,485 $ 80,495 $ 138,980 3.9 2013 512,971 60,540 78,198 138,738 3.7 2012 392,648 67,885 71,113 138,998 2.8 2011 504,175 71,770 83,960 155,730 3.2 2010 502,874 68,140 87,661 155,801 3.2 2009 509,183 64,190 89,825 154,015 3.3 2008 658,616 60,645 75,538 136,183 4.8 2007 635,140 57,825 73,785 131,610 4.8 2006 624,408 54,830 62,222 117,052 5.3 2005 461,763 44,265 60,459 104,724 4.4
(1) The Highway Revenue Bonds are secured by a prior lien on and pledge of motor vehicle and related fuel fees and taxes.(2) Includes vehicle license tax revenues distributed directly to the State Highway Fund. Fiscal year 2005 is net of a $118 million distribution to the State General Fund. Fiscal year 2009 is net of $66 million, 2010 is net of $44 million, and 2011 is net of $45 million distribution to the State General Fund.
STATE OF ARIZONASCHEDULE 16PLEDGED-REVENUE COVERAGE ARIZONA TRANSPORTATION BOARD TRANSPORTATION EXCISE TAX REVENUE BONDSFOR THE LAST TEN FISCAL YEARSFISCAL YEAR ENDED JUNE 30, 2014(Expressed in Thousands)
(1)Fiscal PledgedYear Revenue Principal Interest Total Coverage2014 $ 243,786 $ 58,600 $ 44,988 $ 103,588 2.4 2013 227,800 55,870 47,721 103,591 2.2 2012 216,281 55,460 48,129 103,589 2.1 2011 206,545 45,970 42,496 88,466 2.3 2010 199,672 33,315 38,225 71,540 2.8 2009 219,165 13,825 17,193 31,018 7.1 2008 253,742 19,045 10,673 29,718 8.5 2007 262,264 - - - N/A2006 316,491 80,375 1,566 81,941 3.9 2005 316,806 208,625 14,318 222,943 1.4
(1) The Bonds are secured by transportation excise taxes collected by the Arizona Department of Revenue on behalf of Maricopa County.
(1), (2)Pledged Debt Service
Revenue
Debt Service
- 250 -

STATE OF ARIZONASCHEDULE 17PLEDGED-REVENUE COVERAGE SCHOOL FACILITIES BOARD STATE SCHOOL IMPROVEMENT REVENUE BONDSFOR THE LAST TEN FISCAL YEARSFISCAL YEAR ENDED JUNE 30, 2014(Expressed in Thousands)
(1) (2)Fiscal PledgedYear Revenue Principal Interest Total Coverage2014 $ 601,854 $ 46,720 $ 9,575 $ 56,295 10.692013 567,824 43,680 13,487 57,167 9.932012 542,395 41,405 22,804 64,209 8.452011 514,346 39,215 25,088 64,303 8.002010 504,391 37,230 27,074 64,304 7.842009 558,900 35,420 28,885 64,305 8.692008 645,828 33,810 30,498 64,308 10.042007 666,184 31,055 31,893 62,948 10.582006 628,471 34,480 30,052 64,532 9.742005 538,346 28,485 36,060 64,545 8.34
(1) Pledged revenues consist of education transaction privilege tax revenues. These revenues result from a .6% increase in the State transaction privilege and use tax rate that was approved by a statewide vote at the November 2000 election. (2) Principal does not include sinking fund deposits of $1,270 each year, beginning in fiscal year 2003 and ending in fiscal year 2007, that will be sufficient to retire bonds with a par amount of $6,350 upon maturity, in fiscal year 2016. Additionally, principal does not include sinking fund deposits of $1,538 each year, beginning in fiscal year 2006 and ending in fiscal year 2018, that will be sufficient to retire bonds with a par amount of $20,000 upon maturity, in fiscal year 2018.
STATE OF ARIZONASCHEDULE 18PLEDGED-REVENUE COVERAGE SCHOOL FACILITIES BOARD STATE SCHOOL TRUST REVENUE BONDSFOR THE LAST TEN FISCAL YEARSFISCAL YEAR ENDED JUNE 30, 2014(Expressed in Thousands)
(1)Fiscal PledgedYear Revenue Principal Interest Total Coverage2014 $ 57,345 $ 19,275 $ 4,971 $ 24,246 2.372013 49,645 18,315 5,933 24,248 2.052012 39,155 17,400 6,846 24,246 1.612011 42,191 16,535 7,714 24,249 1.742010 38,147 15,710 8,539 24,249 1.572009 72,263 15,105 9,143 24,248 2.982008 72,263 14,470 8,400 22,870 3.162007 72,263 13,980 11,524 25,504 2.832006 72,263 13,440 12,061 25,501 2.832005 72,263 13,740 11,960 25,700 2.81
(1) Pledged revenues consist of expendable revenue from the State School Trust. This revenue includes the State Treasurer's formula distribution of earnings on permanent fund investments as specified in the Arizona Constitution. Additionally, the State Land Commissioner distributes interest received from financed sales of trust lands and revenue received from land trust leases, except that, under current statutes, the amount of State School Trust Revenues available to pay debt service on all State School Trust Revenue Obligations shall not exceed $72,263. Expendable trust revenues in excess of $72,263 must be deposited in the Classroom Site Fund.
Debt Service
Debt Service
- 251 -
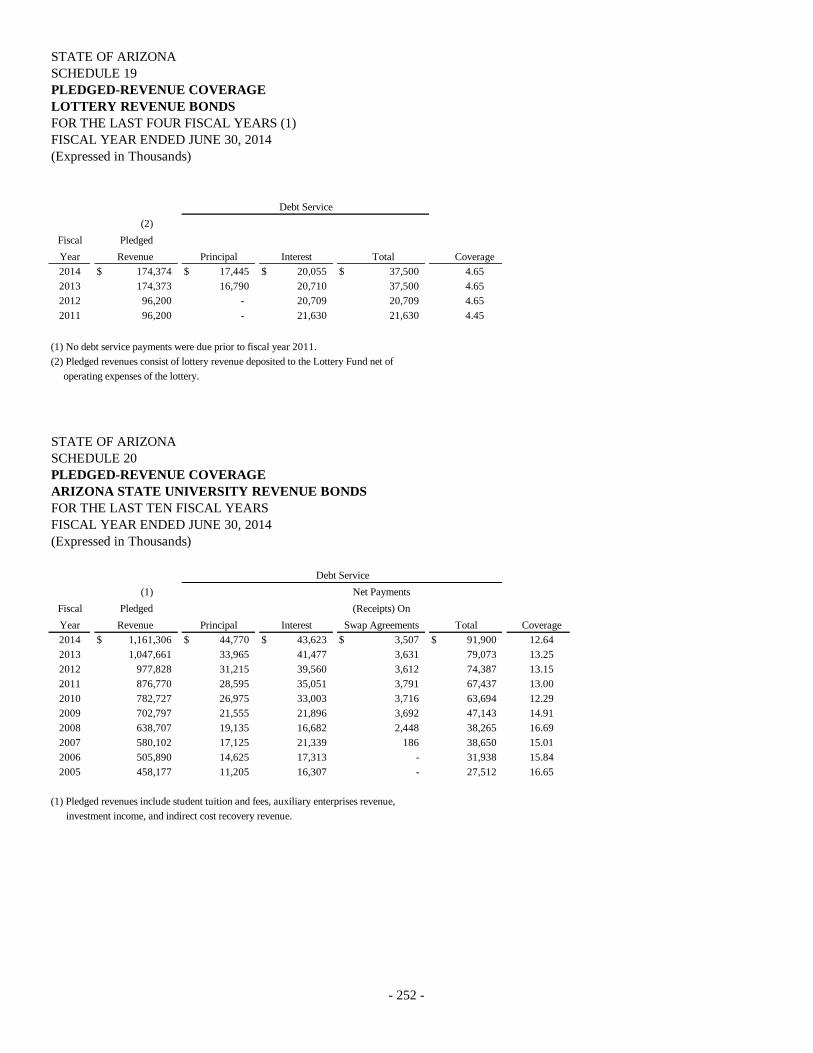
STATE OF ARIZONASCHEDULE 19PLEDGED-REVENUE COVERAGE LOTTERY REVENUE BONDSFOR THE LAST FOUR FISCAL YEARS (1)FISCAL YEAR ENDED JUNE 30, 2014(Expressed in Thousands)
Fiscal PledgedYear Revenue Principal Interest Total Coverage2014 $ 174,374 $ 17,445 $ 20,055 $ 37,500 4.652013 174,373 16,790 20,710 37,500 4.652012 96,200 - 20,709 20,709 4.652011 96,200 - 21,630 21,630 4.45
(1) No debt service payments were due prior to fiscal year 2011.(2) Pledged revenues consist of lottery revenue deposited to the Lottery Fund net of operating expenses of the lottery.
STATE OF ARIZONASCHEDULE 20PLEDGED-REVENUE COVERAGE ARIZONA STATE UNIVERSITY REVENUE BONDSFOR THE LAST TEN FISCAL YEARSFISCAL YEAR ENDED JUNE 30, 2014(Expressed in Thousands)
Fiscal PledgedYear Revenue Principal Interest Total Coverage2014 $ 1,161,306 $ 44,770 $ 43,623 $ 3,507 $ 91,900 12.642013 1,047,661 33,965 41,477 3,631 79,073 13.252012 977,828 31,215 39,560 3,612 74,387 13.152011 876,770 28,595 35,051 3,791 67,437 13.002010 782,727 26,975 33,003 3,716 63,694 12.292009 702,797 21,555 21,896 3,692 47,143 14.912008 638,707 19,135 16,682 2,448 38,265 16.692007 580,102 17,125 21,339 186 38,650 15.012006 505,890 14,625 17,313 - 31,938 15.842005 458,177 11,205 16,307 - 27,512 16.65
(1) Pledged revenues include student tuition and fees, auxiliary enterprises revenue, investment income, and indirect cost recovery revenue.
(Receipts) OnSwap Agreements
Debt Service(2)
Debt Service(1) Net Payments
- 252 -

STATE OF ARIZONASCHEDULE 21PLEDGED-REVENUE COVERAGE UNIVERSITY OF ARIZONA REVENUE BONDSFOR THE LAST TEN FISCAL YEARSFISCAL YEAR ENDED JUNE 30, 2014(Expressed in Thousands)
(1)(1), (2) Direct Net Revenue
Fiscal Gross Operating Available forYear Revenues Expenses Debt Service Principal Total Coverage2014 $ 1,400,095 $ 1,261,247 $ 138,848 $ 22,600 $ 38,250 $ 60,850 2.282013 1,356,478 1,199,559 156,919 21,895 34,556 56,451 2.782012 1,226,227 1,126,649 99,578 17,375 31,480 48,855 2.042011 1,215,062 1,056,408 158,654 24,720 28,571 53,291 2.982010 1,128,091 962,469 165,622 23,860 24,593 48,453 3.422009 1,044,354 911,440 132,914 22,725 15,437 38,162 3.482008 1,113,954 1,005,572 108,382 21,235 14,978 36,213 2.992007 982,559 899,084 83,475 17,440 14,166 31,606 2.642006 897,706 836,657 61,049 12,355 13,433 25,788 2.372005 830,077 774,014 56,063 11,815 11,817 23,632 2.37
(1) Gross Revenues and Direct Operating Expenses include current operating unrestricted funds only since these are the funds that are pledged for debt service payments under the System Revenue Bond Indentures. Also excluded from expenses is interest, depreciation, and amortization.(2) Payment of principal and interest on revenue bonds are secured by a pledge of student tuition and fees, auxiliary enterprise revenue, sales and service revenue, and other operating revenues, such as indirect cost recovery and certain investment income.
STATE OF ARIZONASCHEDULE 22PLEDGED-REVENUE COVERAGE NORTHERN ARIZONA UNIVERSITY REVENUE BONDSFOR THE LAST TEN FISCAL YEARSFISCAL YEAR ENDED JUNE 30, 2014(Expressed in Thousands)
(1), (2), (3)Fiscal GrossYear Revenues Principal Interest Total2014 $ 283,468 $ 6,615 $ 17,305 $ 23,920 11.852013 263,733 6,610 15,474 22,084 11.942012 246,098 5,835 15,028 20,863 11.802011 220,538 24,310 14,712 39,022 5.652010 198,197 6,545 10,912 17,457 11.352009 164,877 6,570 7,383 13,953 11.822008 143,733 10,455 6,628 17,083 8.412007 136,100 9,610 5,943 15,553 8.752006 129,608 10,310 6,603 16,913 7.662005 110,981 10,065 6,060 16,125 6.88
(1) Payment of principal and interest on revenue bonds are secured by a pledge of student tuition and fees and certain auxiliary enterprise revenue, investment income and indirect cost recovery revenue.(2) Fiscal year 2011 includes debt defeasance of $18.7 million.(2) Fiscal year 2013 gross revenue was revised by NAU in fiscal year 2014.
Debt ServiceInterest
Debt ServiceCoverage
- 253 -

(This page intentionally left blank)

STATE OF ARIZONASCHEDULE 23DEMOGRAPHIC AND ECONOMIC STATISTICSFOR THE LAST TEN CALENDAR YEARS
Personal Per CapitaIncome (3) Personal (2) Unemployment
Population (1,3) (in thousands) Income Rate (4)2013 6,626,624 $ 245,070,457 $ 36,983 7.32012 6,551,149 239,929,270 36,624 8.02011 6,468,796 229,719,194 35,512 8.62010 6,408,790 217,855,645 33,993 9.72009 6,343,154 215,635,941 33,995 10.52008 6,280,362 224,661,187 35,772 7.8 2007 6,167,681 221,175,458 35,860 4.12006 6,029,141 209,900,700 34,814 3.62005 5,839,077 189,280,632 32,416 4.22004 5,652,404 170,838,836 30,224 4.2
(1) These are midyear population estimates of the U.S. Bureau of the Census. (2) Per capita personal income is total personal income divided by total midyear population estimates of the U.S. Bureau of the Census. (3) Population and personal income estimates were revised to reflect revisions made by the U.S. Bureau of Economic Analysis.(4) Unemployment rates were revised to reflect revisions made by the Office of Employment and Population Statistics.
Sources: U.S. Bureau of Economic Analysis (for population, personal income, and per capita personal income figures).U.S. Bureau of the Census (also for population).Office of Employment and Population Statistics at Arizona Department of Administration (for unemployment rate).
STATE OF ARIZONASCHEDULE 24PRINCIPAL EMPLOYERSCURRENT YEAR AND NINE YEARS AGO
Calendar Year Ended December 31, 2013 Calendar Year Ended December 31, 2004Full-Time Percentage Full-Time Percentage Equivalent of Total State Equivalent of Total State
Employer Employees Rank Employment Employees Rank Employment State of Arizona 49,278 1 1.64 % 49,147 1 1.76 %Wal-Mart Stores Inc. 32,169 2 1.06 19,510 2 0.70Banner Health 25,270 3 0.84 14,447 4 0.52City of Phoenix 14,983 4 0.50 13,617 5 0.49Wells Fargo 14,713 5 0.49 11,000 8 0.39Maricopa County 12,698 6 0.42 15,218 3 0.55Arizona State University 12,222 7 0.40 10,530 9 0.38Intel Corp. 11,900 8 0.39 - - -JP Morgan Chase & Co. 11,042 9 0.37 - - -Bank of America 11,000 10 0.37 - - -Honeywell International - - - 12,000 6 0.43U.S. Postal Service - - - 11,406 7 0.41Raytheon Co. - - - 10,300 10 0.37
Total 195,275 6.48 % 167,175 6.00 %
Source: Arizona State University CAFR 2014.
Calendar Year Ended
December 31
- 255 -

STATE OF ARIZONASCHEDULE 25STATE EMPLOYEES BY FUNCTION (1)FOR THE LAST TEN FISCAL YEARSFISCAL YEAR ENDED JUNE 30, 2014
2014 2013 2012 2011 2010 2009FULL-TIME EQUIVALENT EMPLOYEES General government: Lottery 98.8 97.8 104.0 104.0 104.0 110.0 Arizona State Retirement System 246.9 233.9 236.0 236.0 236.0 236.0 Department of Revenue 861.8 860.3 935.0 935.0 863.0 1,164.0 All other 2,229.6 2,214.4 2,427.6 2,646.5 2,746.5 2,989.2 Health and welfare: Department of Economic Security 5,654.1 5,453.5 3,726.0 3,726.0 4,201.0 4,201.0 Arizona Health Care Cost Containment System 2,217.3 2,217.3 1,407.3 1,423.0 1,484.0 1,635.8 Department of Health Services 1,176.7 1,176.7 1,513.3 1,513.3 1,538.6 1,699.1 All other 946.6 946.6 1,098.5 954.5 966.5 981.5 Inspection and regulation 1,643.9 1,649.8 1,801.2 1,807.7 1,820.7 1,943.1 Education: Universities 15,607.7 15,478.7 16,964.2 15,754.2 15,664.5 17,353.5 All other 838.9 834.4 886.5 896.0 972.4 1,003.4 Protection and safety: Department of Corrections 9,384.0 10,118.2 10,015.2 10,015.2 9,755.9 9,932.5 Department of Juvenile Corrections 738.5 738.5 1,001.7 1,001.7 1,050.7 1,163.7 Department of Public Safety 1,904.7 1,903.7 2,139.8 2,081.8 2,099.8 2,114.8 All other 95.6 90.1 112.6 117.9 118.4 134.9 Department of Transportation 4,548.0 4,548.0 4,548.0 4,548.0 4,548.0 4,748.0 Natural resources 716.5 716.5 930.2 937.2 956.7 1,009.7
Total 48,909.6 49,278.4 49,847.1 48,698.0 49,126.7 52,420.2
(1) Full-time equivalent employees are categorized by the function of government that their respective agency generally serves. Information is not available to distinguish between governmental, business-type, or fiduciary activities.
Source: The Executive Budget (Detail). Includes only those positions funded by appropriated funds approved in the Executive Budget.
Fiscal Year
- 256 -

2008 2007 2006 2005
110.0 110.0 110.0 110.0 235.0 231.0 221.0 199.0
1,164.0 1,148.0 1,146.0 1,024.0 2,999.2 2,957.5 2,898.6 2,944.3
4,099.2 3,874.4 3,953.7 3,902.7 1,629.0 1,617.3 1,583.5 1,574.5 1,702.1 1,680.4 1,735.5 1,734.5
981.5 859.9 858.5 924.2 1,930.1 1,853.7 1,827.3 1,818.5
17,138.8 16,975.0 16,419.5 16,027.5 1,001.4 969.0 913.8 949.5
9,755.9 9,726.9 9,726.9 10,322.4 1,163.7 1,195.7 1,160.5 1,151.5 2,108.8 2,065.8 1,901.8 1,872.0
133.9 125.4 127.4 120.6 4,744.0 4,703.5 4,649.0 4,626.0 1,007.7 967.3 926.9 903.2
51,904.3 51,060.8 50,159.9 50,204.4
Fiscal Year
- 257 -

STATE OF ARIZONASCHEDULE 26OPERATING INDICATORS BY FUNCTIONFOR THE LAST TEN FISCAL YEARS (1)FISCAL YEAR ENDED JUNE 30, 2014
2014 2013 2012 2011 2010 2009 2008FUNCTIONS/PROGRAMSGeneral government: Number of tax returns received (in millions) 5.7 5.5 5.4 5.4 5.2 5.7 5.6Health and welfare: Arizona Health Care Cost Containment System membership (2) 1,508,690 1,318,650 1,314,210 1,392,810 1,392,420 1,282,910 1,136,585 Average monthly number of recipients of temporary assistance for needy families N/A 38,353 39,194 44,842 82,127 83,969 80,221 Average monthly number of persons receiving food stamp benefits N/A 1,100,920 1,123,068 1,049,522 986,413 752,772 600,549Inspection and regulation: Nonfatal occupational injuries and illnesses: Total recordable cases (in thousands) (3) N/A N/A 67.9 66.4 75.2 84.0 101.8 Incident rate per 100 full-time workers (3) N/A N/A 3.5 3.5 3.7 3.9 4.6Education: Public school enrollment, grades K-12 (4) 1,084,276 1,077,703 1,066,740 1,062,200 1,068,987 1,062,618 1,132,963Protection and safety: Number of miles patrolled by the Highway Patrol 19,321,168 18,914,572 19,465,944 19,953,766 21,275,292 21,987,920 21,881,034 State prison adult inmate population (5) 41,773 40,273 39,877 40,181 40,477 39,628 38,897Transportation: Number of registered vehicles (6) 7,453,046 7,180,797 6,823,906 6,839,659 6,740,536 6,692,834 6,733,610 Number of driver licenses issued (7) 1,188,903 1,159,695 1,184,630 1,196,675 1,241,977 1,246,358 1,200,227Natural resources: Game and Fish Department's license and tag sales (8) N/A 848,617 815,488 826,385 874,442 874,363 896,143Universities: University full-time equivalent students (9) 141,264 136,884 134,051 129,653 122,734 118,743 113,092Unemployment compensation: Number of initial unemployment claims filed 257,951 261,418 288,097 311,472 363,189 396,755 226,772Industrial Commission special fund: No-insurance awards issued 1,303 1,618 1,365 882 1,781 2,244 2,748 Number of vocational rehabilitation awards issued 170 136 125 132 128 103 118Lottery: Total lottery sales (in millions) 723.9$ 692.9$ 646.7$ 583.5$ 551.5$ 484.5$ 472.9$ Other business-type activities: Arizona Health Care Cost Containment System's Healthcare Group membership (10) - 6,370 7,080 8,260 10,760 14,560 21,646
N/A = Not available(1) Some figures may represent time periods other than a fiscal year (such as an academic or calendar year), as indicated in the notes below.(2) Approximate number of members enrolled as of June 1. Excludes membership in the Healthcare Group, which is listed separately as other business-type activities, beginning in fiscal year 2002.(3) Numbers represent total recordable cases and incident rates for the calendar year ended December 31. The fiscal years above contain data for the calendar year that ends during that fiscal year. For example, fiscal year 2013 contains data for the calendar year ending December 31, 2012. One hundred full-time workers represent 200,000 hours worked (100 times 40 hours per week times 50 weeks per year).(4) These enrollment counts represent a head count of all active enrollments on October 1st of each school year. The fiscal years above contain data for the academic year that occurs during that fiscal year. For example, fiscal year 2014 contains data from the October 1, 2013 enrollment figures. Starting with the 2008-09 school year, due to federal requirements, new business rules were used to calculate enrollment, so that counts are unduplicated. Prior to this, the counts are not unduplicated counts; concurrently enrolled students are counted as having an active membership in each school. Also, there was a change in data collection in 2003. From 2003 to 2008, concurrent enrollments in technology schools are included, which may additionally overstate aggregated enrollment figures.(5) Beginning in 2007, the state prison inmate population on the 2 Year Prison Population Trend Report excludes the inmate count from the county jail. For fiscal years 2006 and prior, the number includes both the county jail and the outside count of inmates. Fiscal year 2014 total is as of June 30.(6) Count represents the total number of vehicles registered as of the end of the fiscal year. (7) Count represents the number of driver licenses issued during that fiscal year, beginning July 1 and ending June 30. (8) Numbers represent sales for licenses, stamps, and tags for the calendar year ended December 31. The fiscal years above contain data for the calendar year that ends during that fiscal year. For example, fiscal year 2014 contains data for the calendar year ending December 31, 2013.(9) Enrollment figures represent the number of full-time equivalent students for the fall semester. The fiscal years above contain data for the fall semester that occurs during that fiscal year. For example, fiscal year 2014 contains data for the fall 2013 semester. These figures are generated by calculating one full-time equivalent student for each 15 student credit hours produced in lower-division undergraduate courses, each 12 student credit hours produced in upper-division undergraduate courses, and each 10 student credit hours produced in graduate courses.(10) Approximate number of members enrolled as of June 1. Healthcare Group ceased operations on December 31, 2013.
Sources: The State Departments of Transportation, Public Safety, Corrections, Education, Game and Fish, Economic Security, Revenue, the Industrial Commission of Arizona, Arizona Lottery, Arizona Health Care Cost Containment System, Arizona Board of Regents, and the U.S. Department of Labor.
Fiscal Year
- 258 -

2007 2006 2005
5.5 5.5 6.0
1,075,125 1,065,444 1,075,873
82,408 93,553 105,517
537,072 546,424 546,369
99.4 97.0 87.14.6 4.9 4.7
1,106,207 1,084,247 1,043,704
20,282,212 19,703,282 19,922,70437,088 34,864 32,710
6,608,726 6,318,402 5,945,1311,266,973 1,205,068 1,158,223
940,223 897,159 808,055
110,580 107,765 104,685
185,397 161,869 200,282
3,265 2,744 3,281133 124 102
462.2$ 468.7$ 397.6$
26,914 21,600 14,626
Fiscal Year
- 259 -

STATE OF ARIZONASCHEDULE 27CAPITAL ASSET STATISTICS BY FUNCTIONFOR THE LAST TEN FISCAL YEARS (1)FISCAL YEAR ENDED JUNE 30, 2014
2014 2013 2012 2011 2010 2009 2008FUNCTIONS/PROGRAMSProtection and safety: Number of adult prison facilities (3) 10 10 10 10 10 10 10Transportation: Public road mileage (center lane miles) (2) 6,800 6,751 6,751 6,722 6,789 6,753 6,785 Number of bridges (2) 4,787 4,754 4,754 4,741 4,700 4,648 4,637Natural resources: State Trust acres 9,223,617 9,223,873 9,302,256 9,252,495 9,258,071 9,259,296 9,260,253Universities: Number of facilities (4) 1,212 1,705 1,711 1,740 1,737 1,670 1,669 Gross square feet (in thousands) (4) 44,658 41,141 39,933 37,967 37,589 37,186 36,000
N/A = Not available
Note: No capital asset indicators are available for the general government, health and welfare, inspection and regulation, education, Industrial Commission special fund, and other business-type activity functions.
(1) Ten years of data may not be available for some statistics, but will be accumulated over time. Also, some figures may represent time periods other than a fiscal year (such as a calendar year), as indicated in the notes below.(2) These are the number of center lane miles and bridges that the Arizona Department of Transportation accounts for under the modified approach, which is discussed in the Required Supplementary Information portion of this report. (3) The Arizona Department of Corrections also contracts with private prison facilities to provide custody and treatment.(4) In addition to academic/support facilities, auxiliary enterprise facilities are also reported. These would include essentially self-supporting entities, such as residence halls and parking structures.
Sources: The State Departments of Transportation, Land, Corrections, and the Universities.
Fiscal Year
- 260 -

2007 2006 2005
10 10 10
6,817 6,922 6,8164,648 4,676 4,608
9,262,781 9,267,377 9,269,723
1,663 1,002 N/A34,946 20,154 N/A
Fiscal Year
- 261 -

ACKNOWLEDGMENTS The Comprehensive Annual Financial Report was prepared by the Department of Administration, General Accounting Office, Financial Reporting Section: Ron Santa Cruz Neil Broadstock, MBA, CPA, CMA, CGFM Michael J. Kallaur, CPA Tami Schuler, MEd Chris Freitag, CPA Marjorie Wakefield, MBA Cody Johnson, MBA, CPA Special acknowledgment goes to: All fiscal and accounting personnel throughout the Arizona State government, whose dedicated efforts and
cooperation contributed to the compilation of financial information that appears in the report.