statistical and financial summaries · statistical and financial summaries 2011 ... atn bangla...
TRANSCRIPT

INDIVIDUAL PAY TELEVISION, PAY-PER-VIEW, VIDEO-ON-DEMAND
AND SPECIALTY SERVICES
STATISTICAL AND FINANCIAL SUMMARIES
2011 - 2015
CONSUMER AFFAIRS AND STRATEGIC POLICY

PAGE
NOTICE TO READER I
VERTICALLY INTEGRATED COMPANIES - CATEGORY B SPECIALTY SERVICES II
NON-VERTICALLY INTEGRATED COMPANIES - CATEGORY B SPECIALTY SERVICES III
INDIVIDUAL PAY TELEVISION, PAY-PER-VIEW, VIDEO-ON-DEMAND AND SPECIALTY SERVICES
SERVICE NAME UNDERID# LICENSEE TYPE LANGUAGE
Aajtak Canada (formerly Hindi News) 535435813 Ethnic Channels Group Limited Specialty (category B service) Ethnic 1
AASTHA (South Asian Devotional Music & Discourse Channel) 535420369 Asian Television Network International Limited Pay-TV (category B service) Ethnic 2
ABC Spark (formerly Harmony) 535434435 3924181 Canada Inc. Specialty (category B service) English 3
Aboriginal Peoples Television Network (APTN) 535437471 Aboriginal Peoples Television Network Incorporated Specialty (category A service) Eng/Fr/Native 4
Abu Dhabi TV (formerly Arabic TV) 535417605 Ethnic Channels Group Limited Specialty (category B service) Ethnic 5
Access Communications Co-operative Limited, Regina 535427844 Access Communications Co-operative Limited Video-on-Demand English 6
ACTION (formerly Showcase Action) 305424997 Showcase Television Inc. Specialty (category B service) English 7
addikTV (formerly Mystère) 205424104 Groupe TVA inc. Specialty (category A service) French 8
Afroglobal Television 535427092 Afroglobal Network Inc. Specialty (category B service) English/French/Ethnic 9
All TV 305425763 All TV Inc. Specialty (category B service) Ethnic 10
AMI-télé 535437356 Accessible Media Inc. Specialty (category A service) French 11
AMI-tv (formerly The Accessible Channel) 535425674 Accessible Media Inc. Specialty (category A service) English 12
Animal Planet 305426266 Animal Planet Canada Company Specialty (category B service) English 13
AOV Adult Movie Channel (AOVMC) 535418992 Drive Publishing Inc. Specialty (category B service) English 14
AOV Maleflixxx (AOVMF) 305426761 1225520 Ontario Inc. Specialty (category B service) English 15
AOV XXX Action Clips (AOVXXX) 305426753 1225520 Ontario Inc. Specialty (category B service) English 16
ARGENT (formerly LCN Argent) 205424097 Groupe TVA inc. Specialty (category A service) French 17
ATN ARY (Urdu) (formerly ATN Urdu Channel) 305424905 South Asian Television Canada Limited Specialty (category B service) Ethnic 18
ATN B4U Movie (formerly Hindi Movie) 305424913 South Asian Television Canada Limited Pay-TV (category B service) Ethnic 19
ATN B4U Music (formerly ATN-Music Network One (Hindi Music)) 535420301 Asian Television Network International Limited Pay-TV (category B service) Ethnic 20
ATN Bangla (formerly ATN - Bangla Channel One) 535420252 Asian Television Network International Limited Pay-TV (category B service) Ethnic 21
ATN Caribbean (CBN) 305425292 1272558 Ontario Inc. Pay-TV (category 2 service) English 22
ATN CBN (Cricket Channel One) 535428545 Asian Television Network International Limited Specialty (category B service) English 23
ATN Cricket Plus (Asian Sports Network) 535428610 Asian Television Network International Limited Specialty (category B service) English/Ethnic 24
ATN Cricket Plus (ATN – Asian Sports Network (ASN)) 535421987 Asian Television Network International Limited Pay-TV (category B service) English 25
ATN DD SPORTS (Cricket Channel Two) 535428553 Asian Television Network International Limited Specialty (category B service) English 26
ATN FOOD FOOD (South Asian Cooking Channel 1) 535435053 Asian Television Network International Limited Specialty (category B service) Ethnic 27
ATN Gujarati channel (formerly ATN Zee Gujarati) 305424921 South Asian Television Canada Limited Specialty (category B service) Ethnic 28
ATN Hindi Movie Channel 535428529 Asian Television Network International Limited Specialty (category B service) Ethnic 29
ATN Hindi Movie Channel 3 535433958 Asian Television Network International Limited Specialty (category B service) Ethnic 30
ATN - Music Network One (Hindi Music) - AMN1 535428595 Asian Television Network International Limited Specialty (category B service) Ethnic 31
ATN NDTV 24/7 (formerly ATN – South Asian News – English) 535420335 Asian Television Network International Limited Pay-TV (category B service) Ethnic 32
ATN NDTV 24x7 (formerly South Asian English News Channel 2 535433114 Asian Television Network International Limited Specialty (category B service) English 33
ATN Punjabi Channel (formerly ATN Alpha ETC Punjabi) 305424880 South Asian Television Canada Limited Specialty (category B service) Ethnic 34
ATN SAB (Comedy Channel One) 535432348 Asian Television Network International Limited Specialty (category B service) Ethnic 35
TABLE OF CONTENTS

ATN South Asian Television Canada Channel 2 (SATV 2) 535435467 Asian Television Network International Limited Specialty (category B service) English/Ethnic 36
ATN South Asian Television (SATV) 305417421 South Asian Television Canada Limited Specialty (category A service) Ethnic 37
ATN Tamil Channel (Jaya TV) 305424898 South Asian Television Canada Limited Specialty (category B service) Ethnic 38
ATN - Times Now (formerly South Asian News - English) 535428579 Asian Television Network International Limited Specialty (category B service) English 39
ATN Zee Cinema (formerly ATN – Hindi Movie Channel Two) 535420294 Asian Television Network International Limited Pay-TV (category B service) Ethnic 40
ATN - Zoom (formerly Music Network Two) 535428602 Asian Television Network International Limited Specialty (category B service) Ethnic 41
AUX TV 535428149 Blue Ant Media Partnership Specialty (category B service) English 42
Avis de Recherche 205429568 Avis de recherche incorporée Specialty (category B service) French 43
BBC Canada 305424319 Jasper Broadcasting Inc. Specialty (category B service) English 44
BBC Kids 305426852 Knowledge-West Communications Corporation Specialty (category B service) English 45
BC News 1 (formerly Global News Plus BC) 535434906 Shaw Television Limited Partnership Specialty (category B service) English 46
Bell TV On Demand and Vu! (formerly Bell) 205421499 Bell ExpressVu Limited Partnership Pay-per-view Direct-to-Home Bilingual 47
Bell TV On Demand (formerly General Interest) 305424153 Bell ExpressVu Limited Partnership Pay-per-view programming Bilingual 48
Bell TV On Demand (formerly Vu! On Demand) 535419338 Bell ExpressVu Limited Partnership Video-on-Demand Bilingual 49
Big Magic International Canada (formerly Imagine Dil Se) 535422737 Ethnic Channels Group Limited Specialty (category B service) Ethnic 50
Book Television (formerly Book Television - The Channel) 405423922 Bell Media Inc. Specialty (category A service) English 51
BPM:TV (The Dance Channel) 305424848 Stornoway Communications Limited Partnership Specialty (category B service) English 52
Bragg Communications Incorporated, Halifax 535424840 Bragg Communications Incorporated Video-on-Demand English 53
Bravo! 315413740 Bell Media Inc. Specialty (category A service) English 54
Bruce Telecom, Tiverton 535426929 Bruce Telecom Video-on-Demand English 55
Business News Network (BNN) (previously ROBTV) 305417273 Bell Media Inc. Specialty (category A service) English 56
CablePulse 24 (CP24) 305417348 Bell Media Inc. Specialty (category A service) English 57
Câblevision du Nord de Québec inc., Val d'Or 535424121 Câblevision du Nord de Québec inc. Video-on-Demand French 58
Canal D 215413790 Bell Media Inc. Specialty (category A service) French 59
Canal D/Investigation 535433411 Bell Media Inc. Specialty (category B service) French 60
Canal Indigo 205416466 Vidéotron s.e.n.c. Pay-per-view programming Bilingual 61
Canal Vie 205417381 Bell Media Inc. Specialty (category A service) French 62
Cartoon Network (formerly TELETOON Kapow!) 535433982 TELETOON Canada Inc. Specialty (category B service) English 63
Cartoon Network (formerly TELETOON Retro (English)) 535421135 TELETOON Canada Inc. Specialty (category B service) English 64
Casa - (formerly Les idées de ma maison) 535421276 Groupe TVA inc. Specialty (category B service) French 65
CBC News Network (Formerly Newsworld) 334805116 Canadian Broadcasting Corporation Specialty (category C service) English 66
Channel Punjabi (formerly PTC Punjabi) 535423199 Channel Punjabi Television Inc. Specialty (category B service) Ethnic 67
CINÉPOP (formerly Cinémania) 205426720 Bell Media Inc. Pay-TV (category B service) French 68
CityNews Channel (formerly City news (Toronto)) 535427852 Rogers Broadcasting Limited Specialty (category B service) English 69
CMT (formerly Country Music Television) 435413778 Country Music Television Ltd. Specialty (category A service) English 70
Cogeco Cable Holdings Inc., Montréal 205424112 Cogeco Cable Canada LP Video-on-Demand Bilingual 71
Comedy Gold (formerly TV Land) 405426314 Bell Media Inc. Specialty (category B service) English 72
Cosmopolitan TV (formerly Cosmopolitan Television) 535425723 Cosmopolitan Television Canada Company Specialty (category B service) English 73
Cottage Life (formerly Bold) 405423948 Blue Ant Television Ltd. Specialty (category A service) English 74
Crime + Investigation (formerly Mystery) 305423907 Mystery Partnership Specialty (category A service) English 75
CTV News Channel (formerly CTV Newsnet) 305417223 Bell Media Inc. Specialty (category C service) English 76
Daystar Canada (formerly Grace TV) 535421515 World Media Ministries Specialty (category B service) English 77
DejaView 305426050 Shaw Television Limited Partnership Specialty (category B service) English 78
Discovery Channel 315413765 2953285 Canada Inc. Specialty (category A service) English 79
Discovery Science (formerly Discovery Civilization Channel) 305426191 Discovery Science Canada Company Specialty (category B service) English 80
Discovery Velocity (formerly Discovery World HD) 535421250 2953285 Canada Inc. Specialty (category B service) English 81

D.I.Y. Network (formerly D.I.Y. Television) 535421151 HGTV Canada Inc. Specialty (category B service) English 82
Documentary (formerly The Canadian Documentary Channel) 305423965 The Canadian Documentary Channel Limited Partnersh Specialty (category A service) English 83
DTOUR (formerly TVtropolis) 305417299 TVtropolis General Partnership Specialty (category A service) English 84
Dusk (formerly Scream) 305426505 3924181 Canada Inc. Specialty (category B service) English 85
E! (formerly Star! TV) 305417330 Bell Media Inc. Specialty (category A service) English 86
Encore Avenue 435413703 Encore Avenue Ltd. Pay-TV (category A service) English 87
EqualiTV 535427109 EqualiTV International Foundation Specialty (category B service) English 88
ERT sat (formerly Odyssey II) 305425375 1494679 Ontario Inc. Specialty (category B service) Ethnic 89
ESPN Classic 305424608 The Sports Network Inc. Specialty (category B service) English 90
EuroWorld SPORT (formerly RCS Television) 535422000 Telelatino Network Inc. Specialty (category B service) English 91
Évasion (formerly Canal Évasion) 205421548 Canal Évasion inc. Specialty (category A service) French 92
Execulink Telecom Inc., Thedford 535426234 Execulink Telecom Inc. Video-on-Demand English 93
Fairchild Television II 535435714 Fairchild Television Ltd. Specialty (category B service) Ethnic 94
Fairchild TV 314600560 Fairchild Television Ltd. Specialty (category A service) Ethnic 95
Family Channel (formerly Family) 314600859 DHX Television Ltd. Pay-TV (category A service) English 96
Family CHRGD (formerly Disney XD) 535428214 DHX Television Ltd. Specialty (category B service) English 97
FashionTelevisionChannel (formerly Fashion Television ...) 305423931 Bell Media Inc. Specialty (category A service) English 98
Festival Portuguese Television 305424179 1395047 Ontario Inc. Specialty (category B service) Ethnic 99
Fight Network 535418348 Fight Media Inc. Specialty (category B service) English 100
FNTSY Sports Network (formerly The League–Fantasy Sports TV) 535435540 Fight Media Inc. Specialty (category B service) English 101
Food Network Canada 305423329 Food Network Canada Inc. Specialty (category A service) English 102
Fox Sports World Canada 305426068 Fox Sports World Canada Partnership Specialty (category B service) English 103
FTV-Filipino TV (formerly The Mabuhay Channel/ECG Filipino) 535417639 Ethnic Channels Group Limited Specialty (category B service) Ethnic 104
FX (formerly FX Canada) 535432174 8064750 Canada Inc. Specialty (category B service) English 105
FXX (Canada) (formerly Ampersand) 535432190 8834776 Canada Inc. Specialty (category B service) English 106
Fyi (formerly Twist TV) 305424020 Discovery Health Channel Canada ULC Specialty (category A service) English 107
G4 (Canada) (fromerly G4techTV) 305423957 Rogers Media Inc. Specialty (category A service) English 108
GameTV (formerly CGTV Canada) 305428072 The GameTV Corporation Specialty (category B service) English 109
Gol TV (The Soccer net) 535420913 Gol TV (Canada) Ltd. Specialty (category B service) English 110
GUSTO (formerly MmmTV) 535430706 7262591 Canada Limited Specialty (category B service) English 111
H2 (formerly The Cave, Men TV) 205424055 Men TV General Partnership Specialty (category A service) English 112
HGTV Canada - Home and Garden Television Canada 305417322 HGTV Canada Inc. Specialty (category A service) English 113
HIFI (formerly Treasure HD) 535420898 Blue Ant Television Ltd. Specialty (category B service) English 114
Historia 205421556 8504644 Canada Inc. Specialty (category A service) French 115
History Television 305417249 History Television Inc. Specialty (category A service) English 116
Hollywood Suite 2000s Movies (formerly Sony Movie Channel) 535429824 Hollywood Suite Corp. Specialty (category B service) English 117
Hollywood Suite 70s Movies (formerly Warner Films) 535429791 Hollywood Suite Inc. Specialty (category B service) English 118
Hollywood Suite 80s Movies (formerly MGM Channel) 535429816 Hollywood Suite Inc. Specialty (category B service) English 119
Hollywood Suite 90s Movies (formerly AXN Movies) 535429808 Hollywood Suite Corp. Specialty (category B service) English 120
HPItv (formerly The Racing Network Canada) 305424616 Woodbine Entertainment Group Specialty (category B service) English 121
Hustler TV (Formerly TEN Channel 1/Hustler Channel) 305424723 TEN Broadcasting Inc. Specialty (category B service) English 122
ichannel 305424046 Stornoway Communications Limited Partnership Specialty (category A service) English 123
ICI ARTV 205423734 Canadian Broadcasting Corporation Specialty (category A service) French 124
ICI EXPLORA (formerly SENS) 535432215 Canadian Broadcasting Corporation Specialty (category B service) French 125
ICI RDI 215413782 Canadian Broadcasting Corporation Specialty (category C service) French 126
IDNR-TV Natural Resources Television 535419289 The Natural Resources Television Channel (IDRN-TV/ Specialty (category B service) Bilingual 127

Illico sur demande 205429295 Vidéotron s.e.n.c. Video-on-Demand Bilingual 128
Investigation Discovery (formerly Court TV Canada) 405425613 Bell Media Inc. Specialty (category B service) English 129
Jaam-e-Jam (formerly ITN-Iran TV Network/Persian/Iranian TV) 535419487 Ethnic Channels Group Limited Specialty (category B service) Ethnic 130
Juicebox (formerly PunchMuch) 405426322 Bell Media Inc. Specialty (category B service) English 131
La chaîne Disney (formerly TÉLÉTOON Rétro (Français)) 535421127 TELETOON Canada Inc. Specialty (category B service) French 132
Leafs TV 305425531 Toronto Maple Leafs Network Ltd. Specialty (category B service) English 133
Le Canal Nouvelles (LCN) 205417406 Groupe TVA inc. Specialty (category C service) French 134
Le Réseau des Sports (RDS) 214301137 Le Réseau des sports (RDS) inc. Specialty (category C service) French 135
Lifetime (formerly Showcase Diva) 305425002 Showcase Television Inc. Specialty (category B service) English 136
Live National Hockey League Games 505424169 Breakaway PPV Corporation Pay-per-view Direct-to-Home English 137
Love Nature (formerly Oasis HD) 535420880 Blue Ant Television Ltd. Specialty (category B service) English 138
L S Times 535423652 L S Movie Channel Limited Specialty (category B service) Ethnic 139
M3 (formerly MuchMoreMusic) 305417364 Bell Media Inc. Specialty (category A service) English 140
Makeful TV (formerly BITE Television ) 305428600 Blue Ant Media Partnership Specialty (category B service) English 141
Max Front Row 535417712 Saskatchewan Telecommunications Video-on-Demand Bilingual 142
Mediaset Italia (formerly Italian Entertainment TV) 535423024 Telelatino Network Inc. Specialty (category B service) Ethnic 143
MEGA Cosmos (formerly Greek TV 1) 535422761 Ethnic Channels Group Limited Specialty (category B service) Ethnic 144
Moi&cie (formerly Mlle) 535430516 Groupe TVA inc. Specialty (category B service) French 145
Mountain Cablevision Limited, Hamilton 535420054 Mountain Cablevision Limited Video-on-Demand English 146
Movie Central 435101126 Movie Central Ltd. Pay-TV (category A service) English 147
MovieTime (formerly known as Lonestar) 305426000 Shaw Television Limited Partnership Specialty (category B service) English 148
MTS Video on Demand 535418132 MTS Inc. Video-on-Demand English 149
MTV2 (formerly Razer) 405424037 Bell Media Inc. Specialty (category A service) English 150
MTV (Canada) (formerly known as Talk TV) 305417372 Bell Media Inc. Specialty (category A service) English 151
Much (formerly MuchMusic) 314600545 Bell Media Inc. Specialty (category A service) English 152
MuchLoud 305426539 Bell Media Inc. Specialty (category B service) English 153
MuchRetro (formerly MuchMoreRetro) 305426597 Bell Media Inc. Specialty (category B service) English 154
MuchVibe 305426521 Bell Media Inc. Specialty (category B service) English 155
MUSIMAX 205417399 MusiquePlus inc. Specialty (category A service) French 156
MusiquePlus 214301129 MusiquePlus inc. Specialty (category A service) French 157
NatGeo Wild 535434584 NGC Channel Inc. Specialty (category B service) English 158
National Geographic Channel 305424294 NGC Channel Inc. Specialty (category B service) English 159
NBA TV (Canada) - (formerly Raptors NBA TV) 305425440 Toronto Raptors Network Ltd. Specialty (category B service) English 160
Nickelodeon (formerly YTV OneWorld) 535427068 4537459 Canada Inc. Specialty (category B service) English 161
Northwestel Inc., Yellowknife 535427878 Northwestel Inc. Video-on-Demand English 162
Novus Entertainment Inc., Vancouver 535435532 Novus Entertainment Inc. Video-on-Demand Bilingual 163
NTD Television 535433015 New Tang Dynasty Television (Canada) Specialty (category B service) Ethnic 164
NuevoMundo Television (NMTV) 535420385 NMTV inc. Specialty (category B service) Ethnic 165
Odyssey (formerly OTN) 305417413 Odyssey Television Network Inc. Specialty (category A service) Ethnic 166
OTN 3 535433437 Greek National Television Network (Canada) Inc. Specialty (category B service) Ethnic 167
Outdoor Life Network (OLN) 305417314 Rogers Media Inc. Specialty (category A service) English 168
OUTtv (formerly PrideVision) 305423973 OUTtv Network Inc. Specialty (category A service) English 169
OWN: The Oprah Winfrey Network (formerly OWN; formerly VIVA) 305417257 OWN Inc. Specialty (category A service) English 170
Penthouse TV 535425161 Fifth Dimension Properties Inc. Specialty (category B service) English 171
Playmen (formerly HARDtv) 535420062 4510810 Canada Inc. Specialty (category B service) English 172
Prise 2 (formerly Nostalgie) 535421284 Groupe TVA inc. Specialty (category B service) French 173

ProSieBenSat.1 (formerly German TV) 535422240 Ethnic Channels Group Limited Specialty (category B service) Ethnic 174
Public Affairs programming/coverage of the HOC proceedings 535437455 Cable Public Affairs Channel Inc. Specialty (category A service) English 175
radX (formerly Rush HD) 535422323 Blue Ant Television Ltd. Specialty (category B service) English 176
RDS Info (formerly Réseau Info Sports (RIS) 205424063 Le Réseau des sports (RDS) inc. Specialty (category A service) French 177
Reality TV 535428892 Shaw Television Limited Partnership Specialty (category B service) English 178
Red Hot TV (Red Light District TV) 305424731 TEN Broadcasting Inc. Specialty (category B service) English 179
Rewind (formerly Movieola) 305425599 Moviola: Short Film Channel Inc. Specialty (category B service) English 180
Rogers on Demand 305424137 Rogers Communications Partnership Video-on-Demand Bilingual 181
RTVi+ (formerly Centre TV & previously Russian TV Two) 535417671 Ethnic Channels Group Limited Specialty (category B service) Ethnic 182
RTVi (formerly Russian TV One) 535417663 Ethnic Channels Group Limited Specialty (category B service) Ethnic 183
Sahara Filmy 535426044 Soundview Entertainment Inc. Specialty (category B service) Ethnic 184
Salt & Light (Inner Peace Television Network) 305428436 Salt and Light Catholic Media Foundation Specialty (category B service) English 185
Saskatchewan Telecommunications, Regina 535423230 Saskatchewan Telecommunications Pay-per-view programming English 186
SBTN (formerly Vietnamese TV) 535417704 Ethnic Channels Group Limited Specialty (category B service) Ethnic 187
Seaside Communications Inc., Reserve Mines 535423389 Seaside Communications Inc. Video-on-Demand Bilingual 188
Séries+ 205421564 8504652 Canada Inc. Specialty (category A service) French 189
Shaw on Demand 405424144 Shaw Cablesystems (VCI) Limited Video-on-Demand Bilingual 190
Shaw Pay-Per-View (formerly Allarcom) 405416430 Shaw Pay-Per-View Ltd. Pay-per-view Direct-to-Home English 191
Shaw Pay-Per-View (formerly Home Theatre (pay-per-view)) 435408117 Shaw Pay-Per-View Ltd. Pay-per-view programming English 192
Showcase 315413732 Showcase Television Inc. Specialty (category A service) English 193
Silver Screen Classics 535417803 1490525 Ontario Inc. Specialty (category B service) English 194
Sky TG 24 Canada (formerly Network Italia) 305425416 Telelatino Network Inc. Specialty (category B service) Ethnic 195
Slice 315413724 Life Network Inc. Specialty (category A service) English 196
Smithsonian Channel (formerly eqhd) 535422357 Blue Ant Television Ltd. Specialty (category B service) English 197
Sogetel inc., Nicolet 535428404 Sogetel inc. Video-on-Demand Bilingual 198
Source Cable Limited, Hamilton (Part of) 535425707 Source Cable Limited Video-on-Demand English 199
Space (formerly Space: The Imagination Station) 305417306 Bell Media Inc. Specialty (category A service) English 200
Sportsnet 360 (formerly The Score) 305417356 Rogers Media Inc. Specialty (category A service) English 201
Sportsnet (formerly Rogers Sportsnet) 305417265 Rogers Media Inc. Specialty (category C service) English 202
Sportsnet One (formerly Rogers Sportsnet One) 535429527 Rogers Media Inc. Specialty (category C service) English 203
Sportsnet PPV 305417207 Rogers Communications Partnership Pay-per-view programming English 204
Sportsnet World (formerly Setanta Sports (Canada)) 535426052 Rogers Media Inc. Specialty (category B service) English 205
SSTV 305425325 S. S. TV Inc. Specialty (category B service) Ethnic 206
Sundance Channel (formerly Drive-In Classics Channel) 305427644 7202342 Canada Inc. Specialty (category B service) English 207
Sun News 535431241 Sun News General Partnership Specialty (category C service) English 208
Super Channel (formerly Allarco Entertainment) 535422406 Allarco Entertainment Limited Partnership Pay-TV (category A service) English 209
Super Écran 214300535 Bell Media Inc. Pay-TV (category A service) French 210
Talentvision 515408441 Fairchild Television Ltd. Specialty (category A service) Ethnic 211
Talentvision II 535435722 Fairchild Television Ltd. Specialty (category B service) Ethnic 212
Tamil One (formerly TAMIL TV & ITBC Television Network) 305429997 TamilOne Inc. Specialty (category B service) Ethnic 213
Tamil Vision Channel 305427917 Tamil Vision Inc. Specialty (category B service) Ethnic 214
TBayTel, Thunder Bay 535427266 TBayTel Video-on-Demand Bilingual 215
Telebimbi (formerly All Italian Children's Television) 535433825 Telelatino Network Inc. Specialty (category B service) Ethnic 216
Telelatino 314600552 Telelatino Network Inc. Specialty (category A service) Ethnic 217
Télémagino (formerly Disney Junior) 535421862 DHX Television Ltd. Specialty (category B service) French 218
"Teleniños" (formerly All Spanish Children's Television) 535433817 Telelatino Network Inc. Specialty (category B service) Ethnic 219

TELETOON/TÉLÉTOON 305417231 TELETOON Canada Inc. Specialty (category A service) Bilingual 220
TELUS Communications Company, Edmonton 535417738 TELUS Communications Company Video-on-Demand Bilingual 221
Ten Cricket (formerly ECGL Cricket TV) 535438148 Ethnic Channels Group Limited Specialty (category B service) English/Ethnic 222
The Beautiful Little Channel (formerly Classical Digital) 535424428 ZoomerMedia Limited Specialty (category B service) English 223
The Brand New ONE Body, Mind, Spirit, Love Channel 305423915 ZoomerMedia Limited Specialty (category A service) English 224
The Comedy Network 305417215 Bell Media Inc. Specialty (category A service) English 225
The Cult Movie Channel 535417126 The Cult Movie Channel Inc. Specialty (category B service) English 226
The Independent Film Channel Canada 105424006 Showcase Television Inc. Specialty (category A service) English 227
The Israeli Network (formerly Israeli TV 1) 535419461 Ethnic Channels Group Limited Specialty (category B service) Ethnic 228
The Movie Network 314600354 Bell Media Inc. Pay-TV (category A service) English 229
The Movie Network Encore (formerly Mpix) 315413716 Bell Media Inc. Pay-TV (category A service) English 230
The NHL Network 305425789 The NHL Network Inc. Specialty (category B service) English 231
The Pet Network 305424822 Stornoway Communications Limited Partnership Specialty (category B service) English 232
The Rural Channel 535426911 Ag-Com Productions Ltd. Specialty (category B service) English 233
The Seasonal Channel 535435699 Stingray Digital Group Inc. Specialty (category B service) No Language 234
The Sports Network (TSN) 314600537 The Sports Network Inc. Specialty (category C service) English 235
TheWeather Network / MétéoMédia 214301194 Pelmorex Communications Inc. Specialty (category A service) Bilingual 236
travel + escape 305423999 Blue Ant Media Partnership Specialty (category A service) English 237
TreeHouse TV 305417281 YTV Canada, Inc. Specialty (category A service) English 238
TV5 214301103 TV5 Québec Canada Specialty (category A service) French 239
TVA Sports 535429486 Groupe TVA inc. Specialty (category C service) French 240
Univision Canada (formerly TLN en Español) 535423082 Telelatino Network Inc. Specialty (category B service) Ethnic 241
UTV Movies 535429444 Soundview Entertainment Inc. Specialty (category B service) Ethnic 242
Viceland (formerly The Biography Channel) 305424012 Rogers Media Inc. Specialty (category A service) English 243
Viewer's Choice Canada (PPV) 315405639 Viewer's Choice Canada Inc. Pay-per-view programming English 244
Vision TV 314600834 ZoomerMedia Limited Specialty (category A service) English 245
Vivid TV (formerly Vanessa) 535426169 Télévision Sex-Shop inc. Pay-TV (category B service) Bilingual 246
VRAK.TV 214301111 Bell Media Inc. Specialty (category A service) French 247
Westman Media Cooperative Ltd., Brandon 535417720 Westman Media Cooperative Ltd. Video-on-Demand Bilingual 248
Wightman Telecom Ltd., Clifford 535426937 Wightman Telecom Ltd. Video-on-Demand English 249
Wild tv (The Hunting Channel) 535417118 Wild TV Inc. Specialty (category B service) English 250
WIN TV (formerly Caribbean HDTV) 535433643 WIN HDTV (Canada) Incorporated Specialty (category B service) English/Ethnic 251
W Movies (formerly SexTV: The Channel) 305427636 7202377 Canada Inc. Specialty (category B service) English 252
W Network 415413806 W Network Inc. Specialty (category A service) English 253
World Fishing Network (WFN-TV) 535420393 World Fishing Network ULC Specialty (category B service) English 254
YOOPA (formerly TVA Junior) 535429402 Groupe TVA inc. Specialty (category B service) French 255
YTV 314600842 YTV Canada, Inc. Specialty (category A service) English 256
Zee Cinema Canada (formerly Bollywood SD) 535434500 Ethnic Channels Group Limited Specialty (category B service) Ethnic 257
Zee Premier Canada (Bollywood Movies TV) 535435821 Ethnic Channels Group Limited Specialty (category B service) Ethnic 258
Zee TV Canada (formerly Hindi Women’s TV) 535435681 Ethnic Channels Group Limited Specialty (category B service) Ethnic 259
Zeste (formerly Cuisine) 535426961 Zeste Diffusion inc. Specialty (category B service) French 260
Zing (formerly Hindi Music TV) 535435847 Ethnic Channels Group Limited Specialty (category B service) Ethnic 261
Ztélé (formerly Canal Z) 205421572 Bell Media Inc. Specialty (category A service) French 262

(a) a Canadian programming service that is designated as such by the Commission; or
(b) (i) a pay television service other than a Category 2 service that was designated as such by the Commission before that day and other
than a Category C service, or
(ii) a specialty service other than a Category 2 service that was designated as such by the Commission before that day and other than a
Category C service. (service de catégorie A)
(a) (b)
(a) a Canadian programming service that is designated as such by the Commission; or
(b)
for the remainder of the term of a licence that was issued before September 1, 2011, a Category 2 service that was designated as such by
the Commission before that day, other than a Category C service. (service de catégorie B)
“Category C service” means
a pay television service or a specialty service that is subject to the conditions of licence set out in the appendices to Broadcasting
Regulatory Policy CRTC 2009-562, dated September 4, 2009 and entitled Conditions of licence for competitive Canadian specialty
services operating in the genres of mainstream sports and national news, as amended from time to time. (service de catégorie C)
In Broadcasting Regulatory Policy CRTC 2011-601 - Regulatory framework relating to vertical integration, the Commission determined it will
publish complete financial information for specialty Category A services and specialty Category B services owned or controlled by a vertically
integrated entity. The Commission also determined it will publish partial financial information for all independent individual specialty Category B
services including total revenues, total programming expenses, and total Canadian programming expenses. Complete financial information for
all independent specialty Category B services on an aggregate basis is also included in this publication.
Beginning in broadcast year 2012, pay and specialty services were classified in the newly defined categories A, B and C. The definitions as
outlined in the Broadcast Distribution Regulations are explained as follows:
“Category A service” means
for the remainder of the term of a licence that was issued before September 1, 2011,
“Category B service”, except as set out in subsection 19(2), meansa Canadian programming service that is designated as such by the Commission; or
NOTICE TO READER
- I -

VERTICALLY INTEGRATED COMPANIES - CATEGORY B SPECIALTY SERVICES
2011 2012 Var % 2013 Var % 2014 Var % 2015 Var % CAGR (%)
($) Reporting Units 24 27 139 27 139 27 139 27 139
Revenue y1 y2 y3 y4 y5
Residential/bulk/smatv subscriber revenue 73,641,260 90,323,623 22.65 107,672,607 19.21 110,878,532 2.98 121,157,598 9.27 13.3
DTH revenue 45,561,226 47,077,375 3.33 47,292,808 0.46 47,927,601 1.34 45,382,786 -5.31 -0.1
Local advertising revenue 0 0 n/a 0 n/a 0 n/a 0 n/a n/a
National advertising revenue 46,205,991 57,577,453 24.61 67,291,122 16.87 74,719,219 11.04 77,150,731 3.25 13.7
Other revenue 779,864 735,960 -5.63 344,492 -53.19 393,538 14.24 312,817 -20.51 -20.4
Total Revenue 166,188,341 195,714,411 17.77 222,601,029 13.74 233,918,890 5.08 244,003,932 4.31 10.1
ExpensesProgramming and Production 62,324,438 71,106,741 14.09 82,345,668 15.81 97,042,355 17.85 102,793,405 5.93 13.3
Technical 11,099,170 12,576,209 13.31 12,070,284 -4.02 11,600,463 -3.89 11,289,700 -2.68 0.4
Sales and Promotion 10,930,411 10,159,591 -7.05 11,627,893 14.45 7,613,905 -34.52 7,810,087 2.58 -8.1
Administration and General 16,272,608 18,749,382 15.22 21,919,107 16.91 26,085,277 19.01 28,414,193 8.93 15.0
Total Expenses 100,626,627 112,591,923 11.89 127,962,952 13.65 142,342,000 11.24 150,307,385 5.60 10.6
Operating Income 65,561,714 83,122,488 94,638,077 91,576,890 93,696,547
Depreciation 1,761,136 1,515,493 -13.95 1,257,728 -17.01 1,317,912 4.79 1,529,229 16.03 -3.5
P.B.I.T. 63,800,578 81,606,995 93,380,349 90,258,978 92,167,318
Interest Expense 4,371,455 2,242,440 1,884,488 1,310,771 809,842
Adjustments - Gain (Loss) 181,544 -901,898 -1,926,638 -1,899,722 -671,528
Pre-tax Profit 59,610,667 78,462,657 89,569,223 87,048,485 90,685,948
Canadian Programming ExpensesAcquisition of rights 13,876,751 17,894,853 28.96 21,309,457 19.08 25,498,561 19.66 27,992,706 9.78 19.2
Script & concept 25,000 20,000 -20.00 65,703 228.52 31,545 -51.99 33,803 7.16 7.8
Filler Programming + Program Production 6,084,089 10,208,786 67.79 11,203,241 9.74 9,930,996 -11.36 10,259,753 3.31 14.0
Investment in Programming 0 0 n/a 0 n/a 0 n/a 0 n/a n/a
Total Canadian Programming 19,985,840 28,123,639 40.72 32,578,401 15.84 35,461,102 8.85 38,286,262 7.97 17.7
Canadian Programming / Revenue (%) 12.03 14.37 14.64 15.16 15.69
Total Remuneration ($) 10,251,390 16,737,579 63.27 16,308,223 -2.57 15,952,575 -2.18 16,371,789 2.63 12.4
Average Staff Count 160.51 207.80 29.46 207.16 -0.31 182.81 -11.75 178.52 -2.35
Average Remuneration ($) 63,868 80,547 26.11 78,723 -2.26 87,263 10.85 91,708 5.09 9.5
Average Remuneration excl. Benefits ($) n/a n/a n/a n/a n/a 73,953 n/a 76,516 3.47 n/a
Profitability (%)Operating Margin 39.5 42.5 42.5 39.1 38.4
P.B.I.T. Margin 38.4 41.7 41.9 38.6 37.8
Pre-tax Margin 35.9 40.1 40.2 37.2 37.2
CRTC - FINANCIAL SUMMARY - SPECIALTY SERVICES
CAGR = Compound Annual Growth Rate
- II -

NON-VERTICALLY INTEGRATED COMPANIES - CATEGORY B SPECIALTY SERVICES
2011 2012 Var % 2013 Var % 2014 Var % 2015 Var % CAGR (%)
($) Reporting Units 74 91 480 99 480 96 480 94 480
Revenue y1 y2 y3 y4 y5
Residential/bulk/smatv subscriber revenue 69,991,892 82,760,194 18.24 104,779,679 26.61 102,069,024 -2.59 109,724,035 7.50 11.9
DTH revenue 47,143,404 48,153,871 2.14 46,909,745 -2.58 43,482,877 -7.31 42,297,265 -2.73 -2.7
Local advertising revenue 3,876,448 4,413,514 13.85 6,190,443 40.26 7,001,895 13.11 7,709,671 10.11 18.8
National advertising revenue 25,806,951 31,360,554 21.52 37,980,346 21.11 37,668,325 -0.82 27,524,869 -26.93 1.6
Other revenue 15,868,215 15,030,322 -5.28 18,829,764 25.28 17,841,367 -5.25 20,558,091 15.23 6.7
Total Revenue 162,686,910 181,718,455 11.70 214,689,977 18.14 208,063,488 -3.09 207,813,931 -0.12 6.3
ExpensesProgramming and Production 64,890,131 82,675,220 27.41 104,723,792 26.67 99,347,902 -5.13 100,677,582 1.34 11.6
Technical 24,241,247 26,525,776 9.42 26,630,111 0.39 24,285,775 -8.80 27,009,921 11.22 2.7
Sales and Promotion 16,746,218 19,255,130 14.98 19,660,981 2.11 14,573,060 -25.88 14,557,393 -0.11 -3.4
Administration and General 39,568,544 38,003,642 -3.95 39,350,003 3.54 42,656,191 8.40 30,656,398 -28.13 -6.2
Total Expenses 145,446,140 166,459,768 14.45 190,364,887 14.36 180,862,928 -4.99 172,901,294 -4.40 4.4
Operating Income 17,240,770 15,258,687 24,325,090 27,200,560 34,912,637
Depreciation 3,619,590 5,607,449 54.92 6,355,160 13.33 5,484,883 -13.69 5,079,220 -7.40 8.8
P.B.I.T. 13,621,180 9,651,238 17,969,930 21,715,677 29,833,417
Interest Expense 9,007,092 1,369,392 2,875,730 2,979,698 2,554,224
Adjustments - Gain (Loss) -638,826 -3,611,366 -3,009,685 166,267 -7,984,997
Pre-tax Profit 3,975,262 4,670,480 12,084,515 18,902,246 19,294,196
Canadian Programming ExpensesAcquisition of rights 10,668,477 14,378,573 34.78 17,677,017 22.94 9,954,536 -43.69 13,173,627 32.34 5.4
Script & concept 733,358 1,045,782 42.60 946,652 -9.48 1,158,459 22.37 1,006,922 -13.08 8.3
Filler Programming + Program Production 22,624,163 27,622,431 22.09 29,232,618 5.83 29,400,127 0.57 23,856,310 -18.86 1.3
Investment in Programming 1,078,554 1,540,489 42.83 1,367,410 -11.24 1,512,095 10.58 2,783,211 84.06 26.7
Total Canadian Programming 35,104,552 44,587,275 27.01 49,223,697 10.40 42,025,217 -14.62 40,820,070 -2.87 3.8
Canadian Programming / Revenue (%) 21.58 24.54 22.93 20.20 19.64
Total Remuneration ($) 33,234,580 41,198,569 23.96 42,649,125 3.52 34,744,584 -18.53 32,214,388 -7.28 -0.8
Average Staff Count 683.84 755.40 10.46 763.58 1.08 864.49 13.22 596.02 -31.06
Average Remuneration ($) 48,600 54,539 12.22 55,854 2.41 40,191 -28.04 54,049 34.48 2.7
Average Remuneration excl. Benefits ($) n/a n/a n/a n/a 35,104 n/a 49,924 42.22 n/a
Profitability (%)Operating Margin 10.6 8.4 11.3 13.1 16.8
P.B.I.T. Margin 8.4 5.3 8.4 10.4 14.4
Pre-tax Margin 2.4 2.6 5.6 9.1 9.3
CRTC - FINANCIAL SUMMARY - SPECIALTY SERVICES
CAGR = Compound Annual Growth Rate
- III -

Undertaking # Service Name
535435813 Aajtak Canada (formerly Hindi News)
2011 2012 Var % 2013 Var % 2014 Var % 2015 Var %
y4 y5
86,006 171,784 99.73
59,067 37,320 -36.82
4,920 2,997 -39.09
6,561 3,996 -39.09
21,321 12,988 -39.08
0 0
32,802 19,981 -39.09
38.14 11.63
RevenueResidential/bulk/smatv subscriber revenueDTH revenue
Ethnic Channels Group Limited Levin, Slava Specialty (category B service) 2015
($) CAGR (%)
CRTC - FINANCIAL SUMMARY - PAY & SPECIALTY
Pay and Specialty
Licensee Licensee Ultimate Owner Type Year
Pre-tax Profit
Canadian Programming ExpensesAcquisition of rights
P.B.I.T.
Interest ExpenseAdjustments - Gain (Loss)
Total ExpensesOperating IncomeDepreciation
TechnicalSales and PromotionAdministration and General
Total RevenueExpensesProgramming and Production
Local advertising revenueNational advertising revenueOther revenue
Pre-tax MarginCAGR = Compound Annual Growth Rate
Profitability (%)Operating MarginP.B.I.T. Margin
Average Staff CountAverage Remuneration ($)
Subscribers
Total Canadian Programming
Canadian Programming/Revenue (%)
Total Remuneration ($)
Script & conceptFiller Programming + Program ProductionInvestment in Programming
Page 1

Undertaking # Service Name
535420369 AASTHA (South Asian Devotional Music
& Discourse Channel)
2011 2012 Var % 2013 Var % 2014 Var % 2015 Var %
y1 y2 y3 y4
34,869 37,869 8.60 115,559 205.15 96,974 -16.08 -100.00
64,757 70,329 8.60 0 -100.00 0
3,446 8,728 153.28 16,008 83.41 13,433 -16.09 -100.00
1,855 4,700 153.37 0 -100.00 0
0 0 0 0
104,927 121,626 15.91 131,567 8.17 110,407 -16.08 -100.00
83,024 82,718 -0.37 90,845 9.82 62,519 -31.18 -100.00
42,366 44,831 5.82 38,908 -13.21 27,904 -28.28 -100.00
17,968 23,075 28.42 4,749 -79.42 1,424 -70.01 -100.00
49,026 25,437 -48.12 3,376 -86.73 1,938 -42.59 -100.00
192,384 176,061 -8.48 137,878 -21.69 93,785 -31.98 -100.00
-87,457 -54,435 -6,311 16,622
920 1,407 52.93 14,087 901.21 2,286 -83.77 -100.00
-88,377 -55,842 -20,398 14,336
-61 51 -183.61 1,782 >999± 1,403 -21.27 -100.00
-16 250 >999± 0 -100.00 0
-88,332 -55,643 -22,180 12,933
0 0 0 0
0 0 0 0
55,487 52,167 -5.98 25,061 -51.96 7,315 -70.81 -100.00
0 0 0 0
55,487 52,167 -5.98 25,061 -51.96 7,315 -70.81 -100.00
52.88 42.89 19.05 6.63
81,508 53,696 -34.12 20,261 -62.27 0 -100.00
3 1.19 -60.33 0.43 -63.87 0 -100.00
27,169 45,123 66.08 47,119 4.42
4,881 4,466 -8.50 4,313 -3.43 3,525 -18.27 -100.00
-83.4 -44.8 -4.8 15.1
-84.2 -45.9 -15.5 13.0
-84.2 -45.7 -16.9 11.7
CRTC - FINANCIAL SUMMARY - PAY & SPECIALTY
Pay and Specialty
Licensee Licensee Ultimate Owner Type Year
Total ExpensesOperating IncomeDepreciation
TechnicalSales and PromotionAdministration and General
Total RevenueExpensesProgramming and Production
Local advertising revenueNational advertising revenueOther revenue
RevenueResidential/bulk/smatv subscriber revenueDTH revenue
Asian Television Network
International Limited
Chandrasekar, Shan Pay-TV (category B service) 2014
($) CAGR (%)
Profitability (%)Operating MarginP.B.I.T. Margin
Average Staff CountAverage Remuneration ($)
Subscribers
Total Canadian Programming
Canadian Programming/Revenue (%)
Total Remuneration ($)
Script & conceptFiller Programming + Program ProductionInvestment in Programming
Pre-tax Profit
Canadian Programming ExpensesAcquisition of rights
P.B.I.T.
Interest ExpenseAdjustments - Gain (Loss)
Pre-tax MarginCAGR = Compound Annual Growth Rate
Page 2
Undertaking # Service Name
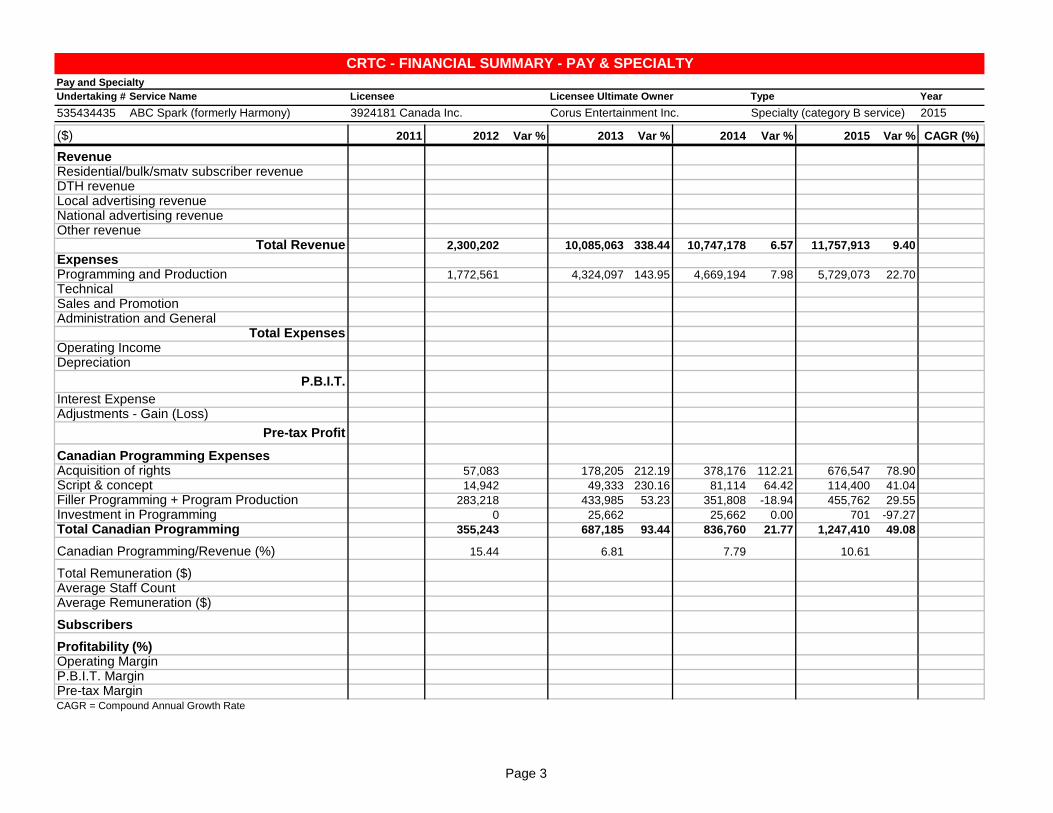
535434435 ABC Spark (formerly Harmony)
2011 2012 Var % 2013 Var % 2014 Var % 2015 Var %
y2 y3 y4 y5
2,300,202 10,085,063 338.44 10,747,178 6.57 11,757,913 9.40
1,772,561 4,324,097 143.95 4,669,194 7.98 5,729,073 22.70
57,083 178,205 212.19 378,176 112.21 676,547 78.90
14,942 49,333 230.16 81,114 64.42 114,400 41.04
283,218 433,985 53.23 351,808 -18.94 455,762 29.55
0 25,662 25,662 0.00 701 -97.27
355,243 687,185 93.44 836,760 21.77 1,247,410 49.08
15.44 6.81 7.79 10.61
Total RevenueExpensesProgramming and Production
Local advertising revenueNational advertising revenueOther revenue
RevenueResidential/bulk/smatv subscriber revenueDTH revenue
3924181 Canada Inc. Corus Entertainment Inc. Specialty (category B service) 2015
($) CAGR (%)
CRTC - FINANCIAL SUMMARY - PAY & SPECIALTY
Pay and Specialty
Licensee Licensee Ultimate Owner Type Year
Total Canadian Programming
Canadian Programming/Revenue (%)
Total Remuneration ($)
Script & conceptFiller Programming + Program ProductionInvestment in Programming
Pre-tax Profit
Canadian Programming ExpensesAcquisition of rights
P.B.I.T.
Interest ExpenseAdjustments - Gain (Loss)
Total ExpensesOperating IncomeDepreciation
TechnicalSales and PromotionAdministration and General
Pre-tax MarginCAGR = Compound Annual Growth Rate
Profitability (%)Operating MarginP.B.I.T. Margin
Average Staff CountAverage Remuneration ($)
Subscribers
Page 3

Undertaking # Service Name
535437471 Aboriginal Peoples Television Network
(APTN)
2011 2012 Var % 2013 Var % 2014 Var % 2015 Var %
y4 y5
38,404,232 40,404,938 5.21
0 0
0 0
2,392,669 2,664,900 11.38
2,391,086 2,284,116 -4.47
43,187,987 45,353,954 5.02
21,898,118 22,266,000 1.68
6,182,991 5,832,397 -5.67
3,120,479 3,176,398 1.79
5,288,754 5,593,853 5.77
36,490,342 36,868,648 1.04
6,697,645 8,485,306
1,837,841 1,655,106 -9.94
4,859,804 6,830,200
365,051 456,068 24.93
54,874 39,248 -28.48
4,549,627 6,413,380
14,793,786 14,854,570 0.41
971,312 1,200,896 23.64
5,648,305 5,791,007 2.53
0 0
21,413,403 21,846,473 2.02
49.58 48.17
11,762,079 11,859,829 0.83
162 160 -1.23
72,605 74,124 2.09
11,035,699 10,861,542 -1.58
15.5 18.7
11.3 15.1
10.5 14.1
RevenueResidential/bulk/smatv subscriber revenueDTH revenue
Aboriginal Peoples Television
Network Incorporated
Aboriginal Peoples Television
Network Incorporated
Specialty (category A service) 2015
($) CAGR (%)
CRTC - FINANCIAL SUMMARY - PAY & SPECIALTY
Pay and Specialty
Licensee Licensee Ultimate Owner Type Year
Pre-tax Profit
Canadian Programming ExpensesAcquisition of rights
P.B.I.T.
Interest ExpenseAdjustments - Gain (Loss)
Total ExpensesOperating IncomeDepreciation
TechnicalSales and PromotionAdministration and General
Total RevenueExpensesProgramming and Production
Local advertising revenueNational advertising revenueOther revenue
Pre-tax MarginCAGR = Compound Annual Growth Rate
Profitability (%)Operating MarginP.B.I.T. Margin
Average Staff CountAverage Remuneration ($)
Subscribers
Total Canadian Programming
Canadian Programming/Revenue (%)
Total Remuneration ($)
Script & conceptFiller Programming + Program ProductionInvestment in Programming
Page 4

Undertaking # Service Name
535417605 Abu Dhabi TV (formerly Arabic TV)
2011 2012 Var % 2013 Var % 2014 Var % 2015 Var %
y1 y2 y3 y4 y5
61,557 111,145 80.56 107,828 -2.98 111,224 3.15 148,291 33.33
28,616 40,903 42.94 37,513 -8.29 34,029 -9.29 19,275 -43.36
2,025 4,041 99.56 3,639 -9.95 5,104 40.26 2,301 -54.92
2,700 5,387 99.52 4,852 -9.93 6,806 40.27 3,067 -54.94
8,776 17,510 99.52 15,769 -9.94 22,118 40.26 9,970 -54.92
0 0 0 0 0
13,501 26,938 99.53 24,260 -9.94 34,028 40.26 15,338 -54.93
21.93 24.24 22.50 30.59 10.34
CRTC - FINANCIAL SUMMARY - PAY & SPECIALTY
Pay and Specialty
Licensee Licensee Ultimate Owner Type Year
Total ExpensesOperating IncomeDepreciation
TechnicalSales and PromotionAdministration and General
Total Revenue 24.6
ExpensesProgramming and Production -9.4
Local advertising revenueNational advertising revenueOther revenue
RevenueResidential/bulk/smatv subscriber revenueDTH revenue
Ethnic Channels Group Limited Levin, Slava Specialty (category B service) 2015
($) CAGR (%)
Profitability (%)Operating MarginP.B.I.T. Margin
Average Staff CountAverage Remuneration ($)
Subscribers
Total Canadian Programming 3.2
Canadian Programming/Revenue (%)
Total Remuneration ($)
Script & concept 3.2
Filler Programming + Program Production 3.2
Investment in Programming
Pre-tax Profit
Canadian Programming ExpensesAcquisition of rights 3.3
P.B.I.T.
Interest ExpenseAdjustments - Gain (Loss)
Pre-tax MarginCAGR = Compound Annual Growth Rate
Page 5

Undertaking # Service Name
535427844 Access Communications Co-operative
Limited, Regina
2011 2012 Var % 2013 Var % 2014 Var % 2015 Var %
y1 y2 y3 y4 y5
563,087 617,639 9.69 536,238 -13.18 531,197 -0.94 452,394 -14.83
0 0 0 0 0
0 0 0 0 0
0 0 0 0 0
0 0 0 0 0
563,087 617,639 9.69 536,238 -13.18 531,197 -0.94 452,394 -14.83
603,815 638,248 5.70 585,469 -8.27 594,629 1.56 476,169 -19.92
0 0 0 0 0
0 0 0 0 0
0 0 0 0 0
603,815 638,248 5.70 585,469 -8.27 594,629 1.56 476,169 -19.92
-40,728 -20,609 -49,231 -63,432 -23,775
0 0 0 0 0
-40,728 -20,609 -49,231 -63,432 -23,775
0 0 0 0 0
0 0 0 0 0
-40,728 -20,609 -49,231 -63,432 -23,775
0 0
0 0
0 0
0 0
0 0
0.00 0.00
0 0 0 0 0
0 0 0 0 0
-7.2 -3.3 -9.2 -11.9 -5.3
-7.2 -3.3 -9.2 -11.9 -5.3
-7.2 -3.3 -9.2 -11.9 -5.3
Total Revenue -5.3
ExpensesProgramming and Production -5.8
Local advertising revenueNational advertising revenueOther revenue
RevenueResidential/bulk/smatv subscriber revenue -5.3
DTH revenue
Access Communications Co-
operative Limited
Access Communications Co-
operative Limited
Video-on-Demand 2015
($) CAGR (%)
CRTC - FINANCIAL SUMMARY - PAY & SPECIALTY
Pay and Specialty
Licensee Licensee Ultimate Owner Type Year
Total Canadian Programming
Canadian Programming/Revenue (%)
Total Remuneration ($)
Script & conceptFiller Programming + Program ProductionInvestment in Programming
Pre-tax Profit
Canadian Programming ExpensesAcquisition of rights
P.B.I.T.
Interest ExpenseAdjustments - Gain (Loss)
Total Expenses -5.8
Operating IncomeDepreciation
TechnicalSales and PromotionAdministration and General
Pre-tax MarginCAGR = Compound Annual Growth Rate
Profitability (%)Operating MarginP.B.I.T. Margin
Average Staff CountAverage Remuneration ($)
Subscribers
Page 6

Undertaking # Service Name
305424997 ACTION (formerly Showcase Action)
2011 2012 Var % 2013 Var % 2014 Var % 2015 Var %
y1 y2 y3 y4 y5
4,304,985 6,370,581 47.98 7,177,091 12.66 7,708,867 7.41 8,036,696 4.25
4,099,636 3,458,758 -15.63 3,863,649 11.71 4,352,452 12.65 4,255,325 -2.23
0 0 0 0 0
8,306,057 9,224,075 11.05 9,643,848 4.55 10,302,216 6.83 8,243,353 -19.98
0 0 0 0 0
16,710,678 19,053,414 14.02 20,684,588 8.56 22,363,535 8.12 20,535,374 -8.17
4,031,098 4,089,758 1.46 5,113,850 25.04 5,596,152 9.43 5,550,101 -0.82
676,435 667,518 -1.32 652,392 -2.27 646,549 -0.90 653,280 1.04
339,651 665,873 96.05 453,373 -31.91 271,372 -40.14 223,176 -17.76
1,083,908 909,693 -16.07 988,632 8.68 1,563,880 58.19 1,554,149 -0.62
6,131,092 6,332,842 3.29 7,208,247 13.82 8,077,953 12.07 7,980,706 -1.20
10,579,586 12,720,572 13,476,341 14,285,582 12,554,668
0 1,827 0 -100.00 0 0
10,579,586 12,718,745 13,476,341 14,285,582 12,554,668
363,842 10,134 -97.21 8,295 -18.15 2,057 -75.20 0 -100.00
0 0 0 0 0
10,215,744 12,708,611 13,468,046 14,283,525 12,554,668
232,235 488,761 110.46 482,694 -1.24 490,697 1.66 454,557 -7.37
0 0 0 0 0
321,214 359,390 11.88 338,799 -5.73 439,428 29.70 397,463 -9.55
0 0 0 0 0
553,449 848,151 53.25 821,493 -3.14 930,125 13.22 852,020 -8.40
3.31 4.45 3.97 4.16 4.15
742,735 986,546 32.83 938,486 -4.87 1,396,908 48.85 1,231,281 -11.86
10 12 20.00 11 -8.33 15 36.36 13 -13.33
74,274 82,212 10.69 85,317 3.78 93,127 9.15 94,714 1.70
4,479,329 4,563,675 1.88 4,581,044 0.38 4,493,460 -1.91 4,333,013 -3.57
63.3 66.8 65.2 63.9 61.1
63.3 66.8 65.2 63.9 61.1
61.1 66.7 65.1 63.9 61.1
RevenueResidential/bulk/smatv subscriber revenue 16.9
DTH revenue 0.9
Showcase Television Inc. Shaw Communications Inc. Specialty (category B service) 2015
($) CAGR (%)
CRTC - FINANCIAL SUMMARY - PAY & SPECIALTY
Pay and Specialty
Licensee Licensee Ultimate Owner Type Year
Pre-tax Profit
Canadian Programming ExpensesAcquisition of rights 18.3
P.B.I.T.
Interest ExpenseAdjustments - Gain (Loss)
Total Expenses 6.8
Operating IncomeDepreciation
Technical -0.9
Sales and Promotion -10.0
Administration and General 9.4
Total Revenue 5.3
ExpensesProgramming and Production 8.3
Local advertising revenueNational advertising revenue -0.2
Other revenue
Pre-tax MarginCAGR = Compound Annual Growth Rate
Profitability (%)Operating MarginP.B.I.T. Margin
Average Staff CountAverage Remuneration ($) 6.3
Subscribers -0.8
Total Canadian Programming 11.4
Canadian Programming/Revenue (%)
Total Remuneration ($) 13.5
Script & conceptFiller Programming + Program Production 5.5
Investment in Programming
Page 7

Undertaking # Service Name
205424104 addikTV (formerly Mystère)
2011 2012 Var % 2013 Var % 2014 Var % 2015 Var %
y1 y2 y3 y4 y5
3,021,749 3,669,608 21.44 4,292,762 16.98 4,840,027 12.75 6,203,679 28.17
2,089,341 2,173,622 4.03 2,318,273 6.65 2,587,404 11.61 2,009,539 -22.33
0 0 0 0 0
1,403,908 2,657,942 89.32 3,769,472 41.82 3,622,691 -3.89 3,835,046 5.86
9,004 145,564 >999± 213,364 46.58 140,749 -34.03 83,683 -40.54
6,524,002 8,646,736 32.54 10,593,871 22.52 11,190,871 5.64 12,131,947 8.41
4,049,391 5,117,836 26.39 6,273,012 22.57 7,772,011 23.90 8,312,511 6.95
490,854 670,044 36.51 579,667 -13.49 448,130 -22.69 407,085 -9.16
545,274 752,231 37.95 1,231,645 63.73 945,420 -23.24 936,764 -0.92
140,608 129,928 -7.60 157,646 21.33 442,230 180.52 498,484 12.72
5,226,127 6,670,039 27.63 8,241,970 23.57 9,607,791 16.57 10,154,844 5.69
1,297,875 1,976,697 2,351,901 1,583,080 1,977,103
100,000 100,000 0.00 100,000 0.00 100,000 0.00 100,000 0.00
1,197,875 1,876,697 2,251,901 1,483,080 1,877,103
250,000 105,416 -57.83 108,250 2.69 85,964 -20.59 59,231 -31.10
0 0 0 0 0
947,875 1,771,281 2,143,651 1,397,116 1,817,872
1,933,364 2,526,820 30.70 3,349,080 32.54 4,224,102 26.13 4,657,074 10.25
0 35,587 0 -100.00 0 0
0 0 0 0 0
0 0 0 0 0
1,933,364 2,562,407 32.54 3,349,080 30.70 4,224,102 26.13 4,657,074 10.25
29.63 29.63 31.61 37.75 38.39
172,249 230,054 33.56 163,803 -28.80 106,750 -34.83 276,324 158.85
2 2 0.00 2 0.00 2 0.00 3 50.00
86,125 115,027 33.56 81,902 -28.80 53,375 -34.83 92,108 72.57
872,852 997,196 14.25 1,107,005 11.01 1,252,770 13.17 1,357,748 8.38
19.9 22.9 22.2 14.1 16.3
18.4 21.7 21.3 13.3 15.5
14.5 20.5 20.2 12.5 15.0
CRTC - FINANCIAL SUMMARY - PAY & SPECIALTY
Pay and Specialty
Licensee Licensee Ultimate Owner Type Year
Total Expenses 18.1
Operating IncomeDepreciation 0.0
Technical -4.6
Sales and Promotion 14.5
Administration and General 37.2
Total Revenue 16.8
ExpensesProgramming and Production 19.7
Local advertising revenueNational advertising revenue 28.6
Other revenue 74.6
RevenueResidential/bulk/smatv subscriber revenue 19.7
DTH revenue -1.0
Groupe TVA inc. Les Placements Péladeau inc. Specialty (category A service) 2015
($) CAGR (%)
Profitability (%)Operating MarginP.B.I.T. Margin
Average Staff CountAverage Remuneration ($) 1.7
Subscribers 11.7
Total Canadian Programming 24.6
Canadian Programming/Revenue (%)
Total Remuneration ($) 12.5
Script & conceptFiller Programming + Program ProductionInvestment in Programming
Pre-tax Profit
Canadian Programming ExpensesAcquisition of rights 24.6
P.B.I.T.
Interest ExpenseAdjustments - Gain (Loss)
Pre-tax MarginCAGR = Compound Annual Growth Rate
Page 8

Undertaking # Service Name
535427092 Afroglobal Television
2011 2012 Var % 2013 Var % 2014 Var % 2015 Var %
y2 y3
21,640 7,510 -65.30 -100.00
0 11,800 -100.00
0 10,000 -100.00
0 0
0 0
0 1,800 -100.00
0 11,800 -100.00
0.00 157.12
Total RevenueExpensesProgramming and Production
Local advertising revenueNational advertising revenueOther revenue
RevenueResidential/bulk/smatv subscriber revenueDTH revenue
Afroglobal Network Inc. Afroglobal Network Inc. Specialty (category B service) 2013
($) CAGR (%)
CRTC - FINANCIAL SUMMARY - PAY & SPECIALTY
Pay and Specialty
Licensee Licensee Ultimate Owner Type Year
Total Canadian Programming
Canadian Programming/Revenue (%)
Total Remuneration ($)
Script & conceptFiller Programming + Program ProductionInvestment in Programming
Pre-tax Profit
Canadian Programming ExpensesAcquisition of rights
P.B.I.T.
Interest ExpenseAdjustments - Gain (Loss)
Total ExpensesOperating IncomeDepreciation
TechnicalSales and PromotionAdministration and General
Pre-tax MarginCAGR = Compound Annual Growth Rate
Profitability (%)Operating MarginP.B.I.T. Margin
Average Staff CountAverage Remuneration ($)
Subscribers
Page 9

Undertaking # Service Name
305425763 All TV
2011 2012 Var % 2013 Var % 2014 Var % 2015 Var %
y1 y2 y3 y4 y5
1,246,465 1,389,091 11.44 1,447,416 4.20 1,595,484 10.23 1,448,780 -9.19
570,659 671,486 17.67 715,803 6.60 693,764 -3.08 690,114 -0.53
0 0 0 0 0
0 0 0 0 0
222,466 200,665 -9.80 224,250 11.75 260,073 15.97 218,923 -15.82
0 0 0 0 0
222,466 200,665 -9.80 224,250 11.75 260,073 15.97 218,923 -15.82
17.85 14.45 15.49 16.30 15.11
RevenueResidential/bulk/smatv subscriber revenueDTH revenue
All TV Inc. Lee, Jang Sung Specialty (category B service) 2015
($) CAGR (%)
CRTC - FINANCIAL SUMMARY - PAY & SPECIALTY
Pay and Specialty
Licensee Licensee Ultimate Owner Type Year
Pre-tax Profit
Canadian Programming ExpensesAcquisition of rights
P.B.I.T.
Interest ExpenseAdjustments - Gain (Loss)
Total ExpensesOperating IncomeDepreciation
TechnicalSales and PromotionAdministration and General
Total Revenue 3.8
ExpensesProgramming and Production 4.9
Local advertising revenueNational advertising revenueOther revenue
Pre-tax MarginCAGR = Compound Annual Growth Rate
Profitability (%)Operating MarginP.B.I.T. Margin
Average Staff CountAverage Remuneration ($)
Subscribers
Total Canadian Programming -0.4
Canadian Programming/Revenue (%)
Total Remuneration ($)
Script & conceptFiller Programming + Program Production -0.4
Investment in Programming
Page 10

Undertaking # Service Name
535437356 AMI-télé
2011 2012 Var % 2013 Var % 2014 Var % 2015 Var %
y5
4,525,674
2,072,970
0
0
2,524
6,601,168
4,176,720
473,112
720,978
561,544
5,932,354
668,814
137,985
530,829
0
0
530,829
1,249,301
0
1,825,803
0
3,075,104
46.58
1,477,527
18.17
81,317
2,819,100
10.1
8.0
8.0
CRTC - FINANCIAL SUMMARY - PAY & SPECIALTY
Pay and Specialty
Licensee Licensee Ultimate Owner Type Year
Total ExpensesOperating IncomeDepreciation
TechnicalSales and PromotionAdministration and General
Total RevenueExpensesProgramming and Production
Local advertising revenueNational advertising revenueOther revenue
RevenueResidential/bulk/smatv subscriber revenueDTH revenue
Accessible Media Inc. Accessible Media Inc. Specialty (category A service) 2015
($) CAGR (%)
Profitability (%)Operating MarginP.B.I.T. Margin
Average Staff CountAverage Remuneration ($)
Subscribers
Total Canadian Programming
Canadian Programming/Revenue (%)
Total Remuneration ($)
Script & conceptFiller Programming + Program ProductionInvestment in Programming
Pre-tax Profit
Canadian Programming ExpensesAcquisition of rights
P.B.I.T.
Interest ExpenseAdjustments - Gain (Loss)
Pre-tax MarginCAGR = Compound Annual Growth Rate
Page 11

Undertaking # Service Name
535425674 AMI-tv (formerly The Accessible Channel)
2011 2012 Var % 2013 Var % 2014 Var % 2015 Var %
y1 y2 y3 y4 y5
12,769,802 12,904,403
5,534,052 5,420,227
0 0
0 0
18,546 35,344
15,883,484 17,196,741 8.27 17,431,020 1.36 18,322,400 5.11 18,359,974 0.21
6,140,443 9,370,793 52.61 10,049,581 7.24 10,703,622 6.51 10,698,527 -0.05
2,347,607 1,836,152
1,479,448 1,542,913
2,070,237 1,874,187
16,600,914 15,951,779
1,721,486 2,408,195
828,959 547,933
892,527 1,860,262
0 0
-151,342 -27,271
741,185 1,832,991
2,290,938 4,586,143 100.19 4,069,196 -11.27 4,337,306 6.59 4,898,859 12.95
0 0 0 0 0
1,807,221 2,905,558 60.77 3,566,014 22.73 4,363,250 22.36 3,865,728 -11.40
0 0 0 0 0
4,098,159 7,491,701 82.81 7,635,210 1.92 8,700,556 13.95 8,764,587 0.74
25.80 43.56 43.80 47.49 47.74
5,730,198 4,877,969
71.6 55.52
80,031 87,860
7,745,131 7,625,230
9.4 13.1
4.9 10.1
4.0 10.0
Total Revenue 3.7
ExpensesProgramming and Production 14.9
Local advertising revenueNational advertising revenueOther revenue
RevenueResidential/bulk/smatv subscriber revenueDTH revenue
Accessible Media Inc. Accessible Media Inc. Specialty (category A service) 2015
($) CAGR (%)
CRTC - FINANCIAL SUMMARY - PAY & SPECIALTY
Pay and Specialty
Licensee Licensee Ultimate Owner Type Year
Total Canadian Programming 20.9
Canadian Programming/Revenue (%)
Total Remuneration ($)
Script & conceptFiller Programming + Program Production 20.9
Investment in Programming
Pre-tax Profit
Canadian Programming ExpensesAcquisition of rights 20.9
P.B.I.T.
Interest ExpenseAdjustments - Gain (Loss)
Total ExpensesOperating IncomeDepreciation
TechnicalSales and PromotionAdministration and General
Pre-tax MarginCAGR = Compound Annual Growth Rate
Profitability (%)Operating MarginP.B.I.T. Margin
Average Staff CountAverage Remuneration ($)
Subscribers
Page 12

Undertaking # Service Name
305426266 Animal Planet
2011 2012 Var % 2013 Var % 2014 Var % 2015 Var %
y1 y2 y3 y4 y5
2,260,181 2,850,381 26.11 3,653,545 28.18 4,185,056 14.55 4,239,956 1.31
2,353,095 2,657,670 12.94 2,693,613 1.35 2,600,661 -3.45 2,471,844 -4.95
0 0 0 0 0
1,623,556 1,873,252 15.38 2,274,081 21.40 2,356,799 3.64 3,165,630 34.32
0 0 0 0 2,760
6,236,832 7,381,303 18.35 8,621,239 16.80 9,142,516 6.05 9,880,190 8.07
2,812,910 2,672,263 -5.00 2,682,674 0.39 3,322,073 23.83 3,274,080 -1.44
720,341 765,690 6.30 777,944 1.60 782,861 0.63 790,863 1.02
427,539 408,669 -4.41 409,913 0.30 365,307 -10.88 369,784 1.23
821,058 894,105 8.90 1,047,677 17.18 997,691 -4.77 1,058,231 6.07
4,781,848 4,740,727 -0.86 4,918,208 3.74 5,467,932 11.18 5,492,958 0.46
1,454,984 2,640,576 3,703,031 3,674,584 4,387,232
86,224 107,045 24.15 118,755 10.94 130,500 9.89 157,003 20.31
1,368,760 2,533,531 3,584,276 3,544,084 4,230,229
0 4,176 1,470 -64.80 7,071 381.02 51,251 624.81
54,037 -64,330 -219.05 0 -100.00 0 0
1,422,797 2,465,025 3,582,806 3,537,013 4,178,978
329,612 438,370 33.00 943,960 115.33 1,446,213 53.21 1,305,527 -9.73
0 10,000 0 -100.00 0 0
348,681 381,176 9.32 551 -99.86 466 -15.43 3,432 636.48
0 0 0 0 0
678,293 829,546 22.30 944,511 13.86 1,446,679 53.17 1,308,959 -9.52
10.88 11.24 10.96 15.82 13.25
201,530 250,032 24.07 233,455 -6.63 263,524 12.88 258,735 -1.82
2.5 3 20.00 2.17 -27.67 2.67 23.04 2.82 5.62
80,612 83,344 3.39 107,583 29.08 98,698 -8.26 91,750 -7.04
1,923,538 2,147,404 11.64 2,345,246 9.21 2,428,387 3.55 2,384,196 -1.82
23.3 35.8 43.0 40.2 44.4
21.9 34.3 41.6 38.8 42.8
22.8 33.4 41.6 38.7 42.3
RevenueResidential/bulk/smatv subscriber revenue 17.0
DTH revenue 1.2
Animal Planet Canada Company BCE Inc. Specialty (category B service) 2015
($) CAGR (%)
CRTC - FINANCIAL SUMMARY - PAY & SPECIALTY
Pay and Specialty
Licensee Licensee Ultimate Owner Type Year
Pre-tax Profit
Canadian Programming ExpensesAcquisition of rights 41.1
P.B.I.T.
Interest ExpenseAdjustments - Gain (Loss)
Total Expenses 3.5
Operating IncomeDepreciation 16.2
Technical 2.4
Sales and Promotion -3.6
Administration and General 6.6
Total Revenue 12.2
ExpensesProgramming and Production 3.9
Local advertising revenueNational advertising revenue 18.2
Other revenue
Pre-tax MarginCAGR = Compound Annual Growth Rate
Profitability (%)Operating MarginP.B.I.T. Margin
Average Staff CountAverage Remuneration ($) 3.3
Subscribers 5.5
Total Canadian Programming 17.9
Canadian Programming/Revenue (%)
Total Remuneration ($) 6.5
Script & conceptFiller Programming + Program Production -68.5
Investment in Programming
Page 13

Undertaking # Service Name
535418992 AOV Adult Movie Channel (AOVMC)
2011 2012 Var % 2013 Var % 2014 Var % 2015 Var %
y1 y2 y3 y4 y5
1,426,680 1,320,743 -7.43 1,009,198 -23.59 671,561 -33.46 529,751 -21.12
413,591 357,656 -13.52 298,854 -16.44 195,762 -34.50 154,896 -20.88
68,932 63,638 -7.68 65,723 3.28 41,759 -36.46 35,437 -15.14
0 0 0 0 0
0 0 0 0 0
0 0 0 0 0
68,932 63,638 -7.68 65,723 3.28 41,759 -36.46 35,437 -15.14
4.83 4.82 6.51 6.22 6.69
CRTC - FINANCIAL SUMMARY - PAY & SPECIALTY
Pay and Specialty
Licensee Licensee Ultimate Owner Type Year
Total ExpensesOperating IncomeDepreciation
TechnicalSales and PromotionAdministration and General
Total Revenue -21.9
ExpensesProgramming and Production -21.8
Local advertising revenueNational advertising revenueOther revenue
RevenueResidential/bulk/smatv subscriber revenueDTH revenue
Drive Publishing Inc. Drive Publishing Inc. Specialty (category B service) 2015
($) CAGR (%)
Profitability (%)Operating MarginP.B.I.T. Margin
Average Staff CountAverage Remuneration ($)
Subscribers
Total Canadian Programming -15.3
Canadian Programming/Revenue (%)
Total Remuneration ($)
Script & conceptFiller Programming + Program ProductionInvestment in Programming
Pre-tax Profit
Canadian Programming ExpensesAcquisition of rights -15.3
P.B.I.T.
Interest ExpenseAdjustments - Gain (Loss)
Pre-tax MarginCAGR = Compound Annual Growth Rate
Page 14

Undertaking # Service Name
305426761 AOV Maleflixxx (AOVMF)
2011 2012 Var % 2013 Var % 2014 Var % 2015 Var %
y1 y2 y3 y4 y5
191,640 178,253 -6.99 224,021 25.68 125,430 -44.01 115,752 -7.72
57,610 52,697 -8.53 66,428 26.06 39,959 -39.85 34,726 -13.10
8,921 8,763 -1.77 11,051 26.11 8,601 -22.17 5,788 -32.71
0 0 0 0 0
0 0 0 0 0
0 0 0 0 0
8,921 8,763 -1.77 11,051 26.11 8,601 -22.17 5,788 -32.71
4.66 4.92 4.93 6.86 5.00
Total Revenue -11.8
ExpensesProgramming and Production -11.9
Local advertising revenueNational advertising revenueOther revenue
RevenueResidential/bulk/smatv subscriber revenueDTH revenue
1225520 Ontario Inc. 1225520 Ontario Inc. Specialty (category B service) 2015
($) CAGR (%)
CRTC - FINANCIAL SUMMARY - PAY & SPECIALTY
Pay and Specialty
Licensee Licensee Ultimate Owner Type Year
Total Canadian Programming -10.3
Canadian Programming/Revenue (%)
Total Remuneration ($)
Script & conceptFiller Programming + Program ProductionInvestment in Programming
Pre-tax Profit
Canadian Programming ExpensesAcquisition of rights -10.3
P.B.I.T.
Interest ExpenseAdjustments - Gain (Loss)
Total ExpensesOperating IncomeDepreciation
TechnicalSales and PromotionAdministration and General
Pre-tax MarginCAGR = Compound Annual Growth Rate
Profitability (%)Operating MarginP.B.I.T. Margin
Average Staff CountAverage Remuneration ($)
Subscribers
Page 15

Undertaking # Service Name
305426753 AOV XXX Action Clips (AOVXXX)
2011 2012 Var % 2013 Var % 2014 Var % 2015 Var %
y1 y2 y3 y4 y5
87,227 115,305 32.19 92,551 -19.73 87,457 -5.50 76,759 -12.23
12,525 18,887 50.79 25,175 33.29 14,198 -43.60 8,530 -39.92
2,679 2,633 -1.72 1,991 -24.38 4,730 137.57 1,249 -73.59
0 0 0 0 0
0 0 0 0 0
0 0 0 0 0
2,679 2,633 -1.72 1,991 -24.38 4,730 137.57 1,249 -73.59
3.07 2.28 2.15 5.41 1.63
RevenueResidential/bulk/smatv subscriber revenueDTH revenue
1225520 Ontario Inc. 1225520 Ontario Inc. Specialty (category B service) 2015
($) CAGR (%)
CRTC - FINANCIAL SUMMARY - PAY & SPECIALTY
Pay and Specialty
Licensee Licensee Ultimate Owner Type Year
Pre-tax Profit
Canadian Programming ExpensesAcquisition of rights -17.4
P.B.I.T.
Interest ExpenseAdjustments - Gain (Loss)
Total ExpensesOperating IncomeDepreciation
TechnicalSales and PromotionAdministration and General
Total Revenue -3.2
ExpensesProgramming and Production -9.2
Local advertising revenueNational advertising revenueOther revenue
Pre-tax MarginCAGR = Compound Annual Growth Rate
Profitability (%)Operating MarginP.B.I.T. Margin
Average Staff CountAverage Remuneration ($)
Subscribers
Total Canadian Programming -17.4
Canadian Programming/Revenue (%)
Total Remuneration ($)
Script & conceptFiller Programming + Program ProductionInvestment in Programming
Page 16

Undertaking # Service Name
205424097 ARGENT (formerly LCN Argent)
2011 2012 Var % 2013 Var % 2014 Var % 2015 Var %
y1 y2 y3 y4 y5
2,759,830 1,723,834 -37.54 1,296,591 -24.78 1,293,837 -0.21 1,428,290 10.39
1,326,626 1,384,270 4.35 1,233,858 -10.87 997,059 -19.19 700,524 -29.74
0 0 0 0 0
84,126 51,219 -39.12 76,673 49.70 52,014 -32.16 33,047 -36.47
14,044 24,813 76.68 13,691 -44.82 11,405 -16.70 7,711 -32.39
4,184,626 3,184,136 -23.91 2,620,813 -17.69 2,354,315 -10.17 2,169,572 -7.85
2,031,725 2,033,203 0.07 2,009,520 -1.16 1,857,775 -7.55 1,841,215 -0.89
455,582 561,959 23.35 344,650 -38.67 184,625 -46.43 89,981 -51.26
135,320 55,986 -58.63 31,685 -43.41 38,806 22.47 35,687 -8.04
523,780 425,795 -18.71 613,183 44.01 580,738 -5.29 452,166 -22.14
3,146,407 3,076,943 -2.21 2,999,038 -2.53 2,661,944 -11.24 2,419,049 -9.12
1,038,219 107,193 -378,225 -307,629 -249,477
226,000 226,000 0.00 226,000 0.00 226,000 0.00 226,000 0.00
812,219 -118,807 -604,225 -533,629 -475,477
224,000 250,990 12.05 257,739 2.69 204,677 -20.59 141,026 -31.10
0 0 0 0 0
588,219 -369,797 -861,964 -738,306 -616,503
1,747,906 0 -100.00 0 0 0
0 0 0 0 0
0 2,023,394 2,004,566 -0.93 1,857,775 -7.32 1,841,215 -0.89
0 0 0 0 0
1,747,906 2,023,394 15.76 2,004,566 -0.93 1,857,775 -7.32 1,841,215 -0.89
41.77 63.55 76.49 78.91 84.87
1,553,567 1,688,095 8.66 1,549,393 -8.22 1,458,823 -5.85 1,461,718 0.20
15 16 6.67 16 0.00 15 -6.25 14 -6.67
103,571 105,506 1.87 96,837 -8.22 97,255 0.43 104,408 7.36
950,027 655,594 -30.99 549,887 -16.12 551,942 0.37 501,915 -9.06
24.8 3.4 -14.4 -13.1 -11.5
19.4 -3.7 -23.1 -22.7 -21.9
14.1 -11.6 -32.9 -31.4 -28.4
CRTC - FINANCIAL SUMMARY - PAY & SPECIALTY
Pay and Specialty
Licensee Licensee Ultimate Owner Type Year
Total Expenses -6.4
Operating IncomeDepreciation 0.0
Technical -33.3
Sales and Promotion -28.3
Administration and General -3.6
Total Revenue -15.1
ExpensesProgramming and Production -2.4
Local advertising revenueNational advertising revenue -20.8
Other revenue -13.9
RevenueResidential/bulk/smatv subscriber revenue -15.2
DTH revenue -14.8
Groupe TVA inc. Les Placements Péladeau inc. Specialty (category A service) 2015
($) CAGR (%)
Profitability (%)Operating MarginP.B.I.T. Margin
Average Staff CountAverage Remuneration ($) 0.2
Subscribers -14.7
Total Canadian Programming 1.3
Canadian Programming/Revenue (%)
Total Remuneration ($) -1.5
Script & conceptFiller Programming + Program ProductionInvestment in Programming
Pre-tax Profit
Canadian Programming ExpensesAcquisition of rights -100.0
P.B.I.T.
Interest ExpenseAdjustments - Gain (Loss)
Pre-tax MarginCAGR = Compound Annual Growth Rate
Page 17

Undertaking # Service Name
305424905 ATN ARY (Urdu) (formerly ATN Urdu
Channel)
2011 2012 Var % 2013 Var % 2014 Var % 2015 Var %
y1 y2 y3
536,272 580,711 8.29 275,719 -52.52 -100.00
205,379 180,720 -12.01 189,930 5.10 -100.00
0 0 0
0 0 0
129,541 111,638 -13.82 52,520 -52.96 -100.00
0 0 0
129,541 111,638 -13.82 52,520 -52.96 -100.00
24.16 19.22 19.05
Total RevenueExpensesProgramming and Production
Local advertising revenueNational advertising revenueOther revenue
RevenueResidential/bulk/smatv subscriber revenueDTH revenue
South Asian Television Canada
Limited
Chandrasekar, Shan Specialty (category B service) 2013
($) CAGR (%)
CRTC - FINANCIAL SUMMARY - PAY & SPECIALTY
Pay and Specialty
Licensee Licensee Ultimate Owner Type Year
Total Canadian Programming
Canadian Programming/Revenue (%)
Total Remuneration ($)
Script & conceptFiller Programming + Program ProductionInvestment in Programming
Pre-tax Profit
Canadian Programming ExpensesAcquisition of rights
P.B.I.T.
Interest ExpenseAdjustments - Gain (Loss)
Total ExpensesOperating IncomeDepreciation
TechnicalSales and PromotionAdministration and General
Pre-tax MarginCAGR = Compound Annual Growth Rate
Profitability (%)Operating MarginP.B.I.T. Margin
Average Staff CountAverage Remuneration ($)
Subscribers
Page 18

Undertaking # Service Name
305424913 ATN B4U Movie (formerly Hindi Movie)
2011 2012 Var % 2013 Var % 2014 Var % 2015 Var %
y1 y2
579,299 522,920 -9.73 -100.00
1,075,842 971,137 -9.73 -100.00
376,256 368,043 -2.18 -100.00
202,600 198,177 -2.18 -100.00
0 0
2,233,997 2,060,277 -7.78 -100.00
1,172,199 1,078,017 -8.03 -100.00
93,147 89,641 -3.76 -100.00
136,365 155,323 13.90 -100.00
193,128 158,622 -17.87 -100.00
1,594,839 1,481,603 -7.10 -100.00
639,158 578,674
15,286 19,433 27.13 -100.00
623,872 559,241
-1,012 701 -169.27 -100.00
-16 250 >999± -100.00
624,868 558,790
0 0
0 0
714,706 656,152 -8.19 -100.00
0 0
714,706 656,152 -8.19 -100.00
31.99 31.85
276,226 249,995 -9.50 -100.00
6 5.56 -7.33 -100.00
46,038 44,963 -2.33 -100.00
52,696 46,201 -12.33 -100.00
28.6 28.1
27.9 27.1
28.0 27.1
RevenueResidential/bulk/smatv subscriber revenueDTH revenue
South Asian Television Canada
Limited
Chandrasekar, Shan Pay-TV (category B service) 2012
($) CAGR (%)
CRTC - FINANCIAL SUMMARY - PAY & SPECIALTY
Pay and Specialty
Licensee Licensee Ultimate Owner Type Year
Pre-tax Profit
Canadian Programming ExpensesAcquisition of rights
P.B.I.T.
Interest ExpenseAdjustments - Gain (Loss)
Total ExpensesOperating IncomeDepreciation
TechnicalSales and PromotionAdministration and General
Total RevenueExpensesProgramming and Production
Local advertising revenueNational advertising revenueOther revenue
Pre-tax MarginCAGR = Compound Annual Growth Rate
Profitability (%)Operating MarginP.B.I.T. Margin
Average Staff CountAverage Remuneration ($)
Subscribers
Total Canadian Programming
Canadian Programming/Revenue (%)
Total Remuneration ($)
Script & conceptFiller Programming + Program ProductionInvestment in Programming
Page 19

Undertaking # Service Name
535420301 ATN B4U Music (formerly ATN-Music
Network One (Hindi Music))
2011 2012 Var % 2013 Var % 2014 Var % 2015 Var %
y1 y2
60,776 64,305 5.81 -100.00
112,873 119,424 5.80 -100.00
19,000 7,422 -60.94 -100.00
10,231 3,997 -60.93 -100.00
0 0
202,880 195,148 -3.81 -100.00
134,856 136,128 0.94 -100.00
44,782 40,385 -9.82 -100.00
22,908 193 -99.16 -100.00
55,884 30,188 -45.98 -100.00
258,430 206,894 -19.94 -100.00
-55,550 -11,746
1,604 24 -98.50 -100.00
-57,154 -11,770
-106 87 -182.08 -100.00
-16 208 >999± -100.00
-57,064 -11,649
0 0
0 0
86,858 84,250 -3.00 -100.00
0 0
86,858 84,250 -3.00 -100.00
42.81 43.17
90,678 56,075 -38.16 -100.00
3 1.5 -50.00 -100.00
30,226 37,383 23.68 -100.00
10,788 4,998 -53.67 -100.00
-27.4 -6.0
-28.2 -6.0
-28.1 -6.0
CRTC - FINANCIAL SUMMARY - PAY & SPECIALTY
Pay and Specialty
Licensee Licensee Ultimate Owner Type Year
Total ExpensesOperating IncomeDepreciation
TechnicalSales and PromotionAdministration and General
Total RevenueExpensesProgramming and Production
Local advertising revenueNational advertising revenueOther revenue
RevenueResidential/bulk/smatv subscriber revenueDTH revenue
Asian Television Network
International Limited
Chandrasekar, Shan Pay-TV (category B service) 2012
($) CAGR (%)
Profitability (%)Operating MarginP.B.I.T. Margin
Average Staff CountAverage Remuneration ($)
Subscribers
Total Canadian Programming
Canadian Programming/Revenue (%)
Total Remuneration ($)
Script & conceptFiller Programming + Program ProductionInvestment in Programming
Pre-tax Profit
Canadian Programming ExpensesAcquisition of rights
P.B.I.T.
Interest ExpenseAdjustments - Gain (Loss)
Pre-tax MarginCAGR = Compound Annual Growth Rate
Page 20

Undertaking # Service Name
535420252 ATN Bangla (formerly ATN - Bangla
Channel One)
2011 2012 Var % 2013 Var % 2014 Var % 2015 Var %
y1 y2 y3
16,353 13,171 -19.46 0 -100.00
30,371 24,460 -19.46 0 -100.00
55,655 56,067 0.74 0 -100.00
29,968 30,189 0.74 0 -100.00
0 0 0
132,347 123,887 -6.39 0 -100.00
45,982 32,038 -30.32 0 -100.00
40,638 42,550 4.70 0 -100.00
34,548 40,498 17.22 0 -100.00
44,127 18,654 -57.73 0 -100.00
165,295 133,740 -19.09 0 -100.00
-32,948 -9,853 0
432 489 13.19 0 -100.00
-33,380 -10,342 0
-29 18 -162.07 0 -100.00
-16 250 >999± 0 -100.00
-33,367 -10,110 0
0 0 0
0 0 0
33,067 21,413 -35.24 0 -100.00
0 0 0
33,067 21,413 -35.24 0 -100.00
24.99 17.28
77,745 48,940 -37.05 0 -100.00
3 1.09 -63.67 0 -100.00
25,915 44,899 73.26
1,337 1,224 -8.45 0 -100.00
-24.9 -8.0
-25.2 -8.3
-25.2 -8.2
TechnicalSales and PromotionAdministration and General
Total RevenueExpensesProgramming and Production
Local advertising revenueNational advertising revenueOther revenue
RevenueResidential/bulk/smatv subscriber revenueDTH revenue
Asian Television Network
International Limited
Chandrasekar, Shan Pay-TV (category B service) 2013
($) CAGR (%)
CRTC - FINANCIAL SUMMARY - PAY & SPECIALTY
Pay and Specialty
Licensee Licensee Ultimate Owner Type Year
Average Staff CountAverage Remuneration ($)
Subscribers
Total Canadian Programming
Canadian Programming/Revenue (%)
Total Remuneration ($)
Script & conceptFiller Programming + Program ProductionInvestment in Programming
Pre-tax Profit
Canadian Programming ExpensesAcquisition of rights
P.B.I.T.
Interest ExpenseAdjustments - Gain (Loss)
Total ExpensesOperating IncomeDepreciation
Pre-tax MarginCAGR = Compound Annual Growth Rate
Profitability (%)Operating MarginP.B.I.T. Margin
Page 21
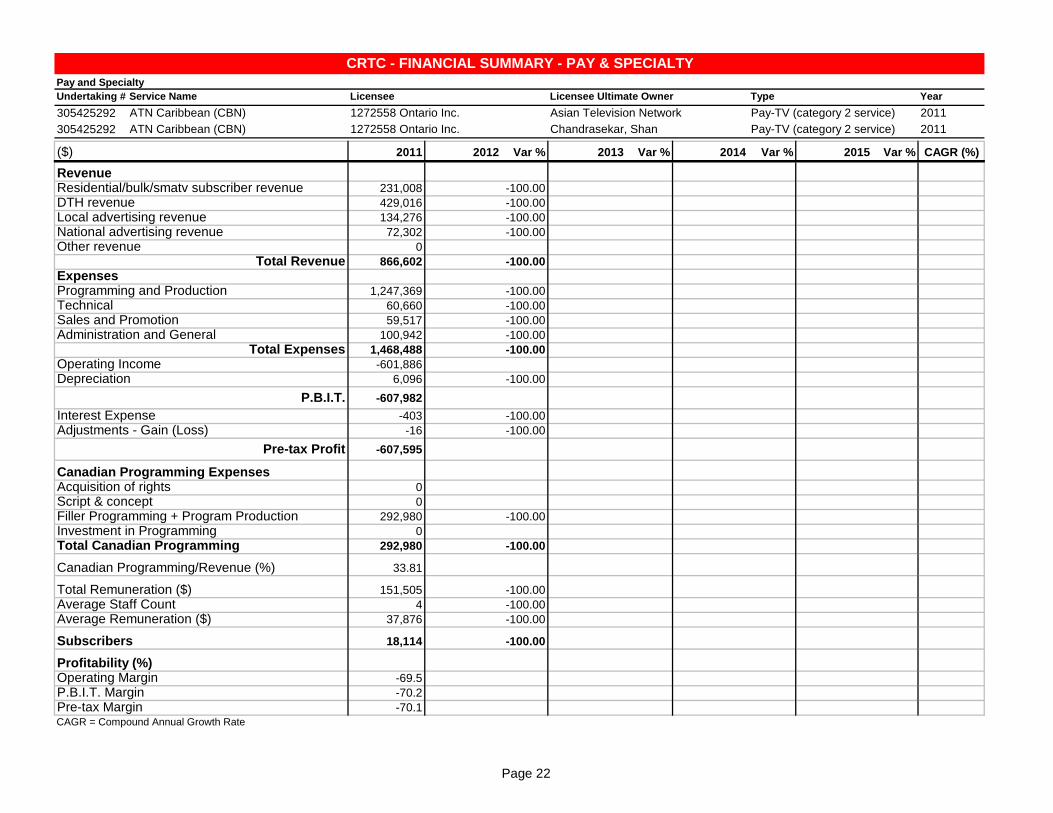
Undertaking # Service Name
305425292 ATN Caribbean (CBN)
305425292 ATN Caribbean (CBN)
2011 2012 Var % 2013 Var % 2014 Var % 2015 Var %
y1
231,008 -100.00
429,016 -100.00
134,276 -100.00
72,302 -100.00
0
866,602 -100.00
1,247,369 -100.00
60,660 -100.00
59,517 -100.00
100,942 -100.00
1,468,488 -100.00
-601,886
6,096 -100.00
-607,982
-403 -100.00
-16 -100.00
-607,595
0
0
292,980 -100.00
0
292,980 -100.00
33.81
151,505 -100.00
4 -100.00
37,876 -100.00
18,114 -100.00
-69.5
-70.2
-70.1
DTH revenueLocal advertising revenueNational advertising revenue
($) CAGR (%)
RevenueResidential/bulk/smatv subscriber revenue
1272558 Ontario Inc. Asian Television Network
International Limited
Pay-TV (category 2 service) 2011
1272558 Ontario Inc. Chandrasekar, Shan Pay-TV (category 2 service) 2011
CRTC - FINANCIAL SUMMARY - PAY & SPECIALTY
Pay and Specialty
Licensee Licensee Ultimate Owner Type Year
Acquisition of rightsScript & conceptFiller Programming + Program Production
Adjustments - Gain (Loss)
Pre-tax Profit
Canadian Programming Expenses
Depreciation
P.B.I.T.
Interest Expense
Administration and GeneralTotal Expenses
Operating Income
Programming and ProductionTechnicalSales and Promotion
Other revenueTotal Revenue
Expenses
P.B.I.T. MarginPre-tax MarginCAGR = Compound Annual Growth Rate
Subscribers
Profitability (%)Operating Margin
Total Remuneration ($)Average Staff CountAverage Remuneration ($)
Investment in ProgrammingTotal Canadian Programming
Canadian Programming/Revenue (%)
Page 22

Undertaking # Service Name
535428545 ATN CBN (Cricket Channel One)
2011 2012 Var % 2013 Var % 2014 Var % 2015 Var %
y2 y3 y4 y5
835,802 696,746 -16.64 501,901 -27.96 431,838 -13.96
787,443 732,719 -6.95 407,422 -44.40 145,493 -64.29
0 0 0 0
0 0 0 0
287,826 132,719 -53.89 34,350 -74.12 27,905 -18.76
0 0 0 0
287,826 132,719 -53.89 34,350 -74.12 27,905 -18.76
34.44 19.05 6.84 6.46
Pay and Specialty
Licensee Licensee Ultimate Owner Type Year
Asian Television Network
International Limited
Chandrasekar, Shan Specialty (category B service) 2015
CRTC - FINANCIAL SUMMARY - PAY & SPECIALTY
Depreciation
P.B.I.T.
Interest Expense
Administration and GeneralTotal Expenses
Operating Income
Programming and ProductionTechnicalSales and Promotion
Other revenueTotal Revenue
Expenses
DTH revenueLocal advertising revenueNational advertising revenue
($) CAGR (%)
RevenueResidential/bulk/smatv subscriber revenue
P.B.I.T. MarginPre-tax MarginCAGR = Compound Annual Growth Rate
Subscribers
Profitability (%)Operating Margin
Total Remuneration ($)Average Staff CountAverage Remuneration ($)
Investment in ProgrammingTotal Canadian Programming
Canadian Programming/Revenue (%)
Acquisition of rightsScript & conceptFiller Programming + Program Production
Adjustments - Gain (Loss)
Pre-tax Profit
Canadian Programming Expenses
Page 23

Undertaking # Service Name
535428610 ATN Cricket Plus (Asian Sports Network)
2011 2012 Var % 2013 Var % 2014 Var % 2015 Var %
y2 y3 y4 y5
318,714 324,302 1.75 339,765 4.77 299,242 -11.93
514,878 361,781 -29.73 279,430 -22.76 109,653 -60.76
0 0 0 0
0 0 0 0
111,427 61,774 -44.56 23,471 -62.01 21,031 -10.40
0 0 0 0
111,427 61,774 -44.56 23,471 -62.01 21,031 -10.40
34.96 19.05 6.91 7.03
CRTC - FINANCIAL SUMMARY - PAY & SPECIALTY
Programming and ProductionTechnicalSales and Promotion
Other revenueTotal Revenue
Expenses
DTH revenueLocal advertising revenueNational advertising revenue
($) CAGR (%)
RevenueResidential/bulk/smatv subscriber revenue
Pay and Specialty
Licensee Licensee Ultimate Owner Type Year
Asian Television Network
International Limited
Chandrasekar, Shan Specialty (category B service) 2015
Total Remuneration ($)Average Staff CountAverage Remuneration ($)
Investment in ProgrammingTotal Canadian Programming
Canadian Programming/Revenue (%)
Acquisition of rightsScript & conceptFiller Programming + Program Production
Adjustments - Gain (Loss)
Pre-tax Profit
Canadian Programming Expenses
Depreciation
P.B.I.T.
Interest Expense
Administration and GeneralTotal Expenses
Operating Income
P.B.I.T. MarginPre-tax MarginCAGR = Compound Annual Growth Rate
Subscribers
Profitability (%)Operating Margin
Page 24
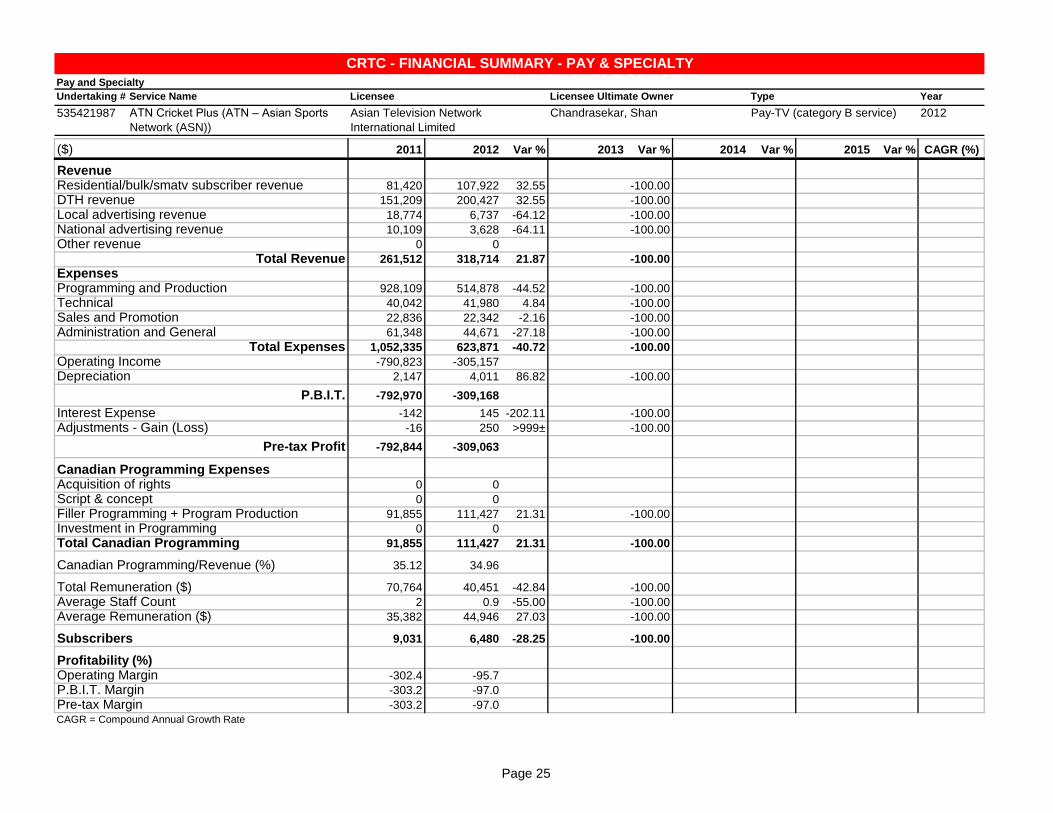
Undertaking # Service Name
535421987 ATN Cricket Plus (ATN – Asian Sports
Network (ASN))
2011 2012 Var % 2013 Var % 2014 Var % 2015 Var %
y1 y2
81,420 107,922 32.55 -100.00
151,209 200,427 32.55 -100.00
18,774 6,737 -64.12 -100.00
10,109 3,628 -64.11 -100.00
0 0
261,512 318,714 21.87 -100.00
928,109 514,878 -44.52 -100.00
40,042 41,980 4.84 -100.00
22,836 22,342 -2.16 -100.00
61,348 44,671 -27.18 -100.00
1,052,335 623,871 -40.72 -100.00
-790,823 -305,157
2,147 4,011 86.82 -100.00
-792,970 -309,168
-142 145 -202.11 -100.00
-16 250 >999± -100.00
-792,844 -309,063
0 0
0 0
91,855 111,427 21.31 -100.00
0 0
91,855 111,427 21.31 -100.00
35.12 34.96
70,764 40,451 -42.84 -100.00
2 0.9 -55.00 -100.00
35,382 44,946 27.03 -100.00
9,031 6,480 -28.25 -100.00
-302.4 -95.7
-303.2 -97.0
-303.2 -97.0
DTH revenueLocal advertising revenueNational advertising revenue
($) CAGR (%)
RevenueResidential/bulk/smatv subscriber revenue
Pay and Specialty
Licensee Licensee Ultimate Owner Type Year
Asian Television Network
International Limited
Chandrasekar, Shan Pay-TV (category B service) 2012
CRTC - FINANCIAL SUMMARY - PAY & SPECIALTY
Acquisition of rightsScript & conceptFiller Programming + Program Production
Adjustments - Gain (Loss)
Pre-tax Profit
Canadian Programming Expenses
Depreciation
P.B.I.T.
Interest Expense
Administration and GeneralTotal Expenses
Operating Income
Programming and ProductionTechnicalSales and Promotion
Other revenueTotal Revenue
Expenses
P.B.I.T. MarginPre-tax MarginCAGR = Compound Annual Growth Rate
Subscribers
Profitability (%)Operating Margin
Total Remuneration ($)Average Staff CountAverage Remuneration ($)
Investment in ProgrammingTotal Canadian Programming
Canadian Programming/Revenue (%)
Page 25

Undertaking # Service Name
535428553 ATN DD SPORTS (Cricket Channel Two)
2011 2012 Var % 2013 Var % 2014 Var % 2015 Var %
y1 y2 y3 y4 y5
13,097 70,970 441.88 40,993 -42.24 52,338 27.68 34,832 -33.45
8,045 45,464 465.12 7,808 -82.83 2,695 -65.48 25,432 843.67
0 0 0 0 0
0 0 0 0 0
4,425 30,436 587.82 7,808 -74.35 2,695 -65.48 2,210 -18.00
0 0 0 0 0
4,425 30,436 587.82 7,808 -74.35 2,695 -65.48 2,210 -18.00
33.79 42.89 19.05 5.15 6.34
Pay and Specialty
Licensee Licensee Ultimate Owner Type Year
Asian Television Network
International Limited
Chandrasekar, Shan Specialty (category B service) 2015
CRTC - FINANCIAL SUMMARY - PAY & SPECIALTY
Depreciation
P.B.I.T.
Interest Expense
Administration and GeneralTotal Expenses
Operating Income
Programming and Production 33.3
TechnicalSales and Promotion
Other revenueTotal Revenue 27.7
Expenses
DTH revenueLocal advertising revenueNational advertising revenue
($) CAGR (%)
RevenueResidential/bulk/smatv subscriber revenue
P.B.I.T. MarginPre-tax MarginCAGR = Compound Annual Growth Rate
Subscribers
Profitability (%)Operating Margin
Total Remuneration ($)Average Staff CountAverage Remuneration ($)
Investment in ProgrammingTotal Canadian Programming -15.9
Canadian Programming/Revenue (%)
Acquisition of rightsScript & conceptFiller Programming + Program Production -15.9
Adjustments - Gain (Loss)
Pre-tax Profit
Canadian Programming Expenses
Page 26
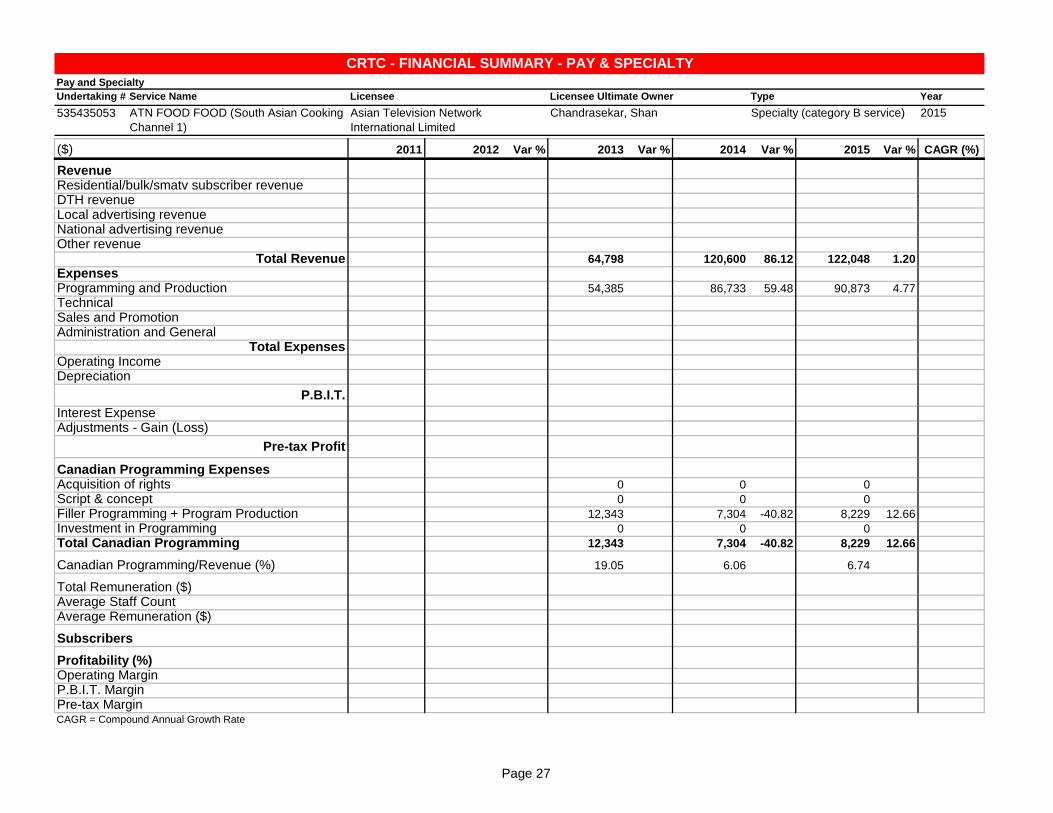
Undertaking # Service Name
535435053 ATN FOOD FOOD (South Asian Cooking
Channel 1)
2011 2012 Var % 2013 Var % 2014 Var % 2015 Var %
y3 y4 y5
64,798 120,600 86.12 122,048 1.20
54,385 86,733 59.48 90,873 4.77
0 0 0
0 0 0
12,343 7,304 -40.82 8,229 12.66
0 0 0
12,343 7,304 -40.82 8,229 12.66
19.05 6.06 6.74
CRTC - FINANCIAL SUMMARY - PAY & SPECIALTY
Programming and ProductionTechnicalSales and Promotion
Other revenueTotal Revenue
Expenses
DTH revenueLocal advertising revenueNational advertising revenue
($) CAGR (%)
RevenueResidential/bulk/smatv subscriber revenue
Pay and Specialty
Licensee Licensee Ultimate Owner Type Year
Asian Television Network
International Limited
Chandrasekar, Shan Specialty (category B service) 2015
Total Remuneration ($)Average Staff CountAverage Remuneration ($)
Investment in ProgrammingTotal Canadian Programming
Canadian Programming/Revenue (%)
Acquisition of rightsScript & conceptFiller Programming + Program Production
Adjustments - Gain (Loss)
Pre-tax Profit
Canadian Programming Expenses
Depreciation
P.B.I.T.
Interest Expense
Administration and GeneralTotal Expenses
Operating Income
P.B.I.T. MarginPre-tax MarginCAGR = Compound Annual Growth Rate
Subscribers
Profitability (%)Operating Margin
Page 27
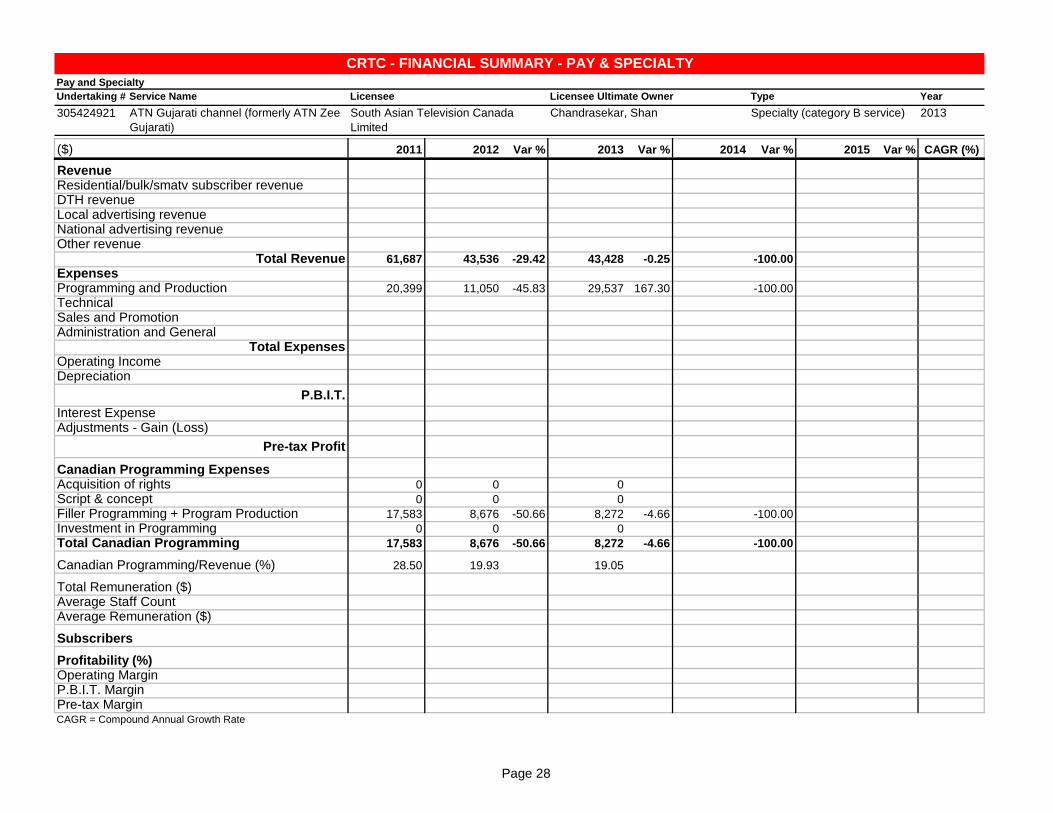
Undertaking # Service Name
305424921 ATN Gujarati channel (formerly ATN Zee
Gujarati)
2011 2012 Var % 2013 Var % 2014 Var % 2015 Var %
y1 y2 y3
61,687 43,536 -29.42 43,428 -0.25 -100.00
20,399 11,050 -45.83 29,537 167.30 -100.00
0 0 0
0 0 0
17,583 8,676 -50.66 8,272 -4.66 -100.00
0 0 0
17,583 8,676 -50.66 8,272 -4.66 -100.00
28.50 19.93 19.05
DTH revenueLocal advertising revenueNational advertising revenue
($) CAGR (%)
RevenueResidential/bulk/smatv subscriber revenue
Pay and Specialty
Licensee Licensee Ultimate Owner Type Year
South Asian Television Canada
Limited
Chandrasekar, Shan Specialty (category B service) 2013
CRTC - FINANCIAL SUMMARY - PAY & SPECIALTY
Acquisition of rightsScript & conceptFiller Programming + Program Production
Adjustments - Gain (Loss)
Pre-tax Profit
Canadian Programming Expenses
Depreciation
P.B.I.T.
Interest Expense
Administration and GeneralTotal Expenses
Operating Income
Programming and ProductionTechnicalSales and Promotion
Other revenueTotal Revenue
Expenses
P.B.I.T. MarginPre-tax MarginCAGR = Compound Annual Growth Rate
Subscribers
Profitability (%)Operating Margin
Total Remuneration ($)Average Staff CountAverage Remuneration ($)
Investment in ProgrammingTotal Canadian Programming
Canadian Programming/Revenue (%)
Page 28

Undertaking # Service Name
535433958 ATN Hindi Movie Channel 3
2011 2012 Var % 2013 Var % 2014 Var % 2015 Var %
y3 y4 y5
485,828 298,409 -38.58 264,701 -11.30
395,501 213,803 -45.94 193,773 -9.37
0 0 0
0 0 0
92,542 17,650 -80.93 16,933 -4.06
0 0 0
92,542 17,650 -80.93 16,933 -4.06
19.05 5.91 6.40
Pay and Specialty
Licensee Licensee Ultimate Owner Type Year
Asian Television Network
International Limited
Chandrasekar, Shan Specialty (category B service) 2015
CRTC - FINANCIAL SUMMARY - PAY & SPECIALTY
Depreciation
P.B.I.T.
Interest Expense
Administration and GeneralTotal Expenses
Operating Income
Programming and ProductionTechnicalSales and Promotion
Other revenueTotal Revenue
Expenses
DTH revenueLocal advertising revenueNational advertising revenue
($) CAGR (%)
RevenueResidential/bulk/smatv subscriber revenue
P.B.I.T. MarginPre-tax MarginCAGR = Compound Annual Growth Rate
Subscribers
Profitability (%)Operating Margin
Total Remuneration ($)Average Staff CountAverage Remuneration ($)
Investment in ProgrammingTotal Canadian Programming
Canadian Programming/Revenue (%)
Acquisition of rightsScript & conceptFiller Programming + Program Production
Adjustments - Gain (Loss)
Pre-tax Profit
Canadian Programming Expenses
Page 29

Undertaking # Service Name
535428529 ATN Hindi Movie Channel
2011 2012 Var % 2013 Var % 2014 Var % 2015 Var %
y3 y4 y5
2,394,800 1,619,914 -32.36 1,435,673 -11.37
1,859,785 1,193,078 -35.85 1,075,065 -9.89
0 0 0
0 0 0
456,170 105,348 -76.91 98,479 -6.52
0 0 0
456,170 105,348 -76.91 98,479 -6.52
19.05 6.50 6.86
CRTC - FINANCIAL SUMMARY - PAY & SPECIALTY
Programming and ProductionTechnicalSales and Promotion
Other revenueTotal Revenue
Expenses
DTH revenueLocal advertising revenueNational advertising revenue
($) CAGR (%)
RevenueResidential/bulk/smatv subscriber revenue
Pay and Specialty
Licensee Licensee Ultimate Owner Type Year
Asian Television Network
International Limited
Chandrasekar, Shan Specialty (category B service) 2015
Total Remuneration ($)Average Staff CountAverage Remuneration ($)
Investment in ProgrammingTotal Canadian Programming
Canadian Programming/Revenue (%)
Acquisition of rightsScript & conceptFiller Programming + Program Production
Adjustments - Gain (Loss)
Pre-tax Profit
Canadian Programming Expenses
Depreciation
P.B.I.T.
Interest Expense
Administration and GeneralTotal Expenses
Operating Income
P.B.I.T. MarginPre-tax MarginCAGR = Compound Annual Growth Rate
Subscribers
Profitability (%)Operating Margin
Page 30
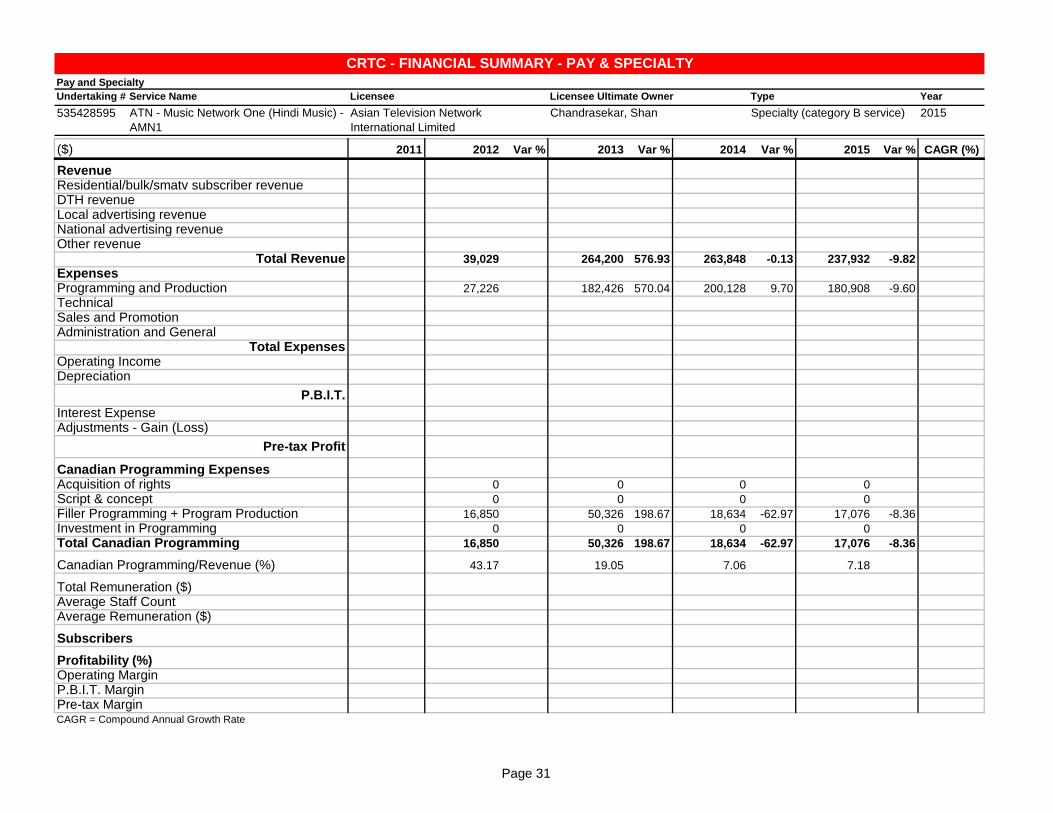
Undertaking # Service Name
535428595 ATN - Music Network One (Hindi Music) -
AMN1
2011 2012 Var % 2013 Var % 2014 Var % 2015 Var %
y2 y3 y4 y5
39,029 264,200 576.93 263,848 -0.13 237,932 -9.82
27,226 182,426 570.04 200,128 9.70 180,908 -9.60
0 0 0 0
0 0 0 0
16,850 50,326 198.67 18,634 -62.97 17,076 -8.36
0 0 0 0
16,850 50,326 198.67 18,634 -62.97 17,076 -8.36
43.17 19.05 7.06 7.18
DTH revenueLocal advertising revenueNational advertising revenue
($) CAGR (%)
RevenueResidential/bulk/smatv subscriber revenue
Pay and Specialty
Licensee Licensee Ultimate Owner Type Year
Asian Television Network
International Limited
Chandrasekar, Shan Specialty (category B service) 2015
CRTC - FINANCIAL SUMMARY - PAY & SPECIALTY
Acquisition of rightsScript & conceptFiller Programming + Program Production
Adjustments - Gain (Loss)
Pre-tax Profit
Canadian Programming Expenses
Depreciation
P.B.I.T.
Interest Expense
Administration and GeneralTotal Expenses
Operating Income
Programming and ProductionTechnicalSales and Promotion
Other revenueTotal Revenue
Expenses
P.B.I.T. MarginPre-tax MarginCAGR = Compound Annual Growth Rate
Subscribers
Profitability (%)Operating Margin
Total Remuneration ($)Average Staff CountAverage Remuneration ($)
Investment in ProgrammingTotal Canadian Programming
Canadian Programming/Revenue (%)
Page 31
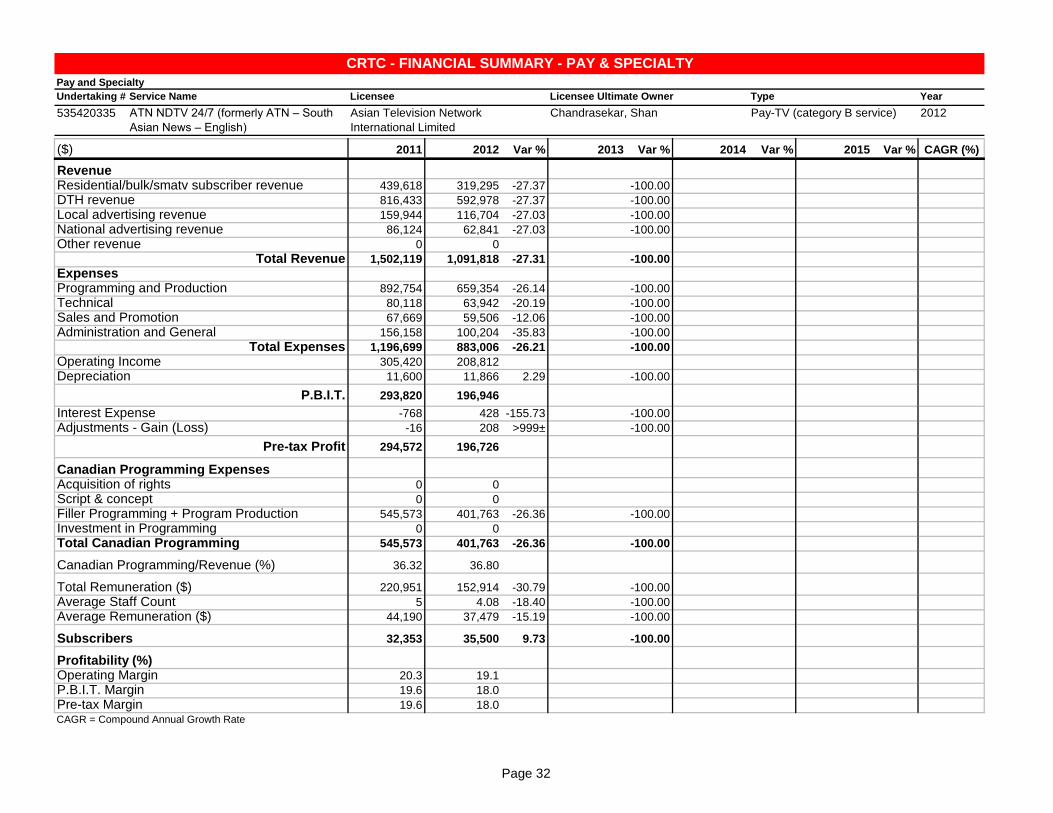
Undertaking # Service Name
535420335 ATN NDTV 24/7 (formerly ATN – South
Asian News – English)
2011 2012 Var % 2013 Var % 2014 Var % 2015 Var %
y1 y2
439,618 319,295 -27.37 -100.00
816,433 592,978 -27.37 -100.00
159,944 116,704 -27.03 -100.00
86,124 62,841 -27.03 -100.00
0 0
1,502,119 1,091,818 -27.31 -100.00
892,754 659,354 -26.14 -100.00
80,118 63,942 -20.19 -100.00
67,669 59,506 -12.06 -100.00
156,158 100,204 -35.83 -100.00
1,196,699 883,006 -26.21 -100.00
305,420 208,812
11,600 11,866 2.29 -100.00
293,820 196,946
-768 428 -155.73 -100.00
-16 208 >999± -100.00
294,572 196,726
0 0
0 0
545,573 401,763 -26.36 -100.00
0 0
545,573 401,763 -26.36 -100.00
36.32 36.80
220,951 152,914 -30.79 -100.00
5 4.08 -18.40 -100.00
44,190 37,479 -15.19 -100.00
32,353 35,500 9.73 -100.00
20.3 19.1
19.6 18.0
19.6 18.0
Pay and Specialty
Licensee Licensee Ultimate Owner Type Year
Asian Television Network
International Limited
Chandrasekar, Shan Pay-TV (category B service) 2012
CRTC - FINANCIAL SUMMARY - PAY & SPECIALTY
Depreciation
P.B.I.T.
Interest Expense
Administration and GeneralTotal Expenses
Operating Income
Programming and ProductionTechnicalSales and Promotion
Other revenueTotal Revenue
Expenses
DTH revenueLocal advertising revenueNational advertising revenue
($) CAGR (%)
RevenueResidential/bulk/smatv subscriber revenue
P.B.I.T. MarginPre-tax MarginCAGR = Compound Annual Growth Rate
Subscribers
Profitability (%)Operating Margin
Total Remuneration ($)Average Staff CountAverage Remuneration ($)
Investment in ProgrammingTotal Canadian Programming
Canadian Programming/Revenue (%)
Acquisition of rightsScript & conceptFiller Programming + Program Production
Adjustments - Gain (Loss)
Pre-tax Profit
Canadian Programming Expenses
Page 32

Undertaking # Service Name
535433114 ATN NDTV 24x7 (formerly South Asian
English News Channel 2
2011 2012 Var % 2013 Var % 2014 Var % 2015 Var %
y2 y3 y4 y5
218,364 1,899,907 770.06 924,836 -51.32 754,932 -18.37
131,871 1,311,855 894.80 526,618 -59.86 430,751 -18.20
0 0 0 0
0 0 0 0
80,353 361,901 350.39 64,200 -82.26 53,285 -17.00
0 0 0 0
80,353 361,901 350.39 64,200 -82.26 53,285 -17.00
36.80 19.05 6.94 7.06
CRTC - FINANCIAL SUMMARY - PAY & SPECIALTY
Programming and ProductionTechnicalSales and Promotion
Other revenueTotal Revenue
Expenses
DTH revenueLocal advertising revenueNational advertising revenue
($) CAGR (%)
RevenueResidential/bulk/smatv subscriber revenue
Pay and Specialty
Licensee Licensee Ultimate Owner Type Year
Asian Television Network
International Limited
Chandrasekar, Shan Specialty (category B service) 2015
Total Remuneration ($)Average Staff CountAverage Remuneration ($)
Investment in ProgrammingTotal Canadian Programming
Canadian Programming/Revenue (%)
Acquisition of rightsScript & conceptFiller Programming + Program Production
Adjustments - Gain (Loss)
Pre-tax Profit
Canadian Programming Expenses
Depreciation
P.B.I.T.
Interest Expense
Administration and GeneralTotal Expenses
Operating Income
P.B.I.T. MarginPre-tax MarginCAGR = Compound Annual Growth Rate
Subscribers
Profitability (%)Operating Margin
Page 33

Undertaking # Service Name
305424880 ATN Punjabi Channel (formerly ATN
Alpha ETC Punjabi)
2011 2012 Var % 2013 Var % 2014 Var % 2015 Var %
y1 y2 y3 y4 y5
1,924,389 1,894,697 -1.54 2,465,843 30.14 1,697,235 -31.17 1,485,996 -12.45
1,033,258 974,764 -5.66 2,106,682 116.12 1,222,848 -41.95 1,108,313 -9.37
0 0 0 0 0
0 0 0 0 0
630,613 593,494 -5.89 469,703 -20.86 112,293 -76.09 100,708 -10.32
0 0 0 0 0
630,613 593,494 -5.89 469,703 -20.86 112,293 -76.09 100,708 -10.32
32.77 31.32 19.05 6.62 6.78
DTH revenueLocal advertising revenueNational advertising revenue
($) CAGR (%)
RevenueResidential/bulk/smatv subscriber revenue
Pay and Specialty
Licensee Licensee Ultimate Owner Type Year
South Asian Television Canada
Limited
Chandrasekar, Shan Specialty (category B service) 2015
CRTC - FINANCIAL SUMMARY - PAY & SPECIALTY
Acquisition of rightsScript & conceptFiller Programming + Program Production -36.8
Adjustments - Gain (Loss)
Pre-tax Profit
Canadian Programming Expenses
Depreciation
P.B.I.T.
Interest Expense
Administration and GeneralTotal Expenses
Operating Income
Programming and Production 1.8
TechnicalSales and Promotion
Other revenueTotal Revenue -6.3
Expenses
P.B.I.T. MarginPre-tax MarginCAGR = Compound Annual Growth Rate
Subscribers
Profitability (%)Operating Margin
Total Remuneration ($)Average Staff CountAverage Remuneration ($)
Investment in ProgrammingTotal Canadian Programming -36.8
Canadian Programming/Revenue (%)
Page 34

Undertaking # Service Name
535432348 ATN SAB (Comedy Channel One)
2011 2012 Var % 2013 Var % 2014 Var % 2015 Var %
y2 y3 y4 y5
252,749 440,398 74.24 456,390 3.63 415,484 -8.96
145,574 370,885 154.77 327,841 -11.61 299,412 -8.67
0 0 0 0
0 0 0 0
90,310 83,888 -7.11 27,226 -67.54 25,271 -7.18
0 0 0 0
90,310 83,888 -7.11 27,226 -67.54 25,271 -7.18
35.73 19.05 5.97 6.08
Pay and Specialty
Licensee Licensee Ultimate Owner Type Year
Asian Television Network
International Limited
Chandrasekar, Shan Specialty (category B service) 2015
CRTC - FINANCIAL SUMMARY - PAY & SPECIALTY
Depreciation
P.B.I.T.
Interest Expense
Administration and GeneralTotal Expenses
Operating Income
Programming and ProductionTechnicalSales and Promotion
Other revenueTotal Revenue
Expenses
DTH revenueLocal advertising revenueNational advertising revenue
($) CAGR (%)
RevenueResidential/bulk/smatv subscriber revenue
P.B.I.T. MarginPre-tax MarginCAGR = Compound Annual Growth Rate
Subscribers
Profitability (%)Operating Margin
Total Remuneration ($)Average Staff CountAverage Remuneration ($)
Investment in ProgrammingTotal Canadian Programming
Canadian Programming/Revenue (%)
Acquisition of rightsScript & conceptFiller Programming + Program Production
Adjustments - Gain (Loss)
Pre-tax Profit
Canadian Programming Expenses
Page 35

Undertaking # Service Name
535435467 ATN South Asian Television Canada
Channel 2 (SATV 2)
2011 2012 Var % 2013 Var % 2014 Var % 2015 Var %
y3 y4 y5
4,387,425 7,551,043 72.11 7,513,875 -0.49
3,735,848 5,902,017 57.98 5,982,697 1.37
0 0 0
0 0 0
835,733 409,434 -51.01 406,694 -0.67
0 0 0
835,733 409,434 -51.01 406,694 -0.67
19.05 5.42 5.41
CRTC - FINANCIAL SUMMARY - PAY & SPECIALTY
Programming and ProductionTechnicalSales and Promotion
Other revenueTotal Revenue
Expenses
DTH revenueLocal advertising revenueNational advertising revenue
($) CAGR (%)
RevenueResidential/bulk/smatv subscriber revenue
Pay and Specialty
Licensee Licensee Ultimate Owner Type Year
Asian Television Network
International Limited
Chandrasekar, Shan Specialty (category B service) 2015
Total Remuneration ($)Average Staff CountAverage Remuneration ($)
Investment in ProgrammingTotal Canadian Programming
Canadian Programming/Revenue (%)
Acquisition of rightsScript & conceptFiller Programming + Program Production
Adjustments - Gain (Loss)
Pre-tax Profit
Canadian Programming Expenses
Depreciation
P.B.I.T.
Interest Expense
Administration and GeneralTotal Expenses
Operating Income
P.B.I.T. MarginPre-tax MarginCAGR = Compound Annual Growth Rate
Subscribers
Profitability (%)Operating Margin
Page 36

Undertaking # Service Name
305417421 ATN South Asian Television (SATV)
2011 2012 Var % 2013 Var % 2014 Var % 2015 Var %
y1 y2 y3 y4 y5
2,366,082 2,477,189 4.70 7,102,422 186.71 6,334,599 -10.81 6,539,194 3.23
4,394,151 4,600,495 4.70 396,996 -91.37 354,078 -10.81 365,514 3.23
2,383,113 2,408,741 1.08 1,598,643 -33.63 1,425,818 -10.81 1,471,869 3.23
1,283,215 1,297,014 1.08 453,533 -65.03 404,502 -10.81 417,567 3.23
0 0 267,476 238,560 -10.81 246,265 3.23
10,426,561 10,783,439 3.42 9,819,070 -8.94 8,757,557 -10.81 9,040,409 3.23
5,518,746 5,494,687 -0.44 5,389,590 -1.91 7,897,280 46.53 7,950,724 0.68
259,808 270,180 3.99 96,621 -64.24 117,903 22.03 30,300 -74.30
773,700 906,419 17.15 556,964 -38.55 212,420 -61.86 340,091 60.10
666,061 965,907 45.02 647,229 -32.99 783,551 21.06 732,973 -6.45
7,218,315 7,637,193 5.80 6,690,404 -12.40 9,011,154 34.69 9,054,088 0.48
3,208,246 3,146,246 3,128,666 -253,597 -13,679
62,433 92,057 47.45 14,086 -84.70 2,286 -83.77 2,593 13.43
3,145,813 3,054,189 3,114,580 -255,883 -16,272
-4,132 3,322 -180.40 1,782 -46.36 1,403 -21.27 234 -83.32
-16 250 >999± 44,003 >999± 432,686 883.31 80,319 -81.44
3,149,929 3,051,117 3,156,801 175,400 63,813
0 0 0 0 0
0 0 0 0 0
2,878,216 3,179,833 10.48 1,870,372 -41.18 5,086,680 171.96 4,975,282 -2.19
0 0 0 0 0
2,878,216 3,179,833 10.48 1,870,372 -41.18 5,086,680 171.96 4,975,282 -2.19
27.60 29.49 19.05 58.08 55.03
949,796 1,449,131 52.57 1,512,117 4.35 0 -100.00 0
19 32.2 69.47 32.39 0.59 0 -100.00 0
49,989 45,004 -9.97 46,685 3.73
116,380 145,244 24.80 121,542 -16.32 120,588 -0.78 116,434 -3.44
30.8 29.2 31.9 -2.9 -0.2
30.2 28.3 31.7 -2.9 -0.2
30.2 28.3 32.1 2.0 0.7
DTH revenue -46.3
Local advertising revenue -11.4
National advertising revenue -24.5
($) CAGR (%)
RevenueResidential/bulk/smatv subscriber revenue 28.9
Pay and Specialty
Licensee Licensee Ultimate Owner Type Year
South Asian Television Canada
Limited
Chandrasekar, Shan Specialty (category A service) 2015
CRTC - FINANCIAL SUMMARY - PAY & SPECIALTY
Acquisition of rightsScript & conceptFiller Programming + Program Production 14.7
Adjustments - Gain (Loss)
Pre-tax Profit
Canadian Programming Expenses
Depreciation -54.9
P.B.I.T.
Interest Expense
Administration and General 2.4
Total Expenses 5.8
Operating Income
Programming and Production 9.6
Technical -41.6
Sales and Promotion -18.6
Other revenueTotal Revenue -3.5
Expenses
P.B.I.T. MarginPre-tax MarginCAGR = Compound Annual Growth Rate
Subscribers 0.0
Profitability (%)Operating Margin
Total Remuneration ($) -100.0
Average Staff CountAverage Remuneration ($)
Investment in ProgrammingTotal Canadian Programming 14.7
Canadian Programming/Revenue (%)
Page 37

Undertaking # Service Name
305424898 ATN Tamil Channel (Jaya TV)
2011 2012 Var % 2013 Var % 2014 Var % 2015 Var %
y1 y2 y3
276,520 320,278 15.82 271,728 -15.16 -100.00
125,153 112,030 -10.49 187,624 67.48 -100.00
0 0 0
0 0 0
80,985 69,955 -13.62 51,760 -26.01 -100.00
0 0 0
80,985 69,955 -13.62 51,760 -26.01 -100.00
29.29 21.84 19.05
Pay and Specialty
Licensee Licensee Ultimate Owner Type Year
South Asian Television Canada
Limited
Chandrasekar, Shan Specialty (category B service) 2013
CRTC - FINANCIAL SUMMARY - PAY & SPECIALTY
Depreciation
P.B.I.T.
Interest Expense
Administration and GeneralTotal Expenses
Operating Income
Programming and ProductionTechnicalSales and Promotion
Other revenueTotal Revenue
Expenses
DTH revenueLocal advertising revenueNational advertising revenue
($) CAGR (%)
RevenueResidential/bulk/smatv subscriber revenue
P.B.I.T. MarginPre-tax MarginCAGR = Compound Annual Growth Rate
Subscribers
Profitability (%)Operating Margin
Total Remuneration ($)Average Staff CountAverage Remuneration ($)
Investment in ProgrammingTotal Canadian Programming
Canadian Programming/Revenue (%)
Acquisition of rightsScript & conceptFiller Programming + Program Production
Adjustments - Gain (Loss)
Pre-tax Profit
Canadian Programming Expenses
Page 38

Undertaking # Service Name
535428579 ATN - Times Now (formerly South Asian
News - English)
2011 2012 Var % 2013 Var % 2014 Var % 2015 Var %
y1 y2 y3 y4 y5
3,364 10,933 225.00 36,107 230.26 46,923 29.96 153,045 226.16
1,655 8,653 422.84 24,932 188.13 25,334 1.61 87,210 244.24
0 0 0 0 0
0 0 0 0 0
1,002 7,222 620.76 6,878 -4.76 1,872 -72.78 10,688 470.94
0 0 0 0 0
1,002 7,222 620.76 6,878 -4.76 1,872 -72.78 10,688 470.94
29.79 66.06 19.05 3.99 6.98
CRTC - FINANCIAL SUMMARY - PAY & SPECIALTY
Programming and Production 169.4
TechnicalSales and Promotion
Other revenueTotal Revenue 159.7
Expenses
DTH revenueLocal advertising revenueNational advertising revenue
($) CAGR (%)
RevenueResidential/bulk/smatv subscriber revenue
Pay and Specialty
Licensee Licensee Ultimate Owner Type Year
Asian Television Network
International Limited
Chandrasekar, Shan Specialty (category B service) 2015
Total Remuneration ($)Average Staff CountAverage Remuneration ($)
Investment in ProgrammingTotal Canadian Programming 80.7
Canadian Programming/Revenue (%)
Acquisition of rightsScript & conceptFiller Programming + Program Production 80.7
Adjustments - Gain (Loss)
Pre-tax Profit
Canadian Programming Expenses
Depreciation
P.B.I.T.
Interest Expense
Administration and GeneralTotal Expenses
Operating Income
P.B.I.T. MarginPre-tax MarginCAGR = Compound Annual Growth Rate
Subscribers
Profitability (%)Operating Margin
Page 39

Undertaking # Service Name
535420294 ATN Zee Cinema (formerly ATN – Hindi
Movie Channel Two)
2011 2012 Var % 2013 Var % 2014 Var % 2015 Var %
y1 y2
80,780 90,684 12.26 -100.00
150,021 168,414 12.26 -100.00
116,319 74,895 -35.61 -100.00
62,634 40,329 -35.61 -100.00
0 0
409,754 374,322 -8.65 -100.00
174,873 196,105 12.14 -100.00
46,648 91,044 95.17 -100.00
53,814 67,290 25.04 -100.00
61,179 54,976 -10.14 -100.00
336,514 409,415 21.66 -100.00
73,240 -35,093
2,132 3,370 58.07 -100.00
71,108 -38,463
-141 122 -186.52 -100.00
-16 500 >999± -100.00
71,233 -38,085
0 0
0 0
111,078 122,946 10.68 -100.00
0 0
111,078 122,946 10.68 -100.00
27.11 32.84
101,517 117,141 15.39 -100.00
3 2.6 -13.33 -100.00
33,839 45,054 33.14 -100.00
12,282 5,604 -54.37 -100.00
17.9 -9.4
17.4 -10.3
17.4 -10.2
DTH revenueLocal advertising revenueNational advertising revenue
($) CAGR (%)
RevenueResidential/bulk/smatv subscriber revenue
Pay and Specialty
Licensee Licensee Ultimate Owner Type Year
Asian Television Network
International Limited
Chandrasekar, Shan Pay-TV (category B service) 2012
CRTC - FINANCIAL SUMMARY - PAY & SPECIALTY
Acquisition of rightsScript & conceptFiller Programming + Program Production
Adjustments - Gain (Loss)
Pre-tax Profit
Canadian Programming Expenses
Depreciation
P.B.I.T.
Interest Expense
Administration and GeneralTotal Expenses
Operating Income
Programming and ProductionTechnicalSales and Promotion
Other revenueTotal Revenue
Expenses
P.B.I.T. MarginPre-tax MarginCAGR = Compound Annual Growth Rate
Subscribers
Profitability (%)Operating Margin
Total Remuneration ($)Average Staff CountAverage Remuneration ($)
Investment in ProgrammingTotal Canadian Programming
Canadian Programming/Revenue (%)
Page 40

Undertaking # Service Name
535428602 ATN - Zoom (formerly Music Network
Two)
2011 2012 Var % 2013 Var % 2014 Var % 2015 Var %
y1 y2 y3 y4 y5
4,027 17,982 346.54 37,226 107.02 48,030 29.02 155,577 223.92
2,469 15,204 515.80 25,704 69.06 27,320 6.29 89,517 227.66
0 0 0 0 0
0 0 0 0 0
1,495 11,197 648.96 7,091 -36.67 3,305 -53.39 11,729 254.89
0 0 0 0 0
1,495 11,197 648.96 7,091 -36.67 3,305 -53.39 11,729 254.89
37.12 62.27 19.05 6.88 7.54
Pay and Specialty
Licensee Licensee Ultimate Owner Type Year
Asian Television Network
International Limited
Chandrasekar, Shan Specialty (category B service) 2015
CRTC - FINANCIAL SUMMARY - PAY & SPECIALTY
Depreciation
P.B.I.T.
Interest Expense
Administration and GeneralTotal Expenses
Operating Income
Programming and Production 145.4
TechnicalSales and Promotion
Other revenueTotal Revenue 149.3
Expenses
DTH revenueLocal advertising revenueNational advertising revenue
($) CAGR (%)
RevenueResidential/bulk/smatv subscriber revenue
P.B.I.T. MarginPre-tax MarginCAGR = Compound Annual Growth Rate
Subscribers
Profitability (%)Operating Margin
Total Remuneration ($)Average Staff CountAverage Remuneration ($)
Investment in ProgrammingTotal Canadian Programming 67.4
Canadian Programming/Revenue (%)
Acquisition of rightsScript & conceptFiller Programming + Program Production 67.4
Adjustments - Gain (Loss)
Pre-tax Profit
Canadian Programming Expenses
Page 41

Undertaking # Service Name
535428149 AUX TV
2011 2012 Var % 2013 Var % 2014 Var % 2015 Var %
y1 y2 y3 y4 y5
252,601 492,522 94.98 489,078 -0.70 696,776 42.47 1,011,714 45.20
1,168,323 808,147 -30.83 197,285 -75.59 203,379 3.09 162,738 -19.98
987,581 212,438 -78.49 1,673 -99.21 1,767 5.62 95,487 >999±
0 0 0 0 0
80,657 355,500 340.76 85,679 -75.90 110,297 28.73 16,073 -85.43
0 50,972 13,266 -73.97 0 -100.00 0
1,068,238 618,910 -42.06 100,618 -83.74 112,064 11.38 111,560 -0.45
422.90 125.66 20.57 16.08 11.03
CRTC - FINANCIAL SUMMARY - PAY & SPECIALTY
Programming and Production -38.9
TechnicalSales and Promotion
Other revenueTotal Revenue 41.5
Expenses
DTH revenueLocal advertising revenueNational advertising revenue
($) CAGR (%)
RevenueResidential/bulk/smatv subscriber revenue
Pay and Specialty
Licensee Licensee Ultimate Owner Type Year
Blue Ant Media Partnership Blue Ant Media Inc. Specialty (category B service) 2015
Total Remuneration ($)Average Staff CountAverage Remuneration ($)
Investment in ProgrammingTotal Canadian Programming -43.2
Canadian Programming/Revenue (%)
Acquisition of rights -44.2
Script & conceptFiller Programming + Program Production -33.2
Adjustments - Gain (Loss)
Pre-tax Profit
Canadian Programming Expenses
Depreciation
P.B.I.T.
Interest Expense
Administration and GeneralTotal Expenses
Operating Income
P.B.I.T. MarginPre-tax MarginCAGR = Compound Annual Growth Rate
Subscribers
Profitability (%)Operating Margin
Page 42

Undertaking # Service Name
205429568 Avis de Recherche
2011 2012 Var % 2013 Var % 2014 Var % 2015 Var %
y1 y2 y3 y4 y5
1,503,292 1,730,011 15.08 1,829,473 5.75 1,895,384 3.60 1,951,305 2.95
716,884 1,084,764 51.32 1,052,682 -2.96 836,527 -20.53 501,087 -40.10
0 0 0 0 0
0 0 0 0 0
716,884 1,084,764 51.32 1,052,682 -2.96 836,527 -20.53 501,087 -40.10
0 0 0 0 0
716,884 1,084,764 51.32 1,052,682 -2.96 836,527 -20.53 501,087 -40.10
47.69 62.70 57.54 44.13 25.68
DTH revenueLocal advertising revenueNational advertising revenue
($) CAGR (%)
RevenueResidential/bulk/smatv subscriber revenue
Pay and Specialty
Licensee Licensee Ultimate Owner Type Year
Avis de recherche incorporée Géracitano, Vincent Specialty (category B service) 2015
CRTC - FINANCIAL SUMMARY - PAY & SPECIALTY
Acquisition of rightsScript & conceptFiller Programming + Program Production -8.6
Adjustments - Gain (Loss)
Pre-tax Profit
Canadian Programming Expenses
Depreciation
P.B.I.T.
Interest Expense
Administration and GeneralTotal Expenses
Operating Income
Programming and Production -8.6
TechnicalSales and Promotion
Other revenueTotal Revenue 6.7
Expenses
P.B.I.T. MarginPre-tax MarginCAGR = Compound Annual Growth Rate
Subscribers
Profitability (%)Operating Margin
Total Remuneration ($)Average Staff CountAverage Remuneration ($)
Investment in ProgrammingTotal Canadian Programming -8.6
Canadian Programming/Revenue (%)
Page 43

Undertaking # Service Name
305424319 BBC Canada
2011 2012 Var % 2013 Var % 2014 Var % 2015 Var %
y1 y2 y3 y4 y5
2,977,524 4,302,447 44.50 4,707,048 9.40 4,944,739 5.05 5,323,862 7.67
3,131,379 2,997,095 -4.29 2,813,036 -6.14 2,704,455 -3.86 2,605,483 -3.66
0 0 0 0 0
2,915,303 3,143,498 7.83 3,145,808 0.07 3,166,880 0.67 2,711,608 -14.38
0 0 0 0 0
9,024,206 10,443,040 15.72 10,665,892 2.13 10,816,074 1.41 10,640,953 -1.62
3,457,551 2,146,329 -37.92 2,593,566 20.84 2,690,605 3.74 2,519,092 -6.37
674,941 654,261 -3.06 657,877 0.55 496,750 -24.49 556,876 12.10
219,787 353,159 60.68 228,653 -35.25 78,451 -65.69 115,424 47.13
1,248,413 1,054,195 -15.56 1,107,738 5.08 1,240,319 11.97 1,374,319 10.80
5,600,692 4,207,944 -24.87 4,587,834 9.03 4,506,125 -1.78 4,565,711 1.32
3,423,514 6,235,096 6,078,058 6,309,949 6,075,242
0 0 0 0 0
3,423,514 6,235,096 6,078,058 6,309,949 6,075,242
1,845,138 1,548,800 -16.06 1,195,143 -22.83 776,274 -35.05 416,887 -46.30
0 0 0 0 0
1,578,376 4,686,296 4,882,915 5,533,675 5,658,355
133,551 156,251 17.00 133,097 -14.82 123,546 -7.18 37,978 -69.26
0 0 0 0 0
535,047 341,272 -36.22 303,164 -11.17 406,224 33.99 395,992 -2.52
0 0 0 0 0
668,598 497,523 -25.59 436,261 -12.31 529,770 21.43 433,970 -18.08
7.41 4.76 4.09 4.90 4.08
791,231 906,794 14.61 1,039,431 14.63 1,082,557 4.15 1,145,716 5.83
10 11 10.00 12 9.09 12 0.00 12 0.00
79,123 82,436 4.19 86,619 5.07 90,213 4.15 95,476 5.83
2,629,465 2,726,348 3.68 2,727,819 0.05 2,681,246 -1.71 2,656,825 -0.91
37.9 59.7 57.0 58.3 57.1
37.9 59.7 57.0 58.3 57.1
17.5 44.9 45.8 51.2 53.2
Pay and Specialty
Licensee Licensee Ultimate Owner Type Year
Jasper Broadcasting Inc. Shaw Communications Inc. Specialty (category B service) 2015
CRTC - FINANCIAL SUMMARY - PAY & SPECIALTY
Depreciation
P.B.I.T.
Interest Expense
Administration and General 2.4
Total Expenses -5.0
Operating Income
Programming and Production -7.6
Technical -4.7
Sales and Promotion -14.9
Other revenueTotal Revenue 4.2
Expenses
DTH revenue -4.5
Local advertising revenueNational advertising revenue -1.8
($) CAGR (%)
RevenueResidential/bulk/smatv subscriber revenue 15.6
P.B.I.T. MarginPre-tax MarginCAGR = Compound Annual Growth Rate
Subscribers 0.3
Profitability (%)Operating Margin
Total Remuneration ($) 9.7
Average Staff CountAverage Remuneration ($) 4.8
Investment in ProgrammingTotal Canadian Programming -10.2
Canadian Programming/Revenue (%)
Acquisition of rights -27.0
Script & conceptFiller Programming + Program Production -7.3
Adjustments - Gain (Loss)
Pre-tax Profit
Canadian Programming Expenses
Page 44

Undertaking # Service Name
305426852 BBC Kids
2011 2012 Var % 2013 Var % 2014 Var % 2015 Var %
y1 y2 y3 y4 y5
2,259,429 2,625,002 16.18 2,860,935 8.99 2,774,845 -3.01 3,091,305 11.40
800,065 337,301 -57.84 543,927 61.26 950,931 74.83 1,227,995 29.14
61,529 284,351 362.14 0 -100.00 294,789 609,464 106.75
0 0 0 0 0
99,403 0 -100.00 212,132 0 -100.00 0
0 0 0 0 0
160,932 284,351 76.69 212,132 -25.40 294,789 38.96 609,464 106.75
7.12 10.83 7.41 10.62 19.72
CRTC - FINANCIAL SUMMARY - PAY & SPECIALTY
Programming and Production 11.3
TechnicalSales and Promotion
Other revenueTotal Revenue 8.2
Expenses
DTH revenueLocal advertising revenueNational advertising revenue
($) CAGR (%)
RevenueResidential/bulk/smatv subscriber revenue
Pay and Specialty
Licensee Licensee Ultimate Owner Type Year
Knowledge-West Communications
Corporation
Knowledge Network Corporation Specialty (category B service) 2015
Total Remuneration ($)Average Staff CountAverage Remuneration ($)
Investment in ProgrammingTotal Canadian Programming 39.5
Canadian Programming/Revenue (%)
Acquisition of rights 77.4
Script & conceptFiller Programming + Program Production -100.0
Adjustments - Gain (Loss)
Pre-tax Profit
Canadian Programming Expenses
Depreciation
P.B.I.T.
Interest Expense
Administration and GeneralTotal Expenses
Operating Income
P.B.I.T. MarginPre-tax MarginCAGR = Compound Annual Growth Rate
Subscribers
Profitability (%)Operating Margin
Page 45
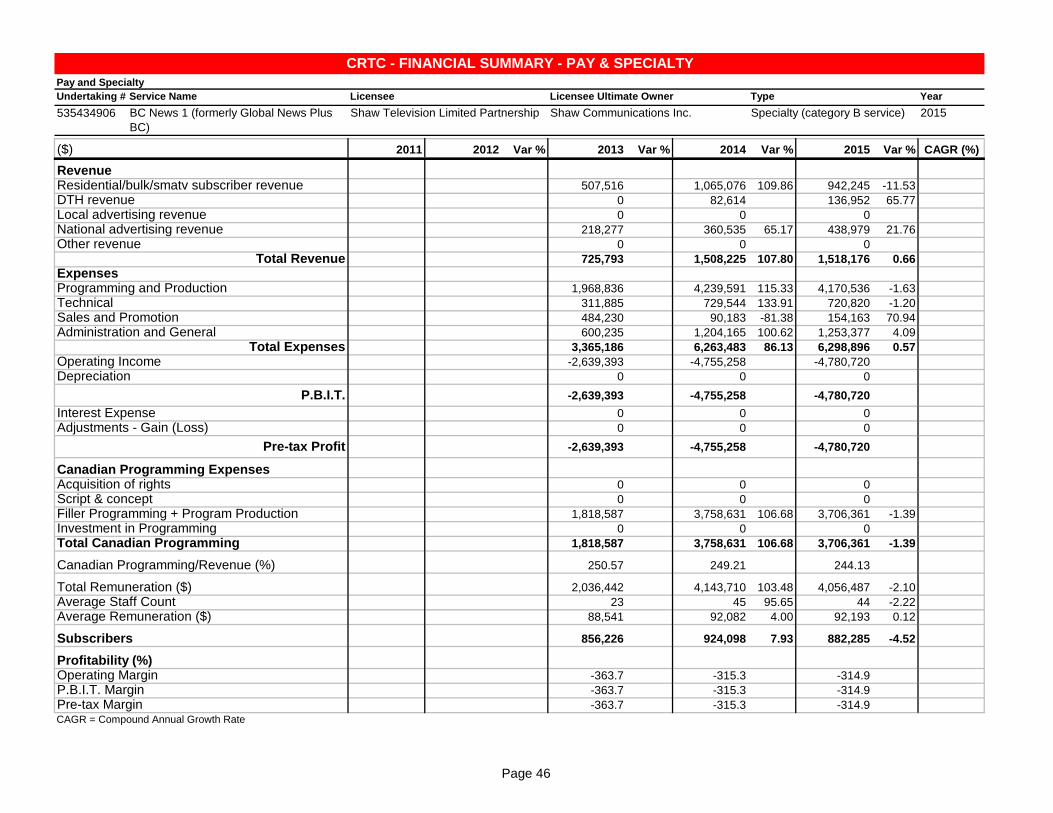
Undertaking # Service Name
535434906 BC News 1 (formerly Global News Plus
BC)
2011 2012 Var % 2013 Var % 2014 Var % 2015 Var %
y3 y4 y5
507,516 1,065,076 109.86 942,245 -11.53
0 82,614 136,952 65.77
0 0 0
218,277 360,535 65.17 438,979 21.76
0 0 0
725,793 1,508,225 107.80 1,518,176 0.66
1,968,836 4,239,591 115.33 4,170,536 -1.63
311,885 729,544 133.91 720,820 -1.20
484,230 90,183 -81.38 154,163 70.94
600,235 1,204,165 100.62 1,253,377 4.09
3,365,186 6,263,483 86.13 6,298,896 0.57
-2,639,393 -4,755,258 -4,780,720
0 0 0
-2,639,393 -4,755,258 -4,780,720
0 0 0
0 0 0
-2,639,393 -4,755,258 -4,780,720
0 0 0
0 0 0
1,818,587 3,758,631 106.68 3,706,361 -1.39
0 0 0
1,818,587 3,758,631 106.68 3,706,361 -1.39
250.57 249.21 244.13
2,036,442 4,143,710 103.48 4,056,487 -2.10
23 45 95.65 44 -2.22
88,541 92,082 4.00 92,193 0.12
856,226 924,098 7.93 882,285 -4.52
-363.7 -315.3 -314.9
-363.7 -315.3 -314.9
-363.7 -315.3 -314.9
DTH revenueLocal advertising revenueNational advertising revenue
($) CAGR (%)
RevenueResidential/bulk/smatv subscriber revenue
Pay and Specialty
Licensee Licensee Ultimate Owner Type Year
Shaw Television Limited Partnership Shaw Communications Inc. Specialty (category B service) 2015
CRTC - FINANCIAL SUMMARY - PAY & SPECIALTY
Acquisition of rightsScript & conceptFiller Programming + Program Production
Adjustments - Gain (Loss)
Pre-tax Profit
Canadian Programming Expenses
Depreciation
P.B.I.T.
Interest Expense
Administration and GeneralTotal Expenses
Operating Income
Programming and ProductionTechnicalSales and Promotion
Other revenueTotal Revenue
Expenses
P.B.I.T. MarginPre-tax MarginCAGR = Compound Annual Growth Rate
Subscribers
Profitability (%)Operating Margin
Total Remuneration ($)Average Staff CountAverage Remuneration ($)
Investment in ProgrammingTotal Canadian Programming
Canadian Programming/Revenue (%)
Page 46
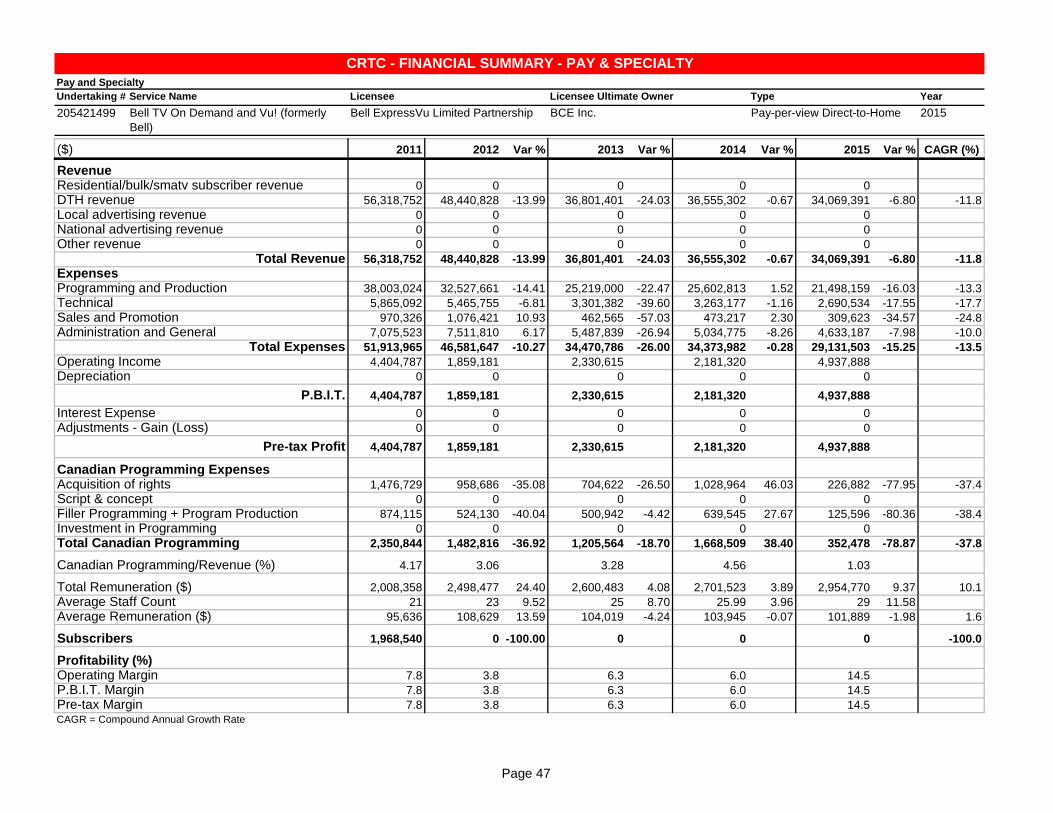
Undertaking # Service Name
205421499 Bell TV On Demand and Vu! (formerly
Bell)
2011 2012 Var % 2013 Var % 2014 Var % 2015 Var %
y1 y2 y3 y4 y5
0 0 0 0 0
56,318,752 48,440,828 -13.99 36,801,401 -24.03 36,555,302 -0.67 34,069,391 -6.80
0 0 0 0 0
0 0 0 0 0
0 0 0 0 0
56,318,752 48,440,828 -13.99 36,801,401 -24.03 36,555,302 -0.67 34,069,391 -6.80
38,003,024 32,527,661 -14.41 25,219,000 -22.47 25,602,813 1.52 21,498,159 -16.03
5,865,092 5,465,755 -6.81 3,301,382 -39.60 3,263,177 -1.16 2,690,534 -17.55
970,326 1,076,421 10.93 462,565 -57.03 473,217 2.30 309,623 -34.57
7,075,523 7,511,810 6.17 5,487,839 -26.94 5,034,775 -8.26 4,633,187 -7.98
51,913,965 46,581,647 -10.27 34,470,786 -26.00 34,373,982 -0.28 29,131,503 -15.25
4,404,787 1,859,181 2,330,615 2,181,320 4,937,888
0 0 0 0 0
4,404,787 1,859,181 2,330,615 2,181,320 4,937,888
0 0 0 0 0
0 0 0 0 0
4,404,787 1,859,181 2,330,615 2,181,320 4,937,888
1,476,729 958,686 -35.08 704,622 -26.50 1,028,964 46.03 226,882 -77.95
0 0 0 0 0
874,115 524,130 -40.04 500,942 -4.42 639,545 27.67 125,596 -80.36
0 0 0 0 0
2,350,844 1,482,816 -36.92 1,205,564 -18.70 1,668,509 38.40 352,478 -78.87
4.17 3.06 3.28 4.56 1.03
2,008,358 2,498,477 24.40 2,600,483 4.08 2,701,523 3.89 2,954,770 9.37
21 23 9.52 25 8.70 25.99 3.96 29 11.58
95,636 108,629 13.59 104,019 -4.24 103,945 -0.07 101,889 -1.98
1,968,540 0 -100.00 0 0 0
7.8 3.8 6.3 6.0 14.5
7.8 3.8 6.3 6.0 14.5
7.8 3.8 6.3 6.0 14.5
Pay and Specialty
Licensee Licensee Ultimate Owner Type Year
Bell ExpressVu Limited Partnership BCE Inc. Pay-per-view Direct-to-Home 2015
CRTC - FINANCIAL SUMMARY - PAY & SPECIALTY
Depreciation
P.B.I.T.
Interest Expense
Administration and General -10.0
Total Expenses -13.5
Operating Income
Programming and Production -13.3
Technical -17.7
Sales and Promotion -24.8
Other revenueTotal Revenue -11.8
Expenses
DTH revenue -11.8
Local advertising revenueNational advertising revenue
($) CAGR (%)
RevenueResidential/bulk/smatv subscriber revenue
P.B.I.T. MarginPre-tax MarginCAGR = Compound Annual Growth Rate
Subscribers -100.0
Profitability (%)Operating Margin
Total Remuneration ($) 10.1
Average Staff CountAverage Remuneration ($) 1.6
Investment in ProgrammingTotal Canadian Programming -37.8
Canadian Programming/Revenue (%)
Acquisition of rights -37.4
Script & conceptFiller Programming + Program Production -38.4
Adjustments - Gain (Loss)
Pre-tax Profit
Canadian Programming Expenses
Page 47

Undertaking # Service Name
305424153 Bell TV On Demand (formerly General
Interest)
2011 2012 Var % 2013 Var % 2014 Var % 2015 Var %
y1 y2 y3 y4 y5
103,756 0 -100.00 883,736 3,225,409 264.97 5,945,993 84.35
0 0 0 0 0
0 0 0 0 0
0 0 0 0 0
0 698,418 0 -100.00 0 0
103,756 698,418 573.14 883,736 26.53 3,225,409 264.97 5,945,993 84.35
69,190 264,699 282.57 497,849 88.08 2,231,520 348.23 4,658,960 108.78
0 0 0 0 0
0 0 0 0 0
0 0 0 0 0
69,190 264,699 282.57 497,849 88.08 2,231,520 348.23 4,658,960 108.78
34,566 433,719 385,887 993,889 1,287,033
0 0 0 0 0
34,566 433,719 385,887 993,889 1,287,033
0 0 0 0 0
0 0 0 0 0
34,566 433,719 385,887 993,889 1,287,033
0 7,941 20,706 160.75 309,433 >999± 12,236 -96.05
0 0 0 0 0
0 0 0 0 125,596
0 0 0 0 0
0 7,941 20,706 160.75 309,433 >999± 137,832 -55.46
0.00 1.14 2.34 9.59 2.32
0 0 0 0 0
0 0 0 0 0
0 0 0 0 0
33.3 62.1 43.7 30.8 21.6
33.3 62.1 43.7 30.8 21.6
33.3 62.1 43.7 30.8 21.6
CRTC - FINANCIAL SUMMARY - PAY & SPECIALTY
Programming and Production 186.5
TechnicalSales and Promotion
Other revenueTotal Revenue 175.1
Expenses
DTH revenueLocal advertising revenueNational advertising revenue
($) CAGR (%)
RevenueResidential/bulk/smatv subscriber revenue 175.1
Pay and Specialty
Licensee Licensee Ultimate Owner Type Year
Bell ExpressVu Limited Partnership BCE Inc. Pay-per-view programming 2015
Total Remuneration ($)Average Staff CountAverage Remuneration ($)
Investment in ProgrammingTotal Canadian Programming
Canadian Programming/Revenue (%)
Acquisition of rightsScript & conceptFiller Programming + Program Production
Adjustments - Gain (Loss)
Pre-tax Profit
Canadian Programming Expenses
Depreciation
P.B.I.T.
Interest Expense
Administration and GeneralTotal Expenses 186.5
Operating Income
P.B.I.T. MarginPre-tax MarginCAGR = Compound Annual Growth Rate
Subscribers
Profitability (%)Operating Margin
Page 48

Undertaking # Service Name
535419338 Bell TV On Demand (formerly Vu! On
Demand)
2011 2012 Var % 2013 Var % 2014 Var % 2015 Var %
y1 y2 y3 y4 y5
1,736,883 4,688,310 169.93 9,018,897 92.37 13,162,525 45.94 15,257,853 15.92
0 0 0 0 0
0 0 0 0 0
0 0 0 0 0
0 0 0 0 0
1,736,883 4,688,310 169.93 9,018,897 92.37 13,162,525 45.94 15,257,853 15.92
2,183,740 5,884,206 169.46 11,248,447 91.16 16,265,575 44.60 18,975,716 16.66
86,844 471,307 442.71 809,068 71.66 1,174,977 45.23 1,204,946 2.55
0 65,356 469,855 618.92 461,379 -1.80 307,462 -33.36
0 211,448 1,933,814 814.56 704,351 -63.58 561,247 -20.32
2,270,584 6,632,317 192.10 14,461,184 118.04 18,606,282 28.66 21,049,371 13.13
-533,701 -1,944,007 -5,442,287 -5,443,757 -5,791,518
0 0 0 0 0
-533,701 -1,944,007 -5,442,287 -5,443,757 -5,791,518
0 0 0 0 0
0 0 0 0 0
-533,701 -1,944,007 -5,442,287 -5,443,757 -5,791,518
0 152,811 367,017 140.18 437,839 19.30 584,179 33.42
0 0 0 0 0
0 125,703 259,576 106.50 342,000 31.75 451,106 31.90
0 0 0 0 0
0 278,514 626,593 124.98 779,839 24.46 1,035,285 32.76
0.00 5.94 6.95 5.92 6.79
0 211,351 1,551,097 633.90 582,165 -62.47 477,008 -18.06
0 5 25 400.00 11.99 -52.04 18 50.13
42,270 62,044 46.78 48,554 -21.74 26,500 -45.42
-30.7 -41.5 -60.3 -41.4 -38.0
-30.7 -41.5 -60.3 -41.4 -38.0
-30.7 -41.5 -60.3 -41.4 -38.0
DTH revenueLocal advertising revenueNational advertising revenue
($) CAGR (%)
RevenueResidential/bulk/smatv subscriber revenue 72.2
Pay and Specialty
Licensee Licensee Ultimate Owner Type Year
Bell ExpressVu Limited Partnership BCE Inc. Video-on-Demand 2015
CRTC - FINANCIAL SUMMARY - PAY & SPECIALTY
Acquisition of rightsScript & conceptFiller Programming + Program Production
Adjustments - Gain (Loss)
Pre-tax Profit
Canadian Programming Expenses
Depreciation
P.B.I.T.
Interest Expense
Administration and GeneralTotal Expenses 74.5
Operating Income
Programming and Production 71.7
Technical 93.0
Sales and Promotion
Other revenueTotal Revenue 72.2
Expenses
P.B.I.T. MarginPre-tax MarginCAGR = Compound Annual Growth Rate
Subscribers
Profitability (%)Operating Margin
Total Remuneration ($)Average Staff CountAverage Remuneration ($)
Investment in ProgrammingTotal Canadian Programming
Canadian Programming/Revenue (%)
Page 49

Undertaking # Service Name
535422737 Big Magic International Canada (formerly
Imagine Dil Se)
2011 2012 Var % 2013 Var % 2014 Var % 2015 Var %
y1 y2 y3
440,409 684,843 55.50 286,509 -58.16 -100.00
230,265 188,244 -18.25 236,993 25.90 -100.00
15,305 15,316 0.07 3,049 -80.09 -100.00
20,407 20,422 0.07 4,065 -80.09 -100.00
66,323 66,371 0.07 13,212 -80.09 -100.00
0 0 0
102,035 102,109 0.07 20,326 -80.09 -100.00
23.17 14.91 7.09
Pay and Specialty
Licensee Licensee Ultimate Owner Type Year
Ethnic Channels Group Limited Levin, Slava Specialty (category B service) 2013
CRTC - FINANCIAL SUMMARY - PAY & SPECIALTY
Depreciation
P.B.I.T.
Interest Expense
Administration and GeneralTotal Expenses
Operating Income
Programming and ProductionTechnicalSales and Promotion
Other revenueTotal Revenue
Expenses
DTH revenueLocal advertising revenueNational advertising revenue
($) CAGR (%)
RevenueResidential/bulk/smatv subscriber revenue
P.B.I.T. MarginPre-tax MarginCAGR = Compound Annual Growth Rate
Subscribers
Profitability (%)Operating Margin
Total Remuneration ($)Average Staff CountAverage Remuneration ($)
Investment in ProgrammingTotal Canadian Programming
Canadian Programming/Revenue (%)
Acquisition of rightsScript & conceptFiller Programming + Program Production
Adjustments - Gain (Loss)
Pre-tax Profit
Canadian Programming Expenses
Page 50

Undertaking # Service Name
405423922 Book Television (formerly Book
Television - The Channel)
2011 2012 Var % 2013 Var % 2014 Var % 2015 Var %
y1 y2 y3 y4 y5
1,657,313 1,753,523 5.81 1,805,477 2.96 1,949,236 7.96 1,812,870 -7.00
2,532,615 2,700,018 6.61 2,646,220 -1.99 2,628,159 -0.68 2,097,501 -20.19
0 0 0 0 0
63,132 82,594 30.83 27,512 -66.69 29,525 7.32 37,569 27.24
0 0 0 0 0
4,253,060 4,536,135 6.66 4,479,209 -1.25 4,606,920 2.85 3,947,940 -14.30
1,834,893 684,588 -62.69 582,312 -14.94 833,538 43.14 568,469 -31.80
517,763 510,227 -1.46 507,227 -0.59 505,482 -0.34 478,430 -5.35
53,801 55,479 3.12 23,153 -58.27 5,416 -76.61 4,503 -16.86
252,484 227,590 -9.86 215,370 -5.37 222,291 3.21 249,815 12.38
2,658,941 1,477,884 -44.42 1,328,062 -10.14 1,566,727 17.97 1,301,217 -16.95
1,594,119 3,058,251 3,151,147 3,040,193 2,646,723
273,528 51,293 -81.25 61,577 20.05 65,683 6.67 62,735 -4.49
1,320,591 3,006,958 3,089,570 2,974,510 2,583,988
0 0 0 0 0
-124,755 -308,557 147.33 -307,853 -0.23 -308,092 0.08 -55,281 -82.06
1,195,836 2,698,401 2,781,717 2,666,418 2,528,707
500,100 200,872 -59.83 285,638 42.20 213,261 -25.34 96,242 -54.87
0 0 0 0 0
995,145 184,941 -81.42 0 -100.00 0 0
0 0 0 0 0
1,495,245 385,813 -74.20 285,638 -25.96 213,261 -25.34 96,242 -54.87
35.16 8.51 6.38 4.63 2.44
126,600 107,966 -14.72 26,872 -75.11 2 -99.99 0 -100.00
1.33 2 50.38 0.45 -77.50 0 -100.00 0
95,188 53,983 -43.29 59,716 10.62
969,000 946,165 -2.36 885,479 -6.41 823,283 -7.02 523,731 -36.39
37.5 67.4 70.4 66.0 67.0
31.1 66.3 69.0 64.6 65.5
28.1 59.5 62.1 57.9 64.1
CRTC - FINANCIAL SUMMARY - PAY & SPECIALTY
Programming and Production -25.4
Technical -2.0
Sales and Promotion -46.2
Other revenueTotal Revenue -1.8
Expenses
DTH revenue -4.6
Local advertising revenueNational advertising revenue -12.2
($) CAGR (%)
RevenueResidential/bulk/smatv subscriber revenue 2.3
Pay and Specialty
Licensee Licensee Ultimate Owner Type Year
Bell Media Inc. BCE Inc. Specialty (category A service) 2015
Total Remuneration ($) -100.0
Average Staff CountAverage Remuneration ($)
Investment in ProgrammingTotal Canadian Programming -49.6
Canadian Programming/Revenue (%)
Acquisition of rights -33.8
Script & conceptFiller Programming + Program Production -100.0
Adjustments - Gain (Loss)
Pre-tax Profit
Canadian Programming Expenses
Depreciation -30.8
P.B.I.T.
Interest Expense
Administration and General -0.3
Total Expenses -16.4
Operating Income
P.B.I.T. MarginPre-tax MarginCAGR = Compound Annual Growth Rate
Subscribers -14.3
Profitability (%)Operating Margin
Page 51

Undertaking # Service Name
305424848 BPM:TV (The Dance Channel)
2011 2012 Var % 2013 Var % 2014 Var % 2015 Var %
y1 y2 y3 y4 y5
629,213 598,569 -4.87 534,067 -10.78 444,342 -16.80 133,032 -70.06
339,418 397,136 17.00 367,462 -7.47 368,629 0.32 19,645 -94.67
7,075 9,410 33.00 3,535 -62.43 46,471 >999± 1,045 -97.75
0 0 0 0 0
292,806 324,901 10.96 285,275 -12.20 265,132 -7.06 0 -100.00
0 0 0 0 0
299,881 334,311 11.48 288,810 -13.61 311,603 7.89 1,045 -99.66
47.66 55.85 54.08 70.13 0.79
DTH revenueLocal advertising revenueNational advertising revenue
($) CAGR (%)
RevenueResidential/bulk/smatv subscriber revenue
Pay and Specialty
Licensee Licensee Ultimate Owner Type Year
Stornoway Communications Limited
Partnership
Smith, Vincent & Co. Ltd. Specialty (category B service) 2015
CRTC - FINANCIAL SUMMARY - PAY & SPECIALTY
Acquisition of rights -38.0
Script & conceptFiller Programming + Program Production -100.0
Adjustments - Gain (Loss)
Pre-tax Profit
Canadian Programming Expenses
Depreciation
P.B.I.T.
Interest Expense
Administration and GeneralTotal Expenses
Operating Income
Programming and Production -51.0
TechnicalSales and Promotion
Other revenueTotal Revenue -32.2
Expenses
P.B.I.T. MarginPre-tax MarginCAGR = Compound Annual Growth Rate
Subscribers
Profitability (%)Operating Margin
Total Remuneration ($)Average Staff CountAverage Remuneration ($)
Investment in ProgrammingTotal Canadian Programming -75.7
Canadian Programming/Revenue (%)
Page 52

Undertaking # Service Name
535424840 Bragg Communications Incorporated,
Halifax
2011 2012 Var % 2013 Var % 2014 Var % 2015 Var %
y1 y2 y3 y4 y5
5,236,193 6,294,988 20.22 5,854,604 -7.00 5,213,860 -10.94 4,605,536 -11.67
0 0 0 0 0
0 0 0 0 0
0 0 0 0 0
0 0 0 0 0
5,236,193 6,294,988 20.22 5,854,604 -7.00 5,213,860 -10.94 4,605,536 -11.67
3,600,355 4,557,985 26.60 4,145,491 -9.05 4,514,403 8.90 4,513,216 -0.03
0 0 0 0 0
0 0 0 0 0
0 0 0 10,518 9,212 -12.42
3,600,355 4,557,985 26.60 4,145,491 -9.05 4,524,921 9.15 4,522,428 -0.06
1,635,838 1,737,003 1,709,113 688,939 83,108
0 0 0 0 0
1,635,838 1,737,003 1,709,113 688,939 83,108
0 0 0 0 0
0 0 0 0 0
1,635,838 1,737,003 1,709,113 688,939 83,108
3,600,355 4,557,985 26.60 4,145,491 -9.05 4,514,403 8.90 4,513,216 -0.03
0 0 0 0 0
0 0 0 0 0
0 0 0 0 0
3,600,355 4,557,985 26.60 4,145,491 -9.05 4,514,403 8.90 4,513,216 -0.03
68.76 72.41 70.81 86.58 98.00
0 0 0 0 0
0 0 0 0 0
31.2 27.6 29.2 13.2 1.8
31.2 27.6 29.2 13.2 1.8
31.2 27.6 29.2 13.2 1.8
Pay and Specialty
Licensee Licensee Ultimate Owner Type Year
Bragg Communications Incorporated Tidnish Holdings Limited Video-on-Demand 2015
CRTC - FINANCIAL SUMMARY - PAY & SPECIALTY
Depreciation
P.B.I.T.
Interest Expense
Administration and GeneralTotal Expenses 5.9
Operating Income
Programming and Production 5.8
TechnicalSales and Promotion
Other revenueTotal Revenue -3.2
Expenses
DTH revenueLocal advertising revenueNational advertising revenue
($) CAGR (%)
RevenueResidential/bulk/smatv subscriber revenue -3.2
P.B.I.T. MarginPre-tax MarginCAGR = Compound Annual Growth Rate
Subscribers
Profitability (%)Operating Margin
Total Remuneration ($)Average Staff CountAverage Remuneration ($)
Investment in ProgrammingTotal Canadian Programming 5.8
Canadian Programming/Revenue (%)
Acquisition of rights 5.8
Script & conceptFiller Programming + Program Production
Adjustments - Gain (Loss)
Pre-tax Profit
Canadian Programming Expenses
Page 53

Undertaking # Service Name
315413740 Bravo!
2011 2012 Var % 2013 Var % 2014 Var % 2015 Var %
y1 y2 y3 y4 y5
18,694,579 19,171,914 2.55 19,495,674 1.69 20,676,717 6.06 20,037,637 -3.09
5,884,024 6,043,809 2.72 6,157,681 1.88 6,115,676 -0.68 5,987,718 -2.09
0 0 0 0 0
13,771,454 16,950,060 23.08 24,964,152 47.28 26,497,875 6.14 25,305,295 -4.50
58 40,629 >999± 71,415 75.77 12,105 -83.05 32,000 164.35
38,350,115 42,206,412 10.06 50,688,922 20.10 53,302,373 5.16 51,362,650 -3.64
17,821,912 17,657,301 -0.92 19,116,413 8.26 18,394,919 -3.77 16,646,808 -9.50
1,280,724 1,267,840 -1.01 1,380,523 8.89 1,385,600 0.37 1,133,172 -18.22
1,713,818 1,557,447 -9.12 2,237,992 43.70 2,100,827 -6.13 2,160,102 2.82
3,732,804 3,224,122 -13.63 3,266,004 1.30 3,917,376 19.94 4,169,602 6.44
24,549,258 23,706,710 -3.43 26,000,932 9.68 25,798,722 -0.78 24,109,684 -6.55
13,800,857 18,499,702 24,687,990 27,503,651 27,252,966
2,625,818 967,835 -63.14 792,556 -18.11 850,498 7.31 899,275 5.74
11,175,039 17,531,867 23,895,434 26,653,153 26,353,691
0 61 365 498.36 117 -67.95 100 -14.53
-43,124,923 -2,868,201 -93.35 -3,477,650 21.25 -4,053,440 16.56 -3,940,749 -2.78
-31,949,884 14,663,605 20,417,419 22,599,596 22,412,842
4,061,537 4,126,561 1.60 7,496,207 81.66 5,849,501 -21.97 3,519,984 -39.82
25,000 50,001 100.00 64,000 28.00 23,232 -63.70 141,905 510.82
3,783,562 3,581,658 -5.34 804,742 -77.53 146,550 -81.79 0 -100.00
776,410 0 -100.00 0 0 0
8,646,509 7,758,220 -10.27 8,364,949 7.82 6,019,283 -28.04 3,661,889 -39.16
22.55 18.38 16.50 11.29 7.13
4,463,107 2,003,623 -55.11 576,652 -71.22 293,584 -49.09 276,205 -5.92
42 18 -57.14 5 -72.22 3 -40.00 2 -33.33
106,264 111,312 4.75 115,330 3.61 97,861 -15.15 138,103 41.12
7,019,783 6,811,736 -2.96 6,755,640 -0.82 6,602,264 -2.27 6,361,414 -3.65
36.0 43.8 48.7 51.6 53.1
29.1 41.5 47.1 50.0 51.3
-83.3 34.7 40.3 42.4 43.6
CRTC - FINANCIAL SUMMARY - PAY & SPECIALTY
Programming and Production -1.7
Technical -3.0
Sales and Promotion 6.0
Other revenue 384.7
Total Revenue 7.6
Expenses
DTH revenue 0.4
Local advertising revenueNational advertising revenue 16.4
($) CAGR (%)
RevenueResidential/bulk/smatv subscriber revenue 1.8
Pay and Specialty
Licensee Licensee Ultimate Owner Type Year
Bell Media Inc. BCE Inc. Specialty (category A service) 2015
Total Remuneration ($) -50.1
Average Staff CountAverage Remuneration ($) 6.8
Investment in Programming -100.0
Total Canadian Programming -19.3
Canadian Programming/Revenue (%)
Acquisition of rights -3.5
Script & concept 54.4
Filler Programming + Program Production -100.0
Adjustments - Gain (Loss)
Pre-tax Profit
Canadian Programming Expenses
Depreciation -23.5
P.B.I.T.
Interest Expense
Administration and General 2.8
Total Expenses -0.5
Operating Income
P.B.I.T. MarginPre-tax MarginCAGR = Compound Annual Growth Rate
Subscribers -2.4
Profitability (%)Operating Margin
Page 54

Undertaking # Service Name
535426929 Bruce Telecom, Tiverton
2011 2012 Var % 2013 Var % 2014 Var % 2015 Var %
y1
9,936 -100.00
0
0
0
0
9,936 -100.00
13,057 -100.00
0
0
0
13,057 -100.00
-3,121
0
-3,121
0
0
-3,121
0
0
0
497 -100.00
497 -100.00
5.00
0
0
-31.4
-31.4
-31.4
DTH revenueLocal advertising revenueNational advertising revenue
($) CAGR (%)
RevenueResidential/bulk/smatv subscriber revenue
Pay and Specialty
Licensee Licensee Ultimate Owner Type Year
Bruce Telecom Bruce Telecom Video-on-Demand 2011
CRTC - FINANCIAL SUMMARY - PAY & SPECIALTY
Acquisition of rightsScript & conceptFiller Programming + Program Production
Adjustments - Gain (Loss)
Pre-tax Profit
Canadian Programming Expenses
Depreciation
P.B.I.T.
Interest Expense
Administration and GeneralTotal Expenses
Operating Income
Programming and ProductionTechnicalSales and Promotion
Other revenueTotal Revenue
Expenses
P.B.I.T. MarginPre-tax MarginCAGR = Compound Annual Growth Rate
Subscribers
Profitability (%)Operating Margin
Total Remuneration ($)Average Staff CountAverage Remuneration ($)
Investment in ProgrammingTotal Canadian Programming
Canadian Programming/Revenue (%)
Page 55

Undertaking # Service Name
305417273 Business News Network (BNN)
(previously ROBTV)
2011 2012 Var % 2013 Var % 2014 Var % 2015 Var %
y1 y2 y3 y4 y5
15,169,075 16,661,282 9.84 17,183,494 3.13 18,417,079 7.18 17,662,472 -4.10
6,536,720 6,554,553 0.27 6,664,079 1.67 6,545,970 -1.77 6,305,568 -3.67
0 0 0 0 0
10,124,082 8,715,548 -13.91 7,900,441 -9.35 6,808,790 -13.82 5,567,665 -18.23
3,482 28,677 723.58 85,348 197.62 79,534 -6.81 149,527 88.00
31,833,359 31,960,060 0.40 31,833,362 -0.40 31,851,373 0.06 29,685,232 -6.80
15,242,251 13,140,705 -13.79 13,125,202 -0.12 15,176,177 15.63 14,079,069 -7.23
419,443 1,059,541 152.61 1,015,320 -4.17 994,769 -2.02 841,126 -15.45
1,302,852 1,123,761 -13.75 817,649 -27.24 502,852 -38.50 553,819 10.14
2,286,271 1,965,839 -14.02 2,000,616 1.77 2,082,619 4.10 2,241,916 7.65
19,250,817 17,289,846 -10.19 16,958,787 -1.91 18,756,417 10.60 17,715,930 -5.55
12,582,542 14,670,214 14,874,575 13,094,956 11,969,302
917,692 1,092,885 19.09 865,833 -20.78 859,168 -0.77 814,786 -5.17
11,664,850 13,577,329 14,008,742 12,235,788 11,154,516
0 0 12 10,314 >999± 9,607 -6.85
18,411 0 -100.00 0 0 -45,285
11,683,261 13,577,329 14,008,730 12,225,474 11,099,624
0 0 0 0 0
0 0 0 0 0
15,105,251 13,088,258 -13.35 12,915,452 -1.32 14,969,217 15.90 13,926,592 -6.97
0 0 0 0 0
15,105,251 13,088,258 -13.35 12,915,452 -1.32 14,969,217 15.90 13,926,592 -6.97
47.45 40.95 40.57 47.00 46.91
7,970,025 7,005,326 -12.10 6,631,082 -5.34 7,652,238 15.40 5,604,217 -26.76
94 84 -10.64 77 -8.33 84 9.09 61 -27.38
84,788 83,397 -1.64 86,118 3.26 91,098 5.78 91,872 0.85
6,290,699 6,454,946 2.61 6,358,008 -1.50 6,205,366 -2.40 5,996,824 -3.36
39.5 45.9 46.7 41.1 40.3
36.6 42.5 44.0 38.4 37.6
36.7 42.5 44.0 38.4 37.4
Pay and Specialty
Licensee Licensee Ultimate Owner Type Year
Bell Media Inc. BCE Inc. Specialty (category A service) 2015
CRTC - FINANCIAL SUMMARY - PAY & SPECIALTY
Depreciation -2.9
P.B.I.T.
Interest Expense
Administration and General -0.5
Total Expenses -2.1
Operating Income
Programming and Production -2.0
Technical 19.0
Sales and Promotion -19.3
Other revenue 156.0
Total Revenue -1.7
Expenses
DTH revenue -0.9
Local advertising revenueNational advertising revenue -13.9
($) CAGR (%)
RevenueResidential/bulk/smatv subscriber revenue 3.9
P.B.I.T. MarginPre-tax MarginCAGR = Compound Annual Growth Rate
Subscribers -1.2
Profitability (%)Operating Margin
Total Remuneration ($) -8.4
Average Staff CountAverage Remuneration ($) 2.0
Investment in ProgrammingTotal Canadian Programming -2.0
Canadian Programming/Revenue (%)
Acquisition of rightsScript & conceptFiller Programming + Program Production -2.0
Adjustments - Gain (Loss)
Pre-tax Profit
Canadian Programming Expenses
Page 56

Undertaking # Service Name
305417348 CablePulse 24 (CP24)
2011 2012 Var % 2013 Var % 2014 Var % 2015 Var %
y1 y2 y3 y4 y5
1,903,278 1,876,748 -1.39 1,988,128 5.93 2,784,352 40.05 2,878,332 3.38
1,697,326 1,670,293 -1.59 1,684,932 0.88 1,753,915 4.09 1,743,791 -0.58
8,880,333 9,635,400 8.50 9,663,757 0.29 10,446,658 8.10 13,291,466 27.23
9,164,147 9,680,270 5.63 11,112,225 14.79 11,790,225 6.10 12,629,316 7.12
30,000 71,416 138.05 30,000 -57.99 883 -97.06 0 -100.00
21,675,084 22,934,127 5.81 24,479,042 6.74 26,776,033 9.38 30,542,905 14.07
12,639,457 14,031,505 11.01 15,484,205 10.35 17,239,733 11.34 18,058,590 4.75
753,543 614,408 -18.46 596,516 -2.91 627,368 5.17 616,205 -1.78
1,533,946 1,635,169 6.60 1,793,207 9.66 1,527,796 -14.80 1,785,283 16.85
2,324,982 1,667,375 -28.28 1,868,052 12.04 2,060,846 10.32 2,374,338 15.21
17,251,928 17,948,457 4.04 19,741,980 9.99 21,455,743 8.68 22,834,416 6.43
4,423,156 4,985,670 4,737,062 5,320,290 7,708,489
3,055,871 2,079,846 -31.94 1,189,420 -42.81 1,093,857 -8.03 1,073,761 -1.84
1,367,285 2,905,824 3,547,642 4,226,433 6,634,728
0 0 1,665 749 -55.02 0 -100.00
-634,916 -1,555,167 144.94 -1,673,013 7.58 -1,714,558 2.48 -381,260 -77.76
732,369 1,350,657 1,872,964 2,511,126 6,253,468
0 0 0 0 0
0 0 0 0 0
9,851,048 14,031,505 42.44 15,484,205 10.35 17,239,733 11.34 18,058,590 4.75
0 0 0 0 0
9,851,048 14,031,505 42.44 15,484,205 10.35 17,239,733 11.34 18,058,590 4.75
45.45 61.18 63.25 64.38 59.13
8,630,473 8,095,831 -6.19 7,831,853 -3.26 7,898,476 0.85 8,203,622 3.86
100 94 -6.00 87 -7.45 87 0.00 87 0.00
86,305 86,126 -0.21 90,021 4.52 90,787 0.85 94,295 3.86
2,988,042 3,033,805 1.53 3,556,237 17.22 3,582,650 0.74 3,536,462 -1.29
20.4 21.7 19.4 19.9 25.2
6.3 12.7 14.5 15.8 21.7
3.4 5.9 7.7 9.4 20.5
DTH revenue 0.7
Local advertising revenue 10.6
National advertising revenue 8.4
($) CAGR (%)
RevenueResidential/bulk/smatv subscriber revenue 10.9
Pay and Specialty
Licensee Licensee Ultimate Owner Type Year
Bell Media Inc. BCE Inc. Specialty (category A service) 2015
CRTC - FINANCIAL SUMMARY - PAY & SPECIALTY
Acquisition of rightsScript & conceptFiller Programming + Program Production 16.4
Adjustments - Gain (Loss)
Pre-tax Profit
Canadian Programming Expenses
Depreciation -23.0
P.B.I.T.
Interest Expense
Administration and General 0.5
Total Expenses 7.3
Operating Income
Programming and Production 9.3
Technical -4.9
Sales and Promotion 3.9
Other revenue -100.0
Total Revenue 9.0
Expenses
P.B.I.T. MarginPre-tax MarginCAGR = Compound Annual Growth Rate
Subscribers 4.3
Profitability (%)Operating Margin
Total Remuneration ($) -1.3
Average Staff CountAverage Remuneration ($) 2.2
Investment in ProgrammingTotal Canadian Programming 16.4
Canadian Programming/Revenue (%)
Page 57

Undertaking # Service Name
535424121 Câblevision du Nord de Québec inc., Val
d'Or
2011 2012 Var % 2013 Var % 2014 Var % 2015 Var %
y1 y2 y3 y4 y5
683,177 685,572 0.35 644,181 -6.04 531,287 -17.53 418,561 -21.22
0 0 0 0 0
0 0 0 0 0
0 0 0 0 0
0 0 0 -22,112 -6,327 -71.39
683,177 685,572 0.35 644,181 -6.04 509,175 -20.96 412,234 -19.04
365,618 363,252 -0.65 372,909 2.66 287,743 -22.84 224,428 -22.00
79,301 64,939 -18.11 62,215 -4.19 62,288 0.12 78,172 25.50
38,509 14,333 -62.78 21,000 46.52 14,695 -30.02 0 -100.00
66,972 47,244 -29.46 43,639 -7.63 35,991 -17.53 27,201 -24.42
550,400 489,768 -11.02 499,763 2.04 400,717 -19.82 329,801 -17.70
132,777 195,804 144,418 108,458 82,433
54,463 54,463 0.00 70,069 28.65 70,069 0.00 85,676 22.27
78,314 141,341 74,349 38,389 -3,243
0 0 0 0 0
0 0 0 0 0
78,314 141,341 74,349 38,389 -3,243
2,990 3,241 8.39 3,386 4.47 3,014 -10.99 2,169 -28.04
0 0 0 0 0
0 0 0 0 0
0 0 0 0 0
2,990 3,241 8.39 3,386 4.47 3,014 -10.99 2,169 -28.04
0.44 0.47 0.53 0.59 0.53
45,460 43,948 -3.33 35,135 -20.05 43,155 22.83 55,566 28.76
1 1.5 50.00 1 -33.33 1 0.00 1 0.00
45,460 29,299 -35.55 35,135 19.92 43,155 22.83 55,566 28.76
19.4 28.6 22.4 21.3 20.0
11.5 20.6 11.5 7.5 -0.8
11.5 20.6 11.5 7.5 -0.8
Pay and Specialty
Licensee Licensee Ultimate Owner Type Year
Câblevision du Nord de Québec inc. BCE Inc. Video-on-Demand 2015
CRTC - FINANCIAL SUMMARY - PAY & SPECIALTY
Depreciation 12.0
P.B.I.T.
Interest Expense
Administration and General -20.2
Total Expenses -12.0
Operating Income
Programming and Production -11.5
Technical -0.4
Sales and Promotion -100.0
Other revenueTotal Revenue -11.9
Expenses
DTH revenueLocal advertising revenueNational advertising revenue
($) CAGR (%)
RevenueResidential/bulk/smatv subscriber revenue -11.5
P.B.I.T. MarginPre-tax MarginCAGR = Compound Annual Growth Rate
Subscribers
Profitability (%)Operating Margin
Total Remuneration ($) 5.2
Average Staff CountAverage Remuneration ($) 5.2
Investment in ProgrammingTotal Canadian Programming -7.7
Canadian Programming/Revenue (%)
Acquisition of rights -7.7
Script & conceptFiller Programming + Program Production
Adjustments - Gain (Loss)
Pre-tax Profit
Canadian Programming Expenses
Page 58

Undertaking # Service Name
215413790 Canal D
2011 2012 Var % 2013 Var % 2014 Var % 2015 Var %
y1 y2 y3 y4 y5
17,330,497 17,139,340 -1.10 17,339,744 1.17 16,229,788 -6.40 17,005,067 4.78
5,367,211 6,466,482 20.48 6,421,956 -0.69 6,134,450 -4.48 5,856,029 -4.54
0 0 0 0 0
15,702,087 16,585,847 5.63 22,283,819 34.35 21,914,822 -1.66 18,804,989 -14.19
0 0 0 0 -26
38,399,795 40,191,669 4.67 46,045,519 14.56 44,279,060 -3.84 41,666,059 -5.90
14,651,021 15,088,673 2.99 13,136,143 -12.94 14,995,628 14.16 16,048,438 7.02
1,001,692 903,757 -9.78 945,948 4.67 326,505 -65.48 405,713 24.26
1,489,021 1,647,948 10.67 5,534,722 235.86 4,259,340 -23.04 3,871,625 -9.10
2,008,617 2,020,129 0.57 2,233,515 10.56 1,897,582 -15.04 1,550,796 -18.28
19,150,351 19,660,507 2.66 21,850,328 11.14 21,479,055 -1.70 21,876,572 1.85
19,249,444 20,531,162 24,195,191 22,800,005 19,789,487
90,681 93,869 3.52 221,238 135.69 608,636 175.10 1,178,387 93.61
19,158,763 20,437,293 23,973,953 22,191,369 18,611,100
0 0 0 61,672 104,135 68.85
254,798 234,797 -7.85 166,583 -29.05 5,878 -96.47 -335,470 >999±
19,413,561 20,672,090 24,140,536 22,135,575 18,171,495
10,556,970 10,939,796 3.63 9,817,556 -10.26 10,601,546 7.99 11,945,755 12.68
109,397 56,374 -48.47 63,802 13.18 76,293 19.58 268,141 251.46
1,997,569 1,890,666 -5.35 1,849,405 -2.18 2,290,510 23.85 2,081,061 -9.14
0 0 0 0 0
12,663,936 12,886,836 1.76 11,730,763 -8.97 12,968,349 10.55 14,294,957 10.23
32.98 32.06 25.48 29.29 34.31
3,277,278 3,097,950 -5.47 3,393,948 9.55 2,349,187 -30.78 2,822,976 20.17
31 32 3.23 33 3.13 25 -24.24 27 8.00
105,719 96,811 -8.43 102,847 6.23 93,967 -8.63 104,555 11.27
2,611,310 2,599,858 -0.44 2,549,210 -1.95 2,512,377 -1.44 2,488,473 -0.95
50.1 51.1 52.5 51.5 47.5
49.9 50.8 52.1 50.1 44.7
50.6 51.4 52.4 50.0 43.6
CRTC - FINANCIAL SUMMARY - PAY & SPECIALTY
Programming and Production 2.3
Technical -20.2
Sales and Promotion 27.0
Other revenueTotal Revenue 2.1
Expenses
DTH revenue 2.2
Local advertising revenueNational advertising revenue 4.6
($) CAGR (%)
RevenueResidential/bulk/smatv subscriber revenue -0.5
Pay and Specialty
Licensee Licensee Ultimate Owner Type Year
Bell Media Inc. BCE Inc. Specialty (category A service) 2015
Total Remuneration ($) -3.7
Average Staff CountAverage Remuneration ($) -0.3
Investment in ProgrammingTotal Canadian Programming 3.1
Canadian Programming/Revenue (%)
Acquisition of rights 3.1
Script & concept 25.1
Filler Programming + Program Production 1.0
Adjustments - Gain (Loss)
Pre-tax Profit
Canadian Programming Expenses
Depreciation 89.9
P.B.I.T.
Interest Expense
Administration and General -6.3
Total Expenses 3.4
Operating Income
P.B.I.T. MarginPre-tax MarginCAGR = Compound Annual Growth Rate
Subscribers -1.2
Profitability (%)Operating Margin
Page 59

Undertaking # Service Name
535433411 Canal D/Investigation
2011 2012 Var % 2013 Var % 2014 Var % 2015 Var %
y4 y5
110,673 2,156,023 >999±
130,037 1,064,666 718.74
0 0
364,270 1,199,389 229.26
0 0
604,980 4,420,078 630.62
5,076,490 3,855,105 -24.06
108,461 76,447 -29.52
637,189 784,612 23.14
253,113 220,506 -12.88
6,075,253 4,936,670 -18.74
-5,470,273 -516,592
6,122 124,838 >999±
-5,476,395 -641,430
0 11,723
0 0
-5,476,395 -653,153
659,889 1,673,840 153.65
0 14,300
459,369 678,405 47.68
0 0
1,119,258 2,366,545 111.44
185.01 53.54
383,610 592,162 54.37
5 6 20.00
76,722 98,694 28.64
259,760 533,682 105.45
-904.2 -11.7
-905.2 -14.5
-905.2 -14.8
DTH revenueLocal advertising revenueNational advertising revenue
($) CAGR (%)
RevenueResidential/bulk/smatv subscriber revenue
Pay and Specialty
Licensee Licensee Ultimate Owner Type Year
Bell Media Inc. BCE Inc. Specialty (category B service) 2015
CRTC - FINANCIAL SUMMARY - PAY & SPECIALTY
Acquisition of rightsScript & conceptFiller Programming + Program Production
Adjustments - Gain (Loss)
Pre-tax Profit
Canadian Programming Expenses
Depreciation
P.B.I.T.
Interest Expense
Administration and GeneralTotal Expenses
Operating Income
Programming and ProductionTechnicalSales and Promotion
Other revenueTotal Revenue
Expenses
P.B.I.T. MarginPre-tax MarginCAGR = Compound Annual Growth Rate
Subscribers
Profitability (%)Operating Margin
Total Remuneration ($)Average Staff CountAverage Remuneration ($)
Investment in ProgrammingTotal Canadian Programming
Canadian Programming/Revenue (%)
Page 60

Undertaking # Service Name
205416466 Canal Indigo
2011 2012 Var % 2013 Var % 2014 Var % 2015 Var %
y1 y2 y3 y4 y5
6,125,195 6,959,904 13.63 8,191,678 17.70 10,170,597 24.16 7,394,597 -27.29
0 0 0 0 0
0 0 0 0 0
0 0 0 0 0
0 0 0 0 0
6,125,195 6,959,904 13.63 8,191,678 17.70 10,170,597 24.16 7,394,597 -27.29
2,674,078 2,823,669 5.59 3,785,901 34.08 4,890,258 29.17 3,572,913 -26.94
328,690 814,747 147.88 725,781 -10.92 623,562 -14.08 312,501 -49.88
125,931 307,144 143.90 300,394 -2.20 177,747 -40.83 182,548 2.70
532,595 656,294 23.23 465,617 -29.05 467,322 0.37 581,514 24.44
3,661,294 4,601,854 25.69 5,277,693 14.69 6,158,889 16.70 4,649,476 -24.51
2,463,901 2,358,050 2,913,985 4,011,708 2,745,121
0 0 0 0 0
2,463,901 2,358,050 2,913,985 4,011,708 2,745,121
0 0 0 0 0
0 0 0 0 0
2,463,901 2,358,050 2,913,985 4,011,708 2,745,121
1,959,093 2,103,443 7.37 2,409,118 14.53 2,887,347 19.85 1,615,995 -44.03
0 0 0 0 0
0 0 0 0 0
0 0 0 0 0
1,959,093 2,103,443 7.37 2,409,118 14.53 2,887,347 19.85 1,615,995 -44.03
31.98 30.22 29.41 28.39 21.85
125,931 307,144 143.90 300,394 -2.20 177,747 -40.83 182,548 2.70
2 3 50.00 2 -33.33 2 0.00 2 0.00
62,966 102,381 62.60 150,197 46.70 88,874 -40.83 91,274 2.70
1,393,188 1,495,947 7.38 1,561,412 4.38 1,610,373 3.14 1,555,903 -3.38
40.2 33.9 35.6 39.4 37.1
40.2 33.9 35.6 39.4 37.1
40.2 33.9 35.6 39.4 37.1
Pay and Specialty
Licensee Licensee Ultimate Owner Type Year
Vidéotron s.e.n.c. Les Placements Péladeau inc. Pay-per-view programming 2015
CRTC - FINANCIAL SUMMARY - PAY & SPECIALTY
Depreciation
P.B.I.T.
Interest Expense
Administration and General 2.2
Total Expenses 6.2
Operating Income
Programming and Production 7.5
Technical -1.3
Sales and Promotion 9.7
Other revenueTotal Revenue 4.8
Expenses
DTH revenueLocal advertising revenueNational advertising revenue
($) CAGR (%)
RevenueResidential/bulk/smatv subscriber revenue 4.8
P.B.I.T. MarginPre-tax MarginCAGR = Compound Annual Growth Rate
Subscribers 2.8
Profitability (%)Operating Margin
Total Remuneration ($) 9.7
Average Staff CountAverage Remuneration ($) 9.7
Investment in ProgrammingTotal Canadian Programming -4.7
Canadian Programming/Revenue (%)
Acquisition of rights -4.7
Script & conceptFiller Programming + Program Production
Adjustments - Gain (Loss)
Pre-tax Profit
Canadian Programming Expenses
Page 61

Undertaking # Service Name
205417381 Canal Vie
2011 2012 Var % 2013 Var % 2014 Var % 2015 Var %
y1 y2 y3 y4 y5
17,463,298 18,130,730 3.82 18,704,342 3.16 17,634,326 -5.72 17,227,323 -2.31
5,876,338 6,138,237 4.46 6,672,820 8.71 6,569,240 -1.55 6,139,827 -6.54
0 0 0 0 0
18,565,136 18,501,568 -0.34 23,609,218 27.61 23,337,289 -1.15 22,297,016 -4.46
0 0 0 0 0
41,904,772 42,770,535 2.07 48,986,380 14.53 47,540,855 -2.95 45,664,166 -3.95
22,487,113 21,019,613 -6.53 21,134,486 0.55 20,582,449 -2.61 21,703,618 5.45
1,313,227 1,125,530 -14.29 964,346 -14.32 281,446 -70.81 380,879 35.33
2,307,873 2,785,146 20.68 6,619,703 137.68 4,907,996 -25.86 4,112,802 -16.20
2,041,923 2,065,564 1.16 2,255,393 9.19 1,895,502 -15.96 1,657,785 -12.54
28,150,136 26,995,853 -4.10 30,973,928 14.74 27,667,393 -10.68 27,855,084 0.68
13,754,636 15,774,682 18,012,452 19,873,462 17,809,082
90,728 93,909 3.51 221,306 135.66 648,701 193.12 1,299,176 100.27
13,663,908 15,680,773 17,791,146 19,224,761 16,509,906
0 0 0 61,668 104,134 68.86
254,874 234,868 -7.85 166,633 -29.05 5,881 -96.47 -94,023 >999±
13,918,782 15,915,641 17,957,779 19,168,974 16,311,749
18,078,191 16,826,163 -6.93 17,265,449 2.61 16,283,999 -5.68 18,078,101 11.02
218,158 152,075 -30.29 174,446 14.71 93,593 -46.35 176,394 88.47
2,958,591 2,531,212 -14.45 2,125,014 -16.05 2,486,284 17.00 2,085,163 -16.13
0 0 0 0 0
21,254,940 19,509,450 -8.21 19,564,909 0.28 18,863,876 -3.58 20,339,658 7.82
50.72 45.61 39.94 39.68 44.54
3,888,608 3,631,504 -6.61 3,893,012 7.20 2,504,806 -35.66 2,831,736 13.05
35 34 -2.86 35 2.94 25 -28.57 28 12.00
111,103 106,809 -3.87 111,229 4.14 100,192 -9.92 101,133 0.94
2,342,640 2,353,879 0.48 2,347,188 -0.28 2,331,986 -0.65 2,231,617 -4.30
32.8 36.9 36.8 41.8 39.0
32.6 36.7 36.3 40.4 36.2
33.2 37.2 36.7 40.3 35.7
CRTC - FINANCIAL SUMMARY - PAY & SPECIALTY
Programming and Production -0.9
Technical -26.6
Sales and Promotion 15.5
Other revenueTotal Revenue 2.2
Expenses
DTH revenue 1.1
Local advertising revenueNational advertising revenue 4.7
($) CAGR (%)
RevenueResidential/bulk/smatv subscriber revenue -0.3
Pay and Specialty
Licensee Licensee Ultimate Owner Type Year
Bell Media Inc. BCE Inc. Specialty (category A service) 2015
Total Remuneration ($) -7.6
Average Staff CountAverage Remuneration ($) -2.3
Investment in ProgrammingTotal Canadian Programming -1.1
Canadian Programming/Revenue (%)
Acquisition of rights 0.0
Script & concept -5.2
Filler Programming + Program Production -8.4
Adjustments - Gain (Loss)
Pre-tax Profit
Canadian Programming Expenses
Depreciation 94.5
P.B.I.T.
Interest Expense
Administration and General -5.1
Total Expenses -0.3
Operating Income
P.B.I.T. MarginPre-tax MarginCAGR = Compound Annual Growth Rate
Subscribers -1.2
Profitability (%)Operating Margin
Page 62

Undertaking # Service Name
535433982 Cartoon Network (formerly TELETOON
Kapow!)
2011 2012 Var % 2013 Var % 2014 Var % 2015 Var %
y2 y3 y4 y5
117,015 3,096,161 >999± 3,992,304 28.94 3,437,973 -13.88
23,959 2,956,538 >999± 3,849,751 30.21 4,983,617 29.45
0 37,637 25,876 -31.25 53,199 105.59
0 0 15,373 31,358 103.98
0 141,752 93,689 -33.91 156,896 67.46
0 0 0 31,200
0 179,389 134,938 -24.78 272,653 102.06
0.00 5.79 3.38 7.93
DTH revenueLocal advertising revenueNational advertising revenue
($) CAGR (%)
RevenueResidential/bulk/smatv subscriber revenue
Pay and Specialty
Licensee Licensee Ultimate Owner Type Year
TELETOON Canada Inc. Corus Entertainment Inc. Specialty (category B service) 2015
CRTC - FINANCIAL SUMMARY - PAY & SPECIALTY
Acquisition of rightsScript & conceptFiller Programming + Program Production
Adjustments - Gain (Loss)
Pre-tax Profit
Canadian Programming Expenses
Depreciation
P.B.I.T.
Interest Expense
Administration and GeneralTotal Expenses
Operating Income
Programming and ProductionTechnicalSales and Promotion
Other revenueTotal Revenue
Expenses
P.B.I.T. MarginPre-tax MarginCAGR = Compound Annual Growth Rate
Subscribers
Profitability (%)Operating Margin
Total Remuneration ($)Average Staff CountAverage Remuneration ($)
Investment in ProgrammingTotal Canadian Programming
Canadian Programming/Revenue (%)
Page 63

Undertaking # Service Name
535421135 Cartoon Network (formerly TELETOON
Retro (English))
2011 2012 Var % 2013 Var % 2014 Var % 2015 Var %
y1 y2 y3 y4 y5
6,453,674 7,489,719 16.05 7,397,661 -1.23 7,073,348 -4.38 6,662,286 -5.81
1,586,370 1,799,580 13.44 1,714,385 -4.73 1,604,582 -6.40 1,489,895 -7.15
203,023 228,669 12.63 264,005 15.45 106,466 -59.67 71,361 -32.97
0 0 0 22,823 24,768 8.52
-592 12,590 >999± 16,795 33.40 163,658 874.44 216,336 32.19
0 0 0 0 0
202,431 241,259 19.18 280,800 16.39 292,947 4.33 312,465 6.66
3.14 3.22 3.80 4.14 4.69
Pay and Specialty
Licensee Licensee Ultimate Owner Type Year
TELETOON Canada Inc. Corus Entertainment Inc. Specialty (category B service) 2015
CRTC - FINANCIAL SUMMARY - PAY & SPECIALTY
Depreciation
P.B.I.T.
Interest Expense
Administration and GeneralTotal Expenses
Operating Income
Programming and Production -1.6
TechnicalSales and Promotion
Other revenueTotal Revenue 0.8
Expenses
DTH revenueLocal advertising revenueNational advertising revenue
($) CAGR (%)
RevenueResidential/bulk/smatv subscriber revenue
P.B.I.T. MarginPre-tax MarginCAGR = Compound Annual Growth Rate
Subscribers
Profitability (%)Operating Margin
Total Remuneration ($)Average Staff CountAverage Remuneration ($)
Investment in ProgrammingTotal Canadian Programming 11.5
Canadian Programming/Revenue (%)
Acquisition of rights -23.0
Script & conceptFiller Programming + Program Production
Adjustments - Gain (Loss)
Pre-tax Profit
Canadian Programming Expenses
Page 64

Undertaking # Service Name
535421276 Casa - (formerly Les idées de ma
maison)
2011 2012 Var % 2013 Var % 2014 Var % 2015 Var %
y1 y2 y3 y4 y5
1,905,717 2,745,218 44.05 3,379,356 23.10 3,631,970 7.48 4,696,858 29.32
1,528,037 1,628,960 6.60 1,760,153 8.05 2,008,437 14.11 1,637,487 -18.47
0 0 0 0 0
1,467,686 2,441,385 66.34 2,740,094 12.24 3,455,632 26.11 3,195,000 -7.54
132,308 238,917 80.58 214,486 -10.23 262,561 22.41 199,865 -23.88
5,033,748 7,054,480 40.14 8,094,089 14.74 9,358,600 15.62 9,729,210 3.96
4,294,915 5,698,621 32.68 6,263,263 9.91 6,714,111 7.20 7,313,141 8.92
421,779 667,878 58.35 577,907 -13.47 286,387 -50.44 170,547 -40.45
794,416 739,343 -6.93 1,101,675 49.01 703,965 -36.10 732,906 4.11
274,908 143,565 -47.78 238,199 65.92 371,881 56.12 427,487 14.95
5,786,018 7,249,407 25.29 8,181,044 12.85 8,076,344 -1.28 8,644,081 7.03
-752,270 -194,927 -86,955 1,282,256 1,085,129
100,000 100,000 0.00 100,000 0.00 100,000 0.00 100,000 0.00
-852,270 -294,927 -186,955 1,182,256 985,129
200,000 156,417 -21.79 160,623 2.69 127,555 -20.59 87,888 -31.10
0 0 0 0 0
-1,052,270 -451,344 -347,578 1,054,701 897,241
3,660,265 4,939,380 34.95 5,390,726 9.14 5,800,387 7.60 6,258,905 7.90
0 0 0 0 0
0 0 0 0 0
0 0 0 0 0
3,660,265 4,939,380 34.95 5,390,726 9.14 5,800,387 7.60 6,258,905 7.90
72.71 70.02 66.60 61.98 64.33
253,590 320,982 26.58 172,935 -46.12 103,533 -40.13 235,349 127.32
3 3 0.00 2 -33.33 2 0.00 2 0.00
84,530 106,994 26.58 86,468 -19.18 51,767 -40.13 117,675 127.32
700,067 811,338 15.89 924,632 13.96 1,068,662 15.58 1,163,328 8.86
-14.9 -2.8 -1.1 13.7 11.2
-16.9 -4.2 -2.3 12.6 10.1
-20.9 -6.4 -4.3 11.3 9.2
CRTC - FINANCIAL SUMMARY - PAY & SPECIALTY
Programming and Production 14.2
Technical -20.3
Sales and Promotion -2.0
Other revenue 10.9
Total Revenue 17.9
Expenses
DTH revenue 1.7
Local advertising revenueNational advertising revenue 21.5
($) CAGR (%)
RevenueResidential/bulk/smatv subscriber revenue 25.3
Pay and Specialty
Licensee Licensee Ultimate Owner Type Year
Groupe TVA inc. Les Placements Péladeau inc. Specialty (category B service) 2015
Total Remuneration ($) -1.9
Average Staff CountAverage Remuneration ($) 8.6
Investment in ProgrammingTotal Canadian Programming 14.4
Canadian Programming/Revenue (%)
Acquisition of rights 14.4
Script & conceptFiller Programming + Program Production
Adjustments - Gain (Loss)
Pre-tax Profit
Canadian Programming Expenses
Depreciation 0.0
P.B.I.T.
Interest Expense
Administration and General 11.7
Total Expenses 10.6
Operating Income
P.B.I.T. MarginPre-tax MarginCAGR = Compound Annual Growth Rate
Subscribers 13.5
Profitability (%)Operating Margin
Page 65

Undertaking # Service Name
334805116 CBC News Network (Formerly
Newsworld)
2011 2012 Var % 2013 Var % 2014 Var % 2015 Var %
y1 y2 y3 y4 y5
50,470,964 50,983,039 1.01 50,606,511 -0.74 49,995,158 -1.21 52,021,094 4.05
17,141,019 17,644,637 2.94 17,730,568 0.49 18,783,518 5.94 15,032,863 -19.97
0 0 0 0 0
14,547,453 17,472,969 20.11 18,462,152 5.66 19,538,932 5.83 19,176,930 -1.85
55,298 57,017 3.11 0 -100.00 1,634,816 1,720,790 5.26
82,214,734 86,157,662 4.80 86,799,231 0.74 89,952,424 3.63 87,951,677 -2.22
65,399,654 62,083,219 -5.07 57,861,322 -6.80 59,879,627 3.49 61,579,011 2.84
2,524,631 2,349,917 -6.92 2,390,084 1.71 2,419,186 1.22 2,637,258 9.01
3,146,216 2,598,682 -17.40 2,493,464 -4.05 3,621,347 45.23 5,572,059 53.87
1,176,914 1,543,817 31.18 1,708,143 10.64 7,497,050 338.90 7,371,945 -1.67
72,247,415 68,575,635 -5.08 64,453,013 -6.01 73,417,210 13.91 77,160,273 5.10
9,967,319 17,582,027 22,346,218 16,535,214 10,791,404
2,823,222 2,521,273 -10.70 1,975,599 -21.64 2,805,992 42.03 2,952,343 5.22
7,144,097 15,060,754 20,370,619 13,729,222 7,839,061
0 0 0 495,026 410,424 -17.09
0 0 0 -2,946,358 -2,948,701 0.08
7,144,097 15,060,754 20,370,619 10,287,838 4,479,936
1,797,193 17,900 -99.00 14,683 -17.97 0 -100.00 328,064
0 0 0 0 0
61,951,706 61,333,069 -1.00 57,333,435 -6.52 55,941,863 -2.43 57,513,799 2.81
15,350 4,601 -70.03 0 -100.00 0 0
63,764,249 61,355,570 -3.78 57,348,118 -6.53 55,941,863 -2.45 57,841,863 3.40
77.56 71.21 66.07 62.19 65.77
33,312,217 32,701,718 -1.83 33,142,515 1.35 48,033,626 44.93 47,357,692 -1.41
342 338 -1.17 329.1 -2.63 468 42.21 456.65 -2.43
97,404 96,751 -0.67 100,707 4.09 102,636 1.92 103,707 1.04
11,165,366 11,362,597 1.77 11,336,559 -0.23 11,376,354 0.35 11,173,366 -1.78
12.1 20.4 25.7 18.4 12.3
8.7 17.5 23.5 15.3 8.9
8.7 17.5 23.5 11.4 5.1
DTH revenue -3.2
Local advertising revenueNational advertising revenue 7.2
($) CAGR (%)
RevenueResidential/bulk/smatv subscriber revenue 0.8
Pay and Specialty
Licensee Licensee Ultimate Owner Type Year
Canadian Broadcasting Corporation Canadian Broadcasting Corporation Specialty (category C service) 2015
CRTC - FINANCIAL SUMMARY - PAY & SPECIALTY
Acquisition of rights -34.6
Script & conceptFiller Programming + Program Production -1.8
Adjustments - Gain (Loss)
Pre-tax Profit
Canadian Programming Expenses
Depreciation 1.1
P.B.I.T.
Interest Expense
Administration and General 58.2
Total Expenses 1.7
Operating Income
Programming and Production -1.5
Technical 1.1
Sales and Promotion 15.4
Other revenue 136.2
Total Revenue 1.7
Expenses
P.B.I.T. MarginPre-tax MarginCAGR = Compound Annual Growth Rate
Subscribers 0.0
Profitability (%)Operating Margin
Total Remuneration ($) 9.2
Average Staff CountAverage Remuneration ($) 1.6
Investment in Programming -100.0
Total Canadian Programming -2.4
Canadian Programming/Revenue (%)
Page 66

Undertaking # Service Name
535423199 Channel Punjabi (formerly PTC Punjabi)
2011 2012 Var % 2013 Var % 2014 Var % 2015 Var %
y1
149,527 -100.00
35,588 -100.00
0
0
12,000 -100.00
0
12,000 -100.00
8.03
Pay and Specialty
Licensee Licensee Ultimate Owner Type Year
Channel Punjabi Television Inc. Gill, Surjit S Specialty (category 2 service) 2011
CRTC - FINANCIAL SUMMARY - PAY & SPECIALTY
Depreciation
P.B.I.T.
Interest Expense
Administration and GeneralTotal Expenses
Operating Income
Programming and ProductionTechnicalSales and Promotion
Other revenueTotal Revenue
Expenses
DTH revenueLocal advertising revenueNational advertising revenue
($) CAGR (%)
RevenueResidential/bulk/smatv subscriber revenue
P.B.I.T. MarginPre-tax MarginCAGR = Compound Annual Growth Rate
Subscribers
Profitability (%)Operating Margin
Total Remuneration ($)Average Staff CountAverage Remuneration ($)
Investment in ProgrammingTotal Canadian Programming
Canadian Programming/Revenue (%)
Acquisition of rightsScript & conceptFiller Programming + Program Production
Adjustments - Gain (Loss)
Pre-tax Profit
Canadian Programming Expenses
Page 67

Undertaking # Service Name
205426720 CINÉPOP (formerly Cinémania)
2011 2012 Var % 2013 Var % 2014 Var % 2015 Var %
y1 y2 y3 y4 y5
4,088,550 5,175,500 26.59 5,981,216 15.57 6,739,001 12.67 7,173,882 6.45
2,862,805 3,174,530 10.89 3,377,923 6.41 3,563,104 5.48 4,165,671 16.91
0 0 0 0 0
0 0 0 0 0
0 9,559 0 -100.00 0 0
6,951,355 8,359,589 20.26 9,359,139 11.96 10,302,105 10.08 11,339,553 10.07
3,122,974 3,441,825 10.21 3,808,518 10.65 3,649,716 -4.17 3,793,036 3.93
702,118 745,422 6.17 772,142 3.58 549,029 -28.90 589,381 7.35
495,446 592,435 19.58 444,705 -24.94 113,240 -74.54 137,631 21.54
155,584 215,047 38.22 159,773 -25.70 312,991 95.90 235,727 -24.69
4,476,122 4,994,729 11.59 5,185,138 3.81 4,624,976 -10.80 4,755,775 2.83
2,475,233 3,364,860 4,174,001 5,677,129 6,583,778
19,906 7,600 -61.82 0 -100.00 106,519 320,209 200.61
2,455,327 3,357,260 4,174,001 5,570,610 6,263,569
0 0 0 0 35,170
0 0 0 0 -15,783
2,455,327 3,357,260 4,174,001 5,570,610 6,212,616
422,422 502,930 19.06 571,089 13.55 838,641 46.85 814,136 -2.92
0 0 0 0 0
1,145,130 1,302,492 13.74 1,342,813 3.10 926,096 -31.03 1,021,334 10.28
0 0 0 0 0
1,567,552 1,805,422 15.17 1,913,902 6.01 1,764,737 -7.79 1,835,470 4.01
22.55 21.60 20.45 17.13 16.19
387,130 360,896 -6.78 356,963 -1.09 255,354 -28.46 305,784 19.75
5 5 0.00 5 0.00 4 -20.00 5 25.00
77,426 72,179 -6.78 71,393 -1.09 63,839 -10.58 61,157 -4.20
881,155 995,206 12.94 1,092,007 9.73 1,180,445 8.10 1,241,441 5.17
35.6 40.3 44.6 55.1 58.1
35.3 40.2 44.6 54.1 55.2
35.3 40.2 44.6 54.1 54.8
CRTC - FINANCIAL SUMMARY - PAY & SPECIALTY
Programming and Production 5.0
Technical -4.3
Sales and Promotion -27.4
Other revenueTotal Revenue 13.0
Expenses
DTH revenue 9.8
Local advertising revenueNational advertising revenue
($) CAGR (%)
RevenueResidential/bulk/smatv subscriber revenue 15.1
Pay and Specialty
Licensee Licensee Ultimate Owner Type Year
Bell Media Inc. BCE Inc. Pay-TV (category B service) 2015
Total Remuneration ($) -5.7
Average Staff CountAverage Remuneration ($) -5.7
Investment in ProgrammingTotal Canadian Programming 4.0
Canadian Programming/Revenue (%)
Acquisition of rights 17.8
Script & conceptFiller Programming + Program Production -2.8
Adjustments - Gain (Loss)
Pre-tax Profit
Canadian Programming Expenses
Depreciation 100.3
P.B.I.T.
Interest Expense
Administration and General 11.0
Total Expenses 1.5
Operating Income
P.B.I.T. MarginPre-tax MarginCAGR = Compound Annual Growth Rate
Subscribers 9.0
Profitability (%)Operating Margin
Page 68

Undertaking # Service Name
535427852 CityNews Channel (formerly City news
(Toronto))
2011 2012 Var % 2013 Var % 2014 Var % 2015 Var %
y2 y3 y4
304,716 645,518 111.84 0 -100.00
0 0 0
0 0 0
1,093,485 387,055 -64.60 0 -100.00
368 0 -100.00 0
1,398,569 1,032,573 -26.17 0 -100.00
4,200,456 3,357,375 -20.07 0 -100.00
426,718 301,044 -29.45 0 -100.00
353,502 238,465 -32.54 0 -100.00
344,887 647,672 87.79 0 -100.00
5,325,563 4,544,556 -14.67 0 -100.00
-3,926,994 -3,511,983 0
0 0 0
-3,926,994 -3,511,983 0
0 0 0
0 0 0
-3,926,994 -3,511,983 0
0 0 0
0 0 0
4,200,456 3,357,375 -20.07 0 -100.00
0 0 0
4,200,456 3,357,375 -20.07 0 -100.00
300.34 325.15
4,307,848 3,302,662 -23.33 0 -100.00
55 55 0.00 0 -100.00
78,325 60,048 -23.33
1,525,017 1,988,000 30.36 0 -100.00
-280.8 -340.1
-280.8 -340.1
-280.8 -340.1
DTH revenueLocal advertising revenueNational advertising revenue
($) CAGR (%)
RevenueResidential/bulk/smatv subscriber revenue
Pay and Specialty
Licensee Licensee Ultimate Owner Type Year
Rogers Broadcasting Limited Rogers Communications Inc. Specialty (category B service) 2014
CRTC - FINANCIAL SUMMARY - PAY & SPECIALTY
Acquisition of rightsScript & conceptFiller Programming + Program Production
Adjustments - Gain (Loss)
Pre-tax Profit
Canadian Programming Expenses
Depreciation
P.B.I.T.
Interest Expense
Administration and GeneralTotal Expenses
Operating Income
Programming and ProductionTechnicalSales and Promotion
Other revenueTotal Revenue
Expenses
P.B.I.T. MarginPre-tax MarginCAGR = Compound Annual Growth Rate
Subscribers
Profitability (%)Operating Margin
Total Remuneration ($)Average Staff CountAverage Remuneration ($)
Investment in ProgrammingTotal Canadian Programming
Canadian Programming/Revenue (%)
Page 69

Undertaking # Service Name
435413778 CMT (formerly Country Music Television)
2011 2012 Var % 2013 Var % 2014 Var % 2015 Var %
y1 y2 y3 y4 y5
3,800,521 3,471,732 -8.65 3,282,503 -5.45 2,959,197 -9.85 2,821,423 -4.66
1,232,551 1,263,100 2.48 1,249,811 -1.05 1,275,875 2.09 1,196,691 -6.21
0 0 0 0 0
25,644,028 24,539,232 -4.31 20,190,088 -17.72 15,388,515 -23.78 15,816,972 2.78
6,790 0 -100.00 0 0 60,671
30,683,890 29,274,064 -4.59 24,722,402 -15.55 19,623,587 -20.62 19,895,757 1.39
10,323,355 11,988,205 16.13 12,371,403 3.20 12,090,952 -2.27 13,231,576 9.43
735,160 661,814 -9.98 593,260 -10.36 518,852 -12.54 539,802 4.04
3,680,334 3,333,580 -9.42 2,823,545 -15.30 944,161 -66.56 227,864 -75.87
4,660,925 4,530,905 -2.79 3,750,292 -17.23 2,628,576 -29.91 1,720,038 -34.56
19,399,774 20,514,504 5.75 19,538,500 -4.76 16,182,541 -17.18 15,719,280 -2.86
11,284,116 8,759,560 5,183,902 3,441,046 4,176,477
3,281 1,026,209 >999± 1,128,969 10.01 786,933 -30.30 718,444 -8.70
11,280,835 7,733,351 4,054,933 2,654,113 3,458,033
177,964 299,375 68.22 387,582 29.46 478,459 23.45 185,185 -61.30
308,202 689,060 123.57 -142,037 -120.61 7,941 -105.59 -158,787 >999±
11,411,073 8,123,036 3,525,314 2,183,595 3,114,061
6,923,365 7,961,724 15.00 8,519,366 7.00 7,859,376 -7.75 8,347,558 6.21
208,502 247,093 18.51 279,642 13.17 349,086 24.83 402,544 15.31
533,824 872,363 63.42 766,980 -12.08 638,023 -16.81 710,875 11.42
0 47,500 60,000 26.32 140,443 134.07 336,405 139.53
7,665,691 9,128,680 19.08 9,625,988 5.45 8,986,928 -6.64 9,797,382 9.02
24.98 31.18 38.94 45.80 49.24
3,792,996 3,624,419 -4.44 2,429,796 -32.96 741,969 -69.46 572,565 -22.83
69 70 1.45 56 -20.00 26 -53.57 30 15.38
54,971 51,777 -5.81 43,389 -16.20 28,537 -34.23 19,086 -33.12
10,627,113 10,654,934 0.26 10,577,182 -0.73 10,220,615 -3.37 9,948,757 -2.66
36.8 29.9 21.0 17.5 21.0
36.8 26.4 16.4 13.5 17.4
37.2 27.7 14.3 11.1 15.7
Pay and Specialty
Licensee Licensee Ultimate Owner Type Year
Country Music Television Ltd. Corus Entertainment Inc. Specialty (category A service) 2015
CRTC - FINANCIAL SUMMARY - PAY & SPECIALTY
Depreciation 284.7
P.B.I.T.
Interest Expense
Administration and General -22.1
Total Expenses -5.1
Operating Income
Programming and Production 6.4
Technical -7.4
Sales and Promotion -50.1
Other revenue 72.9
Total Revenue -10.3
Expenses
DTH revenue -0.7
Local advertising revenueNational advertising revenue -11.4
($) CAGR (%)
RevenueResidential/bulk/smatv subscriber revenue -7.2
P.B.I.T. MarginPre-tax MarginCAGR = Compound Annual Growth Rate
Subscribers -1.6
Profitability (%)Operating Margin
Total Remuneration ($) -37.7
Average Staff CountAverage Remuneration ($) -23.2
Investment in ProgrammingTotal Canadian Programming 6.3
Canadian Programming/Revenue (%)
Acquisition of rights 4.8
Script & concept 17.9
Filler Programming + Program Production 7.4
Adjustments - Gain (Loss)
Pre-tax Profit
Canadian Programming Expenses
Page 70

Undertaking # Service Name
205424112 Cogeco Cable Holdings Inc., Montréal
2011 2012 Var % 2013 Var % 2014 Var % 2015 Var %
y1 y2 y3 y4 y5
19,331,273 21,423,428 10.82 19,697,470 -8.06 17,646,806 -10.41 15,073,623 -14.58
0 0 0 0 0
0 0 0 0 0
0 0 0 0 0
0 0 0 0 0
19,331,273 21,423,428 10.82 19,697,470 -8.06 17,646,806 -10.41 15,073,623 -14.58
0 0 0 0 0
0 0 0 0 0
0 0 0 0 0
11,462,022 12,955,277 13.03 11,824,302 -8.73 12,923,432 9.30 12,294,261 -4.87
11,462,022 12,955,277 13.03 11,824,302 -8.73 12,923,432 9.30 12,294,261 -4.87
7,869,251 8,468,151 7,873,168 4,723,374 2,779,362
0 0 0 0 0
7,869,251 8,468,151 7,873,168 4,723,374 2,779,362
0 0 0 0 0
0 0 0 0 0
7,869,251 8,468,151 7,873,168 4,723,374 2,779,362
0 0 0 0 0
0 0 0 0 0
0 0 0 0 0
0 0 0 0 0
0 0 0 0 0
0.00 0.00 0.00 0.00 0.00
0 0 0 0 0
0 0 0 0 0
40.7 39.5 40.0 26.8 18.4
40.7 39.5 40.0 26.8 18.4
40.7 39.5 40.0 26.8 18.4
CRTC - FINANCIAL SUMMARY - PAY & SPECIALTY
Programming and ProductionTechnicalSales and Promotion
Other revenueTotal Revenue -6.0
Expenses
DTH revenueLocal advertising revenueNational advertising revenue
($) CAGR (%)
RevenueResidential/bulk/smatv subscriber revenue -6.0
Pay and Specialty
Licensee Licensee Ultimate Owner Type Year
Cogeco Cable Holdings Inc. Gestion Audem inc. Video-on-Demand 2015
Total Remuneration ($)Average Staff CountAverage Remuneration ($)
Investment in ProgrammingTotal Canadian Programming
Canadian Programming/Revenue (%)
Acquisition of rightsScript & conceptFiller Programming + Program Production
Adjustments - Gain (Loss)
Pre-tax Profit
Canadian Programming Expenses
Depreciation
P.B.I.T.
Interest Expense
Administration and General 1.8
Total Expenses 1.8
Operating Income
P.B.I.T. MarginPre-tax MarginCAGR = Compound Annual Growth Rate
Subscribers
Profitability (%)Operating Margin
Page 71

Undertaking # Service Name
405426314 Comedy Gold (formerly TV Land)
2011 2012 Var % 2013 Var % 2014 Var % 2015 Var %
y1 y2 y3 y4 y5
1,766,790 1,800,805 1.93 1,937,613 7.60 2,038,598 5.21 1,791,980 -12.10
621,431 1,315,276 111.65 1,732,986 31.76 1,481,781 -14.50 1,303,616 -12.02
0 0 0 0 0
863,501 1,098,409 27.20 1,459,282 32.85 1,208,802 -17.16 1,381,276 14.27
0 0 0 0 0
3,251,722 4,214,490 29.61 5,129,881 21.72 4,729,181 -7.81 4,476,872 -5.34
635,510 1,199,664 88.77 1,085,366 -9.53 1,175,110 8.27 888,184 -24.42
233,109 244,893 5.06 256,193 4.61 245,553 -4.15 223,832 -8.85
82,526 106,188 28.67 114,990 8.29 58,516 -49.11 101,305 73.12
201,979 197,426 -2.25 224,463 13.69 217,801 -2.97 256,662 17.84
1,153,124 1,748,171 51.60 1,681,012 -3.84 1,696,980 0.95 1,469,983 -13.38
2,098,598 2,466,319 3,448,869 3,032,201 3,006,889
218,565 66,811 -69.43 70,522 5.55 67,426 -4.39 71,140 5.51
1,880,033 2,399,508 3,378,347 2,964,775 2,935,749
199,000 0 -100.00 0 0 0
0 -286,678 -474,856 65.64 -412,875 -13.05 -178,114 -56.86
1,681,033 2,112,830 2,903,491 2,551,900 2,757,635
125,000 66,293 -46.97 139,567 110.53 236,549 69.49 202,912 -14.22
0 0 0 0 0
0 121,374 0 -100.00 0 0
0 0 0 0 0
125,000 187,667 50.13 139,567 -25.63 236,549 69.49 202,912 -14.22
3.84 4.45 2.72 5.00 4.53
21,469 46,943 118.65 9,221 -80.36 0 -100.00 0
0.51 1 96.08 0.15 -85.00 0 -100.00 0
42,096 46,943 11.51 61,473 30.95
968,217 943,722 -2.53 894,185 -5.25 839,127 -6.16 775,915 -7.53
64.5 58.5 67.2 64.1 67.2
57.8 56.9 65.9 62.7 65.6
51.7 50.1 56.6 54.0 61.6
DTH revenue 20.4
Local advertising revenueNational advertising revenue 12.5
($) CAGR (%)
RevenueResidential/bulk/smatv subscriber revenue 0.4
Pay and Specialty
Licensee Licensee Ultimate Owner Type Year
Bell Media Inc. BCE Inc. Specialty (category B service) 2015
CRTC - FINANCIAL SUMMARY - PAY & SPECIALTY
Acquisition of rights 12.9
Script & conceptFiller Programming + Program Production
Adjustments - Gain (Loss)
Pre-tax Profit
Canadian Programming Expenses
Depreciation -24.5
P.B.I.T.
Interest Expense
Administration and General 6.2
Total Expenses 6.3
Operating Income
Programming and Production 8.7
Technical -1.0
Sales and Promotion 5.3
Other revenueTotal Revenue 8.3
Expenses
P.B.I.T. MarginPre-tax MarginCAGR = Compound Annual Growth Rate
Subscribers -5.4
Profitability (%)Operating Margin
Total Remuneration ($) -100.0
Average Staff CountAverage Remuneration ($)
Investment in ProgrammingTotal Canadian Programming 12.9
Canadian Programming/Revenue (%)
Page 72
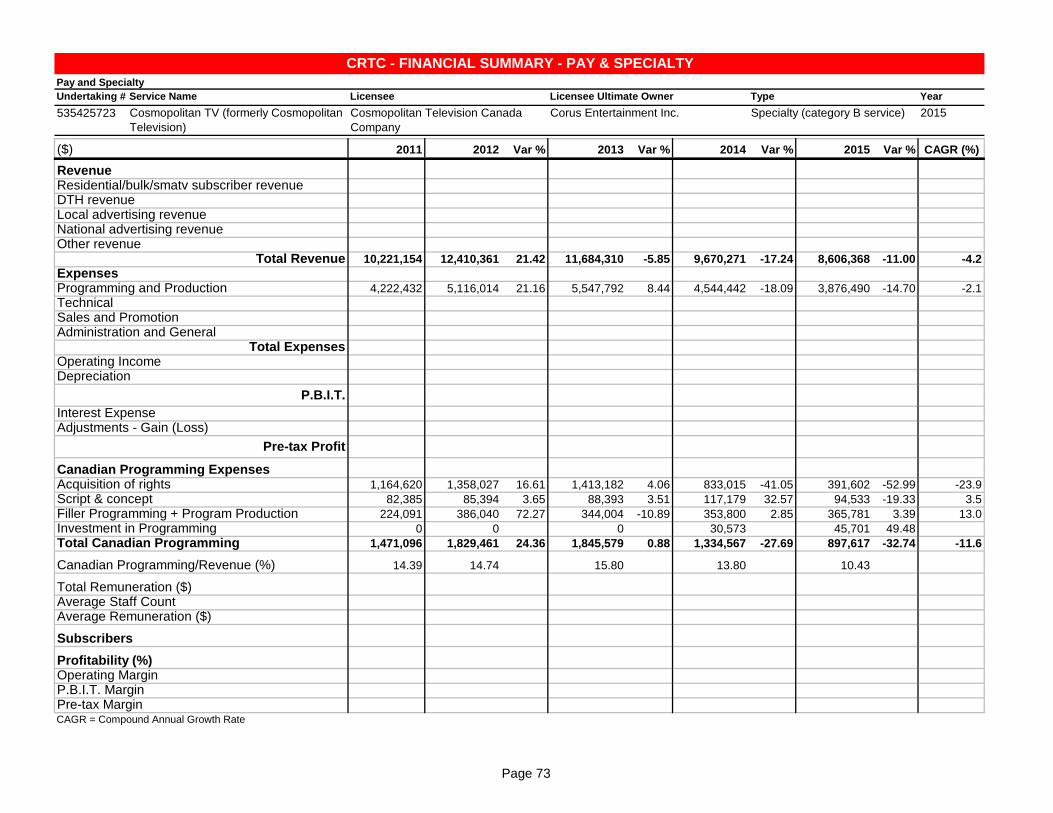
Undertaking # Service Name
535425723 Cosmopolitan TV (formerly Cosmopolitan
Television)
2011 2012 Var % 2013 Var % 2014 Var % 2015 Var %
y1 y2 y3 y4 y5
10,221,154 12,410,361 21.42 11,684,310 -5.85 9,670,271 -17.24 8,606,368 -11.00
4,222,432 5,116,014 21.16 5,547,792 8.44 4,544,442 -18.09 3,876,490 -14.70
1,164,620 1,358,027 16.61 1,413,182 4.06 833,015 -41.05 391,602 -52.99
82,385 85,394 3.65 88,393 3.51 117,179 32.57 94,533 -19.33
224,091 386,040 72.27 344,004 -10.89 353,800 2.85 365,781 3.39
0 0 0 30,573 45,701 49.48
1,471,096 1,829,461 24.36 1,845,579 0.88 1,334,567 -27.69 897,617 -32.74
14.39 14.74 15.80 13.80 10.43
Pay and Specialty
Licensee Licensee Ultimate Owner Type Year
Cosmopolitan Television Canada
Company
Corus Entertainment Inc. Specialty (category B service) 2015
CRTC - FINANCIAL SUMMARY - PAY & SPECIALTY
Depreciation
P.B.I.T.
Interest Expense
Administration and GeneralTotal Expenses
Operating Income
Programming and Production -2.1
TechnicalSales and Promotion
Other revenueTotal Revenue -4.2
Expenses
DTH revenueLocal advertising revenueNational advertising revenue
($) CAGR (%)
RevenueResidential/bulk/smatv subscriber revenue
P.B.I.T. MarginPre-tax MarginCAGR = Compound Annual Growth Rate
Subscribers
Profitability (%)Operating Margin
Total Remuneration ($)Average Staff CountAverage Remuneration ($)
Investment in ProgrammingTotal Canadian Programming -11.6
Canadian Programming/Revenue (%)
Acquisition of rights -23.9
Script & concept 3.5
Filler Programming + Program Production 13.0
Adjustments - Gain (Loss)
Pre-tax Profit
Canadian Programming Expenses
Page 73

Undertaking # Service Name
405423948 Cottage Life (formerly Bold)
2011 2012 Var % 2013 Var % 2014 Var % 2015 Var %
y1 y2 y3 y4 y5
1,473,616 1,672,534 13.50 1,640,141 -1.94 1,587,616 -3.20 1,587,366 -0.02
2,508,560 2,356,900 -6.05 2,342,618 -0.61 2,325,501 -0.73 2,253,251 -3.11
0 0 0 0 0
56,444 61,115 8.28 18,108 -70.37 780,806 >999± 1,004,362 28.63
0 0 0 0 0
4,038,620 4,090,549 1.29 4,000,867 -2.19 4,693,923 17.32 4,844,979 3.22
3,334,188 1,527,962 -54.17 1,418,722 -7.15 1,082,256 -23.72 2,515,885 132.47
826,246 724,538 -12.31 621,187 -14.26 810,250 30.44 783,000 -3.36
256,345 486,262 89.69 325,648 -33.03 785,394 141.18 441,751 -43.75
27,716 34,157 23.24 700,136 >999± 1,322,590 88.90 1,320,000 -0.20
4,444,495 2,772,919 -37.61 3,065,693 10.56 4,000,490 30.49 5,060,636 26.50
-405,875 1,317,630 935,174 693,433 -215,657
0 0 0 0 0
-405,875 1,317,630 935,174 693,433 -215,657
0 0 0 0 0
0 0 0 0 0
-405,875 1,317,630 935,174 693,433 -215,657
954,785 685,448 -28.21 345,859 -49.54 520,868 50.60 1,504,508 188.85
0 0 0 0 0
1,105,678 391,338 -64.61 93,253 -76.17 455,229 388.17 747,750 64.26
855,099 8,775 -98.97 414,273 >999± 0 -100.00 0
2,915,562 1,085,561 -62.77 853,385 -21.39 976,097 14.38 2,252,258 130.74
72.19 26.54 21.33 20.79 46.49
709,727 671,322 -5.41 323,949 -51.74 0 -100.00 0
8 7.5 -6.25 4.38 -41.60 0 -100.00 0
88,716 89,510 0.89 73,961 -17.37
2,662,024 2,635,696 -0.99 2,565,383 -2.67 2,509,466 -2.18 2,389,188 -4.79
-10.0 32.2 23.4 14.8 -4.5
-10.0 32.2 23.4 14.8 -4.5
-10.0 32.2 23.4 14.8 -4.5
CRTC - FINANCIAL SUMMARY - PAY & SPECIALTY
Programming and Production -6.8
Technical -1.3
Sales and Promotion 14.6
Other revenueTotal Revenue 4.7
Expenses
DTH revenue -2.7
Local advertising revenueNational advertising revenue 105.4
($) CAGR (%)
RevenueResidential/bulk/smatv subscriber revenue 1.9
Pay and Specialty
Licensee Licensee Ultimate Owner Type Year
Blue Ant Television Ltd. Blue Ant Media Inc. Specialty (category A service) 2015
Total Remuneration ($) -100.0
Average Staff CountAverage Remuneration ($)
Investment in Programming -100.0
Total Canadian Programming -6.3
Canadian Programming/Revenue (%)
Acquisition of rights 12.0
Script & conceptFiller Programming + Program Production -9.3
Adjustments - Gain (Loss)
Pre-tax Profit
Canadian Programming Expenses
Depreciation
P.B.I.T.
Interest Expense
Administration and General 162.7
Total Expenses 3.3
Operating Income
P.B.I.T. MarginPre-tax MarginCAGR = Compound Annual Growth Rate
Subscribers -2.7
Profitability (%)Operating Margin
Page 74

Undertaking # Service Name
305423907 Crime + Investigation (formerly Mystery)
2011 2012 Var % 2013 Var % 2014 Var % 2015 Var %
y1 y2 y3 y4 y5
3,484,286 4,649,895 33.45 5,245,624 12.81 6,237,318 18.91 7,548,999 21.03
4,553,531 4,387,278 -3.65 4,132,325 -5.81 4,162,019 0.72 4,225,930 1.54
0 0 0 0 0
4,853,906 5,504,016 13.39 6,498,514 18.07 7,378,274 13.54 7,384,225 0.08
166 0 -100.00 0 0 0
12,891,889 14,541,189 12.79 15,876,463 9.18 17,777,611 11.97 19,159,154 7.77
7,657,339 6,485,898 -15.30 6,613,868 1.97 6,528,614 -1.29 5,751,918 -11.90
548,103 714,256 30.31 615,572 -13.82 545,951 -11.31 542,437 -0.64
801,832 514,674 -35.81 169,205 -67.12 165,383 -2.26 194,132 17.38
553,796 834,526 50.69 953,074 14.21 1,434,258 50.49 1,838,162 28.16
9,561,070 8,549,354 -10.58 8,351,719 -2.31 8,674,206 3.86 8,326,649 -4.01
3,330,819 5,991,835 7,524,744 9,103,405 10,832,505
0 0 0 0 0
3,330,819 5,991,835 7,524,744 9,103,405 10,832,505
0 -27,721 -6,513 -76.51 0 -100.00 0
21,938 0 -100.00 0 0 0
3,352,757 6,019,556 7,531,257 9,103,405 10,832,505
5,002,864 4,036,180 -19.32 4,010,728 -0.63 3,995,408 -0.38 2,350,718 -41.16
0 26,000 0 -100.00 0 0
0 432,716 284,564 -34.24 300,476 5.59 351,118 16.85
0 0 0 0 0
5,002,864 4,494,896 -10.15 4,295,292 -4.44 4,295,884 0.01 2,701,836 -37.11
38.81 30.91 27.05 24.16 14.10
956,828 903,831 -5.54 883,702 -2.23 1,143,964 29.45 1,046,306 -8.54
17 12 -29.41 11 -8.33 14 27.27 12 -14.29
56,284 75,319 33.82 80,337 6.66 81,712 1.71 87,192 6.71
1,732,090 1,966,210 13.52 2,016,325 2.55 3,202,266 58.82 3,193,398 -0.28
25.8 41.2 47.4 51.2 56.5
25.8 41.2 47.4 51.2 56.5
26.0 41.4 47.4 51.2 56.5
DTH revenue -1.9
Local advertising revenueNational advertising revenue 11.1
($) CAGR (%)
RevenueResidential/bulk/smatv subscriber revenue 21.3
Pay and Specialty
Licensee Licensee Ultimate Owner Type Year
Mystery Partnership Shaw Communications Inc. Specialty (category A service) 2015
CRTC - FINANCIAL SUMMARY - PAY & SPECIALTY
Acquisition of rights -17.2
Script & conceptFiller Programming + Program Production
Adjustments - Gain (Loss)
Pre-tax Profit
Canadian Programming Expenses
Depreciation
P.B.I.T.
Interest Expense
Administration and General 35.0
Total Expenses -3.4
Operating Income
Programming and Production -6.9
Technical -0.3
Sales and Promotion -29.9
Other revenue -100.0
Total Revenue 10.4
Expenses
P.B.I.T. MarginPre-tax MarginCAGR = Compound Annual Growth Rate
Subscribers 16.5
Profitability (%)Operating Margin
Total Remuneration ($) 2.3
Average Staff CountAverage Remuneration ($) 11.6
Investment in ProgrammingTotal Canadian Programming -14.3
Canadian Programming/Revenue (%)
Page 75

Undertaking # Service Name
305417223 CTV News Channel (formerly CTV
Newsnet)
2011 2012 Var % 2013 Var % 2014 Var % 2015 Var %
y1 y2 y3 y4 y5
10,832,743 11,450,037 5.70 11,465,775 0.14 12,385,197 8.02 12,142,748 -1.96
3,894,940 4,073,907 4.59 4,016,268 -1.41 3,995,805 -0.51 3,833,969 -4.05
0 0 0 0 0
8,984,818 10,334,145 15.02 10,560,629 2.19 10,206,159 -3.36 10,593,431 3.79
0 0 0 0 0
23,712,501 25,858,089 9.05 26,042,672 0.71 26,587,161 2.09 26,570,148 -0.06
13,868,190 15,909,205 14.72 16,610,448 4.41 14,029,654 -15.54 12,221,777 -12.89
1,467,771 1,420,841 -3.20 1,286,508 -9.45 1,150,847 -10.54 1,085,351 -5.69
923,592 904,077 -2.11 880,348 -2.62 973,206 10.55 921,731 -5.29
1,479,756 1,249,446 -15.56 1,394,397 11.60 1,503,275 7.81 1,769,131 17.69
17,739,309 19,483,569 9.83 20,171,701 3.53 17,656,982 -12.47 15,997,990 -9.40
5,973,192 6,374,520 5,870,971 8,930,179 10,572,158
327,826 466,551 42.32 357,784 -23.31 379,065 5.95 422,217 11.38
5,645,366 5,907,969 5,513,187 8,551,114 10,149,941
0 550 2,548 363.27 1,137 -55.38 0 -100.00
93,500 0 -100.00 0 -573,911 -167,226 -70.86
5,738,866 5,907,419 5,510,639 7,976,066 9,982,715
0 0 0 0 0
0 0 0 0 0
12,827,845 14,965,933 16.67 16,610,448 10.99 14,029,654 -15.54 12,221,777 -12.89
0 0 0 0 0
12,827,845 14,965,933 16.67 16,610,448 10.99 14,029,654 -15.54 12,221,777 -12.89
54.10 57.88 63.78 52.77 46.00
8,841,154 10,797,173 22.12 10,940,118 1.32 9,369,678 -14.35 6,903,459 -26.32
70 81 15.71 89 9.88 82 -7.87 69.75 -14.94
126,302 133,298 5.54 122,923 -7.78 114,264 -7.04 98,974 -13.38
8,612,204 8,694,480 0.96 8,440,427 -2.92 8,218,462 -2.63 7,941,886 -3.37
25.2 24.7 22.5 33.6 39.8
23.8 22.8 21.2 32.2 38.2
24.2 22.8 21.2 30.0 37.6
Pay and Specialty
Licensee Licensee Ultimate Owner Type Year
Bell Media Inc. BCE Inc. Specialty (category C service) 2015
CRTC - FINANCIAL SUMMARY - PAY & SPECIALTY
Depreciation 6.5
P.B.I.T.
Interest Expense
Administration and General 4.6
Total Expenses -2.6
Operating Income
Programming and Production -3.1
Technical -7.3
Sales and Promotion -0.1
Other revenueTotal Revenue 2.9
Expenses
DTH revenue -0.4
Local advertising revenueNational advertising revenue 4.2
($) CAGR (%)
RevenueResidential/bulk/smatv subscriber revenue 2.9
P.B.I.T. MarginPre-tax MarginCAGR = Compound Annual Growth Rate
Subscribers -2.0
Profitability (%)Operating Margin
Total Remuneration ($) -6.0
Average Staff CountAverage Remuneration ($) -5.9
Investment in ProgrammingTotal Canadian Programming -1.2
Canadian Programming/Revenue (%)
Acquisition of rightsScript & conceptFiller Programming + Program Production -1.2
Adjustments - Gain (Loss)
Pre-tax Profit
Canadian Programming Expenses
Page 76
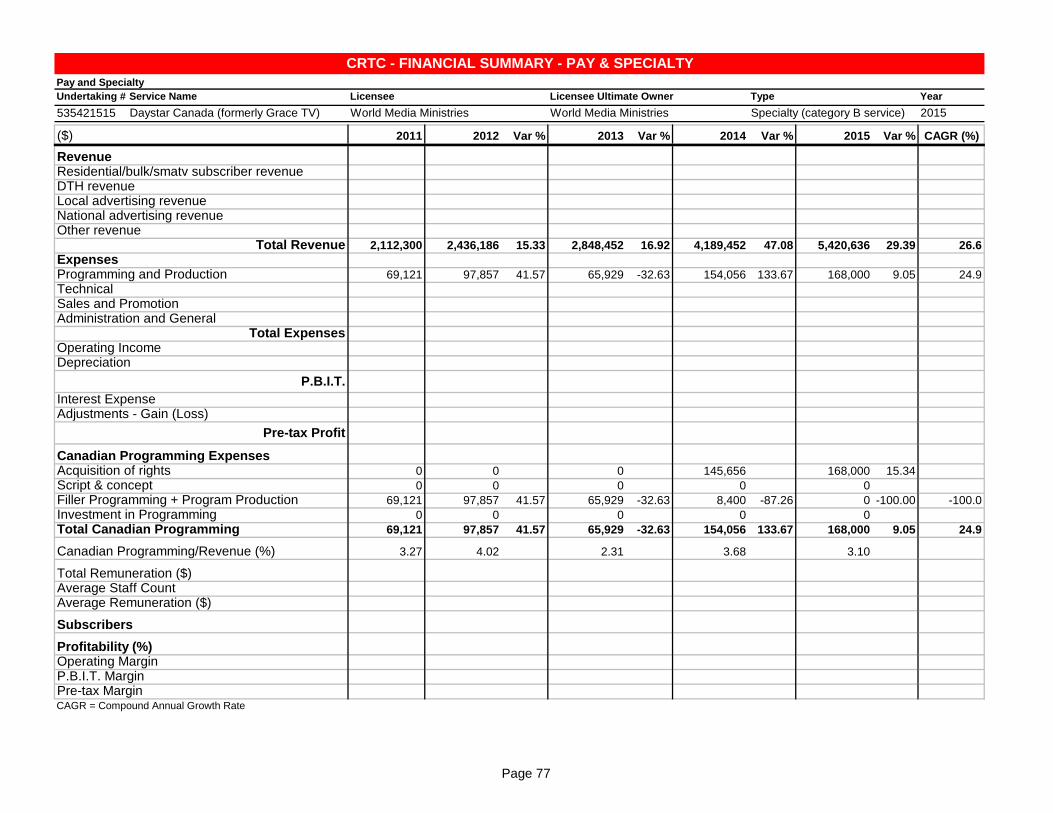
Undertaking # Service Name
535421515 Daystar Canada (formerly Grace TV)
2011 2012 Var % 2013 Var % 2014 Var % 2015 Var %
y1 y2 y3 y4 y5
2,112,300 2,436,186 15.33 2,848,452 16.92 4,189,452 47.08 5,420,636 29.39
69,121 97,857 41.57 65,929 -32.63 154,056 133.67 168,000 9.05
0 0 0 145,656 168,000 15.34
0 0 0 0 0
69,121 97,857 41.57 65,929 -32.63 8,400 -87.26 0 -100.00
0 0 0 0 0
69,121 97,857 41.57 65,929 -32.63 154,056 133.67 168,000 9.05
3.27 4.02 2.31 3.68 3.10
CRTC - FINANCIAL SUMMARY - PAY & SPECIALTY
Programming and Production 24.9
TechnicalSales and Promotion
Other revenueTotal Revenue 26.6
Expenses
DTH revenueLocal advertising revenueNational advertising revenue
($) CAGR (%)
RevenueResidential/bulk/smatv subscriber revenue
Pay and Specialty
Licensee Licensee Ultimate Owner Type Year
World Media Ministries World Media Ministries Specialty (category B service) 2015
Total Remuneration ($)Average Staff CountAverage Remuneration ($)
Investment in ProgrammingTotal Canadian Programming 24.9
Canadian Programming/Revenue (%)
Acquisition of rightsScript & conceptFiller Programming + Program Production -100.0
Adjustments - Gain (Loss)
Pre-tax Profit
Canadian Programming Expenses
Depreciation
P.B.I.T.
Interest Expense
Administration and GeneralTotal Expenses
Operating Income
P.B.I.T. MarginPre-tax MarginCAGR = Compound Annual Growth Rate
Subscribers
Profitability (%)Operating Margin
Page 77

Undertaking # Service Name
305426050 DejaView
2011 2012 Var % 2013 Var % 2014 Var % 2015 Var %
y1 y2 y3 y4 y5
2,491,846 2,866,314 15.03 2,983,060 4.07 3,072,572 3.00 3,194,530 3.97
2,234,591 2,238,841 0.19 2,210,937 -1.25 2,190,110 -0.94 2,367,202 8.09
0 0 0 0 0
2,687,697 3,094,693 15.14 2,629,926 -15.02 2,719,883 3.42 2,429,995 -10.66
0 0 0 0 0
7,414,134 8,199,848 10.60 7,823,923 -4.58 7,982,565 2.03 7,991,727 0.11
2,414,305 2,131,769 -11.70 1,898,300 -10.95 1,746,006 -8.02 1,431,644 -18.00
583,822 737,840 26.38 621,546 -15.76 545,818 -12.18 541,748 -0.75
623,726 345,197 -44.66 124,503 -63.93 127,902 2.73 138,633 8.39
525,307 696,746 32.64 776,021 11.38 1,280,414 65.00 1,273,359 -0.55
4,147,160 3,911,552 -5.68 3,420,370 -12.56 3,700,140 8.18 3,385,384 -8.51
3,266,974 4,288,296 4,403,553 4,282,425 4,606,343
0 0 0 0 0
3,266,974 4,288,296 4,403,553 4,282,425 4,606,343
2,451 0 -100.00 0 0 0
0 0 0 0 0
3,264,523 4,288,296 4,403,553 4,282,425 4,606,343
-19,726 96,754 -590.49 139,070 43.74 101,223 -27.21 267 -99.74
0 0 0 0 0
0 155,566 173,273 11.38 181,982 5.03 179,478 -1.38
0 0 0 0 0
-19,726 252,320 >999± 312,343 23.79 283,205 -9.33 179,745 -36.53
-0.27 3.08 3.99 3.55 2.25
925,794 813,008 -12.18 786,392 -3.27 964,689 22.67 860,367 -10.81
17 11 -35.29 10 -9.09 12 20.00 10 -16.67
54,458 73,910 35.72 78,639 6.40 80,391 2.23 86,037 7.02
1,515,568 1,633,454 7.78 1,565,370 -4.17 1,532,707 -2.09 1,506,037 -1.74
44.1 52.3 56.3 53.6 57.6
44.1 52.3 56.3 53.6 57.6
44.0 52.3 56.3 53.6 57.6
DTH revenue 1.5
Local advertising revenueNational advertising revenue -2.5
($) CAGR (%)
RevenueResidential/bulk/smatv subscriber revenue 6.4
Pay and Specialty
Licensee Licensee Ultimate Owner Type Year
Shaw Television Limited Partnership Shaw Communications Inc. Specialty (category B service) 2015
CRTC - FINANCIAL SUMMARY - PAY & SPECIALTY
Acquisition of rightsScript & conceptFiller Programming + Program Production
Adjustments - Gain (Loss)
Pre-tax Profit
Canadian Programming Expenses
Depreciation
P.B.I.T.
Interest Expense
Administration and General 24.8
Total Expenses -5.0
Operating Income
Programming and Production -12.3
Technical -1.9
Sales and Promotion -31.3
Other revenueTotal Revenue 1.9
Expenses
P.B.I.T. MarginPre-tax MarginCAGR = Compound Annual Growth Rate
Subscribers -0.2
Profitability (%)Operating Margin
Total Remuneration ($) -1.8
Average Staff CountAverage Remuneration ($) 12.1
Investment in ProgrammingTotal Canadian Programming
Canadian Programming/Revenue (%)
Page 78

Undertaking # Service Name
315413765 Discovery Channel
2011 2012 Var % 2013 Var % 2014 Var % 2015 Var %
y1 y2 y3 y4 y5
37,017,632 37,561,048 1.47 36,916,596 -1.72 39,298,440 6.45 36,525,988 -7.05
13,001,758 12,813,795 -1.45 12,759,759 -0.42 12,561,789 -1.55 12,043,683 -4.12
0 0 0 0 0
49,868,798 48,762,172 -2.22 51,649,777 5.92 47,768,274 -7.52 47,735,419 -0.07
24,654 58,050 135.46 45,946 -20.85 193,999 322.23 1,067,848 450.44
99,912,842 99,195,065 -0.72 101,372,078 2.19 99,822,502 -1.53 97,372,938 -2.45
50,818,252 55,167,950 8.56 60,635,604 9.91 59,228,062 -2.32 59,666,785 0.74
987,812 1,038,482 5.13 1,081,021 4.10 1,102,134 1.95 1,117,731 1.42
6,798,612 5,479,653 -19.40 7,315,624 33.51 6,473,779 -11.51 6,805,641 5.13
4,736,041 3,826,290 -19.21 4,519,959 18.13 4,145,161 -8.29 4,373,745 5.51
63,340,717 65,512,375 3.43 73,552,208 12.27 70,949,136 -3.54 71,963,902 1.43
36,572,125 33,682,690 27,819,870 28,873,366 25,409,036
1,484,450 2,014,491 35.71 1,596,609 -20.74 1,666,863 4.40 2,007,156 20.42
35,087,675 31,668,199 26,223,261 27,206,503 23,401,880
3,381 122,225 >999± 2,428,788 >999± 2,685,969 10.59 5,919,267 120.38
325,546 -2,498,854 -867.59 0 -100.00 0 0
35,409,840 29,047,120 23,794,473 24,520,534 17,482,613
20,653,749 23,117,073 11.93 30,324,090 31.18 31,788,851 4.83 27,636,839 -13.06
201,333 293,400 45.73 716,682 144.27 317,375 -55.72 305,822 -3.64
19,071,646 19,984,708 4.79 18,315,418 -8.35 15,333,669 -16.28 19,877,572 29.63
0 0 0 0 0
39,926,728 43,395,181 8.69 49,356,190 13.74 47,439,895 -3.88 47,820,233 0.80
39.96 43.75 48.69 47.52 49.11
6,171,812 4,967,867 -19.51 5,019,206 1.03 4,724,466 -5.87 4,945,582 4.68
49.5 48 -3.03 42 -12.50 40 -4.76 44 10.00
124,683 103,497 -16.99 119,505 15.47 118,112 -1.17 112,400 -4.84
8,113,810 7,899,862 -2.64 7,733,150 -2.11 7,560,436 -2.23 7,202,041 -4.74
36.6 34.0 27.4 28.9 26.1
35.1 31.9 25.9 27.3 24.0
35.4 29.3 23.5 24.6 18.0
Pay and Specialty
Licensee Licensee Ultimate Owner Type Year
2953285 Canada Inc. BCE Inc. Specialty (category A service) 2015
CRTC - FINANCIAL SUMMARY - PAY & SPECIALTY
Depreciation 7.8
P.B.I.T.
Interest Expense
Administration and General -2.0
Total Expenses 3.2
Operating Income
Programming and Production 4.1
Technical 3.1
Sales and Promotion 0.0
Other revenue 156.5
Total Revenue -0.6
Expenses
DTH revenue -1.9
Local advertising revenueNational advertising revenue -1.1
($) CAGR (%)
RevenueResidential/bulk/smatv subscriber revenue -0.3
P.B.I.T. MarginPre-tax MarginCAGR = Compound Annual Growth Rate
Subscribers -2.9
Profitability (%)Operating Margin
Total Remuneration ($) -5.4
Average Staff CountAverage Remuneration ($) -2.6
Investment in ProgrammingTotal Canadian Programming 4.6
Canadian Programming/Revenue (%)
Acquisition of rights 7.6
Script & concept 11.0
Filler Programming + Program Production 1.0
Adjustments - Gain (Loss)
Pre-tax Profit
Canadian Programming Expenses
Page 79

Undertaking # Service Name
305426191 Discovery Science (formerly Discovery
Civilization Channel)
2011 2012 Var % 2013 Var % 2014 Var % 2015 Var %
y1 y2 y3 y4 y5
1,713,832 1,961,970 14.48 2,332,952 18.91 2,641,887 13.24 2,721,001 2.99
1,707,173 1,859,912 8.95 2,001,671 7.62 2,044,230 2.13 1,989,687 -2.67
0 0 0 0 0
726,487 789,768 8.71 846,348 7.16 920,297 8.74 1,146,636 24.59
0 0 0 0 0
4,147,492 4,611,650 11.19 5,180,971 12.35 5,606,414 8.21 5,857,324 4.48
1,733,001 1,843,188 6.36 1,787,465 -3.02 1,608,904 -9.99 2,101,017 30.59
757,591 798,186 5.36 797,107 -0.14 815,356 2.29 823,362 0.98
477,729 363,587 -23.89 363,070 -0.14 304,922 -16.02 327,810 7.51
784,019 876,705 11.82 986,741 12.55 968,464 -1.85 1,003,082 3.57
3,752,340 3,881,666 3.45 3,934,383 1.36 3,697,646 -6.02 4,255,271 15.08
395,152 729,984 1,246,588 1,908,768 1,602,053
57,339 67,820 18.28 71,224 5.02 79,933 12.23 93,077 16.44
337,813 662,164 1,175,364 1,828,835 1,508,976
0 0 -11,457 -11,958 4.37 -15,158 26.76
9,200 7,442 -19.11 0 -100.00 0 0
347,013 669,606 1,186,821 1,840,793 1,524,134
410,120 399,800 -2.52 349,020 -12.70 440,371 26.17 724,825 64.59
0 0 45,203 21,653 -52.10 0 -100.00
305,172 340,136 11.46 211,189 -37.91 86,480 -59.05 276,806 220.08
0 0 0 0 0
715,292 739,936 3.45 605,412 -18.18 548,504 -9.40 1,001,631 82.61
17.25 16.04 11.69 9.78 17.10
183,025 204,324 11.64 172,775 -15.44 153,860 -10.95 155,257 0.91
2.5 2.8 12.00 2.17 -22.50 2.17 0.00 2.17 0.00
73,210 72,973 -0.32 79,620 9.11 70,903 -10.95 71,547 0.91
1,399,775 1,448,006 3.45 1,562,630 7.92 1,617,059 3.48 1,647,679 1.89
9.5 15.8 24.1 34.0 27.4
8.1 14.4 22.7 32.6 25.8
8.4 14.5 22.9 32.8 26.0
DTH revenue 3.9
Local advertising revenueNational advertising revenue 12.1
($) CAGR (%)
RevenueResidential/bulk/smatv subscriber revenue 12.3
Pay and Specialty
Licensee Licensee Ultimate Owner Type Year
Discovery Science Canada Company BCE Inc. Specialty (category B service) 2015
CRTC - FINANCIAL SUMMARY - PAY & SPECIALTY
Acquisition of rights 15.3
Script & conceptFiller Programming + Program Production -2.4
Adjustments - Gain (Loss)
Pre-tax Profit
Canadian Programming Expenses
Depreciation 12.9
P.B.I.T.
Interest Expense
Administration and General 6.4
Total Expenses 3.2
Operating Income
Programming and Production 4.9
Technical 2.1
Sales and Promotion -9.0
Other revenueTotal Revenue 9.0
Expenses
P.B.I.T. MarginPre-tax MarginCAGR = Compound Annual Growth Rate
Subscribers 4.2
Profitability (%)Operating Margin
Total Remuneration ($) -4.0
Average Staff CountAverage Remuneration ($) -0.6
Investment in ProgrammingTotal Canadian Programming 8.8
Canadian Programming/Revenue (%)
Page 80

Undertaking # Service Name
535421250 Discovery Velocity (formerly Discovery
World HD)
2011 2012 Var % 2013 Var % 2014 Var % 2015 Var %
y1 y2 y3 y4 y5
16,973,777 18,110,093 6.69 17,609,321 -2.77 17,141,791 -2.66 15,466,654 -9.77
9,840,390 8,752,779 -11.05 8,258,799 -5.64 7,630,502 -7.61 7,523,820 -1.40
0 0 0 0 0
330,624 276,884 -16.25 428,993 54.94 585,057 36.38 1,118,125 91.11
0 0 0 0 0
27,144,791 27,139,756 -0.02 26,297,113 -3.10 25,357,350 -3.57 24,108,599 -4.92
9,792,369 8,516,933 -13.02 8,611,387 1.11 8,234,488 -4.38 8,126,196 -1.32
594,657 282,453 -52.50 423,697 50.01 424,473 0.18 449,852 5.98
1,871,278 853,702 -54.38 862,491 1.03 827,360 -4.07 829,875 0.30
989,642 1,058,764 6.98 1,489,026 40.64 1,208,642 -18.83 1,287,236 6.50
13,247,946 10,711,852 -19.14 11,386,601 6.30 10,694,963 -6.07 10,693,159 -0.02
13,896,845 16,427,904 14,910,512 14,662,387 13,415,440
123,157 395,317 220.99 361,515 -8.55 361,531 0.00 383,102 5.97
13,773,688 16,032,587 14,548,997 14,300,856 13,032,338
0 19 75 294.74 36 -52.00 0 -100.00
0 0 0 0 0
13,773,688 16,032,568 14,548,922 14,300,820 13,032,338
2,370,172 2,782,019 17.38 2,935,582 5.52 3,637,590 23.91 3,611,404 -0.72
25,000 10,000 -60.00 20,500 105.00 9,892 -51.75 19,503 97.16
2,775,263 874,296 -68.50 462,002 -47.16 342,935 -25.77 676,101 97.15
0 0 0 0 0
5,170,435 3,666,315 -29.09 3,418,084 -6.77 3,990,417 16.74 4,307,008 7.93
19.05 13.51 13.00 15.74 17.87
183,879 201,402 9.53 202,822 0.71 195,391 -3.66 213,796 9.42
2.5 2.5 0.00 2.5 0.00 2.5 0.00 2.5 0.00
73,552 80,561 9.53 81,129 0.71 78,156 -3.66 85,518 9.42
1,442,292 1,493,112 3.52 1,320,604 -11.55 1,228,798 -6.95 1,142,436 -7.03
51.2 60.5 56.7 57.8 55.6
50.7 59.1 55.3 56.4 54.1
50.7 59.1 55.3 56.4 54.1
Pay and Specialty
Licensee Licensee Ultimate Owner Type Year
2953285 Canada Inc. BCE Inc. Specialty (category B service) 2015
CRTC - FINANCIAL SUMMARY - PAY & SPECIALTY
Depreciation 32.8
P.B.I.T.
Interest Expense
Administration and General 6.8
Total Expenses -5.2
Operating Income
Programming and Production -4.6
Technical -6.7
Sales and Promotion -18.4
Other revenueTotal Revenue -2.9
Expenses
DTH revenue -6.5
Local advertising revenueNational advertising revenue 35.6
($) CAGR (%)
RevenueResidential/bulk/smatv subscriber revenue -2.3
P.B.I.T. MarginPre-tax MarginCAGR = Compound Annual Growth Rate
Subscribers -5.7
Profitability (%)Operating Margin
Total Remuneration ($) 3.8
Average Staff CountAverage Remuneration ($) 3.8
Investment in ProgrammingTotal Canadian Programming -4.5
Canadian Programming/Revenue (%)
Acquisition of rights 11.1
Script & concept -6.0
Filler Programming + Program Production -29.8
Adjustments - Gain (Loss)
Pre-tax Profit
Canadian Programming Expenses
Page 81

Undertaking # Service Name
535421151 D.I.Y. Network (formerly D.I.Y. Television)
2011 2012 Var % 2013 Var % 2014 Var % 2015 Var %
y1 y2 y3 y4 y5
2,493,399 3,917,663 57.12 3,683,275 -5.98 3,965,287 7.66 3,909,987 -1.39
3,078,885 2,226,272 -27.69 2,091,701 -6.04 2,101,851 0.49 2,166,120 3.06
0 0 0 0 0
4,265,326 4,598,700 7.82 4,656,343 1.25 6,025,461 29.40 5,419,727 -10.05
0 0 0 0 0
9,837,610 10,742,635 9.20 10,431,319 -2.90 12,092,599 15.93 11,495,834 -4.93
987,351 999,661 1.25 994,575 -0.51 1,109,884 11.59 1,630,366 46.90
669,774 653,432 -2.44 633,601 -3.03 489,595 -22.73 549,651 12.27
594,916 279,076 -53.09 206,201 -26.11 345,031 67.33 184,909 -46.41
1,364,076 1,382,428 1.35 1,348,031 -2.49 1,741,690 29.20 1,888,480 8.43
3,616,117 3,314,597 -8.34 3,182,408 -3.99 3,686,200 15.83 4,253,406 15.39
6,221,493 7,428,038 7,248,911 8,406,399 7,242,428
0 0 0 0 0
6,221,493 7,428,038 7,248,911 8,406,399 7,242,428
-7,753 -599 -92.27 0 -100.00 0 0
0 0 0 0 0
6,229,246 7,428,637 7,248,911 8,406,399 7,242,428
57,189 57,700 0.89 59,170 2.55 60,849 2.84 47,321 -22.23
0 0 0 0 0
274,678 246,813 -10.14 224,908 -8.88 248,384 10.44 231,610 -6.75
0 0 0 0 0
331,867 304,513 -8.24 284,078 -6.71 309,233 8.85 278,931 -9.80
3.37 2.83 2.72 2.56 2.43
813,435 1,038,852 27.71 1,003,324 -3.42 961,589 -4.16 998,154 3.80
11 12 9.09 11 -8.33 11 0.00 11 0.00
73,949 86,571 17.07 91,211 5.36 87,417 -4.16 90,741 3.80
2,200,219 2,484,142 12.90 3,233,203 30.15 3,256,020 0.71 3,248,921 -0.22
63.2 69.1 69.5 69.5 63.0
63.2 69.1 69.5 69.5 63.0
63.3 69.2 69.5 69.5 63.0
CRTC - FINANCIAL SUMMARY - PAY & SPECIALTY
Programming and Production 13.4
Technical -4.8
Sales and Promotion -25.3
Other revenueTotal Revenue 4.0
Expenses
DTH revenue -8.4
Local advertising revenueNational advertising revenue 6.2
($) CAGR (%)
RevenueResidential/bulk/smatv subscriber revenue 11.9
Pay and Specialty
Licensee Licensee Ultimate Owner Type Year
HGTV Canada Inc. Shaw Communications Inc. Specialty (category B service) 2015
Total Remuneration ($) 5.3
Average Staff CountAverage Remuneration ($) 5.3
Investment in ProgrammingTotal Canadian Programming -4.3
Canadian Programming/Revenue (%)
Acquisition of rights -4.6
Script & conceptFiller Programming + Program Production -4.2
Adjustments - Gain (Loss)
Pre-tax Profit
Canadian Programming Expenses
Depreciation
P.B.I.T.
Interest Expense
Administration and General 8.5
Total Expenses 4.1
Operating Income
P.B.I.T. MarginPre-tax MarginCAGR = Compound Annual Growth Rate
Subscribers 10.2
Profitability (%)Operating Margin
Page 82

Undertaking # Service Name
305423965 Documentary (formerly The Canadian
Documentary Channel)
2011 2012 Var % 2013 Var % 2014 Var % 2015 Var %
y1 y2 y3 y4 y5
2,530,657 3,187,513 25.96 3,316,105 4.03 3,426,097 3.32 4,022,419 17.41
2,735,263 2,640,874 -3.45 2,729,270 3.35 2,850,923 4.46 2,314,865 -18.80
0 0 0 0 0
176,558 186,278 5.51 274,837 47.54 270,325 -1.64 307,338 13.69
63,205 3,243 -94.87 592 -81.75 4,909 729.22 6 -99.88
5,505,683 6,017,908 9.30 6,320,804 5.03 6,552,254 3.66 6,644,628 1.41
2,558,112 2,764,550 8.07 2,878,598 4.13 3,314,613 15.15 3,326,337 0.35
1,234,684 1,215,982 -1.51 1,239,365 1.92 1,254,565 1.23 1,241,201 -1.07
436,036 514,638 18.03 572,571 11.26 514,502 -10.14 536,185 4.21
594,285 636,279 7.07 617,375 -2.97 622,446 0.82 528,802 -15.04
4,823,117 5,131,449 6.39 5,307,909 3.44 5,706,126 7.50 5,632,525 -1.29
682,566 886,459 1,012,895 846,128 1,012,103
0 0 0 0 0
682,566 886,459 1,012,895 846,128 1,012,103
59,103 30,672 -48.10 0 -100.00 0 0
0 0 0 0 0
623,463 855,787 1,012,895 846,128 1,012,103
1,371,297 1,536,289 12.03 1,462,783 -4.78 1,593,223 8.92 1,618,908 1.61
215,788 304,750 41.23 357,294 17.24 633,370 77.27 562,317 -11.22
471,781 558,300 18.34 584,058 4.61 597,936 2.38 619,537 3.61
0 0 0 0 2,060
2,058,866 2,399,339 16.54 2,404,135 0.20 2,824,529 17.49 2,802,822 -0.77
37.40 39.87 38.04 43.11 42.18
711,563 666,738 -6.30 778,773 16.80 866,587 11.28 895,945 3.39
8 7.5 -6.25 8.25 10.00 8.75 6.06 8.75 0.00
88,945 88,898 -0.05 94,397 6.18 99,039 4.92 102,394 3.39
2,563,944 2,669,402 4.11 2,697,178 1.04 2,692,691 -0.17 2,646,500 -1.72
12.4 14.7 16.0 12.9 15.2
12.4 14.7 16.0 12.9 15.2
11.3 14.2 16.0 12.9 15.2
DTH revenue -4.1
Local advertising revenueNational advertising revenue 14.9
($) CAGR (%)
RevenueResidential/bulk/smatv subscriber revenue 12.3
Pay and Specialty
Licensee Licensee Ultimate Owner Type Year
The Canadian Documentary Channel
Limited Partnersh
Canadian Broadcasting Corporation Specialty (category A service) 2015
CRTC - FINANCIAL SUMMARY - PAY & SPECIALTY
Acquisition of rights 4.2
Script & concept 27.1
Filler Programming + Program Production 7.1
Adjustments - Gain (Loss)
Pre-tax Profit
Canadian Programming Expenses
Depreciation
P.B.I.T.
Interest Expense
Administration and General -2.9
Total Expenses 4.0
Operating Income
Programming and Production 6.8
Technical 0.1
Sales and Promotion 5.3
Other revenue -90.1
Total Revenue 4.8
Expenses
P.B.I.T. MarginPre-tax MarginCAGR = Compound Annual Growth Rate
Subscribers 0.8
Profitability (%)Operating Margin
Total Remuneration ($) 5.9
Average Staff CountAverage Remuneration ($) 3.6
Investment in ProgrammingTotal Canadian Programming 8.0
Canadian Programming/Revenue (%)
Page 83

Undertaking # Service Name
305417299 DTOUR (formerly TVtropolis)
2011 2012 Var % 2013 Var % 2014 Var % 2015 Var %
y1 y2 y3 y4 y5
10,972,219 10,622,994 -3.18 10,789,186 1.56 10,824,411 0.33 11,350,635 4.86
3,505,084 3,453,772 -1.46 3,766,653 9.06 3,831,390 1.72 3,645,634 -4.85
0 0 0 0 0
27,113,111 23,877,768 -11.93 17,508,955 -26.67 12,378,789 -29.30 10,743,270 -13.21
308 113 -63.31 1 -99.12 0 -100.00 0
41,590,722 37,954,647 -8.74 32,064,795 -15.52 27,034,590 -15.69 25,739,539 -4.79
27,674,301 18,184,542 -34.29 12,050,839 -33.73 9,475,433 -21.37 7,363,374 -22.29
566,669 855,538 50.98 722,057 -15.60 622,640 -13.77 610,446 -1.96
4,219,958 2,983,149 -29.31 1,153,190 -61.34 817,556 -29.10 359,332 -56.05
1,513,375 1,572,954 3.94 1,575,452 0.16 2,234,107 41.81 2,084,593 -6.69
33,974,303 23,596,183 -30.55 15,501,538 -34.30 13,149,736 -15.17 10,417,745 -20.78
7,616,419 14,358,464 16,563,257 13,884,854 15,321,794
0 0 1,454 10,523 623.73 10,225 -2.83
7,616,419 14,358,464 16,561,803 13,874,331 15,311,569
0 -32,929 -28,964 -12.04 -9,739 -66.38 -1,870 -80.80
-20,821 0 -100.00 0 0 0
7,595,598 14,391,393 16,590,767 13,884,070 15,313,439
19,179,790 13,286,978 -30.72 7,609,721 -42.73 5,055,174 -33.57 3,002,537 -40.60
0 117,996 236,348 100.30 30,000 -87.31 0 -100.00
0 790,779 781,317 -1.20 778,418 -0.37 701,179 -9.92
213,000 0 -100.00 0 0 0
19,392,790 14,195,753 -26.80 8,627,386 -39.23 5,863,592 -32.04 3,703,716 -36.84
46.63 37.40 26.91 21.69 14.39
2,047,250 1,516,190 -25.94 1,745,822 15.15 2,052,093 17.54 1,788,430 -12.85
28 20 -28.57 22 10.00 25 13.64 21 -16.00
73,116 75,810 3.68 79,356 4.68 82,084 3.44 85,163 3.75
6,263,767 6,014,856 -3.97 5,759,675 -4.24 5,335,548 -7.36 4,996,819 -6.35
18.3 37.8 51.7 51.4 59.5
18.3 37.8 51.7 51.3 59.5
18.3 37.9 51.7 51.4 59.5
Pay and Specialty
Licensee Licensee Ultimate Owner Type Year
TVtropolis General Partnership Shaw Communications Inc. Specialty (category A service) 2015
CRTC - FINANCIAL SUMMARY - PAY & SPECIALTY
Depreciation
P.B.I.T.
Interest Expense
Administration and General 8.3
Total Expenses -25.6
Operating Income
Programming and Production -28.2
Technical 1.9
Sales and Promotion -46.0
Other revenue -100.0
Total Revenue -11.3
Expenses
DTH revenue 1.0
Local advertising revenueNational advertising revenue -20.7
($) CAGR (%)
RevenueResidential/bulk/smatv subscriber revenue 0.9
P.B.I.T. MarginPre-tax MarginCAGR = Compound Annual Growth Rate
Subscribers -5.5
Profitability (%)Operating Margin
Total Remuneration ($) -3.3
Average Staff CountAverage Remuneration ($) 3.9
Investment in Programming -100.0
Total Canadian Programming -33.9
Canadian Programming/Revenue (%)
Acquisition of rights -37.1
Script & conceptFiller Programming + Program Production
Adjustments - Gain (Loss)
Pre-tax Profit
Canadian Programming Expenses
Page 84

Undertaking # Service Name
305426505 Dusk (formerly Scream)
2011 2012 Var % 2013 Var % 2014 Var % 2015 Var %
y1 y2
7,653,392 4,519,767 -40.94 -100.00
1,699,039 1,341,007 -21.07 -100.00
262,063 234,935 -10.35 -100.00
8,593 22,996 167.61 -100.00
195,782 223,744 14.28 -100.00
0 0
466,438 481,675 3.27 -100.00
6.09 10.66
CRTC - FINANCIAL SUMMARY - PAY & SPECIALTY
Programming and ProductionTechnicalSales and Promotion
Other revenueTotal Revenue
Expenses
DTH revenueLocal advertising revenueNational advertising revenue
($) CAGR (%)
RevenueResidential/bulk/smatv subscriber revenue
Pay and Specialty
Licensee Licensee Ultimate Owner Type Year
3924181 Canada Inc. Corus Entertainment Inc. Specialty (category B service) 2012
Total Remuneration ($)Average Staff CountAverage Remuneration ($)
Investment in ProgrammingTotal Canadian Programming
Canadian Programming/Revenue (%)
Acquisition of rightsScript & conceptFiller Programming + Program Production
Adjustments - Gain (Loss)
Pre-tax Profit
Canadian Programming Expenses
Depreciation
P.B.I.T.
Interest Expense
Administration and GeneralTotal Expenses
Operating Income
P.B.I.T. MarginPre-tax MarginCAGR = Compound Annual Growth Rate
Subscribers
Profitability (%)Operating Margin
Page 85

Undertaking # Service Name
305417330 E! (formerly Star! TV)
2011 2012 Var % 2013 Var % 2014 Var % 2015 Var %
y1 y2 y3 y4 y5
12,534,812 13,624,182 8.69 13,388,515 -1.73 11,801,861 -11.85 12,281,339 4.06
5,540,242 3,723,306 -32.80 3,402,754 -8.61 3,153,245 -7.33 2,839,354 -9.95
0 0 0 0 0
9,049,855 11,223,517 24.02 13,979,104 24.55 14,217,359 1.70 14,430,077 1.50
0 18,662 17,877 -4.21 176,290 886.13 45,445 -74.22
27,124,909 28,589,667 5.40 30,788,250 7.69 29,348,755 -4.68 29,596,215 0.84
16,433,955 13,850,838 -15.72 13,772,555 -0.57 17,955,291 30.37 15,101,565 -15.89
1,179,221 1,209,998 2.61 1,223,936 1.15 1,165,296 -4.79 1,038,630 -10.87
885,839 1,077,348 21.62 1,901,553 76.50 1,567,831 -17.55 1,324,734 -15.51
1,979,917 2,512,399 26.89 1,994,248 -20.62 2,085,017 4.55 2,243,225 7.59
20,478,932 18,650,583 -8.93 18,892,292 1.30 22,773,435 20.54 19,708,154 -13.46
6,645,977 9,939,084 11,895,958 6,575,320 9,888,061
1,873,224 728,215 -61.13 540,507 -25.78 546,183 1.05 606,083 10.97
4,772,753 9,210,869 11,355,451 6,029,137 9,281,978
-141,297 283,463 -300.62 308,266 8.75 518,134 68.08 970,472 87.30
-795,656 -1,943,457 144.26 -2,128,382 9.52 -1,919,099 -9.83 -2,254,876 17.50
4,118,394 6,983,949 8,918,803 3,591,904 6,056,630
262,828 158,177 -39.82 823,472 420.60 3,988,277 384.32 3,314,818 -16.89
0 0 222,836 34,977 -84.30 0 -100.00
10,566,973 7,561,341 -28.44 5,199,825 -31.23 5,349,172 2.87 4,099,726 -23.36
650 0 -100.00 0 0 0
10,830,451 7,719,518 -28.72 6,246,133 -19.09 9,372,426 50.05 7,414,544 -20.89
39.93 27.00 20.29 31.93 25.05
8,626,176 7,596,381 -11.94 7,412,125 -2.43 7,352,618 -0.80 5,799,488 -21.12
81 71 -12.35 65 -8.45 69.11 6.32 55 -20.42
106,496 106,991 0.47 114,033 6.58 106,390 -6.70 105,445 -0.89
6,460,210 6,880,039 6.50 7,114,520 3.41 7,136,382 0.31 7,068,626 -0.95
24.5 34.8 38.6 22.4 33.4
17.6 32.2 36.9 20.5 31.4
15.2 24.4 29.0 12.2 20.5
DTH revenue -15.4
Local advertising revenueNational advertising revenue 12.4
($) CAGR (%)
RevenueResidential/bulk/smatv subscriber revenue -0.5
Pay and Specialty
Licensee Licensee Ultimate Owner Type Year
Bell Media Inc. BCE Inc. Specialty (category A service) 2015
CRTC - FINANCIAL SUMMARY - PAY & SPECIALTY
Acquisition of rights 88.5
Script & conceptFiller Programming + Program Production -21.1
Adjustments - Gain (Loss)
Pre-tax Profit
Canadian Programming Expenses
Depreciation -24.6
P.B.I.T.
Interest Expense
Administration and General 3.2
Total Expenses -1.0
Operating Income
Programming and Production -2.1
Technical -3.1
Sales and Promotion 10.6
Other revenueTotal Revenue 2.2
Expenses
P.B.I.T. MarginPre-tax MarginCAGR = Compound Annual Growth Rate
Subscribers 2.3
Profitability (%)Operating Margin
Total Remuneration ($) -9.5
Average Staff CountAverage Remuneration ($) -0.3
Investment in Programming -100.0
Total Canadian Programming -9.0
Canadian Programming/Revenue (%)
Page 86

Undertaking # Service Name
435413703 Encore Avenue
2011 2012 Var % 2013 Var % 2014 Var % 2015 Var %
y1 y2 y3 y4 y5
12,286,724 12,722,913 3.55 13,304,894 4.57 13,573,759 2.02 12,411,052 -8.57
8,265,063 7,120,619 -13.85 7,071,288 -0.69 6,683,998 -5.48 5,977,685 -10.57
0 0 0 0 0
0 0 0 0 0
0 0 0 0 0
20,551,787 19,843,532 -3.45 20,376,182 2.68 20,257,757 -0.58 18,388,737 -9.23
6,754,222 5,422,446 -19.72 5,299,175 -2.27 5,122,249 -3.34 4,751,067 -7.25
1,401,271 1,293,898 -7.66 1,203,294 -7.00 1,113,366 -7.47 990,071 -11.07
435,969 332,408 -23.75 309,162 -6.99 277,503 -10.24 262,680 -5.34
3,031,144 2,579,112 -14.91 2,239,719 -13.16 2,067,733 -7.68 1,051,071 -49.17
11,622,606 9,627,864 -17.16 9,051,350 -5.99 8,580,851 -5.20 7,054,889 -17.78
8,929,181 10,215,668 11,324,832 11,676,906 11,333,848
0 511,597 563,839 10.21 491,452 -12.84 448,643 -8.71
8,929,181 9,704,071 10,760,993 11,185,454 10,885,205
127,440 140,919 10.58 152,166 7.98 185,053 21.61 174,275 -5.82
1,669,115 1,135,344 -31.98 384,114 -66.17 645,049 67.93 866,829 34.38
10,470,856 10,698,496 10,992,941 11,645,450 11,577,759
891,586 975,318 9.39 746,494 -23.46 441,406 -40.87 275,524 -37.58
8,593 38,233 344.93 38,198 -0.09 36,226 -5.16 29,476 -18.63
539,802 781,775 44.83 832,718 6.52 701,095 -15.81 888,953 26.79
1,437,948 -145,350 -110.11 0 -100.00 0 0
2,877,929 1,649,976 -42.67 1,617,410 -1.97 1,178,727 -27.12 1,193,953 1.29
14.00 8.31 7.94 5.82 6.49
1,904,419 1,827,776 -4.02 1,761,688 -3.62 1,141,217 -35.22 637,730 -44.12
27 29 7.41 23 -20.69 27 17.39 31 14.81
70,534 63,027 -10.64 76,595 21.53 42,267 -44.82 20,572 -51.33
2,371,054 2,305,491 -2.77 2,249,940 -2.41 2,139,038 -4.93 1,997,353 -6.62
43.4 51.5 55.6 57.6 61.6
43.4 48.9 52.8 55.2 59.2
50.9 53.9 53.9 57.5 63.0
Pay and Specialty
Licensee Licensee Ultimate Owner Type Year
Encore Avenue Ltd. Corus Entertainment Inc. Pay-TV (category A service) 2015
CRTC - FINANCIAL SUMMARY - PAY & SPECIALTY
Depreciation
P.B.I.T.
Interest Expense
Administration and General -23.3
Total Expenses -11.7
Operating Income
Programming and Production -8.4
Technical -8.3
Sales and Promotion -11.9
Other revenueTotal Revenue -2.7
Expenses
DTH revenue -7.8
Local advertising revenueNational advertising revenue
($) CAGR (%)
RevenueResidential/bulk/smatv subscriber revenue 0.3
P.B.I.T. MarginPre-tax MarginCAGR = Compound Annual Growth Rate
Subscribers -4.2
Profitability (%)Operating Margin
Total Remuneration ($) -23.9
Average Staff CountAverage Remuneration ($) -26.5
Investment in Programming -100.0
Total Canadian Programming -19.7
Canadian Programming/Revenue (%)
Acquisition of rights -25.4
Script & concept 36.1
Filler Programming + Program Production 13.3
Adjustments - Gain (Loss)
Pre-tax Profit
Canadian Programming Expenses
Page 87

Undertaking # Service Name
535427109 EqualiTV
2011 2012 Var % 2013 Var % 2014 Var % 2015 Var %
y1 y2 y3 y4
5,555 12,000 116.02 1,500 -87.50 0 -100.00
5,000 12,000 140.00 0 -100.00 0
0 0 0 0
0 0 0 0
5,000 12,000 140.00 0 -100.00 0
0 0 0 0
5,000 12,000 140.00 0 -100.00 0
90.01 100.00 0.00
CRTC - FINANCIAL SUMMARY - PAY & SPECIALTY
Programming and ProductionTechnicalSales and Promotion
Other revenueTotal Revenue
Expenses
DTH revenueLocal advertising revenueNational advertising revenue
($) CAGR (%)
RevenueResidential/bulk/smatv subscriber revenue
Pay and Specialty
Licensee Licensee Ultimate Owner Type Year
EqualiTV International Foundation EqualiTV International Foundation Specialty (category B service) 2014
Total Remuneration ($)Average Staff CountAverage Remuneration ($)
Investment in ProgrammingTotal Canadian Programming
Canadian Programming/Revenue (%)
Acquisition of rightsScript & conceptFiller Programming + Program Production
Adjustments - Gain (Loss)
Pre-tax Profit
Canadian Programming Expenses
Depreciation
P.B.I.T.
Interest Expense
Administration and GeneralTotal Expenses
Operating Income
P.B.I.T. MarginPre-tax MarginCAGR = Compound Annual Growth Rate
Subscribers
Profitability (%)Operating Margin
Page 88

Undertaking # Service Name
305425375 ERT sat (formerly Odyssey II)
2011 2012 Var % 2013 Var % 2014 Var % 2015 Var %
y1 y2 y3 y4 y5
567,432 524,470 -7.57 630,574 20.23 146,104 -76.83 130,893 -10.41
468,762 446,536 -4.74 388,473 -13.00 53,081 -86.34 24,228 -54.36
20,000 0 -100.00 0 0 0
0 20,000 20,000 0.00 20,000 0.00 10,000 -50.00
67,758 96,376 42.24 350,056 263.22 25,656 -92.67 14,228 -44.54
0 0 0 0 0
87,758 116,376 32.61 370,056 217.98 45,656 -87.66 24,228 -46.93
15.47 22.19 58.69 31.25 18.51
DTH revenueLocal advertising revenueNational advertising revenue
($) CAGR (%)
RevenueResidential/bulk/smatv subscriber revenue
Pay and Specialty
Licensee Licensee Ultimate Owner Type Year
1494679 Ontario Inc. Odyssey Television Network Inc. Specialty (category B service) 2015
CRTC - FINANCIAL SUMMARY - PAY & SPECIALTY
Acquisition of rights -100.0
Script & conceptFiller Programming + Program Production -32.3
Adjustments - Gain (Loss)
Pre-tax Profit
Canadian Programming Expenses
Depreciation
P.B.I.T.
Interest Expense
Administration and GeneralTotal Expenses
Operating Income
Programming and Production -52.3
TechnicalSales and Promotion
Other revenueTotal Revenue -30.7
Expenses
P.B.I.T. MarginPre-tax MarginCAGR = Compound Annual Growth Rate
Subscribers
Profitability (%)Operating Margin
Total Remuneration ($)Average Staff CountAverage Remuneration ($)
Investment in ProgrammingTotal Canadian Programming -27.5
Canadian Programming/Revenue (%)
Page 89

Undertaking # Service Name
305424608 ESPN Classic
2011 2012 Var % 2013 Var % 2014 Var % 2015 Var %
y1 y2 y3 y4 y5
1,379,319 1,479,548 7.27 1,476,268 -0.22 1,544,927 4.65 1,424,336 -7.81
1,248,115 1,282,688 2.77 1,222,719 -4.68 1,282,243 4.87 614,475 -52.08
0 0 0 0 0
286,654 270,218 -5.73 219,895 -18.62 208,014 -5.40 92,014 -55.77
0 0 0 0 0
2,914,088 3,032,454 4.06 2,918,882 -3.75 3,035,184 3.98 2,130,825 -29.80
433,293 593,983 37.09 651,918 9.75 416,733 -36.08 296,565 -28.84
940,036 747,770 -20.45 699,340 -6.48 701,304 0.28 642,665 -8.36
220,720 227,075 2.88 219,226 -3.46 205,222 -6.39 179,638 -12.47
615,011 629,150 2.30 639,572 1.66 653,369 2.16 666,456 2.00
2,209,060 2,197,978 -0.50 2,210,056 0.55 1,976,628 -10.56 1,785,324 -9.68
705,028 834,476 708,826 1,058,556 345,501
0 0 0 0 0
705,028 834,476 708,826 1,058,556 345,501
0 0 0 0 0
0 0 0 0 0
705,028 834,476 708,826 1,058,556 345,501
33,862 2,615 -92.28 0 -100.00 0 0
0 0 0 0 0
171,794 377,722 119.87 441,443 16.87 412,550 -6.55 291,618 -29.31
0 0 0 0 0
205,656 380,337 84.94 441,443 16.07 412,550 -6.55 291,618 -29.31
7.06 12.54 15.12 13.59 13.69
143,118 142,118 -0.70 134,496 -5.36 152,047 13.05 51,373 -66.21
2 2 0.00 2 0.00 2 0.00 1 -50.00
71,559 71,059 -0.70 67,248 -5.36 76,024 13.05 51,373 -32.42
1,092,322 1,127,561 3.23 1,028,723 -8.77 955,903 -7.08 556,649 -41.77
24.2 27.5 24.3 34.9 16.2
24.2 27.5 24.3 34.9 16.2
24.2 27.5 24.3 34.9 16.2
Pay and Specialty
Licensee Licensee Ultimate Owner Type Year
The Sports Network Inc. BCE Inc. Specialty (category B service) 2015
CRTC - FINANCIAL SUMMARY - PAY & SPECIALTY
Depreciation
P.B.I.T.
Interest Expense
Administration and General 2.0
Total Expenses -5.2
Operating Income
Programming and Production -9.0
Technical -9.1
Sales and Promotion -5.0
Other revenueTotal Revenue -7.5
Expenses
DTH revenue -16.2
Local advertising revenueNational advertising revenue -24.7
($) CAGR (%)
RevenueResidential/bulk/smatv subscriber revenue 0.8
P.B.I.T. MarginPre-tax MarginCAGR = Compound Annual Growth Rate
Subscribers -15.5
Profitability (%)Operating Margin
Total Remuneration ($) -22.6
Average Staff CountAverage Remuneration ($) -8.0
Investment in ProgrammingTotal Canadian Programming 9.1
Canadian Programming/Revenue (%)
Acquisition of rights -100.0
Script & conceptFiller Programming + Program Production 14.1
Adjustments - Gain (Loss)
Pre-tax Profit
Canadian Programming Expenses
Page 90

Undertaking # Service Name
535422000 EuroWorld SPORT (formerly RCS
Television)
2011 2012 Var % 2013 Var % 2014 Var % 2015 Var %
y1 y2 y3 y4 y5
137,580 55,577 -59.60 46,404 -16.51 53,846 16.04 20,649 -61.65
33,444 38,186 14.18 80,693 111.32 80,937 0.30 14,000 -82.70
4,000 4,000 0.00 4,000 0.00 4,000 0.00 4,000 0.00
0 0 0 0 0
0 0 0 0 0
0 0 0 0 0
4,000 4,000 0.00 4,000 0.00 4,000 0.00 4,000 0.00
2.91 7.20 8.62 7.43 19.37
CRTC - FINANCIAL SUMMARY - PAY & SPECIALTY
Programming and Production -19.6
TechnicalSales and Promotion
Other revenueTotal Revenue -37.8
Expenses
DTH revenueLocal advertising revenueNational advertising revenue
($) CAGR (%)
RevenueResidential/bulk/smatv subscriber revenue
Pay and Specialty
Licensee Licensee Ultimate Owner Type Year
Telelatino Network Inc. Corus Entertainment Inc. Specialty (category B service) 2015
Total Remuneration ($)Average Staff CountAverage Remuneration ($)
Investment in ProgrammingTotal Canadian Programming 0.0
Canadian Programming/Revenue (%)
Acquisition of rights 0.0
Script & conceptFiller Programming + Program Production
Adjustments - Gain (Loss)
Pre-tax Profit
Canadian Programming Expenses
Depreciation
P.B.I.T.
Interest Expense
Administration and GeneralTotal Expenses
Operating Income
P.B.I.T. MarginPre-tax MarginCAGR = Compound Annual Growth Rate
Subscribers
Profitability (%)Operating Margin
Page 91

Undertaking # Service Name
205421548 Évasion (formerly Canal Évasion)
2011 2012 Var % 2013 Var % 2014 Var % 2015 Var %
y1 y2 y3 y4 y5
6,618,989 6,727,436 1.64 6,475,004 -3.75 6,740,789 4.10 6,015,801 -10.76
2,061,083 2,063,547 0.12 2,072,477 0.43 2,105,845 1.61 2,437,249 15.74
0 0 0 0 0
3,891,540 3,864,539 -0.69 3,668,311 -5.08 2,552,099 -30.43 2,727,428 6.87
35 -158 -551.43 -500 216.46 42 -108.40 75,391 >999±
12,571,647 12,655,364 0.67 12,215,292 -3.48 11,398,775 -6.68 11,255,869 -1.25
7,193,835 7,572,670 5.27 7,138,997 -5.73 7,218,602 1.12 6,942,022 -3.83
742,629 813,561 9.55 715,697 -12.03 679,621 -5.04 1,146,309 68.67
1,637,115 1,552,975 -5.14 1,482,194 -4.56 1,259,787 -15.01 1,124,333 -10.75
1,845,943 1,751,461 -5.12 1,751,087 -0.02 1,461,552 -16.53 1,291,621 -11.63
11,419,522 11,690,667 2.37 11,087,975 -5.16 10,619,562 -4.22 10,504,285 -1.09
1,152,125 964,697 1,127,317 779,213 751,584
182,091 127,990 -29.71 77,021 -39.82 34,917 -54.67 16,897 -51.61
970,034 836,707 1,050,296 744,296 734,687
2,569 7,233 181.55 4,009 -44.57 7,779 94.04 6,764 -13.05
70,888 98,335 38.72 178,242 81.26 202,509 13.61 193,646 -4.38
1,038,353 927,809 1,224,529 939,026 921,569
4,118,786 4,048,050 -1.72 3,997,693 -1.24 4,625,795 15.71 4,447,679 -3.85
0 140,000 29,648 -78.82 1,002 -96.62 40 -96.01
1,328,888 1,626,465 22.39 1,593,305 -2.04 1,165,450 -26.85 873,728 -25.03
0 0 0 0 0
5,447,674 5,814,515 6.73 5,620,646 -3.33 5,792,247 3.05 5,321,447 -8.13
43.33 45.95 46.01 50.81 47.28
1,598,790 1,473,160 -7.86 1,454,275 -1.28 1,232,909 -15.22 1,211,729 -1.72
16.5 16.17 -2.00 15.75 -2.60 13.13 -16.63 12.03 -8.38
96,896 91,105 -5.98 92,335 1.35 93,900 1.70 100,726 7.27
2,072,442 2,050,587 -1.05 2,031,946 -0.91 2,013,886 -0.89 1,911,663 -5.08
9.2 7.6 9.2 6.8 6.7
7.7 6.6 8.6 6.5 6.5
8.3 7.3 10.0 8.2 8.2
Pay and Specialty
Licensee Licensee Ultimate Owner Type Year
Canal Évasion inc. Groupe Serdy inc. Specialty (category A service) 2015
CRTC - FINANCIAL SUMMARY - PAY & SPECIALTY
Depreciation -44.8
P.B.I.T.
Interest Expense
Administration and General -8.5
Total Expenses -2.1
Operating Income
Programming and Production -0.9
Technical 11.5
Sales and Promotion -9.0
Other revenue 581.3
Total Revenue -2.7
Expenses
DTH revenue 4.3
Local advertising revenueNational advertising revenue -8.5
($) CAGR (%)
RevenueResidential/bulk/smatv subscriber revenue -2.4
P.B.I.T. MarginPre-tax MarginCAGR = Compound Annual Growth Rate
Subscribers -2.0
Profitability (%)Operating Margin
Total Remuneration ($) -6.7
Average Staff CountAverage Remuneration ($) 1.0
Investment in ProgrammingTotal Canadian Programming -0.6
Canadian Programming/Revenue (%)
Acquisition of rights 1.9
Script & conceptFiller Programming + Program Production -10.0
Adjustments - Gain (Loss)
Pre-tax Profit
Canadian Programming Expenses
Page 92

Undertaking # Service Name
535426234 Execulink Telecom Inc., Thedford
2011 2012 Var % 2013 Var % 2014 Var % 2015 Var %
y1 y2 y3 y4
56,304 15,140 -73.11 0 -100.00 1,779,799 -100.00
0 0 0 0
0 0 0 0
0 0 0 0
0 0 0 0
56,304 15,140 -73.11 0 -100.00 1,779,799 -100.00
0 0 0 0
0 0 0 0
0 0 0 0
0 0 0 0
0 0 0 0
56,304 15,140 0 1,779,799
0 0 0 0
56,304 15,140 0 1,779,799
0 0 0 0
0 0 0 0
56,304 15,140 0 1,779,799
0 7,570 0 -100.00 0
0 0 0 0
0 0 0 0
0 0 0 0
0 7,570 0 -100.00 0
0.00 50.00 0.00
0 0 0 0
0 0 0 0
100.0 100.0 100.0
100.0 100.0 100.0
100.0 100.0 100.0
CRTC - FINANCIAL SUMMARY - PAY & SPECIALTY
Programming and ProductionTechnicalSales and Promotion
Other revenueTotal Revenue
Expenses
DTH revenueLocal advertising revenueNational advertising revenue
($) CAGR (%)
RevenueResidential/bulk/smatv subscriber revenue
Pay and Specialty
Licensee Licensee Ultimate Owner Type Year
Execulink Telecom Inc. Execulink Telecom Inc. Video-on-Demand 2014
Total Remuneration ($)Average Staff CountAverage Remuneration ($)
Investment in ProgrammingTotal Canadian Programming
Canadian Programming/Revenue (%)
Acquisition of rightsScript & conceptFiller Programming + Program Production
Adjustments - Gain (Loss)
Pre-tax Profit
Canadian Programming Expenses
Depreciation
P.B.I.T.
Interest Expense
Administration and GeneralTotal Expenses
Operating Income
P.B.I.T. MarginPre-tax MarginCAGR = Compound Annual Growth Rate
Subscribers
Profitability (%)Operating Margin
Page 93

Undertaking # Service Name
535435714 Fairchild Television II
2011 2012 Var % 2013 Var % 2014 Var % 2015 Var %
y3 y4 y5
24,489 967,709 >999± 1,397,646 44.43
56,184 272,994 385.89 436,990 60.07
0 0 0
0 0 0
0 0 0
0 0 0
0 0 0
0.00 0.00 0.00
DTH revenueLocal advertising revenueNational advertising revenue
($) CAGR (%)
RevenueResidential/bulk/smatv subscriber revenue
Pay and Specialty
Licensee Licensee Ultimate Owner Type Year
Fairchild Television Ltd. Fairchild Property Group Ltd. Specialty (category B service) 2015
CRTC - FINANCIAL SUMMARY - PAY & SPECIALTY
Acquisition of rightsScript & conceptFiller Programming + Program Production
Adjustments - Gain (Loss)
Pre-tax Profit
Canadian Programming Expenses
Depreciation
P.B.I.T.
Interest Expense
Administration and GeneralTotal Expenses
Operating Income
Programming and ProductionTechnicalSales and Promotion
Other revenueTotal Revenue
Expenses
P.B.I.T. MarginPre-tax MarginCAGR = Compound Annual Growth Rate
Subscribers
Profitability (%)Operating Margin
Total Remuneration ($)Average Staff CountAverage Remuneration ($)
Investment in ProgrammingTotal Canadian Programming
Canadian Programming/Revenue (%)
Page 94

Undertaking # Service Name
314600560 Fairchild TV
2011 2012 Var % 2013 Var % 2014 Var % 2015 Var %
y1 y2 y3 y4 y5
11,250,287 11,201,075 -0.44 10,934,901 -2.38 10,574,431 -3.30 10,091,725 -4.56
3,491,139 3,299,153 -5.50 2,959,812 -10.29 2,569,445 -13.19 2,436,613 -5.17
8,132,595 8,251,555 1.46 7,291,779 -11.63 6,806,713 -6.65 6,670,968 -1.99
4,452,062 3,900,030 -12.40 3,208,949 -17.72 2,387,660 -25.59 2,348,918 -1.62
1,113,531 1,192,678 7.11 834,130 -30.06 434,058 -47.96 755,755 74.11
28,439,614 27,844,491 -2.09 25,229,571 -9.39 22,772,307 -9.74 22,303,979 -2.06
13,198,783 13,606,082 3.09 13,067,949 -3.96 13,159,551 0.70 13,280,872 0.92
2,559,308 2,138,852 -16.43 2,299,435 7.51 2,114,460 -8.04 1,823,531 -13.76
2,835,200 2,839,845 0.16 2,614,263 -7.94 2,391,546 -8.52 2,354,498 -1.55
4,332,293 4,306,520 -0.59 3,512,809 -18.43 2,987,319 -14.96 3,389,738 13.47
22,925,584 22,891,299 -0.15 21,494,456 -6.10 20,652,876 -3.92 20,848,639 0.95
5,514,030 4,953,192 3,735,115 2,119,431 1,455,340
378,301 305,937 -19.13 386,177 26.23 463,586 20.04 517,685 11.67
5,135,729 4,647,255 3,348,938 1,655,845 937,655
74,404 57,600 -22.58 40,046 -30.48 15,675 -60.86 984 -93.72
0 0 0 0 0
5,061,325 4,589,655 3,308,892 1,640,170 936,671
257,018 260,445 1.33 252,529 -3.04 387,190 53.32 300,217 -22.46
0 0 0 0 0
8,079,200 8,506,721 5.29 8,540,579 0.40 8,394,667 -1.71 8,312,795 -0.98
0 0 0 0 0
8,336,218 8,767,166 5.17 8,793,108 0.30 8,781,857 -0.13 8,613,012 -1.92
29.31 31.49 34.85 38.56 38.62
9,873,288 10,483,017 6.18 10,510,771 0.26 9,091,554 -13.50 9,663,746 6.29
337 335 -0.59 343 2.39 325 -5.25 313 -3.69
29,298 31,293 6.81 30,644 -2.07 27,974 -8.71 30,875 10.37
366,025 351,378 -4.00 333,173 -5.18 318,368 -4.44 294,573 -7.47
19.4 17.8 14.8 9.3 6.5
18.1 16.7 13.3 7.3 4.2
17.8 16.5 13.1 7.2 4.2
Pay and Specialty
Licensee Licensee Ultimate Owner Type Year
Fairchild Television Ltd. Fairchild Property Group Ltd. Specialty (category A service) 2015
CRTC - FINANCIAL SUMMARY - PAY & SPECIALTY
Depreciation 8.2
P.B.I.T.
Interest Expense
Administration and General -6.0
Total Expenses -2.4
Operating Income
Programming and Production 0.2
Technical -8.1
Sales and Promotion -4.5
Other revenue -9.2
Total Revenue -5.9
Expenses
DTH revenue -8.6
Local advertising revenue -4.8
National advertising revenue -14.8
($) CAGR (%)
RevenueResidential/bulk/smatv subscriber revenue -2.7
P.B.I.T. MarginPre-tax MarginCAGR = Compound Annual Growth Rate
Subscribers -5.3
Profitability (%)Operating Margin
Total Remuneration ($) -0.5
Average Staff CountAverage Remuneration ($) 1.3
Investment in ProgrammingTotal Canadian Programming 0.8
Canadian Programming/Revenue (%)
Acquisition of rights 4.0
Script & conceptFiller Programming + Program Production 0.7
Adjustments - Gain (Loss)
Pre-tax Profit
Canadian Programming Expenses
Page 95

Undertaking # Service Name
314600859 Family Channel (formerly Family)
2011 2012 Var % 2013 Var % 2014 Var % 2015 Var %
y1 y2 y3 y4 y5
46,947,540 47,452,922 1.08 47,932,574 1.01 46,170,270 -3.68 43,561,376 -5.65
15,038,471 14,290,462 -4.97 14,029,991 -1.82 15,197,925 8.32 16,125,135 6.10
0 0 0 0 0
0 0 0 0 0
1,293,980 2,854,917 120.63 5,051,494 76.94 9,652,066 91.07 12,002,456 24.35
63,279,991 64,598,301 2.08 67,014,059 3.74 71,020,261 5.98 71,688,967 0.94
24,593,721 26,063,669 5.98 27,885,125 6.99 27,262,531 -2.23 27,306,101 0.16
1,227,477 1,073,370 -12.55 1,184,063 10.31 1,506,095 27.20 1,492,516 -0.90
13,089,849 12,504,865 -4.47 13,921,315 11.33 14,800,617 6.32 15,274,560 3.20
3,934,461 3,832,711 -2.59 3,839,543 0.18 3,033,625 -20.99 2,889,194 -4.76
42,845,508 43,474,615 1.47 46,830,046 7.72 46,602,868 -0.49 46,962,371 0.77
20,434,483 21,123,686 20,184,013 24,417,393 24,726,596
164,689 280,334 70.22 279,274 -0.38 220,302 -21.12 320,711 45.58
20,269,794 20,843,352 19,904,739 24,197,091 24,405,885
4,720,460 4,691,500 -0.61 3,894,930 -16.98 0 -100.00 858,473
16,248,683 15,638,451 -3.76 12,957,566 -17.14 0 -100.00 -16,076,922
31,798,017 31,790,303 28,967,375 24,197,091 7,470,490
7,467,655 8,367,967 12.06 8,962,558 7.11 8,860,415 -1.14 8,928,530 0.77
948,534 812,755 -14.31 1,033,139 27.12 352,623 -65.87 127,487 -63.85
1,348,701 1,567,622 16.23 1,502,206 -4.17 2,112,862 40.65 1,852,089 -12.34
437,200 412,480 -5.65 91,284 -77.87 3,321 -96.36 0 -100.00
10,202,090 11,160,824 9.40 11,589,187 3.84 11,329,221 -2.24 10,908,106 -3.72
16.12 17.28 17.29 15.95 15.22
3,675,787 5,065,565 37.81 4,737,204 -6.48 5,626,406 18.77 6,147,185 9.26
48 44 -8.33 66 50.00 66 0.00 65 -1.52
76,579 115,126 50.34 71,776 -37.65 85,249 18.77 94,572 10.94
5,936,794 5,753,571 -3.09 5,726,126 -0.48 5,467,587 -4.52 5,152,095 -5.77
32.3 32.7 30.1 34.4 34.5
32.0 32.3 29.7 34.1 34.0
50.2 49.2 43.2 34.1 10.4
CRTC - FINANCIAL SUMMARY - PAY & SPECIALTY
Programming and Production 2.7
Technical 5.0
Sales and Promotion 3.9
Other revenue 74.5
Total Revenue 3.2
Expenses
DTH revenue 1.8
Local advertising revenueNational advertising revenue
($) CAGR (%)
RevenueResidential/bulk/smatv subscriber revenue -1.9
Pay and Specialty
Licensee Licensee Ultimate Owner Type Year
DHX Television Ltd. DHX Media Ltd. Pay-TV (category A service) 2015
Total Remuneration ($) 13.7
Average Staff CountAverage Remuneration ($) 5.4
Investment in Programming -100.0
Total Canadian Programming 1.7
Canadian Programming/Revenue (%)
Acquisition of rights 4.6
Script & concept -39.5
Filler Programming + Program Production 8.3
Adjustments - Gain (Loss)
Pre-tax Profit
Canadian Programming Expenses
Depreciation 18.1
P.B.I.T.
Interest Expense
Administration and General -7.4
Total Expenses 2.3
Operating Income
P.B.I.T. MarginPre-tax MarginCAGR = Compound Annual Growth Rate
Subscribers -3.5
Profitability (%)Operating Margin
Page 96

Undertaking # Service Name
535428214 Family CHRGD (formerly Disney XD)
2011 2012 Var % 2013 Var % 2014 Var % 2015 Var %
y1 y2 y3 y4 y5
175,542 1,692,453 864.13 6,533,310 286.03 6,817,028 4.34 6,868,342 0.75
139,652 855,095 512.30 1,935,889 126.39 2,021,501 4.42 2,239,887 10.80
9,663 46,842 384.76 103,424 120.79 130,687 26.36 287,501 119.99
0 0 0 0 0
4,397 180,461 >999± 217,757 20.67 273,954 25.81 253,947 -7.30
0 0 0 0 0
14,060 227,303 >999± 321,181 41.30 404,641 25.99 541,448 33.81
8.01 13.43 4.92 5.94 7.88
DTH revenueLocal advertising revenueNational advertising revenue
($) CAGR (%)
RevenueResidential/bulk/smatv subscriber revenue
Pay and Specialty
Licensee Licensee Ultimate Owner Type Year
DHX Television Ltd. DHX Media Ltd. Specialty (category B service) 2015
CRTC - FINANCIAL SUMMARY - PAY & SPECIALTY
Acquisition of rights 133.6
Script & conceptFiller Programming + Program Production 175.7
Adjustments - Gain (Loss)
Pre-tax Profit
Canadian Programming Expenses
Depreciation
P.B.I.T.
Interest Expense
Administration and GeneralTotal Expenses
Operating Income
Programming and Production 100.1
TechnicalSales and Promotion
Other revenueTotal Revenue 150.1
Expenses
P.B.I.T. MarginPre-tax MarginCAGR = Compound Annual Growth Rate
Subscribers
Profitability (%)Operating Margin
Total Remuneration ($)Average Staff CountAverage Remuneration ($)
Investment in ProgrammingTotal Canadian Programming 149.1
Canadian Programming/Revenue (%)
Page 97
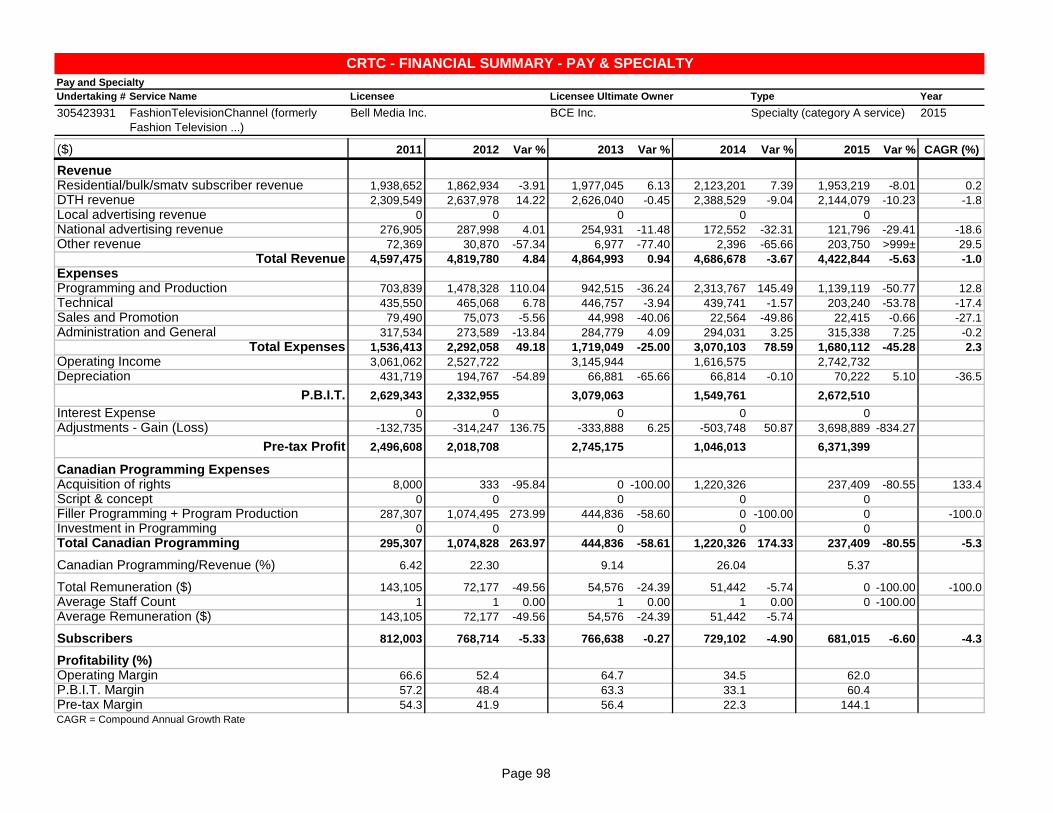
Undertaking # Service Name
305423931 FashionTelevisionChannel (formerly
Fashion Television ...)
2011 2012 Var % 2013 Var % 2014 Var % 2015 Var %
y1 y2 y3 y4 y5
1,938,652 1,862,934 -3.91 1,977,045 6.13 2,123,201 7.39 1,953,219 -8.01
2,309,549 2,637,978 14.22 2,626,040 -0.45 2,388,529 -9.04 2,144,079 -10.23
0 0 0 0 0
276,905 287,998 4.01 254,931 -11.48 172,552 -32.31 121,796 -29.41
72,369 30,870 -57.34 6,977 -77.40 2,396 -65.66 203,750 >999±
4,597,475 4,819,780 4.84 4,864,993 0.94 4,686,678 -3.67 4,422,844 -5.63
703,839 1,478,328 110.04 942,515 -36.24 2,313,767 145.49 1,139,119 -50.77
435,550 465,068 6.78 446,757 -3.94 439,741 -1.57 203,240 -53.78
79,490 75,073 -5.56 44,998 -40.06 22,564 -49.86 22,415 -0.66
317,534 273,589 -13.84 284,779 4.09 294,031 3.25 315,338 7.25
1,536,413 2,292,058 49.18 1,719,049 -25.00 3,070,103 78.59 1,680,112 -45.28
3,061,062 2,527,722 3,145,944 1,616,575 2,742,732
431,719 194,767 -54.89 66,881 -65.66 66,814 -0.10 70,222 5.10
2,629,343 2,332,955 3,079,063 1,549,761 2,672,510
0 0 0 0 0
-132,735 -314,247 136.75 -333,888 6.25 -503,748 50.87 3,698,889 -834.27
2,496,608 2,018,708 2,745,175 1,046,013 6,371,399
8,000 333 -95.84 0 -100.00 1,220,326 237,409 -80.55
0 0 0 0 0
287,307 1,074,495 273.99 444,836 -58.60 0 -100.00 0
0 0 0 0 0
295,307 1,074,828 263.97 444,836 -58.61 1,220,326 174.33 237,409 -80.55
6.42 22.30 9.14 26.04 5.37
143,105 72,177 -49.56 54,576 -24.39 51,442 -5.74 0 -100.00
1 1 0.00 1 0.00 1 0.00 0 -100.00
143,105 72,177 -49.56 54,576 -24.39 51,442 -5.74
812,003 768,714 -5.33 766,638 -0.27 729,102 -4.90 681,015 -6.60
66.6 52.4 64.7 34.5 62.0
57.2 48.4 63.3 33.1 60.4
54.3 41.9 56.4 22.3 144.1
Pay and Specialty
Licensee Licensee Ultimate Owner Type Year
Bell Media Inc. BCE Inc. Specialty (category A service) 2015
CRTC - FINANCIAL SUMMARY - PAY & SPECIALTY
Depreciation -36.5
P.B.I.T.
Interest Expense
Administration and General -0.2
Total Expenses 2.3
Operating Income
Programming and Production 12.8
Technical -17.4
Sales and Promotion -27.1
Other revenue 29.5
Total Revenue -1.0
Expenses
DTH revenue -1.8
Local advertising revenueNational advertising revenue -18.6
($) CAGR (%)
RevenueResidential/bulk/smatv subscriber revenue 0.2
P.B.I.T. MarginPre-tax MarginCAGR = Compound Annual Growth Rate
Subscribers -4.3
Profitability (%)Operating Margin
Total Remuneration ($) -100.0
Average Staff CountAverage Remuneration ($)
Investment in ProgrammingTotal Canadian Programming -5.3
Canadian Programming/Revenue (%)
Acquisition of rights 133.4
Script & conceptFiller Programming + Program Production -100.0
Adjustments - Gain (Loss)
Pre-tax Profit
Canadian Programming Expenses
Page 98
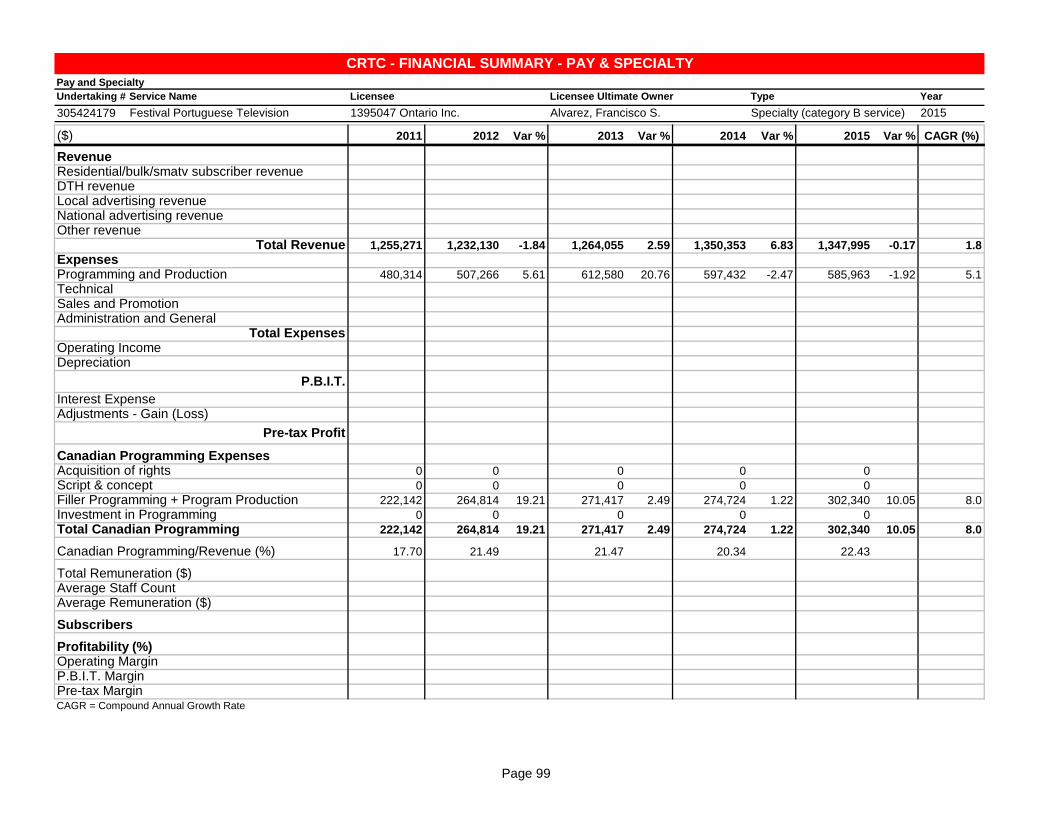
Undertaking # Service Name
305424179 Festival Portuguese Television
2011 2012 Var % 2013 Var % 2014 Var % 2015 Var %
y1 y2 y3 y4 y5
1,255,271 1,232,130 -1.84 1,264,055 2.59 1,350,353 6.83 1,347,995 -0.17
480,314 507,266 5.61 612,580 20.76 597,432 -2.47 585,963 -1.92
0 0 0 0 0
0 0 0 0 0
222,142 264,814 19.21 271,417 2.49 274,724 1.22 302,340 10.05
0 0 0 0 0
222,142 264,814 19.21 271,417 2.49 274,724 1.22 302,340 10.05
17.70 21.49 21.47 20.34 22.43
CRTC - FINANCIAL SUMMARY - PAY & SPECIALTY
Programming and Production 5.1
TechnicalSales and Promotion
Other revenueTotal Revenue 1.8
Expenses
DTH revenueLocal advertising revenueNational advertising revenue
($) CAGR (%)
RevenueResidential/bulk/smatv subscriber revenue
Pay and Specialty
Licensee Licensee Ultimate Owner Type Year
1395047 Ontario Inc. Alvarez, Francisco S. Specialty (category B service) 2015
Total Remuneration ($)Average Staff CountAverage Remuneration ($)
Investment in ProgrammingTotal Canadian Programming 8.0
Canadian Programming/Revenue (%)
Acquisition of rightsScript & conceptFiller Programming + Program Production 8.0
Adjustments - Gain (Loss)
Pre-tax Profit
Canadian Programming Expenses
Depreciation
P.B.I.T.
Interest Expense
Administration and GeneralTotal Expenses
Operating Income
P.B.I.T. MarginPre-tax MarginCAGR = Compound Annual Growth Rate
Subscribers
Profitability (%)Operating Margin
Page 99

Undertaking # Service Name
535418348 Fight Network
2011 2012 Var % 2013 Var % 2014 Var % 2015 Var %
y1 y2 y3 y4 y5
3,095,736 3,590,011 15.97 3,446,272 -4.00 4,288,248 24.43 4,555,550 6.23
981,012 1,472,789 50.13 1,453,219 -1.33 2,266,911 55.99 3,364,402 48.41
422,349 260,104 -38.41 325,743 25.24 504,413 54.85 871,938 72.86
0 0 0 0 0
558,663 1,039,283 86.03 1,127,476 8.49 1,762,498 56.32 1,911,172 8.44
0 0 0 0 0
981,012 1,299,387 32.45 1,453,219 11.84 2,266,911 55.99 2,783,110 22.77
31.69 36.19 42.17 52.86 61.09
DTH revenueLocal advertising revenueNational advertising revenue
($) CAGR (%)
RevenueResidential/bulk/smatv subscriber revenue
Pay and Specialty
Licensee Licensee Ultimate Owner Type Year
Fight Media Inc. Sygnus Corp. Specialty (category B service) 2015
CRTC - FINANCIAL SUMMARY - PAY & SPECIALTY
Acquisition of rights 19.9
Script & conceptFiller Programming + Program Production 36.0
Adjustments - Gain (Loss)
Pre-tax Profit
Canadian Programming Expenses
Depreciation
P.B.I.T.
Interest Expense
Administration and GeneralTotal Expenses
Operating Income
Programming and Production 36.1
TechnicalSales and Promotion
Other revenueTotal Revenue 10.1
Expenses
P.B.I.T. MarginPre-tax MarginCAGR = Compound Annual Growth Rate
Subscribers
Profitability (%)Operating Margin
Total Remuneration ($)Average Staff CountAverage Remuneration ($)
Investment in ProgrammingTotal Canadian Programming 29.8
Canadian Programming/Revenue (%)
Page 100

Undertaking # Service Name
535435540 FNTSY Sports Network (formerly The
League–Fantasy Sports TV)
2011 2012 Var % 2013 Var % 2014 Var % 2015 Var %
y3 y4 y5
0 17,986 103,478 475.33
0 739,817 1,119,976 51.39
0 57,317 74,221 29.49
0 0 0
0 495,238 872,573 76.19
0 0 0
0 552,555 946,794 71.35
>999± 914.97
CRTC - FINANCIAL SUMMARY - PAY & SPECIALTY
Programming and ProductionTechnicalSales and Promotion
Other revenueTotal Revenue
Expenses
DTH revenueLocal advertising revenueNational advertising revenue
($) CAGR (%)
RevenueResidential/bulk/smatv subscriber revenue
Pay and Specialty
Licensee Licensee Ultimate Owner Type Year
Fight Media Inc. Sygnus Corp. Specialty (category B service) 2015
Total Remuneration ($)Average Staff CountAverage Remuneration ($)
Investment in ProgrammingTotal Canadian Programming
Canadian Programming/Revenue (%)
Acquisition of rightsScript & conceptFiller Programming + Program Production
Adjustments - Gain (Loss)
Pre-tax Profit
Canadian Programming Expenses
Depreciation
P.B.I.T.
Interest Expense
Administration and GeneralTotal Expenses
Operating Income
P.B.I.T. MarginPre-tax MarginCAGR = Compound Annual Growth Rate
Subscribers
Profitability (%)Operating Margin
Page 101

Undertaking # Service Name
305423329 Food Network Canada
2011 2012 Var % 2013 Var % 2014 Var % 2015 Var %
y1 y2 y3 y4 y5
7,843,466 9,295,403 18.51 11,120,018 19.63 12,085,532 8.68 12,795,299 5.87
2,968,551 3,058,305 3.02 3,799,301 24.23 4,354,575 14.62 4,552,395 4.54
0 0 0 0 0
41,543,723 47,399,014 14.09 51,438,544 8.52 52,666,823 2.39 49,782,982 -5.48
0 0 0 0 0
52,355,740 59,752,722 14.13 66,357,863 11.05 69,106,930 4.14 67,130,676 -2.86
22,327,832 23,719,101 6.23 25,383,819 7.02 25,129,033 -1.00 28,126,806 11.93
703,857 701,293 -0.36 677,103 -3.45 1,044,606 54.28 1,343,520 28.61
2,491,432 2,076,056 -16.67 1,582,132 -23.79 1,880,423 18.85 2,325,803 23.69
4,024,146 3,484,352 -13.41 3,221,817 -7.53 3,679,336 14.20 5,313,473 44.41
29,547,267 29,980,802 1.47 30,864,871 2.95 31,733,398 2.81 37,109,602 16.94
22,808,473 29,771,920 35,492,992 37,373,532 30,021,074
167,370 257,155 53.64 172,123 -33.07 189,572 10.14 98,098 -48.25
22,641,103 29,514,765 35,320,869 37,183,960 29,922,976
-27,618 3,318 -112.01 18,863 468.51 -28,182 -249.40 -29,744 5.54
0 0 0 0 0
22,668,721 29,511,447 35,302,006 37,212,142 29,952,720
16,862,084 18,219,555 8.05 19,934,970 9.42 19,805,637 -0.65 20,735,876 4.70
308,458 114,474 -62.89 52,500 -54.14 100,000 90.48 73,000 -27.00
1,754,697 1,827,801 4.17 1,938,155 6.04 1,563,403 -19.34 1,321,468 -15.47
0 0 0 0 0
18,925,239 20,161,830 6.53 21,925,625 8.75 21,469,040 -2.08 22,130,344 3.08
36.15 33.74 33.04 31.07 32.97
2,040,122 2,974,490 45.80 3,006,310 1.07 3,226,075 7.31 3,334,880 3.37
27 35 29.63 34 -2.86 36 5.88 36 0.00
75,560 84,985 12.47 88,421 4.04 89,613 1.35 92,636 3.37
6,357,703 7,368,691 15.90 7,539,371 2.32 6,201,097 -17.75 6,032,667 -2.72
43.6 49.8 53.5 54.1 44.7
43.2 49.4 53.2 53.8 44.6
43.3 49.4 53.2 53.8 44.6
DTH revenue 11.3
Local advertising revenueNational advertising revenue 4.6
($) CAGR (%)
RevenueResidential/bulk/smatv subscriber revenue 13.0
Pay and Specialty
Licensee Licensee Ultimate Owner Type Year
Food Network Canada Inc. Shaw Communications Inc. Specialty (category A service) 2015
CRTC - FINANCIAL SUMMARY - PAY & SPECIALTY
Acquisition of rights 5.3
Script & concept -30.3
Filler Programming + Program Production -6.8
Adjustments - Gain (Loss)
Pre-tax Profit
Canadian Programming Expenses
Depreciation -12.5
P.B.I.T.
Interest Expense
Administration and General 7.2
Total Expenses 5.9
Operating Income
Programming and Production 5.9
Technical 17.5
Sales and Promotion -1.7
Other revenueTotal Revenue 6.4
Expenses
P.B.I.T. MarginPre-tax MarginCAGR = Compound Annual Growth Rate
Subscribers -1.3
Profitability (%)Operating Margin
Total Remuneration ($) 13.1
Average Staff CountAverage Remuneration ($) 5.2
Investment in ProgrammingTotal Canadian Programming 4.0
Canadian Programming/Revenue (%)
Page 102

Undertaking # Service Name
305426068 Fox Sports World Canada
2011 2012 Var % 2013 Var % 2014 Var % 2015 Var %
y1 y2 y4 y5
2,314,639 1,401,509 -39.45 -100.00 0 0
529,384 325,174 -38.58 -100.00 0 0
0 0 0 0
138,837 80,163 -42.26 -100.00 0 0
439,901 313,228 -28.80 -100.00 0 0
3,422,761 2,120,074 -38.06 -100.00 0 0
3,382,564 2,627,456 -22.32 -100.00 0 0
358,079 530,307 48.10 -100.00 0 0
325,624 59,470 -81.74 -100.00 0 0
511,829 457,129 -10.69 -100.00 0 0
4,578,096 3,674,362 -19.74 -100.00 0 0
-1,155,335 -1,554,288 0 0
0 0 0 0
-1,155,335 -1,554,288 0 0
0 0 0 0
26,097 0 -100.00 0 0
-1,129,238 -1,554,288 0 0
1,813,922 1,071,950 -40.90 -100.00 0 0
0 0 0 0
0 180,593 -100.00 0 0
0 0 0 0
1,813,922 1,252,543 -30.95 -100.00 0 0
53.00 59.08
946,181 588,499 -37.80 -100.00 0 0
21 8 -61.90 -100.00 0 0
45,056 73,562 63.27 -100.00
759,707 0 -100.00 0 0
-33.8 -73.3
-33.8 -73.3
-33.0 -73.3
Pay and Specialty
Licensee Licensee Ultimate Owner Type Year
Fox Sports World Canada
Partnership
Shaw Communications Inc. Specialty (category B service) 2015
CRTC - FINANCIAL SUMMARY - PAY & SPECIALTY
Depreciation
P.B.I.T.
Interest Expense
Administration and General -100.0
Total Expenses -100.0
Operating Income
Programming and Production -100.0
Technical -100.0
Sales and Promotion -100.0
Other revenue -100.0
Total Revenue -100.0
Expenses
DTH revenue -100.0
Local advertising revenueNational advertising revenue -100.0
($) CAGR (%)
RevenueResidential/bulk/smatv subscriber revenue -100.0
P.B.I.T. MarginPre-tax MarginCAGR = Compound Annual Growth Rate
Subscribers -100.0
Profitability (%)Operating Margin
Total Remuneration ($) -100.0
Average Staff CountAverage Remuneration ($)
Investment in ProgrammingTotal Canadian Programming -100.0
Canadian Programming/Revenue (%)
Acquisition of rights -100.0
Script & conceptFiller Programming + Program Production
Adjustments - Gain (Loss)
Pre-tax Profit
Canadian Programming Expenses
Page 103

Undertaking # Service Name
535417639 FTV-Filipino TV (formerly The Mabuhay
Channel/ECG Filipino)
2011 2012 Var % 2013 Var % 2014 Var % 2015 Var %
y1 y2 y3 y4 y5
76,050 668,342 778.82 1,241,032 85.69 2,064,002 66.31 2,140,105 3.69
23,043 294,258 >999± 560,272 90.40 830,668 48.26 750,717 -9.62
1,597 29,611 >999± 59,331 100.37 94,663 59.55 74,066 -21.76
2,130 39,482 >999± 79,108 100.36 126,217 59.55 98,755 -21.76
6,921 128,316 >999± 257,100 100.36 410,206 59.55 320,953 -21.76
0 0 0 0 0
10,648 197,409 >999± 395,539 100.37 631,086 59.55 493,774 -21.76
14.00 29.54 31.87 30.58 23.07
CRTC - FINANCIAL SUMMARY - PAY & SPECIALTY
Programming and Production 138.9
TechnicalSales and Promotion
Other revenueTotal Revenue 130.3
Expenses
DTH revenueLocal advertising revenueNational advertising revenue
($) CAGR (%)
RevenueResidential/bulk/smatv subscriber revenue
Pay and Specialty
Licensee Licensee Ultimate Owner Type Year
Ethnic Channels Group Limited Levin, Slava Specialty (category B service) 2015
Total Remuneration ($)Average Staff CountAverage Remuneration ($)
Investment in ProgrammingTotal Canadian Programming 161.0
Canadian Programming/Revenue (%)
Acquisition of rights 161.0
Script & concept 160.9
Filler Programming + Program Production 161.0
Adjustments - Gain (Loss)
Pre-tax Profit
Canadian Programming Expenses
Depreciation
P.B.I.T.
Interest Expense
Administration and GeneralTotal Expenses
Operating Income
P.B.I.T. MarginPre-tax MarginCAGR = Compound Annual Growth Rate
Subscribers
Profitability (%)Operating Margin
Page 104

Undertaking # Service Name
535432174 FX (formerly FX Canada)
2011 2012 Var % 2013 Var % 2014 Var % 2015 Var %
y2 y3 y4 y5
93,363 6,561,118 >999± 6,916,302 5.41 9,168,200 32.56
2,303,726 0 -100.00 0 0
0 0 0 0
1,375,439 1,925,365 39.98 3,201,044 66.26 5,190,303 62.14
0 0 10,225 4,500 -55.99
3,772,528 8,486,483 124.95 10,127,571 19.34 14,363,003 41.82
4,278,234 7,308,412 70.83 7,818,283 6.98 10,282,823 31.52
211,002 202,015 -4.26 210,198 4.05 215,419 2.48
896,157 874,425 -2.43 157,901 -81.94 240,152 52.09
1,552,738 1,563,417 0.69 1,935,282 23.79 1,940,114 0.25
6,938,131 9,948,269 43.39 10,121,664 1.74 12,678,508 25.26
-3,165,603 -1,461,786 5,907 1,684,495
66,667 100,000 50.00 100,000 0.00 100,000 0.00
-3,232,270 -1,561,786 -94,093 1,584,495
0 7,050 11,488 62.95 0 -100.00
0 0 0 450,608
-3,232,270 -1,568,836 -105,581 2,035,103
394,988 376,074 -4.79 517,827 37.69 662,956 28.03
0 0 0 0
107,783 0 -100.00 0 0
0 0 0 0
502,771 376,074 -25.20 517,827 37.69 662,956 28.03
13.33 4.43 5.11 4.62
1,016,057 1,004,935 -1.09 801,015 -20.29 803,243 0.28
10 10 0.00 8 -20.00 8 0.00
101,606 100,494 -1.09 100,127 -0.36 100,405 0.28
1,459,792 3,910,000 167.85 4,035,000 3.20 4,671,000 15.76
-83.9 -17.2 0.1 11.7
-85.7 -18.4 -0.9 11.0
-85.7 -18.5 -1.0 14.2
DTH revenueLocal advertising revenueNational advertising revenue
($) CAGR (%)
RevenueResidential/bulk/smatv subscriber revenue
Pay and Specialty
Licensee Licensee Ultimate Owner Type Year
8064750 Canada Inc. Rogers Communications Inc. Specialty (category B service) 2015
CRTC - FINANCIAL SUMMARY - PAY & SPECIALTY
Acquisition of rightsScript & conceptFiller Programming + Program Production
Adjustments - Gain (Loss)
Pre-tax Profit
Canadian Programming Expenses
Depreciation
P.B.I.T.
Interest Expense
Administration and GeneralTotal Expenses
Operating Income
Programming and ProductionTechnicalSales and Promotion
Other revenueTotal Revenue
Expenses
P.B.I.T. MarginPre-tax MarginCAGR = Compound Annual Growth Rate
Subscribers
Profitability (%)Operating Margin
Total Remuneration ($)Average Staff CountAverage Remuneration ($)
Investment in ProgrammingTotal Canadian Programming
Canadian Programming/Revenue (%)
Page 105

Undertaking # Service Name
535432190 FXX (Canada) (formerly Ampersand)
2011 2012 Var % 2013 Var % 2014 Var % 2015 Var %
y4 y5
0 3,712,045
0 0
0 0
215,699 812,651 276.75
0 0
215,699 4,524,696 >999±
3,737,371 5,578,036 49.25
0 99,253
18,939 108,730 474.11
277,079 471,970 70.34
4,033,389 6,257,989 55.15
-3,817,690 -1,733,293
0 0
-3,817,690 -1,733,293
0 0
0 0
-3,817,690 -1,733,293
0 345,228
0 0
0 0
0 0
0 345,228
0.00 7.63
12,917 343,285 >999±
0.3 4 >999±
43,057 85,821 99.32
353,000 1,641,000 364.87
>999± -38.3
>999± -38.3
>999± -38.3
Pay and Specialty
Licensee Licensee Ultimate Owner Type Year
8834776 Canada Inc. Rogers Communications Inc. Specialty (category B service) 2015
CRTC - FINANCIAL SUMMARY - PAY & SPECIALTY
Depreciation
P.B.I.T.
Interest Expense
Administration and GeneralTotal Expenses
Operating Income
Programming and ProductionTechnicalSales and Promotion
Other revenueTotal Revenue
Expenses
DTH revenueLocal advertising revenueNational advertising revenue
($) CAGR (%)
RevenueResidential/bulk/smatv subscriber revenue
P.B.I.T. MarginPre-tax MarginCAGR = Compound Annual Growth Rate
Subscribers
Profitability (%)Operating Margin
Total Remuneration ($)Average Staff CountAverage Remuneration ($)
Investment in ProgrammingTotal Canadian Programming
Canadian Programming/Revenue (%)
Acquisition of rightsScript & conceptFiller Programming + Program Production
Adjustments - Gain (Loss)
Pre-tax Profit
Canadian Programming Expenses
Page 106

Undertaking # Service Name
305424020 Fyi (formerly Twist TV)
2011 2012 Var % 2013 Var % 2014 Var % 2015 Var %
y1 y2 y3 y4 y5
2,162,600 3,112,766 43.94 3,454,359 10.97 3,519,931 1.90 3,731,251 6.00
2,223,989 2,002,985 -9.94 1,807,164 -9.78 1,804,910 -0.12 1,840,292 1.96
0 0 0 0 0
1,953,502 1,864,550 -4.55 1,761,425 -5.53 1,677,730 -4.75 2,604,722 55.25
0 0 0 0 0
6,340,091 6,980,301 10.10 7,022,948 0.61 7,002,571 -0.29 8,176,265 16.76
1,641,390 2,475,992 50.85 1,888,235 -23.74 2,038,453 7.96 2,449,179 20.15
697,495 675,368 -3.17 657,017 -2.72 597,951 -8.99 594,381 -0.60
633,262 202,177 -68.07 121,434 -39.94 104,531 -13.92 89,702 -14.19
1,105,350 847,679 -23.31 911,929 7.58 1,331,700 46.03 1,739,022 30.59
4,077,497 4,201,216 3.03 3,578,615 -14.82 4,072,635 13.80 4,872,284 19.63
2,262,594 2,779,085 3,444,333 2,929,936 3,303,981
0 1,827 5,481 200.00 5,481 0.00 3,654 -33.33
2,262,594 2,777,258 3,438,852 2,924,455 3,300,327
-298,246 -460,311 54.34 -801,820 74.19 -1,157,838 44.40 -1,358,514 17.33
0 0 0 0 0
2,560,840 3,237,569 4,240,672 4,082,293 4,658,841
153,885 826,240 436.92 497,681 -39.77 499,204 0.31 83,328 -83.31
0 0 0 0 0
350,361 407,519 16.31 307,095 -24.64 336,967 9.73 358,041 6.25
0 0 0 0 0
504,246 1,233,759 144.67 804,776 -34.77 836,171 3.90 441,369 -47.22
7.95 17.67 11.46 11.94 5.40
716,407 985,035 37.50 929,671 -5.62 1,118,292 20.29 1,001,488 -10.44
9 12 33.33 10 -16.67 12 20.00 11 -8.33
79,601 82,086 3.12 92,967 13.26 93,191 0.24 91,044 -2.30
2,099,795 2,157,968 2.77 2,173,082 0.70 2,094,099 -3.63 2,062,738 -1.50
35.7 39.8 49.0 41.8 40.4
35.7 39.8 49.0 41.8 40.4
40.4 46.4 60.4 58.3 57.0
CRTC - FINANCIAL SUMMARY - PAY & SPECIALTY
Programming and Production 10.5
Technical -3.9
Sales and Promotion -38.7
Other revenueTotal Revenue 6.6
Expenses
DTH revenue -4.6
Local advertising revenueNational advertising revenue 7.5
($) CAGR (%)
RevenueResidential/bulk/smatv subscriber revenue 14.6
Pay and Specialty
Licensee Licensee Ultimate Owner Type Year
Discovery Health Channel Canada
ULC
Shaw Communications Inc. Specialty (category A service) 2015
Total Remuneration ($) 8.7
Average Staff CountAverage Remuneration ($) 3.4
Investment in ProgrammingTotal Canadian Programming -3.3
Canadian Programming/Revenue (%)
Acquisition of rights -14.2
Script & conceptFiller Programming + Program Production 0.5
Adjustments - Gain (Loss)
Pre-tax Profit
Canadian Programming Expenses
Depreciation
P.B.I.T.
Interest Expense
Administration and General 12.0
Total Expenses 4.6
Operating Income
P.B.I.T. MarginPre-tax MarginCAGR = Compound Annual Growth Rate
Subscribers -0.4
Profitability (%)Operating Margin
Page 107

Undertaking # Service Name
305423957 G4 (Canada) (fromerly G4techTV)
2011 2012 Var % 2013 Var % 2014 Var % 2015 Var %
y1 y2 y3 y4 y5
3,638,704 4,778,546 31.33 5,448,165 14.01 5,370,988 -1.42 2,692,562 -49.87
4,300,520 4,002,858 -6.92 3,281,063 -18.03 2,998,286 -8.62 1,016,664 -66.09
0 0 0 0 0
1,842,554 1,428,515 -22.47 1,212,109 -15.15 959,159 -20.87 817,839 -14.73
0 0 0 318 0 -100.00
9,781,778 10,209,919 4.38 9,941,337 -2.63 9,328,751 -6.16 4,527,065 -51.47
5,742,881 5,181,506 -9.78 5,182,973 0.03 3,591,064 -30.71 396,042 -88.97
501,779 552,369 10.08 623,067 12.80 599,930 -3.71 585,061 -2.48
530,221 373,877 -29.49 96,169 -74.28 70,075 -27.13 109,169 55.79
960,127 775,716 -19.21 804,857 3.76 609,707 -24.25 1,289,285 111.46
7,735,008 6,883,468 -11.01 6,707,066 -2.56 4,870,776 -27.38 2,379,557 -51.15
2,046,770 3,326,451 3,234,271 4,457,975 2,147,508
146,107 145,806 -0.21 165,549 13.54 192,555 16.31 181,134 -5.93
1,900,663 3,180,645 3,068,722 4,265,420 1,966,374
25,079 30,601 22.02 11,670 -61.86 22,120 89.55 0 -100.00
-39,286 0 -100.00 -2,415,449 0 -100.00 0
1,836,298 3,150,044 641,603 4,243,300 1,966,374
2,960,201 2,457,267 -16.99 3,106,345 26.41 2,949,440 -5.05 131,937 -95.53
0 0 0 0 0
783,402 1,054,090 34.55 1,186,325 12.54 872,878 -26.42 0 -100.00
0 0 0 0 0
3,743,603 3,511,357 -6.20 4,292,670 22.25 3,822,318 -10.96 131,937 -96.55
38.27 34.39 43.18 40.97 2.91
1,892,831 1,516,747 -19.87 1,239,161 -18.30 862,808 -30.37 485,106 -43.78
17 18 5.88 17 -5.56 13 -23.53 7.03 -45.92
111,343 84,264 -24.32 72,892 -13.50 66,370 -8.95 69,005 3.97
2,347,304 2,452,095 4.46 2,350,000 -4.16 2,257,000 -3.96 1,458,000 -35.40
20.9 32.6 32.5 47.8 47.4
19.4 31.2 30.9 45.7 43.4
18.8 30.9 6.5 45.5 43.4
DTH revenue -30.3
Local advertising revenueNational advertising revenue -18.4
($) CAGR (%)
RevenueResidential/bulk/smatv subscriber revenue -7.3
Pay and Specialty
Licensee Licensee Ultimate Owner Type Year
Rogers Media Inc. Rogers Communications Inc. Specialty (category A service) 2015
CRTC - FINANCIAL SUMMARY - PAY & SPECIALTY
Acquisition of rights -54.1
Script & conceptFiller Programming + Program Production -100.0
Adjustments - Gain (Loss)
Pre-tax Profit
Canadian Programming Expenses
Depreciation 5.5
P.B.I.T.
Interest Expense
Administration and General 7.7
Total Expenses -25.5
Operating Income
Programming and Production -48.8
Technical 3.9
Sales and Promotion -32.6
Other revenueTotal Revenue -17.5
Expenses
P.B.I.T. MarginPre-tax MarginCAGR = Compound Annual Growth Rate
Subscribers -11.2
Profitability (%)Operating Margin
Total Remuneration ($) -28.9
Average Staff CountAverage Remuneration ($) -11.3
Investment in ProgrammingTotal Canadian Programming -56.7
Canadian Programming/Revenue (%)
Page 108

Undertaking # Service Name
305428072 GameTV (formerly CGTV Canada)
2011 2012 Var % 2013 Var % 2014 Var % 2015 Var %
y1 y2 y3 y4 y5
831,084 877,256 5.56 1,239,325 41.27 1,695,061 36.77 1,960,228 15.64
422,913 743,916 75.90 1,441,443 93.76 1,844,190 27.94 2,095,268 13.61
60,170 160,199 166.24 194,301 21.29 244,360 25.76 237,398 -2.85
0 0 0 0 0
97,999 44,859 -54.23 71,332 59.01 0 -100.00 0
0 0 0 0 0
158,169 205,058 29.64 265,633 29.54 244,360 -8.01 237,398 -2.85
19.03 23.37 21.43 14.42 12.11
Pay and Specialty
Licensee Licensee Ultimate Owner Type Year
The GameTV Corporation Kilmer Van Nostrand Co. Limited Specialty (category B service) 2015
CRTC - FINANCIAL SUMMARY - PAY & SPECIALTY
Depreciation
P.B.I.T.
Interest Expense
Administration and GeneralTotal Expenses
Operating Income
Programming and Production 49.2
TechnicalSales and Promotion
Other revenueTotal Revenue 23.9
Expenses
DTH revenueLocal advertising revenueNational advertising revenue
($) CAGR (%)
RevenueResidential/bulk/smatv subscriber revenue
P.B.I.T. MarginPre-tax MarginCAGR = Compound Annual Growth Rate
Subscribers
Profitability (%)Operating Margin
Total Remuneration ($)Average Staff CountAverage Remuneration ($)
Investment in ProgrammingTotal Canadian Programming 10.7
Canadian Programming/Revenue (%)
Acquisition of rights 40.9
Script & conceptFiller Programming + Program Production -100.0
Adjustments - Gain (Loss)
Pre-tax Profit
Canadian Programming Expenses
Page 109
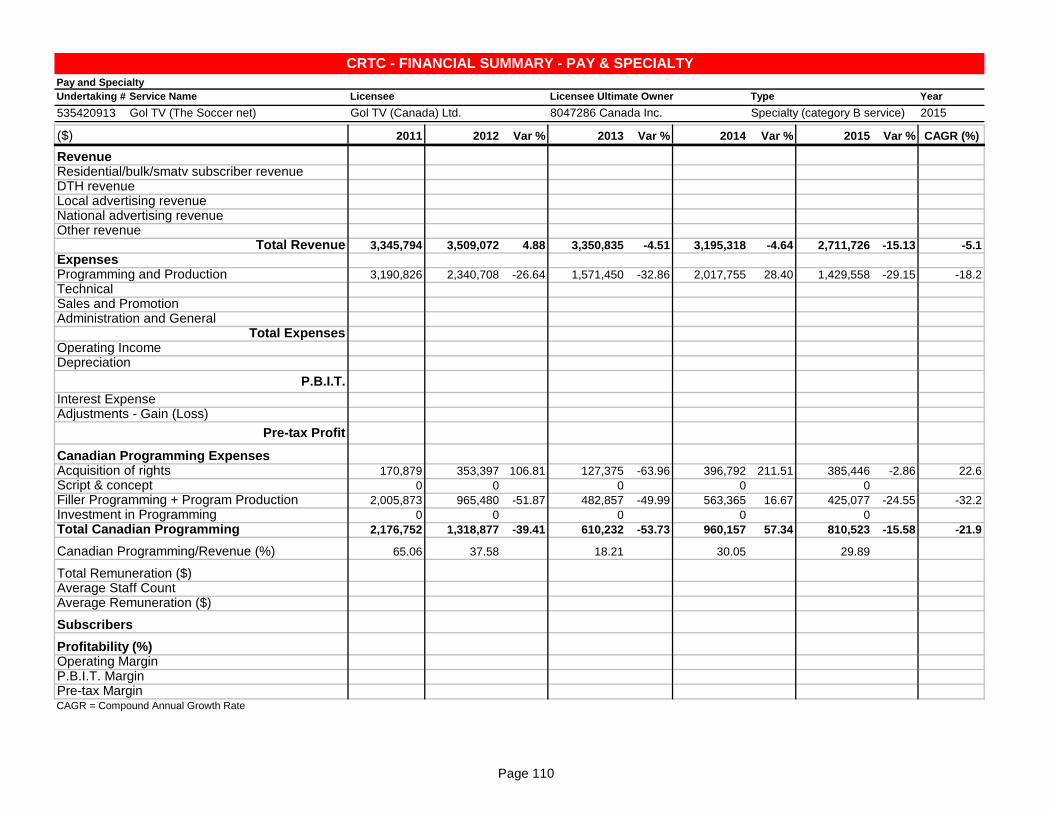
Undertaking # Service Name
535420913 Gol TV (The Soccer net)
2011 2012 Var % 2013 Var % 2014 Var % 2015 Var %
y1 y2 y3 y4 y5
3,345,794 3,509,072 4.88 3,350,835 -4.51 3,195,318 -4.64 2,711,726 -15.13
3,190,826 2,340,708 -26.64 1,571,450 -32.86 2,017,755 28.40 1,429,558 -29.15
170,879 353,397 106.81 127,375 -63.96 396,792 211.51 385,446 -2.86
0 0 0 0 0
2,005,873 965,480 -51.87 482,857 -49.99 563,365 16.67 425,077 -24.55
0 0 0 0 0
2,176,752 1,318,877 -39.41 610,232 -53.73 960,157 57.34 810,523 -15.58
65.06 37.58 18.21 30.05 29.89
CRTC - FINANCIAL SUMMARY - PAY & SPECIALTY
Programming and Production -18.2
TechnicalSales and Promotion
Other revenueTotal Revenue -5.1
Expenses
DTH revenueLocal advertising revenueNational advertising revenue
($) CAGR (%)
RevenueResidential/bulk/smatv subscriber revenue
Pay and Specialty
Licensee Licensee Ultimate Owner Type Year
Gol TV (Canada) Ltd. 8047286 Canada Inc. Specialty (category B service) 2015
Total Remuneration ($)Average Staff CountAverage Remuneration ($)
Investment in ProgrammingTotal Canadian Programming -21.9
Canadian Programming/Revenue (%)
Acquisition of rights 22.6
Script & conceptFiller Programming + Program Production -32.2
Adjustments - Gain (Loss)
Pre-tax Profit
Canadian Programming Expenses
Depreciation
P.B.I.T.
Interest Expense
Administration and GeneralTotal Expenses
Operating Income
P.B.I.T. MarginPre-tax MarginCAGR = Compound Annual Growth Rate
Subscribers
Profitability (%)Operating Margin
Page 110

Undertaking # Service Name
535430706 GUSTO (formerly MmmTV)
2011 2012 Var % 2013 Var % 2014 Var % 2015 Var %
y4 y5
1,094,401 2,247,401 105.35
1,216,456 1,801,564 48.10
146,456 153,344 4.70
0 0
0 111,329
0 0
146,456 264,673 80.72
13.38 11.78
DTH revenueLocal advertising revenueNational advertising revenue
($) CAGR (%)
RevenueResidential/bulk/smatv subscriber revenue
Pay and Specialty
Licensee Licensee Ultimate Owner Type Year
7262591 Canada Limited Knight, Christopher Specialty (category B service) 2015
CRTC - FINANCIAL SUMMARY - PAY & SPECIALTY
Acquisition of rightsScript & conceptFiller Programming + Program Production
Adjustments - Gain (Loss)
Pre-tax Profit
Canadian Programming Expenses
Depreciation
P.B.I.T.
Interest Expense
Administration and GeneralTotal Expenses
Operating Income
Programming and ProductionTechnicalSales and Promotion
Other revenueTotal Revenue
Expenses
P.B.I.T. MarginPre-tax MarginCAGR = Compound Annual Growth Rate
Subscribers
Profitability (%)Operating Margin
Total Remuneration ($)Average Staff CountAverage Remuneration ($)
Investment in ProgrammingTotal Canadian Programming
Canadian Programming/Revenue (%)
Page 111

Undertaking # Service Name
205424055 H2 (formerly The Cave, Men TV)
2011 2012 Var % 2013 Var % 2014 Var % 2015 Var %
y1 y2 y3 y4 y5
1,592,768 2,194,785 37.80 3,038,263 38.43 3,896,878 28.26 4,413,737 13.26
2,723,514 2,494,045 -8.43 1,933,948 -22.46 1,667,539 -13.78 1,617,543 -3.00
0 0 0 0 0
440,078 238,540 -45.80 1,573,364 559.58 2,529,976 60.80 3,326,868 31.50
862 765 -11.25 0 -100.00 0 0
4,757,222 4,928,135 3.59 6,545,575 32.82 8,094,393 23.66 9,358,148 15.61
3,009,409 4,958,284 64.76 2,161,740 -56.40 2,075,169 -4.00 2,091,790 0.80
1,183,277 952,961 -19.46 815,077 -14.47 767,551 -5.83 782,914 2.00
312,180 211,931 -32.11 339,740 60.31 172,692 -49.17 176,599 2.26
465,774 291,623 -37.39 1,548,134 430.87 1,806,090 16.66 2,091,422 15.80
4,970,640 6,414,799 29.05 4,864,691 -24.16 4,821,502 -0.89 5,142,725 6.66
-213,418 -1,486,664 1,680,884 3,272,891 4,215,423
0 0 13,238 19,513 47.40 19,513 0.00
-213,418 -1,486,664 1,667,646 3,253,378 4,195,910
3,039 0 -100.00 -160 0 -100.00 0
0 0 0 0 0
-216,457 -1,486,664 1,667,806 3,253,378 4,195,910
2,035,753 3,946,246 93.85 72,351 -98.17 26,156 -63.85 44,326 69.47
0 0 0 0 0
0 0 538,325 525,957 -2.30 490,793 -6.69
16,667 0 -100.00 0 0 0
2,052,420 3,946,246 92.27 610,676 -84.53 552,113 -9.59 535,119 -3.08
43.14 80.08 9.33 6.82 5.72
0 0 1,528,956 1,321,682 -13.56 1,193,726 -9.68
0 0 17 15 -11.76 13 -13.33
89,939 88,112 -2.03 91,825 4.21
906,563 969,484 6.94 3,093,204 219.06 2,954,240 -4.49 2,816,403 -4.67
-4.5 -30.2 25.7 40.4 45.0
-4.5 -30.2 25.5 40.2 44.8
-4.6 -30.2 25.5 40.2 44.8
Pay and Specialty
Licensee Licensee Ultimate Owner Type Year
Men TV General Partnership Shaw Communications Inc. Specialty (category A service) 2015
CRTC - FINANCIAL SUMMARY - PAY & SPECIALTY
Depreciation
P.B.I.T.
Interest Expense
Administration and General 45.6
Total Expenses 0.9
Operating Income
Programming and Production -8.7
Technical -9.8
Sales and Promotion -13.3
Other revenue -100.0
Total Revenue 18.4
Expenses
DTH revenue -12.2
Local advertising revenueNational advertising revenue 65.8
($) CAGR (%)
RevenueResidential/bulk/smatv subscriber revenue 29.0
P.B.I.T. MarginPre-tax MarginCAGR = Compound Annual Growth Rate
Subscribers 32.8
Profitability (%)Operating Margin
Total Remuneration ($)Average Staff CountAverage Remuneration ($)
Investment in Programming -100.0
Total Canadian Programming -28.5
Canadian Programming/Revenue (%)
Acquisition of rights -61.6
Script & conceptFiller Programming + Program Production
Adjustments - Gain (Loss)
Pre-tax Profit
Canadian Programming Expenses
Page 112

Undertaking # Service Name
305417322 HGTV Canada - Home and Garden
Television Canada
2011 2012 Var % 2013 Var % 2014 Var % 2015 Var %
y1 y2 y3 y4 y5
11,306,713 12,349,505 9.22 13,213,309 6.99 13,906,801 5.25 14,425,257 3.73
3,761,584 4,054,599 7.79 4,000,667 -1.33 4,616,435 15.39 5,165,257 11.89
0 0 0 0 0
59,408,637 55,920,827 -5.87 56,651,109 1.31 58,096,644 2.55 52,530,899 -9.58
0 0 0 0 0
74,476,934 72,324,931 -2.89 73,865,085 2.13 76,619,880 3.73 72,121,413 -5.87
34,352,175 31,943,595 -7.01 24,959,902 -21.86 25,620,925 2.65 32,605,868 27.26
717,179 735,374 2.54 700,590 -4.73 986,198 40.77 1,228,708 24.59
2,886,220 1,307,073 -54.71 1,582,475 21.07 2,066,248 30.57 1,905,975 -7.76
4,586,948 3,802,528 -17.10 3,461,603 -8.97 3,882,929 12.17 5,580,980 43.73
42,542,522 37,788,570 -11.17 30,704,570 -18.75 32,556,300 6.03 41,321,531 26.92
31,934,412 34,536,361 43,160,515 44,063,580 30,799,882
3,644 304,955 >999± 319,596 4.80 319,596 0.00 46,322 -85.51
31,930,768 34,231,406 42,840,919 43,743,984 30,753,560
-24,437 -2,683 -89.02 16,794 -725.94 -48,505 -388.82 -43,767 -9.77
0 0 0 0 0
31,955,205 34,234,089 42,824,125 43,792,489 30,797,327
29,597,525 25,615,267 -13.45 19,514,730 -23.82 20,069,157 2.84 25,397,018 26.55
105,000 704,524 570.98 801,677 13.79 174,775 -78.20 339,983 94.53
2,357,640 2,688,550 14.04 2,371,765 -11.78 2,097,821 -11.55 1,815,198 -13.47
0 0 0 0 0
32,060,165 29,008,341 -9.52 22,688,172 -21.79 22,341,753 -1.53 27,552,199 23.32
43.05 40.11 30.72 29.16 38.20
2,341,101 3,322,407 41.92 3,386,465 1.93 3,752,302 10.80 3,826,232 1.97
31 39 25.81 38 -2.56 41 7.89 41 0.00
75,519 85,190 12.81 89,118 4.61 91,520 2.70 93,323 1.97
8,309,463 8,697,847 4.67 9,018,881 3.69 7,250,430 -19.61 7,127,618 -1.69
42.9 47.8 58.4 57.5 42.7
42.9 47.3 58.0 57.1 42.6
42.9 47.3 58.0 57.2 42.7
CRTC - FINANCIAL SUMMARY - PAY & SPECIALTY
Programming and Production -1.3
Technical 14.4
Sales and Promotion -9.9
Other revenueTotal Revenue -0.8
Expenses
DTH revenue 8.3
Local advertising revenueNational advertising revenue -3.0
($) CAGR (%)
RevenueResidential/bulk/smatv subscriber revenue 6.3
Pay and Specialty
Licensee Licensee Ultimate Owner Type Year
HGTV Canada Inc. Shaw Communications Inc. Specialty (category A service) 2015
Total Remuneration ($) 13.1
Average Staff CountAverage Remuneration ($) 5.4
Investment in ProgrammingTotal Canadian Programming -3.7
Canadian Programming/Revenue (%)
Acquisition of rights -3.8
Script & concept 34.1
Filler Programming + Program Production -6.3
Adjustments - Gain (Loss)
Pre-tax Profit
Canadian Programming Expenses
Depreciation 88.8
P.B.I.T.
Interest Expense
Administration and General 5.0
Total Expenses -0.7
Operating Income
P.B.I.T. MarginPre-tax MarginCAGR = Compound Annual Growth Rate
Subscribers -3.8
Profitability (%)Operating Margin
Page 113

Undertaking # Service Name
535420898 HIFI (formerly Treasure HD)
2011 2012 Var % 2013 Var % 2014 Var % 2015 Var %
y1 y2 y3 y4 y5
3,399,917 3,535,642 3.99 3,573,111 1.06 4,005,254 12.09 4,364,881 8.98
1,259,639 1,353,099 7.42 1,765,806 30.50 1,589,792 -9.97 1,678,456 5.58
156,633 344,311 119.82 167,198 -51.44 96,788 -42.11 69,144 -28.56
0 0 0 0 0
250,000 261,642 4.66 623,656 138.36 808,816 29.69 978,091 20.93
0 18,889 0 -100.00 0 0
406,633 624,842 53.66 790,854 26.57 905,604 14.51 1,047,235 15.64
11.96 17.67 22.13 22.61 23.99
DTH revenueLocal advertising revenueNational advertising revenue
($) CAGR (%)
RevenueResidential/bulk/smatv subscriber revenue
Pay and Specialty
Licensee Licensee Ultimate Owner Type Year
Blue Ant Television Ltd. Blue Ant Media Inc. Specialty (category B service) 2015
CRTC - FINANCIAL SUMMARY - PAY & SPECIALTY
Acquisition of rights -18.5
Script & conceptFiller Programming + Program Production 40.6
Adjustments - Gain (Loss)
Pre-tax Profit
Canadian Programming Expenses
Depreciation
P.B.I.T.
Interest Expense
Administration and GeneralTotal Expenses
Operating Income
Programming and Production 7.4
TechnicalSales and Promotion
Other revenueTotal Revenue 6.5
Expenses
P.B.I.T. MarginPre-tax MarginCAGR = Compound Annual Growth Rate
Subscribers
Profitability (%)Operating Margin
Total Remuneration ($)Average Staff CountAverage Remuneration ($)
Investment in ProgrammingTotal Canadian Programming 26.7
Canadian Programming/Revenue (%)
Page 114

Undertaking # Service Name
205421556 Historia
2011 2012 Var % 2013 Var % 2014 Var % 2015 Var %
y1 y2 y3 y4 y5
9,759,547 9,796,482 0.38 10,219,559 4.32 10,779,938 5.48 9,232,825 -14.35
3,226,014 3,235,325 0.29 3,553,770 9.84 3,531,749 -0.62 4,454,578 26.13
0 0 0 0 0
6,899,443 6,710,574 -2.74 7,520,139 12.06 8,035,582 6.85 6,632,382 -17.46
0 0 0 0 31,135
19,885,004 19,742,381 -0.72 21,293,468 7.86 22,347,269 4.95 20,350,920 -8.93
6,453,382 6,530,503 1.20 6,657,029 1.94 5,298,019 -20.41 4,093,535 -22.73
829,902 763,075 -8.05 774,380 1.48 1,174,366 51.65 424,125 -63.88
1,376,033 1,350,300 -1.87 1,002,584 -25.75 1,161,547 15.86 1,080,063 -7.02
2,000,022 1,963,012 -1.85 2,004,891 2.13 2,045,671 2.03 1,957,431 -4.31
10,659,339 10,606,890 -0.49 10,438,884 -1.58 9,679,603 -7.27 7,555,154 -21.95
9,225,665 9,135,491 10,854,584 12,667,666 12,795,766
0 0 0 98,289 89,731 -8.71
9,225,665 9,135,491 10,854,584 12,569,377 12,706,035
0 0 0 235 36,817 >999±
0 0 0 121,297 -4,180,218 >999±
9,225,665 9,135,491 10,854,584 12,690,439 8,489,000
2,897,925 3,259,940 12.49 3,374,031 3.50 2,093,605 -37.95 2,052,307 -1.97
48,217 54,117 12.24 71,667 32.43 225,101 214.09 433,036 92.37
1,551,174 1,434,120 -7.55 1,455,790 1.51 682,878 -53.09 605,277 -11.36
0 0 0 1,336,796 1,125 -99.92
4,497,316 4,748,177 5.58 4,901,488 3.23 4,338,380 -11.49 3,091,745 -28.74
22.62 24.05 23.02 19.41 15.19
2,678,016 2,569,102 -4.07 2,670,367 3.94 963,729 -63.91 1,550,704 60.91
26 26 0.00 28 7.69 15.22 -45.64 51 235.09
103,001 98,812 -4.07 95,370 -3.48 63,320 -33.61 30,406 -51.98
2,086,731 2,071,675 -0.72 2,060,048 -0.56 1,478,608 -28.22 1,434,966 -2.95
46.4 46.3 51.0 56.7 62.9
46.4 46.3 51.0 56.2 62.4
46.4 46.3 51.0 56.8 41.7
Pay and Specialty
Licensee Licensee Ultimate Owner Type Year
8504644 Canada Inc. Corus Entertainment Inc. Specialty (category A service) 2015
CRTC - FINANCIAL SUMMARY - PAY & SPECIALTY
Depreciation
P.B.I.T.
Interest Expense
Administration and General -0.5
Total Expenses -8.3
Operating Income
Programming and Production -10.8
Technical -15.5
Sales and Promotion -5.9
Other revenueTotal Revenue 0.6
Expenses
DTH revenue 8.4
Local advertising revenueNational advertising revenue -1.0
($) CAGR (%)
RevenueResidential/bulk/smatv subscriber revenue -1.4
P.B.I.T. MarginPre-tax MarginCAGR = Compound Annual Growth Rate
Subscribers -8.9
Profitability (%)Operating Margin
Total Remuneration ($) -12.8
Average Staff CountAverage Remuneration ($) -26.3
Investment in ProgrammingTotal Canadian Programming -8.9
Canadian Programming/Revenue (%)
Acquisition of rights -8.3
Script & concept 73.1
Filler Programming + Program Production -21.0
Adjustments - Gain (Loss)
Pre-tax Profit
Canadian Programming Expenses
Page 115

Undertaking # Service Name
305417249 History Television
2011 2012 Var % 2013 Var % 2014 Var % 2015 Var %
y1 y2 y3 y4 y5
20,146,637 20,086,049 -0.30 19,673,570 -2.05 20,889,706 6.18 21,561,610 3.22
7,418,228 7,587,516 2.28 7,303,705 -3.74 7,896,693 8.12 8,024,436 1.62
0 0 0 0 0
43,001,682 48,539,043 12.88 51,387,451 5.87 48,918,133 -4.81 46,326,352 -5.30
0 0 0 0 0
70,566,547 76,212,608 8.00 78,364,726 2.82 77,704,532 -0.84 75,912,398 -2.31
27,145,112 24,865,893 -8.40 26,535,039 6.71 22,849,926 -13.89 18,205,173 -20.33
1,005,218 1,015,127 0.99 994,890 -1.99 1,066,278 7.18 1,104,626 3.60
1,811,631 1,809,078 -0.14 1,664,250 -8.01 1,085,789 -34.76 949,921 -12.51
3,196,694 2,476,111 -22.54 5,822,750 135.16 6,030,098 3.56 6,268,531 3.95
33,158,655 30,166,209 -9.02 35,016,929 16.08 31,032,091 -11.38 26,528,251 -14.51
37,407,892 46,046,399 43,347,797 46,672,441 49,384,147
0 3,654 68,495 >999± 63,383 -7.46 59,730 -5.76
37,407,892 46,042,745 43,279,302 46,609,058 49,324,417
19,260,963 26,509,580 37.63 26,069,154 -1.66 26,448,390 1.45 36,289,324 37.21
6,081,936 0 -100.00 0 0 0
24,228,865 19,533,165 17,210,148 20,160,668 13,035,093
18,345,835 15,860,488 -13.55 16,593,791 4.62 13,398,653 -19.26 9,890,251 -26.18
131,610 204,858 55.66 392,508 91.60 350,027 -10.82 20,645 -94.10
1,704,381 1,948,836 14.34 2,034,604 4.40 1,681,940 -17.33 1,345,807 -19.98
0 0 0 0 0
20,181,826 18,014,182 -10.74 19,020,903 5.59 15,430,620 -18.88 11,256,703 -27.05
28.60 23.64 24.27 19.86 14.83
1,596,086 2,519,734 57.87 2,532,950 0.52 2,425,624 -4.24 2,117,637 -12.70
21 29 38.10 28 -3.45 27 -3.57 23 -14.81
76,004 86,887 14.32 90,463 4.11 89,838 -0.69 92,071 2.49
7,439,852 7,568,295 1.73 7,867,210 3.95 7,082,824 -9.97 6,949,911 -1.88
53.0 60.4 55.3 60.1 65.1
53.0 60.4 55.2 60.0 65.0
34.3 25.6 22.0 25.9 17.2
CRTC - FINANCIAL SUMMARY - PAY & SPECIALTY
Programming and Production -9.5
Technical 2.4
Sales and Promotion -14.9
Other revenueTotal Revenue 1.8
Expenses
DTH revenue 2.0
Local advertising revenueNational advertising revenue 1.9
($) CAGR (%)
RevenueResidential/bulk/smatv subscriber revenue 1.7
Pay and Specialty
Licensee Licensee Ultimate Owner Type Year
History Television Inc. Shaw Communications Inc. Specialty (category A service) 2015
Total Remuneration ($) 7.3
Average Staff CountAverage Remuneration ($) 4.9
Investment in ProgrammingTotal Canadian Programming -13.6
Canadian Programming/Revenue (%)
Acquisition of rights -14.3
Script & concept -37.1
Filler Programming + Program Production -5.7
Adjustments - Gain (Loss)
Pre-tax Profit
Canadian Programming Expenses
Depreciation
P.B.I.T.
Interest Expense
Administration and General 18.3
Total Expenses -5.4
Operating Income
P.B.I.T. MarginPre-tax MarginCAGR = Compound Annual Growth Rate
Subscribers -1.7
Profitability (%)Operating Margin
Page 116

Undertaking # Service Name
535429824 Hollywood Suite 2000s Movies (formerly
Sony Movie Channel)
2011 2012 Var % 2013 Var % 2014 Var % 2015 Var %
y2 y3 y4 y5
223,619 613,400 174.31 1,181,054 92.54 1,432,198 21.26
625,154 1,133,229 81.27 796,897 -29.68 998,601 25.31
73,265 89,513 22.18 101,545 13.44 183,055 80.27
0 0 0 0
0 0 0 0
0 0 0 0
73,265 89,513 22.18 101,545 13.44 183,055 80.27
32.76 14.59 8.60 12.78
DTH revenueLocal advertising revenueNational advertising revenue
($) CAGR (%)
RevenueResidential/bulk/smatv subscriber revenue
Pay and Specialty
Licensee Licensee Ultimate Owner Type Year
Hollywood Suite Corp. Hollywood Suite Inc. Specialty (category B service) 2015
CRTC - FINANCIAL SUMMARY - PAY & SPECIALTY
Acquisition of rightsScript & conceptFiller Programming + Program Production
Adjustments - Gain (Loss)
Pre-tax Profit
Canadian Programming Expenses
Depreciation
P.B.I.T.
Interest Expense
Administration and GeneralTotal Expenses
Operating Income
Programming and ProductionTechnicalSales and Promotion
Other revenueTotal Revenue
Expenses
P.B.I.T. MarginPre-tax MarginCAGR = Compound Annual Growth Rate
Subscribers
Profitability (%)Operating Margin
Total Remuneration ($)Average Staff CountAverage Remuneration ($)
Investment in ProgrammingTotal Canadian Programming
Canadian Programming/Revenue (%)
Page 117

Undertaking # Service Name
535429791 Hollywood Suite 70s Movies (formerly
Warner Films)
2011 2012 Var % 2013 Var % 2014 Var % 2015 Var %
y1 y2 y3 y4 y5
223,619 724,347 223.92 1,259,159 73.83 1,433,681 13.86
729,676 1,264,552 73.30 1,406,771 11.25 1,576,374 12.06
36,003 83,679 132.42 92,081 10.04 168,584 83.08
0 0 0 0
0 0 0 0
0 0 0 0
36,003 83,679 132.42 92,081 10.04 168,584 83.08
16.10 11.55 7.31 11.76
Pay and Specialty
Licensee Licensee Ultimate Owner Type Year
Hollywood Suite Inc. Switzer, Jacob (Jay) Specialty (category B service) 2015
CRTC - FINANCIAL SUMMARY - PAY & SPECIALTY
Depreciation
P.B.I.T.
Interest Expense
Administration and GeneralTotal Expenses
Operating Income
Programming and ProductionTechnicalSales and Promotion
Other revenueTotal Revenue
Expenses
DTH revenueLocal advertising revenueNational advertising revenue
($) CAGR (%)
RevenueResidential/bulk/smatv subscriber revenue
P.B.I.T. MarginPre-tax MarginCAGR = Compound Annual Growth Rate
Subscribers
Profitability (%)Operating Margin
Total Remuneration ($)Average Staff CountAverage Remuneration ($)
Investment in ProgrammingTotal Canadian Programming
Canadian Programming/Revenue (%)
Acquisition of rightsScript & conceptFiller Programming + Program Production
Adjustments - Gain (Loss)
Pre-tax Profit
Canadian Programming Expenses
Page 118

Undertaking # Service Name
535429816 Hollywood Suite 80s Movies (formerly
MGM Channel)
2011 2012 Var % 2013 Var % 2014 Var % 2015 Var %
y2 y3 y4 y5
223,619 724,347 223.92 1,259,159 73.83 1,433,681 13.86
720,788 1,685,275 133.81 1,713,336 1.67 1,915,729 11.81
69,081 85,973 24.45 96,931 12.75 163,285 68.45
0 0 0 0
0 0 0 0
0 0 0 0
69,081 85,973 24.45 96,931 12.75 163,285 68.45
30.89 11.87 7.70 11.39
CRTC - FINANCIAL SUMMARY - PAY & SPECIALTY
Programming and ProductionTechnicalSales and Promotion
Other revenueTotal Revenue
Expenses
DTH revenueLocal advertising revenueNational advertising revenue
($) CAGR (%)
RevenueResidential/bulk/smatv subscriber revenue
Pay and Specialty
Licensee Licensee Ultimate Owner Type Year
Hollywood Suite Inc. Switzer, Jacob (Jay) Specialty (category B service) 2015
Total Remuneration ($)Average Staff CountAverage Remuneration ($)
Investment in ProgrammingTotal Canadian Programming
Canadian Programming/Revenue (%)
Acquisition of rightsScript & conceptFiller Programming + Program Production
Adjustments - Gain (Loss)
Pre-tax Profit
Canadian Programming Expenses
Depreciation
P.B.I.T.
Interest Expense
Administration and GeneralTotal Expenses
Operating Income
P.B.I.T. MarginPre-tax MarginCAGR = Compound Annual Growth Rate
Subscribers
Profitability (%)Operating Margin
Page 119

Undertaking # Service Name
535429808 Hollywood Suite 90s Movies (formerly
AXN Movies)
2011 2012 Var % 2013 Var % 2014 Var % 2015 Var %
y2 y3 y4 y5
223,619 613,400 174.31 1,181,054 92.54 1,432,198 21.26
692,280 1,122,726 62.18 709,043 -36.85 882,702 24.49
36,514 90,370 147.49 91,887 1.68 176,780 92.39
0 0 0 0
0 0 0 0
0 0 0 0
36,514 90,370 147.49 91,887 1.68 176,780 92.39
16.33 14.73 7.78 12.34
DTH revenueLocal advertising revenueNational advertising revenue
($) CAGR (%)
RevenueResidential/bulk/smatv subscriber revenue
Pay and Specialty
Licensee Licensee Ultimate Owner Type Year
Hollywood Suite Corp. Hollywood Suite Inc. Specialty (category B service) 2015
CRTC - FINANCIAL SUMMARY - PAY & SPECIALTY
Acquisition of rightsScript & conceptFiller Programming + Program Production
Adjustments - Gain (Loss)
Pre-tax Profit
Canadian Programming Expenses
Depreciation
P.B.I.T.
Interest Expense
Administration and GeneralTotal Expenses
Operating Income
Programming and ProductionTechnicalSales and Promotion
Other revenueTotal Revenue
Expenses
P.B.I.T. MarginPre-tax MarginCAGR = Compound Annual Growth Rate
Subscribers
Profitability (%)Operating Margin
Total Remuneration ($)Average Staff CountAverage Remuneration ($)
Investment in ProgrammingTotal Canadian Programming
Canadian Programming/Revenue (%)
Page 120

Undertaking # Service Name
305424616 HPItv (formerly The Racing Network
Canada)
2011 2012 Var % 2013 Var % 2014 Var % 2015 Var %
y1 y2 y3 y4 y5
1,164,009 953,676 -18.07 682,144 -28.47 636,583 -6.68 522,331 -17.95
776,685 692,291 -10.87 668,679 -3.41 547,054 -18.19 559,203 2.22
0 0 0 0 0
0 0 0 0 0
0 0 0 547,054 0 -100.00
0 0 0 0 0
0 0 0 547,054 0 -100.00
0.00 0.00 0.00 85.94 0.00
Pay and Specialty
Licensee Licensee Ultimate Owner Type Year
Woodbine Entertainment Group Woodbine Entertainment Group Specialty (category B service) 2015
CRTC - FINANCIAL SUMMARY - PAY & SPECIALTY
Depreciation
P.B.I.T.
Interest Expense
Administration and GeneralTotal Expenses
Operating Income
Programming and Production -7.9
TechnicalSales and Promotion
Other revenueTotal Revenue -18.2
Expenses
DTH revenueLocal advertising revenueNational advertising revenue
($) CAGR (%)
RevenueResidential/bulk/smatv subscriber revenue
P.B.I.T. MarginPre-tax MarginCAGR = Compound Annual Growth Rate
Subscribers
Profitability (%)Operating Margin
Total Remuneration ($)Average Staff CountAverage Remuneration ($)
Investment in ProgrammingTotal Canadian Programming
Canadian Programming/Revenue (%)
Acquisition of rightsScript & conceptFiller Programming + Program Production
Adjustments - Gain (Loss)
Pre-tax Profit
Canadian Programming Expenses
Page 121

Undertaking # Service Name
305424723 Hustler TV (Formerly TEN Channel
1/Hustler Channel)
2011 2012 Var % 2013 Var % 2014 Var % 2015 Var %
y1 y2 y3 y4 y5
1,877,611 1,634,376 -12.95 1,384,344 -15.30 1,138,790 -17.74 999,381 -12.24
613,088 588,238 -4.05 402,500 -31.58 349,497 -13.17 302,286 -13.51
5,981 6,354 6.24 0 -100.00 0 0
113,845 157,604 38.44 88,896 -43.60 77,444 -12.88 67,094 -13.36
341,534 322,812 -5.48 266,687 -17.39 232,332 -12.88 201,283 -13.36
106,461 73,961 -30.53 28,879 -60.95 25,318 -12.33 21,921 -13.42
567,821 560,731 -1.25 384,462 -31.44 335,094 -12.84 290,298 -13.37
30.24 34.31 27.77 29.43 29.05
CRTC - FINANCIAL SUMMARY - PAY & SPECIALTY
Programming and Production -16.2
TechnicalSales and Promotion
Other revenueTotal Revenue -14.6
Expenses
DTH revenueLocal advertising revenueNational advertising revenue
($) CAGR (%)
RevenueResidential/bulk/smatv subscriber revenue
Pay and Specialty
Licensee Licensee Ultimate Owner Type Year
TEN Broadcasting Inc. Duncan, Stuart Specialty (category B service) 2015
Total Remuneration ($)Average Staff CountAverage Remuneration ($)
Investment in Programming -32.6
Total Canadian Programming -15.4
Canadian Programming/Revenue (%)
Acquisition of rights -100.0
Script & concept -12.4
Filler Programming + Program Production -12.4
Adjustments - Gain (Loss)
Pre-tax Profit
Canadian Programming Expenses
Depreciation
P.B.I.T.
Interest Expense
Administration and GeneralTotal Expenses
Operating Income
P.B.I.T. MarginPre-tax MarginCAGR = Compound Annual Growth Rate
Subscribers
Profitability (%)Operating Margin
Page 122

Undertaking # Service Name
305424046 ichannel
2011 2012 Var % 2013 Var % 2014 Var % 2015 Var %
y1 y2 y3 y4 y5
1,709,798 2,232,851 30.59 2,124,753 -4.84 1,953,047 -8.08 1,749,117 -10.44
2,203,869 2,080,214 -5.61 1,915,202 -7.93 1,734,340 -9.44 1,830,319 5.53
0 0 0 0 0
302,901 405,966 34.03 298,940 -26.36 70,158 -76.53 78,798 12.32
0 0 1,553,487 198,036 -87.25 242,114 22.26
4,216,568 4,719,031 11.92 5,892,382 24.86 3,955,581 -32.87 3,900,348 -1.40
1,689,960 1,810,308 7.12 2,755,554 52.21 1,376,308 -50.05 1,097,652 -20.25
1,265,967 1,302,760 2.91 807,564 -38.01 797,774 -1.21 780,544 -2.16
295,738 408,820 38.24 540,695 32.26 481,684 -10.91 142,420 -70.43
705,356 1,168,245 65.62 749,986 -35.80 865,308 15.38 1,570,636 81.51
3,957,021 4,690,133 18.53 4,853,799 3.49 3,521,074 -27.46 3,591,252 1.99
259,547 28,898 1,038,583 434,507 309,096
0 0 0 0 0
259,547 28,898 1,038,583 434,507 309,096
0 0 0 0 0
0 0 0 0 0
259,547 28,898 1,038,583 434,507 309,096
372,262 422,983 13.63 407,716 -3.61 610,231 49.67 253,748 -58.42
0 0 0 0 0
1,122,407 1,114,318 -0.72 2,136,872 91.77 675,586 -68.38 649,058 -3.93
0 0 0 0 0
1,494,669 1,537,301 2.85 2,544,588 65.52 1,285,817 -49.47 902,806 -29.79
35.45 32.58 43.18 32.51 23.15
1,892,829 2,407,212 27.18 1,490,026 -38.10 792,965 -46.78 1,050,480 32.47
28 28 0.00 21 -25.00 17 -19.05 13 -23.53
67,601 85,972 27.18 70,954 -17.47 46,645 -34.26 80,806 73.24
1,129,229 1,184,686 4.91 1,106,545 -6.60 1,002,141 -9.44 899,843 -10.21
6.2 0.6 17.6 11.0 7.9
6.2 0.6 17.6 11.0 7.9
6.2 0.6 17.6 11.0 7.9
DTH revenue -4.5
Local advertising revenueNational advertising revenue -28.6
($) CAGR (%)
RevenueResidential/bulk/smatv subscriber revenue 0.6
Pay and Specialty
Licensee Licensee Ultimate Owner Type Year
Stornoway Communications Limited
Partnership
Smith, Vincent & Co. Ltd. Specialty (category A service) 2015
CRTC - FINANCIAL SUMMARY - PAY & SPECIALTY
Acquisition of rights -9.1
Script & conceptFiller Programming + Program Production -12.8
Adjustments - Gain (Loss)
Pre-tax Profit
Canadian Programming Expenses
Depreciation
P.B.I.T.
Interest Expense
Administration and General 22.2
Total Expenses -2.4
Operating Income
Programming and Production -10.2
Technical -11.4
Sales and Promotion -16.7
Other revenueTotal Revenue -1.9
Expenses
P.B.I.T. MarginPre-tax MarginCAGR = Compound Annual Growth Rate
Subscribers -5.5
Profitability (%)Operating Margin
Total Remuneration ($) -13.7
Average Staff CountAverage Remuneration ($) 4.6
Investment in ProgrammingTotal Canadian Programming -11.8
Canadian Programming/Revenue (%)
Page 123

Undertaking # Service Name
205423734 ICI ARTV
205423734 ICI ARTV
2011 2012 Var % 2013 Var % 2014 Var % 2015 Var %
y1 y2 y3 y4 y5
10,780,876 10,738,642 -0.39 10,482,694 -2.38 9,997,759 -4.63 8,930,635 -10.67
3,258,059 2,954,516 -9.32 2,666,495 -9.75 2,436,499 -8.63 2,140,865 -12.13
0 0 0 0 0
3,174,700 3,541,892 11.57 3,735,430 5.46 3,399,739 -8.99 2,529,998 -25.58
0 0 0 0 0
17,213,635 17,235,050 0.12 16,884,619 -2.03 15,833,997 -6.22 13,601,498 -14.10
12,881,244 12,703,549 -1.38 12,938,749 1.85 11,692,829 -9.63 10,768,218 -7.91
1,250,897 1,256,179 0.42 1,215,998 -3.20 917,674 -24.53 932,197 1.58
1,864,196 1,962,791 5.29 1,997,516 1.77 1,956,260 -2.07 1,887,102 -3.54
973,467 882,248 -9.37 897,947 1.78 1,056,301 17.64 988,226 -6.44
16,969,804 16,804,767 -0.97 17,050,210 1.46 15,623,064 -8.37 14,575,743 -6.70
243,831 430,283 -165,591 210,933 -974,245
65,923 106,114 60.97 115,316 8.67 93,911 -18.56 90,206 -3.95
177,908 324,169 -280,907 117,022 -1,064,451
0 0 0 0 0
22,032 80,973 267.52 80,313 -0.82 89,801 11.81 406,374 352.53
199,940 405,142 -200,594 206,823 -658,077
6,775,417 6,678,148 -1.44 6,827,757 2.24 6,126,320 -10.27 6,866,496 12.08
25,206 72,800 188.82 66,415 -8.77 72,070 8.51 33,292 -53.81
4,101,217 3,931,972 -4.13 4,000,277 1.74 3,673,534 -8.17 2,496,915 -32.03
0 0 0 0 0
10,901,840 10,682,920 -2.01 10,894,449 1.98 9,871,924 -9.39 9,396,703 -4.81
63.33 61.98 64.52 62.35 69.09
3,257,248 3,052,423 -6.29 3,158,458 3.47 3,143,263 -0.48 2,852,143 -9.26
46 42 -8.70 42 0.00 40 -4.76 38.2 -4.50
70,810 72,677 2.64 75,201 3.47 78,582 4.49 74,663 -4.99
2,116,883 2,072,523 -2.10 2,025,432 -2.27 2,026,315 0.04 1,792,141 -11.56
1.4 2.5 -1.0 1.3 -7.2
1.0 1.9 -1.7 0.7 -7.8
1.2 2.4 -1.2 1.3 -4.8
Pay and Specialty
Licensee Licensee Ultimate Owner Type Year
ARTV inc. Canadian Broadcasting Corporation Specialty (category A service) 2015
CRTC - FINANCIAL SUMMARY - PAY & SPECIALTY
Total Expenses -3.7
Operating IncomeDepreciation 8.2
Technical -7.1
Sales and Promotion 0.3
Administration and General 0.4
Total Revenue -5.7
ExpensesProgramming and Production -4.4
Local advertising revenueNational advertising revenue -5.5
Other revenue
RevenueResidential/bulk/smatv subscriber revenue -4.6
DTH revenue -10.0
Canadian Broadcasting Corporation Canadian Broadcasting Corporation Specialty (category A service) 2015
($) CAGR (%)
Profitability (%)Operating MarginP.B.I.T. Margin
Average Staff CountAverage Remuneration ($) 1.3
Subscribers -4.1
Total Canadian Programming -3.7
Canadian Programming/Revenue (%)
Total Remuneration ($) -3.3
Script & concept 7.2
Filler Programming + Program Production -11.7
Investment in Programming
Pre-tax Profit
Canadian Programming ExpensesAcquisition of rights 0.3
P.B.I.T.
Interest ExpenseAdjustments - Gain (Loss)
Pre-tax MarginCAGR = Compound Annual Growth Rate
Page 124

Undertaking # Service Name
535432215 ICI EXPLORA (formerly SENS)
2011 2012 Var % 2013 Var % 2014 Var % 2015 Var %
y2 y3 y4 y5
484,178 2,448,737 405.75 3,830,114 56.41 5,019,591 31.06
1,542,595 3,140,044 103.56 4,103,242 30.67 4,388,985 6.96
23,389 200,209 756.00 297,738 48.71 555,859 86.69
0 0 0 0
1,091,686 1,198,254 9.76 1,797,369 50.00 1,793,374 -0.22
0 0 0 0
1,115,075 1,398,463 25.41 2,095,107 49.81 2,349,233 12.13
230.30 57.11 54.70 46.80
Total RevenueExpensesProgramming and Production
Local advertising revenueNational advertising revenueOther revenue
RevenueResidential/bulk/smatv subscriber revenueDTH revenue
Canadian Broadcasting Corporation Canadian Broadcasting Corporation Specialty (category B service) 2015
($) CAGR (%)
CRTC - FINANCIAL SUMMARY - PAY & SPECIALTY
Pay and Specialty
Licensee Licensee Ultimate Owner Type Year
Total Canadian Programming
Canadian Programming/Revenue (%)
Total Remuneration ($)
Script & conceptFiller Programming + Program ProductionInvestment in Programming
Pre-tax Profit
Canadian Programming ExpensesAcquisition of rights
P.B.I.T.
Interest ExpenseAdjustments - Gain (Loss)
Total ExpensesOperating IncomeDepreciation
TechnicalSales and PromotionAdministration and General
Pre-tax MarginCAGR = Compound Annual Growth Rate
Profitability (%)Operating MarginP.B.I.T. Margin
Average Staff CountAverage Remuneration ($)
Subscribers
Page 125

Undertaking # Service Name
215413782 ICI RDI
2011 2012 Var % 2013 Var % 2014 Var % 2015 Var %
y1 y2 y3 y4 y5
32,125,863 33,592,953 4.57 29,939,061 -10.88 30,747,126 2.70 33,652,973 9.45
11,120,826 11,660,709 4.85 12,030,827 3.17 12,172,652 1.18 8,139,898 -33.13
0 0 0 0 0
10,168,591 11,113,580 9.29 12,009,267 8.06 11,997,541 -0.10 10,836,880 -9.67
667,872 642,292 -3.83 613,944 -4.41 1,823,983 197.09 1,640,589 -10.05
54,083,152 57,009,534 5.41 54,593,099 -4.24 56,741,302 3.93 54,270,340 -4.35
37,641,514 36,242,261 -3.72 35,202,326 -2.87 42,750,510 21.44 40,696,808 -4.80
1,273,843 1,113,459 -12.59 1,360,344 22.17 1,929,605 41.85 2,101,420 8.90
3,434,251 3,445,081 0.32 3,307,239 -4.00 3,348,180 1.24 2,890,014 -13.68
2,039,022 1,826,764 -10.41 1,465,424 -19.78 5,009,328 241.83 4,483,340 -10.50
44,388,630 42,627,565 -3.97 41,335,333 -3.03 53,037,623 28.31 50,171,582 -5.40
9,694,522 14,381,969 13,257,766 3,703,679 4,098,758
2,753,217 2,760,028 0.25 2,712,139 -1.74 2,830,977 4.38 2,707,201 -4.37
6,941,305 11,621,941 10,545,627 872,702 1,391,557
0 0 0 329,339 365,149 10.87
0 0 0 -2,343,139 -2,315,762 -1.17
6,941,305 11,621,941 10,545,627 -1,799,776 -1,289,354
1,525,700 1,521,464 -0.28 1,197,016 -21.32 949,154 -20.71 628,409 -33.79
0 0 0 0 0
34,975,211 33,859,793 -3.19 33,548,024 -0.92 39,174,512 16.77 37,646,725 -3.90
0 0 0 0 41,316
36,500,911 35,381,257 -3.07 34,745,040 -1.80 40,123,666 15.48 38,316,450 -4.50
67.49 62.06 63.64 70.71 70.60
34,559,679 33,647,509 -2.64 32,614,515 -3.07 38,566,744 18.25 37,471,364 -2.84
371 356.8 -3.83 323 -9.47 372.18 15.23 358.64 -3.64
93,153 94,304 1.24 100,974 7.07 103,624 2.62 104,482 0.83
11,189,981 11,679,275 4.37 11,127,544 -4.72 11,186,678 0.53 10,853,504 -2.98
17.9 25.2 24.3 6.5 7.6
12.8 20.4 19.3 1.5 2.6
12.8 20.4 19.3 -3.2 -2.4
RevenueResidential/bulk/smatv subscriber revenue 1.2
DTH revenue -7.5
Canadian Broadcasting Corporation Canadian Broadcasting Corporation Specialty (category C service) 2015
($) CAGR (%)
CRTC - FINANCIAL SUMMARY - PAY & SPECIALTY
Pay and Specialty
Licensee Licensee Ultimate Owner Type Year
Pre-tax Profit
Canadian Programming ExpensesAcquisition of rights -19.9
P.B.I.T.
Interest ExpenseAdjustments - Gain (Loss)
Total Expenses 3.1
Operating IncomeDepreciation -0.4
Technical 13.3
Sales and Promotion -4.2
Administration and General 21.8
Total Revenue 0.1
ExpensesProgramming and Production 2.0
Local advertising revenueNational advertising revenue 1.6
Other revenue 25.2
Pre-tax MarginCAGR = Compound Annual Growth Rate
Profitability (%)Operating MarginP.B.I.T. Margin
Average Staff CountAverage Remuneration ($) 2.9
Subscribers -0.8
Total Canadian Programming 1.2
Canadian Programming/Revenue (%)
Total Remuneration ($) 2.0
Script & conceptFiller Programming + Program Production 1.9
Investment in Programming
Page 126

Undertaking # Service Name
535419289 IDNR-TV Natural Resources Television
2011 2012 Var % 2013 Var % 2014 Var % 2015 Var %
y1 y2 y3 y4 y5
359,313 312,036 -13.16 132,294 -57.60 141,439 6.91 54,350 -61.57
105,935 121,761 14.94 88,634 -27.21 55,897 -36.94 18,443 -67.01
0 0 0 0 0
0 0 0 0 0
105,935 121,761 14.94 88,634 -27.21 55,897 -36.94 18,443 -67.01
0 0 0 0 0
105,935 121,761 14.94 88,634 -27.21 55,897 -36.94 18,443 -67.01
29.48 39.02 67.00 39.52 33.93
CRTC - FINANCIAL SUMMARY - PAY & SPECIALTY
Pay and Specialty
Licensee Licensee Ultimate Owner Type Year
Total ExpensesOperating IncomeDepreciation
TechnicalSales and PromotionAdministration and General
Total Revenue -37.6
ExpensesProgramming and Production -35.4
Local advertising revenueNational advertising revenueOther revenue
RevenueResidential/bulk/smatv subscriber revenueDTH revenue
The Natural Resources Television
Channel (IDRN-TV/
6199054 Canada Inc. Specialty (category B service) 2015
($) CAGR (%)
Profitability (%)Operating MarginP.B.I.T. Margin
Average Staff CountAverage Remuneration ($)
Subscribers
Total Canadian Programming -35.4
Canadian Programming/Revenue (%)
Total Remuneration ($)
Script & conceptFiller Programming + Program Production -35.4
Investment in Programming
Pre-tax Profit
Canadian Programming ExpensesAcquisition of rights
P.B.I.T.
Interest ExpenseAdjustments - Gain (Loss)
Pre-tax MarginCAGR = Compound Annual Growth Rate
Page 127

Undertaking # Service Name
205429295 Illico sur demande
2011 2012 Var % 2013 Var % 2014 Var % 2015 Var %
y1 y2 y3 y4 y5
55,510,304 57,349,755 3.31 57,221,481 -0.22 56,335,721 -1.55 50,011,628 -11.23
0 0 0 0 0
0 0 0 0 0
0 0 0 0 0
0 0 0 0 0
55,510,304 57,349,755 3.31 57,221,481 -0.22 56,335,721 -1.55 50,011,628 -11.23
38,813,444 40,697,804 4.85 43,559,240 7.03 44,783,758 2.81 39,217,378 -12.43
2,296,768 3,324,207 44.73 2,998,278 -9.80 2,022,206 -32.55 1,143,831 -43.44
1,023,612 1,517,022 48.20 2,048,114 35.01 2,113,043 3.17 1,944,776 -7.96
14,606 33,060 126.35 25,667 -22.36 16,436 -35.96 7,206 -56.16
42,148,430 45,572,093 8.12 48,631,299 6.71 48,935,443 0.63 42,313,191 -13.53
13,361,874 11,777,662 8,590,182 7,400,278 7,698,437
10,468,210 12,719,352 21.50 12,713,220 -0.05 10,304,429 -18.95 13,181,446 27.92
2,893,664 -941,690 -4,123,038 -2,904,151 -5,483,009
0 0 0 0 0
0 0 0 0 0
2,893,664 -941,690 -4,123,038 -2,904,151 -5,483,009
5,811,546 4,887,882 -15.89 6,107,201 24.95 7,346,118 20.29 10,068,708 37.06
0 0 0 0 0
0 0 0 0 0
0 0 0 0 0
5,811,546 4,887,882 -15.89 6,107,201 24.95 7,346,118 20.29 10,068,708 37.06
10.47 8.52 10.67 13.04 20.13
1,023,612 1,517,022 48.20 2,048,114 35.01 2,113,043 3.17 1,944,776 -7.96
15 21 40.00 26 23.81 26 0.00 20 -23.08
68,241 72,239 5.86 78,774 9.05 81,271 3.17 97,239 19.65
24.1 20.5 15.0 13.1 15.4
5.2 -1.6 -7.2 -5.2 -11.0
5.2 -1.6 -7.2 -5.2 -11.0
Total Revenue -2.6
ExpensesProgramming and Production 0.3
Local advertising revenueNational advertising revenueOther revenue
RevenueResidential/bulk/smatv subscriber revenue -2.6
DTH revenue
Vidéotron s.e.n.c. Les Placements Péladeau inc. Video-on-Demand 2015
($) CAGR (%)
CRTC - FINANCIAL SUMMARY - PAY & SPECIALTY
Pay and Specialty
Licensee Licensee Ultimate Owner Type Year
Total Canadian Programming 14.7
Canadian Programming/Revenue (%)
Total Remuneration ($) 17.4
Script & conceptFiller Programming + Program ProductionInvestment in Programming
Pre-tax Profit
Canadian Programming ExpensesAcquisition of rights 14.7
P.B.I.T.
Interest ExpenseAdjustments - Gain (Loss)
Total Expenses 0.1
Operating IncomeDepreciation 5.9
Technical -16.0
Sales and Promotion 17.4
Administration and General -16.2
Pre-tax MarginCAGR = Compound Annual Growth Rate
Profitability (%)Operating MarginP.B.I.T. Margin
Average Staff CountAverage Remuneration ($) 9.3
Subscribers
Page 128

Undertaking # Service Name
405425613 Investigation Discovery (formerly Court
TV Canada)
2011 2012 Var % 2013 Var % 2014 Var % 2015 Var %
y1 y2 y3 y4 y5
1,840,754 2,398,042 30.27 3,152,921 31.48 4,556,608 44.52 4,774,763 4.79
1,880,589 2,113,503 12.39 2,356,466 11.50 2,831,312 20.15 2,571,123 -9.19
0 0 0 0 0
643,064 1,174,667 82.67 1,846,140 57.16 2,308,401 25.04 3,720,016 61.15
0 0 0 0 0
4,364,407 5,686,212 30.29 7,355,527 29.36 9,696,321 31.82 11,065,902 14.12
2,076,509 1,632,252 -21.39 1,825,663 11.85 2,258,477 23.71 2,222,919 -1.57
330,311 438,020 32.61 539,268 23.11 771,659 43.09 732,655 -5.05
468,249 402,962 -13.94 418,798 3.93 440,733 5.24 459,225 4.20
315,973 380,753 20.50 477,029 25.29 525,250 10.11 637,364 21.34
3,191,042 2,853,987 -10.56 3,260,758 14.25 3,996,119 22.55 4,052,163 1.40
1,173,365 2,832,225 4,094,769 5,700,202 7,013,739
280,689 71,295 -74.60 101,119 41.83 138,245 36.72 175,845 27.20
892,676 2,760,930 3,993,650 5,561,957 6,837,894
0 0 -349 0 -100.00 0
0 -386,787 -1,278,835 230.63 -1,333,444 4.27 -924,993 -30.63
892,676 2,374,143 2,715,164 4,228,513 5,912,901
245,895 21,367 -91.31 18,048 -15.53 0 -100.00 0
0 0 0 0 0
249,981 528,234 111.31 351,324 -33.49 447,423 27.35 477,920 6.82
0 0 0 0 0
495,876 549,601 10.83 369,372 -32.79 447,423 21.13 477,920 6.82
11.36 9.67 5.02 4.61 4.32
187,823 209,114 11.34 158,659 -24.13 147,420 -7.08 150,191 1.88
2.5 2.5 0.00 2.17 -13.20 2.17 0.00 2.17 0.00
75,129 83,646 11.34 73,115 -12.59 67,935 -7.08 69,212 1.88
956,863 1,035,359 8.20 1,405,963 35.79 1,457,597 3.67 1,425,647 -2.19
26.9 49.8 55.7 58.8 63.4
20.5 48.6 54.3 57.4 61.8
20.5 41.8 36.9 43.6 53.4
RevenueResidential/bulk/smatv subscriber revenue 26.9
DTH revenue 8.1
Bell Media Inc. BCE Inc. Specialty (category B service) 2015
($) CAGR (%)
CRTC - FINANCIAL SUMMARY - PAY & SPECIALTY
Pay and Specialty
Licensee Licensee Ultimate Owner Type Year
Pre-tax Profit
Canadian Programming ExpensesAcquisition of rights -100.0
P.B.I.T.
Interest ExpenseAdjustments - Gain (Loss)
Total Expenses 6.2
Operating IncomeDepreciation -11.0
Technical 22.0
Sales and Promotion -0.5
Administration and General 19.2
Total Revenue 26.2
ExpensesProgramming and Production 1.7
Local advertising revenueNational advertising revenue 55.1
Other revenue
Pre-tax MarginCAGR = Compound Annual Growth Rate
Profitability (%)Operating MarginP.B.I.T. Margin
Average Staff CountAverage Remuneration ($) -2.0
Subscribers 10.5
Total Canadian Programming -0.9
Canadian Programming/Revenue (%)
Total Remuneration ($) -5.4
Script & conceptFiller Programming + Program Production 17.6
Investment in Programming
Page 129

Undertaking # Service Name
535419487 Jaam-e-Jam (formerly ITN-Iran TV
Network/Persian/Iranian TV)
2011 2012 Var % 2013 Var % 2014 Var % 2015 Var %
y1 y2 y3 y4 y5
14,809 2,212 -85.06 2,781 25.72 6,213 123.41 9,291 49.54
12,674 672 -94.70 380 -43.45 1,160 205.26 5,308 357.59
0 101 57 -43.56 174 205.26 206 18.39
6,337 134 -97.89 76 -43.28 232 205.26 274 18.10
6,337 437 -93.10 247 -43.48 754 205.26 892 18.30
0 0 0 0 0
12,674 672 -94.70 380 -43.45 1,160 205.26 1,372 18.28
85.58 30.38 13.66 18.67 14.77
CRTC - FINANCIAL SUMMARY - PAY & SPECIALTY
Pay and Specialty
Licensee Licensee Ultimate Owner Type Year
Total ExpensesOperating IncomeDepreciation
TechnicalSales and PromotionAdministration and General
Total Revenue -11.0
ExpensesProgramming and Production -19.6
Local advertising revenueNational advertising revenueOther revenue
RevenueResidential/bulk/smatv subscriber revenueDTH revenue
Ethnic Channels Group Limited Levin, Slava Specialty (category B service) 2015
($) CAGR (%)
Profitability (%)Operating MarginP.B.I.T. Margin
Average Staff CountAverage Remuneration ($)
Subscribers
Total Canadian Programming -42.6
Canadian Programming/Revenue (%)
Total Remuneration ($)
Script & concept -54.4
Filler Programming + Program Production -38.8
Investment in Programming
Pre-tax Profit
Canadian Programming ExpensesAcquisition of rights
P.B.I.T.
Interest ExpenseAdjustments - Gain (Loss)
Pre-tax MarginCAGR = Compound Annual Growth Rate
Page 130

Undertaking # Service Name
405426322 Juicebox (formerly PunchMuch)
2011 2012 Var % 2013 Var % 2014 Var % 2015 Var %
y1 y2 y3 y4 y5
351,472 308,293 -12.29 317,095 2.86 353,570 11.50 236,650 -33.07
266,513 262,649 -1.45 275,209 4.78 269,638 -2.02 73,784 -72.64
0 0 0 0 0
0 0 0 0 0
100,033 22,208 -77.80 -5,000 -122.51 -5,000 0.00 0 -100.00
718,018 593,150 -17.39 587,304 -0.99 618,208 5.26 310,434 -49.78
93,931 79,351 -15.52 59,974 -24.42 48,315 -19.44 30,450 -36.98
13,894 11,501 -17.22 11,107 -3.43 11,274 1.50 4,426 -60.74
11,397 6,602 -42.07 2,545 -61.45 668 -73.75 237 -64.52
60,600 37,861 -37.52 31,425 -17.00 31,800 1.19 30,602 -3.77
179,822 135,315 -24.75 105,051 -22.37 92,057 -12.37 65,715 -28.61
538,196 457,835 482,253 526,151 244,719
148,193 108,197 -26.99 8,143 -92.47 8,885 9.11 4,933 -44.48
390,003 349,638 474,110 517,266 239,786
0 0 0 0 0
-18,127 -38,837 114.25 -40,709 4.82 -39,907 -1.97 -3,875 -90.29
371,876 310,801 433,401 477,359 235,911
0 0 0 0 0
0 0 0 0 0
0 42,862 48,105 12.23 40,979 -14.81 23,759 -42.02
0 0 0 0 0
0 42,862 48,105 12.23 40,979 -14.81 23,759 -42.02
0.00 7.23 8.19 6.63 7.65
49,304 20,925 -57.56 0 -100.00 0 0
1 1 0.00 0 -100.00 0 0
49,304 20,925 -57.56
282,795 283,352 0.20 271,893 -4.04 253,102 -6.91 114,220 -54.87
75.0 77.2 82.1 85.1 78.8
54.3 58.9 80.7 83.7 77.2
51.8 52.4 73.8 77.2 76.0
Total Revenue -18.9
ExpensesProgramming and Production -24.5
Local advertising revenueNational advertising revenueOther revenue -100.0
RevenueResidential/bulk/smatv subscriber revenue -9.4
DTH revenue -27.5
Bell Media Inc. BCE Inc. Specialty (category B service) 2015
($) CAGR (%)
CRTC - FINANCIAL SUMMARY - PAY & SPECIALTY
Pay and Specialty
Licensee Licensee Ultimate Owner Type Year
Total Canadian Programming
Canadian Programming/Revenue (%)
Total Remuneration ($) -100.0
Script & conceptFiller Programming + Program ProductionInvestment in Programming
Pre-tax Profit
Canadian Programming ExpensesAcquisition of rights
P.B.I.T.
Interest ExpenseAdjustments - Gain (Loss)
Total Expenses -22.3
Operating IncomeDepreciation -57.3
Technical -24.9
Sales and Promotion -62.0
Administration and General -15.7
Pre-tax MarginCAGR = Compound Annual Growth Rate
Profitability (%)Operating MarginP.B.I.T. Margin
Average Staff CountAverage Remuneration ($)
Subscribers -20.3
Page 131

Undertaking # Service Name
535421127 La chaîne Disney (formerly TÉLÉTOON
Rétro (Français))
2011 2012 Var % 2013 Var % 2014 Var % 2015 Var %
y1 y2 y3 y4 y5
1,551,137 1,545,927 -0.34 1,630,704 5.48 1,692,714 3.80 1,621,476 -4.21
335,688 353,336 5.26 376,710 6.62 598,783 58.95 759,066 26.77
55,439 86,133 55.37 63,777 -25.96 39,551 -37.99 16,587 -58.06
0 0 0 48,111 78,898 63.99
0 0 0 42,287 61,170 44.65
0 0 0 0 0
55,439 86,133 55.37 63,777 -25.96 129,949 103.76 156,655 20.55
3.57 5.57 3.91 7.68 9.66
RevenueResidential/bulk/smatv subscriber revenueDTH revenue
TELETOON Canada Inc. Corus Entertainment Inc. Specialty (category B service) 2015
($) CAGR (%)
CRTC - FINANCIAL SUMMARY - PAY & SPECIALTY
Pay and Specialty
Licensee Licensee Ultimate Owner Type Year
Pre-tax Profit
Canadian Programming ExpensesAcquisition of rights -26.0
P.B.I.T.
Interest ExpenseAdjustments - Gain (Loss)
Total ExpensesOperating IncomeDepreciation
TechnicalSales and PromotionAdministration and General
Total Revenue 1.1
ExpensesProgramming and Production 22.6
Local advertising revenueNational advertising revenueOther revenue
Pre-tax MarginCAGR = Compound Annual Growth Rate
Profitability (%)Operating MarginP.B.I.T. Margin
Average Staff CountAverage Remuneration ($)
Subscribers
Total Canadian Programming 29.7
Canadian Programming/Revenue (%)
Total Remuneration ($)
Script & conceptFiller Programming + Program ProductionInvestment in Programming
Page 132

Undertaking # Service Name
305425531 Leafs TV
2011 2012 Var % 2013 Var % 2014 Var % 2015 Var %
y1 y2 y3 y4 y5
8,701,646 9,604,042 10.37 7,373,309 -23.23 10,874,189 47.48 5,637,213 -48.16
3,624,299 3,765,997 3.91 3,332,632 -11.51 5,220,764 56.66 1,473,811 -71.77
0 0 0 0 0
0 0 0 0 0
3,527,556 3,639,949 3.19 3,211,968 -11.76 5,083,245 58.26 1,374,900 -72.95
0 0 0 0 0
3,527,556 3,639,949 3.19 3,211,968 -11.76 5,083,245 58.26 1,374,900 -72.95
40.54 37.90 43.56 46.75 24.39
CRTC - FINANCIAL SUMMARY - PAY & SPECIALTY
Pay and Specialty
Licensee Licensee Ultimate Owner Type Year
Total ExpensesOperating IncomeDepreciation
TechnicalSales and PromotionAdministration and General
Total Revenue -10.3
ExpensesProgramming and Production -20.1
Local advertising revenueNational advertising revenueOther revenue
RevenueResidential/bulk/smatv subscriber revenueDTH revenue
Toronto Maple Leafs Network Ltd. 8047286 Canada Inc. Specialty (category B service) 2015
($) CAGR (%)
Profitability (%)Operating MarginP.B.I.T. Margin
Average Staff CountAverage Remuneration ($)
Subscribers
Total Canadian Programming -21.0
Canadian Programming/Revenue (%)
Total Remuneration ($)
Script & conceptFiller Programming + Program Production -21.0
Investment in Programming
Pre-tax Profit
Canadian Programming ExpensesAcquisition of rights
P.B.I.T.
Interest ExpenseAdjustments - Gain (Loss)
Pre-tax MarginCAGR = Compound Annual Growth Rate
Page 133

Undertaking # Service Name
205417406 Le Canal Nouvelles (LCN)
2011 2012 Var % 2013 Var % 2014 Var % 2015 Var %
y1 y2 y3 y4 y5
9,216,001 9,693,224 5.18 11,463,561 18.26 11,887,034 3.69 13,289,794 11.80
3,135,580 3,594,519 14.64 4,883,304 35.85 5,558,279 13.82 3,556,901 -36.01
0 0 0 0 0
15,204,635 16,005,919 5.27 15,407,225 -3.74 13,771,750 -10.61 12,106,712 -12.09
1,128,740 1,089,839 -3.45 493,542 -54.71 411,318 -16.66 450,720 9.58
28,684,956 30,383,501 5.92 32,247,632 6.14 31,628,381 -1.92 29,404,127 -7.03
16,862,448 16,537,480 -1.93 18,327,281 10.82 19,181,270 4.66 18,002,467 -6.15
765,638 931,619 21.68 1,029,330 10.49 707,002 -31.31 888,657 25.69
1,494,048 2,103,148 40.77 1,917,086 -8.85 1,566,491 -18.29 1,574,995 0.54
1,144,732 1,698,336 48.36 2,093,167 23.25 2,139,774 2.23 2,182,335 1.99
20,266,866 21,270,583 4.95 23,366,864 9.86 23,594,537 0.97 22,648,454 -4.01
8,418,090 9,112,918 8,880,768 8,033,844 6,755,673
300,000 300,000 0.00 300,000 0.00 300,000 0.00 300,000 0.00
8,118,090 8,812,918 8,580,768 7,733,844 6,455,673
0 0 0 0 0
0 0 0 0 0
8,118,090 8,812,918 8,580,768 7,733,844 6,455,673
0 0 0 0 0
0 0 0 0 0
16,064,773 16,532,067 2.91 18,323,221 10.83 19,181,270 4.68 18,002,467 -6.15
0 0 0 0 0
16,064,773 16,532,067 2.91 18,323,221 10.83 19,181,270 4.68 18,002,467 -6.15
56.00 54.41 56.82 60.65 61.22
7,076,412 7,923,696 11.97 8,011,467 1.11 7,865,609 -1.82 6,997,435 -11.04
68 74 8.82 83 12.16 82 -1.20 72 -12.20
104,065 107,077 2.89 96,524 -9.86 95,922 -0.62 97,187 1.32
2,263,742 2,432,684 7.46 2,482,223 2.04 2,661,790 7.23 2,561,661 -3.76
29.3 30.0 27.5 25.4 23.0
28.3 29.0 26.6 24.5 22.0
28.3 29.0 26.6 24.5 22.0
Total Revenue 0.6
ExpensesProgramming and Production 1.7
Local advertising revenueNational advertising revenue -5.5
Other revenue -20.5
RevenueResidential/bulk/smatv subscriber revenue 9.6
DTH revenue 3.2
Groupe TVA inc. Les Placements Péladeau inc. Specialty (category C service) 2015
($) CAGR (%)
CRTC - FINANCIAL SUMMARY - PAY & SPECIALTY
Pay and Specialty
Licensee Licensee Ultimate Owner Type Year
Total Canadian Programming 2.9
Canadian Programming/Revenue (%)
Total Remuneration ($) -0.3
Script & conceptFiller Programming + Program Production 2.9
Investment in Programming
Pre-tax Profit
Canadian Programming ExpensesAcquisition of rights
P.B.I.T.
Interest ExpenseAdjustments - Gain (Loss)
Total Expenses 2.8
Operating IncomeDepreciation 0.0
Technical 3.8
Sales and Promotion 1.3
Administration and General 17.5
Pre-tax MarginCAGR = Compound Annual Growth Rate
Profitability (%)Operating MarginP.B.I.T. Margin
Average Staff CountAverage Remuneration ($) -1.7
Subscribers 3.1
Page 134

Undertaking # Service Name
214301137 Le Réseau des Sports (RDS)
2011 2012 Var % 2013 Var % 2014 Var % 2015 Var %
y1 y2 y3 y4 y5
41,691,031 75,557,599 81.23 89,911,769 19.00 88,210,437 -1.89 88,995,095 0.89
16,014,025 29,148,638 82.02 27,297,493 -6.35 24,857,259 -8.94 22,700,805 -8.68
0 0 0 0 0
63,265,918 62,730,891 -0.85 50,608,461 -19.32 64,524,513 27.50 50,781,113 -21.30
8,995,100 0 -100.00 0 0 0
129,966,074 167,437,128 28.83 167,817,723 0.23 177,592,209 5.82 162,477,013 -8.51
71,965,077 115,318,741 60.24 90,699,466 -21.35 107,080,263 18.06 117,847,036 10.05
2,950,208 1,711,144 -42.00 997,080 -41.73 947,483 -4.97 1,012,349 6.85
11,956,020 12,127,659 1.44 12,395,973 2.21 10,399,511 -16.11 11,084,806 6.59
11,705,864 11,217,502 -4.17 13,026,892 16.13 12,227,805 -6.13 11,050,784 -9.63
98,577,169 140,375,046 42.40 117,119,411 -16.57 130,655,062 11.56 140,994,975 7.91
31,388,905 27,062,082 50,698,312 46,937,147 21,482,038
1,869,040 1,944,398 4.03 1,553,004 -20.13 1,940,322 24.94 2,183,735 12.54
29,519,865 25,117,684 49,145,308 44,996,825 19,298,303
0 0 0 0 0
622,888 592,722 -4.84 290,324 -51.02 410,945 41.55 578,906 40.87
30,142,753 25,710,406 49,435,632 45,407,770 19,877,209
34,561,262 36,432,039 5.41 27,965,648 -23.24 36,637,501 31.01 60,548,163 65.26
0 0 0 0 0
31,540,865 44,465,835 40.98 39,816,638 -10.46 46,335,112 16.37 46,795,693 0.99
0 0 0 0 0
66,102,127 80,897,874 22.38 67,782,286 -16.21 82,972,613 22.41 107,343,856 29.37
50.86 48.32 40.39 46.72 66.07
25,716,571 31,761,114 23.50 31,479,052 -0.89 23,028,577 -26.84 17,912,073 -22.22
323 409 26.63 404 -1.22 303 -25.00 236 -22.11
79,618 77,656 -2.46 77,918 0.34 76,002 -2.46 75,899 -0.14
3,445,734 3,514,326 1.99 3,334,671 -5.11 3,241,475 -2.79 3,149,012 -2.85
24.2 16.2 30.2 26.4 13.2
22.7 15.0 29.3 25.3 11.9
23.2 15.4 29.5 25.6 12.2
CRTC - FINANCIAL SUMMARY - PAY & SPECIALTY
Pay and Specialty
Licensee Licensee Ultimate Owner Type Year
Total Expenses 9.4
Operating IncomeDepreciation 4.0
Technical -23.5
Sales and Promotion -1.9
Administration and General -1.4
Total Revenue 5.7
ExpensesProgramming and Production 13.1
Local advertising revenueNational advertising revenue -5.4
Other revenue -100.0
RevenueResidential/bulk/smatv subscriber revenue 20.9
DTH revenue 9.1
Le Réseau des sports (RDS) inc. BCE Inc. Specialty (category C service) 2015
($) CAGR (%)
Profitability (%)Operating MarginP.B.I.T. Margin
Average Staff CountAverage Remuneration ($) -1.2
Subscribers -2.2
Total Canadian Programming 12.9
Canadian Programming/Revenue (%)
Total Remuneration ($) -8.6
Script & conceptFiller Programming + Program Production 10.4
Investment in Programming
Pre-tax Profit
Canadian Programming ExpensesAcquisition of rights 15.1
P.B.I.T.
Interest ExpenseAdjustments - Gain (Loss)
Pre-tax MarginCAGR = Compound Annual Growth Rate
Page 135

Undertaking # Service Name
305425002 Lifetime (formerly Showcase Diva)
2011 2012 Var % 2013 Var % 2014 Var % 2015 Var %
y1 y2 y3 y4 y5
3,953,437 6,028,656 52.49 6,761,852 12.16 7,278,165 7.64 7,514,457 3.25
4,058,800 3,287,677 -19.00 3,430,643 4.35 3,233,295 -5.75 3,483,646 7.74
0 0 0 0 0
6,881,979 8,176,657 18.81 11,973,957 46.44 11,235,222 -6.17 9,876,197 -12.10
0 0 0 0 0
14,894,216 17,492,990 17.45 22,166,452 26.72 21,746,682 -1.89 20,874,300 -4.01
5,872,974 4,246,471 -27.69 6,765,189 59.31 9,390,146 38.80 8,966,164 -4.52
674,770 663,996 -1.60 648,410 -2.35 727,646 12.22 745,634 2.47
575,942 986,029 71.20 1,454,500 47.51 676,609 -53.48 313,447 -53.67
1,069,484 912,661 -14.66 2,134,677 133.90 2,808,975 31.59 3,641,363 29.63
8,193,170 6,809,157 -16.89 11,002,776 61.59 13,603,376 23.64 13,666,608 0.46
6,701,046 10,683,833 11,163,676 8,143,306 7,207,692
0 1,827 0 -100.00 0 0
6,701,046 10,682,006 11,163,676 8,143,306 7,207,692
1,362,341 9,867 -99.28 9,315 -5.59 1,253 -86.55 0 -100.00
0 0 0 0 0
5,338,705 10,672,139 11,154,361 8,142,053 7,207,692
165,719 312,050 88.30 320,515 2.71 317,725 -0.87 309,495 -2.59
0 0 0 0 0
337,535 356,609 5.65 371,166 4.08 456,859 23.09 417,679 -8.58
0 0 0 0 0
503,254 668,659 32.87 691,681 3.44 774,584 11.99 727,174 -6.12
3.38 3.82 3.12 3.56 3.48
788,618 1,021,030 29.47 979,492 -4.07 1,476,678 50.76 1,329,166 -9.99
10 12 20.00 11 -8.33 16 45.45 14 -12.50
78,862 85,086 7.89 89,045 4.65 92,292 3.65 94,940 2.87
4,366,238 4,341,904 -0.56 4,193,191 -3.43 4,024,923 -4.01 3,776,495 -6.17
45.0 61.1 50.4 37.4 34.5
45.0 61.1 50.4 37.4 34.5
35.8 61.0 50.3 37.4 34.5
Total Revenue 8.8
ExpensesProgramming and Production 11.2
Local advertising revenueNational advertising revenue 9.5
Other revenue
RevenueResidential/bulk/smatv subscriber revenue 17.4
DTH revenue -3.8
Showcase Television Inc. Shaw Communications Inc. Specialty (category B service) 2015
($) CAGR (%)
CRTC - FINANCIAL SUMMARY - PAY & SPECIALTY
Pay and Specialty
Licensee Licensee Ultimate Owner Type Year
Total Canadian Programming 9.6
Canadian Programming/Revenue (%)
Total Remuneration ($) 13.9
Script & conceptFiller Programming + Program Production 5.5
Investment in Programming
Pre-tax Profit
Canadian Programming ExpensesAcquisition of rights 16.9
P.B.I.T.
Interest ExpenseAdjustments - Gain (Loss)
Total Expenses 13.7
Operating IncomeDepreciation
Technical 2.5
Sales and Promotion -14.1
Administration and General 35.8
Pre-tax MarginCAGR = Compound Annual Growth Rate
Profitability (%)Operating MarginP.B.I.T. Margin
Average Staff CountAverage Remuneration ($) 4.8
Subscribers -3.6
Page 136

Undertaking # Service Name
505424169 Live National Hockey League Games
2011 2012 Var % 2013 Var % 2014 Var % 2015 Var %
y1 y2 y3
0 184 0 -100.00
0 0 0
0 0 0
0 0 0
8,449 0 -100.00 0
8,449 184 -97.82 0 -100.00
0 184 0 -100.00
0 0 0
0 0 0
8,449 0 -100.00 0
8,449 184 -97.82 0 -100.00
0 0 0
0 0 0
0 0 0
0 0 0
0 0 0
0 0 0
0 184 0 -100.00
0 0 0
0 0 0
0 0 0
0 184 0 -100.00
0.00 100.00
0 0 0
0 0 0
0 0 0
0.0 0.0
0.0 0.0
0.0 0.0
RevenueResidential/bulk/smatv subscriber revenueDTH revenue
Breakaway PPV Corporation Breakaway PPV Holdings
Corporation
Pay-per-view Direct-to-Home 2013
($) CAGR (%)
CRTC - FINANCIAL SUMMARY - PAY & SPECIALTY
Pay and Specialty
Licensee Licensee Ultimate Owner Type Year
Pre-tax Profit
Canadian Programming ExpensesAcquisition of rights
P.B.I.T.
Interest ExpenseAdjustments - Gain (Loss)
Total ExpensesOperating IncomeDepreciation
TechnicalSales and PromotionAdministration and General
Total RevenueExpensesProgramming and Production
Local advertising revenueNational advertising revenueOther revenue
Pre-tax MarginCAGR = Compound Annual Growth Rate
Profitability (%)Operating MarginP.B.I.T. Margin
Average Staff CountAverage Remuneration ($)
Subscribers
Total Canadian Programming
Canadian Programming/Revenue (%)
Total Remuneration ($)
Script & conceptFiller Programming + Program ProductionInvestment in Programming
Page 137

Undertaking # Service Name
535420880 Love Nature (formerly Oasis HD)
2011 2012 Var % 2013 Var % 2014 Var % 2015 Var %
y1 y2 y3 y4 y5
4,819,825 5,640,552 17.03 6,353,456 12.64 7,040,936 10.82 7,269,260 3.24
2,088,436 2,203,411 5.51 1,945,971 -11.68 2,043,168 4.99 2,508,958 22.80
224,750 416,477 85.31 234,133 -43.78 144,279 -38.38 526,241 264.74
0 0 0 0 0
400,000 670,399 67.60 808,370 20.58 825,793 2.16 1,058,191 28.14
0 0 0 0 0
624,750 1,086,876 73.97 1,042,503 -4.08 970,072 -6.95 1,584,432 63.33
12.96 19.27 16.41 13.78 21.80
CRTC - FINANCIAL SUMMARY - PAY & SPECIALTY
Pay and Specialty
Licensee Licensee Ultimate Owner Type Year
Total ExpensesOperating IncomeDepreciation
TechnicalSales and PromotionAdministration and General
Total Revenue 10.8
ExpensesProgramming and Production 4.7
Local advertising revenueNational advertising revenueOther revenue
RevenueResidential/bulk/smatv subscriber revenueDTH revenue
Blue Ant Television Ltd. Blue Ant Media Inc. Specialty (category B service) 2015
($) CAGR (%)
Profitability (%)Operating MarginP.B.I.T. Margin
Average Staff CountAverage Remuneration ($)
Subscribers
Total Canadian Programming 26.2
Canadian Programming/Revenue (%)
Total Remuneration ($)
Script & conceptFiller Programming + Program Production 27.5
Investment in Programming
Pre-tax Profit
Canadian Programming ExpensesAcquisition of rights 23.7
P.B.I.T.
Interest ExpenseAdjustments - Gain (Loss)
Pre-tax MarginCAGR = Compound Annual Growth Rate
Page 138

Undertaking # Service Name
535423652 L S Times
2011 2012 Var % 2013 Var % 2014 Var % 2015 Var %
y1 y2 y3 y4 y5
845,862 1,350,675 59.68 1,617,438 19.75 2,202,252 36.16 1,809,008 -17.86
152,865 261,829 71.28 341,622 30.48 719,878 110.72 924,089 28.37
0 0 0 0 0
0 0 0 0 0
81,347 126,992 56.11 146,430 15.31 191,948 31.09 220,586 14.92
0 0 0 0 0
81,347 126,992 56.11 146,430 15.31 191,948 31.09 220,586 14.92
9.62 9.40 9.05 8.72 12.19
Total Revenue 20.9
ExpensesProgramming and Production 56.8
Local advertising revenueNational advertising revenueOther revenue
RevenueResidential/bulk/smatv subscriber revenueDTH revenue
L S Movie Channel Limited Wang, Danny Lon Wei Specialty (category B service) 2015
($) CAGR (%)
CRTC - FINANCIAL SUMMARY - PAY & SPECIALTY
Pay and Specialty
Licensee Licensee Ultimate Owner Type Year
Total Canadian Programming 28.3
Canadian Programming/Revenue (%)
Total Remuneration ($)
Script & conceptFiller Programming + Program Production 28.3
Investment in Programming
Pre-tax Profit
Canadian Programming ExpensesAcquisition of rights
P.B.I.T.
Interest ExpenseAdjustments - Gain (Loss)
Total ExpensesOperating IncomeDepreciation
TechnicalSales and PromotionAdministration and General
Pre-tax MarginCAGR = Compound Annual Growth Rate
Profitability (%)Operating MarginP.B.I.T. Margin
Average Staff CountAverage Remuneration ($)
Subscribers
Page 139

Undertaking # Service Name
305417364 M3 (formerly MuchMoreMusic)
2011 2012 Var % 2013 Var % 2014 Var % 2015 Var %
y1 y2 y3 y4 y5
4,636,715 4,807,039 3.67 4,450,591 -7.42 5,345,424 20.11 5,147,928 -3.69
1,387,559 1,549,314 11.66 1,749,979 12.95 1,836,134 4.92 1,878,646 2.32
0 0 0 0 0
11,371,867 11,135,083 -2.08 11,299,450 1.48 12,590,589 11.43 12,190,202 -3.18
0 8,000 0 -100.00 58,500 10,787 -81.56
17,396,141 17,499,436 0.59 17,500,020 0.00 19,830,647 13.32 19,227,563 -3.04
8,105,818 8,413,505 3.80 8,050,551 -4.31 13,337,503 65.67 12,745,836 -4.44
784,693 770,767 -1.77 759,702 -1.44 779,240 2.57 675,286 -13.34
1,142,482 1,012,207 -11.40 1,447,194 42.97 1,309,950 -9.48 1,131,422 -13.63
1,549,283 1,221,759 -21.14 1,280,005 4.77 1,388,146 8.45 1,476,988 6.40
11,582,276 11,418,238 -1.42 11,537,452 1.04 16,814,839 45.74 16,029,532 -4.67
5,813,865 6,081,198 5,962,568 3,015,808 3,198,031
1,196,891 413,975 -65.41 240,370 -41.94 305,120 26.94 339,104 11.14
4,616,974 5,667,223 5,722,198 2,710,688 2,858,927
0 0 0 0 0
-510,282 -1,189,803 133.17 -1,201,723 1.00 -1,560,850 29.88 -3,365,879 115.64
4,106,692 4,477,420 4,520,475 1,149,838 -506,952
0 162,725 38,117 -76.58 3,112,951 >999± 2,492,571 -19.93
0 0 0 0 0
5,171,753 3,249,838 -37.16 3,538,039 8.87 1,821,862 -48.51 720,680 -60.44
0 0 0 0 0
5,171,753 3,412,563 -34.02 3,576,156 4.79 4,934,813 37.99 3,213,251 -34.89
29.73 19.50 20.44 24.88 16.71
1,507,323 605,951 -59.80 878,293 44.94 829,303 -5.58 122,680 -85.21
8 6 -25.00 16 166.67 13 -18.75 1.79 -86.23
188,415 100,992 -46.40 54,893 -45.65 63,793 16.21 68,536 7.44
6,344,010 6,344,010 0.00 6,137,846 -3.25 6,043,115 -1.54 5,830,980 -3.51
33.4 34.8 34.1 15.2 16.6
26.5 32.4 32.7 13.7 14.9
23.6 25.6 25.8 5.8 -2.6
RevenueResidential/bulk/smatv subscriber revenue 2.7
DTH revenue 7.9
Bell Media Inc. BCE Inc. Specialty (category A service) 2015
($) CAGR (%)
CRTC - FINANCIAL SUMMARY - PAY & SPECIALTY
Pay and Specialty
Licensee Licensee Ultimate Owner Type Year
Pre-tax Profit
Canadian Programming ExpensesAcquisition of rights
P.B.I.T.
Interest ExpenseAdjustments - Gain (Loss)
Total Expenses 8.5
Operating IncomeDepreciation -27.0
Technical -3.7
Sales and Promotion -0.2
Administration and General -1.2
Total Revenue 2.5
ExpensesProgramming and Production 12.0
Local advertising revenueNational advertising revenue 1.8
Other revenue
Pre-tax MarginCAGR = Compound Annual Growth Rate
Profitability (%)Operating MarginP.B.I.T. Margin
Average Staff CountAverage Remuneration ($) -22.3
Subscribers -2.1
Total Canadian Programming -11.2
Canadian Programming/Revenue (%)
Total Remuneration ($) -46.6
Script & conceptFiller Programming + Program Production -38.9
Investment in Programming
Page 140

Undertaking # Service Name
305428600 Makeful TV (formerly BITE Television )
2011 2012 Var % 2013 Var % 2014 Var % 2015 Var %
y1 y2 y3 y4 y5
1,110,285 1,617,232 45.66 1,780,576 10.10 1,899,675 6.69 2,328,969 22.60
890,757 1,041,669 16.94 695,401 -33.24 1,005,361 44.57 1,539,904 53.17
592,983 153,959 -74.04 99,626 -35.29 277,949 178.99 469,740 69.00
0 0 0 0 0
22,412 410,453 >999± 120,774 -70.58 60,821 -49.64 29,567 -51.39
0 0 7,736 0 -100.00 285,250
615,395 564,412 -8.28 228,136 -59.58 338,770 48.49 784,557 131.59
55.43 34.90 12.81 17.83 33.69
CRTC - FINANCIAL SUMMARY - PAY & SPECIALTY
Pay and Specialty
Licensee Licensee Ultimate Owner Type Year
Total ExpensesOperating IncomeDepreciation
TechnicalSales and PromotionAdministration and General
Total Revenue 20.4
ExpensesProgramming and Production 14.7
Local advertising revenueNational advertising revenueOther revenue
RevenueResidential/bulk/smatv subscriber revenueDTH revenue
Blue Ant Media Partnership Blue Ant Media Inc. Specialty (category B service) 2015
($) CAGR (%)
Profitability (%)Operating MarginP.B.I.T. Margin
Average Staff CountAverage Remuneration ($)
Subscribers
Total Canadian Programming 6.3
Canadian Programming/Revenue (%)
Total Remuneration ($)
Script & conceptFiller Programming + Program Production 7.2
Investment in Programming
Pre-tax Profit
Canadian Programming ExpensesAcquisition of rights -5.7
P.B.I.T.
Interest ExpenseAdjustments - Gain (Loss)
Pre-tax MarginCAGR = Compound Annual Growth Rate
Page 141
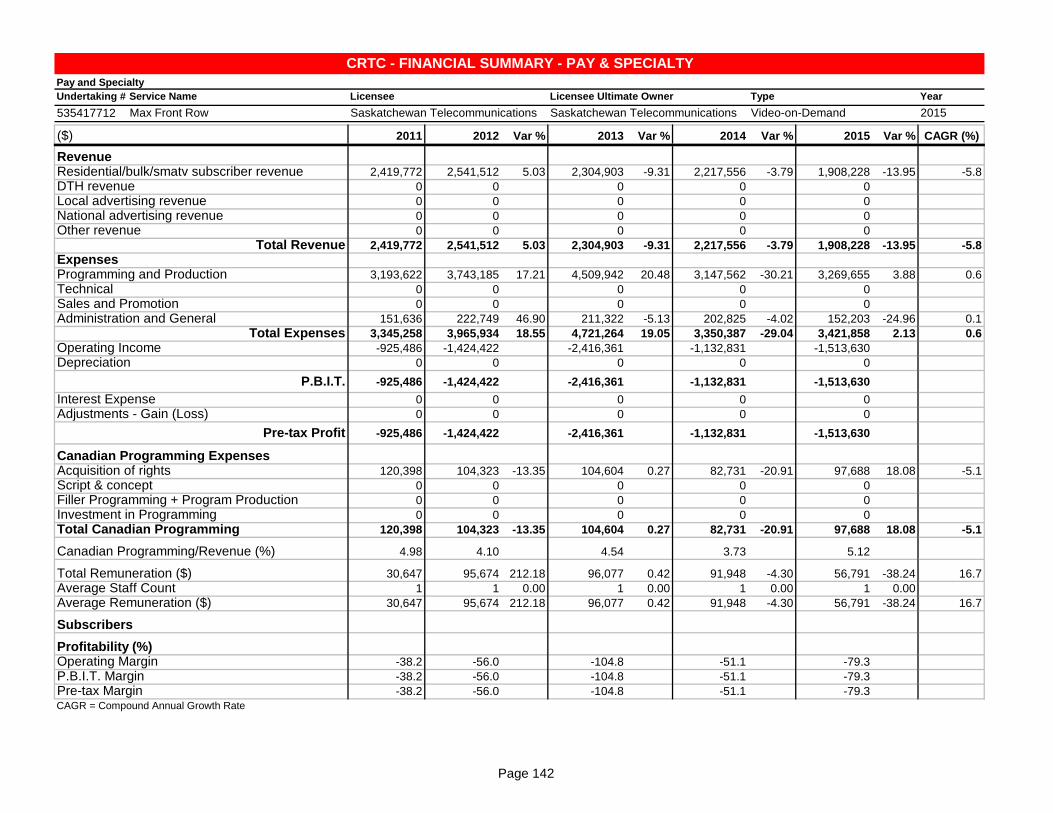
Undertaking # Service Name
535417712 Max Front Row
2011 2012 Var % 2013 Var % 2014 Var % 2015 Var %
y1 y2 y3 y4 y5
2,419,772 2,541,512 5.03 2,304,903 -9.31 2,217,556 -3.79 1,908,228 -13.95
0 0 0 0 0
0 0 0 0 0
0 0 0 0 0
0 0 0 0 0
2,419,772 2,541,512 5.03 2,304,903 -9.31 2,217,556 -3.79 1,908,228 -13.95
3,193,622 3,743,185 17.21 4,509,942 20.48 3,147,562 -30.21 3,269,655 3.88
0 0 0 0 0
0 0 0 0 0
151,636 222,749 46.90 211,322 -5.13 202,825 -4.02 152,203 -24.96
3,345,258 3,965,934 18.55 4,721,264 19.05 3,350,387 -29.04 3,421,858 2.13
-925,486 -1,424,422 -2,416,361 -1,132,831 -1,513,630
0 0 0 0 0
-925,486 -1,424,422 -2,416,361 -1,132,831 -1,513,630
0 0 0 0 0
0 0 0 0 0
-925,486 -1,424,422 -2,416,361 -1,132,831 -1,513,630
120,398 104,323 -13.35 104,604 0.27 82,731 -20.91 97,688 18.08
0 0 0 0 0
0 0 0 0 0
0 0 0 0 0
120,398 104,323 -13.35 104,604 0.27 82,731 -20.91 97,688 18.08
4.98 4.10 4.54 3.73 5.12
30,647 95,674 212.18 96,077 0.42 91,948 -4.30 56,791 -38.24
1 1 0.00 1 0.00 1 0.00 1 0.00
30,647 95,674 212.18 96,077 0.42 91,948 -4.30 56,791 -38.24
-38.2 -56.0 -104.8 -51.1 -79.3
-38.2 -56.0 -104.8 -51.1 -79.3
-38.2 -56.0 -104.8 -51.1 -79.3
Total Revenue -5.8
ExpensesProgramming and Production 0.6
Local advertising revenueNational advertising revenueOther revenue
RevenueResidential/bulk/smatv subscriber revenue -5.8
DTH revenue
Saskatchewan Telecommunications Saskatchewan Telecommunications Video-on-Demand 2015
($) CAGR (%)
CRTC - FINANCIAL SUMMARY - PAY & SPECIALTY
Pay and Specialty
Licensee Licensee Ultimate Owner Type Year
Total Canadian Programming -5.1
Canadian Programming/Revenue (%)
Total Remuneration ($) 16.7
Script & conceptFiller Programming + Program ProductionInvestment in Programming
Pre-tax Profit
Canadian Programming ExpensesAcquisition of rights -5.1
P.B.I.T.
Interest ExpenseAdjustments - Gain (Loss)
Total Expenses 0.6
Operating IncomeDepreciation
TechnicalSales and PromotionAdministration and General 0.1
Pre-tax MarginCAGR = Compound Annual Growth Rate
Profitability (%)Operating MarginP.B.I.T. Margin
Average Staff CountAverage Remuneration ($) 16.7
Subscribers
Page 142

Undertaking # Service Name
535423024 Mediaset Italia (formerly Italian
Entertainment TV)
2011 2012 Var % 2013 Var % 2014 Var % 2015 Var %
y1 y2 y3 y4 y5
237,500 328,878 38.47 721,009 119.23 986,639 36.84 1,777,662 80.17
166,523 104,762 -37.09 165,412 57.89 211,392 27.80 207,465 -1.86
4,000 4,000 0.00 4,000 0.00 4,000 0.00 4,000 0.00
0 0 0 0 0
0 0 0 0 0
0 0 0 0 0
4,000 4,000 0.00 4,000 0.00 4,000 0.00 4,000 0.00
1.68 1.22 0.55 0.41 0.23
RevenueResidential/bulk/smatv subscriber revenueDTH revenue
Telelatino Network Inc. Corus Entertainment Inc. Specialty (category B service) 2015
($) CAGR (%)
CRTC - FINANCIAL SUMMARY - PAY & SPECIALTY
Pay and Specialty
Licensee Licensee Ultimate Owner Type Year
Pre-tax Profit
Canadian Programming ExpensesAcquisition of rights 0.0
P.B.I.T.
Interest ExpenseAdjustments - Gain (Loss)
Total ExpensesOperating IncomeDepreciation
TechnicalSales and PromotionAdministration and General
Total Revenue 65.4
ExpensesProgramming and Production 5.7
Local advertising revenueNational advertising revenueOther revenue
Pre-tax MarginCAGR = Compound Annual Growth Rate
Profitability (%)Operating MarginP.B.I.T. Margin
Average Staff CountAverage Remuneration ($)
Subscribers
Total Canadian Programming 0.0
Canadian Programming/Revenue (%)
Total Remuneration ($)
Script & conceptFiller Programming + Program ProductionInvestment in Programming
Page 143

Undertaking # Service Name
535422761 MEGA Cosmos (formerly Greek TV 1)
2011 2012 Var % 2013 Var % 2014 Var % 2015 Var %
y1 y2
945,732 775,444 -18.01 -100.00
602,057 581,181 -3.47 -100.00
5,119 35,314 589.86 -100.00
6,826 47,086 589.80 -100.00
22,184 153,029 589.82 -100.00
0 0
34,129 235,429 589.82 -100.00
3.61 30.36
CRTC - FINANCIAL SUMMARY - PAY & SPECIALTY
Pay and Specialty
Licensee Licensee Ultimate Owner Type Year
Total ExpensesOperating IncomeDepreciation
TechnicalSales and PromotionAdministration and General
Total RevenueExpensesProgramming and Production
Local advertising revenueNational advertising revenueOther revenue
RevenueResidential/bulk/smatv subscriber revenueDTH revenue
Ethnic Channels Group Limited Levin, Slava Specialty (category B service) 2012
($) CAGR (%)
Profitability (%)Operating MarginP.B.I.T. Margin
Average Staff CountAverage Remuneration ($)
Subscribers
Total Canadian Programming
Canadian Programming/Revenue (%)
Total Remuneration ($)
Script & conceptFiller Programming + Program ProductionInvestment in Programming
Pre-tax Profit
Canadian Programming ExpensesAcquisition of rights
P.B.I.T.
Interest ExpenseAdjustments - Gain (Loss)
Pre-tax MarginCAGR = Compound Annual Growth Rate
Page 144

Undertaking # Service Name
535430516 Moi&cie (formerly Mlle)
2011 2012 Var % 2013 Var % 2014 Var % 2015 Var %
y1 y2 y3 y4 y5
44,935 1,381,860 >999± 2,097,715 51.80 2,718,069 29.57 4,066,048 49.59
0 466,045 977,400 109.72 1,170,016 19.71 849,503 -27.39
0 0 0 0 0
322,346 728,491 126.00 431,181 -40.81 650,145 50.78 886,627 36.37
58,965 85,477 44.96 19,982 -76.62 22,731 13.76 38,265 68.34
426,246 2,661,873 524.49 3,526,278 32.47 4,560,961 29.34 5,840,443 28.05
1,414,293 4,011,442 183.64 5,838,531 45.55 6,698,346 14.73 6,114,348 -8.72
229,325 565,348 146.53 485,050 -14.20 241,615 -50.19 91,561 -62.10
950,493 295,707 -68.89 960,790 224.91 508,791 -47.04 517,211 1.65
164,929 217,257 31.73 187,731 -13.59 232,532 23.86 209,357 -9.97
2,759,040 5,089,754 84.48 7,472,102 46.81 7,681,284 2.80 6,932,477 -9.75
-2,332,794 -2,427,881 -3,945,824 -3,120,323 -1,092,034
165,200 100,000 -39.47 100,000 0.00 100,000 0.00 100,000 0.00
-2,497,994 -2,527,881 -4,045,824 -3,220,323 -1,192,034
155,800 156,417 0.40 160,623 2.69 127,555 -20.59 87,888 -31.10
0 0 0 0 0
-2,653,794 -2,684,298 -4,206,447 -3,347,878 -1,279,922
1,185,012 3,193,346 169.48 5,072,463 58.84 5,023,030 -0.97 4,382,073 -12.76
0 0 0 0 0
0 0 0 0 0
0 0 0 0 0
1,185,012 3,193,346 169.48 5,072,463 58.84 5,023,030 -0.97 4,382,073 -12.76
278.01 119.97 143.85 110.13 75.03
247,726 311,856 25.89 171,755 -44.92 103,533 -39.72 258,363 149.55
3 3 0.00 2 -33.33 2 0.00 3.18 59.00
82,575 103,952 25.89 85,878 -17.39 51,767 -39.72 81,246 56.95
89,872 400,022 345.10 552,395 38.09 691,879 25.25 852,531 23.22
-547.3 -91.2 -111.9 -68.4 -18.7
-586.0 -95.0 -114.7 -70.6 -20.4
-622.6 -100.8 -119.3 -73.4 -21.9
Total Revenue 92.4
ExpensesProgramming and Production 44.2
Local advertising revenueNational advertising revenue 28.8
Other revenue -10.3
RevenueResidential/bulk/smatv subscriber revenue 208.4
DTH revenue
Groupe TVA inc. Les Placements Péladeau inc. Specialty (category B service) 2015
($) CAGR (%)
CRTC - FINANCIAL SUMMARY - PAY & SPECIALTY
Pay and Specialty
Licensee Licensee Ultimate Owner Type Year
Total Canadian Programming 38.7
Canadian Programming/Revenue (%)
Total Remuneration ($) 1.1
Script & conceptFiller Programming + Program ProductionInvestment in Programming
Pre-tax Profit
Canadian Programming ExpensesAcquisition of rights 38.7
P.B.I.T.
Interest ExpenseAdjustments - Gain (Loss)
Total Expenses 25.9
Operating IncomeDepreciation -11.8
Technical -20.5
Sales and Promotion -14.1
Administration and General 6.1
Pre-tax MarginCAGR = Compound Annual Growth Rate
Profitability (%)Operating MarginP.B.I.T. Margin
Average Staff CountAverage Remuneration ($) -0.4
Subscribers 75.5
Page 145

Undertaking # Service Name
535420054 Mountain Cablevision Limited, Hamilton
2011 2012 Var % 2013 Var % 2014 Var % 2015 Var %
y1
458,776 -100.00
0
0
0
0
458,776 -100.00
425,258 -100.00
0
0
51,652 -100.00
476,910 -100.00
-18,134
0
-18,134
0
0
-18,134
0
0
0
0
0
0.00
0
0
-4.0
-4.0
-4.0
RevenueResidential/bulk/smatv subscriber revenueDTH revenue
Mountain Cablevision Limited Shaw Communications Inc. Video-on-Demand 2011
($) CAGR (%)
CRTC - FINANCIAL SUMMARY - PAY & SPECIALTY
Pay and Specialty
Licensee Licensee Ultimate Owner Type Year
Pre-tax Profit
Canadian Programming ExpensesAcquisition of rights
P.B.I.T.
Interest ExpenseAdjustments - Gain (Loss)
Total ExpensesOperating IncomeDepreciation
TechnicalSales and PromotionAdministration and General
Total RevenueExpensesProgramming and Production
Local advertising revenueNational advertising revenueOther revenue
Pre-tax MarginCAGR = Compound Annual Growth Rate
Profitability (%)Operating MarginP.B.I.T. Margin
Average Staff CountAverage Remuneration ($)
Subscribers
Total Canadian Programming
Canadian Programming/Revenue (%)
Total Remuneration ($)
Script & conceptFiller Programming + Program ProductionInvestment in Programming
Page 146

Undertaking # Service Name
435101126 Movie Central
2011 2012 Var % 2013 Var % 2014 Var % 2015 Var %
y1 y2 y3 y4 y5
73,713,319 61,893,929 -16.03 60,770,002 -1.82 52,677,186 -13.32 52,268,906 -0.78
36,785,207 34,163,111 -7.13 34,052,295 -0.32 32,360,097 -4.97 29,465,405 -8.95
0 0 0 0 0
0 0 0 0 0
0 0 0 0 0
110,498,526 96,057,040 -13.07 94,822,297 -1.29 85,037,283 -10.32 81,734,311 -3.88
71,021,224 66,496,719 -6.37 64,160,905 -3.51 62,579,566 -2.46 76,037,727 21.51
2,139,654 1,724,348 -19.41 1,698,572 -1.49 1,590,202 -6.38 1,538,138 -3.27
3,926,344 3,685,923 -6.12 3,627,007 -1.60 3,201,543 -11.73 2,691,969 -15.92
14,079,203 13,942,826 -0.97 10,997,540 -21.12 9,876,799 -10.19 7,030,851 -28.81
91,166,425 85,849,816 -5.83 80,484,024 -6.25 77,248,110 -4.02 87,298,685 13.01
19,332,101 10,207,224 14,338,273 7,789,173 -5,564,374
0 1,841,748 2,029,820 10.21 1,376,056 -32.21 1,256,198 -8.71
19,332,101 8,365,476 12,308,453 6,413,117 -6,820,572
2,558,534 2,644,929 3.38 2,978,070 12.60 3,070,986 3.12 4,063,066 32.30
7,442,294 20,344,462 173.36 18,039,609 -11.33 27,916,744 54.75 26,893,845 -3.66
24,215,861 26,065,009 27,369,992 31,258,875 16,010,207
12,116,263 11,853,119 -2.17 12,156,367 2.56 13,204,280 8.62 13,905,059 5.31
1,670,677 813,390 -51.31 844,046 3.77 576,974 -31.64 376,032 -34.83
448,927 613,610 36.68 740,257 20.64 635,733 -14.12 910,512 43.22
3,416,531 1,306,582 -61.76 458,872 -64.88 -118,549 -125.83 9,166,589 >999±
17,652,398 14,586,701 -17.37 14,199,542 -2.65 14,298,438 0.70 24,358,192 70.36
15.98 15.19 14.97 16.81 29.80
4,104,964 3,024,715 -26.32 2,903,419 -4.01 2,020,748 -30.40 1,373,519 -32.03
41 38 -7.32 32 -15.79 34 6.25 46 35.29
100,121 79,598 -20.50 90,732 13.99 59,434 -34.50 29,859 -49.76
983,663 976,152 -0.76 995,496 1.98 926,923 -6.89 885,509 -4.47
17.5 10.6 15.1 9.2 -6.8
17.5 8.7 13.0 7.5 -8.3
21.9 27.1 28.9 36.8 19.6
CRTC - FINANCIAL SUMMARY - PAY & SPECIALTY
Pay and Specialty
Licensee Licensee Ultimate Owner Type Year
Total Expenses -1.1
Operating IncomeDepreciation
Technical -7.9
Sales and Promotion -9.0
Administration and General -15.9
Total Revenue -7.3
ExpensesProgramming and Production 1.7
Local advertising revenueNational advertising revenueOther revenue
RevenueResidential/bulk/smatv subscriber revenue -8.2
DTH revenue -5.4
Movie Central Ltd. Corus Entertainment Inc. Pay-TV (category A service) 2015
($) CAGR (%)
Profitability (%)Operating MarginP.B.I.T. Margin
Average Staff CountAverage Remuneration ($) -26.1
Subscribers -2.6
Total Canadian Programming 8.4
Canadian Programming/Revenue (%)
Total Remuneration ($) -23.9
Script & concept -31.1
Filler Programming + Program Production 19.3
Investment in Programming 28.0
Pre-tax Profit
Canadian Programming ExpensesAcquisition of rights 3.5
P.B.I.T.
Interest ExpenseAdjustments - Gain (Loss)
Pre-tax MarginCAGR = Compound Annual Growth Rate
Page 147

Undertaking # Service Name
305426000 MovieTime (formerly known as Lonestar)
2011 2012 Var % 2013 Var % 2014 Var % 2015 Var %
y1 y2 y3 y4 y5
3,084,635 6,047,425 96.05 6,514,327 7.72 5,289,751 -18.80 5,626,262 6.36
2,446,518 2,307,643 -5.68 1,999,384 -13.36 2,133,648 6.72 2,363,140 10.76
0 0 0 0 0
3,950,638 5,427,848 37.39 6,604,273 21.67 7,647,716 15.80 8,014,310 4.79
0 0 0 0 0
9,481,791 13,782,916 45.36 15,117,984 9.69 15,071,115 -0.31 16,003,712 6.19
2,883,440 2,775,660 -3.74 3,098,071 11.62 3,305,418 6.69 3,292,428 -0.39
585,285 753,016 28.66 636,074 -15.53 926,916 45.72 935,737 0.95
944,622 503,361 -46.71 167,444 -66.73 143,556 -14.27 158,751 10.58
548,539 733,862 33.78 814,836 11.03 1,410,974 73.16 1,423,693 0.90
4,961,886 4,765,899 -3.95 4,716,425 -1.04 5,786,864 22.70 5,810,609 0.41
4,519,905 9,017,017 10,401,559 9,284,251 10,193,103
0 0 0 0 0
4,519,905 9,017,017 10,401,559 9,284,251 10,193,103
1,227 0 -100.00 0 0 0
0 0 0 0 0
4,518,678 9,017,017 10,401,559 9,284,251 10,193,103
195,659 143,310 -26.76 148,125 3.36 147,408 -0.48 128,672 -12.71
0 0 0 0 0
0 276,410 284,776 3.03 210,094 -26.22 202,223 -3.75
0 0 0 0 0
195,659 419,720 114.52 432,901 3.14 357,502 -17.42 330,895 -7.44
2.06 3.05 2.86 2.37 2.07
1,087,071 970,123 -10.76 953,142 -1.75 1,110,508 16.51 1,006,803 -9.34
23 13 -43.48 12 -7.69 13 8.33 12 -7.69
47,264 74,625 57.89 79,429 6.44 85,424 7.55 83,900 -1.78
4,257,639 5,106,370 19.93 5,206,356 1.96 4,439,145 -14.74 4,247,136 -4.33
47.7 65.4 68.8 61.6 63.7
47.7 65.4 68.8 61.6 63.7
47.7 65.4 68.8 61.6 63.7
Total Revenue 14.0
ExpensesProgramming and Production 3.4
Local advertising revenueNational advertising revenue 19.3
Other revenue
RevenueResidential/bulk/smatv subscriber revenue 16.2
DTH revenue -0.9
Shaw Television Limited Partnership Shaw Communications Inc. Specialty (category B service) 2015
($) CAGR (%)
CRTC - FINANCIAL SUMMARY - PAY & SPECIALTY
Pay and Specialty
Licensee Licensee Ultimate Owner Type Year
Total Canadian Programming 14.0
Canadian Programming/Revenue (%)
Total Remuneration ($) -1.9
Script & conceptFiller Programming + Program ProductionInvestment in Programming
Pre-tax Profit
Canadian Programming ExpensesAcquisition of rights -10.0
P.B.I.T.
Interest ExpenseAdjustments - Gain (Loss)
Total Expenses 4.0
Operating IncomeDepreciation
Technical 12.5
Sales and Promotion -36.0
Administration and General 26.9
Pre-tax MarginCAGR = Compound Annual Growth Rate
Profitability (%)Operating MarginP.B.I.T. Margin
Average Staff CountAverage Remuneration ($) 15.4
Subscribers -0.1
Page 148

Undertaking # Service Name
535418132 MTS Video on Demand
2011 2012 Var % 2013 Var % 2014 Var % 2015 Var %
y1 y2 y3 y4 y5
3,382,461 3,318,968 -1.88 3,315,475 -0.11 3,089,318 -6.82 2,880,809 -6.75
0 0 0 0 0
0 0 0 0 0
0 0 0 0 0
0 0 0 0 0
3,382,461 3,318,968 -1.88 3,315,475 -0.11 3,089,318 -6.82 2,880,809 -6.75
2,437,212 3,038,325 24.66 2,742,549 -9.73 2,361,441 -13.90 2,332,739 -1.22
1,150,309 944,438 -17.90 1,338,123 41.68 1,063,139 -20.55 1,030,034 -3.11
626,270 456,435 -27.12 488,794 7.09 405,304 -17.08 281,609 -30.52
303,478 222,085 -26.82 238,406 7.35 200,409 -15.94 176,324 -12.02
4,517,269 4,661,283 3.19 4,807,872 3.14 4,030,293 -16.17 3,820,706 -5.20
-1,134,808 -1,342,315 -1,492,397 -940,975 -939,897
0 0 0 0 0
-1,134,808 -1,342,315 -1,492,397 -940,975 -939,897
0 0 0 0 0
0 0 0 0 0
-1,134,808 -1,342,315 -1,492,397 -940,975 -939,897
761,799 1,362,334 78.83 1,176,889 -13.61 1,024,745 -12.93 757,309 -26.10
0 0 0 0 0
0 0 0 0 0
0 0 0 0 0
761,799 1,362,334 78.83 1,176,889 -13.61 1,024,745 -12.93 757,309 -26.10
22.52 41.05 35.50 33.17 26.29
672,334 478,525 -28.83 513,660 7.34 466,709 -9.14 375,318 -19.58
10.83 7.5 -30.75 7.36 -1.87 6.67 -9.38 5.1 -23.54
62,081 63,803 2.77 69,791 9.38 69,971 0.26 73,592 5.17
-33.5 -40.4 -45.0 -30.5 -32.6
-33.5 -40.4 -45.0 -30.5 -32.6
-33.5 -40.4 -45.0 -30.5 -32.6
RevenueResidential/bulk/smatv subscriber revenue -3.9
DTH revenue
MTS Inc. Manitoba Telecom Services Inc. Video-on-Demand 2015
($) CAGR (%)
CRTC - FINANCIAL SUMMARY - PAY & SPECIALTY
Pay and Specialty
Licensee Licensee Ultimate Owner Type Year
Pre-tax Profit
Canadian Programming ExpensesAcquisition of rights -0.2
P.B.I.T.
Interest ExpenseAdjustments - Gain (Loss)
Total Expenses -4.1
Operating IncomeDepreciation
Technical -2.7
Sales and Promotion -18.1
Administration and General -12.7
Total Revenue -3.9
ExpensesProgramming and Production -1.1
Local advertising revenueNational advertising revenueOther revenue
Pre-tax MarginCAGR = Compound Annual Growth Rate
Profitability (%)Operating MarginP.B.I.T. Margin
Average Staff CountAverage Remuneration ($) 4.3
Subscribers
Total Canadian Programming -0.2
Canadian Programming/Revenue (%)
Total Remuneration ($) -13.6
Script & conceptFiller Programming + Program ProductionInvestment in Programming
Page 149

Undertaking # Service Name
405424037 MTV2 (formerly Razer)
2011 2012 Var % 2013 Var % 2014 Var % 2015 Var %
y1 y2 y3 y4 y5
1,826,368 1,961,686 7.41 2,006,405 2.28 2,048,564 2.10 2,395,116 16.92
2,488,102 2,552,731 2.60 2,718,536 6.50 2,906,568 6.92 2,971,283 2.23
0 0 0 0 0
312,387 169,307 -45.80 54,938 -67.55 122,920 123.74 165,002 34.24
0 0 0 0 0
4,626,857 4,683,724 1.23 4,779,879 2.05 5,078,052 6.24 5,531,401 8.93
3,801,365 1,849,412 -51.35 2,098,135 13.45 2,400,135 14.39 1,993,787 -16.93
513,027 493,407 -3.82 521,071 5.61 500,865 -3.88 471,618 -5.84
84,268 71,578 -15.06 36,520 -48.98 13,424 -63.24 12,231 -8.89
315,661 241,818 -23.39 248,194 2.64 245,627 -1.03 347,467 41.46
4,714,321 2,656,215 -43.66 2,903,920 9.33 3,160,051 8.82 2,825,103 -10.60
-87,464 2,027,509 1,875,959 1,918,001 2,706,298
370,824 169,585 -54.27 73,013 -56.95 79,702 9.16 95,200 19.44
-458,288 1,857,924 1,802,946 1,838,299 2,611,098
410,061 358,547 -12.56 319,711 -10.83 273,677 -14.40 219,630 -19.75
-135,720 -318,596 134.75 -328,518 3.11 -331,956 1.05 -135,047 -59.32
-1,004,069 1,180,781 1,154,717 1,232,666 2,256,421
22,533 0 -100.00 0 530,195 497,642 -6.14
0 0 0 0 0
2,246,248 548,666 -75.57 513,954 -6.33 0 -100.00 0
0 0 0 0 0
2,268,781 548,666 -75.82 513,954 -6.33 530,195 3.16 497,642 -6.14
49.04 11.71 10.75 10.44 9.00
104,758 60,226 -42.51 13,546 -77.51 0 -100.00 0
1 1 0.00 0.25 -75.00 0 -100.00 0
104,758 60,226 -42.51 54,184 -10.03
803,195 869,496 8.25 962,471 10.69 1,020,623 6.04 1,029,171 0.84
-1.9 43.3 39.2 37.8 48.9
-9.9 39.7 37.7 36.2 47.2
-21.7 25.2 24.2 24.3 40.8
CRTC - FINANCIAL SUMMARY - PAY & SPECIALTY
Pay and Specialty
Licensee Licensee Ultimate Owner Type Year
Total Expenses -12.0
Operating IncomeDepreciation -28.8
Technical -2.1
Sales and Promotion -38.3
Administration and General 2.4
Total Revenue 4.6
ExpensesProgramming and Production -14.9
Local advertising revenueNational advertising revenue -14.8
Other revenue
RevenueResidential/bulk/smatv subscriber revenue 7.0
DTH revenue 4.5
Bell Media Inc. BCE Inc. Specialty (category A service) 2015
($) CAGR (%)
Profitability (%)Operating MarginP.B.I.T. Margin
Average Staff CountAverage Remuneration ($)
Subscribers 6.4
Total Canadian Programming -31.6
Canadian Programming/Revenue (%)
Total Remuneration ($) -100.0
Script & conceptFiller Programming + Program Production -100.0
Investment in Programming
Pre-tax Profit
Canadian Programming ExpensesAcquisition of rights 116.8
P.B.I.T.
Interest ExpenseAdjustments - Gain (Loss)
Pre-tax MarginCAGR = Compound Annual Growth Rate
Page 150

Undertaking # Service Name
305417372 MTV (Canada) (formerly known as Talk
TV)
2011 2012 Var % 2013 Var % 2014 Var % 2015 Var %
y1 y2 y3 y4 y5
7,443,349 8,310,653 11.65 9,124,244 9.79 9,487,422 3.98 8,333,838 -12.16
1,924,323 1,901,432 -1.19 1,857,369 -2.32 1,761,810 -5.14 1,649,250 -6.39
0 0 0 0 0
16,208,370 13,653,578 -15.76 12,192,391 -10.70 8,903,176 -26.98 8,401,166 -5.64
560,862 289,653 -48.36 1,053,215 263.61 615,863 -41.53 319,340 -48.15
26,136,904 24,155,316 -7.58 24,227,219 0.30 20,768,271 -14.28 18,703,594 -9.94
18,349,250 20,963,978 14.25 18,751,536 -10.55 19,571,100 4.37 14,228,556 -27.30
441,380 600,601 36.07 841,691 40.14 921,168 9.44 812,726 -11.77
3,115,414 1,906,031 -38.82 2,582,562 35.49 1,836,930 -28.87 1,361,360 -25.89
2,419,101 1,545,467 -36.11 1,668,454 7.96 1,568,609 -5.98 1,740,119 10.93
24,325,145 25,016,077 2.84 23,844,243 -4.68 23,897,807 0.22 18,142,761 -24.08
1,811,759 -860,761 382,976 -3,129,536 560,833
1,656,508 1,696,937 2.44 1,741,095 2.60 1,591,357 -8.60 1,220,686 -23.29
155,251 -2,557,698 -1,358,119 -4,720,893 -659,853
522,702 1,946,113 272.32 1,811,697 -6.91 1,550,836 -14.40 1,252,118 -19.26
1,200 0 -100.00 -9,542 -164,572 >999± -896,946 445.02
-366,251 -4,503,811 -3,179,358 -6,436,301 -2,808,917
544,705 101,147 -81.43 157,268 55.48 1,410,014 796.57 2,476,930 75.67
50,000 50,000 0.00 0 -100.00 0 0
10,527,746 13,393,213 27.22 10,625,577 -20.66 8,897,941 -16.26 2,488,611 -72.03
0 0 0 0 0
11,122,451 13,544,360 21.77 10,782,845 -20.39 10,307,955 -4.40 4,965,541 -51.83
42.55 56.07 44.51 49.63 26.55
4,734,543 4,426,300 -6.51 5,254,518 18.71 3,705,127 -29.49 664,662 -82.06
60 60 0.00 61 1.67 42.76 -29.90 15 -64.92
78,909 73,772 -6.51 86,140 16.77 86,649 0.59 44,311 -48.86
6,744,628 6,501,481 -3.61 6,361,023 -2.16 6,073,352 -4.52 5,799,647 -4.51
6.9 -3.6 1.6 -15.1 3.0
0.6 -10.6 -5.6 -22.7 -3.5
-1.4 -18.6 -13.1 -31.0 -15.0
Total Revenue -8.0
ExpensesProgramming and Production -6.2
Local advertising revenueNational advertising revenue -15.2
Other revenue -13.1
RevenueResidential/bulk/smatv subscriber revenue 2.9
DTH revenue -3.8
Bell Media Inc. BCE Inc. Specialty (category A service) 2015
($) CAGR (%)
CRTC - FINANCIAL SUMMARY - PAY & SPECIALTY
Pay and Specialty
Licensee Licensee Ultimate Owner Type Year
Total Canadian Programming -18.3
Canadian Programming/Revenue (%)
Total Remuneration ($) -38.8
Script & concept -100.0
Filler Programming + Program Production -30.3
Investment in Programming
Pre-tax Profit
Canadian Programming ExpensesAcquisition of rights 46.0
P.B.I.T.
Interest ExpenseAdjustments - Gain (Loss)
Total Expenses -7.1
Operating IncomeDepreciation -7.4
Technical 16.5
Sales and Promotion -18.7
Administration and General -7.9
Pre-tax MarginCAGR = Compound Annual Growth Rate
Profitability (%)Operating MarginP.B.I.T. Margin
Average Staff CountAverage Remuneration ($) -13.4
Subscribers -3.7
Page 151

Undertaking # Service Name
314600545 Much (formerly MuchMusic)
2011 2012 Var % 2013 Var % 2014 Var % 2015 Var %
y1 y2 y3 y4 y5
9,828,999 9,643,912 -1.88 10,001,784 3.71 14,497,378 44.95 11,669,619 -19.51
4,302,107 4,171,984 -3.02 4,052,269 -2.87 3,795,013 -6.35 3,451,266 -9.06
0 0 0 0 0
29,936,543 23,548,003 -21.34 21,451,036 -8.91 17,980,975 -16.18 19,205,354 6.81
1,778,235 2,856,347 60.63 2,168,910 -24.07 1,089,649 -49.76 581,007 -46.68
45,845,884 40,220,246 -12.27 37,673,999 -6.33 37,363,015 -0.83 34,907,246 -6.57
21,979,479 27,754,547 26.27 29,040,186 4.63 27,859,983 -4.06 22,194,000 -20.34
1,422,191 1,173,149 -17.51 1,096,991 -6.49 1,077,755 -1.75 891,290 -17.30
3,974,876 3,813,391 -4.06 4,716,677 23.69 3,327,644 -29.45 2,374,811 -28.63
5,019,384 4,089,845 -18.52 4,315,919 5.53 4,989,369 15.60 4,641,865 -6.96
32,395,930 36,830,932 13.69 39,169,773 6.35 37,254,751 -4.89 30,101,966 -19.20
13,449,954 3,389,314 -1,495,774 108,264 4,805,280
3,827,311 1,610,344 -57.92 746,434 -53.65 751,584 0.69 771,030 2.59
9,622,643 1,778,970 -2,242,208 -643,320 4,034,250
0 152 707 365.13 -6,294 -990.24 -5,633 -10.50
-848,914 -2,254,658 165.59 -1,594,812 -29.27 -2,274,230 42.60 -298,651 -86.87
8,773,729 -475,840 -3,837,727 -2,911,256 3,741,232
938,749 849,455 -9.51 1,556,806 83.27 211,467 -86.42 39,381 -81.38
0 0 0 0 101,839
15,694,078 16,531,850 5.34 16,320,162 -1.28 15,294,276 -6.29 9,590,307 -37.29
0 0 0 0 0
16,632,827 17,381,305 4.50 17,876,968 2.85 15,505,743 -13.26 9,731,527 -37.24
36.28 43.22 47.45 41.50 27.88
6,181,646 6,261,453 1.29 6,608,785 5.55 4,087,723 -38.15 3,803,488 -6.95
84 74 -11.90 75 1.35 56.73 -24.36 47.43 -16.39
73,591 84,614 14.98 88,117 4.14 72,056 -18.23 80,192 11.29
8,411,528 9,308,782 10.67 9,248,193 -0.65 9,239,706 -0.09 9,048,672 -2.07
29.3 8.4 -4.0 0.3 13.8
21.0 4.4 -6.0 -1.7 11.6
19.1 -1.2 -10.2 -7.8 10.7
RevenueResidential/bulk/smatv subscriber revenue 4.4
DTH revenue -5.4
Bell Media Inc. BCE Inc. Specialty (category A service) 2015
($) CAGR (%)
CRTC - FINANCIAL SUMMARY - PAY & SPECIALTY
Pay and Specialty
Licensee Licensee Ultimate Owner Type Year
Pre-tax Profit
Canadian Programming ExpensesAcquisition of rights -54.7
P.B.I.T.
Interest ExpenseAdjustments - Gain (Loss)
Total Expenses -1.8
Operating IncomeDepreciation -33.0
Technical -11.0
Sales and Promotion -12.1
Administration and General -1.9
Total Revenue -6.6
ExpensesProgramming and Production 0.2
Local advertising revenueNational advertising revenue -10.5
Other revenue -24.4
Pre-tax MarginCAGR = Compound Annual Growth Rate
Profitability (%)Operating MarginP.B.I.T. Margin
Average Staff CountAverage Remuneration ($) 2.2
Subscribers 1.8
Total Canadian Programming -12.5
Canadian Programming/Revenue (%)
Total Remuneration ($) -11.4
Script & conceptFiller Programming + Program Production -11.6
Investment in Programming
Page 152

Undertaking # Service Name
305426539 MuchLoud
2011 2012 Var % 2013 Var % 2014 Var % 2015 Var %
y1 y2 y3 y4 y5
359,322 355,441 -1.08 332,973 -6.32 357,092 7.24 259,694 -27.28
0 0 0 0 0
0 0 0 0 0
0 0 0 0 0
0 0 0 0 0
359,322 355,441 -1.08 332,973 -6.32 357,092 7.24 259,694 -27.28
65,703 57,763 -12.08 39,394 -31.80 27,546 -30.08 26,133 -5.13
8,079 7,160 -11.38 6,244 -12.79 6,460 3.46 3,703 -42.68
9,573 5,728 -40.17 1,774 -69.03 383 -78.41 198 -48.30
83,548 62,006 -25.78 66,164 6.71 78,803 19.10 62,312 -20.93
166,903 132,657 -20.52 113,576 -14.38 113,192 -0.34 92,346 -18.42
192,419 222,784 219,397 243,900 167,348
126,737 110,909 -12.49 4,577 -95.87 5,091 11.23 4,127 -18.94
65,682 111,875 214,820 238,809 163,221
0 0 0 0 0
-10,540 -24,178 129.39 -22,885 -5.35 -22,867 -0.08 -3,242 -85.82
55,142 87,697 191,935 215,942 159,979
0 0 0 0 0
0 0 0 0 0
0 36,515 30,556 -16.32 23,167 -24.18 20,254 -12.57
0 0 0 0 0
0 36,515 30,556 -16.32 23,167 -24.18 20,254 -12.57
0.00 10.27 9.18 6.49 7.80
49,304 13,128 -73.37 0 -100.00 0 0
1 1 0.00 0 -100.00 0 0
49,304 13,128 -73.37
164,724 149,292 -9.37 135,392 -9.31 120,480 -11.01 111,017 -7.85
53.6 62.7 65.9 68.3 64.4
18.3 31.5 64.5 66.9 62.9
15.3 24.7 57.6 60.5 61.6
CRTC - FINANCIAL SUMMARY - PAY & SPECIALTY
Pay and Specialty
Licensee Licensee Ultimate Owner Type Year
Total Expenses -13.8
Operating IncomeDepreciation -57.5
Technical -17.7
Sales and Promotion -62.1
Administration and General -7.1
Total Revenue -7.8
ExpensesProgramming and Production -20.6
Local advertising revenueNational advertising revenueOther revenue
RevenueResidential/bulk/smatv subscriber revenue -7.8
DTH revenue
Bell Media Inc. BCE Inc. Specialty (category B service) 2015
($) CAGR (%)
Profitability (%)Operating MarginP.B.I.T. Margin
Average Staff CountAverage Remuneration ($)
Subscribers -9.4
Total Canadian Programming
Canadian Programming/Revenue (%)
Total Remuneration ($) -100.0
Script & conceptFiller Programming + Program ProductionInvestment in Programming
Pre-tax Profit
Canadian Programming ExpensesAcquisition of rights
P.B.I.T.
Interest ExpenseAdjustments - Gain (Loss)
Pre-tax MarginCAGR = Compound Annual Growth Rate
Page 153

Undertaking # Service Name
305426597 MuchRetro (formerly MuchMoreRetro)
2011 2012 Var % 2013 Var % 2014 Var % 2015 Var %
y1 y2 y3 y4 y5
744,860 823,633 10.58 792,241 -3.81 745,083 -5.95 634,796 -14.80
0 0 0 0 0
0 0 0 0 0
0 0 0 0 0
0 0 0 0 0
744,860 823,633 10.58 792,241 -3.81 745,083 -5.95 634,796 -14.80
102,338 92,538 -9.58 75,188 -18.75 61,727 -17.90 63,664 3.14
16,747 16,591 -0.93 14,856 -10.46 13,479 -9.27 9,051 -32.85
12,769 8,164 -36.06 3,164 -61.24 799 -74.75 484 -39.42
102,794 81,274 -20.94 87,440 7.59 98,853 13.05 85,598 -13.41
234,648 198,567 -15.38 180,648 -9.02 174,858 -3.21 158,797 -9.19
510,212 625,066 611,593 570,225 475,999
76,317 45,285 -40.66 10,891 -75.95 10,623 -2.46 10,087 -5.05
433,895 579,781 600,702 559,602 465,912
0 0 0 0 0
-21,849 -56,025 156.42 -54,450 -2.81 -47,712 -12.37 -7,924 -83.39
412,046 523,756 546,252 511,890 457,988
0 0 0 0 0
0 0 0 0 0
0 70,268 61,718 -12.17 53,087 -13.98 54,405 2.48
0 0 0 0 0
0 70,268 61,718 -12.17 53,087 -13.98 54,405 2.48
0.00 8.53 7.79 7.12 8.57
49,304 13,128 -73.37 0 -100.00 0 0
1 1 0.00 0 -100.00 0 0
49,304 13,128 -73.37
267,103 273,684 2.46 256,684 -6.21 251,534 -2.01 247,182 -1.73
68.5 75.9 77.2 76.5 75.0
58.3 70.4 75.8 75.1 73.4
55.3 63.6 69.0 68.7 72.1
Total Revenue -3.9
ExpensesProgramming and Production -11.2
Local advertising revenueNational advertising revenueOther revenue
RevenueResidential/bulk/smatv subscriber revenue -3.9
DTH revenue
Bell Media Inc. BCE Inc. Specialty (category B service) 2015
($) CAGR (%)
CRTC - FINANCIAL SUMMARY - PAY & SPECIALTY
Pay and Specialty
Licensee Licensee Ultimate Owner Type Year
Total Canadian Programming
Canadian Programming/Revenue (%)
Total Remuneration ($) -100.0
Script & conceptFiller Programming + Program ProductionInvestment in Programming
Pre-tax Profit
Canadian Programming ExpensesAcquisition of rights
P.B.I.T.
Interest ExpenseAdjustments - Gain (Loss)
Total Expenses -9.3
Operating IncomeDepreciation -39.7
Technical -14.3
Sales and Promotion -55.9
Administration and General -4.5
Pre-tax MarginCAGR = Compound Annual Growth Rate
Profitability (%)Operating MarginP.B.I.T. Margin
Average Staff CountAverage Remuneration ($)
Subscribers -1.9
Page 154

Undertaking # Service Name
305426521 MuchVibe
2011 2012 Var % 2013 Var % 2014 Var % 2015 Var %
y1 y2 y3 y4 y5
374,538 311,246 -16.90 307,870 -1.08 277,936 -9.72 216,826 -21.99
267,657 459,055 71.51 490,957 6.95 392,274 -20.10 102,692 -73.82
0 0 0 0 0
0 0 0 0 0
0 0 0 0 0
642,195 770,301 19.95 798,827 3.70 670,210 -16.10 319,518 -52.33
93,724 89,674 -4.32 73,366 -18.19 52,831 -27.99 30,968 -41.38
14,439 15,516 7.46 14,979 -3.46 12,124 -19.06 4,556 -62.42
13,555 9,054 -33.21 3,503 -61.31 718 -79.50 244 -66.02
101,933 77,509 -23.96 84,755 9.35 93,309 10.09 74,267 -20.41
223,651 191,753 -14.26 176,603 -7.90 158,982 -9.98 110,035 -30.79
418,544 578,548 622,224 511,228 209,483
113,515 78,474 -30.87 10,982 -86.01 9,556 -12.98 5,077 -46.87
305,029 500,074 611,242 501,672 204,406
0 0 0 0 0
-18,838 -52,397 178.15 -54,903 4.78 -42,917 -21.83 -3,988 -90.71
286,191 447,677 556,339 458,755 200,418
0 0 0 0 0
0 0 0 0 0
0 64,169 61,060 -4.85 45,376 -25.69 24,222 -46.62
0 0 0 0 0
0 64,169 61,060 -4.85 45,376 -25.69 24,222 -46.62
0.00 8.33 7.64 6.77 7.58
49,304 13,353 -72.92 0 -100.00 0 0
1 1 0.00 0 -100.00 0 0
49,304 13,353 -72.92
481,876 481,876 0.00 394,362 -18.16 350,592 -11.10 126,080 -64.04
65.2 75.1 77.9 76.3 65.6
47.5 64.9 76.5 74.9 64.0
44.6 58.1 69.6 68.4 62.7
RevenueResidential/bulk/smatv subscriber revenue -12.8
DTH revenue -21.3
Bell Media Inc. BCE Inc. Specialty (category B service) 2015
($) CAGR (%)
CRTC - FINANCIAL SUMMARY - PAY & SPECIALTY
Pay and Specialty
Licensee Licensee Ultimate Owner Type Year
Pre-tax Profit
Canadian Programming ExpensesAcquisition of rights
P.B.I.T.
Interest ExpenseAdjustments - Gain (Loss)
Total Expenses -16.3
Operating IncomeDepreciation -54.0
Technical -25.1
Sales and Promotion -63.4
Administration and General -7.6
Total Revenue -16.0
ExpensesProgramming and Production -24.2
Local advertising revenueNational advertising revenueOther revenue
Pre-tax MarginCAGR = Compound Annual Growth Rate
Profitability (%)Operating MarginP.B.I.T. Margin
Average Staff CountAverage Remuneration ($)
Subscribers -28.5
Total Canadian Programming
Canadian Programming/Revenue (%)
Total Remuneration ($) -100.0
Script & conceptFiller Programming + Program ProductionInvestment in Programming
Page 155

Undertaking # Service Name
205417399 MUSIMAX
2011 2012 Var % 2013 Var % 2014 Var % 2015 Var %
y1 y2 y3 y4 y5
4,930,564 5,155,194 4.56 5,304,379 2.89 5,060,138 -4.60 5,913,618 16.87
1,984,024 1,816,410 -8.45 2,056,686 13.23 1,424,966 -30.72 1,433,827 0.62
0 0 0 0 0
2,775,014 2,527,697 -8.91 2,261,393 -10.54 2,109,059 -6.74 1,494,329 -29.15
0 0 0 0 1,351,308
9,689,602 9,499,301 -1.96 9,622,458 1.30 8,594,163 -10.69 10,193,082 18.60
6,861,902 7,116,932 3.72 6,980,913 -1.91 6,813,604 -2.40 6,735,513 -1.15
519,652 514,044 -1.08 537,678 4.60 534,997 -0.50 2,598,706 385.74
470,290 356,539 -24.19 303,905 -14.76 347,087 14.21 2,024,376 483.25
1,437,339 1,455,105 1.24 1,532,019 5.29 1,207,061 -21.21 1,833,585 51.90
9,289,183 9,442,620 1.65 9,354,515 -0.93 8,902,749 -4.83 13,192,180 48.18
400,419 56,681 267,943 -308,586 -2,999,098
210,335 178,567 -15.10 164,588 -7.83 159,700 -2.97 268,162 67.92
190,084 -121,886 103,355 -468,286 -3,267,260
0 0 0 0 -62,710
0 0 0 0 750,000
190,084 -121,886 103,355 -468,286 -2,454,550
2,901,505 2,287,723 -21.15 2,697,123 17.90 2,112,968 -21.66 5,024,354 137.79
454,176 484,476 6.67 474,960 -1.96 481,128 1.30 0 -100.00
2,242,165 2,986,137 33.18 2,619,123 -12.29 2,820,123 7.67 0 -100.00
0 0 0 0 0
5,597,846 5,758,336 2.87 5,791,206 0.57 5,414,219 -6.51 5,024,354 -7.20
57.77 60.62 60.18 63.00 49.29
4,634,999 4,845,530 4.54 4,652,892 -3.98 4,307,696 -7.42 4,596,595 6.71
62 60 -3.23 56 -6.67 55 -1.79 60.5 10.00
74,758 80,759 8.03 83,087 2.88 78,322 -5.74 75,977 -2.99
2,071,372 1,949,084 -5.90 1,826,706 -6.28 2,114,360 15.75 1,950,429 -7.75
4.1 0.6 2.8 -3.6 -29.4
2.0 -1.3 1.1 -5.4 -32.1
2.0 -1.3 1.1 -5.4 -24.1
CRTC - FINANCIAL SUMMARY - PAY & SPECIALTY
Pay and Specialty
Licensee Licensee Ultimate Owner Type Year
Total Expenses 9.2
Operating IncomeDepreciation 6.3
Technical 49.5
Sales and Promotion 44.0
Administration and General 6.3
Total Revenue 1.3
ExpensesProgramming and Production -0.5
Local advertising revenueNational advertising revenue -14.3
Other revenue
RevenueResidential/bulk/smatv subscriber revenue 4.7
DTH revenue -7.8
MusiquePlus inc. Remstar Diffusion inc. Specialty (category A service) 2015
($) CAGR (%)
Profitability (%)Operating MarginP.B.I.T. Margin
Average Staff CountAverage Remuneration ($) 0.4
Subscribers -1.5
Total Canadian Programming -2.7
Canadian Programming/Revenue (%)
Total Remuneration ($) -0.2
Script & concept -100.0
Filler Programming + Program Production -100.0
Investment in Programming
Pre-tax Profit
Canadian Programming ExpensesAcquisition of rights 14.7
P.B.I.T.
Interest ExpenseAdjustments - Gain (Loss)
Pre-tax MarginCAGR = Compound Annual Growth Rate
Page 156

Undertaking # Service Name
214301129 MusiquePlus
2011 2012 Var % 2013 Var % 2014 Var % 2015 Var %
y1 y2 y3 y4 y5
6,339,328 6,460,865 1.92 6,745,895 4.41 6,604,615 -2.09 7,428,412 12.47
2,286,404 2,178,531 -4.72 2,425,676 11.34 1,807,920 -25.47 1,718,168 -4.96
0 0 0 0 0
4,529,479 4,418,041 -2.46 4,364,218 -1.22 3,627,991 -16.87 3,730,107 2.81
0 0 0 0 1,352,857
13,155,211 13,057,437 -0.74 13,535,789 3.66 12,040,526 -11.05 14,229,544 18.18
10,247,425 9,832,975 -4.04 9,289,018 -5.53 9,623,162 3.60 6,303,352 -34.50
519,652 520,513 0.17 545,518 4.80 532,995 -2.30 2,587,358 385.44
1,481,902 1,397,835 -5.67 337,638 -75.85 370,656 9.78 2,300,022 520.53
1,441,248 1,435,289 -0.41 2,054,523 43.14 1,239,837 -39.65 1,951,482 57.40
13,690,227 13,186,612 -3.68 12,226,697 -7.28 11,766,650 -3.76 13,142,214 11.69
-535,016 -129,175 1,309,092 273,876 1,087,330
496,691 447,867 -9.83 442,566 -1.18 453,956 2.57 268,162 -40.93
-1,031,707 -577,042 866,526 -180,080 819,168
-8,890 14,462 -262.68 -1,325 -109.16 -14 -98.94 -62,072 >999±
0 0 0 0 750,000
-1,022,817 -591,504 867,851 -180,066 1,631,240
5,080,362 3,573,888 -29.65 2,442,841 -31.65 2,132,754 -12.69 4,030,011 88.96
410,844 447,276 8.87 443,952 -0.74 460,212 3.66 0 -100.00
3,422,956 4,360,901 27.40 4,892,146 12.18 5,707,281 16.66 0 -100.00
0 0 0 0 0
8,914,162 8,382,065 -5.97 7,778,939 -7.20 8,300,247 6.70 4,030,011 -51.45
67.76 64.19 57.47 68.94 28.32
7,495,877 7,684,502 2.52 7,428,533 -3.33 6,631,241 -10.73 4,596,595 -30.68
94 89 -5.32 89 0.00 88 -1.12 60.5 -31.25
79,743 86,343 8.28 83,467 -3.33 75,355 -9.72 75,977 0.83
2,468,545 2,362,688 -4.29 2,264,746 -4.15 2,515,132 11.06 2,370,877 -5.74
-4.1 -1.0 9.7 2.3 7.6
-7.8 -4.4 6.4 -1.5 5.8
-7.8 -4.5 6.4 -1.5 11.5
Total Revenue 2.0
ExpensesProgramming and Production -11.4
Local advertising revenueNational advertising revenue -4.7
Other revenue
RevenueResidential/bulk/smatv subscriber revenue 4.0
DTH revenue -6.9
MusiquePlus inc. Remstar Diffusion inc. Specialty (category A service) 2015
($) CAGR (%)
CRTC - FINANCIAL SUMMARY - PAY & SPECIALTY
Pay and Specialty
Licensee Licensee Ultimate Owner Type Year
Total Canadian Programming -18.0
Canadian Programming/Revenue (%)
Total Remuneration ($) -11.5
Script & concept -100.0
Filler Programming + Program Production -100.0
Investment in Programming
Pre-tax Profit
Canadian Programming ExpensesAcquisition of rights -5.6
P.B.I.T.
Interest ExpenseAdjustments - Gain (Loss)
Total Expenses -1.0
Operating IncomeDepreciation -14.3
Technical 49.4
Sales and Promotion 11.6
Administration and General 7.9
Pre-tax MarginCAGR = Compound Annual Growth Rate
Profitability (%)Operating MarginP.B.I.T. Margin
Average Staff CountAverage Remuneration ($) -1.2
Subscribers -1.0
Page 157

Undertaking # Service Name
535434584 NatGeo Wild
2011 2012 Var % 2013 Var % 2014 Var % 2015 Var %
y2 y3 y4 y5
189,346 3,536,421 >999± 3,627,921 2.59 3,166,711 -12.71
160,447 538,988 235.93 531,163 -1.45 522,817 -1.57
0 0 0 0
158,689 2,024,021 >999± 2,249,949 11.16 2,134,931 -5.11
0 0 0 0
508,482 6,099,430 >999± 6,409,033 5.08 5,824,459 -9.12
303,943 1,424,278 368.60 1,693,509 18.90 2,128,160 25.67
210,894 827,714 292.48 774,635 -6.41 788,137 1.74
306,323 533,188 74.06 454,337 -14.79 476,391 4.85
639,579 2,091,740 227.05 2,239,623 7.07 2,445,741 9.20
1,460,739 4,876,920 233.87 5,162,104 5.85 5,838,429 13.10
-952,257 1,222,510 1,246,929 -13,970
0 0 0 0
-952,257 1,222,510 1,246,929 -13,970
0 0 0 0
0 0 0 0
-952,257 1,222,510 1,246,929 -13,970
41,942 54,138 29.08 63,107 16.57 143,823 127.90
0 0 0 0
24,902 314,490 >999± 339,343 7.90 326,610 -3.75
0 0 0 0
66,844 368,628 451.48 402,450 9.18 470,433 16.89
13.15 6.04 6.28 8.08
368,987 1,223,382 231.55 928,357 -24.12 853,733 -8.04
3 14 366.67 10 -28.57 9 -10.00
122,996 87,384 -28.95 92,836 6.24 94,859 2.18
274,023 2,991,975 991.87 2,906,056 -2.87 2,748,145 -5.43
-187.3 20.0 19.5 -0.2
-187.3 20.0 19.5 -0.2
-187.3 20.0 19.5 -0.2
RevenueResidential/bulk/smatv subscriber revenueDTH revenue
NGC Channel Inc. Shaw Communications Inc. Specialty (category B service) 2015
($) CAGR (%)
CRTC - FINANCIAL SUMMARY - PAY & SPECIALTY
Pay and Specialty
Licensee Licensee Ultimate Owner Type Year
Pre-tax Profit
Canadian Programming ExpensesAcquisition of rights
P.B.I.T.
Interest ExpenseAdjustments - Gain (Loss)
Total ExpensesOperating IncomeDepreciation
TechnicalSales and PromotionAdministration and General
Total RevenueExpensesProgramming and Production
Local advertising revenueNational advertising revenueOther revenue
Pre-tax MarginCAGR = Compound Annual Growth Rate
Profitability (%)Operating MarginP.B.I.T. Margin
Average Staff CountAverage Remuneration ($)
Subscribers
Total Canadian Programming
Canadian Programming/Revenue (%)
Total Remuneration ($)
Script & conceptFiller Programming + Program ProductionInvestment in Programming
Page 158

Undertaking # Service Name
305424294 National Geographic Channel
2011 2012 Var % 2013 Var % 2014 Var % 2015 Var %
y1 y2 y3 y4 y5
8,261,596 7,861,161 -4.85 8,879,756 12.96 9,132,062 2.84 8,948,752 -2.01
3,201,751 3,533,198 10.35 4,655,095 31.75 4,801,280 3.14 4,417,728 -7.99
0 0 0 0 0
8,469,653 11,222,074 32.50 12,010,234 7.02 13,434,211 11.86 13,575,823 1.05
0 0 1 0 -100.00 0
19,933,000 22,616,433 13.46 25,545,086 12.95 27,367,553 7.13 26,942,303 -1.55
3,070,153 3,285,240 7.01 3,719,241 13.21 4,460,045 19.92 4,557,875 2.19
698,961 730,957 4.58 706,709 -3.32 578,268 -18.17 628,566 8.70
353,114 800,696 126.75 1,073,972 34.13 246,414 -77.06 174,090 -29.35
3,670,450 3,658,999 -0.31 3,591,628 -1.84 3,719,636 3.56 4,241,650 14.03
7,792,678 8,475,892 8.77 9,091,550 7.26 9,004,363 -0.96 9,602,181 6.64
12,140,322 14,140,541 16,453,536 18,363,190 17,340,122
0 -5,981 0 -100.00 0 0
12,140,322 14,146,522 16,453,536 18,363,190 17,340,122
-11,492 0 -100.00 -13,114 -21,856 66.66 -31,346 43.42
0 0 0 0 0
12,151,814 14,146,522 16,466,650 18,385,046 17,371,468
352,476 383,422 8.78 544,562 42.03 971,875 78.47 962,270 -0.99
0 0 0 0 0
483,058 561,595 16.26 572,940 2.02 574,377 0.25 431,639 -24.85
0 0 0 0 0
835,534 945,017 13.10 1,117,502 18.25 1,546,252 38.37 1,393,909 -9.85
4.19 4.18 4.37 5.65 5.17
900,968 1,327,814 47.38 1,208,924 -8.95 1,159,777 -4.07 1,087,553 -6.23
12 16 33.33 14 -12.50 13 -7.14 12 -7.69
75,081 82,988 10.53 86,352 4.05 89,214 3.31 90,629 1.59
6,360,612 6,480,322 1.88 7,125,246 9.95 5,615,325 -21.19 5,053,294 -10.01
60.9 62.5 64.4 67.1 64.4
60.9 62.5 64.4 67.1 64.4
61.0 62.5 64.5 67.2 64.5
CRTC - FINANCIAL SUMMARY - PAY & SPECIALTY
Pay and Specialty
Licensee Licensee Ultimate Owner Type Year
Total Expenses 5.4
Operating IncomeDepreciation
Technical -2.6
Sales and Promotion -16.2
Administration and General 3.7
Total Revenue 7.8
ExpensesProgramming and Production 10.4
Local advertising revenueNational advertising revenue 12.5
Other revenue
RevenueResidential/bulk/smatv subscriber revenue 2.0
DTH revenue 8.4
NGC Channel Inc. Shaw Communications Inc. Specialty (category B service) 2015
($) CAGR (%)
Profitability (%)Operating MarginP.B.I.T. Margin
Average Staff CountAverage Remuneration ($) 4.8
Subscribers -5.6
Total Canadian Programming 13.7
Canadian Programming/Revenue (%)
Total Remuneration ($) 4.8
Script & conceptFiller Programming + Program Production -2.8
Investment in Programming
Pre-tax Profit
Canadian Programming ExpensesAcquisition of rights 28.5
P.B.I.T.
Interest ExpenseAdjustments - Gain (Loss)
Pre-tax MarginCAGR = Compound Annual Growth Rate
Page 159

Undertaking # Service Name
305425440 NBA TV (Canada) - (formerly Raptors
NBA TV)
2011 2012 Var % 2013 Var % 2014 Var % 2015 Var %
y1 y2 y3 y4 y5
8,261,595 8,471,430 2.54 8,738,470 3.15 8,162,047 -6.60 7,913,388 -3.05
1,935,961 2,098,169 8.38 2,045,954 -2.49 2,156,315 5.39 2,249,205 4.31
0 0 0 0 0
0 0 0 0 0
438,158 540,550 23.37 389,319 -27.98 792,578 103.58 568,147 -28.32
0 0 0 0 0
438,158 540,550 23.37 389,319 -27.98 792,578 103.58 568,147 -28.32
5.30 6.38 4.46 9.71 7.18
Total Revenue -1.1
ExpensesProgramming and Production 3.8
Local advertising revenueNational advertising revenueOther revenue
RevenueResidential/bulk/smatv subscriber revenueDTH revenue
Toronto Raptors Network Ltd. 8047286 Canada Inc. Specialty (category B service) 2015
($) CAGR (%)
CRTC - FINANCIAL SUMMARY - PAY & SPECIALTY
Pay and Specialty
Licensee Licensee Ultimate Owner Type Year
Total Canadian Programming 6.7
Canadian Programming/Revenue (%)
Total Remuneration ($)
Script & conceptFiller Programming + Program Production 6.7
Investment in Programming
Pre-tax Profit
Canadian Programming ExpensesAcquisition of rights
P.B.I.T.
Interest ExpenseAdjustments - Gain (Loss)
Total ExpensesOperating IncomeDepreciation
TechnicalSales and PromotionAdministration and General
Pre-tax MarginCAGR = Compound Annual Growth Rate
Profitability (%)Operating MarginP.B.I.T. Margin
Average Staff CountAverage Remuneration ($)
Subscribers
Page 160

Undertaking # Service Name
535427068 Nickelodeon (formerly YTV OneWorld)
2011 2012 Var % 2013 Var % 2014 Var % 2015 Var %
y1 y2 y3 y4 y5
6,793,459 7,005,074 3.11 6,878,900 -1.80 6,460,041 -6.09 5,817,794 -9.94
1,532,269 2,257,365 47.32 2,312,582 2.45 2,305,808 -0.29 2,988,758 29.62
290,521 707,026 143.36 733,940 3.81 878,561 19.70 599,252 -31.79
8,593 61,416 614.72 70,660 15.05 61,677 -12.71 42,246 -31.50
104,836 225,794 115.38 203,685 -9.79 189,698 -6.87 174,198 -8.17
0 0 0 0 1,092,406
403,950 994,236 146.13 1,008,285 1.41 1,129,936 12.07 1,908,102 68.87
5.95 14.19 14.66 17.49 32.80
RevenueResidential/bulk/smatv subscriber revenueDTH revenue
4537459 Canada Inc. Corus Entertainment Inc. Specialty (category B service) 2015
($) CAGR (%)
CRTC - FINANCIAL SUMMARY - PAY & SPECIALTY
Pay and Specialty
Licensee Licensee Ultimate Owner Type Year
Pre-tax Profit
Canadian Programming ExpensesAcquisition of rights 19.8
P.B.I.T.
Interest ExpenseAdjustments - Gain (Loss)
Total ExpensesOperating IncomeDepreciation
TechnicalSales and PromotionAdministration and General
Total Revenue -3.8
ExpensesProgramming and Production 18.2
Local advertising revenueNational advertising revenueOther revenue
Pre-tax MarginCAGR = Compound Annual Growth Rate
Profitability (%)Operating MarginP.B.I.T. Margin
Average Staff CountAverage Remuneration ($)
Subscribers
Total Canadian Programming 47.4
Canadian Programming/Revenue (%)
Total Remuneration ($)
Script & concept 48.9
Filler Programming + Program Production 13.5
Investment in Programming
Page 161

Undertaking # Service Name
535427878 Northwestel Inc., Yellowknife
2011 2012 Var % 2013 Var % 2014 Var % 2015 Var %
y1 y2 y3 y4 y5
782,133 896,614 14.64 819,178 -8.64 775,188 -5.37 799,605 3.15
0 0 0 0 0
111,916 122,808 9.73 115,250 -6.15 74,714 -35.17 67,262 -9.97
0 0 0 0 0
0 0 0 0 0
894,049 1,019,422 14.02 934,428 -8.34 849,902 -9.05 866,867 2.00
648,595 660,845 1.89 465,585 -29.55 431,162 -7.39 552,422 28.12
0 0 197,483 323,468 63.80 224,172 -30.70
87,808 87,220 -0.67 51,644 -40.79 21,754 -57.88 38,064 74.97
54,100 54,100 0.00 130,952 142.06 116,661 -10.91 240,822 106.43
790,503 802,165 1.48 845,664 5.42 893,045 5.60 1,055,480 18.19
103,546 217,257 88,764 -43,143 -188,613
243,187 243,187 0.00 81,467 -66.50 114,981 41.14 164,178 42.79
-139,641 -25,930 7,297 -158,124 -352,791
0 0 0 12,899 18,417 42.78
0 0 0 0 0
-139,641 -25,930 7,297 -171,023 -371,208
12,385 20,221 63.27 0 -100.00 0 0
64,131 54,037 -15.74 0 -100.00 0 0
351,025 298,638 -14.92 0 -100.00 0 0
0 0 465,585 0 -100.00 0
427,541 372,896 -12.78 465,585 24.86 0 -100.00 0
47.82 36.58 49.83 0.00 0.00
178,030 178,030 0.00 286,266 60.80 298,607 4.31 217,621 -27.12
1.5 1.5 0.00 1.85 23.33 1.85 0.00 2 8.11
118,687 118,687 0.00 154,738 30.38 161,409 4.31 108,811 -32.59
11.6 21.3 9.5 -5.1 -21.8
-15.6 -2.5 0.8 -18.6 -40.7
-15.6 -2.5 0.8 -20.1 -42.8
CRTC - FINANCIAL SUMMARY - PAY & SPECIALTY
Pay and Specialty
Licensee Licensee Ultimate Owner Type Year
Total Expenses 7.5
Operating IncomeDepreciation -9.4
TechnicalSales and Promotion -18.9
Administration and General 45.3
Total Revenue -0.8
ExpensesProgramming and Production -3.9
Local advertising revenue -12.0
National advertising revenueOther revenue
RevenueResidential/bulk/smatv subscriber revenue 0.6
DTH revenue
Northwestel Inc. BCE Inc. Video-on-Demand 2015
($) CAGR (%)
Profitability (%)Operating MarginP.B.I.T. Margin
Average Staff CountAverage Remuneration ($) -2.2
Subscribers
Total Canadian Programming -100.0
Canadian Programming/Revenue (%)
Total Remuneration ($) 5.2
Script & concept -100.0
Filler Programming + Program Production -100.0
Investment in Programming
Pre-tax Profit
Canadian Programming ExpensesAcquisition of rights -100.0
P.B.I.T.
Interest ExpenseAdjustments - Gain (Loss)
Pre-tax MarginCAGR = Compound Annual Growth Rate
Page 162

Undertaking # Service Name
535435532 Novus Entertainment Inc., Vancouver
2011 2012 Var % 2013 Var % 2014 Var % 2015 Var %
y5
70,157
0
0
0
0
70,157
88,036
20,719
0
61,236
169,991
-99,834
92,201
-192,035
0
0
-192,035
8,803
0
0
0
8,803
12.55
61,236
1
61,236
-142.3
-273.7
-273.7
Total RevenueExpensesProgramming and Production
Local advertising revenueNational advertising revenueOther revenue
RevenueResidential/bulk/smatv subscriber revenueDTH revenue
Novus Entertainment Inc. 503161 British Columbia Ltd. Video-on-Demand 2015
($) CAGR (%)
CRTC - FINANCIAL SUMMARY - PAY & SPECIALTY
Pay and Specialty
Licensee Licensee Ultimate Owner Type Year
Total Canadian Programming
Canadian Programming/Revenue (%)
Total Remuneration ($)
Script & conceptFiller Programming + Program ProductionInvestment in Programming
Pre-tax Profit
Canadian Programming ExpensesAcquisition of rights
P.B.I.T.
Interest ExpenseAdjustments - Gain (Loss)
Total ExpensesOperating IncomeDepreciation
TechnicalSales and PromotionAdministration and General
Pre-tax MarginCAGR = Compound Annual Growth Rate
Profitability (%)Operating MarginP.B.I.T. Margin
Average Staff CountAverage Remuneration ($)
Subscribers
Page 163

Undertaking # Service Name
535433015 NTD Television
2011 2012 Var % 2013 Var % 2014 Var % 2015 Var %
y3 y4 y5
4,646,174 791,780 -82.96 1,881,031 137.57
4,218,936 1,292,224 -69.37 1,621,810 25.51
4,193,936 946,009 -77.44 1,621,810 71.44
0 0 0
0 0 0
0 0 0
4,193,936 946,009 -77.44 1,621,810 71.44
90.27 119.48 86.22
RevenueResidential/bulk/smatv subscriber revenueDTH revenue
New Tang Dynasty Television
(Canada)
New Tang Dynasty Television
(Canada)
Specialty (category B service) 2015
($) CAGR (%)
CRTC - FINANCIAL SUMMARY - PAY & SPECIALTY
Pay and Specialty
Licensee Licensee Ultimate Owner Type Year
Pre-tax Profit
Canadian Programming ExpensesAcquisition of rights
P.B.I.T.
Interest ExpenseAdjustments - Gain (Loss)
Total ExpensesOperating IncomeDepreciation
TechnicalSales and PromotionAdministration and General
Total RevenueExpensesProgramming and Production
Local advertising revenueNational advertising revenueOther revenue
Pre-tax MarginCAGR = Compound Annual Growth Rate
Profitability (%)Operating MarginP.B.I.T. Margin
Average Staff CountAverage Remuneration ($)
Subscribers
Total Canadian Programming
Canadian Programming/Revenue (%)
Total Remuneration ($)
Script & conceptFiller Programming + Program ProductionInvestment in Programming
Page 164

Undertaking # Service Name
535420385 NuevoMundo Television (NMTV)
2011 2012 Var % 2013 Var % 2014 Var % 2015 Var %
y1 y2 y3 y4
168,264 218,564 29.89 632,197 189.25 364,694 -42.31 -100.00
209,658 238,692 13.85 151,438 -36.56 256,973 69.69 -100.00
0 0 0 0
0 0 0 0
209,658 238,692 13.85 151,438 -36.56 0 -100.00
0 0 0 0
209,658 238,692 13.85 151,438 -36.56 0 -100.00
124.60 109.21 23.95 0.00
CRTC - FINANCIAL SUMMARY - PAY & SPECIALTY
Pay and Specialty
Licensee Licensee Ultimate Owner Type Year
Total ExpensesOperating IncomeDepreciation
TechnicalSales and PromotionAdministration and General
Total RevenueExpensesProgramming and Production
Local advertising revenueNational advertising revenueOther revenue
RevenueResidential/bulk/smatv subscriber revenueDTH revenue
NMTV inc. NMTV inc. Specialty (category B service) 2014
($) CAGR (%)
Profitability (%)Operating MarginP.B.I.T. Margin
Average Staff CountAverage Remuneration ($)
Subscribers
Total Canadian Programming
Canadian Programming/Revenue (%)
Total Remuneration ($)
Script & conceptFiller Programming + Program ProductionInvestment in Programming
Pre-tax Profit
Canadian Programming ExpensesAcquisition of rights
P.B.I.T.
Interest ExpenseAdjustments - Gain (Loss)
Pre-tax MarginCAGR = Compound Annual Growth Rate
Page 165

Undertaking # Service Name
305417413 Odyssey (formerly OTN)
2011 2012 Var % 2013 Var % 2014 Var % 2015 Var %
y1 y2 y3 y4 y5
780,105 1,101,694 41.22 1,123,864 2.01 1,041,453 -7.33 1,068,951 2.64
919,798 885,737 -3.70 902,996 1.95 1,151,069 27.47 1,226,935 6.59
114,295 122,350 7.05 136,278 11.38 138,177 1.39 98,888 -28.43
0 0 5,897 91,285 >999± 63,750 -30.16
0 0 0 0 0
1,814,198 2,109,781 16.29 2,169,035 2.81 2,421,984 11.66 2,458,524 1.51
1,115,863 1,289,472 15.56 1,401,708 8.70 1,605,107 14.51 1,377,215 -14.20
118,382 131,643 11.20 115,700 -12.11 153,937 33.05 150,115 -2.48
12,753 8,993 -29.48 19,135 112.78 58,080 203.53 18,556 -68.05
76,882 149,543 94.51 59,051 -60.51 86,544 46.56 110,331 27.49
1,323,880 1,579,651 19.32 1,595,594 1.01 1,903,668 19.31 1,656,217 -13.00
490,318 530,130 573,441 518,316 802,307
32,873 32,110 -2.32 24,333 -24.22 32,726 34.49 33,155 1.31
457,445 498,020 549,108 485,590 769,152
1,165 12,294 955.28 5,157 -58.05 5,622 9.02 3,503 -37.69
0 5,234 -4,833 -192.34 0 -100.00 0
456,280 490,960 539,118 479,968 765,649
0 0 0 0 0
50,000 50,000 0.00 50,000 0.00 50,000 0.00 50,000 0.00
626,896 762,279 21.60 762,183 -0.01 884,739 16.08 800,040 -9.57
0 0 0 0 0
676,896 812,279 20.00 812,183 -0.01 934,739 15.09 850,040 -9.06
37.31 38.50 37.44 38.59 34.58
586,527 742,039 26.51 400,503 -46.03 502,939 25.58 424,049 -15.69
10 10 0.00 10 0.00 10 0.00 10 0.00
58,653 74,204 26.51 40,050 -46.03 50,294 25.58 42,405 -15.69
20,158 22,083 9.55 22,520 1.98 24,148 7.23 22,177 -8.16
27.0 25.1 26.4 21.4 32.6
25.2 23.6 25.3 20.0 31.3
25.2 23.3 24.9 19.8 31.1
Total Revenue 7.9
ExpensesProgramming and Production 5.4
Local advertising revenue -3.6
National advertising revenueOther revenue
RevenueResidential/bulk/smatv subscriber revenue 8.2
DTH revenue 7.5
Odyssey Television Network Inc. Maniatakos, Peter Specialty (category A service) 2015
($) CAGR (%)
CRTC - FINANCIAL SUMMARY - PAY & SPECIALTY
Pay and Specialty
Licensee Licensee Ultimate Owner Type Year
Total Canadian Programming 5.9
Canadian Programming/Revenue (%)
Total Remuneration ($) -7.8
Script & concept 0.0
Filler Programming + Program Production 6.3
Investment in Programming
Pre-tax Profit
Canadian Programming ExpensesAcquisition of rights
P.B.I.T.
Interest ExpenseAdjustments - Gain (Loss)
Total Expenses 5.8
Operating IncomeDepreciation 0.2
Technical 6.1
Sales and Promotion 9.8
Administration and General 9.5
Pre-tax MarginCAGR = Compound Annual Growth Rate
Profitability (%)Operating MarginP.B.I.T. Margin
Average Staff CountAverage Remuneration ($) -7.8
Subscribers 2.4
Page 166

Undertaking # Service Name
535433437 OTN 3
2011 2012 Var % 2013 Var % 2014 Var % 2015 Var %
y2 y3 y4 y5
182,395 819,669 349.39 867,042 5.78 932,290 7.53
166,960 647,539 287.84 746,928 15.35 735,615 -1.51
0 0 0 0
5,000 20,000 300.00 20,000 0.00 20,000 0.00
14,215 70,206 393.89 87,195 24.20 154,023 76.64
0 0 0 0
19,215 90,206 369.46 107,195 18.83 174,023 62.34
10.53 11.01 12.36 18.67
RevenueResidential/bulk/smatv subscriber revenueDTH revenue
Greek National Television Network
(Canada) Inc.
Maniatakos, Peter Specialty (category B service) 2015
($) CAGR (%)
CRTC - FINANCIAL SUMMARY - PAY & SPECIALTY
Pay and Specialty
Licensee Licensee Ultimate Owner Type Year
Pre-tax Profit
Canadian Programming ExpensesAcquisition of rights
P.B.I.T.
Interest ExpenseAdjustments - Gain (Loss)
Total ExpensesOperating IncomeDepreciation
TechnicalSales and PromotionAdministration and General
Total RevenueExpensesProgramming and Production
Local advertising revenueNational advertising revenueOther revenue
Pre-tax MarginCAGR = Compound Annual Growth Rate
Profitability (%)Operating MarginP.B.I.T. Margin
Average Staff CountAverage Remuneration ($)
Subscribers
Total Canadian Programming
Canadian Programming/Revenue (%)
Total Remuneration ($)
Script & conceptFiller Programming + Program ProductionInvestment in Programming
Page 167

Undertaking # Service Name
305417314 Outdoor Life Network (OLN)
2011 2012 Var % 2013 Var % 2014 Var % 2015 Var %
y1 y2 y3 y4 y5
6,865,594 6,531,687 -4.86 7,158,267 9.59 7,213,013 0.76 7,573,725 5.00
2,539,113 2,291,986 -9.73 2,956,619 29.00 3,068,094 3.77 3,239,781 5.60
0 0 0 0 0
12,332,026 11,287,743 -8.47 12,401,589 9.87 9,595,061 -22.63 9,245,575 -3.64
192,150 25,964 -86.49 2,333 -91.01 70,908 >999± 0 -100.00
21,928,883 20,137,380 -8.17 22,518,808 11.83 19,947,076 -11.42 20,059,081 0.56
9,571,974 10,858,022 13.44 11,313,325 4.19 14,006,518 23.81 9,479,352 -32.32
547,335 559,300 2.19 606,600 8.46 485,888 -19.90 513,468 5.68
1,389,848 545,786 -60.73 446,365 -18.22 292,078 -34.57 562,213 92.49
1,472,432 1,431,741 -2.76 1,498,967 4.70 1,153,728 -23.03 1,325,246 14.87
12,981,589 13,394,849 3.18 13,865,257 3.51 15,938,212 14.95 11,880,279 -25.46
8,947,294 6,742,531 8,653,551 4,008,864 8,178,802
0 11,492 0 -100.00 0 0
8,947,294 6,731,039 8,653,551 4,008,864 8,178,802
0 2,412 0 -100.00 0 0
-2,725,589 0 -100.00 0 0 0
6,221,705 6,728,627 8,653,551 4,008,864 8,178,802
6,091,985 5,833,548 -4.24 6,502,329 11.46 7,712,146 18.61 6,167,055 -20.03
0 0 315,017 309,475 -1.76 0 -100.00
937,841 1,442,560 53.82 1,432,763 -0.68 1,544,581 7.80 0 -100.00
0 0 0 0 0
7,029,826 7,276,108 3.50 8,250,109 13.39 9,566,202 15.95 6,167,055 -35.53
32.06 36.13 36.64 47.96 30.74
2,979,399 1,977,660 -33.62 1,787,407 -9.62 1,455,031 -18.60 648,361 -55.44
19 21 10.53 20 -4.76 13.8 -31.00 8 -42.03
156,810 94,174 -39.94 89,370 -5.10 105,437 17.98 81,045 -23.13
5,870,341 5,452,026 -7.13 5,429,000 -0.42 5,194,000 -4.33 4,960,000 -4.51
40.8 33.5 38.4 20.1 40.8
40.8 33.4 38.4 20.1 40.8
28.4 33.4 38.4 20.1 40.8
CRTC - FINANCIAL SUMMARY - PAY & SPECIALTY
Pay and Specialty
Licensee Licensee Ultimate Owner Type Year
Total Expenses -2.2
Operating IncomeDepreciation
Technical -1.6
Sales and Promotion -20.3
Administration and General -2.6
Total Revenue -2.2
ExpensesProgramming and Production -0.2
Local advertising revenueNational advertising revenue -7.0
Other revenue -100.0
RevenueResidential/bulk/smatv subscriber revenue 2.5
DTH revenue 6.3
Rogers Media Inc. Rogers Communications Inc. Specialty (category A service) 2015
($) CAGR (%)
Profitability (%)Operating MarginP.B.I.T. Margin
Average Staff CountAverage Remuneration ($) -15.2
Subscribers -4.1
Total Canadian Programming -3.2
Canadian Programming/Revenue (%)
Total Remuneration ($) -31.7
Script & conceptFiller Programming + Program Production -100.0
Investment in Programming
Pre-tax Profit
Canadian Programming ExpensesAcquisition of rights 0.3
P.B.I.T.
Interest ExpenseAdjustments - Gain (Loss)
Pre-tax MarginCAGR = Compound Annual Growth Rate
Page 168

Undertaking # Service Name
305423973 OUTtv (formerly PrideVision)
2011 2012 Var % 2013 Var % 2014 Var % 2015 Var %
y1 y2 y3 y4 y5
1,080,230 1,997,254 84.89 3,119,560 56.19 3,090,991 -0.92 3,052,894 -1.23
1,932,466 1,866,709 -3.40 1,867,411 0.04 1,848,171 -1.03 1,739,296 -5.89
0 0 0 0 0
173,567 81,228 -53.20 102,712 26.45 184,743 79.87 247,191 33.80
83,191 28,412 -65.85 143,327 404.46 747,886 421.80 121,200 -83.79
3,269,454 3,973,603 21.54 5,233,010 31.69 5,871,791 12.21 5,160,581 -12.11
1,908,791 2,209,186 15.74 2,804,268 26.94 2,797,191 -0.25 2,539,796 -9.20
886,118 890,651 0.51 943,201 5.90 1,082,044 14.72 790,893 -26.91
162,038 356,169 119.81 575,945 61.71 564,295 -2.02 448,502 -20.52
334,401 337,473 0.92 622,779 84.54 880,412 41.37 1,115,029 26.65
3,291,348 3,793,479 15.26 4,946,193 30.39 5,323,942 7.64 4,894,220 -8.07
-21,894 180,124 286,817 547,849 266,361
29,732 24,581 -17.32 23,441 -4.64 32,311 37.84 1,322,830 >999±
-51,626 155,543 263,376 515,538 -1,056,469
35,832 40,840 13.98 46,476 13.80 56,228 20.98 51,344 -8.69
-5,597 0 -100.00 -29,207 0 -100.00 0
-93,055 114,703 187,693 459,310 -1,107,813
784,255 760,095 -3.08 692,394 -8.91 1,891,515 173.18 1,575,956 -16.68
0 0 0 155,200 0 -100.00
675,620 838,965 24.18 1,209,535 44.17 396,566 -67.21 513,929 29.59
0 0 0 0 0
1,459,875 1,599,060 9.53 1,901,929 18.94 2,443,281 28.46 2,089,885 -14.46
44.65 40.24 36.34 41.61 40.50
528,007 509,419 -3.52 710,466 39.47 848,561 19.44 1,249,382 47.24
7 8 14.29 10 25.00 11 10.00 13 18.18
75,430 63,677 -15.58 71,047 11.57 77,142 8.58 96,106 24.58
630,929 939,200 48.86 1,026,169 9.26 990,300 -3.50 914,962 -7.61
-0.7 4.5 5.5 9.3 5.2
-1.6 3.9 5.0 8.8 -20.5
-2.8 2.9 3.6 7.8 -21.5
Total Revenue 12.1
ExpensesProgramming and Production 7.4
Local advertising revenueNational advertising revenue 9.2
Other revenue 9.9
RevenueResidential/bulk/smatv subscriber revenue 29.7
DTH revenue -2.6
OUTtv Network Inc. OUT Broadcasting Corporation Specialty (category A service) 2015
($) CAGR (%)
CRTC - FINANCIAL SUMMARY - PAY & SPECIALTY
Pay and Specialty
Licensee Licensee Ultimate Owner Type Year
Total Canadian Programming 9.4
Canadian Programming/Revenue (%)
Total Remuneration ($) 24.0
Script & conceptFiller Programming + Program Production -6.6
Investment in Programming
Pre-tax Profit
Canadian Programming ExpensesAcquisition of rights 19.1
P.B.I.T.
Interest ExpenseAdjustments - Gain (Loss)
Total Expenses 10.4
Operating IncomeDepreciation 158.3
Technical -2.8
Sales and Promotion 29.0
Administration and General 35.1
Pre-tax MarginCAGR = Compound Annual Growth Rate
Profitability (%)Operating MarginP.B.I.T. Margin
Average Staff CountAverage Remuneration ($) 6.2
Subscribers 9.7
Page 169

Undertaking # Service Name
305417257 OWN: The Oprah Winfrey Network
(formerly OWN; formerly VIVA)
2011 2012 Var % 2013 Var % 2014 Var % 2015 Var %
y1 y2 y3 y4 y5
14,880,817 14,184,122 -4.68 14,449,890 1.87 14,611,236 1.12 16,823,415 15.14
5,187,718 6,011,729 15.88 5,892,083 -1.99 5,540,076 -5.97 5,258,447 -5.08
0 0 0 0 0
6,587,072 7,904,731 20.00 9,065,868 14.69 8,147,606 -10.13 6,180,705 -24.14
43,235 95,114 119.99 96,063 1.00 203,023 111.34 338,105 66.54
26,698,842 28,195,696 5.61 29,503,904 4.64 28,501,941 -3.40 28,600,672 0.35
9,328,566 13,721,076 47.09 18,593,690 35.51 20,562,282 10.59 21,342,152 3.79
501,084 484,888 -3.23 448,958 -7.41 413,858 -7.82 457,080 10.44
3,401,330 2,196,914 -35.41 644,463 -70.67 167,205 -74.06 205,850 23.11
3,000,079 3,251,485 8.38 3,033,430 -6.71 2,631,514 -13.25 1,698,505 -35.46
16,231,059 19,654,363 21.09 22,720,541 15.60 23,774,859 4.64 23,703,587 -0.30
10,467,783 8,541,333 6,783,363 4,727,082 4,897,085
30,968 1,066,773 >999± 1,171,257 9.79 897,215 -23.40 809,775 -9.75
10,436,815 7,474,560 5,612,106 3,829,867 4,087,310
755,128 1,396,650 84.96 1,022,576 -26.78 1,233,990 20.67 1,126,024 -8.75
-1,198,481 1,146,331 -195.65 231,856 -79.77 1,511,952 552.11 1,574,724 4.15
8,483,206 7,224,241 4,821,386 4,107,829 4,536,010
4,848,839 5,199,645 7.23 6,247,421 20.15 5,730,767 -8.27 4,354,026 -24.02
203,637 285,898 40.40 414,826 45.10 415,957 0.27 224,489 -46.03
619,309 884,924 42.89 893,038 0.92 735,081 -17.69 857,743 16.69
664,116 451,996 -31.94 103,600 -77.08 0 -100.00 1,225,283
6,335,901 6,822,463 7.68 7,658,885 12.26 6,881,805 -10.15 6,661,541 -3.20
23.73 24.20 25.96 24.15 23.29
1,758,669 1,323,255 -24.76 1,167,216 -11.79 744,411 -36.22 480,050 -35.51
29 28 -3.45 24 -14.29 23 -4.17 25 8.70
60,644 47,259 -22.07 48,634 2.91 32,366 -33.45 19,202 -40.67
5,967,663 6,219,356 4.22 6,157,269 -1.00 6,058,998 -1.60 6,066,765 0.13
39.2 30.3 23.0 16.6 17.1
39.1 26.5 19.0 13.4 14.3
31.8 25.6 16.3 14.4 15.9
RevenueResidential/bulk/smatv subscriber revenue 3.1
DTH revenue 0.3
OWN Inc. Corus Entertainment Inc. Specialty (category A service) 2015
($) CAGR (%)
CRTC - FINANCIAL SUMMARY - PAY & SPECIALTY
Pay and Specialty
Licensee Licensee Ultimate Owner Type Year
Pre-tax Profit
Canadian Programming ExpensesAcquisition of rights -2.7
P.B.I.T.
Interest ExpenseAdjustments - Gain (Loss)
Total Expenses 9.9
Operating IncomeDepreciation 126.1
Technical -2.3
Sales and Promotion -50.4
Administration and General -13.3
Total Revenue 1.7
ExpensesProgramming and Production 23.0
Local advertising revenueNational advertising revenue -1.6
Other revenue 67.2
Pre-tax MarginCAGR = Compound Annual Growth Rate
Profitability (%)Operating MarginP.B.I.T. Margin
Average Staff CountAverage Remuneration ($) -25.0
Subscribers 0.4
Total Canadian Programming 1.3
Canadian Programming/Revenue (%)
Total Remuneration ($) -27.7
Script & concept 2.5
Filler Programming + Program Production 8.5
Investment in Programming 16.6
Page 170

Undertaking # Service Name
535425161 Penthouse TV
2011 2012 Var % 2013 Var % 2014 Var % 2015 Var %
y1 y2 y3 y4 y5
536,604 722,356 34.62 621,153 -14.01 538,393 -13.32 564,317 4.82
143,080 202,391 41.45 167,643 -17.17 153,264 -8.58 158,312 3.29
0 0 0 0 0
32,536 47,558 46.17 39,887 -16.13 36,614 -8.21 37,886 3.47
97,607 142,676 46.17 119,662 -16.13 109,841 -8.21 113,657 3.47
0 0 0 0 0
130,143 190,234 46.17 159,549 -16.13 146,455 -8.21 151,543 3.47
24.25 26.34 25.69 27.20 26.85
CRTC - FINANCIAL SUMMARY - PAY & SPECIALTY
Pay and Specialty
Licensee Licensee Ultimate Owner Type Year
Total ExpensesOperating IncomeDepreciation
TechnicalSales and PromotionAdministration and General
Total Revenue 1.3
ExpensesProgramming and Production 2.6
Local advertising revenueNational advertising revenueOther revenue
RevenueResidential/bulk/smatv subscriber revenueDTH revenue
Fifth Dimension Properties Inc. Duncan, Stuart Specialty (category B service) 2015
($) CAGR (%)
Profitability (%)Operating MarginP.B.I.T. Margin
Average Staff CountAverage Remuneration ($)
Subscribers
Total Canadian Programming 3.9
Canadian Programming/Revenue (%)
Total Remuneration ($)
Script & concept 3.9
Filler Programming + Program Production 3.9
Investment in Programming
Pre-tax Profit
Canadian Programming ExpensesAcquisition of rights
P.B.I.T.
Interest ExpenseAdjustments - Gain (Loss)
Pre-tax MarginCAGR = Compound Annual Growth Rate
Page 171

Undertaking # Service Name
535420062 Playmen (formerly HARDtv)
2011 2012 Var % 2013 Var % 2014 Var % 2015 Var %
y1 y2 y3 y4 y5
120,536 132,489 9.92 43,406 -67.24 103,736 138.99 94,329 -9.07
59,522 78,344 31.62 0 -100.00 54,288 82,400 51.78
3,911 7,676 96.27 0 -100.00 0 0
0 0 0 0 0
0 0 0 0 0
0 0 0 43,848 65,920 50.34
3,911 7,676 96.27 0 -100.00 43,848 65,920 50.34
3.24 5.79 0.00 42.27 69.88
Total Revenue -5.9
ExpensesProgramming and Production 8.5
Local advertising revenueNational advertising revenueOther revenue
RevenueResidential/bulk/smatv subscriber revenueDTH revenue
4510810 Canada Inc. Fifth Dimension Properties Inc. Specialty (category B service) 2015
($) CAGR (%)
CRTC - FINANCIAL SUMMARY - PAY & SPECIALTY
Pay and Specialty
Licensee Licensee Ultimate Owner Type Year
Total Canadian Programming 102.6
Canadian Programming/Revenue (%)
Total Remuneration ($)
Script & conceptFiller Programming + Program ProductionInvestment in Programming
Pre-tax Profit
Canadian Programming ExpensesAcquisition of rights -100.0
P.B.I.T.
Interest ExpenseAdjustments - Gain (Loss)
Total ExpensesOperating IncomeDepreciation
TechnicalSales and PromotionAdministration and General
Pre-tax MarginCAGR = Compound Annual Growth Rate
Profitability (%)Operating MarginP.B.I.T. Margin
Average Staff CountAverage Remuneration ($)
Subscribers
Page 172

Undertaking # Service Name
535421284 Prise 2 (formerly Nostalgie)
2011 2012 Var % 2013 Var % 2014 Var % 2015 Var %
y1 y2 y3 y4 y5
2,599,630 3,147,881 21.09 3,619,446 14.98 4,061,055 12.20 4,951,689 21.93
2,045,183 2,085,280 1.96 2,159,215 3.55 2,241,673 3.82 1,635,674 -27.03
0 0 0 0 0
768,797 834,449 8.54 1,542,815 84.89 2,097,628 35.96 2,398,141 14.33
8,826 44,657 405.97 95,517 113.89 85,933 -10.03 67,427 -21.54
5,422,436 6,112,267 12.72 7,416,993 21.35 8,486,289 14.42 9,052,931 6.68
3,036,172 3,378,301 11.27 3,939,191 16.60 4,724,022 19.92 4,813,974 1.90
524,504 715,982 36.51 579,667 -19.04 446,370 -23.00 337,389 -24.41
407,345 437,103 7.31 606,845 38.83 501,431 -17.37 896,966 78.88
109,929 94,724 -13.83 154,198 62.79 344,488 123.41 367,618 6.71
4,077,950 4,626,110 13.44 5,279,901 14.13 6,016,311 13.95 6,415,947 6.64
1,344,486 1,486,157 2,137,092 2,469,978 2,636,984
100,000 100,000 0.00 100,000 0.00 100,000 0.00 100,000 0.00
1,244,486 1,386,157 2,037,092 2,369,978 2,536,984
105,000 200,792 91.23 206,191 2.69 163,741 -20.59 112,821 -31.10
0 0 0 0 0
1,139,486 1,185,365 1,830,901 2,206,237 2,424,163
1,068,329 1,282,418 20.04 1,987,047 54.95 3,048,537 53.42 3,441,773 12.90
0 0 0 0 0
0 0 0 0 0
0 0 0 0 0
1,068,329 1,282,418 20.04 1,987,047 54.95 3,048,537 53.42 3,441,773 12.90
19.70 20.98 26.79 35.92 38.02
167,717 222,443 32.63 160,272 -27.95 107,265 -33.07 235,032 119.11
2 2 0.00 2 0.00 2 0.00 2.16 8.00
83,859 111,222 32.63 80,136 -27.95 53,633 -33.07 108,811 102.88
798,905 888,940 11.27 983,554 10.64 1,065,173 8.30 1,133,904 6.45
24.8 24.3 28.8 29.1 29.1
23.0 22.7 27.5 27.9 28.0
21.0 19.4 24.7 26.0 26.8
RevenueResidential/bulk/smatv subscriber revenue 17.5
DTH revenue -5.4
Groupe TVA inc. Les Placements Péladeau inc. Specialty (category B service) 2015
($) CAGR (%)
CRTC - FINANCIAL SUMMARY - PAY & SPECIALTY
Pay and Specialty
Licensee Licensee Ultimate Owner Type Year
Pre-tax Profit
Canadian Programming ExpensesAcquisition of rights 34.0
P.B.I.T.
Interest ExpenseAdjustments - Gain (Loss)
Total Expenses 12.0
Operating IncomeDepreciation 0.0
Technical -10.4
Sales and Promotion 21.8
Administration and General 35.2
Total Revenue 13.7
ExpensesProgramming and Production 12.2
Local advertising revenueNational advertising revenue 32.9
Other revenue 66.3
Pre-tax MarginCAGR = Compound Annual Growth Rate
Profitability (%)Operating MarginP.B.I.T. Margin
Average Staff CountAverage Remuneration ($) 6.7
Subscribers 9.2
Total Canadian Programming 34.0
Canadian Programming/Revenue (%)
Total Remuneration ($) 8.8
Script & conceptFiller Programming + Program ProductionInvestment in Programming
Page 173

Undertaking # Service Name
535422240 ProSieBenSat.1 (formerly German TV)
2011 2012 Var % 2013 Var % 2014 Var % 2015 Var %
y1 y2 y3 y4 y5
125,133 63,839 -48.98 157,303 146.41 267,671 70.16 306,985 14.69
54,897 53,090 -3.29 93,803 76.69 168,627 79.77 154,987 -8.09
3,444 2,876 -16.49 6,679 132.23 9,520 42.54 6,292 -33.91
4,592 3,835 -16.49 8,906 132.23 12,694 42.53 8,389 -33.91
14,923 12,462 -16.49 28,944 132.26 41,254 42.53 27,264 -33.91
0 0 0 0 0
22,959 19,173 -16.49 44,529 132.25 63,468 42.53 41,945 -33.91
18.35 30.03 28.31 23.71 13.66
CRTC - FINANCIAL SUMMARY - PAY & SPECIALTY
Pay and Specialty
Licensee Licensee Ultimate Owner Type Year
Total ExpensesOperating IncomeDepreciation
TechnicalSales and PromotionAdministration and General
Total Revenue 25.2
ExpensesProgramming and Production 29.6
Local advertising revenueNational advertising revenueOther revenue
RevenueResidential/bulk/smatv subscriber revenueDTH revenue
Ethnic Channels Group Limited Levin, Slava Specialty (category B service) 2015
($) CAGR (%)
Profitability (%)Operating MarginP.B.I.T. Margin
Average Staff CountAverage Remuneration ($)
Subscribers
Total Canadian Programming 16.3
Canadian Programming/Revenue (%)
Total Remuneration ($)
Script & concept 16.3
Filler Programming + Program Production 16.3
Investment in Programming
Pre-tax Profit
Canadian Programming ExpensesAcquisition of rights 16.3
P.B.I.T.
Interest ExpenseAdjustments - Gain (Loss)
Pre-tax MarginCAGR = Compound Annual Growth Rate
Page 174

Undertaking # Service Name
535437455 Public Affairs programming/coverage of
the HOC proceedings
2011 2012 Var % 2013 Var % 2014 Var % 2015 Var %
y4 y5
11,685,082 11,550,827 -1.15
4,165,574 4,573,862 9.80
0 0
0 0
89,603 128,201 43.08
15,940,259 16,252,890 1.96
7,855,481 8,639,118 9.98
1,862,547 2,085,460 11.97
1,636,807 1,560,403 -4.67
1,405,225 1,498,453 6.63
12,760,060 13,783,434 8.02
3,180,199 2,469,456
1,396,555 2,071,160 48.30
1,783,644 398,296
0 5,839
3,639 5,276 44.98
1,787,283 397,733
0 0
56,228 71,188 26.61
7,787,515 8,492,511 9.05
4,913 28,755 485.28
7,848,656 8,592,454 9.48
49.24 52.87
6,009,354 7,227,422 20.27
80 81.75 2.19
75,117 88,409 17.69
11,329,534 11,169,411 -1.41
20.0 15.2
11.2 2.5
11.2 2.4
Total RevenueExpensesProgramming and Production
Local advertising revenueNational advertising revenueOther revenue
RevenueResidential/bulk/smatv subscriber revenueDTH revenue
Cable Public Affairs Channel Inc. Cable Public Affairs Channel Inc. Specialty (category A service) 2015
($) CAGR (%)
CRTC - FINANCIAL SUMMARY - PAY & SPECIALTY
Pay and Specialty
Licensee Licensee Ultimate Owner Type Year
Total Canadian Programming
Canadian Programming/Revenue (%)
Total Remuneration ($)
Script & conceptFiller Programming + Program ProductionInvestment in Programming
Pre-tax Profit
Canadian Programming ExpensesAcquisition of rights
P.B.I.T.
Interest ExpenseAdjustments - Gain (Loss)
Total ExpensesOperating IncomeDepreciation
TechnicalSales and PromotionAdministration and General
Pre-tax MarginCAGR = Compound Annual Growth Rate
Profitability (%)Operating MarginP.B.I.T. Margin
Average Staff CountAverage Remuneration ($)
Subscribers
Page 175

Undertaking # Service Name
535422323 radX (formerly Rush HD)
2011 2012 Var % 2013 Var % 2014 Var % 2015 Var %
y1 y2 y3 y4 y5
3,588,481 3,726,991 3.86 3,793,913 1.80 4,172,606 9.98 4,458,630 6.85
863,196 1,646,142 90.70 1,351,663 -17.89 1,355,798 0.31 1,351,827 -0.29
454,554 497,051 9.35 410,615 -17.39 153,968 -62.50 287,944 87.02
0 0 0 0 0
0 305,523 431,565 41.25 353,139 -18.17 474,636 34.40
0 74,250 25,750 -65.32 0 -100.00 0
454,554 876,824 92.90 867,930 -1.01 507,107 -41.57 762,580 50.38
12.67 23.53 22.88 12.15 17.10
RevenueResidential/bulk/smatv subscriber revenueDTH revenue
Blue Ant Television Ltd. Blue Ant Media Inc. Specialty (category B service) 2015
($) CAGR (%)
CRTC - FINANCIAL SUMMARY - PAY & SPECIALTY
Pay and Specialty
Licensee Licensee Ultimate Owner Type Year
Pre-tax Profit
Canadian Programming ExpensesAcquisition of rights -10.8
P.B.I.T.
Interest ExpenseAdjustments - Gain (Loss)
Total ExpensesOperating IncomeDepreciation
TechnicalSales and PromotionAdministration and General
Total Revenue 5.6
ExpensesProgramming and Production 11.9
Local advertising revenueNational advertising revenueOther revenue
Pre-tax MarginCAGR = Compound Annual Growth Rate
Profitability (%)Operating MarginP.B.I.T. Margin
Average Staff CountAverage Remuneration ($)
Subscribers
Total Canadian Programming 13.8
Canadian Programming/Revenue (%)
Total Remuneration ($)
Script & conceptFiller Programming + Program ProductionInvestment in Programming
Page 176

Undertaking # Service Name
205424063 RDS Info (formerly Réseau Info Sports
(RIS)
2011 2012 Var % 2013 Var % 2014 Var % 2015 Var %
y1 y2 y3 y4 y5
5,500,792 5,228,011 -4.96 4,931,839 -5.67 4,747,215 -3.74 4,456,173 -6.13
3,360,280 2,555,873 -23.94 2,074,274 -18.84 1,932,421 -6.84 1,671,621 -13.50
0 0 0 0 0
2,478,617 1,501,914 -39.41 1,261,213 -16.03 852,172 -32.43 727,889 -14.58
0 0 0 0 0
11,339,689 9,285,798 -18.11 8,267,326 -10.97 7,531,808 -8.90 6,855,683 -8.98
6,085,930 9,991,567 64.17 9,800,305 -1.91 10,046,501 2.51 10,151,508 1.05
425,333 432,726 1.74 411,266 -4.96 411,261 0.00 411,414 0.04
427,609 635,363 48.59 604,944 -4.79 663,694 9.71 709,184 6.85
413,212 535,757 29.66 646,931 20.75 554,779 -14.24 414,124 -25.35
7,352,084 11,595,413 57.72 11,463,446 -1.14 11,676,235 1.86 11,686,230 0.09
3,987,605 -2,309,615 -3,196,120 -4,144,427 -4,830,547
0 0 0 0 0
3,987,605 -2,309,615 -3,196,120 -4,144,427 -4,830,547
0 0 0 0 0
0 0 0 0 0
3,987,605 -2,309,615 -3,196,120 -4,144,427 -4,830,547
859,634 124,942 -85.47 0 -100.00 0 0
0 0 0 0 0
5,166,162 9,822,881 90.14 9,800,305 -0.23 10,046,501 2.51 10,151,508 1.05
0 0 0 0 0
6,025,796 9,947,823 65.09 9,800,305 -1.48 10,046,501 2.51 10,151,508 1.05
53.14 107.13 118.54 133.39 148.07
3,651,902 0 -100.00 0 0 0
37 0 -100.00 0 0 0
98,700
1,444,436 1,380,699 -4.41 1,277,144 -7.50 1,181,220 -7.51 1,116,565 -5.47
35.2 -24.9 -38.7 -55.0 -70.5
35.2 -24.9 -38.7 -55.0 -70.5
35.2 -24.9 -38.7 -55.0 -70.5
CRTC - FINANCIAL SUMMARY - PAY & SPECIALTY
Pay and Specialty
Licensee Licensee Ultimate Owner Type Year
Total Expenses 12.3
Operating IncomeDepreciation
Technical -0.8
Sales and Promotion 13.5
Administration and General 0.1
Total Revenue -11.8
ExpensesProgramming and Production 13.7
Local advertising revenueNational advertising revenue -26.4
Other revenue
RevenueResidential/bulk/smatv subscriber revenue -5.1
DTH revenue -16.0
Le Réseau des sports (RDS) inc. BCE Inc. Specialty (category A service) 2015
($) CAGR (%)
Profitability (%)Operating MarginP.B.I.T. Margin
Average Staff CountAverage Remuneration ($)
Subscribers -6.2
Total Canadian Programming 13.9
Canadian Programming/Revenue (%)
Total Remuneration ($) -100.0
Script & conceptFiller Programming + Program Production 18.4
Investment in Programming
Pre-tax Profit
Canadian Programming ExpensesAcquisition of rights -100.0
P.B.I.T.
Interest ExpenseAdjustments - Gain (Loss)
Pre-tax MarginCAGR = Compound Annual Growth Rate
Page 177

Undertaking # Service Name
535428892 Reality TV
2011 2012 Var % 2013 Var % 2014 Var % 2015 Var %
y1 y2 y3 y4 y5
1,009,677 1,424,014 41.04 0 -100.00 0 0
0 0 0 0 0
0 0 0 0 0
1,352,656 423,859 -68.66 15,220 -96.41 0 -100.00 0
0 0 0 0 0
2,362,333 1,847,873 -21.78 15,220 -99.18 0 -100.00 0
1,602,700 1,334,319 -16.75 282,866 -78.80 0 -100.00 0
123,089 391,753 218.27 0 -100.00 0 0
590,224 202,336 -65.72 0 -100.00 0 0
530,290 679,506 28.14 1,259 -99.81 0 -100.00 0
2,846,303 2,607,914 -8.38 284,125 -89.11 0 -100.00 0
-483,970 -760,041 -268,905 0 0
0 0 0 0 0
-483,970 -760,041 -268,905 0 0
101 0 -100.00 0 0 0
0 0 0 0 0
-484,071 -760,041 -268,905 0 0
83,864 96,257 14.78 54,879 -42.99 0 -100.00 0
0 0 0 0 0
0 200,884 0 -100.00 0 0
0 0 0 0 0
83,864 297,141 254.31 54,879 -81.53 0 -100.00 0
3.55 16.08 360.57
946,800 841,324 -11.14 0 -100.00 0 0
16 11 -31.25 0 -100.00 0 0
59,175 76,484 29.25
1,137,228 1,128,567 -0.76 0 -100.00 0 0
-20.5 -41.1 >999±
-20.5 -41.1 >999±
-20.5 -41.1 >999±
Total Revenue -100.0
ExpensesProgramming and Production -100.0
Local advertising revenueNational advertising revenue -100.0
Other revenue
RevenueResidential/bulk/smatv subscriber revenue -100.0
DTH revenue
Shaw Television Limited Partnership Shaw Communications Inc. Specialty (category B service) 2015
($) CAGR (%)
CRTC - FINANCIAL SUMMARY - PAY & SPECIALTY
Pay and Specialty
Licensee Licensee Ultimate Owner Type Year
Total Canadian Programming -100.0
Canadian Programming/Revenue (%)
Total Remuneration ($) -100.0
Script & conceptFiller Programming + Program ProductionInvestment in Programming
Pre-tax Profit
Canadian Programming ExpensesAcquisition of rights -100.0
P.B.I.T.
Interest ExpenseAdjustments - Gain (Loss)
Total Expenses -100.0
Operating IncomeDepreciation
Technical -100.0
Sales and Promotion -100.0
Administration and General -100.0
Pre-tax MarginCAGR = Compound Annual Growth Rate
Profitability (%)Operating MarginP.B.I.T. Margin
Average Staff CountAverage Remuneration ($)
Subscribers -100.0
Page 178

Undertaking # Service Name
305424731 Red Hot TV (Red Light District TV)
2011 2012 Var % 2013 Var % 2014 Var % 2015 Var %
y1 y2 y3 y4 y5
2,333,945 2,368,510 1.48 2,427,212 2.48 2,326,211 -4.16 2,091,223 -10.10
923,391 930,548 0.78 954,494 2.57 948,080 -0.67 896,247 -5.47
8,971 9,532 6.25 45,991 382.49 44,295 -3.69 48,902 10.40
141,513 105,938 -25.14 155,864 47.13 158,195 1.50 140,396 -11.25
424,541 467,814 10.19 467,591 -0.05 474,585 1.50 421,187 -11.25
8,013 5,567 -30.53 28,879 418.75 25,318 -12.33 21,921 -13.42
583,038 588,851 1.00 698,325 18.59 702,393 0.58 632,406 -9.96
24.98 24.86 28.77 30.19 30.24
RevenueResidential/bulk/smatv subscriber revenueDTH revenue
TEN Broadcasting Inc. Duncan, Stuart Specialty (category B service) 2015
($) CAGR (%)
CRTC - FINANCIAL SUMMARY - PAY & SPECIALTY
Pay and Specialty
Licensee Licensee Ultimate Owner Type Year
Pre-tax Profit
Canadian Programming ExpensesAcquisition of rights 52.8
P.B.I.T.
Interest ExpenseAdjustments - Gain (Loss)
Total ExpensesOperating IncomeDepreciation
TechnicalSales and PromotionAdministration and General
Total Revenue -2.7
ExpensesProgramming and Production -0.7
Local advertising revenueNational advertising revenueOther revenue
Pre-tax MarginCAGR = Compound Annual Growth Rate
Profitability (%)Operating MarginP.B.I.T. Margin
Average Staff CountAverage Remuneration ($)
Subscribers
Total Canadian Programming 2.1
Canadian Programming/Revenue (%)
Total Remuneration ($)
Script & concept -0.2
Filler Programming + Program Production -0.2
Investment in Programming 28.6
Page 179
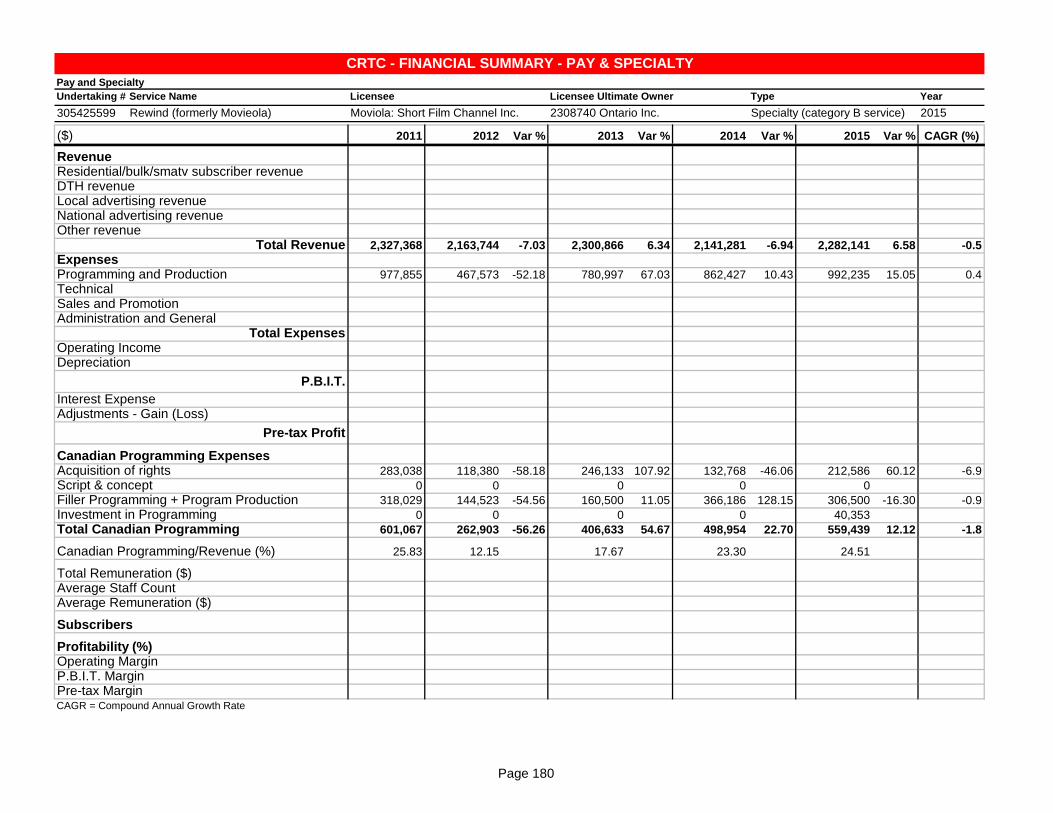
Undertaking # Service Name
305425599 Rewind (formerly Movieola)
2011 2012 Var % 2013 Var % 2014 Var % 2015 Var %
y1 y2 y3 y4 y5
2,327,368 2,163,744 -7.03 2,300,866 6.34 2,141,281 -6.94 2,282,141 6.58
977,855 467,573 -52.18 780,997 67.03 862,427 10.43 992,235 15.05
283,038 118,380 -58.18 246,133 107.92 132,768 -46.06 212,586 60.12
0 0 0 0 0
318,029 144,523 -54.56 160,500 11.05 366,186 128.15 306,500 -16.30
0 0 0 0 40,353
601,067 262,903 -56.26 406,633 54.67 498,954 22.70 559,439 12.12
25.83 12.15 17.67 23.30 24.51
CRTC - FINANCIAL SUMMARY - PAY & SPECIALTY
Pay and Specialty
Licensee Licensee Ultimate Owner Type Year
Total ExpensesOperating IncomeDepreciation
TechnicalSales and PromotionAdministration and General
Total Revenue -0.5
ExpensesProgramming and Production 0.4
Local advertising revenueNational advertising revenueOther revenue
RevenueResidential/bulk/smatv subscriber revenueDTH revenue
Moviola: Short Film Channel Inc. 2308740 Ontario Inc. Specialty (category B service) 2015
($) CAGR (%)
Profitability (%)Operating MarginP.B.I.T. Margin
Average Staff CountAverage Remuneration ($)
Subscribers
Total Canadian Programming -1.8
Canadian Programming/Revenue (%)
Total Remuneration ($)
Script & conceptFiller Programming + Program Production -0.9
Investment in Programming
Pre-tax Profit
Canadian Programming ExpensesAcquisition of rights -6.9
P.B.I.T.
Interest ExpenseAdjustments - Gain (Loss)
Pre-tax MarginCAGR = Compound Annual Growth Rate
Page 180

Undertaking # Service Name
305424137 Rogers on Demand
2011 2012 Var % 2013 Var % 2014 Var % 2015 Var %
y1 y2 y3 y4 y5
70,842,357 68,672,908 -3.06 58,950,209 -14.16 49,905,333 -15.34 47,289,175 -5.24
0 0 0 0 0
0 0 0 0 0
0 0 0 0 0
0 0 0 0 0
70,842,357 68,672,908 -3.06 58,950,209 -14.16 49,905,333 -15.34 47,289,175 -5.24
49,530,014 52,753,491 6.51 48,270,143 -8.50 48,562,853 0.61 44,780,263 -7.79
314,063 282,813 -9.95 277,344 -1.93 362,785 30.81 452,256 24.66
2,306,958 1,838,641 -20.30 1,091,281 -40.65 1,331,647 22.03 969,626 -27.19
0 0 0 0 0
52,151,035 54,874,945 5.22 49,638,768 -9.54 50,257,285 1.25 46,202,145 -8.07
18,691,322 13,797,963 9,311,441 -351,952 1,087,030
15,221,000 20,148,000 32.37 20,678,000 2.63 19,573 -99.91 18,542 -5.27
3,470,322 -6,350,037 -11,366,559 -371,525 1,068,488
0 0 0 0 0
0 0 0 0 0
3,470,322 -6,350,037 -11,366,559 -371,525 1,068,488
0 0 0 4,985,599 5,147,463 3.25
0 0 0 0 0
0 0 0 0 0
0 0 0 0 0
0 0 0 4,985,599 5,147,463 3.25
0.00 0.00 0.00 9.99 10.89
314,000 282,813 -9.93 277,344 -1.93 362,785 30.81 452,256 24.66
3.4 3 -11.76 0 -100.00 3 3.7 23.33
92,353 94,271 2.08 120,928 122,231 1.08
26.4 20.1 15.8 -0.7 2.3
4.9 -9.2 -19.3 -0.7 2.3
4.9 -9.2 -19.3 -0.7 2.3
Total Revenue -9.6
ExpensesProgramming and Production -2.5
Local advertising revenueNational advertising revenueOther revenue
RevenueResidential/bulk/smatv subscriber revenue -9.6
DTH revenue
Rogers Communications Partnership Rogers Communications Inc. Video-on-Demand 2015
($) CAGR (%)
CRTC - FINANCIAL SUMMARY - PAY & SPECIALTY
Pay and Specialty
Licensee Licensee Ultimate Owner Type Year
Total Canadian Programming
Canadian Programming/Revenue (%)
Total Remuneration ($) 9.6
Script & conceptFiller Programming + Program ProductionInvestment in Programming
Pre-tax Profit
Canadian Programming ExpensesAcquisition of rights
P.B.I.T.
Interest ExpenseAdjustments - Gain (Loss)
Total Expenses -3.0
Operating IncomeDepreciation -81.3
Technical 9.5
Sales and Promotion -19.5
Administration and General
Pre-tax MarginCAGR = Compound Annual Growth Rate
Profitability (%)Operating MarginP.B.I.T. Margin
Average Staff CountAverage Remuneration ($) 7.3
Subscribers
Page 181
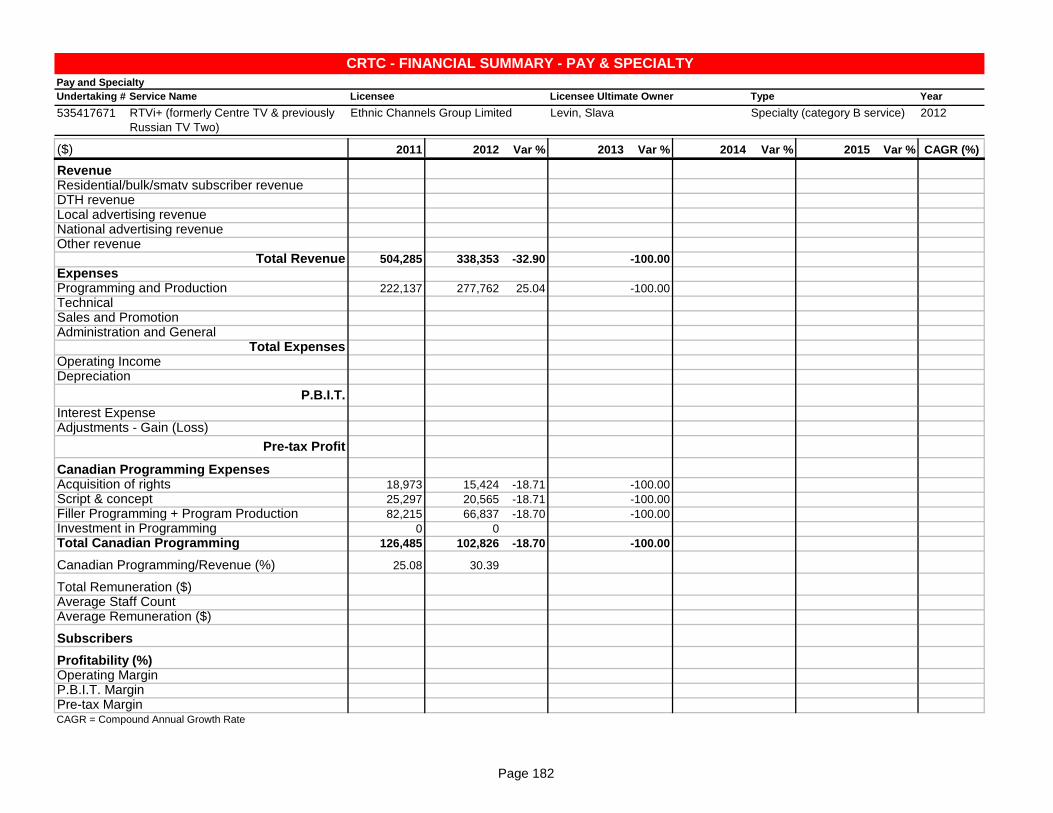
Undertaking # Service Name
535417671 RTVi+ (formerly Centre TV & previously
Russian TV Two)
2011 2012 Var % 2013 Var % 2014 Var % 2015 Var %
y1 y2
504,285 338,353 -32.90 -100.00
222,137 277,762 25.04 -100.00
18,973 15,424 -18.71 -100.00
25,297 20,565 -18.71 -100.00
82,215 66,837 -18.70 -100.00
0 0
126,485 102,826 -18.70 -100.00
25.08 30.39
RevenueResidential/bulk/smatv subscriber revenueDTH revenue
Ethnic Channels Group Limited Levin, Slava Specialty (category B service) 2012
($) CAGR (%)
CRTC - FINANCIAL SUMMARY - PAY & SPECIALTY
Pay and Specialty
Licensee Licensee Ultimate Owner Type Year
Pre-tax Profit
Canadian Programming ExpensesAcquisition of rights
P.B.I.T.
Interest ExpenseAdjustments - Gain (Loss)
Total ExpensesOperating IncomeDepreciation
TechnicalSales and PromotionAdministration and General
Total RevenueExpensesProgramming and Production
Local advertising revenueNational advertising revenueOther revenue
Pre-tax MarginCAGR = Compound Annual Growth Rate
Profitability (%)Operating MarginP.B.I.T. Margin
Average Staff CountAverage Remuneration ($)
Subscribers
Total Canadian Programming
Canadian Programming/Revenue (%)
Total Remuneration ($)
Script & conceptFiller Programming + Program ProductionInvestment in Programming
Page 182

Undertaking # Service Name
535417663 RTVi (formerly Russian TV One)
2011 2012 Var % 2013 Var % 2014 Var % 2015 Var %
y1 y2 y3 y4 y5
982,042 589,231 -40.00 426,233 -27.66 341,824 -19.80 336,641 -1.52
553,072 297,756 -46.16 200,681 -32.60 192,798 -3.93 162,043 -15.95
52,200 17,353 -66.76 11,648 -32.88 10,796 -7.31 6,500 -39.79
69,601 23,137 -66.76 15,531 -32.87 14,394 -7.32 8,667 -39.79
226,202 75,196 -66.76 50,476 -32.87 46,781 -7.32 28,167 -39.79
0 0 0 0 0
348,003 115,686 -66.76 77,655 -32.87 71,971 -7.32 43,334 -39.79
35.44 19.63 18.22 21.05 12.87
CRTC - FINANCIAL SUMMARY - PAY & SPECIALTY
Pay and Specialty
Licensee Licensee Ultimate Owner Type Year
Total ExpensesOperating IncomeDepreciation
TechnicalSales and PromotionAdministration and General
Total Revenue -23.5
ExpensesProgramming and Production -26.4
Local advertising revenueNational advertising revenueOther revenue
RevenueResidential/bulk/smatv subscriber revenueDTH revenue
Ethnic Channels Group Limited Levin, Slava Specialty (category B service) 2015
($) CAGR (%)
Profitability (%)Operating MarginP.B.I.T. Margin
Average Staff CountAverage Remuneration ($)
Subscribers
Total Canadian Programming -40.6
Canadian Programming/Revenue (%)
Total Remuneration ($)
Script & concept -40.6
Filler Programming + Program Production -40.6
Investment in Programming
Pre-tax Profit
Canadian Programming ExpensesAcquisition of rights -40.6
P.B.I.T.
Interest ExpenseAdjustments - Gain (Loss)
Pre-tax MarginCAGR = Compound Annual Growth Rate
Page 183

Undertaking # Service Name
535426044 Sahara Filmy
2011 2012 Var % 2013 Var % 2014 Var % 2015 Var %
y1 y2 y3 y4
55,551 50,506 -9.08 42,686 -15.48 30,391 -28.80 -100.00
41,090 13,238 -67.78 36,283 174.08 25,833 -28.80 -100.00
0 0 0 0
0 0 0 0
6,500 3,200 -50.77 3,000 -6.25 3,000 0.00 -100.00
0 0 0 0
6,500 3,200 -50.77 3,000 -6.25 3,000 0.00 -100.00
11.70 6.34 7.03 9.87
Total RevenueExpensesProgramming and Production
Local advertising revenueNational advertising revenueOther revenue
RevenueResidential/bulk/smatv subscriber revenueDTH revenue
Soundview Entertainment Inc. Soundview Broadcasting Canada Ltd. Specialty (category B service) 2014
($) CAGR (%)
CRTC - FINANCIAL SUMMARY - PAY & SPECIALTY
Pay and Specialty
Licensee Licensee Ultimate Owner Type Year
Total Canadian Programming
Canadian Programming/Revenue (%)
Total Remuneration ($)
Script & conceptFiller Programming + Program ProductionInvestment in Programming
Pre-tax Profit
Canadian Programming ExpensesAcquisition of rights
P.B.I.T.
Interest ExpenseAdjustments - Gain (Loss)
Total ExpensesOperating IncomeDepreciation
TechnicalSales and PromotionAdministration and General
Pre-tax MarginCAGR = Compound Annual Growth Rate
Profitability (%)Operating MarginP.B.I.T. Margin
Average Staff CountAverage Remuneration ($)
Subscribers
Page 184

Undertaking # Service Name
305428436 Salt & Light (Inner Peace Television
Network)
2011 2012 Var % 2013 Var % 2014 Var % 2015 Var %
y1 y2 y3 y4 y5
3,273,709 3,336,833 1.93 3,114,175 -6.67 3,949,855 26.83 2,978,117 -24.60
1,208,347 927,483 -23.24 1,247,254 34.48 946,269 -24.13 1,107,774 17.07
0 0 0 0 0
0 0 0 0 0
1,189,630 908,654 -23.62 1,226,271 34.95 930,617 -24.11 1,076,907 15.72
0 0 0 0 0
1,189,630 908,654 -23.62 1,226,271 34.95 930,617 -24.11 1,076,907 15.72
36.34 27.23 39.38 23.56 36.16
RevenueResidential/bulk/smatv subscriber revenueDTH revenue
Salt and Light Catholic Media
Foundation
Salt and Light Catholic Media
Foundation
Specialty (category B service) 2015
($) CAGR (%)
CRTC - FINANCIAL SUMMARY - PAY & SPECIALTY
Pay and Specialty
Licensee Licensee Ultimate Owner Type Year
Pre-tax Profit
Canadian Programming ExpensesAcquisition of rights
P.B.I.T.
Interest ExpenseAdjustments - Gain (Loss)
Total ExpensesOperating IncomeDepreciation
TechnicalSales and PromotionAdministration and General
Total Revenue -2.3
ExpensesProgramming and Production -2.2
Local advertising revenueNational advertising revenueOther revenue
Pre-tax MarginCAGR = Compound Annual Growth Rate
Profitability (%)Operating MarginP.B.I.T. Margin
Average Staff CountAverage Remuneration ($)
Subscribers
Total Canadian Programming -2.5
Canadian Programming/Revenue (%)
Total Remuneration ($)
Script & conceptFiller Programming + Program Production -2.5
Investment in Programming
Page 185

Undertaking # Service Name
535423230 Saskatchewan Telecommunications,
Regina
2011 2012 Var % 2013 Var % 2014 Var % 2015 Var %
y1 y2 y3 y4 y5
959,948 1,042,381 8.59 1,069,703 2.62 906,083 -15.30 1,181,022 30.34
0 0 0 0 0
0 0 0 0 0
0 0 0 0 0
2,387,881 5,282,099 121.20 3,685,442 -30.23 6,654,773 80.57 5,789,056 -13.01
3,347,829 6,324,480 88.91 4,755,145 -24.81 7,560,856 59.00 6,970,078 -7.81
2,974,298 6,249,387 110.11 4,668,220 -25.30 7,560,406 61.95 6,676,262 -11.69
46,015 63,206 37.36 34,288 -45.75 32,415 -5.46 42,730 31.82
0 0 0 0 0
63,321 99,956 57.86 101,524 1.57 91,278 -10.09 73,249 -19.75
3,083,634 6,412,549 107.95 4,804,032 -25.08 7,684,099 59.95 6,792,241 -11.61
264,195 -88,069 -48,887 -123,243 177,837
0 0 0 0 0
264,195 -88,069 -48,887 -123,243 177,837
0 0 0 0 0
0 0 0 0 0
264,195 -88,069 -48,887 -123,243 177,837
33,085 0 -100.00 0 0 34,854
0 0 0 0 0
0 0 0 0 0
0 0 0 0 0
33,085 0 -100.00 0 0 34,854
0.99 0.00 0.00 0.00 0.50
15,323 47,837 212.19 48,038 0.42 45,974 -4.30 14,198 -69.12
0.5 0.5 0.00 0.5 0.00 0.5 0.00 0.25 -50.00
30,646 95,674 212.19 96,076 0.42 91,948 -4.30 56,792 -38.23
88,452 93,295 5.48 95,649 2.52 100,099 4.65 101,807 1.71
7.9 -1.4 -1.0 -1.6 2.6
7.9 -1.4 -1.0 -1.6 2.6
7.9 -1.4 -1.0 -1.6 2.6
CRTC - FINANCIAL SUMMARY - PAY & SPECIALTY
Pay and Specialty
Licensee Licensee Ultimate Owner Type Year
Total Expenses 21.8
Operating IncomeDepreciation
Technical -1.8
Sales and PromotionAdministration and General 3.7
Total Revenue 20.1
ExpensesProgramming and Production 22.4
Local advertising revenueNational advertising revenueOther revenue 24.8
RevenueResidential/bulk/smatv subscriber revenue 5.3
DTH revenue
Saskatchewan Telecommunications Saskatchewan Telecommunications Pay-per-view programming 2015
($) CAGR (%)
Profitability (%)Operating MarginP.B.I.T. Margin
Average Staff CountAverage Remuneration ($) 16.7
Subscribers 3.6
Total Canadian Programming 1.3
Canadian Programming/Revenue (%)
Total Remuneration ($) -1.9
Script & conceptFiller Programming + Program ProductionInvestment in Programming
Pre-tax Profit
Canadian Programming ExpensesAcquisition of rights 1.3
P.B.I.T.
Interest ExpenseAdjustments - Gain (Loss)
Pre-tax MarginCAGR = Compound Annual Growth Rate
Page 186

Undertaking # Service Name
535417704 SBTN (formerly Vietnamese TV)
2011 2012 Var % 2013 Var % 2014 Var % 2015 Var %
y1 y2 y3 y4 y5
113,495 126,859 11.77 158,228 24.73 160,583 1.49 162,452 1.16
43,583 76,014 74.41 83,939 10.43 100,390 19.60 96,936 -3.44
3,217 5,680 76.56 3,977 -29.98 3,751 -5.68 2,736 -27.06
4,289 7,574 76.59 5,303 -29.98 5,001 -5.69 3,648 -27.05
13,939 24,614 76.58 17,234 -29.98 16,254 -5.69 11,858 -27.05
0 0 0 0 0
21,445 37,868 76.58 26,514 -29.98 25,006 -5.69 18,242 -27.05
18.90 29.85 16.76 15.57 11.23
Total Revenue 9.4
ExpensesProgramming and Production 22.1
Local advertising revenueNational advertising revenueOther revenue
RevenueResidential/bulk/smatv subscriber revenueDTH revenue
Ethnic Channels Group Limited Levin, Slava Specialty (category B service) 2015
($) CAGR (%)
CRTC - FINANCIAL SUMMARY - PAY & SPECIALTY
Pay and Specialty
Licensee Licensee Ultimate Owner Type Year
Total Canadian Programming -4.0
Canadian Programming/Revenue (%)
Total Remuneration ($)
Script & concept -4.0
Filler Programming + Program Production -4.0
Investment in Programming
Pre-tax Profit
Canadian Programming ExpensesAcquisition of rights -4.0
P.B.I.T.
Interest ExpenseAdjustments - Gain (Loss)
Total ExpensesOperating IncomeDepreciation
TechnicalSales and PromotionAdministration and General
Pre-tax MarginCAGR = Compound Annual Growth Rate
Profitability (%)Operating MarginP.B.I.T. Margin
Average Staff CountAverage Remuneration ($)
Subscribers
Page 187

Undertaking # Service Name
535423389 Seaside Communications Inc., Reserve
Mines
2011 2012 Var % 2013 Var % 2014 Var % 2015 Var %
y1 y2 y3
6,692,515 6,952,949 3.89 -100.00
0 0
135,058 129,771 -3.91 -100.00
0 0
1,163,257 1,036,976 -10.86 -100.00
7,990,830 8,119,696 1.61 -100.00
2,292,839 2,368,079 3.28 -100.00
2,518,065 1,942,267 -22.87 -100.00
324,974 477,897 47.06 -100.00
1,478,526 1,709,424 15.62 -100.00
6,614,404 6,497,667 -1.76 -100.00
1,376,426 1,622,029
1,045,317 984,794 -5.79 -100.00
331,109 637,235
620,179 707,338 14.05 -100.00
4,782,429 512,500 -89.28 0 -100.00
4,493,359 442,397 0
0 0
0 0
170,878 0 -100.00
0 0
170,878 0 -100.00
2.14 0.00
1,944,014 1,988,404 2.28 -100.00
31 45 45.16 -100.00
62,710 44,187 -29.54 -100.00
17.2 20.0
4.1 7.8
56.2 5.4
RevenueResidential/bulk/smatv subscriber revenueDTH revenue
Seaside Communications Inc. Oceanside Communication Holdings
Inc.
Video-on-Demand 2013
($) CAGR (%)
CRTC - FINANCIAL SUMMARY - PAY & SPECIALTY
Pay and Specialty
Licensee Licensee Ultimate Owner Type Year
Pre-tax Profit
Canadian Programming ExpensesAcquisition of rights
P.B.I.T.
Interest ExpenseAdjustments - Gain (Loss)
Total ExpensesOperating IncomeDepreciation
TechnicalSales and PromotionAdministration and General
Total RevenueExpensesProgramming and Production
Local advertising revenueNational advertising revenueOther revenue
Pre-tax MarginCAGR = Compound Annual Growth Rate
Profitability (%)Operating MarginP.B.I.T. Margin
Average Staff CountAverage Remuneration ($)
Subscribers
Total Canadian Programming
Canadian Programming/Revenue (%)
Total Remuneration ($)
Script & conceptFiller Programming + Program ProductionInvestment in Programming
Page 188

Undertaking # Service Name
205421564 Séries+
2011 2012 Var % 2013 Var % 2014 Var % 2015 Var %
y1 y2 y3 y4 y5
9,055,881 9,147,987 1.02 9,629,343 5.26 10,419,953 8.21 9,468,386 -9.13
2,990,575 3,022,197 1.06 3,434,738 13.65 3,509,951 2.19 4,416,509 25.83
0 0 0 0 0
17,884,804 18,405,372 2.91 19,612,951 6.56 19,475,134 -0.70 15,814,539 -18.80
0 0 0 842 138,670 >999±
29,931,260 30,575,556 2.15 32,677,032 6.87 33,405,880 2.23 29,838,104 -10.68
9,006,943 9,246,058 2.65 9,389,530 1.55 7,747,589 -17.49 8,028,887 3.63
829,933 763,077 -8.06 774,382 1.48 1,553,250 100.58 445,035 -71.35
1,572,254 1,836,926 16.83 1,379,436 -24.91 1,819,210 31.88 1,818,386 -0.05
2,152,421 2,104,733 -2.22 2,107,047 0.11 2,893,064 37.30 1,497,664 -48.23
13,561,551 13,950,794 2.87 13,650,395 -2.15 14,013,113 2.66 11,789,972 -15.86
16,369,709 16,624,762 19,026,637 19,392,767 18,048,132
0 0 0 98,289 89,731 -8.71
16,369,709 16,624,762 19,026,637 19,294,478 17,958,401
0 0 0 -1,631 9,555,675 >999±
0 0 0 -115,609 501,775 -534.03
16,369,709 16,624,762 19,026,637 19,180,500 8,904,501
3,395,236 3,049,110 -10.19 2,675,927 -12.24 2,058,080 -23.09 2,846,341 38.30
13,025 28,333 117.53 47,996 69.40 246,901 414.42 297,495 20.49
1,542,165 1,537,321 -0.31 1,457,214 -5.21 795,404 -45.42 674,742 -15.17
0 0 0 1,083,135 0 -100.00
4,950,426 4,614,764 -6.78 4,181,137 -9.40 4,183,520 0.06 3,818,578 -8.72
16.54 15.09 12.80 12.52 12.80
2,850,241 2,817,135 -1.16 2,839,792 0.80 1,227,540 -56.77 2,390,114 94.71
27 28 3.70 28 0.00 17.39 -37.89 74 325.53
105,564 100,612 -4.69 101,421 0.80 70,589 -30.40 32,299 -54.24
2,098,941 2,088,135 -0.51 2,079,697 -0.40 1,478,608 -28.90 1,435,247 -2.93
54.7 54.4 58.2 58.1 60.5
54.7 54.4 58.2 57.8 60.2
54.7 54.4 58.2 57.4 29.8
CRTC - FINANCIAL SUMMARY - PAY & SPECIALTY
Pay and Specialty
Licensee Licensee Ultimate Owner Type Year
Total Expenses -3.4
Operating IncomeDepreciation
Technical -14.4
Sales and Promotion 3.7
Administration and General -8.7
Total Revenue -0.1
ExpensesProgramming and Production -2.8
Local advertising revenueNational advertising revenue -3.0
Other revenue
RevenueResidential/bulk/smatv subscriber revenue 1.1
DTH revenue 10.2
8504652 Canada Inc. Corus Entertainment Inc. Specialty (category A service) 2015
($) CAGR (%)
Profitability (%)Operating MarginP.B.I.T. Margin
Average Staff CountAverage Remuneration ($) -25.6
Subscribers -9.1
Total Canadian Programming -6.3
Canadian Programming/Revenue (%)
Total Remuneration ($) -4.3
Script & concept 118.6
Filler Programming + Program Production -18.7
Investment in Programming
Pre-tax Profit
Canadian Programming ExpensesAcquisition of rights -4.3
P.B.I.T.
Interest ExpenseAdjustments - Gain (Loss)
Pre-tax MarginCAGR = Compound Annual Growth Rate
Page 189

Undertaking # Service Name
405424144 Shaw on Demand
405424144 Shaw on Demand
2011 2012 Var % 2013 Var % 2014 Var % 2015 Var %
y1 y2 y3 y4 y5
73,828,608 70,076,710 -5.08 69,047,729 -1.47 69,247,726 0.29 62,055,625 -10.39
0 0 0 0 0
0 0 0 0 0
0 0 0 0 0
0 0 0 0 0
73,828,608 70,076,710 -5.08 69,047,729 -1.47 69,247,726 0.29 62,055,625 -10.39
44,171,298 44,151,362 -0.05 41,080,351 -6.96 42,235,064 2.81 38,744,572 -8.26
0 0 0 0 0
0 0 0 0 0
8,363,433 8,296,516 -0.80 8,116,600 -2.17 8,326,689 2.59 8,149,648 -2.13
52,534,731 52,447,878 -0.17 49,196,951 -6.20 50,561,753 2.77 46,894,220 -7.25
21,293,877 17,628,832 19,850,778 18,685,973 15,161,405
12,500,000 15,000,000 20.00 15,267,000 1.78 15,267,000 0.00 15,000,000 -1.75
8,793,877 2,628,832 4,583,778 3,418,973 161,405
0 0 0 0 0
0 0 0 0 0
8,793,877 2,628,832 4,583,778 3,418,973 161,405
0 0 0 0 0
0 0 0 0 0
0 0 0 0 0
0 0 0 0 0
0 0 0 0 0
0.00 0.00 0.00 0.00 0.00
0 0 0 0 0
0 0 0 0 0
28.8 25.2 28.7 27.0 24.4
11.9 3.8 6.6 4.9 0.3
11.9 3.8 6.6 4.9 0.3
Programming and Production -3.2
TechnicalSales and Promotion
Other revenueTotal Revenue -4.3
Expenses
DTH revenueLocal advertising revenueNational advertising revenue
($) CAGR (%)
RevenueResidential/bulk/smatv subscriber revenue -4.3
Shaw Cablesystems (VCI) Limited Shaw Communications Inc. Video-on-Demand 2015
Shaw Communications Inc. Shaw, JR Video-on-Demand 2015
CRTC - FINANCIAL SUMMARY - PAY & SPECIALTY
Pay and Specialty
Licensee Licensee Ultimate Owner Type Year
Total Remuneration ($)Average Staff CountAverage Remuneration ($)
Investment in ProgrammingTotal Canadian Programming
Canadian Programming/Revenue (%)
Acquisition of rightsScript & conceptFiller Programming + Program Production
Adjustments - Gain (Loss)
Pre-tax Profit
Canadian Programming Expenses
Depreciation 4.7
P.B.I.T.
Interest Expense
Administration and General -0.7
Total Expenses -2.8
Operating Income
P.B.I.T. MarginPre-tax MarginCAGR = Compound Annual Growth Rate
Subscribers
Profitability (%)Operating Margin
Page 190

Undertaking # Service Name
405416430 Shaw Pay-Per-View (formerly Allarcom)
2011 2012 Var % 2013 Var % 2014 Var % 2015 Var %
y1 y2 y3 y4 y5
25,141,491 20,728,298 -17.55 17,963,434 -13.34 14,373,818 -19.98 14,246,852 -0.88
0 0 0 0 0
0 0 0 0 0
0 0 0 0 0
0 0 0 0 0
25,141,491 20,728,298 -17.55 17,963,434 -13.34 14,373,818 -19.98 14,246,852 -0.88
20,300,262 16,499,555 -18.72 14,259,196 -13.58 11,190,749 -21.52 14,045,221 25.51
0 0 0 0 0
1,269 158 -87.55 0 -100.00 0 0
2,829,075 2,606,403 -7.87 2,924,998 12.22 2,988,569 2.17 3,097,745 3.65
23,130,606 19,106,116 -17.40 17,184,194 -10.06 14,179,318 -17.49 17,142,966 20.90
2,010,885 1,622,182 779,240 194,500 -2,896,114
1,000,000 1,000,000 0.00 1,000,000 0.00 1,000,000 0.00 0 -100.00
1,010,885 622,182 -220,760 -805,500 -2,896,114
0 0 0 0 0
0 0 0 0 0
1,010,885 622,182 -220,760 -805,500 -2,896,114
0 0 0 0 0
0 0 0 0 0
0 0 0 0 0
0 0 0 0 0
0 0 0 0 0
0.00 0.00 0.00 0.00 0.00
0 0 0 0 0
0 0 0 0 0
0 0 0 0 0
8.0 7.8 4.3 1.4 -20.3
4.0 3.0 -1.2 -5.6 -20.3
4.0 3.0 -1.2 -5.6 -20.3
DTH revenueLocal advertising revenueNational advertising revenue
($) CAGR (%)
RevenueResidential/bulk/smatv subscriber revenue -13.2
Pay and Specialty
Licensee Licensee Ultimate Owner Type Year
Shaw Pay-Per-View Ltd. Shaw Communications Inc. Pay-per-view Direct-to-Home 2015
CRTC - FINANCIAL SUMMARY - PAY & SPECIALTY
Acquisition of rightsScript & conceptFiller Programming + Program Production
Adjustments - Gain (Loss)
Pre-tax Profit
Canadian Programming Expenses
Depreciation -100.0
P.B.I.T.
Interest Expense
Administration and General 2.3
Total Expenses -7.2
Operating Income
Programming and Production -8.8
TechnicalSales and Promotion -100.0
Other revenueTotal Revenue -13.2
Expenses
P.B.I.T. MarginPre-tax MarginCAGR = Compound Annual Growth Rate
Subscribers
Profitability (%)Operating Margin
Total Remuneration ($)Average Staff CountAverage Remuneration ($)
Investment in ProgrammingTotal Canadian Programming
Canadian Programming/Revenue (%)
Page 191

Undertaking # Service Name
435408117 Shaw Pay-Per-View (formerly Home
Theatre (pay-per-view))
2011 2012 Var % 2013 Var % 2014 Var % 2015 Var %
y1 y2 y3 y4 y5
0 0 0 0 0
9,986,769 6,866,422 -31.24 6,981,776 1.68 6,711,750 -3.87 6,294,149 -6.22
0 0 0 0 0
0 0 0 0 0
0 0 0 0 0
9,986,769 6,866,422 -31.24 6,981,776 1.68 6,711,750 -3.87 6,294,149 -6.22
7,662,163 5,672,275 -25.97 5,685,319 0.23 5,131,554 -9.74 4,534,790 -11.63
0 0 0 0 0
576 34,051 >999± 0 -100.00 0 0
1,285,345 1,173,562 -8.70 1,126,822 -3.98 1,357,808 20.50 1,376,677 1.39
8,948,084 6,879,888 -23.11 6,812,141 -0.98 6,489,362 -4.74 5,911,467 -8.91
1,038,685 -13,466 169,635 222,388 382,682
0 0 0 0 0
1,038,685 -13,466 169,635 222,388 382,682
0 0 0 0 0
0 0 0 0 0
1,038,685 -13,466 169,635 222,388 382,682
0 0 0 0 0
0 0 0 0 0
0 0 0 0 0
0 0 0 0 0
0 0 0 0 0
0.00 0.00 0.00 0.00 0.00
0 0 0 0 0
0 0 0 0 0
0 0 0 0 0
10.4 -0.2 2.4 3.3 6.1
10.4 -0.2 2.4 3.3 6.1
10.4 -0.2 2.4 3.3 6.1
Pay and Specialty
Licensee Licensee Ultimate Owner Type Year
Shaw Pay-Per-View Ltd. Shaw Communications Inc. Pay-per-view programming 2015
CRTC - FINANCIAL SUMMARY - PAY & SPECIALTY
Depreciation
P.B.I.T.
Interest Expense
Administration and General 1.7
Total Expenses -9.8
Operating Income
Programming and Production -12.3
TechnicalSales and Promotion -100.0
Other revenueTotal Revenue -10.9
Expenses
DTH revenue -10.9
Local advertising revenueNational advertising revenue
($) CAGR (%)
RevenueResidential/bulk/smatv subscriber revenue
P.B.I.T. MarginPre-tax MarginCAGR = Compound Annual Growth Rate
Subscribers
Profitability (%)Operating Margin
Total Remuneration ($)Average Staff CountAverage Remuneration ($)
Investment in ProgrammingTotal Canadian Programming
Canadian Programming/Revenue (%)
Acquisition of rightsScript & conceptFiller Programming + Program Production
Adjustments - Gain (Loss)
Pre-tax Profit
Canadian Programming Expenses
Page 192

Undertaking # Service Name
315413732 Showcase
2011 2012 Var % 2013 Var % 2014 Var % 2015 Var %
y1 y2 y3 y4 y5
29,125,559 27,102,402 -6.95 22,982,724 -15.20 23,752,222 3.35 23,401,033 -1.48
8,906,659 9,135,948 2.57 8,754,033 -4.18 9,384,257 7.20 9,392,899 0.09
0 0 0 0 0
36,338,969 37,918,213 4.35 41,178,577 8.60 42,553,141 3.34 40,133,270 -5.69
0 0 0 0 0
74,371,187 74,156,563 -0.29 72,915,334 -1.67 75,689,620 3.80 72,927,202 -3.65
28,919,580 21,864,102 -24.40 30,443,160 39.24 26,901,051 -11.64 27,275,300 1.39
1,029,428 1,096,717 6.54 803,773 -26.71 640,967 -20.26 657,063 2.51
2,395,043 1,637,657 -31.62 2,066,965 26.21 2,343,816 13.39 1,773,687 -24.32
3,407,141 2,575,415 -24.41 2,697,361 4.74 2,481,409 -8.01 2,415,514 -2.66
35,751,192 27,173,891 -23.99 36,011,259 32.52 32,367,243 -10.12 32,121,564 -0.76
38,619,995 46,982,672 36,904,075 43,322,377 40,805,638
0 3,654 97,114 >999± 100,030 3.00 90,677 -9.35
38,619,995 46,979,018 36,806,961 43,222,347 40,714,961
48,370,988 5,051,040 -89.56 2,065,008 -59.12 -1,484,441 -171.89 28,938,403 >999±
11,916,112 0 -100.00 0 0 0
2,165,119 41,927,978 34,741,953 44,706,788 11,776,558
6,678,333 11,162,478 67.14 14,677,481 31.49 12,254,609 -16.51 14,085,156 14.94
97,354 326,303 235.17 244,467 -25.08 0 -100.00 0
1,929,441 2,208,090 14.44 2,235,385 1.24 1,647,659 -26.29 1,511,604 -8.26
0 0 0 0 0
8,705,128 13,696,871 57.34 17,157,333 25.26 13,902,268 -18.97 15,596,760 12.19
11.70 18.47 23.53 18.37 21.39
1,632,633 2,916,416 78.63 2,912,691 -0.13 2,484,594 -14.70 2,139,428 -13.89
21 34 61.90 33 -2.94 27 -18.18 23 -14.81
77,744 85,777 10.33 88,263 2.90 92,022 4.26 93,019 1.08
8,670,774 8,845,368 2.01 9,099,034 2.87 7,127,950 -21.66 6,490,491 -8.94
51.9 63.4 50.6 57.2 56.0
51.9 63.4 50.5 57.1 55.8
2.9 56.5 47.6 59.1 16.1
CRTC - FINANCIAL SUMMARY - PAY & SPECIALTY
Programming and Production -1.5
Technical -10.6
Sales and Promotion -7.2
Other revenueTotal Revenue -0.5
Expenses
DTH revenue 1.3
Local advertising revenueNational advertising revenue 2.5
($) CAGR (%)
RevenueResidential/bulk/smatv subscriber revenue -5.3
Pay and Specialty
Licensee Licensee Ultimate Owner Type Year
Showcase Television Inc. Shaw Communications Inc. Specialty (category A service) 2015
Total Remuneration ($) 7.0
Average Staff CountAverage Remuneration ($) 4.6
Investment in ProgrammingTotal Canadian Programming 15.7
Canadian Programming/Revenue (%)
Acquisition of rights 20.5
Script & concept -100.0
Filler Programming + Program Production -5.9
Adjustments - Gain (Loss)
Pre-tax Profit
Canadian Programming Expenses
Depreciation
P.B.I.T.
Interest Expense
Administration and General -8.2
Total Expenses -2.6
Operating Income
P.B.I.T. MarginPre-tax MarginCAGR = Compound Annual Growth Rate
Subscribers -7.0
Profitability (%)Operating Margin
Page 193

Undertaking # Service Name
535417803 Silver Screen Classics
2011 2012 Var % 2013 Var % 2014 Var % 2015 Var %
y1 y2 y3 y4 y5
2,410,883 3,593,770 49.06 4,216,493 17.33 4,400,819 4.37 4,416,867 0.36
811,600 738,179 -9.05 656,236 -11.10 819,936 24.95 825,371 0.66
70,246 42,640 -39.30 61,360 43.90 47,244 -23.01 167,105 253.71
0 0 0 0 0
196,477 249,856 27.17 228,500 -8.55 449,108 96.55 307,658 -31.50
0 0 0 0 0
266,723 292,496 9.66 289,860 -0.90 496,352 71.24 474,763 -4.35
11.06 8.14 6.87 11.28 10.75
DTH revenueLocal advertising revenueNational advertising revenue
($) CAGR (%)
RevenueResidential/bulk/smatv subscriber revenue
Pay and Specialty
Licensee Licensee Ultimate Owner Type Year
1490525 Ontario Inc. 2308740 Ontario Inc. Specialty (category B service) 2015
CRTC - FINANCIAL SUMMARY - PAY & SPECIALTY
Acquisition of rights 24.2
Script & conceptFiller Programming + Program Production 11.9
Adjustments - Gain (Loss)
Pre-tax Profit
Canadian Programming Expenses
Depreciation
P.B.I.T.
Interest Expense
Administration and GeneralTotal Expenses
Operating Income
Programming and Production 0.4
TechnicalSales and Promotion
Other revenueTotal Revenue 16.3
Expenses
P.B.I.T. MarginPre-tax MarginCAGR = Compound Annual Growth Rate
Subscribers
Profitability (%)Operating Margin
Total Remuneration ($)Average Staff CountAverage Remuneration ($)
Investment in ProgrammingTotal Canadian Programming 15.5
Canadian Programming/Revenue (%)
Page 194

Undertaking # Service Name
305425416 Sky TG 24 Canada (formerly Network
Italia)
2011 2012 Var % 2013 Var % 2014 Var % 2015 Var %
y1 y2 y3 y4 y5
204,561 299,336 46.33 272,171 -9.08 362,888 33.33 233,228 -35.73
67,734 121,000 78.64 114,650 -5.25 98,650 -13.96 110,400 11.91
4,000 4,000 0.00 4,000 0.00 4,000 0.00 4,000 0.00
0 0 0 0 0
0 0 0 0 0
0 0 0 0 0
4,000 4,000 0.00 4,000 0.00 4,000 0.00 4,000 0.00
1.96 1.34 1.47 1.10 1.72
Pay and Specialty
Licensee Licensee Ultimate Owner Type Year
Telelatino Network Inc. Corus Entertainment Inc. Specialty (category B service) 2015
CRTC - FINANCIAL SUMMARY - PAY & SPECIALTY
Depreciation
P.B.I.T.
Interest Expense
Administration and GeneralTotal Expenses
Operating Income
Programming and Production 13.0
TechnicalSales and Promotion
Other revenueTotal Revenue 3.3
Expenses
DTH revenueLocal advertising revenueNational advertising revenue
($) CAGR (%)
RevenueResidential/bulk/smatv subscriber revenue
P.B.I.T. MarginPre-tax MarginCAGR = Compound Annual Growth Rate
Subscribers
Profitability (%)Operating Margin
Total Remuneration ($)Average Staff CountAverage Remuneration ($)
Investment in ProgrammingTotal Canadian Programming 0.0
Canadian Programming/Revenue (%)
Acquisition of rights 0.0
Script & conceptFiller Programming + Program Production
Adjustments - Gain (Loss)
Pre-tax Profit
Canadian Programming Expenses
Page 195

Undertaking # Service Name
315413724 Slice
2011 2012 Var % 2013 Var % 2014 Var % 2015 Var %
y1 y2 y3 y4 y5
10,756,752 10,643,040 -1.06 10,585,538 -0.54 10,929,814 3.25 11,159,571 2.10
3,248,789 3,203,619 -1.39 2,737,280 -14.56 2,131,438 -22.13 2,120,156 -0.53
0 0 0 0 0
25,862,777 27,287,161 5.51 29,369,674 7.63 30,327,863 3.26 25,605,325 -15.57
0 0 0 0 0
39,868,318 41,133,820 3.17 42,692,492 3.79 43,389,115 1.63 38,885,052 -10.38
27,659,722 28,352,158 2.50 33,519,156 18.22 30,973,533 -7.59 20,926,839 -32.44
717,179 729,463 1.71 719,634 -1.35 749,096 4.09 790,794 5.57
1,099,683 1,543,844 40.39 1,291,413 -16.35 699,738 -45.82 400,037 -42.83
2,493,930 1,901,212 -23.77 2,026,957 6.61 2,406,996 18.75 2,296,741 -4.58
31,970,514 32,526,677 1.74 37,557,160 15.47 34,829,363 -7.26 24,414,411 -29.90
7,897,804 8,607,143 5,135,332 8,559,752 14,470,641
0 13,147 42,571 223.81 171,849 303.68 218,581 27.19
7,897,804 8,593,996 5,092,761 8,387,903 14,252,060
1,598,333 2,075,528 29.86 2,265,993 9.18 2,255,512 -0.46 1,634,765 -27.52
0 0 0 0 0
6,299,471 6,518,468 2,826,768 6,132,391 12,617,295
23,456,950 21,913,517 -6.58 25,795,709 17.72 23,563,764 -8.65 12,754,960 -45.87
72,500 215,832 197.70 199,675 -7.49 0 -100.00 358,054
1,231,796 1,586,099 28.76 1,802,119 13.62 1,682,949 -6.61 1,360,898 -19.14
0 0 0 0 0
24,761,246 23,715,448 -4.22 27,797,503 17.21 25,246,713 -9.18 14,473,912 -42.67
62.11 57.65 65.11 58.19 37.22
1,597,687 2,256,654 41.25 2,265,931 0.41 2,499,038 10.29 2,153,712 -13.82
21 26 23.81 25 -3.85 28 12.00 23 -17.86
76,080 86,794 14.08 90,637 4.43 89,251 -1.53 93,640 4.92
6,515,479 6,079,242 -6.70 5,461,976 -10.15 5,230,139 -4.24 4,977,217 -4.84
19.8 20.9 12.0 19.7 37.2
19.8 20.9 11.9 19.3 36.7
15.8 15.8 6.6 14.1 32.4
CRTC - FINANCIAL SUMMARY - PAY & SPECIALTY
Programming and Production -6.7
Technical 2.5
Sales and Promotion -22.3
Other revenueTotal Revenue -0.6
Expenses
DTH revenue -10.1
Local advertising revenueNational advertising revenue -0.3
($) CAGR (%)
RevenueResidential/bulk/smatv subscriber revenue 0.9
Pay and Specialty
Licensee Licensee Ultimate Owner Type Year
Life Network Inc. Shaw Communications Inc. Specialty (category A service) 2015
Total Remuneration ($) 7.8
Average Staff CountAverage Remuneration ($) 5.3
Investment in ProgrammingTotal Canadian Programming -12.6
Canadian Programming/Revenue (%)
Acquisition of rights -14.1
Script & concept 49.1
Filler Programming + Program Production 2.5
Adjustments - Gain (Loss)
Pre-tax Profit
Canadian Programming Expenses
Depreciation
P.B.I.T.
Interest Expense
Administration and General -2.0
Total Expenses -6.5
Operating Income
P.B.I.T. MarginPre-tax MarginCAGR = Compound Annual Growth Rate
Subscribers -6.5
Profitability (%)Operating Margin
Page 196

Undertaking # Service Name
535422357 Smithsonian Channel (formerly eqhd)
2011 2012 Var % 2013 Var % 2014 Var % 2015 Var %
y1 y2 y3 y4 y5
3,212,788 3,341,900 4.02 3,511,990 5.09 3,926,374 11.80 4,304,032 9.62
637,746 1,428,296 123.96 1,211,853 -15.15 1,367,063 12.81 1,629,738 19.21
166,570 209,524 25.79 230,865 10.19 94,683 -58.99 264,209 179.05
0 0 0 0 0
0 316,176 423,135 33.83 418,906 -1.00 487,177 16.30
0 0 83 0 -100.00 0
166,570 525,700 215.60 654,083 24.42 513,589 -21.48 751,386 46.30
5.18 15.73 18.62 13.08 17.46
DTH revenueLocal advertising revenueNational advertising revenue
($) CAGR (%)
RevenueResidential/bulk/smatv subscriber revenue
Pay and Specialty
Licensee Licensee Ultimate Owner Type Year
Blue Ant Television Ltd. Blue Ant Media Inc. Specialty (category B service) 2015
CRTC - FINANCIAL SUMMARY - PAY & SPECIALTY
Acquisition of rights 12.2
Script & conceptFiller Programming + Program Production
Adjustments - Gain (Loss)
Pre-tax Profit
Canadian Programming Expenses
Depreciation
P.B.I.T.
Interest Expense
Administration and GeneralTotal Expenses
Operating Income
Programming and Production 26.4
TechnicalSales and Promotion
Other revenueTotal Revenue 7.6
Expenses
P.B.I.T. MarginPre-tax MarginCAGR = Compound Annual Growth Rate
Subscribers
Profitability (%)Operating Margin
Total Remuneration ($)Average Staff CountAverage Remuneration ($)
Investment in ProgrammingTotal Canadian Programming 45.7
Canadian Programming/Revenue (%)
Page 197

Undertaking # Service Name
535428404 Sogetel inc., Nicolet
2011 2012 Var % 2013 Var % 2014 Var % 2015 Var %
y1 y2 y3 y4 y5
26,948 56,332 109.04 100,934 79.18 132,588 31.36 92,983 -29.87
0 0 0 0 0
0 0 0 0 0
0 0 0 0 0
0 0 0 0 0
26,948 56,332 109.04 100,934 79.18 132,588 31.36 92,983 -29.87
13,479 27,962 107.45 54,275 94.10 70,046 29.06 44,168 -36.94
18,514 21,574 16.53 27,685 28.33 36,908 33.31 36,907 0.00
0 1,200 0 -100.00 0 0
1,174 0 -100.00 1,200 1,200 0.00 1,200 0.00
33,167 50,736 52.97 83,160 63.91 108,154 30.06 82,275 -23.93
-6,219 5,596 17,774 24,434 10,708
13,303 17,890 34.48 19,846 10.93 32,165 62.07 34,225 6.40
-19,522 -12,294 -2,072 -7,731 -23,517
0 0 0 0 0
0 0 0 0 0
-19,522 -12,294 -2,072 -7,731 -23,517
0 0 0 0 0
0 0 0 0 0
0 0 0 0 0
0 0 0 0 0
0 0 0 0 0
0.00 0.00 0.00 0.00 0.00
0 0 0 0 0
0 0 0 0 0
-23.1 9.9 17.6 18.4 11.5
-72.4 -21.8 -2.1 -5.8 -25.3
-72.4 -21.8 -2.1 -5.8 -25.3
CRTC - FINANCIAL SUMMARY - PAY & SPECIALTY
Programming and Production 34.5
Technical 18.8
Sales and Promotion
Other revenueTotal Revenue 36.3
Expenses
DTH revenueLocal advertising revenueNational advertising revenue
($) CAGR (%)
RevenueResidential/bulk/smatv subscriber revenue 36.3
Pay and Specialty
Licensee Licensee Ultimate Owner Type Year
Sogetel inc. Gestion Michel Biron inc. Video-on-Demand 2015
Total Remuneration ($)Average Staff CountAverage Remuneration ($)
Investment in ProgrammingTotal Canadian Programming
Canadian Programming/Revenue (%)
Acquisition of rightsScript & conceptFiller Programming + Program Production
Adjustments - Gain (Loss)
Pre-tax Profit
Canadian Programming Expenses
Depreciation 26.7
P.B.I.T.
Interest Expense
Administration and General 0.6
Total Expenses 25.5
Operating Income
P.B.I.T. MarginPre-tax MarginCAGR = Compound Annual Growth Rate
Subscribers
Profitability (%)Operating Margin
Page 198

Undertaking # Service Name
535425707 Source Cable Limited, Hamilton (Part of)
2011 2012 Var % 2013 Var % 2014 Var % 2015 Var %
y1
206,036 -100.00
0
0
0
0
206,036 -100.00
142,000 -100.00
0
0
0
142,000 -100.00
64,036
76,332 -100.00
-12,296
0
0
-12,296
0
0
142,000 -100.00
0
142,000 -100.00
68.92
0
0
31.1
-6.0
-6.0
DTH revenueLocal advertising revenueNational advertising revenue
($) CAGR (%)
RevenueResidential/bulk/smatv subscriber revenue
Pay and Specialty
Licensee Licensee Ultimate Owner Type Year
Source Cable Limited Campbell, James Edward Video-on-Demand 2011
CRTC - FINANCIAL SUMMARY - PAY & SPECIALTY
Acquisition of rightsScript & conceptFiller Programming + Program Production
Adjustments - Gain (Loss)
Pre-tax Profit
Canadian Programming Expenses
Depreciation
P.B.I.T.
Interest Expense
Administration and GeneralTotal Expenses
Operating Income
Programming and ProductionTechnicalSales and Promotion
Other revenueTotal Revenue
Expenses
P.B.I.T. MarginPre-tax MarginCAGR = Compound Annual Growth Rate
Subscribers
Profitability (%)Operating Margin
Total Remuneration ($)Average Staff CountAverage Remuneration ($)
Investment in ProgrammingTotal Canadian Programming
Canadian Programming/Revenue (%)
Page 199

Undertaking # Service Name
305417306 Space (formerly Space: The Imagination
Station)
2011 2012 Var % 2013 Var % 2014 Var % 2015 Var %
y1 y2 y3 y4 y5
16,617,021 16,796,893 1.08 16,714,085 -0.49 18,640,373 11.52 17,390,266 -6.71
5,283,389 5,674,387 7.40 5,906,835 4.10 5,865,694 -0.70 5,724,826 -2.40
0 0 0 0 0
27,615,072 27,582,371 -0.12 27,638,399 0.20 26,527,579 -4.02 31,765,179 19.74
263,626 92,206 -65.02 14,670 -84.09 52,588 258.47 60,000 14.09
49,779,108 50,145,857 0.74 50,273,989 0.26 51,086,234 1.62 54,940,271 7.54
22,532,359 18,367,094 -18.49 24,728,320 34.63 25,498,668 3.12 17,903,801 -29.79
1,531,759 1,426,726 -6.86 1,374,150 -3.69 1,344,777 -2.14 1,183,783 -11.97
2,592,403 2,492,057 -3.87 2,996,612 20.25 2,291,021 -23.55 2,351,927 2.66
3,913,623 3,306,103 -15.52 3,184,090 -3.69 3,782,557 18.80 4,115,939 8.81
30,570,144 25,591,980 -16.28 32,283,172 26.15 32,917,023 1.96 25,555,450 -22.36
19,208,964 24,553,877 17,990,817 18,169,211 29,384,821
3,346,856 1,123,127 -66.44 741,071 -34.02 771,387 4.09 912,774 18.33
15,862,108 23,430,750 17,249,746 17,397,824 28,472,047
0 0 0 8 866 >999±
-1,452,451 -3,404,749 134.41 -3,454,291 1.46 -5,235,231 51.56 -5,104,058 -2.51
14,409,657 20,026,001 13,795,455 12,162,585 23,367,123
10,379,380 7,965,257 -23.26 14,115,325 77.21 12,971,014 -8.11 3,339,810 -74.25
60,000 86,667 44.45 100,000 15.38 34,945 -65.06 0 -100.00
2,907,621 4,867,235 67.40 3,423,025 -29.67 3,654,848 6.77 3,220,182 -11.89
103,675 0 -100.00 0 0 0
13,450,676 12,919,159 -3.95 17,638,350 36.53 16,660,807 -5.54 6,559,992 -60.63
27.02 25.76 35.08 32.61 11.94
1,363,417 1,724,502 26.48 1,820,195 5.55 2,320,504 27.49 1,803,838 -22.27
18 18 0.00 18.08 0.44 29.92 65.49 25 -16.44
75,745 95,806 26.48 100,675 5.08 77,557 -22.96 72,154 -6.97
6,871,328 6,678,905 -2.80 6,562,605 -1.74 6,355,043 -3.16 6,096,674 -4.07
38.6 49.0 35.8 35.6 53.5
31.9 46.7 34.3 34.1 51.8
28.9 39.9 27.4 23.8 42.5
Pay and Specialty
Licensee Licensee Ultimate Owner Type Year
Bell Media Inc. BCE Inc. Specialty (category A service) 2015
CRTC - FINANCIAL SUMMARY - PAY & SPECIALTY
Depreciation -27.7
P.B.I.T.
Interest Expense
Administration and General 1.3
Total Expenses -4.4
Operating Income
Programming and Production -5.6
Technical -6.2
Sales and Promotion -2.4
Other revenue -30.9
Total Revenue 2.5
Expenses
DTH revenue 2.0
Local advertising revenueNational advertising revenue 3.6
($) CAGR (%)
RevenueResidential/bulk/smatv subscriber revenue 1.1
P.B.I.T. MarginPre-tax MarginCAGR = Compound Annual Growth Rate
Subscribers -3.0
Profitability (%)Operating Margin
Total Remuneration ($) 7.3
Average Staff CountAverage Remuneration ($) -1.2
Investment in Programming -100.0
Total Canadian Programming -16.4
Canadian Programming/Revenue (%)
Acquisition of rights -24.7
Script & concept -100.0
Filler Programming + Program Production 2.6
Adjustments - Gain (Loss)
Pre-tax Profit
Canadian Programming Expenses
Page 200

Undertaking # Service Name
305417356 Sportsnet 360 (formerly The Score)
2011 2012 Var % 2013 Var % 2014 Var % 2015 Var %
y1 y2 y3 y4 y5
11,011,374 10,898,244 -1.03 11,410,901 4.70 11,447,682 0.32 16,472,760 43.90
3,984,544 3,466,290 -13.01 4,164,772 20.15 4,737,020 13.74 5,339,075 12.71
0 0 0 0 0
27,993,128 28,248,857 0.91 25,619,253 -9.31 12,446,815 -51.42 13,060,736 4.93
636,985 475,854 -25.30 460,233 -3.28 679,675 47.68 228,627 -66.36
43,626,031 43,089,245 -1.23 41,655,159 -3.33 29,311,192 -29.63 35,101,198 19.75
20,116,304 25,882,893 28.67 20,663,260 -20.17 21,912,028 6.04 27,795,610 26.85
3,355,720 4,364,230 30.05 2,510,560 -42.47 4,099,957 63.31 4,167,570 1.65
3,219,465 3,556,241 10.46 2,480,066 -30.26 2,061,470 -16.88 2,164,226 4.98
5,924,261 1,304,679 -77.98 19,705,116 >999± 4,891,240 -75.18 3,074,508 -37.14
32,615,750 35,108,043 7.64 45,359,002 29.20 32,964,695 -27.32 37,201,914 12.85
11,010,281 7,981,202 -3,703,843 -3,653,503 -2,100,716
3,321,523 2,642,217 -20.45 1,554,094 -41.18 3,296,895 112.14 2,846,984 -13.65
7,688,758 5,338,985 -5,257,937 -6,950,398 -4,947,700
0 0 109,557 378,742 245.70 0 -100.00
-139,722 -170,985 22.38 -3,823 -97.76 0 -100.00 0
7,549,036 5,168,000 -5,371,317 -7,329,140 -4,947,700
0 0 597,344 0 -100.00 3,371,993
0 0 0 0 0
15,914,385 20,219,253 27.05 17,080,702 -15.52 18,584,510 8.80 14,756,126 -20.60
0 0 0 0 0
15,914,385 20,219,253 27.05 17,678,046 -12.57 18,584,510 5.13 18,128,119 -2.46
36.48 46.92 42.44 63.40 51.65
11,306,565 10,578,634 -6.44 13,226,590 25.03 9,264,697 -29.95 10,274,188 10.90
172 162 -5.81 149 -8.02 118 -20.81 123.25 4.45
65,736 65,300 -0.66 88,769 35.94 78,514 -11.55 83,361 6.17
6,639,501 6,731,693 1.39 6,041,000 -10.26 5,869,000 -2.85 5,694,000 -2.98
25.2 18.5 -8.9 -12.5 -6.0
17.6 12.4 -12.6 -23.7 -14.1
17.3 12.0 -12.9 -25.0 -14.1
CRTC - FINANCIAL SUMMARY - PAY & SPECIALTY
Programming and Production 8.4
Technical 5.6
Sales and Promotion -9.5
Other revenue -22.6
Total Revenue -5.3
Expenses
DTH revenue 7.6
Local advertising revenueNational advertising revenue -17.4
($) CAGR (%)
RevenueResidential/bulk/smatv subscriber revenue 10.6
Pay and Specialty
Licensee Licensee Ultimate Owner Type Year
Rogers Media Inc. Rogers Communications Inc. Specialty (category A service) 2015
Total Remuneration ($) -2.4
Average Staff CountAverage Remuneration ($) 6.1
Investment in ProgrammingTotal Canadian Programming 3.3
Canadian Programming/Revenue (%)
Acquisition of rightsScript & conceptFiller Programming + Program Production -1.9
Adjustments - Gain (Loss)
Pre-tax Profit
Canadian Programming Expenses
Depreciation -3.8
P.B.I.T.
Interest Expense
Administration and General -15.1
Total Expenses 3.3
Operating Income
P.B.I.T. MarginPre-tax MarginCAGR = Compound Annual Growth Rate
Subscribers -3.8
Profitability (%)Operating Margin
Page 201

Undertaking # Service Name
305417265 Sportsnet (formerly Rogers Sportsnet)
2011 2012 Var % 2013 Var % 2014 Var % 2015 Var %
y1 y2 y3 y4 y5
106,188,965 114,972,958 8.27 132,904,153 15.60 157,646,209 18.62 177,214,476 12.41
32,673,052 36,898,017 12.93 43,622,659 18.22 65,603,921 50.39 69,241,813 5.55
0 0 0 0 0
67,460,875 68,675,857 1.80 68,856,950 0.26 72,037,741 4.62 95,974,821 33.23
11,486,717 13,419,383 16.83 8,033,218 -40.14 16,651,031 107.28 17,937,135 7.72
217,809,609 233,966,215 7.42 253,416,980 8.31 311,938,902 23.09 360,368,245 15.53
150,577,090 176,751,251 17.38 165,137,931 -6.57 228,105,454 38.13 256,497,491 12.45
4,803,252 4,911,376 2.25 5,108,118 4.01 5,370,126 5.13 8,653,543 61.14
10,774,825 8,614,885 -20.05 7,605,862 -11.71 9,910,712 30.30 15,912,184 60.56
11,741,941 10,993,938 -6.37 16,724,169 52.12 19,992,168 19.54 18,691,933 -6.50
177,897,108 201,271,450 13.14 194,576,080 -3.33 263,378,460 35.36 299,755,151 13.81
39,912,501 32,694,765 58,840,900 48,560,442 60,613,094
8,626,443 8,859,238 2.70 8,805,946 -0.60 4,363,516 -50.45 6,855,742 57.12
31,286,058 23,835,527 50,034,954 44,196,926 53,757,352
1,480,712 1,859,326 25.57 620,782 -66.61 501,274 -19.25 0 -100.00
1,539,300 -425,966 -127.67 7,357,459 >999± 0 -100.00 0
31,344,646 21,550,235 56,771,631 43,695,652 53,757,352
98,110,483 108,295,220 10.38 83,880,295 -22.54 135,909,541 62.03 156,111,172 14.86
0 0 0 0 0
41,971,710 56,572,613 34.79 59,678,223 5.49 64,866,571 8.69 77,256,788 19.10
0 0 0 0 0
140,082,193 164,867,833 17.69 143,558,518 -12.93 200,776,112 39.86 233,367,960 16.23
64.31 70.47 56.65 64.36 64.76
25,017,560 32,730,012 30.83 26,632,144 -18.63 30,438,748 14.29 41,005,785 34.72
286 353 23.43 405 14.73 446.17 10.17 466.23 4.50
87,474 92,720 6.00 65,758 -29.08 68,222 3.75 87,952 28.92
8,957,170 8,784,719 -1.93 8,497,000 -3.28 8,290,000 -2.44 7,972,000 -3.84
18.3 14.0 23.2 15.6 16.8
14.4 10.2 19.7 14.2 14.9
14.4 9.2 22.4 14.0 14.9
Pay and Specialty
Licensee Licensee Ultimate Owner Type Year
Rogers Media Inc. Rogers Communications Inc. Specialty (category C service) 2015
CRTC - FINANCIAL SUMMARY - PAY & SPECIALTY
Depreciation -5.6
P.B.I.T.
Interest Expense
Administration and General 12.3
Total Expenses 13.9
Operating Income
Programming and Production 14.2
Technical 15.9
Sales and Promotion 10.2
Other revenue 11.8
Total Revenue 13.4
Expenses
DTH revenue 20.7
Local advertising revenueNational advertising revenue 9.2
($) CAGR (%)
RevenueResidential/bulk/smatv subscriber revenue 13.7
P.B.I.T. MarginPre-tax MarginCAGR = Compound Annual Growth Rate
Subscribers -2.9
Profitability (%)Operating Margin
Total Remuneration ($) 13.2
Average Staff CountAverage Remuneration ($) 0.1
Investment in ProgrammingTotal Canadian Programming 13.6
Canadian Programming/Revenue (%)
Acquisition of rights 12.3
Script & conceptFiller Programming + Program Production 16.5
Adjustments - Gain (Loss)
Pre-tax Profit
Canadian Programming Expenses
Page 202
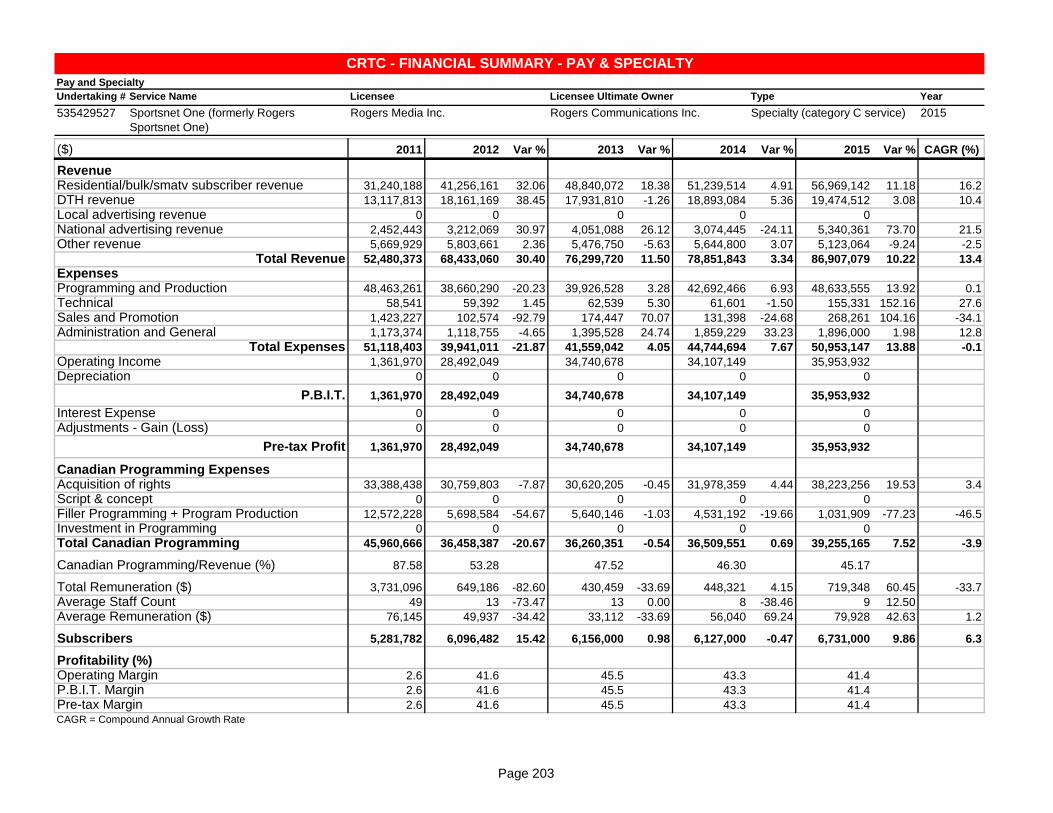
Undertaking # Service Name
535429527 Sportsnet One (formerly Rogers
Sportsnet One)
2011 2012 Var % 2013 Var % 2014 Var % 2015 Var %
y1 y2 y3 y4 y5
31,240,188 41,256,161 32.06 48,840,072 18.38 51,239,514 4.91 56,969,142 11.18
13,117,813 18,161,169 38.45 17,931,810 -1.26 18,893,084 5.36 19,474,512 3.08
0 0 0 0 0
2,452,443 3,212,069 30.97 4,051,088 26.12 3,074,445 -24.11 5,340,361 73.70
5,669,929 5,803,661 2.36 5,476,750 -5.63 5,644,800 3.07 5,123,064 -9.24
52,480,373 68,433,060 30.40 76,299,720 11.50 78,851,843 3.34 86,907,079 10.22
48,463,261 38,660,290 -20.23 39,926,528 3.28 42,692,466 6.93 48,633,555 13.92
58,541 59,392 1.45 62,539 5.30 61,601 -1.50 155,331 152.16
1,423,227 102,574 -92.79 174,447 70.07 131,398 -24.68 268,261 104.16
1,173,374 1,118,755 -4.65 1,395,528 24.74 1,859,229 33.23 1,896,000 1.98
51,118,403 39,941,011 -21.87 41,559,042 4.05 44,744,694 7.67 50,953,147 13.88
1,361,970 28,492,049 34,740,678 34,107,149 35,953,932
0 0 0 0 0
1,361,970 28,492,049 34,740,678 34,107,149 35,953,932
0 0 0 0 0
0 0 0 0 0
1,361,970 28,492,049 34,740,678 34,107,149 35,953,932
33,388,438 30,759,803 -7.87 30,620,205 -0.45 31,978,359 4.44 38,223,256 19.53
0 0 0 0 0
12,572,228 5,698,584 -54.67 5,640,146 -1.03 4,531,192 -19.66 1,031,909 -77.23
0 0 0 0 0
45,960,666 36,458,387 -20.67 36,260,351 -0.54 36,509,551 0.69 39,255,165 7.52
87.58 53.28 47.52 46.30 45.17
3,731,096 649,186 -82.60 430,459 -33.69 448,321 4.15 719,348 60.45
49 13 -73.47 13 0.00 8 -38.46 9 12.50
76,145 49,937 -34.42 33,112 -33.69 56,040 69.24 79,928 42.63
5,281,782 6,096,482 15.42 6,156,000 0.98 6,127,000 -0.47 6,731,000 9.86
2.6 41.6 45.5 43.3 41.4
2.6 41.6 45.5 43.3 41.4
2.6 41.6 45.5 43.3 41.4
CRTC - FINANCIAL SUMMARY - PAY & SPECIALTY
Programming and Production 0.1
Technical 27.6
Sales and Promotion -34.1
Other revenue -2.5
Total Revenue 13.4
Expenses
DTH revenue 10.4
Local advertising revenueNational advertising revenue 21.5
($) CAGR (%)
RevenueResidential/bulk/smatv subscriber revenue 16.2
Pay and Specialty
Licensee Licensee Ultimate Owner Type Year
Rogers Media Inc. Rogers Communications Inc. Specialty (category C service) 2015
Total Remuneration ($) -33.7
Average Staff CountAverage Remuneration ($) 1.2
Investment in ProgrammingTotal Canadian Programming -3.9
Canadian Programming/Revenue (%)
Acquisition of rights 3.4
Script & conceptFiller Programming + Program Production -46.5
Adjustments - Gain (Loss)
Pre-tax Profit
Canadian Programming Expenses
Depreciation
P.B.I.T.
Interest Expense
Administration and General 12.8
Total Expenses -0.1
Operating Income
P.B.I.T. MarginPre-tax MarginCAGR = Compound Annual Growth Rate
Subscribers 6.3
Profitability (%)Operating Margin
Page 203

Undertaking # Service Name
305417207 Sportsnet PPV
2011 2012 Var % 2013 Var % 2014 Var % 2015 Var %
y1 y2 y3 y4 y5
11,092,829 12,009,329 8.26 11,618,261 -3.26 12,621,675 8.64 19,896,033 57.63
0 0 0 0 0
0 0 0 0 0
0 0 0 0 0
0 0 0 0 0
11,092,829 12,009,329 8.26 11,618,261 -3.26 12,621,675 8.64 19,896,033 57.63
9,829,468 10,299,934 4.79 7,981,573 -22.51 9,826,891 23.12 37,051,933 277.05
0 0 0 0 390,000
210,984 522,640 147.72 244,781 -53.16 239,862 -2.01 43,345 -81.93
0 0 0 0 0
10,040,452 10,822,574 7.79 8,226,354 -23.99 10,066,753 22.37 37,485,278 272.37
1,052,377 1,186,755 3,391,907 2,554,922 -17,589,245
0 0 0 0 0
1,052,377 1,186,755 3,391,907 2,554,922 -17,589,245
0 0 0 0 0
0 0 0 0 0
1,052,377 1,186,755 3,391,907 2,554,922 -17,589,245
0 0 0 0 13,273,055
0 0 0 0 0
0 0 0 0 314,420
0 0 0 0 0
0 0 0 0 13,587,475
0.00 0.00 0.00 0.00 68.29
0 0 0 0 390,000
0 0 0 0 4
97,500
34,687 33,988 -2.02 27,161 -20.09 27,966 2.96 1,708,454 >999±
9.5 9.9 29.2 20.2 -88.4
9.5 9.9 29.2 20.2 -88.4
9.5 9.9 29.2 20.2 -88.4
DTH revenueLocal advertising revenueNational advertising revenue
($) CAGR (%)
RevenueResidential/bulk/smatv subscriber revenue 15.7
Pay and Specialty
Licensee Licensee Ultimate Owner Type Year
Rogers Communications Partnership Rogers Communications Inc. Pay-per-view programming 2015
CRTC - FINANCIAL SUMMARY - PAY & SPECIALTY
Acquisition of rightsScript & conceptFiller Programming + Program Production
Adjustments - Gain (Loss)
Pre-tax Profit
Canadian Programming Expenses
Depreciation
P.B.I.T.
Interest Expense
Administration and GeneralTotal Expenses 39.0
Operating Income
Programming and Production 39.3
TechnicalSales and Promotion -32.7
Other revenueTotal Revenue 15.7
Expenses
P.B.I.T. MarginPre-tax MarginCAGR = Compound Annual Growth Rate
Subscribers 164.9
Profitability (%)Operating Margin
Total Remuneration ($)Average Staff CountAverage Remuneration ($)
Investment in ProgrammingTotal Canadian Programming
Canadian Programming/Revenue (%)
Page 204

Undertaking # Service Name
535426052 Sportsnet World (formerly Setanta Sports
(Canada))
2011 2012 Var % 2013 Var % 2014 Var % 2015 Var %
y1 y2 y3 y4 y5
9,248,082 9,820,475 6.19 11,716,180 19.30 11,520,798 -1.67 11,167,418 -3.07
0 0 0 0 0
0 0 0 0 0
205,130 70,750 -65.51 267,974 278.76 5,358 -98.00 0 -100.00
0 0 0 0 0
9,453,212 9,891,225 4.63 11,984,154 21.16 11,526,156 -3.82 11,167,418 -3.11
5,937,537 6,688,831 12.65 8,066,523 20.60 7,606,153 -5.71 10,099,000 32.77
764,654 0 -100.00 258,920 398,380 53.86 404,943 1.65
274,617 108,350 -60.55 58,048 -46.43 19,189 -66.94 0 -100.00
728,163 677,305 -6.98 305,314 -54.92 330,077 8.11 328,213 -0.56
7,704,971 7,474,486 -2.99 8,688,805 16.25 8,353,799 -3.86 10,832,156 29.67
1,748,241 2,416,739 3,295,349 3,172,357 335,262
0 0 0 0 0
1,748,241 2,416,739 3,295,349 3,172,357 335,262
0 0 0 0 0
161,564 -108 -100.07 0 -100.00 0 0
1,909,805 2,416,631 3,295,349 3,172,357 335,262
0 0 128,807 12,083 -90.62 696,442 >999±
0 0 0 0 0
281,666 359,761 27.73 1,775,815 393.61 1,403,842 -20.95 1,443,776 2.84
0 0 0 0 0
281,666 359,761 27.73 1,904,622 429.41 1,415,925 -25.66 2,140,218 51.15
2.98 3.64 15.89 12.28 19.16
359,302 236,386 -34.21 253,210 7.12 197,305 -22.08 261,052 32.31
3 5 66.67 5 0.00 3 -40.00 3 0.00
119,767 47,277 -60.53 50,642 7.12 65,768 29.87 87,017 32.31
82,523 91,417 10.78 100,000 9.39 93,000 -7.00 82,000 -11.83
18.5 24.4 27.5 27.5 3.0
18.5 24.4 27.5 27.5 3.0
20.2 24.4 27.5 27.5 3.0
Pay and Specialty
Licensee Licensee Ultimate Owner Type Year
Rogers Media Inc. Rogers Communications Inc. Specialty (category B service) 2015
CRTC - FINANCIAL SUMMARY - PAY & SPECIALTY
Depreciation
P.B.I.T.
Interest Expense
Administration and General -18.1
Total Expenses 8.9
Operating Income
Programming and Production 14.2
Technical -14.7
Sales and Promotion -100.0
Other revenueTotal Revenue 4.3
Expenses
DTH revenueLocal advertising revenueNational advertising revenue -100.0
($) CAGR (%)
RevenueResidential/bulk/smatv subscriber revenue 4.8
P.B.I.T. MarginPre-tax MarginCAGR = Compound Annual Growth Rate
Subscribers -0.2
Profitability (%)Operating Margin
Total Remuneration ($) -7.7
Average Staff CountAverage Remuneration ($) -7.7
Investment in ProgrammingTotal Canadian Programming 66.0
Canadian Programming/Revenue (%)
Acquisition of rightsScript & conceptFiller Programming + Program Production 50.5
Adjustments - Gain (Loss)
Pre-tax Profit
Canadian Programming Expenses
Page 205

Undertaking # Service Name
305425325 SSTV
2011 2012 Var % 2013 Var % 2014 Var % 2015 Var %
y1 y2 y3 y4 y5
738,226 591,858 -19.83 650,675 9.94 672,225 3.31 633,020 -5.83
479,459 302,662 -36.87 410,480 35.62 327,334 -20.26 357,026 9.07
0 0 33,890 33,890 0.00 0 -100.00
173,135 0 -100.00 82,980 88,370 6.50 0 -100.00
285,670 242,718 -15.04 144,360 -40.52 162,835 12.80 216,951 33.23
0 0 0 0 0
458,805 242,718 -47.10 261,230 7.63 285,095 9.14 216,951 -23.90
62.15 41.01 40.15 42.41 34.27
CRTC - FINANCIAL SUMMARY - PAY & SPECIALTY
Programming and Production -7.1
TechnicalSales and Promotion
Other revenueTotal Revenue -3.8
Expenses
DTH revenueLocal advertising revenueNational advertising revenue
($) CAGR (%)
RevenueResidential/bulk/smatv subscriber revenue
Pay and Specialty
Licensee Licensee Ultimate Owner Type Year
S. S. TV Inc. Pannu, Ravinder Singh Specialty (category B service) 2015
Total Remuneration ($)Average Staff CountAverage Remuneration ($)
Investment in ProgrammingTotal Canadian Programming -17.1
Canadian Programming/Revenue (%)
Acquisition of rightsScript & concept -100.0
Filler Programming + Program Production -6.7
Adjustments - Gain (Loss)
Pre-tax Profit
Canadian Programming Expenses
Depreciation
P.B.I.T.
Interest Expense
Administration and GeneralTotal Expenses
Operating Income
P.B.I.T. MarginPre-tax MarginCAGR = Compound Annual Growth Rate
Subscribers
Profitability (%)Operating Margin
Page 206

Undertaking # Service Name
305427644 Sundance Channel (formerly Drive-In
Classics Channel)
2011 2012 Var % 2013 Var % 2014 Var % 2015 Var %
y1 y2 y3 y4 y5
5,436,612 5,071,095 -6.72 5,628,290 10.99 4,937,292 -12.28 4,708,649 -4.63
1,729,084 2,391,847 38.33 2,574,493 7.64 2,192,090 -14.85 2,337,768 6.65
146,837 128,031 -12.81 82,809 -35.32 63,860 -22.88 103,167 61.55
8,593 39,461 359.22 42,552 7.83 25,174 -40.84 47,727 89.59
142,247 272,008 91.22 274,351 0.86 245,246 -10.61 250,030 1.95
0 0 0 0 0
297,677 439,500 47.64 399,712 -9.05 334,280 -16.37 400,924 19.94
5.48 8.67 7.10 6.77 8.51
DTH revenueLocal advertising revenueNational advertising revenue
($) CAGR (%)
RevenueResidential/bulk/smatv subscriber revenue
Pay and Specialty
Licensee Licensee Ultimate Owner Type Year
7202342 Canada Inc. Corus Entertainment Inc. Specialty (category B service) 2015
CRTC - FINANCIAL SUMMARY - PAY & SPECIALTY
Acquisition of rights -8.5
Script & concept 53.5
Filler Programming + Program Production 15.1
Adjustments - Gain (Loss)
Pre-tax Profit
Canadian Programming Expenses
Depreciation
P.B.I.T.
Interest Expense
Administration and GeneralTotal Expenses
Operating Income
Programming and Production 7.8
TechnicalSales and Promotion
Other revenueTotal Revenue -3.5
Expenses
P.B.I.T. MarginPre-tax MarginCAGR = Compound Annual Growth Rate
Subscribers
Profitability (%)Operating Margin
Total Remuneration ($)Average Staff CountAverage Remuneration ($)
Investment in ProgrammingTotal Canadian Programming 7.7
Canadian Programming/Revenue (%)
Page 207

Undertaking # Service Name
535431241 Sun News
2011 2012 Var % 2013 Var % 2014 Var % 2015 Var %
y1 y2 y3 y4 y5
0 2,911,606 4,261,911 46.38 5,573,065 30.76 4,439,021 -20.35
0 1,279,500 1,823,636 42.53 1,936,410 6.18 912,990 -52.85
0 0 41,044 0 -100.00 0
643,267 1,368,996 112.82 1,671,402 22.09 762,074 -54.41 334,198 -56.15
28,722 96,954 237.56 141,044 45.48 227,389 61.22 159,184 -29.99
671,989 5,657,056 741.84 7,939,037 40.34 8,498,938 7.05 5,845,393 -31.22
7,485,156 14,169,579 89.30 13,148,926 -7.20 13,030,853 -0.90 6,480,065 -50.27
1,590,981 2,531,170 59.09 2,588,973 2.28 3,910,195 51.03 1,686,090 -56.88
898,900 1,365,007 51.85 2,069,732 51.63 1,612,579 -22.09 531,154 -67.06
3,211,741 4,166,843 29.74 2,900,742 -30.39 2,638,878 -9.03 1,791,975 -32.09
13,186,778 22,232,599 68.60 20,708,373 -6.86 21,192,505 2.34 10,489,284 -50.50
-12,514,789 -16,575,543 -12,769,336 -12,693,567 -4,643,891
918,196 1,931,975 110.41 2,020,735 4.59 2,107,460 4.29 756,583 -64.10
-13,432,985 -18,507,518 -14,790,071 -14,801,027 -5,400,474
0 -10,198 -8 -99.92 4,552 >999± 756 -83.39
12,181 0 -100.00 0 -78,250 -12,598,998 >999±
-13,420,804 -18,497,320 -14,790,063 -14,883,829 -18,000,228
0 0 0 0 0
0 0 0 0 0
7,482,984 14,169,579 89.36 13,148,926 -7.20 13,030,852 -0.90 6,480,065 -50.27
0 0 0 0 0
7,482,984 14,169,579 89.36 13,148,926 -7.20 13,030,852 -0.90 6,480,065 -50.27
>999± 250.48 165.62 153.32 110.86
7,373,559 10,864,064 47.34 10,717,153 -1.35 10,132,081 -5.46 4,573,211 -54.86
147 150 2.04 128.76 -14.16 133 3.29 120 -9.77
50,160 72,427 44.39 83,234 14.92 76,181 -8.47 38,110 -49.97
0 4,856,022 4,973,066 2.41 5,013,037 0.80 0 -100.00
>999± -293.0 -160.8 -149.4 -79.4
>999± -327.2 -186.3 -174.2 -92.4
>999± -327.0 -186.3 -175.1 -307.9
Pay and Specialty
Licensee Licensee Ultimate Owner Type Year
Sun News General Partnership Les Placements Péladeau inc. Specialty (category C service) 2015
CRTC - FINANCIAL SUMMARY - PAY & SPECIALTY
Depreciation -4.7
P.B.I.T.
Interest Expense
Administration and General -13.6
Total Expenses -5.6
Operating Income
Programming and Production -3.5
Technical 1.5
Sales and Promotion -12.3
Other revenue 53.4
Total Revenue 71.7
Expenses
DTH revenueLocal advertising revenueNational advertising revenue -15.1
($) CAGR (%)
RevenueResidential/bulk/smatv subscriber revenue
P.B.I.T. MarginPre-tax MarginCAGR = Compound Annual Growth Rate
Subscribers
Profitability (%)Operating Margin
Total Remuneration ($) -11.3
Average Staff CountAverage Remuneration ($) -6.6
Investment in ProgrammingTotal Canadian Programming -3.5
Canadian Programming/Revenue (%)
Acquisition of rightsScript & conceptFiller Programming + Program Production -3.5
Adjustments - Gain (Loss)
Pre-tax Profit
Canadian Programming Expenses
Page 208
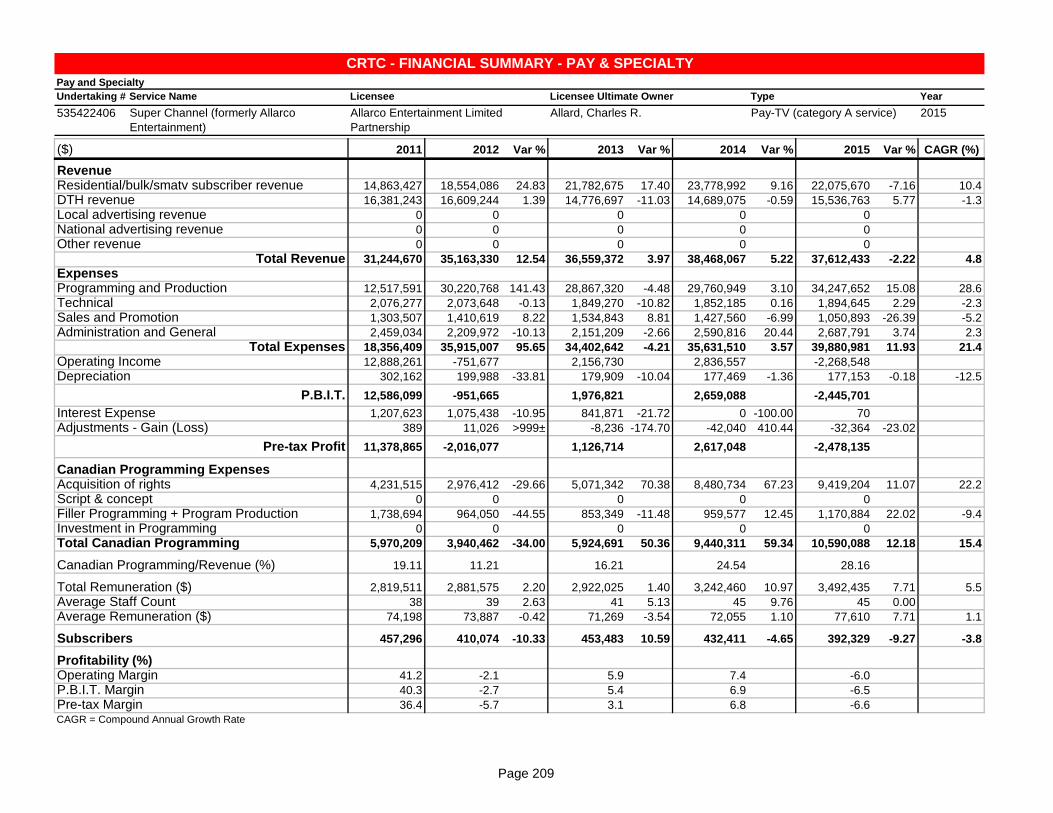
Undertaking # Service Name
535422406 Super Channel (formerly Allarco
Entertainment)
2011 2012 Var % 2013 Var % 2014 Var % 2015 Var %
y1 y2 y3 y4 y5
14,863,427 18,554,086 24.83 21,782,675 17.40 23,778,992 9.16 22,075,670 -7.16
16,381,243 16,609,244 1.39 14,776,697 -11.03 14,689,075 -0.59 15,536,763 5.77
0 0 0 0 0
0 0 0 0 0
0 0 0 0 0
31,244,670 35,163,330 12.54 36,559,372 3.97 38,468,067 5.22 37,612,433 -2.22
12,517,591 30,220,768 141.43 28,867,320 -4.48 29,760,949 3.10 34,247,652 15.08
2,076,277 2,073,648 -0.13 1,849,270 -10.82 1,852,185 0.16 1,894,645 2.29
1,303,507 1,410,619 8.22 1,534,843 8.81 1,427,560 -6.99 1,050,893 -26.39
2,459,034 2,209,972 -10.13 2,151,209 -2.66 2,590,816 20.44 2,687,791 3.74
18,356,409 35,915,007 95.65 34,402,642 -4.21 35,631,510 3.57 39,880,981 11.93
12,888,261 -751,677 2,156,730 2,836,557 -2,268,548
302,162 199,988 -33.81 179,909 -10.04 177,469 -1.36 177,153 -0.18
12,586,099 -951,665 1,976,821 2,659,088 -2,445,701
1,207,623 1,075,438 -10.95 841,871 -21.72 0 -100.00 70
389 11,026 >999± -8,236 -174.70 -42,040 410.44 -32,364 -23.02
11,378,865 -2,016,077 1,126,714 2,617,048 -2,478,135
4,231,515 2,976,412 -29.66 5,071,342 70.38 8,480,734 67.23 9,419,204 11.07
0 0 0 0 0
1,738,694 964,050 -44.55 853,349 -11.48 959,577 12.45 1,170,884 22.02
0 0 0 0 0
5,970,209 3,940,462 -34.00 5,924,691 50.36 9,440,311 59.34 10,590,088 12.18
19.11 11.21 16.21 24.54 28.16
2,819,511 2,881,575 2.20 2,922,025 1.40 3,242,460 10.97 3,492,435 7.71
38 39 2.63 41 5.13 45 9.76 45 0.00
74,198 73,887 -0.42 71,269 -3.54 72,055 1.10 77,610 7.71
457,296 410,074 -10.33 453,483 10.59 432,411 -4.65 392,329 -9.27
41.2 -2.1 5.9 7.4 -6.0
40.3 -2.7 5.4 6.9 -6.5
36.4 -5.7 3.1 6.8 -6.6
CRTC - FINANCIAL SUMMARY - PAY & SPECIALTY
Programming and Production 28.6
Technical -2.3
Sales and Promotion -5.2
Other revenueTotal Revenue 4.8
Expenses
DTH revenue -1.3
Local advertising revenueNational advertising revenue
($) CAGR (%)
RevenueResidential/bulk/smatv subscriber revenue 10.4
Pay and Specialty
Licensee Licensee Ultimate Owner Type Year
Allarco Entertainment Limited
Partnership
Allard, Charles R. Pay-TV (category A service) 2015
Total Remuneration ($) 5.5
Average Staff CountAverage Remuneration ($) 1.1
Investment in ProgrammingTotal Canadian Programming 15.4
Canadian Programming/Revenue (%)
Acquisition of rights 22.2
Script & conceptFiller Programming + Program Production -9.4
Adjustments - Gain (Loss)
Pre-tax Profit
Canadian Programming Expenses
Depreciation -12.5
P.B.I.T.
Interest Expense
Administration and General 2.3
Total Expenses 21.4
Operating Income
P.B.I.T. MarginPre-tax MarginCAGR = Compound Annual Growth Rate
Subscribers -3.8
Profitability (%)Operating Margin
Page 209

Undertaking # Service Name
214300535 Super Écran
2011 2012 Var % 2013 Var % 2014 Var % 2015 Var %
y1 y2 y3 y4 y5
36,564,245 40,116,532 9.72 40,984,706 2.16 39,934,974 -2.56 37,801,302 -5.34
27,387,565 25,380,275 -7.33 24,056,221 -5.22 23,263,327 -3.30 23,601,172 1.45
0 0 0 0 0
0 0 0 0 0
1,619,088 2,652,606 63.83 0 -100.00 0 0
65,570,898 68,149,413 3.93 65,040,927 -4.56 63,198,301 -2.83 61,402,474 -2.84
38,936,117 39,019,192 0.21 37,372,932 -4.22 37,632,813 0.70 40,040,888 6.40
1,112,075 1,106,133 -0.53 1,150,667 4.03 810,348 -29.58 844,229 4.18
2,700,547 2,539,468 -5.96 1,430,084 -43.69 1,350,559 -5.56 2,482,362 83.80
3,357,047 3,827,240 14.01 3,505,062 -8.42 945,522 -73.02 922,562 -2.43
46,105,786 46,492,033 0.84 43,458,745 -6.52 40,739,242 -6.26 44,290,041 8.72
19,465,112 21,657,380 21,582,182 22,459,059 17,112,433
122,183 67,103 -45.08 60,588 -9.71 740,604 >999± 1,780,366 140.39
19,342,929 21,590,277 21,521,594 21,718,455 15,332,067
747,669 694,219 -7.15 722,168 4.03 0 -100.00 46,893
0 0 0 0 -360,967
18,595,260 20,896,058 20,799,426 21,718,455 14,924,207
9,545,406 9,442,335 -1.08 8,735,177 -7.49 9,196,117 5.28 11,250,158 22.34
780,999 700,000 -10.37 700,000 0.00 700,000 0.00 425,014 -39.28
2,013,696 2,082,140 3.40 1,979,843 -4.91 1,649,361 -16.69 1,937,848 17.49
419,178 634,588 51.39 351,015 -44.69 434,764 23.86 -65,357 -115.03
12,759,279 12,859,063 0.78 11,766,035 -8.50 11,980,242 1.82 13,547,663 13.08
19.46 18.87 18.09 18.96 22.06
1,954,192 2,098,376 7.38 1,960,798 -6.56 928,093 -52.67 771,436 -16.88
20 19 -5.00 21 10.53 11 -47.62 7 -36.36
97,710 110,441 13.03 93,371 -15.46 84,372 -9.64 110,205 30.62
632,799 644,419 1.84 628,845 -2.42 624,464 -0.70 616,698 -1.24
29.7 31.8 33.2 35.5 27.9
29.5 31.7 33.1 34.4 25.0
28.4 30.7 32.0 34.4 24.3
DTH revenue -3.7
Local advertising revenueNational advertising revenue
($) CAGR (%)
RevenueResidential/bulk/smatv subscriber revenue 0.8
Pay and Specialty
Licensee Licensee Ultimate Owner Type Year
Bell Media Inc. BCE Inc. Pay-TV (category A service) 2015
CRTC - FINANCIAL SUMMARY - PAY & SPECIALTY
Acquisition of rights 4.2
Script & concept -14.1
Filler Programming + Program Production -1.0
Adjustments - Gain (Loss)
Pre-tax Profit
Canadian Programming Expenses
Depreciation 95.4
P.B.I.T.
Interest Expense
Administration and General -27.6
Total Expenses -1.0
Operating Income
Programming and Production 0.7
Technical -6.7
Sales and Promotion -2.1
Other revenue -100.0
Total Revenue -1.6
Expenses
P.B.I.T. MarginPre-tax MarginCAGR = Compound Annual Growth Rate
Subscribers -0.6
Profitability (%)Operating Margin
Total Remuneration ($) -20.7
Average Staff CountAverage Remuneration ($) 3.1
Investment in ProgrammingTotal Canadian Programming 1.5
Canadian Programming/Revenue (%)
Page 210

Undertaking # Service Name
515408441 Talentvision
2011 2012 Var % 2013 Var % 2014 Var % 2015 Var %
y1 y2 y3 y4 y5
2,856,415 3,491,562 22.24 3,482,387 -0.26 3,510,525 0.81 3,142,416 -10.49
584,866 598,687 2.36 547,057 -8.62 445,172 -18.62 359,166 -19.32
2,426,759 2,585,938 6.56 2,324,361 -10.12 2,163,068 -6.94 1,804,915 -16.56
1,318,497 1,388,228 5.29 1,069,599 -22.95 846,104 -20.90 909,193 7.46
57,833 111,505 92.81 171,425 53.74 177,990 3.83 167,359 -5.97
7,244,370 8,175,920 12.86 7,594,829 -7.11 7,142,859 -5.95 6,383,049 -10.64
3,758,014 3,626,788 -3.49 3,622,244 -0.13 4,259,690 17.60 3,736,741 -12.28
837,360 1,235,228 47.51 1,020,897 -17.35 398,002 -61.01 204,487 -48.62
639,967 688,104 7.52 680,595 -1.09 701,625 3.09 636,188 -9.33
553,835 885,021 59.80 763,793 -13.70 761,967 -0.24 697,265 -8.49
5,789,176 6,435,141 11.16 6,087,529 -5.40 6,121,284 0.55 5,274,681 -13.83
1,455,194 1,740,779 1,507,300 1,021,575 1,108,368
275,955 189,804 -31.22 254,238 33.95 306,883 20.71 306,877 0.00
1,179,239 1,550,975 1,253,062 714,692 801,491
0 0 0 0 0
0 0 0 0 0
1,179,239 1,550,975 1,253,062 714,692 801,491
292,248 324,479 11.03 279,676 -13.81 282,961 1.17 281,249 -0.61
0 0 0 0 0
1,883,058 1,613,058 -14.34 1,652,042 2.42 1,998,101 20.95 1,843,424 -7.74
0 0 0 0 0
2,175,306 1,937,537 -10.93 1,931,718 -0.30 2,281,062 18.08 2,124,673 -6.86
30.03 23.70 25.43 31.93 33.29
2,117,362 2,271,231 7.27 2,386,419 5.07 2,719,908 13.97 2,568,944 -5.55
67 69 2.99 72 4.35 77 6.94 74 -3.90
31,602 32,916 4.16 33,145 0.69 35,323 6.57 34,715 -1.72
517,613 447,827 -13.48 400,322 -10.61 360,630 -9.92 282,452 -21.68
20.1 21.3 19.8 14.3 17.4
16.3 19.0 16.5 10.0 12.6
16.3 19.0 16.5 10.0 12.6
Pay and Specialty
Licensee Licensee Ultimate Owner Type Year
Fairchild Television Ltd. Fairchild Property Group Ltd. Specialty (category A service) 2015
CRTC - FINANCIAL SUMMARY - PAY & SPECIALTY
Depreciation 2.7
P.B.I.T.
Interest Expense
Administration and General 5.9
Total Expenses -2.3
Operating Income
Programming and Production -0.1
Technical -29.7
Sales and Promotion -0.2
Other revenue 30.4
Total Revenue -3.1
Expenses
DTH revenue -11.5
Local advertising revenue -7.1
National advertising revenue -8.9
($) CAGR (%)
RevenueResidential/bulk/smatv subscriber revenue 2.4
P.B.I.T. MarginPre-tax MarginCAGR = Compound Annual Growth Rate
Subscribers -14.1
Profitability (%)Operating Margin
Total Remuneration ($) 5.0
Average Staff CountAverage Remuneration ($) 2.4
Investment in ProgrammingTotal Canadian Programming -0.6
Canadian Programming/Revenue (%)
Acquisition of rights -1.0
Script & conceptFiller Programming + Program Production -0.5
Adjustments - Gain (Loss)
Pre-tax Profit
Canadian Programming Expenses
Page 211

Undertaking # Service Name
535435722 Talentvision II
2011 2012 Var % 2013 Var % 2014 Var % 2015 Var %
y3 y4 y5
1,327 249,507 >999± 313,573 25.68
217,424 871,372 300.77 754,812 -13.38
0 800,264 0 -100.00
0 0 0
1,837 0 -100.00 0
0 0 0
1,837 800,264 >999± 0 -100.00
138.43 320.74 0.00
CRTC - FINANCIAL SUMMARY - PAY & SPECIALTY
Programming and ProductionTechnicalSales and Promotion
Other revenueTotal Revenue
Expenses
DTH revenueLocal advertising revenueNational advertising revenue
($) CAGR (%)
RevenueResidential/bulk/smatv subscriber revenue
Pay and Specialty
Licensee Licensee Ultimate Owner Type Year
Fairchild Television Ltd. Fairchild Property Group Ltd. Specialty (category B service) 2015
Total Remuneration ($)Average Staff CountAverage Remuneration ($)
Investment in ProgrammingTotal Canadian Programming
Canadian Programming/Revenue (%)
Acquisition of rightsScript & conceptFiller Programming + Program Production
Adjustments - Gain (Loss)
Pre-tax Profit
Canadian Programming Expenses
Depreciation
P.B.I.T.
Interest Expense
Administration and GeneralTotal Expenses
Operating Income
P.B.I.T. MarginPre-tax MarginCAGR = Compound Annual Growth Rate
Subscribers
Profitability (%)Operating Margin
Page 212

Undertaking # Service Name
305429997 Tamil One (formerly TAMIL TV & ITBC
Television Network)
2011 2012 Var % 2013 Var % 2014 Var % 2015 Var %
y3
682,545 -100.00
196,253 -100.00
0
0
166,753 -100.00
0
166,753 -100.00
24.43
DTH revenueLocal advertising revenueNational advertising revenue
($) CAGR (%)
RevenueResidential/bulk/smatv subscriber revenue
Pay and Specialty
Licensee Licensee Ultimate Owner Type Year
TamilOne Inc. Vaithilingam, Subanasiri Specialty (category B service) 2013
CRTC - FINANCIAL SUMMARY - PAY & SPECIALTY
Acquisition of rightsScript & conceptFiller Programming + Program Production
Adjustments - Gain (Loss)
Pre-tax Profit
Canadian Programming Expenses
Depreciation
P.B.I.T.
Interest Expense
Administration and GeneralTotal Expenses
Operating Income
Programming and ProductionTechnicalSales and Promotion
Other revenueTotal Revenue
Expenses
P.B.I.T. MarginPre-tax MarginCAGR = Compound Annual Growth Rate
Subscribers
Profitability (%)Operating Margin
Total Remuneration ($)Average Staff CountAverage Remuneration ($)
Investment in ProgrammingTotal Canadian Programming
Canadian Programming/Revenue (%)
Page 213

Undertaking # Service Name
305427917 Tamil Vision Channel
2011 2012 Var % 2013 Var % 2014 Var % 2015 Var %
y1 y2 y3 y4
1,589,040 1,288,140 -18.94 1,052,950 -18.26 849,699 -19.30 -100.00
868,057 768,709 -11.44 706,760 -8.06 569,000 -19.49 -100.00
0 0 0 0
0 250,000 0 -100.00 0
689,381 450,846 -34.60 641,760 42.35 514,000 -19.91 -100.00
0 0 0 0
689,381 700,846 1.66 641,760 -8.43 514,000 -19.91 -100.00
43.38 54.41 60.95 60.49
Pay and Specialty
Licensee Licensee Ultimate Owner Type Year
Tamil Vision Inc. Tamil Vision Inc. Specialty (category B service) 2014
CRTC - FINANCIAL SUMMARY - PAY & SPECIALTY
Depreciation
P.B.I.T.
Interest Expense
Administration and GeneralTotal Expenses
Operating Income
Programming and ProductionTechnicalSales and Promotion
Other revenueTotal Revenue
Expenses
DTH revenueLocal advertising revenueNational advertising revenue
($) CAGR (%)
RevenueResidential/bulk/smatv subscriber revenue
P.B.I.T. MarginPre-tax MarginCAGR = Compound Annual Growth Rate
Subscribers
Profitability (%)Operating Margin
Total Remuneration ($)Average Staff CountAverage Remuneration ($)
Investment in ProgrammingTotal Canadian Programming
Canadian Programming/Revenue (%)
Acquisition of rightsScript & conceptFiller Programming + Program Production
Adjustments - Gain (Loss)
Pre-tax Profit
Canadian Programming Expenses
Page 214

Undertaking # Service Name
535427266 TBayTel, Thunder Bay
2011 2012 Var % 2013 Var % 2014 Var % 2015 Var %
y1 y2 y3 y4 y5
6,436 66,019 925.78 156,430 136.95 189,401 21.08 220,898 16.63
0 0 0 0 0
0 0 0 0 0
0 0 0 0 0
0 0 0 0 0
6,436 66,019 925.78 156,430 136.95 189,401 21.08 220,898 16.63
0 0 0 173,553 200,150 15.33
0 0 0 102,201 91,000 -10.96
0 0 0 48,226 28,582 -40.73
0 0 0 48,109 61,834 28.53
0 0 0 372,089 381,566 2.55
6,436 66,019 156,430 -182,688 -160,668
0 0 0 0 0
6,436 66,019 156,430 -182,688 -160,668
0 0 0 0 0
0 0 0 0 0
6,436 66,019 156,430 -182,688 -160,668
0 0 0 173,553 200,150 15.33
0 0 0 0 0
0 0 0 0 0
0 0 0 0 0
0 0 0 173,553 200,150 15.33
0.00 0.00 0.00 91.63 90.61
0 0 0 0 0
0 0 0 0 0
100.0 100.0 100.0 -96.5 -72.7
100.0 100.0 100.0 -96.5 -72.7
100.0 100.0 100.0 -96.5 -72.7
CRTC - FINANCIAL SUMMARY - PAY & SPECIALTY
Programming and ProductionTechnicalSales and Promotion
Other revenueTotal Revenue 142.0
Expenses
DTH revenueLocal advertising revenueNational advertising revenue
($) CAGR (%)
RevenueResidential/bulk/smatv subscriber revenue 142.0
Pay and Specialty
Licensee Licensee Ultimate Owner Type Year
TBayTel TBayTel Video-on-Demand 2015
Total Remuneration ($)Average Staff CountAverage Remuneration ($)
Investment in ProgrammingTotal Canadian Programming
Canadian Programming/Revenue (%)
Acquisition of rightsScript & conceptFiller Programming + Program Production
Adjustments - Gain (Loss)
Pre-tax Profit
Canadian Programming Expenses
Depreciation
P.B.I.T.
Interest Expense
Administration and GeneralTotal Expenses
Operating Income
P.B.I.T. MarginPre-tax MarginCAGR = Compound Annual Growth Rate
Subscribers
Profitability (%)Operating Margin
Page 215

Undertaking # Service Name
535433825 Telebimbi (formerly All Italian Children's
Television)
2011 2012 Var % 2013 Var % 2014 Var % 2015 Var %
y5
877
1,000
1,000
0
0
0
1,000
114.03
DTH revenueLocal advertising revenueNational advertising revenue
($) CAGR (%)
RevenueResidential/bulk/smatv subscriber revenue
Pay and Specialty
Licensee Licensee Ultimate Owner Type Year
Telelatino Network Inc. Corus Entertainment Inc. Specialty (category B service) 2015
CRTC - FINANCIAL SUMMARY - PAY & SPECIALTY
Acquisition of rightsScript & conceptFiller Programming + Program Production
Adjustments - Gain (Loss)
Pre-tax Profit
Canadian Programming Expenses
Depreciation
P.B.I.T.
Interest Expense
Administration and GeneralTotal Expenses
Operating Income
Programming and ProductionTechnicalSales and Promotion
Other revenueTotal Revenue
Expenses
P.B.I.T. MarginPre-tax MarginCAGR = Compound Annual Growth Rate
Subscribers
Profitability (%)Operating Margin
Total Remuneration ($)Average Staff CountAverage Remuneration ($)
Investment in ProgrammingTotal Canadian Programming
Canadian Programming/Revenue (%)
Page 216

Undertaking # Service Name
314600552 Telelatino
2011 2012 Var % 2013 Var % 2014 Var % 2015 Var %
y1 y2 y3 y4 y5
7,875,119 7,333,854 -6.87 5,642,077 -23.07 6,032,701 6.92 6,087,058 0.90
2,325,539 2,372,295 2.01 2,456,230 3.54 2,793,374 13.73 2,660,138 -4.77
3,270,427 2,711,358 -17.09 2,734,488 0.85 2,548,189 -6.81 2,354,037 -7.62
6,845,046 6,524,460 -4.68 4,783,289 -26.69 4,922,732 2.92 3,697,965 -24.88
0 0 0 0 0
20,316,131 18,941,967 -6.76 15,616,084 -17.56 16,296,996 4.36 14,799,198 -9.19
7,732,324 6,833,571 -11.62 5,168,501 -24.37 5,694,300 10.17 5,621,497 -1.28
218,986 323,001 47.50 277,303 -14.15 166,490 -39.96 170,230 2.25
1,726,564 1,716,469 -0.58 1,593,134 -7.19 1,497,133 -6.03 1,406,611 -6.05
1,271,820 1,416,786 11.40 1,214,054 -14.31 1,137,514 -6.30 1,383,352 21.61
10,949,694 10,289,827 -6.03 8,252,992 -19.79 8,495,437 2.94 8,581,690 1.02
9,366,437 8,652,140 7,363,092 7,801,559 6,217,508
365,425 322,508 -11.74 361,262 12.02 472,331 30.74 247,871 -47.52
9,001,012 8,329,632 7,001,830 7,329,228 5,969,637
3,450 15,844 359.25 29,435 85.78 4,299 -85.39 8,054 87.35
3,076,259 4,432,660 44.09 3,407,210 -23.13 3,790,660 11.25 1,797,809 -52.57
12,073,821 12,746,448 10,379,605 11,115,589 7,759,392
44,711 58,295 30.38 83,597 43.40 133,076 59.19 259,740 95.18
250,000 250,000 0.00 250,000 0.00 250,000 0.00 250,000 0.00
4,878,737 3,732,847 -23.49 3,645,231 -2.35 2,766,486 -24.11 3,051,044 10.29
0 0 0 718,772 0 -100.00
5,173,448 4,041,142 -21.89 3,978,828 -1.54 3,868,334 -2.78 3,560,784 -7.95
25.46 21.33 25.48 23.74 24.06
4,135,678 3,854,438 -6.80 3,687,520 -4.33 3,117,780 -15.45 3,644,065 16.88
66 60 -9.09 55 -8.33 55 0.00 55 0.00
62,662 64,241 2.52 67,046 4.37 56,687 -15.45 66,256 16.88
5,202,520 4,924,380 -5.35 4,329,579 -12.08 4,327,035 -0.06 4,157,979 -3.91
46.1 45.7 47.2 47.9 42.0
44.3 44.0 44.8 45.0 40.3
59.4 67.3 66.5 68.2 52.4
Pay and Specialty
Licensee Licensee Ultimate Owner Type Year
Telelatino Network Inc. Corus Entertainment Inc. Specialty (category A service) 2015
CRTC - FINANCIAL SUMMARY - PAY & SPECIALTY
Depreciation -9.3
P.B.I.T.
Interest Expense
Administration and General 2.1
Total Expenses -5.9
Operating Income
Programming and Production -7.7
Technical -6.1
Sales and Promotion -5.0
Other revenueTotal Revenue -7.6
Expenses
DTH revenue 3.4
Local advertising revenue -7.9
National advertising revenue -14.3
($) CAGR (%)
RevenueResidential/bulk/smatv subscriber revenue -6.2
P.B.I.T. MarginPre-tax MarginCAGR = Compound Annual Growth Rate
Subscribers -5.5
Profitability (%)Operating Margin
Total Remuneration ($) -3.1
Average Staff CountAverage Remuneration ($) 1.4
Investment in ProgrammingTotal Canadian Programming -8.9
Canadian Programming/Revenue (%)
Acquisition of rights 55.3
Script & concept 0.0
Filler Programming + Program Production -11.1
Adjustments - Gain (Loss)
Pre-tax Profit
Canadian Programming Expenses
Page 217

Undertaking # Service Name
535421862 Télémagino (formerly Disney Junior)
2011 2012 Var % 2013 Var % 2014 Var % 2015 Var %
y1 y2 y3 y4 y5
646,476 2,107,383 225.98 2,945,889 39.79 3,378,299 14.68 3,740,017 10.71
809,062 1,157,226 43.03 1,370,659 18.44 1,433,975 4.62 1,458,482 1.71
133,242 279,005 109.40 222,346 -20.31 170,183 -23.46 119,960 -29.51
0 0 0 0 0
440,870 293,317 -33.47 284,852 -2.89 329,622 15.72 243,328 -26.18
0 0 0 0 0
574,112 572,322 -0.31 507,198 -11.38 499,805 -1.46 363,288 -27.31
88.81 27.16 17.22 14.79 9.71
CRTC - FINANCIAL SUMMARY - PAY & SPECIALTY
Programming and Production 15.9
TechnicalSales and Promotion
Other revenueTotal Revenue 55.1
Expenses
DTH revenueLocal advertising revenueNational advertising revenue
($) CAGR (%)
RevenueResidential/bulk/smatv subscriber revenue
Pay and Specialty
Licensee Licensee Ultimate Owner Type Year
DHX Television Ltd. DHX Media Ltd. Specialty (category B service) 2015
Total Remuneration ($)Average Staff CountAverage Remuneration ($)
Investment in ProgrammingTotal Canadian Programming -10.8
Canadian Programming/Revenue (%)
Acquisition of rights -2.6
Script & conceptFiller Programming + Program Production -13.8
Adjustments - Gain (Loss)
Pre-tax Profit
Canadian Programming Expenses
Depreciation
P.B.I.T.
Interest Expense
Administration and GeneralTotal Expenses
Operating Income
P.B.I.T. MarginPre-tax MarginCAGR = Compound Annual Growth Rate
Subscribers
Profitability (%)Operating Margin
Page 218

Undertaking # Service Name
535433817 "Teleniños" (formerly All Spanish
Children's Television)
2011 2012 Var % 2013 Var % 2014 Var % 2015 Var %
y2 y3 y4 y5
24,785 34,230 38.11 32,697 -4.48 31,798 -2.75
12,663 17,045 34.60 21,045 23.47 23,395 11.17
8,663 13,045 50.58 17,045 30.66 19,395 13.79
0 0 0 0
0 4,000 0 -100.00 0
0 0 0 0
8,663 17,045 96.76 17,045 0.00 19,395 13.79
34.95 49.80 52.13 60.99
DTH revenueLocal advertising revenueNational advertising revenue
($) CAGR (%)
RevenueResidential/bulk/smatv subscriber revenue
Pay and Specialty
Licensee Licensee Ultimate Owner Type Year
Telelatino Network Inc. Corus Entertainment Inc. Specialty (category B service) 2015
CRTC - FINANCIAL SUMMARY - PAY & SPECIALTY
Acquisition of rightsScript & conceptFiller Programming + Program Production
Adjustments - Gain (Loss)
Pre-tax Profit
Canadian Programming Expenses
Depreciation
P.B.I.T.
Interest Expense
Administration and GeneralTotal Expenses
Operating Income
Programming and ProductionTechnicalSales and Promotion
Other revenueTotal Revenue
Expenses
P.B.I.T. MarginPre-tax MarginCAGR = Compound Annual Growth Rate
Subscribers
Profitability (%)Operating Margin
Total Remuneration ($)Average Staff CountAverage Remuneration ($)
Investment in ProgrammingTotal Canadian Programming
Canadian Programming/Revenue (%)
Page 219

Undertaking # Service Name
305417231 TELETOON/TÉLÉTOON
2011 2012 Var % 2013 Var % 2014 Var % 2015 Var %
y1 y2 y3 y4 y5
31,163,605 28,612,303 -8.19 28,133,309 -1.67 29,595,699 5.20 26,067,622 -11.92
10,318,881 10,909,687 5.73 10,695,400 -1.96 7,669,623 -28.29 9,425,277 22.89
0 0 0 0 0
47,818,400 44,433,609 -7.08 45,540,983 2.49 42,007,091 -7.76 33,960,298 -19.16
0 0 0 59,836 0 -100.00
89,300,886 83,955,599 -5.99 84,369,692 0.49 79,332,249 -5.97 69,453,197 -12.45
37,174,985 39,123,540 5.24 36,139,370 -7.63 47,247,136 30.74 43,106,268 -8.76
1,200,110 1,436,072 19.66 1,715,094 19.43 1,721,411 0.37 869,873 -49.47
3,905,314 3,657,872 -6.34 3,489,929 -4.59 3,763,869 7.85 1,533,776 -59.25
5,142,101 4,682,576 -8.94 4,575,088 -2.30 6,935,144 51.58 2,993,951 -56.83
47,422,510 48,900,060 3.12 45,919,481 -6.10 59,667,560 29.94 48,503,868 -18.71
41,878,376 35,055,539 38,450,211 19,664,689 20,949,329
165,785 180,658 8.97 159,732 -11.58 35,931 -77.51 0 -100.00
41,712,591 34,874,881 38,290,479 19,628,758 20,949,329
284,929 49,211 -82.73 1,654,008 >999± 1,363,915 -17.54 668,599 -50.98
217,392 46,709 -78.51 362,511 676.11 -1,082,177 -398.52 -70,433 -93.49
41,645,054 34,872,379 36,998,982 17,182,666 20,210,297
20,580,899 22,631,034 9.96 21,183,330 -6.40 30,752,673 45.17 13,173,811 -57.16
541,589 277,640 -48.74 309,116 11.34 966,396 212.63 1,620,429 67.68
2,032,886 1,761,929 -13.33 1,937,487 9.96 2,326,870 20.10 2,192,391 -5.78
111,843 99,692 -10.86 86,960 -12.77 424,517 388.18 7,002,329 >999±
23,267,217 24,770,295 6.46 23,516,893 -5.06 34,470,456 46.58 23,988,960 -30.41
26.05 29.50 27.87 43.45 34.54
7,170,241 6,408,114 -10.63 7,376,052 15.10 1,516,145 -79.45 1,903,187 25.53
81 88 8.64 88 0.00 18 -79.55 91 405.56
88,521 72,819 -17.74 83,819 15.10 84,230 0.49 20,914 -75.17
7,726,261 7,461,740 -3.42 7,271,415 -2.55 8,689,483 19.50 8,340,529 -4.02
46.9 41.8 45.6 24.8 30.2
46.7 41.5 45.4 24.7 30.2
46.6 41.5 43.9 21.7 29.1
Pay and Specialty
Licensee Licensee Ultimate Owner Type Year
TELETOON Canada Inc. Corus Entertainment Inc. Specialty (category A service) 2015
CRTC - FINANCIAL SUMMARY - PAY & SPECIALTY
Depreciation -100.0
P.B.I.T.
Interest Expense
Administration and General -12.7
Total Expenses 0.6
Operating Income
Programming and Production 3.8
Technical -7.7
Sales and Promotion -20.8
Other revenueTotal Revenue -6.1
Expenses
DTH revenue -2.2
Local advertising revenueNational advertising revenue -8.2
($) CAGR (%)
RevenueResidential/bulk/smatv subscriber revenue -4.4
P.B.I.T. MarginPre-tax MarginCAGR = Compound Annual Growth Rate
Subscribers 1.9
Profitability (%)Operating Margin
Total Remuneration ($) -28.2
Average Staff CountAverage Remuneration ($) -30.3
Investment in Programming 181.3
Total Canadian Programming 0.8
Canadian Programming/Revenue (%)
Acquisition of rights -10.6
Script & concept 31.5
Filler Programming + Program Production 1.9
Adjustments - Gain (Loss)
Pre-tax Profit
Canadian Programming Expenses
Page 220

Undertaking # Service Name
535417738 TELUS Communications Company,
Edmonton
2011 2012 Var % 2013 Var % 2014 Var % 2015 Var %
y1 y2 y3 y4 y5
13,988,975 18,935,085 35.36 26,702,468 41.02 30,473,268 14.12 17,975,250 -41.01
0 0 0 0 0
0 0 0 0 0
0 0 0 0 0
0 0 0 0 0
13,988,975 18,935,085 35.36 26,702,468 41.02 30,473,268 14.12 17,975,250 -41.01
12,344,154 21,825,476 76.81 31,106,378 42.52 37,052,591 19.12 39,208,058 5.82
13,680,746 10,201,272 -25.43 10,789,220 5.76 12,572,674 16.53 14,021,762 11.53
2,773,246 2,040,131 -26.44 2,541,507 24.58 2,825,038 11.16 2,439,107 -13.66
3,626,020 3,107,629 -14.30 6,981,691 124.66 7,796,845 11.68 8,428,319 8.10
32,424,166 37,174,508 14.65 51,418,796 38.32 60,247,148 17.17 64,097,246 6.39
-18,435,191 -18,239,423 -24,716,328 -29,773,880 -46,121,996
0 0 -26,336,012 1,275,897 -104.84 0 -100.00
-18,435,191 -18,239,423 1,619,684 -31,049,777 -46,121,996
0 0 0 0 0
0 0 0 0 0
-18,435,191 -18,239,423 1,619,684 -31,049,777 -46,121,996
0 0 0 0 0
0 0 0 0 0
0 0 0 0 0
0 0 0 0 0
0 0 0 0 0
0.00 0.00 0.00 0.00 0.00
15,326,007 11,664,450 -23.89 15,680,466 34.43 16,275,915 3.80 17,052,180 4.77
85 69 -18.82 126 82.61 130 3.17 140 7.69
180,306 169,050 -6.24 124,448 -26.38 125,199 0.60 121,801 -2.71
-131.8 -96.3 -92.6 -97.7 -256.6
-131.8 -96.3 6.1 -101.9 -256.6
-131.8 -96.3 6.1 -101.9 -256.6
CRTC - FINANCIAL SUMMARY - PAY & SPECIALTY
Programming and Production 33.5
Technical 0.6
Sales and Promotion -3.2
Other revenueTotal Revenue 6.5
Expenses
DTH revenueLocal advertising revenueNational advertising revenue
($) CAGR (%)
RevenueResidential/bulk/smatv subscriber revenue 6.5
Pay and Specialty
Licensee Licensee Ultimate Owner Type Year
TELUS Communications Company TELUS Corporation Video-on-Demand 2015
Total Remuneration ($) 2.7
Average Staff CountAverage Remuneration ($) -9.3
Investment in ProgrammingTotal Canadian Programming
Canadian Programming/Revenue (%)
Acquisition of rightsScript & conceptFiller Programming + Program Production
Adjustments - Gain (Loss)
Pre-tax Profit
Canadian Programming Expenses
Depreciation
P.B.I.T.
Interest Expense
Administration and General 23.5
Total Expenses 18.6
Operating Income
P.B.I.T. MarginPre-tax MarginCAGR = Compound Annual Growth Rate
Subscribers
Profitability (%)Operating Margin
Page 221

Undertaking # Service Name
535438148 Ten Cricket (formerly ECGL Cricket TV)
2011 2012 Var % 2013 Var % 2014 Var % 2015 Var %
y4 y5
40,668 58,301 43.36
46,155 56,575 22.58
3,822 2,752 -28.00
5,097 3,669 -28.02
16,565 11,926 -28.00
0 0
25,484 18,347 -28.01
62.66 31.47
DTH revenueLocal advertising revenueNational advertising revenue
($) CAGR (%)
RevenueResidential/bulk/smatv subscriber revenue
Pay and Specialty
Licensee Licensee Ultimate Owner Type Year
Ethnic Channels Group Limited Levin, Slava Specialty (category B service) 2015
CRTC - FINANCIAL SUMMARY - PAY & SPECIALTY
Acquisition of rightsScript & conceptFiller Programming + Program Production
Adjustments - Gain (Loss)
Pre-tax Profit
Canadian Programming Expenses
Depreciation
P.B.I.T.
Interest Expense
Administration and GeneralTotal Expenses
Operating Income
Programming and ProductionTechnicalSales and Promotion
Other revenueTotal Revenue
Expenses
P.B.I.T. MarginPre-tax MarginCAGR = Compound Annual Growth Rate
Subscribers
Profitability (%)Operating Margin
Total Remuneration ($)Average Staff CountAverage Remuneration ($)
Investment in ProgrammingTotal Canadian Programming
Canadian Programming/Revenue (%)
Page 222

Undertaking # Service Name
535424428 The Beautiful Little Channel (formerly
Classical Digital)
2011 2012 Var % 2013 Var % 2014 Var % 2015 Var %
y1 y2 y3 y4 y5
0 0 0 0 0
0 0 12,022 0 -100.00 0
0 0 0 0 0
0 0 0 0 0
0 0 0 0 0
0 0 0 0 0
0 0 0 0 0
DTH revenueLocal advertising revenueNational advertising revenue
($) CAGR (%)
RevenueResidential/bulk/smatv subscriber revenue
Pay and Specialty
Licensee Licensee Ultimate Owner Type Year
ZoomerMedia Limited Olympus Management Limited Specialty (category B service) 2015
CRTC - FINANCIAL SUMMARY - PAY & SPECIALTY
Acquisition of rightsScript & conceptFiller Programming + Program Production
Adjustments - Gain (Loss)
Pre-tax Profit
Canadian Programming Expenses
Depreciation
P.B.I.T.
Interest Expense
Administration and GeneralTotal Expenses
Operating Income
Programming and ProductionTechnicalSales and Promotion
Other revenueTotal Revenue
Expenses
P.B.I.T. MarginPre-tax MarginCAGR = Compound Annual Growth Rate
Subscribers
Profitability (%)Operating Margin
Total Remuneration ($)Average Staff CountAverage Remuneration ($)
Investment in ProgrammingTotal Canadian Programming
Canadian Programming/Revenue (%)
Page 223

Undertaking # Service Name
305423915 The Brand New ONE Body, Mind, Spirit,
Love Channel
2011 2012 Var % 2013 Var % 2014 Var % 2015 Var %
y1 y2 y3 y4 y5
1,952,286 2,284,320 17.01 2,639,800 15.56 2,675,444 1.35 2,718,496 1.61
2,172,870 1,925,650 -11.38 1,901,900 -1.23 1,929,306 1.44 1,769,094 -8.30
0 0 0 0 0
32,449 15,832 -51.21 49,108 210.18 70,973 44.52 171,935 142.25
0 0 0 300 0 -100.00
4,157,605 4,225,802 1.64 4,590,808 8.64 4,676,023 1.86 4,659,525 -0.35
2,331,325 2,378,735 2.03 2,446,351 2.84 2,603,583 6.43 2,551,456 -2.00
722,795 655,648 -9.29 697,336 6.36 705,250 1.13 684,114 -3.00
120,718 143,514 18.88 110,726 -22.85 87,262 -21.19 83,328 -4.51
266,578 909,279 241.09 251,109 -72.38 130,643 -47.97 177,675 36.00
3,441,416 4,087,176 18.76 3,505,522 -14.23 3,526,738 0.61 3,496,573 -0.86
716,189 138,626 1,085,286 1,149,285 1,162,952
1,416 14,951 955.86 7,931 -46.95 2,839 -64.20 1,985 -30.08
714,773 123,675 1,077,355 1,146,446 1,160,967
21,139 0 -100.00 12,389 3,532 -71.49 0 -100.00
0 0 0 0 0
693,634 123,675 1,064,966 1,142,914 1,160,967
530,937 607,220 14.37 558,537 -8.02 216,186 -61.29 925,290 328.01
0 0 0 0 0
937,235 1,019,818 8.81 1,255,111 23.07 1,603,528 27.76 1,038,066 -35.26
341,875 0 -100.00 0 0 0
1,810,047 1,627,038 -10.11 1,813,648 11.47 1,819,714 0.33 1,963,356 7.89
43.54 38.50 39.51 38.92 42.14
878,830 819,594 -6.74 819,000 -0.07 943,838 15.24 299,270 -68.29
12 11 -8.33 11 0.00 17 54.55 17 0.00
73,236 74,509 1.74 74,455 -0.07 55,520 -25.43 17,604 -68.29
956,645 1,007,470 5.31 1,023,206 1.56 993,898 -2.86 951,443 -4.27
17.2 3.3 23.6 24.6 25.0
17.2 2.9 23.5 24.5 24.9
16.7 2.9 23.2 24.4 24.9
Pay and Specialty
Licensee Licensee Ultimate Owner Type Year
ZoomerMedia Limited Olympus Management Limited Specialty (category A service) 2015
CRTC - FINANCIAL SUMMARY - PAY & SPECIALTY
Depreciation 8.8
P.B.I.T.
Interest Expense
Administration and General -9.7
Total Expenses 0.4
Operating Income
Programming and Production 2.3
Technical -1.4
Sales and Promotion -8.9
Other revenueTotal Revenue 2.9
Expenses
DTH revenue -5.0
Local advertising revenueNational advertising revenue 51.7
($) CAGR (%)
RevenueResidential/bulk/smatv subscriber revenue 8.6
P.B.I.T. MarginPre-tax MarginCAGR = Compound Annual Growth Rate
Subscribers -0.1
Profitability (%)Operating Margin
Total Remuneration ($) -23.6
Average Staff CountAverage Remuneration ($) -30.0
Investment in Programming -100.0
Total Canadian Programming 2.1
Canadian Programming/Revenue (%)
Acquisition of rights 14.9
Script & conceptFiller Programming + Program Production 2.6
Adjustments - Gain (Loss)
Pre-tax Profit
Canadian Programming Expenses
Page 224

Undertaking # Service Name
305417215 The Comedy Network
2011 2012 Var % 2013 Var % 2014 Var % 2015 Var %
y1 y2 y3 y4 y5
19,109,633 19,653,390 2.85 18,952,684 -3.57 20,018,569 5.62 18,471,997 -7.73
6,471,643 6,756,722 4.41 7,065,673 4.57 7,158,900 1.32 7,016,484 -1.99
0 0 0 0 0
30,956,652 29,186,880 -5.72 34,758,191 19.09 30,948,404 -10.96 31,080,187 0.43
70,460 258,956 267.52 27,192 -89.50 505,280 >999± 25,462 -94.96
56,608,388 55,855,948 -1.33 60,803,740 8.86 58,631,153 -3.57 56,594,130 -3.47
23,214,736 21,106,057 -9.08 21,005,603 -0.48 20,846,851 -0.76 17,644,927 -15.36
1,136,797 1,149,459 1.11 1,449,745 26.12 1,484,751 2.41 1,470,412 -0.97
1,713,147 2,719,011 58.71 3,325,335 22.30 3,007,857 -9.55 2,665,954 -11.37
5,501,861 3,344,219 -39.22 2,917,405 -12.76 3,370,906 15.54 3,903,503 15.80
31,566,541 28,318,746 -10.29 28,698,088 1.34 28,710,365 0.04 25,684,796 -10.54
25,041,847 27,537,202 32,105,652 29,920,788 30,909,334
782,612 1,044,382 33.45 835,529 -20.00 835,813 0.03 899,256 7.59
24,259,235 26,492,820 31,270,123 29,084,975 30,010,078
0 19 81 326.32 32 -60.49 0 -100.00
-1,986 0 -100.00 4,073 -1,059,708 >999± -3,062,000 188.95
24,257,249 26,492,801 31,274,115 28,025,235 26,948,078
12,596,913 7,960,905 -36.80 10,492,022 31.79 10,113,913 -3.60 5,476,810 -45.85
190,000 200,001 5.26 200,000 0.00 76,543 -61.73 0 -100.00
1,382,249 2,353,462 70.26 0 -100.00 125,258 0 -100.00
201,137 0 -100.00 0 0 0
14,370,299 10,514,368 -26.83 10,692,022 1.69 10,315,714 -3.52 5,476,810 -46.91
25.39 18.82 17.58 17.59 9.68
691,400 375,694 -45.66 462,069 22.99 157,920 -65.82 0 -100.00
8 4 -50.00 6 50.00 2 -66.67 0 -100.00
86,425 93,924 8.68 77,012 -18.01 78,960 2.53
6,149,333 5,947,278 -3.29 5,849,682 -1.64 5,692,195 -2.69 5,417,975 -4.82
44.2 49.3 52.8 51.0 54.6
42.9 47.4 51.4 49.6 53.0
42.9 47.4 51.4 47.8 47.6
CRTC - FINANCIAL SUMMARY - PAY & SPECIALTY
Programming and Production -6.6
Technical 6.6
Sales and Promotion 11.7
Other revenue -22.5
Total Revenue 0.0
Expenses
DTH revenue 2.0
Local advertising revenueNational advertising revenue 0.1
($) CAGR (%)
RevenueResidential/bulk/smatv subscriber revenue -0.8
Pay and Specialty
Licensee Licensee Ultimate Owner Type Year
Bell Media Inc. BCE Inc. Specialty (category A service) 2015
Total Remuneration ($) -100.0
Average Staff CountAverage Remuneration ($)
Investment in Programming -100.0
Total Canadian Programming -21.4
Canadian Programming/Revenue (%)
Acquisition of rights -18.8
Script & concept -100.0
Filler Programming + Program Production -100.0
Adjustments - Gain (Loss)
Pre-tax Profit
Canadian Programming Expenses
Depreciation 3.5
P.B.I.T.
Interest Expense
Administration and General -8.2
Total Expenses -5.0
Operating Income
P.B.I.T. MarginPre-tax MarginCAGR = Compound Annual Growth Rate
Subscribers -3.1
Profitability (%)Operating Margin
Page 225

Undertaking # Service Name
535417126 The Cult Movie Channel
2011 2012 Var % 2013 Var % 2014 Var % 2015 Var %
y1 y2 y3 y4 y5
0 15,187 50,121 230.03 43,676 -12.86 56,480 29.32
0 0 0 0 34,067
0 0 0 0 0
0 0 0 0 0
0 0 0 0 0
0 0 0 0 0
0 0 0 0 0
0.00 0.00 0.00 0.00
DTH revenueLocal advertising revenueNational advertising revenue
($) CAGR (%)
RevenueResidential/bulk/smatv subscriber revenue
Pay and Specialty
Licensee Licensee Ultimate Owner Type Year
The Cult Movie Channel Inc. Kohler, Dieter Specialty (category B service) 2015
CRTC - FINANCIAL SUMMARY - PAY & SPECIALTY
Acquisition of rightsScript & conceptFiller Programming + Program Production
Adjustments - Gain (Loss)
Pre-tax Profit
Canadian Programming Expenses
Depreciation
P.B.I.T.
Interest Expense
Administration and GeneralTotal Expenses
Operating Income
Programming and ProductionTechnicalSales and Promotion
Other revenueTotal Revenue
Expenses
P.B.I.T. MarginPre-tax MarginCAGR = Compound Annual Growth Rate
Subscribers
Profitability (%)Operating Margin
Total Remuneration ($)Average Staff CountAverage Remuneration ($)
Investment in ProgrammingTotal Canadian Programming
Canadian Programming/Revenue (%)
Page 226

Undertaking # Service Name
105424006 The Independent Film Channel Canada
2011 2012 Var % 2013 Var % 2014 Var % 2015 Var %
y1 y2 y3 y4 y5
3,853,525 4,681,150 21.48 5,561,154 18.80 5,123,824 -7.86 4,366,906 -14.77
4,386,513 4,122,207 -6.03 3,774,810 -8.43 3,495,970 -7.39 3,709,841 6.12
0 0 0 0 0
1,501,193 1,660,542 10.61 1,662,611 0.12 1,724,630 3.73 1,371,836 -20.46
0 0 0 0 0
9,741,231 10,463,899 7.42 10,998,575 5.11 10,344,424 -5.95 9,448,583 -8.66
4,322,894 2,481,724 -42.59 2,727,463 9.90 2,404,824 -11.83 2,751,086 14.40
694,165 668,326 -3.72 646,254 -3.30 597,951 -7.47 594,453 -0.58
151,205 215,861 42.76 141,295 -34.54 116,774 -17.35 132,056 13.09
1,470,657 1,636,681 11.29 1,692,874 3.43 2,024,459 19.59 2,032,525 0.40
6,638,921 5,002,592 -24.65 5,207,886 4.10 5,144,008 -1.23 5,510,120 7.12
3,102,310 5,461,307 5,790,689 5,200,416 3,938,463
0 1,827 0 -100.00 0 0
3,102,310 5,459,480 5,790,689 5,200,416 3,938,463
2,757,286 287 -99.99 1,359 373.52 0 -100.00 0
0 0 0 0 0
345,024 5,459,193 5,789,330 5,200,416 3,938,463
2,918,018 699,617 -76.02 1,097,614 56.89 1,089,854 -0.71 1,089,304 -0.05
0 0 0 0 0
440,804 553,798 25.63 439,807 -20.58 405,439 -7.81 408,067 0.65
0 0 0 0 0
3,358,822 1,253,415 -62.68 1,537,421 22.66 1,495,293 -2.74 1,497,371 0.14
34.48 11.98 13.98 14.46 15.85
681,027 907,688 33.28 853,170 -6.01 1,021,286 19.70 918,315 -10.08
9 11 22.22 10 -9.09 11 10.00 10 -9.09
75,670 82,517 9.05 85,317 3.39 92,844 8.82 91,832 -1.09
2,821,586 2,813,283 -0.29 2,727,950 -3.03 1,409,513 -48.33 1,302,284 -7.61
31.8 52.2 52.6 50.3 41.7
31.8 52.2 52.6 50.3 41.7
3.5 52.2 52.6 50.3 41.7
CRTC - FINANCIAL SUMMARY - PAY & SPECIALTY
Programming and Production -10.7
Technical -3.8
Sales and Promotion -3.3
Other revenueTotal Revenue -0.8
Expenses
DTH revenue -4.1
Local advertising revenueNational advertising revenue -2.2
($) CAGR (%)
RevenueResidential/bulk/smatv subscriber revenue 3.2
Pay and Specialty
Licensee Licensee Ultimate Owner Type Year
Showcase Television Inc. Shaw Communications Inc. Specialty (category A service) 2015
Total Remuneration ($) 7.8
Average Staff CountAverage Remuneration ($) 5.0
Investment in ProgrammingTotal Canadian Programming -18.3
Canadian Programming/Revenue (%)
Acquisition of rights -21.8
Script & conceptFiller Programming + Program Production -1.9
Adjustments - Gain (Loss)
Pre-tax Profit
Canadian Programming Expenses
Depreciation
P.B.I.T.
Interest Expense
Administration and General 8.4
Total Expenses -4.6
Operating Income
P.B.I.T. MarginPre-tax MarginCAGR = Compound Annual Growth Rate
Subscribers -17.6
Profitability (%)Operating Margin
Page 227

Undertaking # Service Name
535419461 The Israeli Network (formerly Israeli TV 1)
2011 2012 Var % 2013 Var % 2014 Var % 2015 Var %
y1 y2 y3 y4 y5
286,186 330,189 15.38 312,420 -5.38 246,263 -21.18 262,085 6.42
93,132 90,104 -3.25 138,205 53.38 154,987 12.14 144,304 -6.89
10,045 8,999 -10.41 6,041 -32.87 7,186 18.95 4,105 -42.88
13,393 11,998 -10.42 8,055 -32.86 9,581 18.94 5,474 -42.87
43,527 38,994 -10.41 26,177 -32.87 31,138 18.95 17,790 -42.87
0 0 0 0 0
66,965 59,991 -10.41 40,273 -32.87 47,905 18.95 27,369 -42.87
23.40 18.17 12.89 19.45 10.44
DTH revenueLocal advertising revenueNational advertising revenue
($) CAGR (%)
RevenueResidential/bulk/smatv subscriber revenue
Pay and Specialty
Licensee Licensee Ultimate Owner Type Year
Ethnic Channels Group Limited Levin, Slava Specialty (category B service) 2015
CRTC - FINANCIAL SUMMARY - PAY & SPECIALTY
Acquisition of rights -20.1
Script & concept -20.0
Filler Programming + Program Production -20.0
Adjustments - Gain (Loss)
Pre-tax Profit
Canadian Programming Expenses
Depreciation
P.B.I.T.
Interest Expense
Administration and GeneralTotal Expenses
Operating Income
Programming and Production 11.6
TechnicalSales and Promotion
Other revenueTotal Revenue -2.2
Expenses
P.B.I.T. MarginPre-tax MarginCAGR = Compound Annual Growth Rate
Subscribers
Profitability (%)Operating Margin
Total Remuneration ($)Average Staff CountAverage Remuneration ($)
Investment in ProgrammingTotal Canadian Programming -20.0
Canadian Programming/Revenue (%)
Page 228

Undertaking # Service Name
314600354 The Movie Network
2011 2012 Var % 2013 Var % 2014 Var % 2015 Var %
y1 y2 y3 y4 y5
74,278,011 75,387,579 1.49 73,589,577 -2.39 68,801,498 -6.51 63,731,171 -7.37
59,436,346 55,239,473 -7.06 54,177,318 -1.92 55,678,788 2.77 56,828,375 2.06
0 0 0 0 0
0 0 0 0 0
5,033,707 6,079,650 20.78 0 -100.00 0 4,307
138,748,064 136,706,702 -1.47 127,766,895 -6.54 124,480,286 -2.57 120,563,853 -3.15
96,991,335 95,632,984 -1.40 89,563,224 -6.35 87,680,702 -2.10 99,814,552 13.84
1,651,885 1,413,527 -14.43 1,010,318 -28.53 1,087,043 7.59 2,529,218 132.67
5,730,329 5,877,476 2.57 4,989,104 -15.11 2,377,908 -52.34 5,174,135 117.59
4,594,174 5,097,931 10.97 14,065,793 175.91 2,682,632 -80.93 3,448,144 28.54
108,967,723 108,021,918 -0.87 109,628,439 1.49 93,828,285 -14.41 110,966,049 18.27
29,780,341 28,684,784 18,138,456 30,652,001 9,597,804
1,647,095 1,114,071 -32.36 1,509,862 35.53 3,981,350 163.69 5,493,163 37.97
28,133,246 27,570,713 16,628,594 26,670,651 4,104,641
1,037,957 858,920 -17.25 642,843 -25.16 0 -100.00 89,747
-200,000 -200,000 0.00 -200,000 0.00 -91,244 -54.38 0 -100.00
26,895,289 26,511,793 15,785,751 26,579,407 4,014,894
18,585,419 17,609,411 -5.25 16,587,714 -5.80 15,426,886 -7.00 21,464,612 39.14
1,551,950 1,300,000 -16.23 1,300,000 0.00 1,809,751 39.21 2,389,120 32.01
3,273,558 3,985,558 21.75 2,273,962 -42.94 474,893 -79.12 611,166 28.70
2,737,151 5,665,588 106.99 3,117,821 -44.97 664,000 -78.70 3,298,955 396.83
26,148,078 28,560,557 9.23 23,279,497 -18.49 18,375,530 -21.07 27,763,853 51.09
18.85 20.89 18.22 14.76 23.03
14,111,652 14,135,158 0.17 12,633,096 -10.63 2,798,663 -77.85 610,362 -78.19
149 157 5.37 148 -5.73 44.66 -69.82 9 -79.85
94,709 90,033 -4.94 85,359 -5.19 62,666 -26.59 67,818 8.22
1,226,465 1,187,520 -3.18 1,181,772 -0.48 1,152,851 -2.45 1,132,667 -1.75
21.5 21.0 14.2 24.6 8.0
20.3 20.2 13.0 21.4 3.4
19.4 19.4 12.4 21.4 3.3
Pay and Specialty
Licensee Licensee Ultimate Owner Type Year
Bell Media Inc. BCE Inc. Pay-TV (category A service) 2015
CRTC - FINANCIAL SUMMARY - PAY & SPECIALTY
Depreciation 35.1
P.B.I.T.
Interest Expense
Administration and General -6.9
Total Expenses 0.5
Operating Income
Programming and Production 0.7
Technical 11.2
Sales and Promotion -2.5
Other revenue -82.9
Total Revenue -3.5
Expenses
DTH revenue -1.1
Local advertising revenueNational advertising revenue
($) CAGR (%)
RevenueResidential/bulk/smatv subscriber revenue -3.8
P.B.I.T. MarginPre-tax MarginCAGR = Compound Annual Growth Rate
Subscribers -2.0
Profitability (%)Operating Margin
Total Remuneration ($) -54.4
Average Staff CountAverage Remuneration ($) -8.0
Investment in Programming 4.8
Total Canadian Programming 1.5
Canadian Programming/Revenue (%)
Acquisition of rights 3.7
Script & concept 11.4
Filler Programming + Program Production -34.3
Adjustments - Gain (Loss)
Pre-tax Profit
Canadian Programming Expenses
Page 229

Undertaking # Service Name
315413716 The Movie Network Encore (formerly
Mpix)
2011 2012 Var % 2013 Var % 2014 Var % 2015 Var %
y1 y2 y3 y4 y5
16,190,798 15,070,928 -6.92 14,491,607 -3.84 12,973,790 -10.47 11,280,019 -13.06
9,496,348 8,749,254 -7.87 8,627,296 -1.39 8,850,341 2.59 9,094,357 2.76
0 0 0 0 0
0 0 0 0 0
0 0 0 0 0
25,687,146 23,820,182 -7.27 23,118,903 -2.94 21,824,131 -5.60 20,374,376 -6.64
7,430,290 8,269,750 11.30 7,494,895 -9.37 7,129,602 -4.87 5,586,643 -21.64
1,425,129 1,436,330 0.79 1,433,219 -0.22 1,329,648 -7.23 1,643,547 23.61
1,030,479 895,025 -13.14 730,304 -18.40 248,121 -66.02 164,214 -33.82
1,384,795 1,431,644 3.38 1,377,471 -3.78 762,907 -44.62 662,547 -13.15
11,270,693 12,032,749 6.76 11,035,889 -8.28 9,470,278 -14.19 8,056,951 -14.92
14,416,453 11,787,433 12,083,014 12,353,853 12,317,425
0 0 0 220,162 575,337 161.32
14,416,453 11,787,433 12,083,014 12,133,691 11,742,088
546,094 350,219 -35.87 331,007 -5.49 0 -100.00 0
0 0 0 0 0
13,870,359 11,437,214 11,752,007 12,133,691 11,742,088
1,385,897 1,472,822 6.27 1,649,139 11.97 2,178,935 32.13 1,767,460 -18.88
0 0 0 0 0
903,646 1,208,984 33.79 966,093 -20.09 0 -100.00 0
1,508,300 1,791,210 18.76 1,059,417 -40.85 528,000 -50.16 0 -100.00
3,797,843 4,473,016 17.78 3,674,649 -17.85 2,706,935 -26.33 1,767,460 -34.71
14.78 18.78 15.89 12.40 8.67
937,350 919,556 -1.90 946,390 2.92 194,060 -79.49 69,157 -64.36
15 15 0.00 15 0.00 2.9 -80.67 1 -65.52
62,490 61,304 -1.90 63,093 2.92 66,917 6.06 69,157 3.35
1,583,223 1,480,266 -6.50 1,401,247 -5.34 1,316,313 -6.06 1,225,426 -6.90
56.1 49.5 52.3 56.6 60.5
56.1 49.5 52.3 55.6 57.6
54.0 48.0 50.8 55.6 57.6
CRTC - FINANCIAL SUMMARY - PAY & SPECIALTY
Programming and Production -6.9
Technical 3.6
Sales and Promotion -36.8
Other revenueTotal Revenue -5.6
Expenses
DTH revenue -1.1
Local advertising revenueNational advertising revenue
($) CAGR (%)
RevenueResidential/bulk/smatv subscriber revenue -8.6
Pay and Specialty
Licensee Licensee Ultimate Owner Type Year
Bell Media Inc. BCE Inc. Pay-TV (category A service) 2015
Total Remuneration ($) -47.9
Average Staff CountAverage Remuneration ($) 2.6
Investment in Programming -100.0
Total Canadian Programming -17.4
Canadian Programming/Revenue (%)
Acquisition of rights 6.3
Script & conceptFiller Programming + Program Production -100.0
Adjustments - Gain (Loss)
Pre-tax Profit
Canadian Programming Expenses
Depreciation
P.B.I.T.
Interest Expense
Administration and General -16.8
Total Expenses -8.1
Operating Income
P.B.I.T. MarginPre-tax MarginCAGR = Compound Annual Growth Rate
Subscribers -6.2
Profitability (%)Operating Margin
Page 230

Undertaking # Service Name
305425789 The NHL Network
2011 2012 Var % 2013 Var % 2014 Var % 2015 Var %
y1 y2 y3 y4 y5
11,970,969 12,550,023 4.84 12,299,336 -2.00 12,583,172 2.31 10,735,840 -14.68
4,638,366 4,698,457 1.30 4,574,933 -2.63 5,563,522 21.61 3,707,044 -33.37
300,000 300,000 0.00 300,000 0.00 0 -100.00 0
0 0 0 0 0
2,776,885 2,786,996 0.36 2,263,039 -18.80 3,354,007 48.21 2,964,945 -11.60
0 0 0 0 0
3,076,885 3,086,996 0.33 2,563,039 -16.97 3,354,007 30.86 2,964,945 -11.60
25.70 24.60 20.84 26.65 27.62
DTH revenueLocal advertising revenueNational advertising revenue
($) CAGR (%)
RevenueResidential/bulk/smatv subscriber revenue
Pay and Specialty
Licensee Licensee Ultimate Owner Type Year
The NHL Network Inc. 3918921 Canada Inc. Specialty (category B service) 2015
CRTC - FINANCIAL SUMMARY - PAY & SPECIALTY
Acquisition of rights -100.0
Script & conceptFiller Programming + Program Production 1.7
Adjustments - Gain (Loss)
Pre-tax Profit
Canadian Programming Expenses
Depreciation
P.B.I.T.
Interest Expense
Administration and GeneralTotal Expenses
Operating Income
Programming and Production -5.5
TechnicalSales and Promotion
Other revenueTotal Revenue -2.7
Expenses
P.B.I.T. MarginPre-tax MarginCAGR = Compound Annual Growth Rate
Subscribers
Profitability (%)Operating Margin
Total Remuneration ($)Average Staff CountAverage Remuneration ($)
Investment in ProgrammingTotal Canadian Programming -0.9
Canadian Programming/Revenue (%)
Page 231

Undertaking # Service Name
305424822 The Pet Network
2011 2012 Var % 2013 Var % 2014 Var % 2015 Var %
y1 y2 y3 y4 y5
690,726 1,525,065 120.79 2,096,234 37.45 813,258 -61.20 267,907 -67.06
951,445 1,854,513 94.92 2,241,917 20.89 1,161,423 -48.20 601,732 -48.19
633,729 1,418,960 123.91 1,630,561 14.91 127,909 -92.16 561,630 339.09
0 0 0 0 0
163,440 193,845 18.60 398,211 105.43 857,613 115.37 0 -100.00
0 0 0 0 0
797,169 1,612,805 102.32 2,028,772 25.79 985,522 -51.42 561,630 -43.01
115.41 105.75 96.78 121.18 209.64
Pay and Specialty
Licensee Licensee Ultimate Owner Type Year
Stornoway Communications Limited
Partnership
Smith, Vincent & Co. Ltd. Specialty (category B service) 2015
CRTC - FINANCIAL SUMMARY - PAY & SPECIALTY
Depreciation
P.B.I.T.
Interest Expense
Administration and GeneralTotal Expenses
Operating Income
Programming and Production -10.8
TechnicalSales and Promotion
Other revenueTotal Revenue -21.1
Expenses
DTH revenueLocal advertising revenueNational advertising revenue
($) CAGR (%)
RevenueResidential/bulk/smatv subscriber revenue
P.B.I.T. MarginPre-tax MarginCAGR = Compound Annual Growth Rate
Subscribers
Profitability (%)Operating Margin
Total Remuneration ($)Average Staff CountAverage Remuneration ($)
Investment in ProgrammingTotal Canadian Programming -8.4
Canadian Programming/Revenue (%)
Acquisition of rights -3.0
Script & conceptFiller Programming + Program Production -100.0
Adjustments - Gain (Loss)
Pre-tax Profit
Canadian Programming Expenses
Page 232

Undertaking # Service Name
535426911 The Rural Channel
2011 2012 Var % 2013 Var % 2014 Var % 2015 Var %
y3 y4 y5
0 123,950 235,950 90.36
0 5,163 0 -100.00
0 0 0
0 0 0
0 0 0
0 0 0
0 0 0
0.00 0.00
CRTC - FINANCIAL SUMMARY - PAY & SPECIALTY
Programming and ProductionTechnicalSales and Promotion
Other revenueTotal Revenue
Expenses
DTH revenueLocal advertising revenueNational advertising revenue
($) CAGR (%)
RevenueResidential/bulk/smatv subscriber revenue
Pay and Specialty
Licensee Licensee Ultimate Owner Type Year
Ag-Com Productions Ltd. Hundredfold Holdings Inc. Specialty (category B service) 2015
Total Remuneration ($)Average Staff CountAverage Remuneration ($)
Investment in ProgrammingTotal Canadian Programming
Canadian Programming/Revenue (%)
Acquisition of rightsScript & conceptFiller Programming + Program Production
Adjustments - Gain (Loss)
Pre-tax Profit
Canadian Programming Expenses
Depreciation
P.B.I.T.
Interest Expense
Administration and GeneralTotal Expenses
Operating Income
P.B.I.T. MarginPre-tax MarginCAGR = Compound Annual Growth Rate
Subscribers
Profitability (%)Operating Margin
Page 233
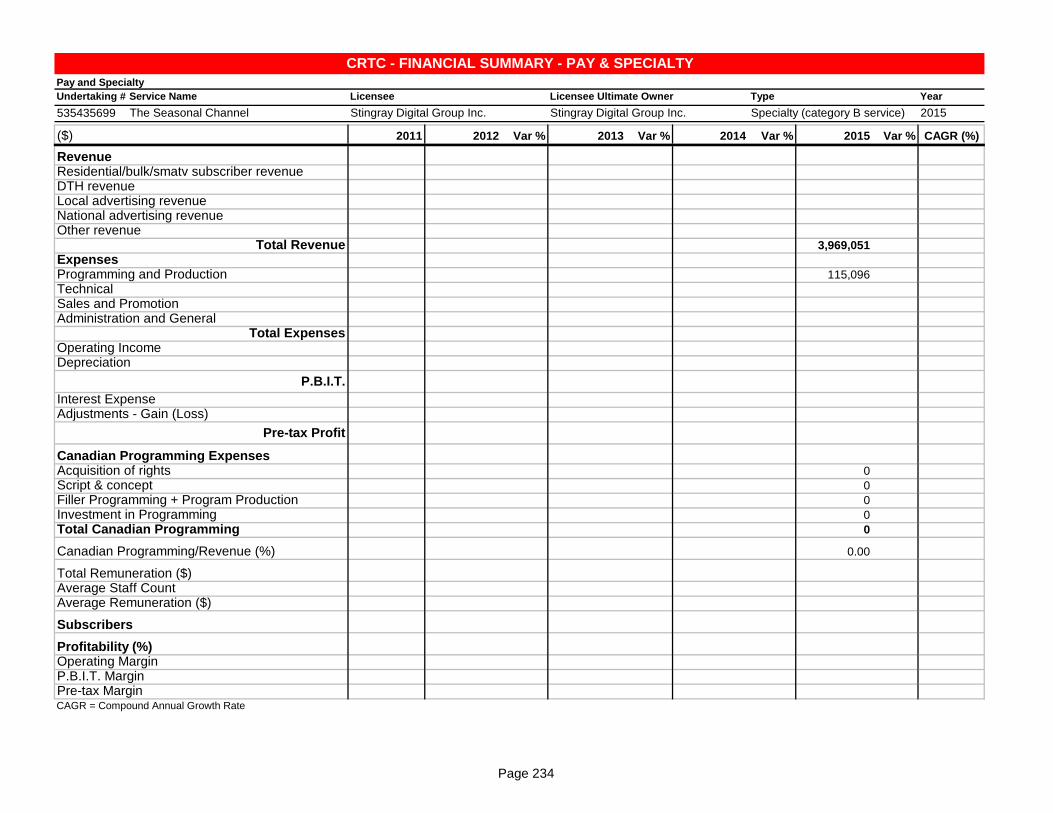
Undertaking # Service Name
535435699 The Seasonal Channel
2011 2012 Var % 2013 Var % 2014 Var % 2015 Var %
y5
3,969,051
115,096
0
0
0
0
0
0.00
DTH revenueLocal advertising revenueNational advertising revenue
($) CAGR (%)
RevenueResidential/bulk/smatv subscriber revenue
Pay and Specialty
Licensee Licensee Ultimate Owner Type Year
Stingray Digital Group Inc. Stingray Digital Group Inc. Specialty (category B service) 2015
CRTC - FINANCIAL SUMMARY - PAY & SPECIALTY
Acquisition of rightsScript & conceptFiller Programming + Program Production
Adjustments - Gain (Loss)
Pre-tax Profit
Canadian Programming Expenses
Depreciation
P.B.I.T.
Interest Expense
Administration and GeneralTotal Expenses
Operating Income
Programming and ProductionTechnicalSales and Promotion
Other revenueTotal Revenue
Expenses
P.B.I.T. MarginPre-tax MarginCAGR = Compound Annual Growth Rate
Subscribers
Profitability (%)Operating Margin
Total Remuneration ($)Average Staff CountAverage Remuneration ($)
Investment in ProgrammingTotal Canadian Programming
Canadian Programming/Revenue (%)
Page 234

Undertaking # Service Name
314600537 The Sports Network (TSN)
2011 2012 Var % 2013 Var % 2014 Var % 2015 Var %
y1 y2 y3 y4 y5
112,813,081 185,770,758 64.67 216,353,607 16.46 256,171,363 18.40 250,182,832 -2.34
34,254,957 55,738,143 62.72 62,900,532 12.85 77,279,671 22.86 70,117,773 -9.27
0 0 0 0 0
129,582,617 133,180,289 2.78 120,704,444 -9.37 118,645,699 -1.71 122,478,121 3.23
12,749,039 144,521 -98.87 434,897 200.92 91,151 -79.04 61,582 -32.44
289,399,694 374,833,711 29.52 400,393,480 6.82 452,187,884 12.94 442,840,308 -2.07
167,091,606 272,170,110 62.89 235,182,618 -13.59 282,051,564 19.93 278,488,788 -1.26
5,939,227 930,329 -84.34 1,218,641 30.99 1,272,285 4.40 2,905,161 128.34
16,065,902 16,410,445 2.14 15,488,273 -5.62 16,841,223 8.74 16,230,402 -3.63
15,363,935 15,593,200 1.49 19,702,712 26.35 19,068,717 -3.22 20,627,069 8.17
204,460,670 305,104,084 49.22 271,592,244 -10.98 319,233,789 17.54 318,251,420 -0.31
84,939,024 69,729,627 128,801,236 132,954,095 124,588,888
2,735,050 7,933,517 190.07 5,765,857 -27.32 6,957,721 20.67 8,361,693 20.18
82,203,974 61,796,110 123,035,379 125,996,374 116,227,195
25,228,806 25,253,030 0.10 25,213,408 -0.16 25,309,175 0.38 25,511,133 0.80
1,353,215 444,352 -67.16 4,519,565 917.11 2,795,593 -38.14 9,225,623 230.01
58,328,383 36,987,432 102,341,536 103,482,792 99,941,685
69,218,379 96,815,920 39.87 62,648,471 -35.29 103,461,482 65.15 114,292,946 10.47
0 0 0 0 0
70,928,036 89,407,461 26.05 86,883,848 -2.82 98,414,292 13.27 108,037,944 9.78
0 0 0 0 0
140,146,415 186,223,381 32.88 149,532,319 -19.70 201,875,774 35.00 222,330,890 10.13
48.43 49.68 37.35 44.64 50.21
20,287,941 22,518,305 10.99 23,098,468 2.58 24,534,798 6.22 28,384,076 15.69
199 214 7.54 218 1.87 224 2.75 241 7.59
101,949 105,226 3.21 105,956 0.69 109,530 3.37 117,776 7.53
9,003,852 9,190,812 2.08 9,069,491 -1.32 9,050,153 -0.21 8,798,198 -2.78
29.4 18.6 32.2 29.4 28.1
28.4 16.5 30.7 27.9 26.2
20.2 9.9 25.6 22.9 22.6
Pay and Specialty
Licensee Licensee Ultimate Owner Type Year
The Sports Network Inc. BCE Inc. Specialty (category C service) 2015
CRTC - FINANCIAL SUMMARY - PAY & SPECIALTY
Depreciation 32.2
P.B.I.T.
Interest Expense
Administration and General 7.6
Total Expenses 11.7
Operating Income
Programming and Production 13.6
Technical -16.4
Sales and Promotion 0.3
Other revenue -73.6
Total Revenue 11.2
Expenses
DTH revenue 19.6
Local advertising revenueNational advertising revenue -1.4
($) CAGR (%)
RevenueResidential/bulk/smatv subscriber revenue 22.0
P.B.I.T. MarginPre-tax MarginCAGR = Compound Annual Growth Rate
Subscribers -0.6
Profitability (%)Operating Margin
Total Remuneration ($) 8.8
Average Staff CountAverage Remuneration ($) 3.7
Investment in ProgrammingTotal Canadian Programming 12.2
Canadian Programming/Revenue (%)
Acquisition of rights 13.4
Script & conceptFiller Programming + Program Production 11.1
Adjustments - Gain (Loss)
Pre-tax Profit
Canadian Programming Expenses
Page 235

Undertaking # Service Name
214301194 TheWeather Network / MétéoMédia
2011 2012 Var % 2013 Var % 2014 Var % 2015 Var %
y1 y2 y3 y4 y5
22,900,686 23,393,424 2.15 23,870,896 2.04 24,499,628 2.63 24,190,240 -1.26
7,777,821 7,727,874 -0.64 7,468,298 -3.36 7,151,372 -4.24 6,681,282 -6.57
0 0 0 0 0
18,236,451 19,001,825 4.20 19,336,119 1.76 15,725,726 -18.67 11,754,703 -25.25
220,118 251,744 14.37 152,527 -39.41 81,605 -46.50 67,476 -17.31
49,135,076 50,374,867 2.52 50,827,840 0.90 47,458,331 -6.63 42,693,701 -10.04
20,715,231 22,489,623 8.57 23,062,400 2.55 23,312,726 1.09 24,577,642 5.43
2,630,908 2,948,683 12.08 2,896,151 -1.78 2,884,316 -0.41 2,820,808 -2.20
3,034,004 2,686,619 -11.45 2,842,720 5.81 3,154,114 10.95 2,470,376 -21.68
9,289,787 8,873,788 -4.48 8,735,998 -1.55 8,287,227 -5.14 7,846,106 -5.32
35,669,930 36,998,713 3.73 37,537,269 1.46 37,638,383 0.27 37,714,932 0.20
13,465,146 13,376,154 13,290,571 9,819,948 4,978,769
2,695,657 2,399,745 -10.98 2,674,486 11.45 2,470,581 -7.62 1,900,928 -23.06
10,769,489 10,976,409 10,616,085 7,349,367 3,077,841
307,564 -68,092 -122.14 -29,564 -56.58 795,887 >999± 1,244,989 56.43
0 0 0 0 0
10,461,925 11,044,501 10,645,649 6,553,480 1,832,852
0 0 0 0 0
0 0 0 0 0
20,715,231 22,489,623 8.57 23,062,400 2.55 23,312,726 1.09 24,577,642 5.43
0 0 0 0 0
20,715,231 22,489,623 8.57 23,062,400 2.55 23,312,726 1.09 24,577,642 5.43
42.16 44.64 45.37 49.12 57.57
16,121,322 15,388,111 -4.55 15,896,823 3.31 16,682,022 4.94 18,239,300 9.34
193 188 -2.59 198 5.32 203 2.53 197 -2.96
83,530 81,852 -2.01 80,287 -1.91 82,177 2.35 92,585 12.67
11,124,476 11,329,477 1.84 11,353,301 0.21 11,353,301 0.00 11,162,022 -1.68
27.4 26.6 26.1 20.7 11.7
21.9 21.8 20.9 15.5 7.2
21.3 21.9 20.9 13.8 4.3
CRTC - FINANCIAL SUMMARY - PAY & SPECIALTY
Programming and Production 4.4
Technical 1.8
Sales and Promotion -5.0
Other revenue -25.6
Total Revenue -3.5
Expenses
DTH revenue -3.7
Local advertising revenueNational advertising revenue -10.4
($) CAGR (%)
RevenueResidential/bulk/smatv subscriber revenue 1.4
Pay and Specialty
Licensee Licensee Ultimate Owner Type Year
Pelmorex Communications Inc. Pelmorex Investments Inc. Specialty (category A service) 2015
Total Remuneration ($) 3.1
Average Staff CountAverage Remuneration ($) 2.6
Investment in ProgrammingTotal Canadian Programming 4.4
Canadian Programming/Revenue (%)
Acquisition of rightsScript & conceptFiller Programming + Program Production 4.4
Adjustments - Gain (Loss)
Pre-tax Profit
Canadian Programming Expenses
Depreciation -8.4
P.B.I.T.
Interest Expense
Administration and General -4.1
Total Expenses 1.4
Operating Income
P.B.I.T. MarginPre-tax MarginCAGR = Compound Annual Growth Rate
Subscribers 0.1
Profitability (%)Operating Margin
Page 236

Undertaking # Service Name
305423999 travel + escape
2011 2012 Var % 2013 Var % 2014 Var % 2015 Var %
y1 y2 y3 y4 y5
3,051,299 3,013,003 -1.26 3,706,496 23.02 4,228,383 14.08 4,383,923 3.68
2,064,510 2,284,306 10.65 1,455,348 -36.29 1,533,247 5.35 1,854,946 20.98
0 0 0 0 0
347,461 812,102 133.72 874,254 7.65 1,578,781 80.59 1,695,338 7.38
0 39,583 0 -100.00 0 0
5,463,270 6,148,994 12.55 6,036,098 -1.84 7,340,411 21.61 7,934,207 8.09
3,354,044 3,272,935 -2.42 4,203,908 28.44 4,929,884 17.27 5,764,923 16.94
503,033 836,462 66.28 1,019,191 21.85 868,381 -14.80 803,000 -7.53
144,896 431,035 197.48 537,326 24.66 503,700 -6.26 575,744 14.30
1,273,015 1,375,276 8.03 414,522 -69.86 521,806 25.88 563,009 7.90
5,274,988 5,915,708 12.15 6,174,947 4.38 6,823,771 10.51 7,706,676 12.94
188,282 233,286 -138,849 516,640 227,531
0 0 0 0 0
188,282 233,286 -138,849 516,640 227,531
2,180 117,812 >999± 0 -100.00 0 0
0 0 0 0 0
186,102 115,474 -138,849 516,640 227,531
2,682,610 1,015,566 -62.14 1,640,383 61.52 2,127,592 29.70 2,652,191 24.66
0 0 0 0 0
0 1,157,493 1,612,706 39.33 1,693,229 4.99 1,475,733 -12.85
0 107,468 113,194 5.33 0 -100.00 0
2,682,610 2,280,527 -14.99 3,366,283 47.61 3,820,821 13.50 4,127,924 8.04
49.10 37.09 55.77 52.05 52.03
821,547 1,605,801 95.46 0 -100.00 0 0
20 21.75 8.75 0 -100.00 0 0
41,077 73,830 79.73
1,068,275 1,116,322 4.50 4,573,419 309.69 4,385,911 -4.10 3,993,897 -8.94
3.4 3.8 -2.3 7.0 2.9
3.4 3.8 -2.3 7.0 2.9
3.4 1.9 -2.3 7.0 2.9
DTH revenue -2.6
Local advertising revenueNational advertising revenue 48.6
($) CAGR (%)
RevenueResidential/bulk/smatv subscriber revenue 9.5
Pay and Specialty
Licensee Licensee Ultimate Owner Type Year
Blue Ant Media Partnership Blue Ant Media Inc. Specialty (category A service) 2015
CRTC - FINANCIAL SUMMARY - PAY & SPECIALTY
Acquisition of rights -0.3
Script & conceptFiller Programming + Program Production
Adjustments - Gain (Loss)
Pre-tax Profit
Canadian Programming Expenses
Depreciation
P.B.I.T.
Interest Expense
Administration and General -18.5
Total Expenses 9.9
Operating Income
Programming and Production 14.5
Technical 12.4
Sales and Promotion 41.2
Other revenueTotal Revenue 9.8
Expenses
P.B.I.T. MarginPre-tax MarginCAGR = Compound Annual Growth Rate
Subscribers 39.1
Profitability (%)Operating Margin
Total Remuneration ($) -100.0
Average Staff CountAverage Remuneration ($)
Investment in ProgrammingTotal Canadian Programming 11.4
Canadian Programming/Revenue (%)
Page 237

Undertaking # Service Name
305417281 TreeHouse TV
2011 2012 Var % 2013 Var % 2014 Var % 2015 Var %
y1 y2 y3 y4 y5
8,857,651 8,886,139 0.32 8,444,959 -4.96 7,613,682 -9.84 7,270,595 -4.51
2,518,645 2,673,420 6.15 2,922,293 9.31 3,054,795 4.53 3,565,381 16.71
0 0 0 0 0
463,683 189,175 -59.20 487,889 157.90 338,423 -30.64 455,034 34.46
2,712,128 2,505,776 -7.61 2,643,551 5.50 2,335,549 -11.65 2,550,360 9.20
14,552,107 14,254,510 -2.05 14,498,692 1.71 13,342,449 -7.97 13,841,370 3.74
5,302,772 5,969,145 12.57 6,284,716 5.29 6,399,333 1.82 10,804,154 68.83
486,214 427,795 -12.02 391,809 -8.41 371,290 -5.24 383,514 3.29
1,153,209 1,188,333 3.05 644,020 -45.80 94,535 -85.32 279,021 195.15
2,821,427 2,663,136 -5.61 2,235,620 -16.05 1,522,790 -31.89 693,319 -54.47
9,763,622 10,248,409 4.97 9,556,165 -6.75 8,387,948 -12.22 12,160,008 44.97
4,788,485 4,006,101 4,942,527 4,954,501 1,681,362
0 0 0 0 0
4,788,485 4,006,101 4,942,527 4,954,501 1,681,362
277,799 256,607 -7.63 160,573 -37.42 149,212 -7.08 226,939 52.09
2,141,335 2,059,682 -3.81 2,334,955 13.36 2,433,417 4.22 1,903,696 -21.77
6,652,021 5,809,176 7,116,909 7,238,706 3,358,119
3,936,891 4,141,566 5.20 4,207,189 1.58 4,606,336 9.49 4,938,573 7.21
86,416 188,406 118.02 238,684 26.69 237,360 -0.55 227,395 -4.20
174,928 376,881 115.45 482,942 28.14 355,472 -26.39 495,501 39.39
5,000 89,350 >999± 18,164 -79.67 8,950 -50.73 4,253,450 >999±
4,203,235 4,796,203 14.11 4,946,979 3.14 5,208,118 5.28 9,914,919 90.37
28.88 33.65 34.12 39.03 71.63
1,465,560 1,302,609 -11.12 1,233,592 -5.30 556,916 -54.85 416,541 -25.21
23 25 8.70 22 -12.00 15 -31.82 11.99 -20.07
63,720 52,104 -18.23 56,072 7.62 37,128 -33.79 34,741 -6.43
8,579,846 8,673,063 1.09 8,637,702 -0.41 8,364,860 -3.16 8,169,445 -2.34
32.9 28.1 34.1 37.1 12.1
32.9 28.1 34.1 37.1 12.1
45.7 40.8 49.1 54.3 24.3
Pay and Specialty
Licensee Licensee Ultimate Owner Type Year
YTV Canada, Inc. Corus Entertainment Inc. Specialty (category A service) 2015
CRTC - FINANCIAL SUMMARY - PAY & SPECIALTY
Depreciation
P.B.I.T.
Interest Expense
Administration and General -29.6
Total Expenses 5.6
Operating Income
Programming and Production 19.5
Technical -5.8
Sales and Promotion -29.9
Other revenue -1.5
Total Revenue -1.2
Expenses
DTH revenue 9.1
Local advertising revenueNational advertising revenue -0.5
($) CAGR (%)
RevenueResidential/bulk/smatv subscriber revenue -4.8
P.B.I.T. MarginPre-tax MarginCAGR = Compound Annual Growth Rate
Subscribers -1.2
Profitability (%)Operating Margin
Total Remuneration ($) -27.0
Average Staff CountAverage Remuneration ($) -14.1
Investment in Programming 440.1
Total Canadian Programming 23.9
Canadian Programming/Revenue (%)
Acquisition of rights 5.8
Script & concept 27.4
Filler Programming + Program Production 29.7
Adjustments - Gain (Loss)
Pre-tax Profit
Canadian Programming Expenses
Page 238

Undertaking # Service Name
214301103 TV5
2011 2012 Var % 2013 Var % 2014 Var % 2015 Var %
y1 y2 y3 y4 y5
8,609,805 8,723,159 1.32 8,505,772 -2.49 8,848,069 4.02 22,230,226 151.24
2,073,225 2,387,501 15.16 2,479,616 3.86 2,758,868 11.26 9,274,735 236.18
0 0 0 0 0
1,496,554 2,012,424 34.47 2,473,048 22.89 2,524,452 2.08 2,317,873 -8.18
6,404,010 5,168,264 -19.30 5,117,726 -0.98 4,858,758 -5.06 2,667,004 -45.11
18,583,594 18,291,348 -1.57 18,576,162 1.56 18,990,147 2.23 36,489,838 92.15
8,346,557 9,374,165 12.31 9,489,676 1.23 10,199,869 7.48 22,084,281 116.52
1,839,837 1,815,011 -1.35 1,955,821 7.76 2,037,135 4.16 3,362,030 65.04
4,047,242 4,091,242 1.09 3,850,715 -5.88 4,440,795 15.32 4,396,438 -1.00
3,079,068 2,232,980 -27.48 2,369,973 6.13 3,124,060 31.82 3,270,673 4.69
17,312,704 17,513,398 1.16 17,666,185 0.87 19,801,859 12.09 33,113,422 67.22
1,270,890 777,950 909,977 -811,712 3,376,416
844,016 790,229 -6.37 619,288 -21.63 657,603 6.19 644,557 -1.98
426,874 -12,279 290,689 -1,469,315 2,731,859
25,682 18,968 -26.14 9,400 -50.44 54,718 482.11 597,026 991.10
1,205 -25,314 >999± -35,446 40.03 95,524 -369.49 40,742 -57.35
402,397 -56,561 245,843 -1,428,509 2,175,575
6,188,374 7,108,336 14.87 6,762,611 -4.86 6,088,499 -9.97 16,968,774 178.70
334,000 148,728 -55.47 521,025 250.32 1,073,294 106.00 115,493 -89.24
218,346 219,994 0.75 217,430 -1.17 225,054 3.51 477,189 112.03
0 0 0 0 0
6,740,720 7,477,058 10.92 7,501,066 0.32 7,386,847 -1.52 17,561,456 137.74
36.27 40.88 40.38 38.90 48.13
5,013,857 3,866,436 -22.88 4,252,978 10.00 5,094,541 19.79 6,110,721 19.95
71 50 -29.58 51 2.00 61 19.61 69 13.11
70,618 77,329 9.50 83,392 7.84 83,517 0.15 88,561 6.04
7,106,667 6,912,634 -2.73 6,914,529 0.03 7,027,248 1.63 10,289,859 46.43
6.8 4.3 4.9 -4.3 9.3
2.3 -0.1 1.6 -7.7 7.5
2.2 -0.3 1.3 -7.5 6.0
CRTC - FINANCIAL SUMMARY - PAY & SPECIALTY
Programming and Production 27.5
Technical 16.3
Sales and Promotion 2.1
Other revenue -19.7
Total Revenue 18.4
Expenses
DTH revenue 45.4
Local advertising revenueNational advertising revenue 11.6
($) CAGR (%)
RevenueResidential/bulk/smatv subscriber revenue 26.8
Pay and Specialty
Licensee Licensee Ultimate Owner Type Year
TV5 Québec Canada TV5 Québec Canada Specialty (category A service) 2015
Total Remuneration ($) 5.1
Average Staff CountAverage Remuneration ($) 5.8
Investment in ProgrammingTotal Canadian Programming 27.1
Canadian Programming/Revenue (%)
Acquisition of rights 28.7
Script & concept -23.3
Filler Programming + Program Production 21.6
Adjustments - Gain (Loss)
Pre-tax Profit
Canadian Programming Expenses
Depreciation -6.5
P.B.I.T.
Interest Expense
Administration and General 1.5
Total Expenses 17.6
Operating Income
P.B.I.T. MarginPre-tax MarginCAGR = Compound Annual Growth Rate
Subscribers 9.7
Profitability (%)Operating Margin
Page 239

Undertaking # Service Name
535429486 TVA Sports
2011 2012 Var % 2013 Var % 2014 Var % 2015 Var %
y2 y3 y4 y5
5,418,437 8,718,098 60.90 10,128,863 16.18 41,618,016 310.89
2,752,074 4,107,034 49.23 4,509,017 9.79 15,372,046 240.92
0 0 0 0
2,170,240 1,985,084 -8.53 1,721,933 -13.26 21,123,586 >999±
515,259 209,947 -59.25 200,403 -4.55 3,672,498 >999±
10,856,010 15,020,163 38.36 16,560,216 10.25 81,786,146 393.87
24,668,700 26,165,950 6.07 27,785,487 6.19 105,228,662 278.72
2,631,034 3,999,164 52.00 3,236,432 -19.07 5,298,786 63.72
2,457,465 2,479,552 0.90 1,761,263 -28.97 6,381,645 262.33
1,262,526 993,112 -21.34 1,065,764 7.32 2,310,736 116.81
31,019,725 33,637,778 8.44 33,848,946 0.63 119,219,829 252.21
-20,163,715 -18,617,615 -17,288,730 -37,433,683
300,000 300,000 0.00 1,500,000 400.00 1,500,000 0.00
-20,463,715 -18,917,615 -18,788,730 -38,933,683
224,887 230,934 2.69 429,002 85.77 295,591 -31.10
0 0 0 0
-20,688,602 -19,148,549 -19,217,732 -39,229,274
6,709,864 5,686,972 -15.24 5,644,294 -0.75 73,724,655 >999±
0 0 0 0
17,068,236 19,368,854 13.48 20,656,674 6.65 28,759,244 39.22
0 0 0 0
23,778,100 25,055,826 5.37 26,300,968 4.97 102,483,899 289.66
219.03 166.81 158.82 125.31
7,576,429 6,317,762 -16.61 6,745,877 6.78 8,090,977 19.94
67 69 2.99 72 4.35 83 15.28
113,081 91,562 -19.03 93,693 2.33 97,482 4.04
1,639,336 1,523,946 -7.04 1,668,891 9.51 1,995,904 19.59
-185.7 -124.0 -104.4 -45.8
-188.5 -125.9 -113.5 -47.6
-190.6 -127.5 -116.0 -48.0
DTH revenueLocal advertising revenueNational advertising revenue
($) CAGR (%)
RevenueResidential/bulk/smatv subscriber revenue
Pay and Specialty
Licensee Licensee Ultimate Owner Type Year
Groupe TVA inc. Les Placements Péladeau inc. Specialty (category C service) 2015
CRTC - FINANCIAL SUMMARY - PAY & SPECIALTY
Acquisition of rightsScript & conceptFiller Programming + Program Production
Adjustments - Gain (Loss)
Pre-tax Profit
Canadian Programming Expenses
Depreciation
P.B.I.T.
Interest Expense
Administration and GeneralTotal Expenses
Operating Income
Programming and ProductionTechnicalSales and Promotion
Other revenueTotal Revenue
Expenses
P.B.I.T. MarginPre-tax MarginCAGR = Compound Annual Growth Rate
Subscribers
Profitability (%)Operating Margin
Total Remuneration ($)Average Staff CountAverage Remuneration ($)
Investment in ProgrammingTotal Canadian Programming
Canadian Programming/Revenue (%)
Page 240

Undertaking # Service Name
535423082 Univision Canada (formerly TLN en
Español)
2011 2012 Var % 2013 Var % 2014 Var % 2015 Var %
y1 y2 y3 y4 y5
900,671 1,379,629 53.18 1,284,583 -6.89 1,484,905 15.59 1,423,529 -4.13
102,344 159,135 55.49 137,785 -13.42 93,851 -31.89 160,000 70.48
4,000 4,000 0.00 4,000 0.00 4,000 0.00 4,000 0.00
0 0 0 0 0
0 0 0 0 0
0 0 0 0 0
4,000 4,000 0.00 4,000 0.00 4,000 0.00 4,000 0.00
0.44 0.29 0.31 0.27 0.28
Pay and Specialty
Licensee Licensee Ultimate Owner Type Year
Telelatino Network Inc. Corus Entertainment Inc. Specialty (category B service) 2015
CRTC - FINANCIAL SUMMARY - PAY & SPECIALTY
Depreciation
P.B.I.T.
Interest Expense
Administration and GeneralTotal Expenses
Operating Income
Programming and Production 11.8
TechnicalSales and Promotion
Other revenueTotal Revenue 12.1
Expenses
DTH revenueLocal advertising revenueNational advertising revenue
($) CAGR (%)
RevenueResidential/bulk/smatv subscriber revenue
P.B.I.T. MarginPre-tax MarginCAGR = Compound Annual Growth Rate
Subscribers
Profitability (%)Operating Margin
Total Remuneration ($)Average Staff CountAverage Remuneration ($)
Investment in ProgrammingTotal Canadian Programming 0.0
Canadian Programming/Revenue (%)
Acquisition of rights 0.0
Script & conceptFiller Programming + Program Production
Adjustments - Gain (Loss)
Pre-tax Profit
Canadian Programming Expenses
Page 241

Undertaking # Service Name
535429444 UTV Movies
2011 2012 Var % 2013 Var % 2014 Var % 2015 Var %
y2 y3 y4 y5
1,743 1,738 -0.29 0 -100.00 0
0 1,477 0 -100.00 0
0 0 0 0
0 0 0 0
0 0 0 0
0 0 0 0
0 0 0 0
0.00 0.00
CRTC - FINANCIAL SUMMARY - PAY & SPECIALTY
Programming and ProductionTechnicalSales and Promotion
Other revenueTotal Revenue
Expenses
DTH revenueLocal advertising revenueNational advertising revenue
($) CAGR (%)
RevenueResidential/bulk/smatv subscriber revenue
Pay and Specialty
Licensee Licensee Ultimate Owner Type Year
Soundview Entertainment Inc. Soundview Broadcasting Canada Ltd. Specialty (category B service) 2015
Total Remuneration ($)Average Staff CountAverage Remuneration ($)
Investment in ProgrammingTotal Canadian Programming
Canadian Programming/Revenue (%)
Acquisition of rightsScript & conceptFiller Programming + Program Production
Adjustments - Gain (Loss)
Pre-tax Profit
Canadian Programming Expenses
Depreciation
P.B.I.T.
Interest Expense
Administration and GeneralTotal Expenses
Operating Income
P.B.I.T. MarginPre-tax MarginCAGR = Compound Annual Growth Rate
Subscribers
Profitability (%)Operating Margin
Page 242

Undertaking # Service Name
305424012 Viceland (formerly The Biography
Channel)
2011 2012 Var % 2013 Var % 2014 Var % 2015 Var %
y1 y2 y3 y4 y5
3,558,066 3,723,170 4.64 3,919,228 5.27 3,651,938 -6.82 3,546,854 -2.88
3,616,061 3,450,776 -4.57 3,114,199 -9.75 2,889,882 -7.20 2,209,754 -23.53
0 0 0 0 0
796,206 972,522 22.14 1,144,620 17.70 813,417 -28.94 603,757 -25.78
36,050 0 -100.00 0 1 0 -100.00
8,006,383 8,146,468 1.75 8,178,047 0.39 7,355,238 -10.06 6,360,365 -13.53
4,826,070 4,172,314 -13.55 4,437,926 6.37 4,100,427 -7.60 4,823,960 17.65
557,781 549,663 -1.46 605,242 10.11 599,930 -0.88 585,241 -2.45
160,647 64,328 -59.96 94,232 46.49 57,922 -38.53 59,678 3.03
945,370 721,703 -23.66 785,150 8.79 535,995 -31.73 650,324 21.33
6,489,868 5,508,008 -15.13 5,922,550 7.53 5,294,274 -10.61 6,119,203 15.58
1,516,515 2,638,460 2,255,497 2,060,964 241,162
3,693 3,392 -8.15 3,861 13.83 4,490 16.29 4,224 -5.92
1,512,822 2,635,068 2,251,636 2,056,474 236,938
634 712 12.30 272 -61.80 516 89.71 0 -100.00
-196,429 0 -100.00 0 0 0
1,315,759 2,634,356 2,251,364 2,055,958 236,938
2,367,209 1,576,932 -33.38 1,878,489 19.12 2,322,976 23.66 4,057,383 74.66
0 0 0 0 0
1,242,816 1,306,829 5.15 1,441,341 10.29 1,040,907 -27.78 0 -100.00
0 0 0 0 0
3,610,025 2,883,761 -20.12 3,319,830 15.12 3,363,883 1.33 4,057,383 20.62
45.09 35.40 40.59 45.73 63.79
1,843,098 1,275,952 -30.77 1,177,754 -7.70 868,895 -26.22 483,127 -44.40
17 17 0.00 16 -5.88 13 -18.75 8.76 -32.62
108,418 75,056 -30.77 73,610 -1.93 66,838 -9.20 55,151 -17.48
2,289,042 2,247,080 -1.83 2,140,000 -4.77 1,986,000 -7.20 1,632,000 -17.82
18.9 32.4 27.6 28.0 3.8
18.9 32.3 27.5 28.0 3.7
16.4 32.3 27.5 28.0 3.7
Pay and Specialty
Licensee Licensee Ultimate Owner Type Year
Rogers Media Inc. Rogers Communications Inc. Specialty (category A service) 2015
CRTC - FINANCIAL SUMMARY - PAY & SPECIALTY
Depreciation 3.4
P.B.I.T.
Interest Expense
Administration and General -8.9
Total Expenses -1.5
Operating Income
Programming and Production 0.0
Technical 1.2
Sales and Promotion -21.9
Other revenue -100.0
Total Revenue -5.6
Expenses
DTH revenue -11.6
Local advertising revenueNational advertising revenue -6.7
($) CAGR (%)
RevenueResidential/bulk/smatv subscriber revenue -0.1
P.B.I.T. MarginPre-tax MarginCAGR = Compound Annual Growth Rate
Subscribers -8.1
Profitability (%)Operating Margin
Total Remuneration ($) -28.5
Average Staff CountAverage Remuneration ($) -15.6
Investment in ProgrammingTotal Canadian Programming 3.0
Canadian Programming/Revenue (%)
Acquisition of rights 14.4
Script & conceptFiller Programming + Program Production -100.0
Adjustments - Gain (Loss)
Pre-tax Profit
Canadian Programming Expenses
Page 243

Undertaking # Service Name
315405639 Viewer's Choice Canada (PPV)
2011 2012 Var % 2013 Var % 2014 Var % 2015 Var %
y1 y2 y3 y4 y5
17,118,056 13,710,763 -19.90 12,456,669 -9.15 10,106,861 -18.86 0 -100.00
0 0 0 0 0
0 0 0 0 0
0 0 0 0 0
0 0 0 0 331,981
17,118,056 13,710,763 -19.90 12,456,669 -9.15 10,106,861 -18.86 331,981 -96.72
12,006,025 9,622,580 -19.85 9,021,048 -6.25 7,408,229 -17.88 136,630 -98.16
1,100,198 1,066,213 -3.09 999,028 -6.30 2,580,590 158.31 58,519 -97.73
189,855 207,608 9.35 176,061 -15.20 216,596 23.02 0 -100.00
909,144 755,210 -16.93 640,170 -15.23 499,642 -21.95 81,536 -83.68
14,205,222 11,651,611 -17.98 10,836,307 -7.00 10,705,057 -1.21 276,685 -97.42
2,912,834 2,059,152 1,620,362 -598,196 55,296
87,722 59,426 -32.26 157 -99.74 101,394 >999± 9,375 -90.75
2,825,112 1,999,726 1,620,205 -699,590 45,921
0 0 0 0 -4,989
75,136 16,336 -78.26 13,234 -18.99 20,566 55.40 0 -100.00
2,900,248 2,016,062 1,633,439 -679,024 50,910
193,833 18,812 -90.29 23,653 25.73 145,254 514.10 0 -100.00
0 0 0 0 15,543
406,872 406,872 0.00 406,872 0.00 463,297 13.87 0 -100.00
855,903 685,538 -19.90 621,794 -9.30 506,382 -18.56 0 -100.00
1,456,608 1,111,222 -23.71 1,052,319 -5.30 1,114,933 5.95 15,543 -98.61
8.51 8.10 8.45 11.03 4.68
410,117 313,072 -23.66 271,931 -13.14 246,613 -9.31 22,557 -90.85
4.75 4 -15.79 3.5 -12.50 2.75 -21.43 0.25 -90.91
86,340 78,268 -9.35 77,695 -0.73 89,677 15.42 90,228 0.61
2,276,479 2,314,089 1.65 2,354,869 1.76 2,521,105 7.06 0 -100.00
17.0 15.0 13.0 -5.9 16.7
16.5 14.6 13.0 -6.9 13.8
16.9 14.7 13.1 -6.7 15.3
Pay and Specialty
Licensee Licensee Ultimate Owner Type Year
Viewer's Choice Canada Inc. BCE Inc. Pay-per-view programming 2015
CRTC - FINANCIAL SUMMARY - PAY & SPECIALTY
Depreciation -42.8
P.B.I.T.
Interest Expense
Administration and General -45.3
Total Expenses -62.6
Operating Income
Programming and Production -67.3
Technical -52.0
Sales and Promotion -100.0
Other revenueTotal Revenue -62.7
Expenses
DTH revenueLocal advertising revenueNational advertising revenue
($) CAGR (%)
RevenueResidential/bulk/smatv subscriber revenue -100.0
P.B.I.T. MarginPre-tax MarginCAGR = Compound Annual Growth Rate
Subscribers -100.0
Profitability (%)Operating Margin
Total Remuneration ($) -51.6
Average Staff CountAverage Remuneration ($) 1.1
Investment in Programming -100.0
Total Canadian Programming -67.9
Canadian Programming/Revenue (%)
Acquisition of rights -100.0
Script & conceptFiller Programming + Program Production -100.0
Adjustments - Gain (Loss)
Pre-tax Profit
Canadian Programming Expenses
Page 244

Undertaking # Service Name
314600834 Vision TV
2011 2012 Var % 2013 Var % 2014 Var % 2015 Var %
y1 y2 y3 y4 y5
8,656,002 8,751,665 1.11 8,549,500 -2.31 8,524,892 -0.29 8,191,013 -3.92
3,092,435 3,147,475 1.78 3,067,900 -2.53 3,064,310 -0.12 3,041,290 -0.75
0 0 0 0 0
4,684,672 5,257,703 12.23 6,325,201 20.30 6,097,611 -3.60 5,897,268 -3.29
9,611,338 9,561,680 -0.52 9,660,371 1.03 9,572,488 -0.91 8,539,732 -10.79
26,044,447 26,718,523 2.59 27,602,972 3.31 27,259,301 -1.25 25,669,303 -5.83
20,055,496 11,584,854 -42.24 13,430,464 15.93 17,157,657 27.75 15,557,714 -9.32
1,318,472 1,189,393 -9.79 1,089,234 -8.42 951,979 -12.60 991,598 4.16
1,263,972 997,656 -21.07 603,049 -39.55 517,012 -14.27 406,841 -21.31
2,437,751 3,761,284 54.29 1,164,491 -69.04 1,243,459 6.78 1,320,717 6.21
25,075,691 17,533,187 -30.08 16,287,238 -7.11 19,870,107 22.00 18,276,870 -8.02
968,756 9,185,336 11,315,734 7,389,194 7,392,433
1,244,202 2,376,795 91.03 790,798 -66.73 555,740 -29.72 278,022 -49.97
-275,446 6,808,541 10,524,936 6,833,454 7,114,411
700,559 300,102 -57.16 78,372 -73.88 20,148 -74.29 15,229 -24.41
0 0 0 0 0
-976,005 6,508,439 10,446,564 6,813,306 7,099,182
16,517,701 7,985,484 -51.65 9,777,721 22.44 13,797,651 41.11 11,445,304 -17.05
28,253 0 -100.00 -21,816 12,000 -155.01 85,280 610.67
598,274 680,181 13.69 698,183 2.65 729,795 4.53 755,436 3.51
0 0 0 0 0
17,144,228 8,665,665 -49.45 10,454,088 20.64 14,539,446 39.08 12,286,020 -15.50
65.83 32.43 37.87 53.34 47.86
4,663,936 3,939,605 -15.53 4,334,346 10.02 1,177,035 -72.84 1,152,157 -2.11
60 60 0.00 60 0.00 53 -11.67 72 35.85
77,732 65,660 -15.53 72,239 10.02 22,208 -69.26 16,002 -27.94
9,325,802 9,411,698 0.92 9,346,386 -0.69 9,371,194 0.27 9,079,505 -3.11
3.7 34.4 41.0 27.1 28.8
-1.1 25.5 38.1 25.1 27.7
-3.7 24.4 37.8 25.0 27.7
CRTC - FINANCIAL SUMMARY - PAY & SPECIALTY
Programming and Production -6.2
Technical -6.9
Sales and Promotion -24.7
Other revenue -2.9
Total Revenue -0.4
Expenses
DTH revenue -0.4
Local advertising revenueNational advertising revenue 5.9
($) CAGR (%)
RevenueResidential/bulk/smatv subscriber revenue -1.4
Pay and Specialty
Licensee Licensee Ultimate Owner Type Year
ZoomerMedia Limited Olympus Management Limited Specialty (category A service) 2015
Total Remuneration ($) -29.5
Average Staff CountAverage Remuneration ($) -32.6
Investment in ProgrammingTotal Canadian Programming -8.0
Canadian Programming/Revenue (%)
Acquisition of rights -8.8
Script & concept 31.8
Filler Programming + Program Production 6.0
Adjustments - Gain (Loss)
Pre-tax Profit
Canadian Programming Expenses
Depreciation -31.3
P.B.I.T.
Interest Expense
Administration and General -14.2
Total Expenses -7.6
Operating Income
P.B.I.T. MarginPre-tax MarginCAGR = Compound Annual Growth Rate
Subscribers -0.7
Profitability (%)Operating Margin
Page 245

Undertaking # Service Name
535426169 Vivid TV (formerly Vanessa)
2011 2012 Var % 2013 Var % 2014 Var % 2015 Var %
y1 y2 y3 y4 y5
305,538 581,836 90.43 523,711 -9.99 554,632 5.90 675,585 21.81
0 0 0 0 0
0 0 0 0 0
0 0 0 0 0
394,358 231,955 -41.18 72,157 -68.89 97,231 34.75 170,152 75.00
699,896 813,791 16.27 595,868 -26.78 651,863 9.40 845,737 29.74
646,361 895,539 38.55 291,267 -67.48 154,473 -46.97 175,568 13.66
365,306 193,573 -47.01 210,346 8.66 228,800 8.77 272,285 19.01
504,418 206,404 -59.08 22,301 -89.20 39,177 75.67 63,233 61.40
596,279 374,888 -37.13 96,529 -74.25 120,664 25.00 156,339 29.57
2,112,364 1,670,404 -20.92 620,443 -62.86 543,114 -12.46 667,425 22.89
-1,412,468 -856,613 -24,575 108,749 178,312
16,705 22,168 32.70 15,744 -28.98 4,742 -69.88 2,425 -48.86
-1,429,173 -878,781 -40,319 104,007 175,887
19,690 73,502 273.30 50,160 -31.76 51,353 2.38 36,705 -28.52
5,086 98 -98.07 0 -100.00 0 1,200
-1,443,777 -952,185 -90,479 52,654 140,382
22,389 70,517 214.96 95,348 35.21 31,293 -67.18 90,735 189.95
0 0 0 0 0
472,989 678,783 43.51 0 -100.00 0 0
0 0 123,449 71,454 -42.12 32,327 -54.76
495,378 749,300 51.26 218,797 -70.80 102,747 -53.04 123,062 19.77
70.78 92.08 36.72 15.76 14.55
842,058 723,388 -14.09 106,216 -85.32 125,932 18.56 171,198 35.94
9 6 -33.33 3 -50.00 3.25 8.33 3.5 7.69
93,562 120,565 28.86 35,405 -70.63 38,748 9.44 48,914 26.23
6,790 6,120 -9.87 5,402 -11.73 6,413 18.72 8,420 31.30
-201.8 -105.3 -4.1 16.7 21.1
-204.2 -108.0 -6.8 16.0 20.8
-206.3 -117.0 -15.2 8.1 16.6
DTH revenueLocal advertising revenueNational advertising revenue
($) CAGR (%)
RevenueResidential/bulk/smatv subscriber revenue 21.9
Pay and Specialty
Licensee Licensee Ultimate Owner Type Year
Télévision Sex-Shop inc. Trudeau, Marc Pay-TV (category B service) 2015
CRTC - FINANCIAL SUMMARY - PAY & SPECIALTY
Acquisition of rights 41.9
Script & conceptFiller Programming + Program Production -100.0
Adjustments - Gain (Loss)
Pre-tax Profit
Canadian Programming Expenses
Depreciation -38.3
P.B.I.T.
Interest Expense
Administration and General -28.4
Total Expenses -25.0
Operating Income
Programming and Production -27.8
Technical -7.1
Sales and Promotion -40.5
Other revenue -19.0
Total Revenue 4.9
Expenses
P.B.I.T. MarginPre-tax MarginCAGR = Compound Annual Growth Rate
Subscribers 5.5
Profitability (%)Operating Margin
Total Remuneration ($) -32.9
Average Staff CountAverage Remuneration ($) -15.0
Investment in ProgrammingTotal Canadian Programming -29.4
Canadian Programming/Revenue (%)
Page 246

Undertaking # Service Name
214301111 VRAK.TV
2011 2012 Var % 2013 Var % 2014 Var % 2015 Var %
y1 y2 y3 y4 y5
15,678,859 15,406,926 -1.73 15,941,743 3.47 15,072,296 -5.45 16,207,297 7.53
5,537,634 6,536,241 18.03 6,169,147 -5.62 6,152,281 -0.27 5,124,421 -16.71
0 0 0 0 0
6,638,973 5,841,903 -12.01 6,485,335 11.01 5,411,604 -16.56 4,772,048 -11.82
0 0 0 0 23,707
27,855,466 27,785,070 -0.25 28,596,225 2.92 26,636,181 -6.85 26,127,473 -1.91
12,059,204 12,444,596 3.20 12,665,426 1.77 14,438,467 14.00 15,091,964 4.53
933,319 853,156 -8.59 959,665 12.48 385,104 -59.87 484,299 25.76
1,727,313 1,856,483 7.48 2,590,980 39.56 2,579,854 -0.43 2,403,299 -6.84
1,714,225 1,757,566 2.53 1,986,125 13.00 2,191,621 10.35 1,200,833 -45.21
16,434,061 16,911,801 2.91 18,202,196 7.63 19,595,046 7.65 19,180,395 -2.12
11,421,405 10,873,269 10,394,029 7,041,135 6,947,078
90,681 93,869 3.52 221,238 135.69 448,083 102.53 741,043 65.38
11,330,724 10,779,400 10,172,791 6,593,052 6,206,035
0 0 0 61,672 104,160 68.89
254,798 234,797 -7.85 166,583 -29.05 5,878 -96.47 -176,278 >999±
11,585,522 11,014,197 10,339,374 6,537,258 5,925,597
7,539,246 8,169,890 8.36 7,946,878 -2.73 8,662,211 9.00 9,624,267 11.11
165,567 81,750 -50.62 151,408 85.21 238,061 57.23 167,148 -29.79
1,829,175 1,637,048 -10.50 1,901,632 16.16 3,015,602 58.58 2,591,288 -14.07
0 0 0 0 0
9,533,988 9,888,688 3.72 9,999,918 1.12 11,915,874 19.16 12,382,703 3.92
34.23 35.59 34.97 44.74 47.39
3,085,993 3,043,413 -1.38 3,166,811 4.05 2,357,267 -25.56 2,897,658 22.92
26 29 11.54 29 0.00 23 -20.69 28 21.74
118,692 104,945 -11.58 109,200 4.05 102,490 -6.15 103,488 0.97
2,504,363 2,381,782 -4.89 2,200,643 -7.61 2,051,898 -6.76 2,107,727 2.72
41.0 39.1 36.3 26.4 26.6
40.7 38.8 35.6 24.8 23.8
41.6 39.6 36.2 24.5 22.7
Pay and Specialty
Licensee Licensee Ultimate Owner Type Year
Bell Media Inc. BCE Inc. Specialty (category A service) 2015
CRTC - FINANCIAL SUMMARY - PAY & SPECIALTY
Depreciation 69.1
P.B.I.T.
Interest Expense
Administration and General -8.5
Total Expenses 3.9
Operating Income
Programming and Production 5.8
Technical -15.1
Sales and Promotion 8.6
Other revenueTotal Revenue -1.6
Expenses
DTH revenue -1.9
Local advertising revenueNational advertising revenue -7.9
($) CAGR (%)
RevenueResidential/bulk/smatv subscriber revenue 0.8
P.B.I.T. MarginPre-tax MarginCAGR = Compound Annual Growth Rate
Subscribers -4.2
Profitability (%)Operating Margin
Total Remuneration ($) -1.6
Average Staff CountAverage Remuneration ($) -3.4
Investment in ProgrammingTotal Canadian Programming 6.8
Canadian Programming/Revenue (%)
Acquisition of rights 6.3
Script & concept 0.2
Filler Programming + Program Production 9.1
Adjustments - Gain (Loss)
Pre-tax Profit
Canadian Programming Expenses
Page 247

Undertaking # Service Name
535417720 Westman Media Cooperative Ltd.,
Brandon
2011 2012 Var % 2013 Var % 2014 Var % 2015 Var %
y1
0
0
0
0
307,536 -100.00
307,536 -100.00
263,397 -100.00
0
0
0
263,397 -100.00
44,139
0
44,139
0
0
44,139
0
0
0
0
0
0.00
0
0
14.4
14.4
14.4
CRTC - FINANCIAL SUMMARY - PAY & SPECIALTY
Programming and ProductionTechnicalSales and Promotion
Other revenueTotal Revenue
Expenses
DTH revenueLocal advertising revenueNational advertising revenue
($) CAGR (%)
RevenueResidential/bulk/smatv subscriber revenue
Pay and Specialty
Licensee Licensee Ultimate Owner Type Year
Westman Media Cooperative Ltd. Westman Media Cooperative Ltd. Video-on-Demand 2011
Total Remuneration ($)Average Staff CountAverage Remuneration ($)
Investment in ProgrammingTotal Canadian Programming
Canadian Programming/Revenue (%)
Acquisition of rightsScript & conceptFiller Programming + Program Production
Adjustments - Gain (Loss)
Pre-tax Profit
Canadian Programming Expenses
Depreciation
P.B.I.T.
Interest Expense
Administration and GeneralTotal Expenses
Operating Income
P.B.I.T. MarginPre-tax MarginCAGR = Compound Annual Growth Rate
Subscribers
Profitability (%)Operating Margin
Page 248

Undertaking # Service Name
535426937 Wightman Telecom Ltd., Clifford
2011 2012 Var % 2013 Var % 2014 Var % 2015 Var %
y1 y2 y3 y4 y5
3,627 39,351 984.95 46,705 18.69 51,714 10.72 52,403 1.33
0 0 0 0 0
0 0 0 0 0
0 0 0 0 0
0 0 0 0 0
3,627 39,351 984.95 46,705 18.69 51,714 10.72 52,403 1.33
2,484 29,530 >999± 32,546 10.21 33,743 3.68 29,961 -11.21
0 0 7,800 7,987 2.40 7,987 0.00
0 0 0 0 0
0 0 0 0 0
2,484 29,530 >999± 40,346 36.63 41,730 3.43 37,948 -9.06
1,143 9,821 6,359 9,984 14,455
0 0 0 0 9,984
1,143 9,821 6,359 9,984 4,471
0 0 0 0 0
0 0 0 0 0
1,143 9,821 6,359 9,984 4,471
0 0 0 0 0
0 0 0 0 0
0 0 0 0 0
0 0 0 0 0
0 0 0 0 0
0.00 0.00 0.00 0.00 0.00
0 7,800 7,800 0.00 7,987 2.40 7,987 0.00
0 0.1 0.5 400.00 0.5 0.00 0.5 0.00
78,000 15,600 -80.00 15,974 2.40 15,974 0.00
31.5 25.0 13.6 19.3 27.6
31.5 25.0 13.6 19.3 8.5
31.5 25.0 13.6 19.3 8.5
DTH revenueLocal advertising revenueNational advertising revenue
($) CAGR (%)
RevenueResidential/bulk/smatv subscriber revenue 95.0
Pay and Specialty
Licensee Licensee Ultimate Owner Type Year
Wightman Telecom Ltd. Wightman Holdings Inc. Video-on-Demand 2015
CRTC - FINANCIAL SUMMARY - PAY & SPECIALTY
Acquisition of rightsScript & conceptFiller Programming + Program Production
Adjustments - Gain (Loss)
Pre-tax Profit
Canadian Programming Expenses
Depreciation
P.B.I.T.
Interest Expense
Administration and GeneralTotal Expenses 97.7
Operating Income
Programming and Production 86.4
TechnicalSales and Promotion
Other revenueTotal Revenue 95.0
Expenses
P.B.I.T. MarginPre-tax MarginCAGR = Compound Annual Growth Rate
Subscribers
Profitability (%)Operating Margin
Total Remuneration ($)Average Staff CountAverage Remuneration ($)
Investment in ProgrammingTotal Canadian Programming
Canadian Programming/Revenue (%)
Page 249

Undertaking # Service Name
535417118 Wild tv (The Hunting Channel)
2011 2012 Var % 2013 Var % 2014 Var % 2015 Var %
y1 y2 y3 y4 y5
6,857,361 6,550,125 -4.48 6,082,147 -7.14 6,407,699 5.35 6,087,038 -5.00
2,482,080 3,109,552 25.28 2,213,178 -28.83 2,320,334 4.84 2,920,833 25.88
0 0 27,340 70,010 156.07 800,500 >999±
0 0 0 0 0
0 0 0 0 0
964,080 1,316,850 36.59 1,235,355 -6.19 1,361,376 10.20 1,132,838 -16.79
964,080 1,316,850 36.59 1,262,695 -4.11 1,431,386 13.36 1,933,338 35.07
14.06 20.10 20.76 22.34 31.76
Pay and Specialty
Licensee Licensee Ultimate Owner Type Year
Wild TV Inc. Kohler, Dieter Specialty (category B service) 2015
CRTC - FINANCIAL SUMMARY - PAY & SPECIALTY
Depreciation
P.B.I.T.
Interest Expense
Administration and GeneralTotal Expenses
Operating Income
Programming and Production 4.2
TechnicalSales and Promotion
Other revenueTotal Revenue -2.9
Expenses
DTH revenueLocal advertising revenueNational advertising revenue
($) CAGR (%)
RevenueResidential/bulk/smatv subscriber revenue
P.B.I.T. MarginPre-tax MarginCAGR = Compound Annual Growth Rate
Subscribers
Profitability (%)Operating Margin
Total Remuneration ($)Average Staff CountAverage Remuneration ($)
Investment in Programming 4.1
Total Canadian Programming 19.0
Canadian Programming/Revenue (%)
Acquisition of rightsScript & conceptFiller Programming + Program Production
Adjustments - Gain (Loss)
Pre-tax Profit
Canadian Programming Expenses
Page 250

Undertaking # Service Name
535433643 WIN TV (formerly Caribbean HDTV)
2011 2012 Var % 2013 Var % 2014 Var % 2015 Var %
y4
10,717 -100.00
5,292 -100.00
5,292 -100.00
0
0
0
5,292 -100.00
49.38
CRTC - FINANCIAL SUMMARY - PAY & SPECIALTY
Programming and ProductionTechnicalSales and Promotion
Other revenueTotal Revenue
Expenses
DTH revenueLocal advertising revenueNational advertising revenue
($) CAGR (%)
RevenueResidential/bulk/smatv subscriber revenue
Pay and Specialty
Licensee Licensee Ultimate Owner Type Year
WIN HDTV (Canada) Incorporated Bola, Bhupinder (Pip) Specialty (category B service) 2014
Total Remuneration ($)Average Staff CountAverage Remuneration ($)
Investment in ProgrammingTotal Canadian Programming
Canadian Programming/Revenue (%)
Acquisition of rightsScript & conceptFiller Programming + Program Production
Adjustments - Gain (Loss)
Pre-tax Profit
Canadian Programming Expenses
Depreciation
P.B.I.T.
Interest Expense
Administration and GeneralTotal Expenses
Operating Income
P.B.I.T. MarginPre-tax MarginCAGR = Compound Annual Growth Rate
Subscribers
Profitability (%)Operating Margin
Page 251

Undertaking # Service Name
305427636 W Movies (formerly SexTV: The Channel)
2011 2012 Var % 2013 Var % 2014 Var % 2015 Var %
y1 y2 y3 y4 y5
5,836,876 6,458,378 10.65 7,413,357 14.79 7,650,029 3.19 7,012,101 -8.34
2,866,993 3,221,497 12.37 3,007,213 -6.65 2,850,231 -5.22 3,549,225 24.52
846,129 866,765 2.44 686,391 -20.81 582,674 -15.11 808,587 38.77
8,593 54,088 529.44 53,922 -0.31 28,087 -47.91 43,754 55.78
241,542 398,830 65.12 400,271 0.36 345,057 -13.79 429,807 24.56
0 0 0 0 45,000
1,096,264 1,319,683 20.38 1,140,584 -13.57 955,818 -16.20 1,327,148 38.85
18.78 20.43 15.39 12.49 18.93
DTH revenueLocal advertising revenueNational advertising revenue
($) CAGR (%)
RevenueResidential/bulk/smatv subscriber revenue
Pay and Specialty
Licensee Licensee Ultimate Owner Type Year
7202377 Canada Inc. Corus Entertainment Inc. Specialty (category B service) 2015
CRTC - FINANCIAL SUMMARY - PAY & SPECIALTY
Acquisition of rights -1.1
Script & concept 50.2
Filler Programming + Program Production 15.5
Adjustments - Gain (Loss)
Pre-tax Profit
Canadian Programming Expenses
Depreciation
P.B.I.T.
Interest Expense
Administration and GeneralTotal Expenses
Operating Income
Programming and Production 5.5
TechnicalSales and Promotion
Other revenueTotal Revenue 4.7
Expenses
P.B.I.T. MarginPre-tax MarginCAGR = Compound Annual Growth Rate
Subscribers
Profitability (%)Operating Margin
Total Remuneration ($)Average Staff CountAverage Remuneration ($)
Investment in ProgrammingTotal Canadian Programming 4.9
Canadian Programming/Revenue (%)
Page 252

Undertaking # Service Name
415413806 W Network
2011 2012 Var % 2013 Var % 2014 Var % 2015 Var %
y1 y2 y3 y4 y5
23,591,545 22,521,445 -4.54 22,325,812 -0.87 20,739,105 -7.11 20,110,221 -3.03
8,695,246 8,048,896 -7.43 6,930,451 -13.90 7,038,076 1.55 7,126,427 1.26
0 0 0 0 0
54,029,550 56,825,514 5.17 61,223,657 7.74 52,869,152 -13.65 51,937,166 -1.76
760,275 697,028 -8.32 702,719 0.82 760,975 8.29 688,354 -9.54
87,076,616 88,092,883 1.17 91,182,639 3.51 81,407,308 -10.72 79,862,168 -1.90
31,831,706 33,930,226 6.59 35,268,781 3.95 34,194,697 -3.05 36,551,418 6.89
1,011,163 870,133 -13.95 793,286 -8.83 740,544 -6.65 665,035 -10.20
6,462,997 6,659,736 3.04 6,350,570 -4.64 3,076,724 -51.55 2,874,534 -6.57
9,971,807 9,055,706 -9.19 7,231,723 -20.14 4,925,170 -31.89 2,303,951 -53.22
49,277,673 50,515,801 2.51 49,644,360 -1.73 42,937,135 -13.51 42,394,938 -1.26
37,798,943 37,577,082 41,538,279 38,470,173 37,467,230
6,172 1,844,514 >999± 2,030,597 10.09 1,376,073 -32.23 1,256,629 -8.68
37,792,771 35,732,568 39,507,682 37,094,100 36,210,601
363,825 445,801 22.53 460,258 3.24 420,307 -8.68 296,689 -29.41
-22,484,343 1,108,884 -104.93 781,774 -29.50 1,827,800 133.80 2,759,577 50.98
14,944,603 36,395,651 39,829,198 38,501,593 38,673,489
21,352,968 22,574,939 5.72 25,235,727 11.79 24,901,786 -1.32 23,621,192 -5.14
354,116 529,707 49.59 561,818 6.06 786,740 40.03 1,097,824 39.54
1,435,003 2,135,715 48.83 2,262,570 5.94 1,936,555 -14.41 1,958,050 1.11
1,465,813 1,420,861 -3.07 398,250 -71.97 439,985 10.48 2,739,602 522.66
24,607,900 26,661,222 8.34 28,458,365 6.74 28,065,066 -1.38 29,416,668 4.82
28.26 30.26 31.21 34.47 36.83
6,062,828 3,693,609 -39.08 2,032,621 -44.97 1,602,619 -21.16 864,914 -46.03
78 71 -8.97 58 -18.31 46 -20.69 58 26.09
77,729 52,023 -33.07 35,045 -32.63 34,840 -0.59 14,912 -57.20
8,387,168 8,403,260 0.19 8,278,673 -1.48 7,928,149 -4.23 7,692,408 -2.97
43.4 42.7 45.6 47.3 46.9
43.4 40.6 43.3 45.6 45.3
17.2 41.3 43.7 47.3 48.4
Pay and Specialty
Licensee Licensee Ultimate Owner Type Year
W Network Inc. Corus Entertainment Inc. Specialty (category A service) 2015
CRTC - FINANCIAL SUMMARY - PAY & SPECIALTY
Depreciation 277.7
P.B.I.T.
Interest Expense
Administration and General -30.7
Total Expenses -3.7
Operating Income
Programming and Production 3.5
Technical -10.0
Sales and Promotion -18.3
Other revenue -2.5
Total Revenue -2.1
Expenses
DTH revenue -4.9
Local advertising revenueNational advertising revenue -1.0
($) CAGR (%)
RevenueResidential/bulk/smatv subscriber revenue -3.9
P.B.I.T. MarginPre-tax MarginCAGR = Compound Annual Growth Rate
Subscribers -2.1
Profitability (%)Operating Margin
Total Remuneration ($) -38.5
Average Staff CountAverage Remuneration ($) -33.8
Investment in Programming 16.9
Total Canadian Programming 4.6
Canadian Programming/Revenue (%)
Acquisition of rights 2.6
Script & concept 32.7
Filler Programming + Program Production 8.1
Adjustments - Gain (Loss)
Pre-tax Profit
Canadian Programming Expenses
Page 253

Undertaking # Service Name
535420393 World Fishing Network (WFN-TV)
2011 2012 Var % 2013 Var % 2014 Var % 2015 Var %
y1 y2 y3 y4 y5
1,802,168 1,943,368 7.84 1,993,441 2.58 2,293,249 15.04 2,172,450 -5.27
126,103 734,855 482.74 571,371 -22.25 744,636 30.32 782,731 5.12
31,158 150,731 383.76 302,140 100.45 449,080 48.63 422,320 -5.96
0 0 0 0 0
62,547 91,490 46.27 88,467 -3.30 0 -100.00 0
0 0 0 0 0
93,705 242,221 158.49 390,607 61.26 449,080 14.97 422,320 -5.96
5.20 12.46 19.59 19.58 19.44
CRTC - FINANCIAL SUMMARY - PAY & SPECIALTY
Programming and Production 57.8
TechnicalSales and Promotion
Other revenueTotal Revenue 4.8
Expenses
DTH revenueLocal advertising revenueNational advertising revenue
($) CAGR (%)
RevenueResidential/bulk/smatv subscriber revenue
Pay and Specialty
Licensee Licensee Ultimate Owner Type Year
World Fishing Network ULC Insight Sports Ltd. Specialty (category B service) 2015
Total Remuneration ($)Average Staff CountAverage Remuneration ($)
Investment in ProgrammingTotal Canadian Programming 45.7
Canadian Programming/Revenue (%)
Acquisition of rights 91.9
Script & conceptFiller Programming + Program Production -100.0
Adjustments - Gain (Loss)
Pre-tax Profit
Canadian Programming Expenses
Depreciation
P.B.I.T.
Interest Expense
Administration and GeneralTotal Expenses
Operating Income
P.B.I.T. MarginPre-tax MarginCAGR = Compound Annual Growth Rate
Subscribers
Profitability (%)Operating Margin
Page 254

Undertaking # Service Name
535429402 YOOPA (formerly TVA Junior)
2011 2012 Var % 2013 Var % 2014 Var % 2015 Var %
y1 y2 y3 y4 y5
1,186,313 2,021,542 70.41 2,990,129 47.91 1,992,677 -33.36 2,809,159 40.97
1,022,099 1,354,727 32.54 1,760,187 29.93 1,713,929 -2.63 1,226,002 -28.47
0 0 0 0 0
0 0 -8 0 -100.00 0
39,831 31,105 -21.91 19,506 -37.29 17,088 -12.40 0 -100.00
2,248,243 3,407,374 51.56 4,769,814 39.99 3,723,694 -21.93 4,035,161 8.36
2,100,097 2,132,641 1.55 2,821,206 32.29 3,230,019 14.49 3,430,436 6.20
484,548 667,527 37.76 428,738 -35.77 208,788 -51.30 88,727 -57.50
340,599 436,178 28.06 662,107 51.80 428,017 -35.36 321,726 -24.83
365,826 298,555 -18.39 233,487 -21.79 257,167 10.14 190,987 -25.73
3,291,070 3,534,901 7.41 4,145,538 17.27 4,123,991 -0.52 4,031,876 -2.23
-1,042,827 -127,527 624,276 -400,297 3,285
165,200 100,000 -39.47 100,000 0.00 100,000 0.00 100,000 0.00
-1,208,027 -227,527 524,276 -500,297 -96,715
155,800 156,417 0.40 160,623 2.69 127,555 -20.59 87,888 -31.10
0 0 0 0 0
-1,363,827 -383,944 363,653 -627,852 -184,603
1,433,595 1,525,860 6.44 2,031,913 33.17 2,399,655 18.10 2,602,438 8.45
0 0 0 0 0
0 0 0 0 0
0 0 0 0 0
1,433,595 1,525,860 6.44 2,031,913 33.17 2,399,655 18.10 2,602,438 8.45
63.77 44.78 42.60 64.44 64.49
162,162 344,563 112.48 162,011 -52.98 106,382 -34.34 244,691 130.01
3 3 0.00 2 -33.33 2 0.00 2.52 26.00
54,054 114,854 112.48 81,006 -29.47 53,191 -34.34 97,100 82.55
405,686 763,352 88.16 772,662 1.22 797,566 3.22 667,314 -16.33
-46.4 -3.7 13.1 -10.7 0.1
-53.7 -6.7 11.0 -13.4 -2.4
-60.7 -11.3 7.6 -16.9 -4.6
DTH revenue 4.7
Local advertising revenueNational advertising revenue
($) CAGR (%)
RevenueResidential/bulk/smatv subscriber revenue 24.1
Pay and Specialty
Licensee Licensee Ultimate Owner Type Year
Groupe TVA inc. Les Placements Péladeau inc. Specialty (category B service) 2015
CRTC - FINANCIAL SUMMARY - PAY & SPECIALTY
Acquisition of rights 16.1
Script & conceptFiller Programming + Program Production
Adjustments - Gain (Loss)
Pre-tax Profit
Canadian Programming Expenses
Depreciation -11.8
P.B.I.T.
Interest Expense
Administration and General -15.0
Total Expenses 5.2
Operating Income
Programming and Production 13.1
Technical -34.6
Sales and Promotion -1.4
Other revenue -100.0
Total Revenue 15.8
Expenses
P.B.I.T. MarginPre-tax MarginCAGR = Compound Annual Growth Rate
Subscribers 13.3
Profitability (%)Operating Margin
Total Remuneration ($) 10.8
Average Staff CountAverage Remuneration ($) 15.8
Investment in ProgrammingTotal Canadian Programming 16.1
Canadian Programming/Revenue (%)
Page 255

Undertaking # Service Name
314600842 YTV
2011 2012 Var % 2013 Var % 2014 Var % 2015 Var %
y1 y2 y3 y4 y5
27,753,955 27,738,341 -0.06 27,807,600 0.25 26,797,684 -3.63 26,074,530 -2.70
9,157,694 9,308,234 1.64 9,319,336 0.12 9,428,189 1.17 9,555,545 1.35
0 0 0 0 0
56,182,634 53,688,288 -4.44 52,143,910 -2.88 43,872,510 -15.86 37,799,089 -13.84
0 109,229 120,160 10.01 126,704 5.45 11,638 -90.81
93,094,283 90,844,092 -2.42 89,391,006 -1.60 80,225,087 -10.25 73,440,802 -8.46
32,192,854 34,949,428 8.56 34,237,292 -2.04 35,074,827 2.45 32,883,525 -6.25
2,194,112 2,167,207 -1.23 1,670,148 -22.94 1,291,272 -22.69 834,950 -35.34
9,132,816 7,870,211 -13.82 7,014,754 -10.87 1,813,414 -74.15 1,567,864 -13.54
11,468,487 10,769,742 -6.09 9,095,480 -15.55 5,888,790 -35.26 3,138,449 -46.70
54,988,269 55,756,588 1.40 52,017,674 -6.71 44,068,303 -15.28 38,424,788 -12.81
38,106,014 35,087,504 37,373,332 36,156,784 35,016,014
1,495,275 2,763,043 84.78 4,126,520 49.35 3,574,931 -13.37 4,228,257 18.28
36,610,739 32,324,461 33,246,812 32,581,853 30,787,757
6,618,019 1,242,173 -81.23 1,097,873 -11.62 1,017,145 -7.35 912,087 -10.33
19,607,706 14,671,413 -25.18 11,965,874 -18.44 73,213,175 511.85 -3,321,651 -104.54
49,600,426 45,753,701 44,114,813 104,777,883 26,554,019
20,850,795 23,781,537 14.06 23,188,198 -2.49 24,164,183 4.21 19,792,062 -18.09
411,518 424,917 3.26 494,338 16.34 842,901 70.51 1,158,440 37.43
1,748,655 2,537,080 45.09 2,704,756 6.61 2,237,037 -17.29 2,512,319 12.31
360,514 412,022 14.29 253,012 -38.59 307,177 21.41 1,872,474 509.57
23,371,482 27,155,556 16.19 26,640,304 -1.90 27,551,298 3.42 25,335,295 -8.04
25.11 29.89 29.80 34.34 34.50
8,468,172 7,323,528 -13.52 4,488,603 -38.71 2,694,787 -39.96 1,464,149 -45.67
107 115 7.48 101 -12.17 64 -36.63 74 15.63
79,142 63,683 -19.53 44,442 -30.21 42,106 -5.26 19,786 -53.01
11,236,887 11,315,638 0.70 11,230,697 -0.75 11,154,698 -0.68 11,118,204 -0.33
40.9 38.6 41.8 45.1 47.7
39.3 35.6 37.2 40.6 41.9
53.3 50.4 49.4 130.6 36.2
Pay and Specialty
Licensee Licensee Ultimate Owner Type Year
YTV Canada, Inc. Corus Entertainment Inc. Specialty (category A service) 2015
CRTC - FINANCIAL SUMMARY - PAY & SPECIALTY
Depreciation 29.7
P.B.I.T.
Interest Expense
Administration and General -27.7
Total Expenses -8.6
Operating Income
Programming and Production 0.5
Technical -21.5
Sales and Promotion -35.6
Other revenueTotal Revenue -5.8
Expenses
DTH revenue 1.1
Local advertising revenueNational advertising revenue -9.4
($) CAGR (%)
RevenueResidential/bulk/smatv subscriber revenue -1.6
P.B.I.T. MarginPre-tax MarginCAGR = Compound Annual Growth Rate
Subscribers -0.3
Profitability (%)Operating Margin
Total Remuneration ($) -35.5
Average Staff CountAverage Remuneration ($) -29.3
Investment in Programming 51.0
Total Canadian Programming 2.0
Canadian Programming/Revenue (%)
Acquisition of rights -1.3
Script & concept 29.5
Filler Programming + Program Production 9.5
Adjustments - Gain (Loss)
Pre-tax Profit
Canadian Programming Expenses
Page 256

Undertaking # Service Name
535434500 Zee Cinema Canada (formerly Bollywood
SD)
2011 2012 Var % 2013 Var % 2014 Var % 2015 Var %
y2 y3 y4 y5
44,050 213,558 384.81 151,102 -29.25 132,767 -12.13
45,139 238,400 428.15 145,643 -38.91 127,421 -12.51
1,324 8,760 561.63 9,846 12.40 6,373 -35.27
1,765 11,680 561.76 13,129 12.41 8,497 -35.28
5,738 37,960 561.55 42,667 12.40 27,617 -35.27
0 0 0 0
8,827 58,400 561.61 65,642 12.40 42,487 -35.27
20.04 27.35 43.44 32.00
CRTC - FINANCIAL SUMMARY - PAY & SPECIALTY
Programming and ProductionTechnicalSales and Promotion
Other revenueTotal Revenue
Expenses
DTH revenueLocal advertising revenueNational advertising revenue
($) CAGR (%)
RevenueResidential/bulk/smatv subscriber revenue
Pay and Specialty
Licensee Licensee Ultimate Owner Type Year
Ethnic Channels Group Limited Levin, Slava Specialty (category B service) 2015
Total Remuneration ($)Average Staff CountAverage Remuneration ($)
Investment in ProgrammingTotal Canadian Programming
Canadian Programming/Revenue (%)
Acquisition of rightsScript & conceptFiller Programming + Program Production
Adjustments - Gain (Loss)
Pre-tax Profit
Canadian Programming Expenses
Depreciation
P.B.I.T.
Interest Expense
Administration and GeneralTotal Expenses
Operating Income
P.B.I.T. MarginPre-tax MarginCAGR = Compound Annual Growth Rate
Subscribers
Profitability (%)Operating Margin
Page 257

Undertaking # Service Name
535435821 Zee Premier Canada (Bollywood Movies
TV)
2011 2012 Var % 2013 Var % 2014 Var % 2015 Var %
y3 y4 y5
279 993 255.91 4,564 359.62
452 992 119.47 8,366 743.35
59 81 37.29 429 429.63
79 108 36.71 572 429.63
256 353 37.89 1,857 426.06
0 0 0
394 542 37.56 2,858 427.31
141.22 54.58 62.62
DTH revenueLocal advertising revenueNational advertising revenue
($) CAGR (%)
RevenueResidential/bulk/smatv subscriber revenue
Pay and Specialty
Licensee Licensee Ultimate Owner Type Year
Ethnic Channels Group Limited Levin, Slava Specialty (category B service) 2015
CRTC - FINANCIAL SUMMARY - PAY & SPECIALTY
Acquisition of rightsScript & conceptFiller Programming + Program Production
Adjustments - Gain (Loss)
Pre-tax Profit
Canadian Programming Expenses
Depreciation
P.B.I.T.
Interest Expense
Administration and GeneralTotal Expenses
Operating Income
Programming and ProductionTechnicalSales and Promotion
Other revenueTotal Revenue
Expenses
P.B.I.T. MarginPre-tax MarginCAGR = Compound Annual Growth Rate
Subscribers
Profitability (%)Operating Margin
Total Remuneration ($)Average Staff CountAverage Remuneration ($)
Investment in ProgrammingTotal Canadian Programming
Canadian Programming/Revenue (%)
Page 258

Undertaking # Service Name
535435681 Zee TV Canada (formerly Hindi Women’s
TV)
2011 2012 Var % 2013 Var % 2014 Var % 2015 Var %
y3 y4 y5
671,561 2,124,232 216.31 2,329,275 9.65
795,223 2,127,997 167.60 1,857,913 -12.69
71,766 115,429 60.84 78,847 -31.69
95,687 153,905 60.84 105,129 -31.69
310,985 500,190 60.84 341,671 -31.69
0 0 0
478,438 769,524 60.84 525,647 -31.69
71.24 36.23 22.57
Pay and Specialty
Licensee Licensee Ultimate Owner Type Year
Ethnic Channels Group Limited Levin, Slava Specialty (category B service) 2015
CRTC - FINANCIAL SUMMARY - PAY & SPECIALTY
Depreciation
P.B.I.T.
Interest Expense
Administration and GeneralTotal Expenses
Operating Income
Programming and ProductionTechnicalSales and Promotion
Other revenueTotal Revenue
Expenses
DTH revenueLocal advertising revenueNational advertising revenue
($) CAGR (%)
RevenueResidential/bulk/smatv subscriber revenue
P.B.I.T. MarginPre-tax MarginCAGR = Compound Annual Growth Rate
Subscribers
Profitability (%)Operating Margin
Total Remuneration ($)Average Staff CountAverage Remuneration ($)
Investment in ProgrammingTotal Canadian Programming
Canadian Programming/Revenue (%)
Acquisition of rightsScript & conceptFiller Programming + Program Production
Adjustments - Gain (Loss)
Pre-tax Profit
Canadian Programming Expenses
Page 259

Undertaking # Service Name
535426961 Zeste (formerly Cuisine)
2011 2012 Var % 2013 Var % 2014 Var % 2015 Var %
y1 y2 y3 y4 y5
3,009,810 3,923,720 30.36 4,756,373 21.22 5,452,297 14.63 6,344,885 16.37
3,597,949 3,586,497 -0.32 2,998,067 -16.41 3,189,737 6.39 3,966,574 24.35
395,438 370,432 -6.32 342,513 -7.54 446,603 30.39 481,161 7.74
0 0 0 805 800 -0.62
2,068,699 2,202,016 6.44 1,823,217 -17.20 1,942,886 6.56 2,487,335 28.02
0 0 0 0 0
2,464,137 2,572,448 4.40 2,165,730 -15.81 2,390,294 10.37 2,969,296 24.22
81.87 65.56 45.53 43.84 46.80
CRTC - FINANCIAL SUMMARY - PAY & SPECIALTY
Programming and Production 2.5
TechnicalSales and Promotion
Other revenueTotal Revenue 20.5
Expenses
DTH revenueLocal advertising revenueNational advertising revenue
($) CAGR (%)
RevenueResidential/bulk/smatv subscriber revenue
Pay and Specialty
Licensee Licensee Ultimate Owner Type Year
Zeste Diffusion inc. Groupe Serdy inc. Specialty (category B service) 2015
Total Remuneration ($)Average Staff CountAverage Remuneration ($)
Investment in ProgrammingTotal Canadian Programming 4.8
Canadian Programming/Revenue (%)
Acquisition of rights 5.0
Script & conceptFiller Programming + Program Production 4.7
Adjustments - Gain (Loss)
Pre-tax Profit
Canadian Programming Expenses
Depreciation
P.B.I.T.
Interest Expense
Administration and GeneralTotal Expenses
Operating Income
P.B.I.T. MarginPre-tax MarginCAGR = Compound Annual Growth Rate
Subscribers
Profitability (%)Operating Margin
Page 260

Undertaking # Service Name
535435847 Zing (formerly Hindi Music TV)
2011 2012 Var % 2013 Var % 2014 Var % 2015 Var %
y3 y4 y5
3,790 41,749 >999± 22,301 -46.58
5,068 24,138 376.28 25,129 4.11
617 2,826 358.02 2,193 -22.40
823 3,768 357.84 2,925 -22.37
2,675 12,244 357.72 9,504 -22.38
0 0 0
4,115 18,838 357.79 14,622 -22.38
108.58 45.12 65.57
DTH revenueLocal advertising revenueNational advertising revenue
($) CAGR (%)
RevenueResidential/bulk/smatv subscriber revenue
Pay and Specialty
Licensee Licensee Ultimate Owner Type Year
Ethnic Channels Group Limited Levin, Slava Specialty (category B service) 2015
CRTC - FINANCIAL SUMMARY - PAY & SPECIALTY
Acquisition of rightsScript & conceptFiller Programming + Program Production
Adjustments - Gain (Loss)
Pre-tax Profit
Canadian Programming Expenses
Depreciation
P.B.I.T.
Interest Expense
Administration and GeneralTotal Expenses
Operating Income
Programming and ProductionTechnicalSales and Promotion
Other revenueTotal Revenue
Expenses
P.B.I.T. MarginPre-tax MarginCAGR = Compound Annual Growth Rate
Subscribers
Profitability (%)Operating Margin
Total Remuneration ($)Average Staff CountAverage Remuneration ($)
Investment in ProgrammingTotal Canadian Programming
Canadian Programming/Revenue (%)
Page 261

Undertaking # Service Name
205421572 Ztélé (formerly Canal Z)
2011 2012 Var % 2013 Var % 2014 Var % 2015 Var %
y1 y2 y3 y4 y5
8,956,932 9,201,636 2.73 9,721,320 5.65 9,375,147 -3.56 9,115,006 -2.77
3,012,501 2,978,488 -1.13 3,434,550 15.31 3,591,347 4.57 3,500,237 -2.54
0 0 0 0 0
11,391,771 11,428,770 0.32 13,728,909 20.13 13,015,555 -5.20 12,944,951 -0.54
0 0 0 0 0
23,361,204 23,608,894 1.06 26,884,779 13.88 25,982,049 -3.36 25,560,194 -1.62
10,781,210 12,760,433 18.36 10,120,389 -20.69 11,519,769 13.83 13,432,605 16.60
857,137 869,104 1.40 941,995 8.39 474,276 -49.65 504,002 6.27
1,648,172 1,705,819 3.50 4,092,595 139.92 3,231,757 -21.03 2,628,949 -18.65
1,907,730 1,946,429 2.03 2,169,216 11.45 1,806,238 -16.73 1,107,734 -38.67
15,194,249 17,281,785 13.74 17,324,195 0.25 17,032,040 -1.69 17,673,290 3.76
8,166,955 6,327,109 9,560,584 8,950,009 7,886,904
90,728 93,909 3.51 221,306 135.66 424,373 91.76 723,942 70.59
8,076,227 6,233,200 9,339,278 8,525,636 7,162,962
0 0 0 74,184 104,134 40.37
0 0 0 5,881 -101,754 >999±
8,076,227 6,233,200 9,339,278 8,457,333 6,957,074
7,016,060 8,905,861 26.94 5,675,944 -36.27 5,787,339 1.96 7,946,592 37.31
0 0 0 0 0
1,604,720 1,700,178 5.95 1,798,819 5.80 2,233,242 24.15 2,007,321 -10.12
0 0 0 0 0
8,620,780 10,606,039 23.03 7,474,763 -29.52 8,020,581 7.30 9,953,913 24.10
36.90 44.92 27.80 30.87 38.94
2,891,140 3,082,446 6.62 2,961,651 -3.92 2,278,769 -23.06 2,876,833 26.25
26 27 3.85 27 0.00 25 -7.41 30 20.00
111,198 114,165 2.67 109,691 -3.92 91,151 -16.90 95,894 5.20
2,067,689 2,039,560 -1.36 2,024,663 -0.73 1,999,047 -1.27 1,880,214 -5.94
35.0 26.8 35.6 34.4 30.9
34.6 26.4 34.7 32.8 28.0
34.6 26.4 34.7 32.6 27.2
Pay and Specialty
Licensee Licensee Ultimate Owner Type Year
Bell Media Inc. BCE Inc. Specialty (category A service) 2015
CRTC - FINANCIAL SUMMARY - PAY & SPECIALTY
Depreciation 68.1
P.B.I.T.
Interest Expense
Administration and General -12.7
Total Expenses 3.9
Operating Income
Programming and Production 5.7
Technical -12.4
Sales and Promotion 12.4
Other revenueTotal Revenue 2.3
Expenses
DTH revenue 3.8
Local advertising revenueNational advertising revenue 3.3
($) CAGR (%)
RevenueResidential/bulk/smatv subscriber revenue 0.4
P.B.I.T. MarginPre-tax MarginCAGR = Compound Annual Growth Rate
Subscribers -2.4
Profitability (%)Operating Margin
Total Remuneration ($) -0.1
Average Staff CountAverage Remuneration ($) -3.6
Investment in ProgrammingTotal Canadian Programming 3.7
Canadian Programming/Revenue (%)
Acquisition of rights 3.2
Script & conceptFiller Programming + Program Production 5.8
Adjustments - Gain (Loss)
Pre-tax Profit
Canadian Programming Expenses
Page 262