statistics on international development 2017 · statistics on international development 2017 final...
TRANSCRIPT

STATISTICS ON INTERNATIONAL
DEVELOPMENT 2017
Final 2016 UK ODA spend statistics
NOVEMBER 2017

CONTENTS
Summary Infographic ........................................................................................ 4
Introduction ....................................................................................................... 5
Supporting Information ...................................................................................... 6
1. UK ODA Flows .............................................................................................. 7
1.1 The ODA:GNI Ratio .................................................................................... 7
1.2 UK ODA by Main Delivery Channel ............................................................ 8
1.3 Makeup of UK ODA by Government Department and Other contributors of UK ODA .......................................................................................................... 10
1.4 Cross-Government Funds ......................................................................... 13
2. Comparisons between UK and other International Donors ......................... 15
2.1 ODA Flows and ODA:GNI Ratio by DAC Donors ...................................... 15
2.2 Total DAC ODA Flows by Recipient Country ............................................ 17
3. Analysis of UK ODA spend ......................................................................... 19
3.1 Regional / Country Breakdowns of Bilateral ODA Spend .......................... 19
3.1.1 Bilateral ODA spend by region ............................................................... 19
3.1.2 Bilateral ODA spend by Country ............................................................ 22
3.1.3 Bilateral ODA Spend by Region and Government Department and Other contributors of UK ODA .................................................................................. 24
3.1.4 Bilateral ODA Spend with No Single Benefitting Country or Region ...... 28
Case Study: Syrian Crisis 2016 ...................................................................... 29
3.2 Broad Sector Breakdown of Bilateral ODA Spend .................................... 30
3.2.1 Bilateral ODA spend by sector in 2016 .................................................. 30
3.2.2 Broad Sector Breakdown of Bilateral ODA Spend by Government Department and Other Contributors of UK ODA ............................................. 32
3.2.3 Broad Sector Breakdown of Bilateral ODA Spend by Top 10 recipients of UK bilateral ODA…………………………………………………………….………34 Case Study: UK ODA Humanitarian Assistance ............................................. 35
3.3 Multilateral Funding ................................................................................... 36
3.3.1 UK Multilateral Funding by Organisation ................................................ 36
3.3.2 UK Multilateral Funding by Extending Agency ....................................... 38
3.3.3 Multilateral Core Funding and Imputed Multilateral Shares ................... 40
Background Notes .......................................................................................... 41
Listing of UK contributors of ODA other than DFID’s main ODA activities in 2016 ................................................................................................................ 45
Scope .............................................................................................................. 47
User Engagement and Uses ........................................................................... 47
Publication Cycle ............................................................................................ 48
Data Revisions ................................................................................................ 48
Data Quality .................................................................................................... 48

Minor Revisions for Previous Years' data ....................................................... 49
Development of the Statistics ......................................................................... 49
Related Statistics and Publications ................................................................. 49
National Statistics ........................................................................................... 50
Contact Details................................................................................................ 50
Additional Tables and Annexes can be found online at: https://www.gov.uk/government/statistics/statistics-on-international-development-2017

4

5
Introduction
Statistics on International Development (SID) is an annual publication that provides
an overview of official UK spend1 on international development. It contains the
release of finalised spend estimates for the 2016 calendar year, updating the
previous provisional estimates published in April 2017, found here. The publication
covers:
Total UK spend on international development for the 2016 calendar year;
Trends in the last five years (2012 to 2016 inclusive as shown in most tables);
Key breakdowns by recipient country or organisation, type of assistance and
purpose;
International comparisons of spend on international development.
The publication focuses on the key international measure of official aid spend, known
as Official Development Assistance (ODA). Box 1 explains the definition of ODA.
1 Official UK spend is defined in Box 1. It does not cover private spending or donations made to support developing
countries, such as by the general public and voluntary sector, or overseas remittances. This private spending or donations data is collected by other sources:
a) Office for National Statistics, The Living Costs and Food Survey,
Table A1 b) Charities Aid Foundation https://www.cafonline.org/about-us/publications/2017-publications/uk-giving-report-2017 2. The DAC list of ODA receiving countries is found here http://www.oecd.org/dac/stats/documentupload/DAC%20List%20of%20ODA%20Recipients%202014%20final.pdf
Box 1 - Key Definition: Official Development Assistance
Official Development Assistance (ODA) is produced according to standardised
definitions and methodologies controlled by the Organisation for Economic
Cooperation and Development (OECD) Development Assistance Committee. ODA
is defined as resource flows to developing countries2 and multilateral organisations,
which are provided by official agencies (e.g. the UK Government) or their executive
agencies, and each transaction meets the following tests:
It is administered with the promotion of the economic development and
welfare of developing countries as its main objective; and
It is concessional in character and conveys a grant element of at least 25 per
cent.
A glossary, explaining key terms used throughout this report, is available in Annex 1 of SID.
Headline ODA is measured on a cash flow basis and takes account of any
repayments as well as spend.

6
Supporting Information
Annexes to the publication are available in a separate document which includes the
following supporting information to help users understand and use the statistics:
Guide to understanding aid statistics – this describes the key definitions used in
the publication, such as bilateral/multilateral aid, aid types and sector
expenditure (Annex 1);
Glossary of terms used throughout the publication (Annex 2);
Summary of data sources used to produce SID (Annex 3);
Data quality and processing arrangements (Annex 4).
This publication focuses on ODA. The data tables included in the publication are
available to download in spreadsheet format. A full dataset in Open Data Standard
format is available on the Statistics on International Development 2017 webpage to
enable users’ access to the microdata themselves.
We also calculate another measure of international development spending, known as
Gross Public Expenditure on Development (GPEX). GPEX is gross spending on
development by DFID on a financial year basis, and covers DFID’s spending in all
countries including those that are not ODA-eligible. GPEX is published as part of this
publication, but is released as additional tables after the main release of ODA figures in
Statistics on International Development. GPEX data for 2016/17 will be published
early 2018.
If there are any tables or data not available from this publication that you need for
your own analysis, or if you have any thoughts about how to improve the publication,
please contact the statistics team at: [email protected]

7
1. UK ODA Flows This section provides an overview of UK Official Development Assistance (ODA). It
covers changes in the amount of UK ODA spent and Gross National Income (GNI)
used in the calculation of the ODA:GNI ratio, breakdowns of UK ODA spend by main
delivery channel, and by Government Departments and other contributors.
1.1 The ODA:GNI Ratio
The ODA:GNI ratio presents the level of UK Official Development Assistance (ODA)
against Gross National Income (GNI).
Table 1 reports the target ODA:GNI ratio for the calendar year 2016 on the basis of
the current international standard for measuring GNI, ESA2 2010. The ESA 2010
methodology leads to higher levels of national income compared with the previous
methodology for GNI, known as ESA 1995, due to additional areas of economic
activity being included in ESA 2010. The GNI measure on an ESA 2010 basis is
about 6 per cent higher than the previous GNI (ESA 1995) measure used to calculate
the ODA:GNI ratio. As part of the 2015 spending review, the UK Government
increased UK ODA to meet the 0.7 per cent target based on the ESA 2010 measure
of GNI and to reflect economic growth. More details about the recent changes in the
GNI methodology and the UK reporting of the 0.7 per cent target are shown in the
background note.
The UK provided a total of £13,381 million of ODA in 2016. This represents an
increase of 10.3 per cent (£1,245m) between 2015 and 2016 (see Table 1). This
increase in ODA largely reflects the change in GNI methodology as noted above.
Table 1: GNI estimates for 2015 and 2016 and ODA:GNI Ratios; Current Prices1,2
1. The 2015 Spending Review used GNI (ESA 2010) to set ODA budgets for 2016 to 2020.
2. Unadjusted for Eurostat reservations, and discontinued by ONS in 2016. In the 2010 spending review ESA 1995 is
used to set the ODA budgets for 2011 to 2015. This was the measurement used for the 2015 ODA:GNI target.
2 European System of Accounts
£ million
GNI ODAR ODA:GNI
ratio (%)GNI ODA
ODA:GNI
ratio (%)
GNI (ESA 2010 current methodology for 2016) 1,833,814 12,136 0.66% 1,910,708 13,381 0.70%
GNI (ESA295)1,722,979 12,136 0.70% - - -
2015 2016

8
The ODA:GNI ratio for 2016 is 0.70 per cent, and therefore the 0.7 per cent target, as
set out in the International Development Act 2015, has been met.
Long Term Trends in UK ODA
Figure 1 shows the trend in UK ODA since 1970. Overall there has been a steady
increase in UK ODA levels since 1970, with a peak in 2005 and 2006 that was driven
by high levels of debt relief3, and a steep increase in 2013 when the UK Government
first met the 0.7 per cent ODA:GNI target. In 2016 UK ODA levels increased as
consequence of the switch to the ESA 2010 methodology for measuring GNI
and GNI growth.
Figure 1: UK ODA levels 1970 – 2016 (millions)1,2
1. For the years 2013 -2015 (transition years) the ESA 1995 GNI was used to calculate the ODA:GNI ratio. Please see figure 16 in the background note. 2. Underlying data for this graph can be found in the accompanying excel file ‘Statistics for International Development: tables 2017’.
3 See commitments made by the UK and other donors at the 2005 G8 Summit in Gleneagles: http://researchbriefings.files.parliament.uk/documents/RP07-51/RP07-51.pdf

9
1.2 UK ODA by Main Delivery Channel
There are two main delivery channels for ODA: bilateral and multilateral. Bilateral
ODA is earmarked spend which the donor has control over – this is usually ODA
going to specific countries, regions or programmes. Bilateral ODA can be further
subdivided into funding to multilateral organisations for specific programmes or in
specific countries, known as ‘bilateral ODA through a multilateral organisation’, and
funding spent through other delivery partners, such as Non-Governmental and Civil
Society Organisations, research institutions and universities or directly by the
government referred to as ‘Other bilateral’ ODA (see Figure 2).
Multilateral ODA describes un-earmarked funds from national governments which are
pooled with other donors’ funding and disbursed as part of the core budget of the
multilateral organisation (Table 2 and Figure 2).
Table 2 shows the UK provided £4,843 million in core contributions to the
multilaterals in 2016, an increase of £370 million (8.3 per cent) on 2015. By
comparison, £8,538 million of ODA was delivered through bilateral channels, an
increase of £875 million (11.4 per cent) on 2015. Bilateral and multilateral loans,
which are another type of concessional ODA funding, represented a small share (6
per cent) of UK ODA. These were for financing bilateral projects in India and
multilateral programmes by the World Bank and the IMF.
Table 2: Total UK ODA: by Main Delivery Channel
Figure 2 presents the breakdown of total ODA by main delivery channel for 2012-
2016, and shows that ‘Other bilateral’ ODA is the largest share of total UK ODA.
Since 2012 the share of ODA spent through other bilateral channels has hovered
around 40 per cent, increasing in 2015 and 2016 to around 45 per cent.
£ million
£m% total ODA £m% total ODA £m% total ODA £m % £m %
Total Bilateral ODA 5,560 63.2% 7,662 63.1% 8,538 63.8% 2,978 53.6% 875 11.4%
of which: bilateral through multilateral 1,879 21.3% 2,158 17.8% 2,552 19.1% 673 35.8% 394 18.3%
Loans 0 0.0% 22 0.2% 8 0.1% 8 - -14 -62.5%
Total Multilateral ODA 3,242 36.8% 4,473 36.9% 4,843 36.2% 1,601 49.4% 370 8.3%
of which: Loans 0 0.0% 282 2.3% 796 6.0% 796 - 514 182.5%
TOTAL ODA 8,802 100.0% 12,136 100.0% 13,381 100.0% 4,579 52.0% 1,245 10.3%
R Figures for 2015 have been revised - see note on revisions in this publication.
2012 2015R 2016 Change since 2012 Change since 2015

10
Consequently total bilateral ODA (bilateral aid spent through other channels and the
multilaterals) has risen steadily while core multilateral ODA has fluctuated marginally
year on year. Core multilateral ODA tends to vary as the contributions of national
governments and the payment schedules of the receiving multilateral organisations
are managed on different multi-year cycles.
Figure 2: UK ODA by main delivery channel, £ billion (and percentage share)
Note that “Bilateral through multilateral” is a component of bilateral
1.3 Makeup of UK ODA by Government Department and other contributors of UK ODA
Table 3 shows the contribution of government departments and other contributors of
UK ODA in 2016. It shows:
Main contributors of UK ODA
DFID spent £9,874 million of ODA (73.8 per cent of total UK ODA) in 2016.
This is an increase of £102 million (or 1.0 per cent) compared with 2015.
ODA spent by departments other than DFID and other contributors of UK
ODA (non-DFID) was £3,507 million in 2016, an increase of £1,143 million (or
Billi
on
s

11
48.3 per cent) on 2015. Non-DFID ODA represented 26.2 per cent of total
ODA in 2016.
In 2016 the largest non-DFID ‘departmental’ shares of ODA were: the
Department of Business, Energy & Industrial Strategy (BEIS) (5.2 per cent of
ODA); the Conflict, Stability and Security Fund (CSSF) (4.5 per cent); the
Foreign and Commonwealth Office (3.8 per cent)4, and the Home Office (2.7
per cent).
The largest non-department sources were non-DFID EU5 attribution which
was £478 million (3.6 per cent of UK ODA) and the UK’s contribution to the
IMF Poverty Reduction and Growth Trust (PRGT), which amounted to £446
million (3.3 per cent) and supports low income countries, such as Afghanistan
and Sierra Leone, with macroeconomic assistance.
Main ODA increases in 2016
IMF Poverty Reduction and Growth Trust ODA increased by £326 million,
from £120 million in 2015 to £446 million to 2016.
In 2016, the CSSF, a cross government fund aimed at tackling conflict and
instability overseas, spent £601 million of ODA. This was an increase of £277
million on 2015 and was the largest spend increase from a non-DFID source
(excluding the IMF PRGT).
BEIS, which supports research and science in developing countries and
tackles climate change, spent £696 million of ODA in 2016. This was an
increase of £168 million compared to 2015.
4 For more detail on FCO spending please see: https://www.gov.uk/government/collections/official-development-
assistance-oda--2 5 See background note

12
Table 3: Breakdown of UK ODA: by Government Department and Other
Contributors of UK ODA
2015 and 2016
R Figures for 2015 have been revised - see note on revisions in this publication. Development 2017
"z" is not applicable, "0" is null and "~" is less than half the smallest unit displayed.
1. Figures may not sum to totals due to rounding. 2. The total figure for DFID no longer includes DFID's share of the Conflict Pool/CSSF. See section 1.4 for more details. 3. DFID's figures for 2015 and 2016 include the capital contribution to CDC. 4. The methodology for EU attribution changed in 2016, and therefore a comparison with the estimate in 2015 is strictly not applicable. 5. The Department for Business, Energy and Industrial Strategy (BEIS) is a government department created in July 2016. In previous publications the Department comprised the former Department for Energy and Climate Change (DECC) and Department for Business, Innovation and Skills (BIS). In 2015 the former DECC spent £336m and the former BIS spent £191m of the BEIS total. In 2016 the former DECC spent £319m and the former BIS spent £376m of the BEIS total. 6. In April 2015, the Government introduced the CSSF replacing the Conflict pool. The 2015 figure reflects Conflict Pool spend from January - March 2015 and the CSSF spend from April -December 2015. 7. CSSF/Conflict Pool includes the UK's contribution to EU peacekeeping activities as it is the fund responsible for the spend. This contribution is not counted in the EU attribution (non-DFID) figure to avoid double-counting. The overall EU attribution figure has not changed. 8. The cross-government Prosperity Fund and Office for National Statistics are new ODA providers in 2016. 9. ODA is the debt relief granted by the Export Credits Guarantee Department. 10. ONS ODA for 2016 was £55,335, less than the last significant figure presented in the table.
Ordered by 2016 ODA
£m % UK ODA £m % UK ODA £m % UK ODA £m % £m %
Department for International Development2,3 7,624 86.6% 9,772 80.5% 9,874 73.8% 2,250 29.5% 102 1.0%
Of which:
EU Attribution4 699 7.9% 426 3.5% 498 3.7% -201 -28.7% 73 Z
Total non-DFID 1,178 13.4% 2,364 19.5% 3,507 26.2% 2,328 197.6% 1,143 48.4%
Of which:
Department for Business, Energy and Industrial Strategy5288 3.3% 527 4.3% 696 5.2% 407 141.3% 168 32.0%
Conflict Pool/Conflict, Stability and Security Fund (CSSF)6,7 188 2.1% 324 2.7% 601 4.5% 413 220.2% 277 85.4%
Foreign & Commonwealth Office 282 3.2% 391 3.2% 504 3.8% 222 78.9% 114 29.1%
Home Office 29 0.3% 222 1.8% 360 2.7% 330 1128.7% 138 62.1%
HM Treasury 0 0.0% 0 0.0% 73 0.5% 73 Z 73 Z
Department for Environment Food and Rural Affairs 22 0.3% 57 0.5% 67 0.5% 45 200.6% 10 18.4%
Department of Health 15 0.2% 32 0.3% 46 0.3% 31 208.5% 14 43.5%
Prosperity Cross- Government Fund8 0 0.0% 0 0.0% 38 0.3% 38 Z 38 Z
Department for Education 0 0.0% 22 0.2% 28 0.2% 28 Z 7 30.8%
Department for Work and Pensions 10 0.1% 9 0.1% 24 0.2% 14 143.7% 15 181.1%
HM Revenue and Customs 0 0.0% 2 0.0% 9 0.1% 9.30 Z 7 414.7%
Ministry of Defence 5 0.1% 9 0.1% 5 0.0% 0 2.2% -4 -45.5%
Export Credits Guarantee Department9 20 0.2% 0 0.0% 2 0.0% -17 -88.6% 2 Z
Department for Culture, Media and Sports 2 0.0% ~ 0.0% 2 0.0% -~ -25.3% ~ 107.9%
Office for National Statistics8,10 0 0.0% 0 0.0% ~ 0.0% ~ Z ~ Z
CDC Group PLC 103 1.2% 0 0.0% 0 0.0% Z Z Z Z
Other contributors of UK ODA
EU Attribution (non - DFID)4,7 109 1.2% 509 4.2% 478 3.6% 369 Z -32 Z
IMF Poverty Reduction and Growth Trust (PRGT) 0 0.0% 120 1.0% 446 3.3% 446 Z 326 272.4%
Gift Aid 91 1.0% 105 0.9% 90 0.7% -1 -1.6% -15 -14.6%
BBC World Service 0 0.0% 20 0.2% 24 0.2% 24 Z 4 18.9%
Scottish Government 10 0.1% 11 0.1% 12 0.1% 1 14.1% 1 4.9%
Colonial Pensions administered by DFID 3 0.0% 2 0.0% 2 0.0% -1 -30.6% 0 -12.2%
Welsh Government 1 0.0% 1 0.0% 1 0.0% ~ 11.3% 0 2.1%
Total UK ODA 8,802 100.0% 12,136 100.0% 13,381 100.0% 4,579 52.0% 1,245 10.3%
2012 2015 2016 Change since 2012 Change since 2015

13
Figure 3: Breakdown of UK ODA by Government department and Other UK ODA contributors, 2012, 2015 and 2016
1.4 Cross - Government Funds
Conflict, Stability and Security Fund
The Conflict, Stability and Security Fund (CSSF) is a cross-government fund which
has a mix of ODA and non-ODA resources. Any National Security Council (NSC6)
department and related agency can bid for these funds. The NSC is responsible for
the overall delivery of the CSSF while individual spending departments are
responsible for managing CSSF spend.
In 2016 there were two additional departments: HM Revenue and Customs and
Department for Transport allocated CSSF funding. Foreign and Commonwealth
Office remained the largest recipient, spending 71.7 per cent of total CSSF ODA.
6 For information on the NSC, please see: https://www.gov.uk/government/groups/national-security-council

14
Table 4a below shows CSSF by spending department in 2012 (i.e. 5 years ago),
2015 and 2016.
Table 4a: Breakdown of CSSF/Conflict Pool ODA: by Government Department 2012, 2015 and 2016
The Prosperity Fund
The cross-government Prosperity Fund7 was first introduced in April 2016. It
promotes economic reform and development in recipient countries. Departments bid
for the funds and the Fund is overseen by a Ministerial Board that sets overall
strategic direction, but individual departments are accountable for their own spending
and delivery under the fund. In 2016, £38 million of ODA was delivered through the
fund. Table 4b below shows the Prosperity Fund by spending department in 2016.
Table 4b: Breakdown of Prosperity Fund ODA: by Government Department 2016
7 For more information on the cross-government Prosperity Fund please see:
https://www.gov.uk/government/publications/cross-government-prosperity-fund-programme/cross-government-prosperity-fund-update
£m
% of the
fund ODA £m
% of the
fund ODA £m
% of the
fund ODA
Total CSSF / Conflict Pool ODA 187.40 100% 324.1 100% 600.9 100%
Of which:
Foreign and Commonwealth Office 176.0 93.9% 240.2 74.1% 431.1 71.7%
Department for International Development 11.4 6.1% 68.7 21.2% 121.5 20.2%
National Crime Agency Z Z 9.3 2.9% 15.8 2.6%
Ministry of Defence 0.0 0.0% 4.4 1.3% 13.6 2.3%
Home Office Z Z 0.7 0.2% 17.0 2.8%
Crown Prosecution Service Z Z 1.0 0.3% 1.5 0.2%
HM Revenue and Customs Z Z Z 0.0% 0.4 0.1%
Department for Transport Z Z Z 0.0% ~ 0.0%
"z" is not applicable, "0" is null and "~" is less than half the smallest unit displayed.
2012 2015 2016
£m
% of the
fund
Total Prosperity Cross- Government Fund ODA 37.5
Of which:
Foreign and Commonwealth Office 34.0 90.7%
Department for International Development 2.5 6.6%
HM Treasury 0.1 0.3%
National Crime Agency 0.2 0.6%
Cabinet Office 0.7 1.8%
2016

15
2. Comparisons between UK and other International Donors The analysis below is based on the provisional8 2016 ODA data from all 29
Development Assistance Committee (DAC) Member countries, except the UK for
which final 2016 ODA data is used9 .
2.1 ODA Flows and ODA:GNI Ratio by DAC Donors
Total ODA from DAC country donors (DAC ODA) in 2016 was £105.7 billion,
representing an increase of 22.7 per cent from the total of £86 billion in 2015. The
UK’s share of the total was 12.7 per cent in 2016. This was a fall of about 1.4
percentage points in share compared to 2015 and largely reflects increases in other
members’ ODA spend, notably Germany and Spain.
Figure 4: Provisional ODA from DAC Donors, 20169
Figure 4 shows in 2016 the UK was the third largest DAC donor country in ODA
spending terms. The largest spending donor remained the US (£24.9 billion), but this
8 To illustrate the impact of using provisional figures, DAC Members’ provisional ODA for 2015 was £86,123 million.
This decreased to £86,023 million for final 2015 ODA – a 0.1 per cent decrease. 9 The UK ODA figure for 2016 is final. In April 2017, the OECD published provisional ODA figures for 2016 for other
DAC member countries. http://www.oecd.org/dac/financing-sustainable-development/development-finance-data/ODA-2016-detailed-summary.pdf. These figures are the latest available for these countries that are used in the charts.

16
represented 0.18 per cent as an ODA:GNI ratio (Figure 5 below). By comparison
Norway spent £3.2 billion (around an 1/8 of the US spend) and but its ODA:GNI ratio
was 1.11 per cent (Figure 5) – showing that Norway spends a larger share of its
national income on ODA. In 2016 Germany was the second largest DAC donor
country after the US due to their ODA spend on in-donor refugee costs doubling
between 2015 and 2016.
Figure 5 shows the UK was the sixth largest contributor on an ODA:GNI ratio basis,
with a final ratio of 0.70 per cent in 2016. Norway, Luxembourg, Sweden and
Denmark all exceeded the UN target in 2016, with Germany meeting the UN target
for the first time.
Figure 5: Provisional ODA from DAC Donors, 201610
10
Figure 5 above is based on the provisional 2016 ODA data from all 29 Development Assistance Committee (DAC)
Member countries, except the UK for which final 2016 ODA data is used .

17
2.4 Total DAC ODA Flows by Recipient Country11
The latest available data for total DAC ODA by recipient region and country is for
2015. UK ODA data by recipient region and country used here is also for 2015,
keeping the data comparable.
Figure 6 shows the largest 15 receiving countries of DAC ODA in 2015, and the UK’s
share in these countries. The UK’s share of total DAC ODA exceeded 20 per cent in
6 of the 15 countries; Pakistan, Ethiopia, South Sudan, Tanzania, Syria and
Bangladesh.
Of the five highest recipient countries of DAC ODA in 2015 (Afghanistan, India,
Ethiopia, Syria and Vietnam), three (Ethiopia, Afghanistan and Syria) were among
the top five UK ODA recipients. Pakistan, the largest recipient of UK ODA overall,
was ranked 6th in terms of DAC ODA spending. India’s position as the second
largest recipient of DAC ODA can be explained by it being the largest recipient of
Germany’s ODA and second largest recipient of Japan’s ODA.
11
Total DAC and UK ODA data were sourced from the OECD DAC website. See also Table C6 in the accompanying
Excel Tables: Statistics on International Development 2016.

18
Figure 6: Map of the top fifteen highest recipients of total DAC Members ODA Spend and UK’s Share by Country, 2015

19
3. Analysis of UK ODA spend
3.1 Regional / Country Breakdowns of Bilateral ODA Spend
Bilateral ODA is spend that does not take the form of a core contribution to a
multilateral organisation12. This includes spend to a specific country or region as well
as spend to multiple countries and/or regions13. It also includes spend in a specific
sector for which there are no designated benefitting country/countries or region(s) or
where benefitting countries are not known until the end of the programme14.
3.1.1 Bilateral ODA spend by region
In 2016, around two thirds (or £5.6bn) of the UK’s bilateral ODA was allocated to a
specific country or region. The remaining 34 per cent (£2.9bn) of bilateral ODA
consisted of spend that could not be assigned to a single benefitting country or
region.
Africa continues to account for the largest percentage share of UK bilateral ODA
expenditure allocated to specific country or region. Africa received approximately
£2.9 billion (51.0 per cent) of bilateral ODA spend in 2016. Africa’s percentage share
of bilateral ODA fell in 2016 on account of increased spending in other parts of the
World, notably in Asia and the Middle East.
In 2016 Asia remains the second largest recipient of UK bilateral ODA (£2.3bn) with
41.8 per cent, followed by the Americas (£0.2bn) with 4.3 per cent, Europe (£0.2bn)
with 2.8 per cent and the Pacific which received less than £10 million of bilateral ODA
0.1 per cent.
12
As defined on the OECD DAC list of ODA-eligible international organisations 13
For some multi-country/region programmes, the current administrative system does not allow recording of spend by individual recipients. Improvements to the system are being considered but for this publication, where this is the case spend is reported as bilateral ODA spend with no single benefitting country or region (section 3.1.4). 14
For example contributions to programmes run by multilaterals who may not report on the benefitting country until the end of the programme.

20
Figure 7: UK bilateral ODA by receiving region, £ billion: 2012 - 2016
Changes in the Regional Flow of UK Bilateral ODA
Africa:
2016: Bilateral ODA to Africa increased by 3.6 per cent from £2,759 million in 2015 to
£2,858 million in 2016, with significant increases in spend being seen in Nigeria, and
Somalia – countries that were affected by famine. In Nigeria the increase was driven
by spending on humanitarian assistance, targeting malnutrition and sanitation and
similarly humanitarian spend also increased in Somalia.
Over five years: Many of the countries (over 60 per cent) classified as “Least
Developed Countries” on the OECD DAC list of recipient countries are in Africa and
they account for a significant share of UK bilateral ODA overall. Therefore Africa has
consistently received the largest amount of ODA. Bilateral ODA to Africa has
increased steadily over the last 5 years, with spend in 2016 (£2,858m) being 31.7 per
cent higher than it was in 2012 (£2,171m).
Asia:
2016: In 2016, bilateral spend to Asia increased by 12.5 per cent (£260m) to £2,344
million, driven largely by increases in ODA to Jordan and Syria – areas affected by
the Syrian Crisis. These countries will be discussed in more detail in the next section.
51 per cent of UK bilateral ODA
42 per cent of UK bilateral ODA
Bil
lio
ns

21
Over five years: Between 2012 and 2013 spend to Asia rose by £577 million (a 42
per cent increase) to £1,949 million. This was the largest year on year increase seen
in Asia ODA in the last five years. Between 2013 and 2014 bilateral ODA to Asia
reduced by £131 million to £1,818 million, due to lower levels of ODA to Pakistan, the
Middle East region and Bangladesh – the same areas that had seen a large
increases in 2013. Between 2014 and 2016, spending in Afghanistan and Syria in
particular saw ODA levels rise by 29 per cent.
The Americas:
2016: In 2016, the Americas received £242 million of UK bilateral ODA, an increase
of £83 million on 2015. Most of this spend was for infrastructure development in the
Caribbean and a project in Brazil focusing on sustainable low carbon land use and
forest management in Farms.
Over five years: Volumes of bilateral ODA to the Americas is on a lower scale than
those to Africa and Asia. Bilateral ODA to the Americas has increased since 2012,
except in 2014 when it fell due to the closing of a transport sector programme in
Guatemala. ODA levels in 2016 have returned to those seen before 2014.
Europe:
2016: Europe received £159 million of UK bilateral ODA in 2016. This was just under
three times more than the amount in 2015. The most significant increase was seen in
Turkey (£92m increase since 2015) to support displaced refugees in the Syria Crisis
with vital supplies, health and education.
Over five years: Like the Americas, ODA spend in Europe15 is small compared to
Asia and Africa. Bilateral ODA to Europe has grown steadily from £32 million in 2012
to £55 million in 2015.
Pacific
A very small proportion of bilateral ODA goes to the Pacific, between 0.1 and 0.2 per
cent (or less than £10m).
15
European countries that received ODA in 2016 were: Albania, Belarus, Bosnia-Herzegovina, Former Yugoslav Republic of Macedonia, Kosovo, Moldova, Montenegro, Serbia, Turkey and Ukraine
4 per cent of UK bilateral ODA
3 per cent of UK bilateral ODA

22
3.1.2 Bilateral ODA spend by Country
In 2016, the UK provided bilateral assistance to 127 countries.
In 2016 the top three recipients of UK bilateral ODA were Pakistan (£463m),
Syria (£352m) and Ethiopia (£334m).
Pakistan was the top recipient of bilateral ODA for the second year running
and saw increased spending in education, other basic social services, and
urban and rural development.
Jordan and Turkey saw the biggest increase in bilateral ODA; they rose in
ranking, jumping from 23rd and 49th place respectively to 7th and 22nd. The rise
in ranking reflected spend to support displaced refugees in the Syrian Crisis –
in Jordan spend rose from £57 million in 2015 to £175 million in 2016, and in
Turkey spend rose from £6 million in 2015 to £98 million in 2016.
India saw the largest fall in ranking, falling from 9th in 2015 to 23rd in 2016.
Spending in education, health and government sectors in India reduced by
more than half, reflecting the UK government’s policy to end traditional
financial aid to India, and move to an aid partnership based on technical
cooperation and private sector investments.
The total country-specific UK bilateral ODA spend to the top five recipients
countries rose from £1,533 million in 2015 to £1,704 million in 2016. As a
percentage share of total country-specific UK bilateral ODA the top five
accounted for 35.2 per cent of the total in 2016, roughly similar to 2015 when
they comprised 33.2 per cent of the total.

23
Figure 8: Top 10 Recipients of UK Bilateral ODA16
2016 rank compared to 2015 rank
Income groups
ODA eligible countries are classified according to four groups – Least Developed,
Other Low Income, Lower Middle Income, Upper Middle Income. These are based on
the country’s gross national income per capita, published by the World Bank. The list
of countries is reviewed every three years by the OECD-DAC, with the next update
due in autumn 2017.
Total UK bilateral ODA to Least Developed and Other Low Income countries
dropped slightly in 2016 to £2,592 million. This was a fall of £175 million on
2015 and reflects a shift in spending to Upper Middle Income countries, like
Jordan, Turkey and Lebanon - countries affected by the Syrian Crisis. UMICs
received £846 million in 2016 this was a 61 per cent increase compared to
2015.
Least Developed and Other Low Income countries remained however, the
highest proportion of total bilateral ODA spend in 2016 – accounting for 53.5
per cent (£2,591m) of (DFID and Non-DFID) country specific spend
combined.
Many of the countries that DFID’s bilateral ODA helps are classified as Least
Developed Countries, while the UK’s overall aid effort covers a larger range of
ODA eligible countries.
16
For detailed breakdowns of spend to the top 20 recipients, please see Table 6 in the tables Statistics on
International Development 2017 document.

24
Spending to Lower Middle Income Countries (LMICs) represented 29.0 per
cent of UK country/region specific bilateral ODA in 2016. This proportion has
remained fairly stable over the last five years.
Table 7: Breakdown of UK Bilateral ODA by Income Group 2012, 2015 and 2016
3.1.3 Bilateral ODA Spend by Region and Government Department and Other Contributors of UK ODA17
In 2016, 95.5 per cent of DFID’s bilateral ODA went to countries in Africa and Asia -
£4,264 million, while the share of non-DFID bilateral ODA to these regions was lower
82.2 per cent (£938m) (see Figure 9).
Africa has consistently been the largest recipient of DFID country- and region-specific
ODA since 2010, with a share of 56.9 per cent in 2016.
By contrast, the largest recipient of non-DFID country- and region-specific ODA is
generally Asia. In 2016, non-DFID ODA contributors spent £623 million in Asia which
accounted for 54.5 per cent. Non-DFID also spends a larger proportion of their ODA
in Europe and Americas – 17.7 per cent compared to DFID – 4.4 per cent (Figure 9).
17
Please see Table C5 in Excel Tables: Statistics on International Development 2017 for underlying data.
£mil % £mil % £mil % £mil % £mil % £mil %
Least Developed Country 1,757.2 59.3% 159.5 31.9% 2,298.4 58.6% 206.8 29.7% 2,158.2 53.7% 195.1 23.7%
Other Low Income Country 238.1 8.0% 15.8 3.2% 246.3 6.3% 15.0 2.1% 226.7 5.6% 11.5 1.4%
Low Middle Income Country 817.0 27.6% 192.2 38.4% 1,104.9 28.1% 225.6 32.4% 1,099.5 27.4% 304.9 37.1%
Upper Middle Income Country 151.3 5.1% 132.6 26.5% 275.4 7.0% 249.8 35.8% 535.3 13.3% 310.9 37.8%
Total 2,963.6 100.0% 500.1 100.0% 3,925.0 100.0% 697.2 100.0% 4,019.8 100.0% 822.3 100.0%
2012 2015 2016
DFID Non-DFID DFID Non-DFID DFID Non-DFID

25
Figure 9: Breakdown of DFID and non-DFID, Country/region Specific Bilateral ODA by Region, 2016
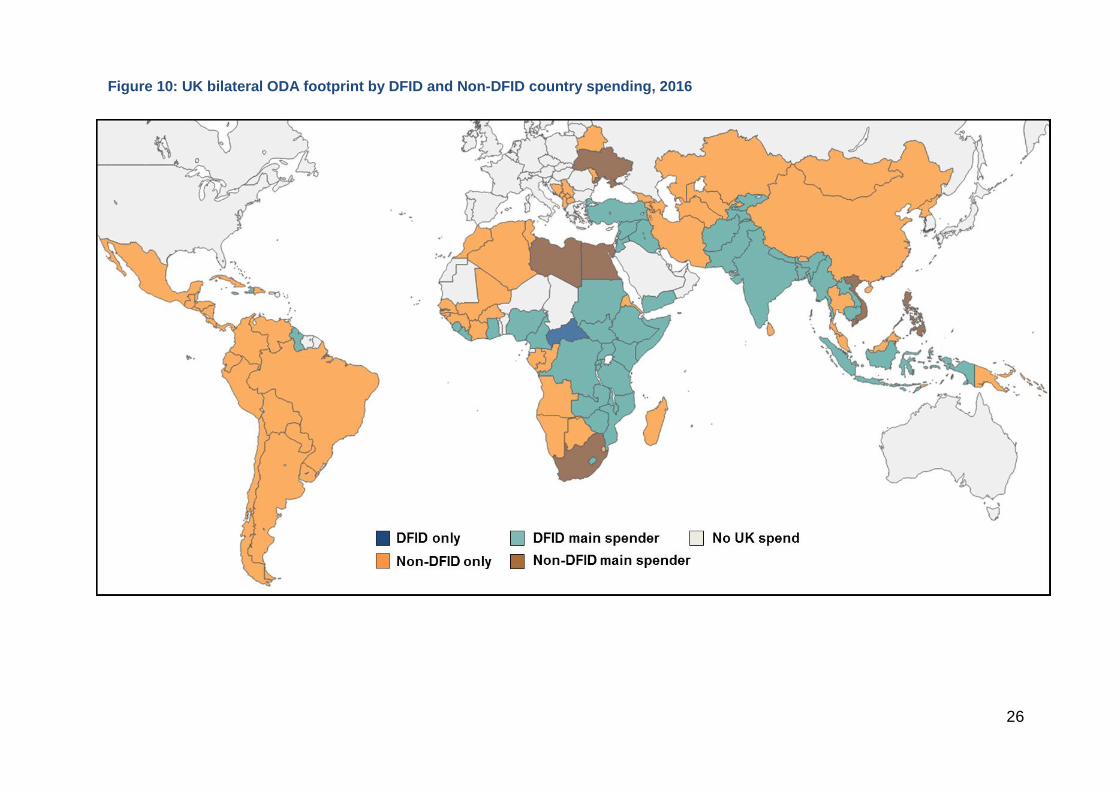
Figure 10 below shows:
DFID provides the majority of its ODA to priority countries in Sub-Saharan
Africa and Asia.
DFID works with Other Government Departments in all of its countries, except
the Central African Republic where there was some spend by DFID on
humanitarian relief.
Other UK Government Departments and other contributors of ODA provide
their ODA in smaller amounts to a much larger spread of countries across the
world.
DFID’s contribution to Asian countries is concentrated in the Middle East
region (Syria, Lebanon etc.) and south and central Asia. While non-DFID
contributes to Asian countries across the whole region.
A similar trend is seen in Africa – DFID spend is concentrated mainly on
central, southern and eastern Africa while non-DFID contributes across the
whole region.
26
Figure 10: UK bilateral ODA footprint by DFID and Non-DFID country spending, 2016

27
Changes in Flows of ODA by Government Department and Other contributors of UK ODA
Figure 11 shows the differences and trends in regional UK ODA flows provided by
DFID and by other departments and contributors (non-DFID).
DFID remains the prime channel of bilateral ODA to Africa and Asia, spending
in 2016 eight times more ODA in Africa, and roughly three times more ODA in
Asia than other Government Departments.
Spending by non-DFID in Asia has been rising fast (from £289m in 2012 to
£623m in 2016) due their contribution to UK aid in the Middle East region, and
in particular to the Syria crisis.
In the Americas and Europe bilateral spending by DFID and non-DFID is on a
smaller scale than in Africa and Asia, with slightly more ODA spend provided
by non-DFID in the Americas and slightly more ODA spending by DFID in
Europe.
Figure 11: Breakdown of Country or Region Specific Bilateral ODA by DFID and
other contributors of UK (non-DFID), 2012-2016

28
3.1.4 Bilateral ODA Spend with No Single Benefitting Country or Region
In 2016 just over a third (34.3 per cent) of bilateral ODA was made up of spend that
was not assigned to a single benefitting country or region. This comprises, for
example, centrally-funded research and other global public goods or programmes
that develop policies that benefit several developing countries that cannot be
meaningfully recorded to a single benefitting country or region. It also consists of
ODA with no country flow as such, for example costs to support asylum seekers in
the UK.
Over one third of spend within this ‘Unspecified’ category consists of project-
type interventions and includes expenditure on multi-country or multi-region
projects. As outlined at the start of section 3.1.4, these are programmes
where it is not possible to directly assign exact spend to the benefitting
countries or regions in the current administrative system18.
Twenty six per cent of the unspecified ODA was allocated to supporting
development work overseas or refugees in the UK, while 18 per cent was for
specific programmes or funds managed by international organisations in a
specific sector with no designated benefitting countries.
A further 11 per cent consists of core support to Non-governmental
Organisations (NGOs) or other delivery partners, such as research
institutions, where often the research outcomes will affect a wide range of
developing countries.
Figure 12: Breakdown of UK Bilateral ODA, 201619
18
We are exploring improvements to DFID systems to allow multiple benefitting countries and regions to be recorded. 19
Totals may sum to more than 100 per cent due to rounding.

29

30
3.2 Broad Sector Breakdown of Bilateral ODA Spend
3.2.1 Bilateral ODA spend by sector in 2016
UK ODA is classified into a number of different broad sectors depending on the
social, economic or humanitarian assistance area it supports. For more information
on what’s included in the broad sectors please see Annex 1 of this publication. Figure
13 provides an overview of bilateral ODA spent by broad sector20 in 2016 and a more
detailed breakdown of the sectors is given in Additional Table A6a. The five largest
sectors by bilateral spend in 2016 were:
Humanitarian ODA – retaining its position as the largest sector and, receiving
£1,284 million (15.0 per cent) (also see the case study on Page 35)
Multisector ODA – that includes general environmental protection, research,
and urban and rural development, the second largest sector (up from a third
in 2015), receiving £1,132 million (13.3 per cent)
Government and Civil Society21 - that covers public policy, human rights and
conflict prevention and resolution, peace and security, the third largest sector
(down from second in 2015), receiving £1,120 million (13.1 per cent)
Health - the fourth largest sector (a non-mover), receiving £1,042 million (12.2
per cent)
Education - the fifth largest sector (up from sixth in 2015), receiving £964
million (11.3 per cent)
Figure 13: Broad Sector breakdown of UK Bilateral ODA, with 2015 ranking in
brackets, 2016 (£ millions)
20
These broad sectors align with the OECD DAC definition of broad sectors. For more information on DAC broad sectors please see http://www.oecd.org/dac/stats/methodology.htm. Following the DAC methodology, where a programme works across multiple sectors, all spend is reported against the sector with the largest spend. For more information please see the background note of this document, 21
For example capacity building within the Criminal Justice Institutions in the Occupied Palestinian Territories

31
Changes in Bilateral ODA Flows by Sector
Figure 14 shows that humanitarian ODA spend increased marginally from
2015 (£1,266m) to 2016 (£1,284m). It remained high due to continued
support for Syria (£221m), Yemen (£114m), and South Sudan (£93m), the
three countries with the largest humanitarian spend in 2016. The ending of
the Ebola crisis saw humanitarian ODA fall in Sierra Leone, while spending in
the country’s health sector rose in 2016.
Overall bilateral ODA spending on Health fell between 2013 and 2015, and
then rose slightly between 2015 (£1,017m) and 2016 (£1,042m). This was
due to sustained levels of health spending in Nigeria and Ethiopia, which
received the highest amounts health spending in both 2015 (£75m and £64m
respectively) and 2016 (£85m and £61m respectively), and an increase in
spending in Sierra Leone from 2015 (£7m) to 2016 (£61m).
Education saw the steepest increase between 2015 and 2016, with spend
increasing from £652 million to £964 million and reflecting in part the UK’s
contribution to the Global Partnership for Education fund (£106m in 2016)
Overall bilateral spending that was not allocated to a sector decreased from
£89 million in 2015 to £66 million in 2016, a decrease from 1.2 per cent of
total bilateral ODA to 0.8 per cent. This was down to a slight improvement in
data quality due to better coding to specific sector activity.
The percentage share of 5 largest sectors (excluding unallocated spend)
remained broadly the same in 2016 (64.9 per cent) as it was in 2015 (67.8 per
cent).

32
Figure 14: UK bilateral ODA by top 5 broad sectors, 2009-2016
3.2.2 Broad Sector Breakdown of Bilateral ODA Spend by Government Department and other contributors of UK ODA
Figure 15 below provides a breakdown of sector spend by DFID and all Other
Government Departments and other contributors of ODA (non-DFID).
For DFID spend, the largest sector was ‘Humanitarian ODA’ in developing
countries and the smallest was ‘support for refugees in the donor country’ (i.e.
in the UK).
For non-DFID spend, the largest sector was ‘Multisector’ aid and the smallest
was ‘Commodity and General Programme Assistance’, i.e. food aid and food
security.
DFID and non-DFID spend in “Government and Civil Society” and
“Multisector” (i.e. research) was roughly equivalent. This is because other
Government Departments are also main contributors to research and science
ODA and to spending in support of government and civil society.

33
Figure 15: DFID’s and Other Government Departments’ and Other Contributors
of ODA (non-DFID) Spend by Sector (2016, £ millions)
DFID
Non-DFID

34
3.2.3 Broad Sector Breakdown of Bilateral ODA Spend by top 10 recipients of UK bilateral ODA
Figure 16 below provides a breakdown of the top 10 recipients of UK bilateral ODA
by their highest sector spend for a particular year.
Figure 16: Top 10 recipients of UK bilateral ODA, by largest sector spend
Some countries in the top 10 consistently receive most UK ODA for the same
sector year on year (Pakistan, Ethiopia, Nigeria and Afghanistan). While
others tend to fluctuate (Ethiopia, Tanzania and Jordan).
Before the war in Syria in 2011, the largest receiving sector of UK ODA in
Syria was education, but after 2011 when a crisis emerged it became
humanitarian assistance. South Sudan, Sierra Leone and Somalia are other
countries that have had emergency humanitarian situations in the recent past
and Figure 16 shows how sector spending has changed.
South Sudan gained independence in 2011 and received £25.3 million in
government and civil society sector ODA from the UK. In 2012, civil war broke
out and UK responded with Humanitarian ODA.
Sierra Leone had two consecutive years (2014 - 2015) of mainly humanitarian
ODA while the Ebola outbreak hit.
Somalia had been in a state of civil war since 1991. In 2012, the first formal
parliament was recognised internationally. The UK since then focuses more
of its spending on “government and civil society”.
2009 2010 2011 2012 2013 2014 2015 2016
Pakistan
Syria
Ethiopia
Nigeria
Afghanistan
Tanzania
Jordan
South Sudan
Sierra Leone
Somalia
Sector Key
Humanitarian
Health
Education
Government and Civil Society
Other Social Infrastructure and services
Commodity and General Programme Assistance
Admin

35

36
3.3 Multilateral Funding
3.3.1 UK Multilateral Funding by Organisation
The UK works with a wide range of organisations with very different roles in
development – for example, to respond to humanitarian need, to develop
infrastructure to support economic growth, or to ensure that particular diseases are
tackled in line with the best available evidence. Multilateral organisations22 are an
essential part of the international system for humanitarian and development ODA.
They are able to work in a wider range of countries than individual donor
governments, offer economies of scale in their operations and expertise, and often
have the legitimacy to work in politically sensitive situations. In doing so, they enable
donor governments, such as the UK, to support humanitarian and development work
in a far wider range of countries.
Table 9 shows the top 20 multilateral organisations that received the most core
funding (Multilateral ODA) in 2015 and 2016. The top five Multilateral organisations’
share of UK Multilateral ODA has remained stable from 2015 to 2016 (67.7 per cent
in 2015 compared with 68.3 per cent in 2016). The International Development
Association (part of the World Bank Group) received the most UK Multilateral ODA in
2016, receiving £1,145 million (23.6 per cent) followed by the development share of
the European Commission Budget, with £1,031 million of UK core funding (21.3 per
cent). Three of the top five UK-funded organisations in 2015 remained in the top five
organisations in 2016. International Monetary Fund – Poverty Reduction and Growth
Trust and African Development Fund replaced the Global Alliance for Vaccines and
Immunization and the Green Climate Fund as the fourth and fifth largest recipient
respectively in 2016.
22
Defined as ODA-eligible multilateral organisations by the OECD DAC, see http://www.oecd.org/dac/stats/annex2.htm

37
Table 9. Top Twenty Recipients of UK Core Funding to Multilateral Organisations (Multilateral ODA)23 2015, 2016
1. Includes the International Development Association - Multilateral Debt Relief Initiative
23
The UK may also provide funding to these organisations for specific programmes, which would be recorded as bilateral spend through a multilateral organisation.
£ millions £ millions
Rank Multilateral
Multilateral
ODA Rank Multilateral
Multilateral
ODA
1 International Development Association11,195 26.7% 1 International Development Association1
1,145 23.6%
2 European Commission - Development Share of Budget 935 20.9% 2 European Commission - Development Share of Budget 1,031 21.3%
3 European Commission - European Development Fund 392 8.8% 3 European Commission - European Development Fund 473 9.8%
4 Global Alliance for Vaccines and Immunization 268 6.0% 4 International Monetary Fund - Poverty Reduction and Grow th Trust 446 9.2%
5 Green Climate Fund 240 5.4% 5 African Development Fund 214 4.4%
6 African Development Fund 212 4.8% 6 Global Alliance for Vaccines and Immunization 200 4.1%
7 Clean Technology Fund 158 3.5% 7 Green Climate Fund 162 3.3%
8 International Monetary Fund - Poverty Reduction and Grow th 120 2.7% 8 Global Fund to Fight AIDS, Tuberculosis and Malaria 153 3.2%
9 Global Fund to Fight AIDS, Tuberculosis and Malaria 100 2.2% 9 International Finance Facility for Immunisation 92 1.9%
10 International Finance Facility for Immunisation 84 1.9% 10 Asian Infrastructure Investment Bank 72 1.5%
11 Strategic Climate Fund 72 1.6% 11 Central Emergency Response Fund 55 1.1%
12 Central Emergency Response Fund 55 1.2% 12 United Nations Development Programme 55 1.1%
13 United Nations Development Programme 55 1.2% 13 Private Infrastructure Development Group 53 1.1%
14 Asian Development Fund 50 1.1% 14 Global Environment Facility - Special Climate Change Fund 53 1.1%
15 United Nations Children’s Fund 48 1.1% 15 United Nations Department of Peacekeeping Operations 51 1.0%
16 World Food Programme 40 0.9% 16 Clean Technology Fund 51 1.0%
17 Advance Market Commitments 40 0.9% 17 Asian Development Fund 50 1.0%
18 CGIAR Fund 35 0.8% 18 United Nations Children’s Fund 48 1.0%
19 United Nations Office of the United Nations High Commissioner for Refugees 35 0.8% 19 World Food Programme 40 0.8%
20 United Nations Relief and Works Agency for Palestine Refugees in the Near East 34 0.8% 20 United Nations Office of the United Nations High Commissioner for Refugees 35 0.7%
2015
% share
of total
2016
% share of
total

38
3.3.2 UK Multilateral Funding by Extending Agency
Table 10 shows UK ODA by delivery channel and agency extending the funding.
Most of the UK’s multilateral ODA is provided through DFID’s funding of multilateral
organisations. DFID accounted for 72.3 per cent (£3,502m) of total UK multilateral
ODA; a fall from 2015, when DFID accounted for 78.4 per cent (£3,507m) of the UK
total. The Department for Business, Energy and Industrial Strategy was the largest
non-DFID department to provide UK multilateral ODA in 2016, accounting for 3.5 per
cent (£168m) of the UK total, primarily made up of core contributions to the Climate
Investment Funds and Green Climate Fund. In 2016, the attribution of government
departments other than DFID to the European Commission development budget
(non-DFID EU Attribution) was 9.9 per cent (£478m) of the UK multilateral total.
Over the last 5 years, the proportion of UK multilateral ODA from non-DFID
contributors has grown. In 2016, multilateral ODA from non-DFID sources accounted
for 27.7 per cent (£1,341m) of the total, compared with 5.6 per cent (£183m) in 2012.
The rising share of non-DFID multilateral ODA reflects an increase in the number of
Other Government Departments providing core multilateral funding for ODA, and an
improvement in the methodology for apportioning the UK’s EU development
expenditure between DFID and Other Government Departments.
Details on the funding of multilaterals in 2015 and 2016 are available online in
Additional Table A8.

39
Table 10: Breakdown of UK ODA: by Government Department and Other Contributors of UK ODA and delivery channel1
2012, 2015 and 2016
1. Figures may not sum to totals due to rounding. 2. The total figure for DFID no longer includes DFID's share of the Conflict Pool/CSSF. See section 1.4 for more details. 3. DFID's figures for 2015 and 2016 include the capital contribution to CDC. 4. The methodology for EU attribution changed in 2016, and therefore a comparison with the estimate in 2015 is strictly not applicable. 5. The Department for Business, Energy and Industrial Strategy (BEIS) is a government department created in July 2016. In previous publications the Department comprised the former Department for Energy and Climate Change (DECC) and Department for Business, Innovation and Skills (BIS). In 2015 the former DECC spent £336m and the former BIS spent £191m of the BEIS total. In 2016 the former DECC spent £319m and the former BIS spent £376m of the BEIS total. 6. In April 2015, the Government introduced the CSSF replacing the Conflict pool. The 2015 figure reflects Conflict Pool spend from January - March 2015 and the CSSF spend from April -December 2015. 7. CSSF/Conflict Pool includes the UK's contribution to EU peacekeeping activities as it is the fund responsible for the spend. This contribution is not counted in the EU attribution (non-DFID) figure to avoid double-counting. The overall EU attribution figure has not changed. 8. The cross-government Prosperity Fund and Office for National Statistics are new ODA providers in 2016. 9. ODA is the debt relief granted by the Export Credits Guarantee Department. 10. ONS ODA for 2016 was £55,335, less than last significant figure presented in the table. "z" is not applicable, "0" is null and "~" is less than half the smallest unit displayed.

40
3.3.3 Multilateral Core Funding and Imputed Multilateral Shares
When DFID or other UK government departments provide core funding to multilateral
organisations, it is not possible to directly track the funding to the country or sector
where it is spent. However, to provide an indication of the destination and sector of
UK ODA, the overall percentages of ODA reported by the relevant multilateral
organisations are used to impute a UK contribution.
This publication uses the breakdown of ODA reported by each multilateral
organisation to the OECD DAC to estimate what percentage of DFID and UK core
contributions are spent in each country and sector. Where a multilateral organisation
does not report its development assistance to the DAC but the multilateral is only
mandated to work in a particular country, region or sector, we allocate all of its core
contributions to the relevant country, region or sector. If a multilateral organisation
does not report to the DAC but works in multiple sectors and/or countries then its
core contributions are not allocated to a country or sector.
The DAC publish detailed information of the multilaterals’ country and sector
spending in December, and because of this timing the latest estimates are available
for 2015 as shown in this publication. Additional Tables A9 and A10 show imputed
multilateral shares of UK Multilateral ODA by sector and country respectively. These
shares should be taken as indicative estimates rather than exact amounts of funding,
and they are dependent upon multilateral organisations returning outflow data to the
DAC.
In 2015, most multilateral organisations, representing around 85 per cent of the UK’s
total core multilateral funding, made returns by sector and country to the OECD DAC.
The latest estimates include a list of multilaterals that reported sector and country
information in Table A9 and A10. The estimates will be incomplete for the non-
reporting multilateral organisations, whose data will be allocated to the unspecified
country or sector category.

41
SUPPORTING INFORMATION
Background Notes
ODA Spending monitoring and reporting
The UK target to spend 0.7 per cent of GNI on ODA is measured on the basis of final
ODA spending and the GNI estimates published by the ONS at the end of September
in the year following the target year. During the spending year, DFID and HMT
monitor ODA spending and the latest information on GNI to ensure the 0.7 per cent
target is met.
UK ODA spend includes DFID spend, non-DFID departmental spend and other
sources of ODA (such as EU attribution and gift aid). DFID and HMT monitor spend
by other departments and funds during the year and estimate the likely contribution
from non-departmental sources of ODA. DFID and HMT monitor movements in GNI
during the year using estimates of GNI produced by the ONS and GNI forecasts
published by the independent Office for Budget Responsibility (OBR). While DFID
can control its own spending on ODA, DFID cannot control GNI nor can it fully control
spending by other government departments and other sources of ODA. After final
decisions on DFID ODA spending are made the GNI estimate can still shift, so can
the amount of ODA spent by other government departments and ODA contributions
from non-departmental sources.
DFID is responsible for collating data and reporting spend on ODA to the
Organisation of Economic Development and Co-operation (OECD), including the 0.7
ODA:GNI ratio commitment.
The ONS produce a first preliminary estimate of GNI for 2016 in the first quarter of
2017. In the spring DFID compile preliminary ODA data for 2016 from ARIES and
the aggregate spending returns of the other government departments and other
contributors to UK ODA. The first estimate of GNI and preliminary ODA data are
used to calculate the provisional estimate of the ODA:GNI ratio, published in April.
Between the spring and the autumn the ODA spending of DFID and other
government departments are finalised. Other government departments will provide
project-level details that allow the ODA spend to be quality assured. The ONS will

42
release a further update of GNI for 2016, which is published in the September
National Accounts. The final ODA data and the updated September GNI estimate for
2016 are used to calculate the final ODA:GNI ratio in this publication, and to report to
the OECD.
ODA:GNI Ratio
The Office for National Statistics (ONS) publish revisions to Gross National Income
(GNI) estimates as more economic data becomes available. The provisional
ODA:GNI ratio is always based on the GNI estimate published in March and the final
ratio is based on the GNI estimate published by the ONS in September. To enable
comparability against international ODA data we do not revise the back series to take
into account any further revisions made to the GNI estimates.
For 2013, 2014 and 2015 we presented the ODA:GNI ratio, based on GNI estimates
using both the ESA 1995 and ESA 2010 accounting standards to show the different
‘target’ and ‘statistical’ ODA:GNI ratio respectively. The ‘target’ ratio used GNI (ESA
1995) that was in use for the Government’s spending plans between 2010 and 2015,
and the measure the Government said it would use to monitor the 0.7 per cent ODA
target between 2013 and 2015. The ‘statistical’ ratio used GNI (ESA 2010), which is
the current international standard for measuring GNI. This methodology was
introduced by the ONS in 2014, and was not available when ODA spending plans
were set for the period between 2010 and 2015.
The ESA 2010 methodology expands the coverage of national income through the
inclusion of additional areas of economic activity and technological developments.
This expanded coverage raises the level of national income compared with the
previous GNI (ESA 1995) methodology. More details about the impact of ESA 2010
changes are provided by the ONS. In 2015 the Government set out its spending
plans for ODA between 2015/16 and 2019/20 in the UK Aid Strategy, taking into
account GNI (ESA 2010) to plan ODA budgets in the 2015 spending review. Figure
17 on the next page helps illustrate the recent changes in the GNI methodology used
to calculate the ODA:GNI ratio.

43
Figure 17: Recent changes in the measurement of GNI and the reporting of the 0.7% target

44
In-donor refugee costs
ODA includes official expenditure for the sustenance of refugees in the UK during the
first twelve months of their stay. This includes estimates of the Home Office’s costs
to support refugees and departmental costs to provide education and health services
to refugees, in line with the OECD DAC directives.
The estimates are calculated using asylum seeker flow information from the Home
Office, including in-year costs. This source ensures that asylum seeker costs can be
estimated for the first 12 months of their stay. The different Departments (Department
for Health, Department for Education (DfE) and Home Office) have their own unit
costs (cost per one asylum seeker) to provide services. These costs are multiplied by
the asylum seeker flow information.
In 2017 the OECD DAC has worked to clarify instructions for reporting in-donor
refugee costs by DAC donors. We will be undertaking further work to ensure the
UK’s reporting is in line with this latest guidance. (See section on development of the
statistics)
CDC Capital Partners PLC – reporting from 2015
A previous internal quality review recommended that DFID statisticians consider
whether the UK’s approach to how CDC reports ODA is in line with the international
rules and best practice in this area. Following a public consultation in 2014/15, DFID
changed its reporting of CDC ODA such that now the capital flow from the UK
government to CDC is scored as ODA, rather than CDC’s net disbursements. In
2016, the UK reported a capital increase provided to CDC of £285 million as ODA.
EU Attribution
The final estimate for the UK share of EU Budget ODA in 2016 is £1,031 million
compared to £935 million in 2015. EU attribution fluctuates from year to year
because the EU works on a seven year programming cycle and the EU development
disbursements in a given year can vary. Exchange rate fluctuations also affect the
UK’s share of EU development spend. The estimate in 2016 is based on published
data from the European Commission.
To avoid double counting a small part of the EU attribution figure for the UK’s
contribution to EU peacekeeping is reported in these statistics by the Conflict,

45
Stability and Security Fund as the fund responsible for spending. This does not
affect the overall EU attribution figure.
Listing of UK Government Departments and other UK contributors of UK ODA other than DFID’s main ODA activities in 2016
To supplement the ODA statistics from other Government Departments and UK
contributors shown in the publication, we have included information in the table below
on the main ODA activities departments other than DFID have supported in 2016.
The table aims to respond to users’ requests for more details on non-DFID ODA.
Government Department or Other contributor of UK ODA
Main ODA funded activity in 2016
BBC World Service - BBC World Service contributes to the BBC’s international news mission to address the global gap in provision of trusted news, by broadcasting and distributing accurate, impartial and independent news and analysis of the highest quality. In developing countries the BBC World Service aims, through journalism that contributes to accountability and good governance, to improve the welfare and economic development of citizens.
Conflict, Stability and Security Fund (CSSF)
- CSSF’s main activities in 2016 were:
Tackling conflict and building stability overseas
Improve capacity and accountability of security and justice actors
Strengthening the rules-based international order and its institutions including women, peace and security
Crisis Response and Resilience
Tackling Serious and Organised Crime
Preventing violent extremism
Department for Business, Energy and Industrial Strategy (BEIS)
- BEIS ODA is spent through the International Climate Fund (ICF), jointly managed by DFID, BEIS and DEFRA. The ICF seeks change in developing countries to tackle emissions by supporting low carbon development and shifting markets in favour of clean and green.
- BEIS also funds the Newton fund and Global Challenges Research Fund (GCRF). The Newton fund uses the UK’s strength in research and innovation to support economic development, social welfare, and to develop capacity in 15 developing countries. The GCRF aims to ensure that UK research takes a leading role in addressing the problems faced by developing countries.
Department for Culture, Media and Sport (DCMS)
- From 2016/17 onwards the £30m Cultural Protection Fund supports countries mainly in Middle Eastern conflict zones to protect and restore their cultural heritage.
Department for Education (DfE) - All of DfE’s ODA is for the support of asylum seekers in the first 12 months after they make a claim for asylum in the UK. This support relates to the provision of publicly-funded education services to child and unaccompanied child asylum seekers of compulsory school age.
Department for Environment, Food and Rural Areas (DEFRA)
International Climate Fund (ICF) – investing in forestry projects that secure biodiversity benefits, promote more sustainable land use and agriculture practices, and contribute to global food security.
The Darwin Initiative - a global competitive grant scheme that funds projects in developing countries and our UK Overseas Territories to help them better manage their natural resources.
Illegal Wildlife Trade (IWT) Challenge Fund – funds projects in developing countries to develop sustainable livelihoods for communities affected by illegal wildlife trade; strengthen law enforcement and the criminal justice system; and reduce demand for the products of the illegal wildlife trade.

46
Department of Health (DH) The Department of Health pays an annual subscription to the World Health Organisation (WHO) - a proportion of which is ODA eligible. It also takes the overall lead for the Government’s engagement with the organisation. DH ODA includes: support of asylum seekers in the first 12 months after they make a claim for asylum in the UK. This support relates to the provision of publicly-funded health services; the Fleming Fund – which focuses on improving data and surveillance of Antimicrobial Resistance (AMR) in low and middle income countries (LMICs) where drug resistant infections have a disproportionate effect, and the Vaccine Network.
Department for Work and Pensions (DWP)
DWP pays an annual core contribution to the International Labour Organisation (ILO). Approximately 60 per cent of this funding is assessed as ODA eligible. DWP has a model for estimating the administration and benefit costs of the Vulnerable Persons Relocation (VPR) scheme.
Foreign and Commonwealth Office (FCO)
The FCO provided £504m of ODA in 2016 through core departmental policy programmes, international subscriptions and aid-related frontline diplomacy. FCO policy programmes supported a wide range of UK foreign policy and UK Aid priorities in the majority of DAC listed countries. As well as scholarships, FCO programmes include small-scale interventions in support of diplomatic activity and longer-term capacity building. This work contributes to strengthening global peace, security, governance or prosperity in support of the UK Aid Strategy. The most significant allocations are: Chevening Scholarships Programme and the Magna Carta Fund for Human Rights and Democracy.
HM Revenue and Customs (HMRC)
HMRC supports developing countries revenue authorities to improve their tax administration functions and tax policies to increase revenue collection, providing economic integration, stability and growth.
HM Treasury (HMT) HMT ODA relates to administrative costs to undertake development related activities. HMT also oversee the UK’s contribution to the Asian Infrastructure Investment Bank.
Home Office (HO) The Home Office’s ODA expenditure consists mostly of support for destitute asylum seekers (adults, families and unaccompanied children) in the first twelve months after they make a claim for asylum in the UK. This support provides mainly accommodation and subsistence payments, but also includes advisory services. Support is also provided for refugees or those in need of humanitarian protection (including children) under the Gateway Protection and Syrian Vulnerable Persons Protection. The Home Office also supports projects to build the capacity and capability of recipient countries to deal with border security, drug smuggling, modern slavery and child protection online.
Ministry of Defence (MoD) In 2016, the MOD provided support to a range of ODA activities:
UK Hydrographic Office (UKHO) for international capacity building in the Caribbean, North India Ocean and Southern Africa.
Training in Basic English; Royal College of Defence Studies; Advanced Command; Managing Defence in the Wider Security Context, and Exclusive Economic Zones.
Refugee assistance in the UK Sovereign Base Areas in Cyprus.
A retraining programme for Afghanistan in a range of courses and qualifications.
MOD also delivers ODA through the Conflict, Stability and Security Fund.
Prosperity Fund Projects undertaken in 2016/17 included improving the environment for business, healthcare, and access to financial services, urban planning and energy infrastructure. The projects helped lay the groundwork for the multiyear programmes operating from 2017/18 onwards.
Scottish Government In 2016 the Scottish Government continued its ongoing partnership agreement with the Government of Malawi; it supported projects in three other countries in Sub Saharan Africa (Rwanda, Tanzania and Zambia) and in 3 countries in South Asia (Bangladesh, India and Pakistan). The Scottish Government also provides humanitarian funding to support crises as they occur, including during 2016, the Malawi food security crisis and the DEC Yemen crisis appeal.
Welsh Assembly The Welsh Assembly supports the Wales for Africa programme, which aims to help deliver the Sustainable Development Goals. It also provides small grants to organisations based in Wales to promote development awareness

47
Scope
This publication presents information on the UK’s spending on Official Development
Assistance (ODA). It includes data from the Devolved Administrations of the UK, as
well as government departments and other contributors to UK ODA. Data relating to
both Bilateral and Multilateral ODA are included in the scope of this publication. This
publication does not include information on:
Results achieved in international development through the UK’s ODA
spend. This information is published separately found here
Development Tracker. You can explore details of the individual
development projects that the UK is funding by using the Development
Tracker. This allows you to filter projects by country and sector, and view
further details about the project as published in documents such as the
business case and annual review. The tracker uses open data on
development projects, compliant with the International Aid Transparency
Initiative (IATI) standard, to show where funding by the UK Government and
its partners is going and ‘trace’ it through the delivery chain
The UK’s non-ODA development spend. A separate set of tables
capturing the National Statistics UK Gross Public Expenditure on
Development (GPEX) for 2015/16 can be found here. GPEX statistics
capture official flows of DFID’s development spend, including aid to countries
and organisations that are not ODA-eligible. Further information on the
definition of GPEX statistics can be found here. GPEX statistics for 2016/17
will be published in early 2018, and will be made available through the
Gov.uk website.
User Engagement and uses
DFID carried out a consultation with users of this publication in 2014, when users told
us that they use these statistics for a variety of purposes: preparing material for
briefs, PQs and public correspondence; for reports and reviews, and providing data
for research and monitoring purposes. The main users were Government (including
DFID and other government departments), civil society and non-government
organisations, students and academia, and the media. A summary of results and
response of this consultation can be found here:
Publication Cycle
DFID releases two National Statistics publications over the year:

48
Provisional UK ODA as a proportion of Gross National Income will be
published in the spring, and includes a provisional estimate of the UK’s
ODA/GNI ratio. The latest edition of this publication can be found here.
Statistics on International Development is usually published in the autumn.
This publication confirms the UK’s ODA/GNI ratio, as well as including more
detailed analysis of the UK’s Bilateral and Multilateral ODA, and includes a
detailed set of supplementary tables, as well as the microdata used to
produce the publication.
Data Revisions
DFID data for this publication is based on an extract of the ARIES database taken in
May 2017, after the end of the calendar year 2016 and financial year 2016/17. Other
Government Department data are collected during May and June, and are quality
assured over the summer. Where we do have to revise information included in this
publication, we will follow the procedures set out in or revisions policy, available here.
Data Quality
Data for this publication comes from the following sources:
DFID’s ‘ARIES’ database that records financial transactions relating to DFID
payments and receipts. It also includes information on the dates of
transactions, where the transactions took place and in which sector. This
information is primarily inputted by spending teams in DFID country offices
and central departments, with some quality assurance carried out at input and
centrally to ensure that spend is in line with OECD definitions of ODA. DFID
spending makes up 74 per cent of total ODA in 2016.
Similar databases for other departments. For non-DFID departments there is
an assessment of whether the spending is in line with the OECD definitions of
ODA. Non-DFID sources account for around 26 per cent of ODA.
The publication is also based on all financial transactions within a given year, and so
is not subject to sampling error.

49
The ARIES database is subject to input errors from spending teams. The risk of input
error is relatively low for estimates of total spend, and by country/region, and
relatively higher for spending by sector (where there is sometimes ambiguity,
especially for projects or programmes that cut across sectors) and by funding
channel. The quality assurance Annex 4 describes the steps that have been taken
by DFID statisticians to minimise these kinds of input errors, and to produce UK ODA
statistics.
Minor revisions for previous years’ data
2015 ODA figures
The DFID estimate for 2015 has been revised upwards by £5m due to a data
processing error for three projects.
The Department of Education ODA estimate for 2015 has been revised downwards
by £7m, which corrects for asylum seeker children who are outside of the age of
compulsory education and should not have been included in ODA.
These small changes do not affect the ODA:GNI ratio in 2015, which is 0.70% (see
Table 1).
Development of the statistics
We seek to continuously improve our publication and welcome feedback from users.
Please send any feedback to [email protected]
As part of the development of these statistics, we have identified three areas of work
for review in the coming year. These are further work on in-donor refugee costs to
ensure that the methodology and data sources are in line with OECD DAC guidance,
the methodology used to estimate Foreign and Commonwealth Office administrative
costs, and the methodology for charities’ Gift Aid that is ODA eligible. We will update
our website shortly with further details about these reviews.
Related Statistics and Publications
DFID’s Annual Report provides information on DFID’s results achieved,
spending, performance and efficiency, and the OECD DAC aid statistics.
Other related publications include, the 0.7% ODA/GNI target,

50
National Statistics
The United Kingdom Statistics Authority has designated these statistics as National
Statistics, in accordance with the Statistics and Registration Service Act 2007 and
signifying compliance with the Code of Practice for Official Statistics. Designation
means the statistics carry the National Statistics label and conform with the
standards summarised in the box below:
Contact Details
For enquiries (non-media) about the information contained in this publication, or for
more detailed information, please contact:
Michael Morris
Department for International Development,
22 Whitehall,
London,
SW1A 2EG
Telephone: 020 7023 0497
E-mail: [email protected]
Website: https://www.gov.uk/government/organisations/department-for-
international-development/about/statistics
For media enquiries please contact the DFID Press Office on +44 (0) 20 7023 0600.
For further information on development issues and DFID policies, please contact the
Public Enquiry Point on 0845 300 4100.