staying ahead - tm forum · pdf filemobile revenues and kpi forecast (eu estimates are low) 40...
TRANSCRIPT

© 2013 TM Forum | 1
V2013.5
Staying Ahead
of a rapidly
changing
industry
Joann O’Brien VP, Collaborative R&D

© 2013 TM Forum | 2
V2013.5
Agenda
9:00am: Joann O’Brien, VP, Collaborative R&D
Welcome & Evolving Collaboration to meet current and future Industry needs
Bill Ahlstrom, President & COO, TM Forum
9:10 – 9:25am: Nik Willetts, CSO, TM Forum
9:25 – 9:50am: Jesús Romero, Corporate Strategy Director, Telefonica How he sees the industry shifting and the impacts this is having on the telecommunications strategy
9:50am – 10:05am: Laurent Leboucher, Vice President APIs and Digital Ecosystems,
Orange & Chair TM Forum Strategy & Adoption Sub-Committee Outlining how the changes in the industry impact on Forum activities
10:05 – 10:15am
Eric Troup, Chief Technical Officer, Worldwide Communications & Media Industries
10:15am – 10:30am: Ken Lipnickey, Director Project Management TM Forum Action Week Logistics

© 2013 TM Forum | 3
V2013.5
Welcome
Bill Ahlstrom
President & COO
TM Forum

© 2013 TM Forum | 4
V2013.5
inform innovate accelerate optimize
Action Week
2014
Good morning! February 10, 2014
© 2013 TM Forum | 5
V2013.5
Who we are
TM Forum is a
global trade
association for
enterprises,
service providers
and their suppliers.
We’re trusted by
the world’s largest
companies to help
them continuously
transform and
succeed in the
digital economy.
85,000+ Member
Professionals
900+ Member
Companies
Global Coverage
1 Forum

© 2013 TM Forum | 6
V2013.5
Is your business a digital native?
agile
fast
efficient
innovative
customer centric
software centric
partner centric
data-driven
secure
mobile
Defining the Digital Business

© 2013 TM Forum | 7
V2013.5
Solving three core challenges for any business
Agile
Business and
IT
Program
Transform
IT & operations
to reduce costs,
minimize risk and
improve time-to-
market
Business
Growth
Program
Maximize
market share,
customer loyalty
and enable new
growth
Open
Digital
Program
Deliver new
services
quickly, easily
and securely
with partners
Rapid Partner
Onboarding
Digital Partner
Security
End-to-End
Service Quality
Managing Money
between Partners
Business
Process
Optimization
Revenue
Management
Cloud,
SDN and NFV
IT & Operations
Transformation
Big Data
Analytics Cyber Security
Big Data
Analytics
Experience
Management
Customer
Privacy

© 2013 TM Forum | 8
V2013.5
This week…
Collaborate
Share
Learn
Network
Create
Enjoy!

Corporate Strategy
Telefónica, S.A.
10 February 2014
Telecoms sector
Time to invest in long term sustainability

DISCOVER. DISRUPT. DELIVER
Executive summary
10
#1: Revenue growth is the main TSR driver; must focus on customer needs Investors reward sustainable revenue growth, ahead of margin trends
#2: Dividend yield was not a key TSR driver in 2013; higher capex and M&A Telco average TSR +27.2% (5.8% DY), ICT average TSR +48.2% (1.6% DY)
#3: Growth outlook in 2014 remains stronger for ICT players … … but long term sustainability is the key issue for all (AAPL -8% post Q4)
#4: IT plays a critical role in the required transformation for all telcos Overcome complexity using standards to facilitate interaction with 3rd parties

DISCOVER, DISRUPT, DELIVER 11
1. The big picture - revenue growth forecasts
2. ICT Hypersector – 2013 TSR performance
3. Growth outlook, sustainability and bundling
4. IT plays a critical role in our transformation

DISCOVER. DISRUPT. DELIVER
Telcos are in a key position in the ICT industry
12
$ 1,116 bn $ 1,627 bn
Devices
+HW2
Digital
Content + IT
solutions3
Connectivity1
Customer
$ 1,574 bn
$ 4,317 bn Total size of the ICT Hypersector (2012)
1. Includes Mobile voice and data, fixed voice and data. 2. Includes Consumer Electronics & mobile devices contributing $788Bn
(phones, PCs, tablets, game consoles, Flat panel TVs, and other CE) + hardware and telecom equipment. 3. Includes Information
Technology (IT services, software) + Digital contents (TV/Filmed, B2B, internet advertising, video games, radio/music,
newspapers/magazines/books)
12
Smartphones and tablets
(linked to telecom networks)
drive growth
• Core telco business
• >35% of the hypersector, led
by mobile voice and data
• >$200bn growth in 2012-16
• Customers increasingly
access content and apps
in the cloud
• Telecom networks are
key to use cloud services

DISCOVER. DISRUPT. DELIVER 13
Global Telecom revenues forecast (+$234bn by 2016F)
1,326
1,536
1,770
2008 2012 2016F
Telecom market (USD Bn)
3.8%
CAGR
3.6%
CAGR
North America
309 353 417
2008 2012 2016F
3.4% 4.2%
308 287 277
63 87 90
2008 2012 2016F
-1.7% -0.9%
Europe
223 220 235
186 252 334
2008 2012 2016F
-0.3%
Asia / Pacific (APAC)
138 188 246 99
149 171
2008 2012 2016F
10.6% 3.6%
Emerging Regions
8.1% 6.8%
1 – Developed countries in Asia / Pacific: Australia, Honk Kong,
Japan, Korea, Singapore, Taiwan
Source: IDC Black Book 2013
7.8% 7.3%
1.7%
8.4% 1.0%
LatAm
ME&A
Developed (1)
Emerging
W Europe
E Europe

DISCOVER. DISRUPT. DELIVER 14
Mobile revenues and KPI forecast (EU estimates are low)
40 72 105 32
82
164
37
65
77
13
33
64
9
30
38
73
104
32 17 12
31 25 20 19 12 10 11 11 12
8 7 6
2016F
24 21 20 26 21 23 24 14 11 36
12 8
15 7 5
84 57 46
109 111 98
116 84
73
59 79 100
57 84 91
123 172 206
Mobile Broadband Mobile Voice
Source: IDC, Pyramid Research (Sept-13), Yankee Group (Dec-12)
Revenues (US$ Bn) Revenues (US$ Bn)
2008 2012 2016F 2008 2012 2016F
2008 2012
2008 2012 2016F 141 282 448 103
318
606 129
380
607 29
222
673 48
244
532 53
657
Revenues per data enabled access
(US$ / month & subscription)
2008 2012 2016F
2008 2012 2016F
Data enabled accesses
(millions 3G+/4G/Wimax subscriptions)
450
2103
5361
167
345
544
10.5%
18.1%
4.4%
19.0%
10.0%
CAGR
12-16
-3.7%
-3.2%
-5.2%
1 – Developed countries in Asia / Pacific: Australia,
Honk Kong, Japan, Korea, Singapore, Taiwan
2 – Rest of the World: Emerging countries in Asia /
Pacific (China, India…) and Eastern Europe
548 587 614
2.1%
6.2%
218 273 311 288 368 401 518 562 623 450 573 661 577 991 1308
8070 Accesses (millions mobile lines)
4044
6325
CAGR
12-16
3558 4766
1993
20
Developed in APAC1 North America
LATAM RoW2
Western Europe
ME&A
2494
Monthly revenues per mobile line (US$)

DISCOVER. DISRUPT. DELIVER
What are industry analysts missing? Three main points
15
European telecoms are currently experiencing a triple-bottom in the
economic, regulatory and product cycles. Key highlights include:
Economy – After two years of negative GDP growth (-0.7% and -0.3%
in 2012-13), a recovery is on the way (2014 +1.0% and 2015 +1.5%)
Regulation – The tide could be turning in Brussels. A stable
investment framework and in-market consolidation are expected.
Product – The need to provide best-in-class customer experience
and superior network quality applies to Europe as well (FTTH/LTE)
Fixed broadband customer experience will radically improve with
superior network speeds and beyond connectivity bundles.
Rapidly declining prices for smartphones will drive mobile data
penetration much higher than currently anticipated across all markets.
Industry forecasts extrapolate for the next few years the main trends
from the recent past. Revenue growth in Europe should be higher.

DISCOVER, DISRUPT, DELIVER 16
1. The big picture – revenue growth forecasts
2. ICT Hypersector – 2013 TSR performance
3. Growth outlook, sustainability and bundling
4. IT plays a critical role in our transformation

DISCOVER. DISRUPT. DELIVER
Coverage universe (100 stocks)
TELCO
1.AMERICA MOVIL 26.OTE
2.AT&T 27.PORTUGAL TELECOM
3.BELGACOM 28.ROGERS
4.BELL CANADA 29.SINGTEL
5.BHARTI 30.SOFTBANK
6.BT 31.SPRINT
7.CABLEVISION 32.SWISSCOM
8.CHINA MOBILE 33.TDC
9.CHINA UNICOM 34.TEF BRAZIL
10.CHINA TELECOM 35.TEF DEUTSCHLAND
11.COMCAST 36.TELE2
12.DEUTSCHE TELEKOM 37.TELECOM ARGENTINA
13.ELISA 38.TELECOM ITALIA
14.ENTEL 39.TELEFONICA
15.ILIAD 40.TELEKOM AUSTRIA
16.KDDI 41.TELENOR
17.KPN 42.TELIASONERA
18.LIBERTY 43.TELSTRA
19.MILLICOM 44.TIM Br
20.MTN 45.TIME WARNER
21.NEXTEL 46.VERIZON
22.NTT 47.VIMPELCOM
23.NTT DOCOMO 48.VIVENDI
24.Oi 49.VODAFONE
25.ORANGE 50.ZIGGO
INTERNET, MEDIA AND TECHNOLOGY
1.21C FOX 26.IBM
2.ACCENTURE 27.INTEL
3.ADOBE 28.JUNIPER
4.ALCATEL 29.LENOVO
5.AMAZON 30.LINKEDIN
6.APPLE 31.MICROSOFT
7.ARM HOLDINGS 32.NASPERS
8.ASML 33.NETFLIX
9.BAIDU 34.ORACLE
10.BLACKBERRY 35.PRICELINE
11.BROADCOM 36.QUALCOMM
12.BSKYB 37.SAMSUNG
13.CANON 38.SAP
14.CISCO 39.SONY
15.CORNING 40.TAIWAN SEMI
16.CRM 41.TELEVISA
17.DIRECTV 42.TENCENT
18.DISCOVERY 43.TEXAS INSTR.
19.EBAY 44.TIME WARNER
20.EMC 45.VIACOM
21.ERICSSON 46.VMWARE
22.FACEBOOK 47.WALT DISNEY
23.GOOGLE 48.WPP
24.HONHAI 49.YAHOO
25.HP 50.ZTE
17

DISCOVER. DISRUPT. DELIVER
Telcos 2013 – TSR +27.2% (only 5.8% from dividend yield)
TSR performance in TELCO companies in 2013 (%)
Capital appreciation in 2013 (EUR bn)
51.1 48.1
27.6 21.6
16.9 16.2 14.9 14.3 13.9 12.2 7.8 7.5 7.4 7.2 5.8 5.6 5.0 4.6 3.4 3.3 3.3 3.0 2.9 2.4 1.8 1.7 1.7 1.6 1.4 1.2 1.1 1.0 0.9 0.8 0.6 0.6 0.4 0.4 0.3
-0.1 -0.2 -0.5 -0.6 -0.9 -1.5 -1.8 -2.2 -2.9 -3.0
-18.4
SFBK
VO
D
CM
CS
KD
DI
DT
NTT
DO
CO
MO BT S
VZ
TW
C
LBTY
TEF
TLSTRA
TN
OR
ATT
MTN
TLSN
TIM
Br
ST
SW
CM
VIP
VIV
OTE
BCE
ORA
ZIG
GO
TEO
TD
C
AM
X
ILIA
D
RO
G
MIL
LIC
OM TI
BH
RT
CVIS
ION
ELI
KPN
O2D
TKA
BCO
M
NEXTEL
PT
EN
TEL
TEF B
r
CU
TELE2
Cte
l
Oi
Cm
ob
1
8
195%
118% 107% 90%
69% 63% 61% 56% 56% 45% 43% 43% 43% 42% 41% 40% 35% 31% 30% 29% 26% 25% 25% 20% 19% 19% 18% 16% 15% 15% 14% 12% 11% 10% 9% 9% 4% 4% 4%
0% -3% -5% -7% -7% -8% -11% -25%
-49% -61%
SFBK
KD
DI
TEO
OTE
BT
VO
D
NTT
TIM
BR
DT
DO
CO
MO
ZIG
GO
TW
C
TDC
CM
CS
LBTY
VIP
TN
OR
TLSTRA
TLSN
MTN
SW
CM
ELI
CVIS
ION
VIV
TEF
VZ
MIL
LIC
OM ST
ILIA
D
ORA
BCE
O2D
RO
G
ATT TI
BCO
M
BH
RT
KPN
AM
X
TEF B
R
TKA
CU
CTel
CM
ob
PT
TELE2
EN
TEL Oi
NEXTEL
TEF
TEF B
r
O2D
TEF
O2D
TEF B
r
Source: Bloomberg (TSR and Consensus Tracker), Dec 2013
CM
ob
CTel

DISCOVER. DISRUPT. DELIVER
Average 12M FWD EPS declined 5% but PE re-rated by +40%
193%
112% 100% 94% 90%
64% 56% 53% 50% 45% 41% 39% 39% 39% 34% 31% 29% 23% 22% 22% 20% 20% 20% 16% 15% 14% 14% 14% 13% 11% 8% 8% 6% 6% 4% 4% 4% 4% 2%
-3% -4% -7% -9% -9% -11% -16% -28% -38%
-57% -61%
SFBK
KD
DI
TEO S
OTE
BT
NTT
VO
D
TIM
Br
DT
LBTY
TW
C
DO
CO
MO
CM
CS
ZIG
GO
TD
C
TN
OR
VIP
MTN
TLSN
TLSTRA
CVIS
ION
SW
CM
TEF
ELI
ILIA
D
MIL
LIC
OM VZ
VIV ST
ORA
BCE
RO
G TI
ATT
BH
RT
KPN
O2D
AM
X
BCO
M
TKA
CU
TEF B
r
Cte
l
Cm
ob
PT
EN
TEL
TELE2 Oi
NEXTEL
442%
51% 36% 32% 28% 24% 22% 13% 13% 12% 12% 12% 10% 9% 9% 9% 8% 8% 8% 7% 6% 5% 5% 2% 1% 1%
0% -1% -1% -3% -4% -4% -13% -14% -14% -16% -19% -19% -19% -21% -24% -29% -36% -37% -48%
-61% -61% -69% -74%
NEXTEL
ILIA
D
TEO
CU
CM
CS
KD
DI
VZ
SFBK
TN
OR
BT
NTT
TLSTRA
TW
C
ZIG
GO
MTN
VIP
Cte
l
RO
G
BH
RT
OTE
TLSN
TKA
ATT
ST
DO
CO
MO
TD
C
DT
ELI
BCE
SW
CM
Cm
ob
TIM
Br
Oi
AM
X
TEF B
r
ORA
BCO
M
VO
D
TEF
LBTY
EN
TEL
MIL
LIC
OM TI
VIV
CVIS
ION
TELE2
PT
KPN
O2D
294% 240% 159% 130%
119%
88% 79% 79% 78% 71% 64% 63% 61% 57% 47% 46% 45% 43% 39% 37% 31% 29% 27% 23% 23% 19% 19% 16% 14% 14% 14% 12% 9% 9% 9% 8% 7% 0%
-1% -2% -3% -5% -7% -9% -10% -19% -24% -31% -50%
O2D
KPN
SFBK
CVIS
ION
PT
VO
D
VIV
LBTY
OTE
KD
DI
TI
MIL
LIC
OM
TELE2
TIM
Br
TEO
BT
DT
TEF
NTT
DO
CO
MO
TD
C
ORA
TW
C
SW
CM
ZIG
GO
AM
X
BCO
M
ELI
TLSN
TN
OR
VIP
MTN
BCE
ST
CM
CS
TSTRA
TEF B
r
NEXTEL
ATT
RO
G
BH
RT
EN
TEL
VZ
TKA
CM
ob
CTel
ILIA
D
CU Oi
Capit
al R
etu
rn (
%)
∆ 1
2m
FW
D E
PS
∆ 1
2m
FW
D P
E
1
9
TEF
TEF B
r
O2D
TEF
TEF B
r
O2D
TEF
TEF B
r
O2D
Source: Bloomberg (TSR and Consensus Tracker), Dec 2013
CM
ob
CTel
CM
ob
CTel
CM
ob
CTel

DISCOVER. DISRUPT. DELIVER
EPS cuts driven by weak revenues and lower margins
20
Revenue
Gro
wth
(%
)
EBIT
Marg
in
Change (
%)
Share
s C
hange &
Rest
* (%
)
*Rest = Changes in Net Income margin vs. EBIT Margin
79% 67%
37%
17% 15% 15% 15% 12% 9% 8% 8% 8% 5% 5% 5% 5% 4% 3% 3% 3% 3% 3% 3% 2% 2% 1% 1% 1% 1% 1% 0%
0% -1% -1% -2% -2% -5% -5% -5% -6% -8% -8% -8% -9% -12% -17% -20% -27% -34%
SFBK
LBTY
TEO
EN
TEL
KD
DI
ILIA
D
CU
CTEL
CM
OB
BH
RT
CM
CS
MIL
LIC
OM
DT
BCE
TIM
Br
VZ
TN
OR
DO
CO
MO
RO
G
MTN
TLSTRA
TEF B
r
SW
CM
ATT
TW
C
NTT
BT Oi
TKA
ZIG
GO
VO
D
ELI
AM
X
BCO
M
VIP
TLSN
KPN
ORA
O2D
TD
C ST
PT
CVIS
ION
TEF
OTE TI
VIV
TELE2
NEXTEL
TEF
O2D
TEF B
r
299%
109%
42% 42% 26% 23% 22% 17% 17% 14% 12% 11% 10% 10% 9% 4% 2% 1% 1% 0%
-2% -2% -3% -5% -6% -8% -9% -10% -13% -13% -14% -17% -18% -19% -22% -23% -24% -28% -34% -36% -53% -55% -57% -61% -68% -73% -82%
-136% -353%
NEXTEL Oi
ILIA
D
TKA
BH
RT
KD
DI
VZ
CU
OTE
TLSN
TN
OR
BT
TLSTRA
CM
CS
TD
C
RO
G
MTN
BCE
VIP
NTT
DT
TW
C
ELI
DO
CO
MO
ZIG
GO
SW
CM
TIM
Br
ATT
VO
D
TEF
ORA TI
CM
OB
BCO
M
AM
X
ST
PT
CTEL
TEF B
r
EN
TEL
MIL
LIC
OM
KPN
TELE2
O2D
VIV
TEO
SFBK
CVIS
ION
LBTY
TEF
TEF B
r
O2D
265% 177% 96%
53% 50% 32% 24% 23% 17% 16% 15% 14% 12% 11% 10% 10% 9% 8% 4% 4% 3% 3% 3% 2% 2% 2% 2% 0% 0%
0% 0% -1% -2% -3% -3% -4% -5% -5% -6% -6% -7% -7% -8% -10% -14% -27% -30% -38%
-143%
LBTY
NEXTEL
CVIS
ION
TEO
VIV ST
CTEL
TELE2
TEF B
r
MIL
LIC
OM
SFBK
ZIG
GO
ATT
CM
CS
NTT
TW
C
VIP
AM
X
CM
OB
MTN
TEF
DO
CO
MO
ELI
ORA
SW
CM
BCO
M
OTE
RO
G
BT
CU
TIM
Br
TLSTRA TI
TD
C
TN
OR
DT
VZ
EN
TEL
VO
D
TLSN
ILIA
D
BCE
O2D
KPN
KD
DI
BH
RT
PT
TKA Oi
TEF
TEF B
r
O2D
CM
ob
CTel
CM
ob
CTel
CM
ob
CTel

DISCOVER. DISRUPT. DELIVER
ICT (ex Telcos) 2013 - TSR +48.2% (1.6% dividend yield)
TSR performance in ICT (Ex Telcos) companies in 2013 (%)
Capital appreciation in 2013 (EUR bn)
298%
242%
105% 103% 103% 101% 99% 93% 89% 87% 77% 68% 60% 59% 59% 58% 57% 55% 49% 46% 45% 44% 44% 43% 42% 38% 38% 31% 31% 27% 25% 22% 18% 17% 16% 16% 15% 14% 12% 8% 8% 4% 2% 1% 0%
0% -5% -9% -10% -37%
NFLX
ALCATEL
FB
YH
OO
NPN
HP
TCN
T
SO
NY
LKD
PCLN
BID
U
VIA
WPP
AM
ZN
AD
BE
GO
OG
21CFO
X
DIS
TW
X
TXN
GLW
MSFT
ARM
ASM
L
DIS
C
LEN
OVO
DTV
CRM
INTC
ACN
ERIC
QCO
M
ZTE
CSCO
TELEVIS
A
ORCL
JN
ET
BSY
TSEM
AAPL
EBAY
SAP
CN
ON
HO
NH
AI
EM
C
IBM
VM
WR
BCO
M
SM
SG
BBRY
2
1 Source: Bloomberg (TSR and Consensus Tracker), Dec 2013
100.2
64.9
52.3 49.5 43.3
34.3
21.3 20.0 19.7 19.5 19.4 18.4 16.1 15.6 15.2 15.1 14.4 11.9 11.3 10.7 10.3 8.9 8.6 8.1 8.0 7.8 7.3 7.1 6.6 6.3 5.8 5.6 5.5 5.2 4.9 3.6 2.3 2.0 1.7 1.5 1.1 0.8
-0.1 -0.2 -0.2 -1.4 -1.5 -1.7 -3.2
-14.5
GO
OG
MSFT
FB
AM
ZN
TCN
T
DIS
21C F
OX
PCLN
BID
U
HP
INTC
AAPL
ORCL
NPN
YH
OO
QCO
M
TW
X
NFLX
VIA
CSCO
TXN
ASM
L
LKN
D
AD
BE
WPP
ACN
DTV
DIS
C
ALCATEL
SO
NY
CRM
GLW
ARM
TSEM
ERIC
EBAY
LEN
OVO
SAP
TELEVIS
A
BSY
JN
ET
ZTE
CN
ON
EM
C
HO
NH
AI
VM
WR
BCO
M
BBRY
IBM
SM
SG

DISCOVER. DISRUPT. DELIVER
12M FWD EPS growth (>20%) and PE re-rating (>30%) C
apit
al R
etu
rn (
%)
∆ 1
2m
FW
D E
PS
∆ 1
2m
FW
D P
E
298% 242%
105% 103% 102% 99% 96% 91% 89% 87% 77%
66% 59% 59% 58% 56% 55% 53% 46% 43% 42% 42% 42% 41% 40% 38% 34% 31% 26% 24% 21% 20% 18% 15% 15% 15% 14% 10% 9% 8% 5% 3%
0% -1% -1% -2% -5% -10% -11% -37%
NFLX
ALCATEL
FB
YH
OO
NPN
TCN
T
HP
SO
NY
LKD
PCLN
BID
U
VIA
AM
ZN
AD
BE
GO
OG
21CFO
X
WPP
DIS
TW
X
ARM
DIS
C
TXN
ASM
L
GLW
MSFT
DTV
LEN
OVO
CRM
INTC
ACN
ERIC
QCO
M
ZTE
TELEVIS
A
ORCL
JN
ET
CSCO
BSY
TSEM
EBAY
AAPL
SAP
CN
ON
EM
C
HO
NH
AI
IBM
VM
WR
SM
SG
BCO
M
BBRY
330% 147%
92% 75% 73%
46% 41% 37% 36% 35% 29% 28% 28% 25% 23% 23% 18% 17% 17% 16% 16% 16% 16% 14% 13% 12% 11% 9% 9% 8% 7% 7% 7% 7% 7% 5% 3% 2% 1% 0% 0% 0%
-4% -8% -8% -9% -12% -15% -17%
-158%
NFLX
BBRY
SO
NY
LKD
FB
YH
OO
ARM
AM
ZN
NPN
PCLN
LEN
OVO
TCN
ZTE
ASM
L
JN
ET
TXN
VM
WR
QCO
M
TW
X
WPP
DIS
C
VIA
DIS
EBAY
DTV
GO
OG
HP
IBM
ERIC
ORCL
BSY
CN
ON
GLW
EM
C
BID
U
ACN
SAP
TELEVIS
A
CRM
CSCO
SM
SG
TSEM
HO
NH
AI
21CFO
X
INTC
MSFT
AAPL
AD
BE
BCO
M
ALCATEL
724%
88% 78% 70% 62% 53% 51% 48% 43% 41% 40% 39% 37% 34% 33% 32% 30% 25% 22% 22% 20% 18% 18% 16% 15% 14% 14% 13% 11% 8% 8% 6% 4% 3% 3% 2% 1% 0% 0% 0%
-1% -6% -7% -7% -7% -8% -10% -10% -19%
-88%
BBRY
AD
BE
HP
21CFO
X
BID
U
MSFT
TCN
T
NPN
VIA
GO
OG
YH
OO
PCLN
INTC
WPP
DIS
GLW
CRM
TW
C
DIS
C
DTV
AAPL
FB
ACN
AM
ZN
TXN
CSCO
ASM
L
TELEVIS
A
ERIC
BCO
M
LKD
ORCL
LEN
OVO
HO
NH
AI
BSY
QCO
M
ARM
SAP
SM
SG
TSEM
SO
NY
EBAY
CN
ON
EM
C
JN
ET
NFLX
IBM
ZTE
VM
WR
ALCATEL
2
2 Source: Bloomberg (TSR and Consensus Tracker), Dec 2013

DISCOVER. DISRUPT. DELIVER
EPS growth driven by strong revenue growth and margins
23
Revenue
Gro
wth
(%
)
EBIT
Marg
in
Change (
%)
Share
s C
hange &
Rest
* (%
)
*Rest = Changes in Net Income margin vs. EBIT Margin
50% 49% 38% 38% 34% 32% 32% 30% 30% 28% 22% 22% 17% 17% 14% 14% 10% 9% 8% 8% 7% 7% 6% 6% 6% 4% 4% 3% 3% 3% 2% 2% 1% 0% 0% 0%
0% 0% -1% -1% -3% -3% -3% -5% -5% -6% -11% -26%
-76%
LN
KD
FB
BID
U
TCN
T
PCLN
NPN
CRM
NFLX
ASM
L
ARM
DIS
C
DIS
C
SO
NY
AM
ZN
EBAY
QCO
M
VM
WR
WPP
LEN
OVO
GO
OG
GLW
BSY
JN
ET
EM
C
CN
ON
DTV
MSFT
TELEVIS
A
ALCATEL
TXN
VIA
TW
X
ACN
ERIC
SAP
TSEM
AD
BE
ORCL
BCO
M
YH
OO
HP
ZTE
INTC
IBM
CSCO
AAPL
21C F
OX
HO
NH
AI
BBRY
644% 488% 291% 118% 101%
38% 31% 29% 28% 27% 23% 20% 20% 17% 15% 13% 11% 11% 10% 9% 9% 8% 8% 8% 7% 6% 5% 3% 3% 2% 1% 0%
-3% -5% -6% -6% -7% -7% -10% -17% -17% -20% -22% -31% -32% -40% -41% -41%
-315%
BBRY
NFLX
ZTE
LN
KD
SO
NY
FB
VM
WR
TXN
GLW
LEN
OVO
JN
ET
HO
NH
AI
21C F
OX
AM
ZN
TW
X
WPP
ERIC HP
VIA
GO
OG
YH
OO
EBAY
IBM
ARM
SAP
PCLN
CSCO
BCO
M
ACN
EM
C
ORCL
TSEM
QCO
M
CN
ON
ASM
L
TELEVIS
A
BSY
DTV
INTC
TCN
T
NPN
MSFT
AAPL
CRM
AD
BE
BID
U
DIS
C
DIS
C
ALCATEL
153%
38% 36% 36% 21% 16% 16% 15% 8% 8% 7% 7% 6% 6% 6% 5% 5% 5% 5% 4% 3% 3% 3% 2% 2% 1% 1% 1% 0%
0% -2% -5% -5% -5% -5% -5% -6% -7% -8% -14% -17% -20% -22% -26% -29%
-93% -186%
-261% -425%
ALCATEL
YH
OO
DIS
C
DIS
C
NPN
AD
BE
DTV
AAPL
BID
U
MSFT
BSY
ORCL
QCO
M
CN
ON
IBM
TCN
T
INTC
ARM
TELEVIS
A
AM
ZN
ERIC
VIA
ASM
L
HP
HO
NH
AI
ACN
CRM
CSCO
TSEM
TW
X
EM
C
GO
OG
SAP
PCLN
TXN
WPP
JN
ET
LEN
OVO
EBAY
FB
21C F
OX
BCO
M
VM
WR
SO
NY
GLW
LN
KD
NFLX
ZTE
BBRY

DISCOVER, DISRUPT, DELIVER 24
1. The big picture – revenue growth forecasts
2. ICT Hypersector - 2013 TSR performance
3. Growth outlook, sustainability and bundling
4. IT plays a critical role in our transformation

DISCOVER. DISRUPT. DELIVER
Telco: Revenue growth and EBIT growth
25
Telco: Revenue growth and EBIT growth (2015/14 calendar year)
Revenue growth
(2yr vs. 1yr FWD)
EBIT
gro
wth
(2yr
vs.
1yr
FW
D)
*Data as of 22 January 2014
DISCOVER. DISRUPT. DELIVER
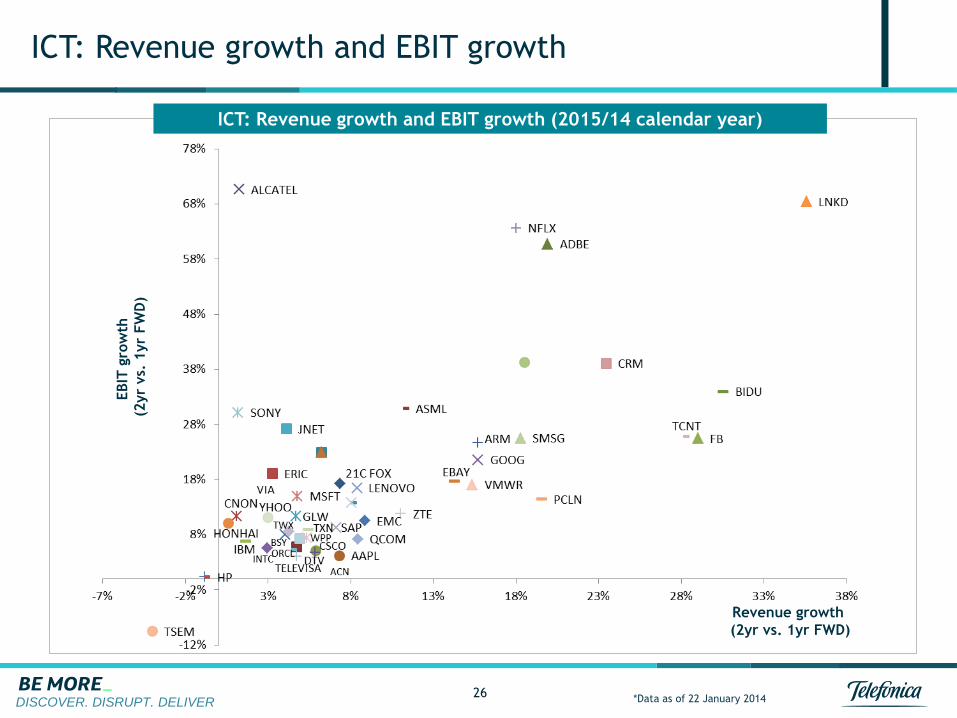
ICT: Revenue growth and EBIT growth
26
ICT: Revenue growth and EBIT growth (2015/14 calendar year)
Revenue growth
(2yr vs. 1yr FWD)
EBIT
gro
wth
(2yr
vs.
1yr
FW
D)
*Data as of 22 January 2014

DISCOVER. DISRUPT. DELIVER
Long term sustainability is critical – AAPL vs. AMZN/GOOG
27
EV / EBITDA
5x
$57.6Bn
32.5
25.1
3Q13
+6% 25.6
3Q13
16.8
3Q13
x%
+20% +17%
Crec. anual ing
x% EBIT %
30%
23%
• iPhone revenues are larger than all of Amazon or Google but they are growing less and there is no certainty about the long term
• What if average prices per unit fall below current $600+ level? What if units sold peak in the future?
Revenues Q4 2013 calendar ($Bn)
2%
EV / EBITDA
24x
EV / EBITDA
13x
EV / OpFCF
6.5x
EV / OpFCF
62x
EV / OpFCF
17x

DISCOVER. DISRUPT. DELIVER
Telcos less profitable and lower growth, same multiples
28
Absolute Valuation
€Bn
Multiples Comparison
Telcos
ICT (ex Telcos)
Telcos
ICT (ex Telcos)
We track the top
100 stocks in the
ICT Hypersector
(50 telcos and 50
from the Internet,
Media and
Technology space).
For full details see
TSR and Consensus
Tracker – ICT
Hypersector (31st
Dec 2013).
1.5x
-0.7x
Net Debt/
EBITDA
32% 23%
17% 6%
16% 17% 9%
14%
x% Margin as % of revenues
1,193
387
201 187 107
1,349
313
80
233 187
Revenues EBITDA CAPEX OpFCF FCF
2,178
1,599
579
2,773 3,006
(233)
EV Market cap Net debt
5.6x
11.7x
6.7%
8.9x
11.9x
6.2%
EV/EBITDA EV/OPFCF FCF YIELD
Big Picture Comparison
€Bn

DISCOVER. DISRUPT. DELIVER
Follow three rules for sustainable exceptional performance
29
Deloitte researched 25,000 listed companies over a 45 year period (1966-2010) and concluded that only 344 (1.4%) generated sustained exceptional performance based on three rules:
Rule #1: Better Before Cheaper Compete on differentiators other than price
Rule #2: Revenue Before Cost Prioritize increasing revenue over reducing costs
Rule #3: Change anything to follow rules 1 and 2

DISCOVER. DISRUPT. DELIVER
Client life time value – bundle connectivity plus services
30
ARPU
£
Churn
(annualized)
Average life
as client
(years)
Total
revenues
(£ per client)
1P 2P 4P
+
Example 3P
B2B
B2C

DISCOVER. DISRUPT. DELIVER
Focus on long term sustainability and superior TSRs
31
Gain revenue market share
with best network
Efficiency improvement
and strict financial discipline
In-market consolidation
Superior total shareholder returns

DISCOVER, DISRUPT, DELIVER 32
1. The big picture – revenue growth forecasts
2. ICT Hypersector - 2013 TSR performance
3. Growth outlook, sustainability and bundling
4. IT plays a critical role in our transformation

DISCOVER, DISRUPT, DELIVER
To be able to respond in this market, Global Telcos need to
overcome their current intrinsic complexity
33
• SLOW in responding to
business needs
• High COST of IT
solutions
• Complex USE OF DATA
and difficulty to obtain
CUSTOMER INSIGHTS
• Difficulty in BEING
DIGITAL
Impact
Drivers of Complexity
IT
• Business imposing
changes to IT but not
considering
implications and
business changes
needed
• Several systems not
convergent with
duplicate applications,
processes and products
per technology/segment
• False conception of
technology changing
web, without
evaluating real
requirements to offer
a multi-channel
experience • Lack of common IT
understanding or
integrity inside the
Operator
• Skills and experience
developed locally as
each local operator has
different processes and
products, avoiding
reutilization
• Product-centric
systems with high
customization to
develop specific
products and
increasing
complexity
• Rapid evolution of the
business and lack of
maturity of IT processes
and technologies
• Incremental changes with
focus on the short term
not considering the long
term vision of business
• Local regulation
imposing
specific products
• Acquisitions of
developed operators
with different systems
and processes
establishing a complex
architectures
panorama

DISCOVER, DISRUPT, DELIVER
Mature industry standards allow for a business led
transformation that will enable significant business benefits
Improve
customer
experience
Out of the box
• Software packaged by
3rd party provider
Full-stack solutions
• Pre-integrated suite of
components
• Best of suite (i.e. covers all
major domains)
Unique data
• Consumer
• Product catalogue
• Inventory
End-to-end processes
• Transform processes
in parallel with
applications
Enabled by standard based
processes (E-TOM),
architecture (TAM) and
information framework (SID) Easy to integrate with
• Loosely coupled (i.e. allows
for substitution of modules
with minimum disruption)
• Web-services/SOA
integration
Non “incremental”
investments
• Freeze legacy expenditure
(i.e. mostly evolutive)
• Fast implementation
minimizes coexistence (i.e.
double maintenance costs)
Enable
business agility
Exploit data
Enable
convergence
Improve and
enable
efficiencies
34

DISCOVER, DISRUPT, DELIVER
Integration will enable seamless interaction with Digital
Services Providers
Standards are a key enabler… … to the homogeneous integration of services
and reusable capabilities in OBs2 (via APIs)
• Common Interface
• Do once, reuse many times
• Faster implementation of new services
(TTM)
• Lower cost of integration with OBs
DSP1 –
Operator
3rd Party
CSP – OB1 CSP – OB2 CSP – OBn . . . .
35
1) DSP: Digital Service Provider; 2) OB: Operating Business
Consistent and
common
integration
surface; from
OBs to digital
service providers
and from digital
service providers
to OBs
Common language, via standards, for the integration of
digital services across the business and within the
supplier environment to ensure consistency of service
and benefits
Simple governance
process that allows
group wide
development and
“in life”
management of the
integration of digital
services
Common interface
with all OBs


© 2013 TM Forum | 37
V2013.4
inform innovate accelerate optimize
How does the digital wave
impact TMForum activities
Laurent Leboucher
TMForum SAS chair
Orange VP APIs and Digital Ecosystems
February 10th

© 2013 TM Forum | 38
V2013.4
The digital economy brings new
opportunities and new challenges …

© 2013 TM Forum | 39
V2013.4
… and will lead
very fast to new roles and
new combinations

© 2013 TM Forum | 40
V2013.4
The digital transformation is at the
core of TMForum programs …
Revenue Management Customer Experience
Management
Agile
Business
Program
Open
Digital
Program
Customer
Engagement
Program
Partner Management Business Process
Optimization
Cloud & Virtualization
IT Transformation
Product Lifecycle Management
Big Data Analytics & Policy Management
Security & Privacy

© 2013 TM Forum | 41
V2013.4
… but it stresses the importance of
the following deliverables for
Framework 14 (this is not exhaustive)
• NFV, SDN: impact on processes, impact on “OSS”
• Digital Services Reference Architecture
• Digital management APIs roadmap (trouble ticket, SLA
management, ordering, product catalog, product lifecycle,
service catalog, billing account, party, …)
• Big Data Analytics: from uses cases to proof of concepts
• CEM index and maturity model
• Digital security and privacy management
• And of course a solid set of frameworks which adresses all
these impacts without overspecifying!

© 2013 TM Forum | 42
V2013.4
To succeed, we need diversity:
CSP+DSP+vendors+adjacent
industries

© 2013 TM Forum | 43
V2013.4
Thank You!

© 2013 TM Forum | 44
V2013.5
DSRA Update Digital Services Reference Architecture
Part of the Open Digital Initiative Project
Eric Troup – Microsoft [email protected]

© 2013 TM Forum | 45
V2013.5
Relationship to Frameworks
Enterprise Management
Strategy, Infrastructure & Product Operations
Fulfillment Assurance Billing &
Revenue
Management
ProductLifecycleManagement
InfrastructureLifecycleManagement
Operations
Support &
Readiness
Customer Relationship Management
Service Management & Operations
Resource Management & Operations
Supplier/Partner Relationship Management
Strategy &
Commit
Marketing & Offer Management
Service Development & Management
Resource Development & Management
Supply Chain Development & Management
(Application, Computing and Network)(Application, Computing and Network)
Enterprise Effectiveness
ManagementKnowledge & Research
Management
Enterprise Risk
Management
Strategic & Enterprise
Planning
Financial & Asset
ManagementStakeholder & External
Relations Management
Human Resources
Management

© 2013 TM Forum | 46
V2013.5
Digital Services are Multi-Cloud
Application Framework (TAM) challenged by
Open Digital Services Ecosystem requirements

© 2013 TM Forum | 47
V2013.5
ETSI NFV Example
San Jose Workshop
• Single Service Provider Centric
• Scenario Specific SDP Functions
One OSS
(Application Framework?)
Single Service Provider Centric
Application Specific
SDP Functions

© 2013 TM Forum | 48
V2013.5
Network Function Virtualization (NFV)?
Should be
Digital Service Function Virtualization (DSFV)
A Common Architecture
for Digital Service Management
NaaS
Network Virtualized CP
Resources
Network Trans/Access
Resources
SaaS
Cloud Virtualized Resources
Network Virtualized Resources
DSRA goal is a common set of reusable service lifecycle management
capabilities for use across virtualized data centers, networks and devices. DSRA
enables many different industry vertical scenarios such as Connected Car, Home,
Media, Healthcare, Government and Energy etc.
Focus

© 2013 TM Forum | 49
V2013.5
Service Enablement Layer or API Exchange Function
Digital Services
Reference Architecture
Development
Service
Deployment
Exposure
Consumption
Implementation
Commerce
Functions
API Broker/Platform (Functional and SMI)
Federated ID & Profile Management, Analytics,
Transaction Management, Events/Notification
Service Catalog Service End Point Catalog
Download /
Utilization
Application Map for the new Open Digital Services Economy

© 2013 TM Forum | 50
V2013.5
DSRA Key Characteristics
Key Pillars 1. Federated Identity &
2. Profile Management
3. Distributed (Multi-Cloud)
Transaction Management.
4. Service Event Notification &
Management
• SMI API
5. Analytics
Key Features 1. Transaction Traceability across Multi-Cloud
2. Eventing
3. Federated Identity / Data Security
4. Runtime Management in Multi-Cloud/Multi-
Tenant
5. Service Broker Model
6. Developer Support
7. Service Composition / Runtime Orchestration
8. Change Sets, Data Driven Architecture
9. End-to-End Analytics
10.Commercial Management of Services /
Partners
11.High Level CxO DSRA Positioning Message
Infrastructure Abstraction / Virtualization

© 2013 TM Forum | 51
V2013.5
Leveraging TOGAF Architecture
Development Model
Catalysts
Member Projects
Industry Initiatives
e.g. NFV (DSFV) Management

© 2013 TM Forum | 52
V2013.5
Need your Help to get this Right

© 2013 TM Forum | 53
V2013.5
Logistics

© 2013 TM Forum | 54
V2013.5
Emergency meeting location
Meeting rooms
Break schedule
Lunch schedule
Daily Agendas
General Sessions
Help and information
IPR statements for meetings
Agenda

© 2013 TM Forum | 55
V2013.5
Event Wi-Fi
Network – Swisscom
User – EVENT/TMFORUM
Password – TMFO3UM
Logistics
The Most Important Information

© 2013 TM Forum | 56
V2013.5
Meeting Location – The Blue Building
directly across the street from the main
hotel entrance.
c/ Padre Damian, 21
Logistics
Emergency

© 2013 TM Forum | 57
V2013.5
Logistics
Meeting Rooms

© 2013 TM Forum | 58
V2013.5
Morning Coffee Break 10:30am – 11:00am
Lunch 12:30pm - 1:30pm
Afternoon Coffee Break 3:00pm – 3:30pm
Logistics
Break Schedule
Activities with prizes at many of the break sessions

© 2013 TM Forum | 59
V2013.5
Coffee
Monday -
Thursday
Logistics
Break Locations
Praga

© 2013 TM Forum | 60
V2013.5
Monday – Thursday in the
upstairs restaurant, Florencia
Friday in Praga
Logistics
Lunch Locations

© 2013 TM Forum | 61
V2013.5
• The Daily Agenda is available at the registration area,
located just outside the main elevators.
• TM Forum staff are always available to help
Logistics
Daily Agendas
Registration
Area

© 2013 TM Forum | 62
V2013.5
Liaison Program on Tuesday
Internet of Things Panel Discussion on Wednesday
evening
Wrap up session on Thursday (reception following)
Future Collaborative Environment and Tools
Logistics
General Sessions

© 2013 TM Forum | 63
V2013.5
Blue shirts
Orange ties
Orange accessories
TM Forum name badges
Logistics
Help and Information
© 2013 TM Forum | 64
V2013.5
Project Meetings
Cross-Project Meetings
Informational Meetings
Logistics
IPR Statements for Meetings

© 2013 TM Forum | 65
V2013.5
Project Meetings
(Open to Project Participants Only)
This meeting is being conducted under the
terms of IPR Mode “xxxx” as defined in the By-
laws Annex 1: Policy on Intellectual Property
Rights. All IPR should be declared.
Logistics
IPR Statements for Meetings

© 2013 TM Forum | 66
V2013.5
Cross-Project Meetings
(Open to Eligible Persons Only, those who are
members of at least one project that is meeting)
This meeting is being conducted under the
terms of IPR Mode RAND as defined in the By-
laws Annex 1: Policy on Intellectual Property
Rights. All IPR should be declared.
Logistics
IPR Statements for Meetings

© 2013 TM Forum | 67
V2013.5
Informational Meetings
(Open Meetings, anyone can attend)
This is an open information meeting in which no
information or materials furnished or provided
by the attendee shall constitute or contain
intellectual property and will not be treated or
protected as such. All attendees understand
and accept this statement.
Logistics
IPR Statements for Meetings

© 2013 TM Forum | 68
V2013.5
Thank You!