strategic mass killings - homepage of joan maría estebanesteban.iae-csic.org/pdf/m_morelli3.pdf ·...
TRANSCRIPT
Strategic Mass Killings�
Joan Estebany, Massimo Morellizand Dominic Rohnerx
May 11, 2010
Abstract
Since World War II there have been about �fty episodes of large-scale mass
killings of civilians and massive forced displacements. They were usually
meticulously planned and independent of military goals. We provide a
model where con�ict onset, con�ict intensity and the decision to commit
mass killings are all endogenous, with two main goals: (1) to identify
the key variables and situations that make mass killings more likely to
occur; and (2) to distinguish conditions under which mass killings and
military con�ict intensity reinforce each other from situations where they
are substitute modes of strategic violence.
We predict that mass killings are most likely in societies with large
natural resources, signi�cant proportionality constraints for rent sharing,
low productivity and low state capacity. Further, massacres are more
likely in a civil than in an interstate war, as in the latter group sizes
matter less for future rents.
In non polarized societies there are asymmetric equilibria with only the
larger group wanting to engage in massacres. In such settings the smaller
�We are grateful to CEPR for sponsoring the con�ict conference in Gerzensee in July2009, where we started this project. We also thank Borek Vasicek and Peter Van der Windtfor research assistance. Helpful comments from Autumn Payton Lockwood, Kalle Moene,Debraj Ray, Alexander Wolitzky, Fabrizio Zilibotti and seminar and conference participants inPrinceton, EUI, IMT-Lucca, Oslo, Dehli, Barcelona and Madrid are gratefully acknowledged.
yInstitut d�Analisis Economica, CSIC, Barcelona. Email: [email protected]. JoanEsteban is a member of the Barcelona GSE Research Network funded by the Government ofCatalonia. He gratefully acknowledges �nancial support from the AXA Research Fund andfrom the Spanish Government CICYT project n. SEJ2006-00369.
zColumbia University and EUI. Email: [email protected] of Zurich. Email: [email protected]. Financial support from the Swiss
National Science Foundation (SNF grant no. 100014-122636) is gratefully acknowledged.
1
group compensates for this by �ghting harder in the �rst place. In this
case we can talk of mass killings and �ghting e¤orts to be substitutes. In
contrast, in polarized societies either both or none of the groups can be
ready to do mass killings in case of victory. Under the "shadow of mass
killings" groups �ght harder. Hence, in this case massacres and �ghting
are complements.
We also present novel empirical results on the role of natural resources
in mass killings and on what kinds of ethnic groups are most likely to be
victimized in massacres and forced resettlements, using group level panel
data.
JEL code: C72, D74.
Keywords: Mass Killings, Civil War, Natural Resources, Intensity of Con-
�ict, Group Size.
�If ever we are constrained to lift the hatchet against any tribe, we shall neverlay it down till that tribe is exterminated, or driven beyond the Mississippi."Thomas Je¤erson (from Mann, 2005: 70).
1 Introduction
Mass killings of civilians are obviously a serious problem. Since World War IIsome 50 episodes of mass killings have led to between 12 and 25 million civiliancasualties (Political Instability Task Force, 2010) and by 2008 have forced thedisplacement of 42 million people (UNHCR, 2009). Surprisingly, while there isan increasing number of formal models of civil and interstate wars,1 the issuesof mass killings and forced displacements have so far been largely neglectedin formal theory. What makes this neglect even more surprising is that masskillings seem to have di¤erent causes, motivations and implications with respectto other forms of con�ict. Indeed, mass killings are a manifestation of the worstof the human being, dominated by irrational hatred and uncontrolled passion.However, in Mann�s (2005: 9, 31) words, �to understand ethnic cleansing weneed a sociology of power more than a special psychology of perpetrators asdisturbed or psychotic people � though some may be. (...) All cases of cleansinginvolve material interests. Usually, members of an ethnic group come to believethey have a collective economic interest against an out-group.� In this paper,we examine whether decisions to exterminate the opponent can be explained as
1See e.g. Blattman and Miguel (2009) and Jackson and Morelli (2009) for the most updatedsurveys on civil and interstate wars, respectively
2
the result of strategic, rational calculation, independently of how these decisionshad been framed.The links between mass killings and warfare are complex. While mass killings
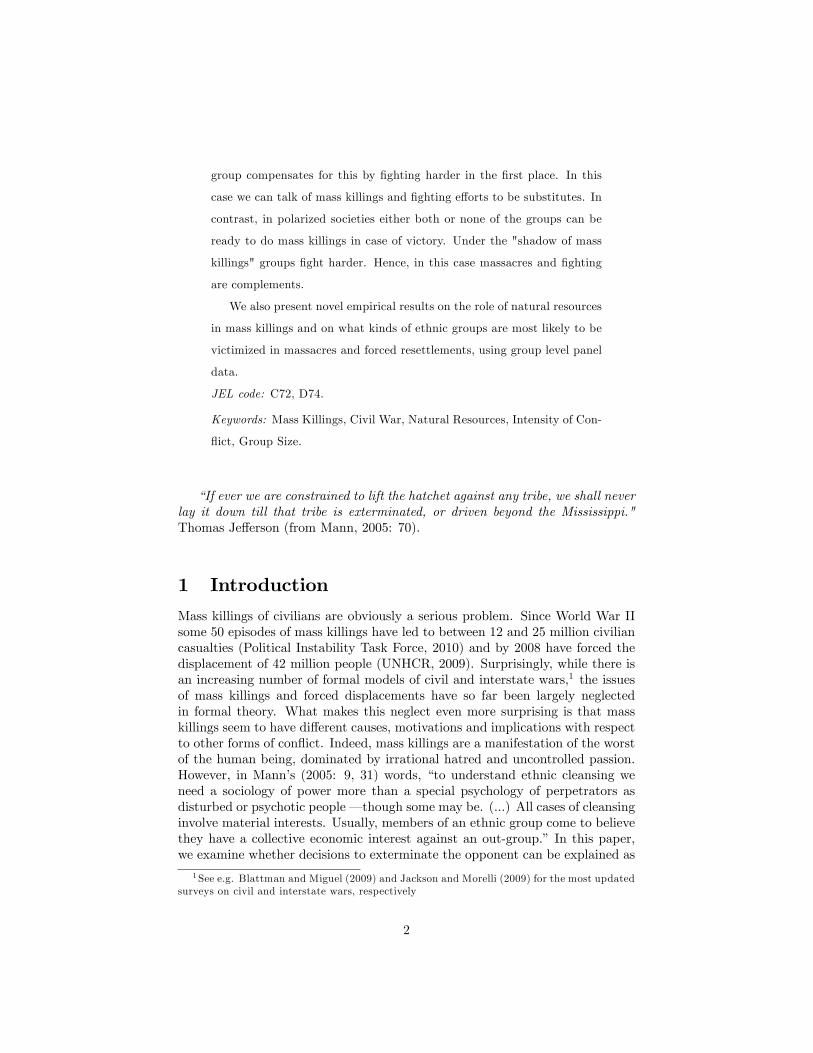
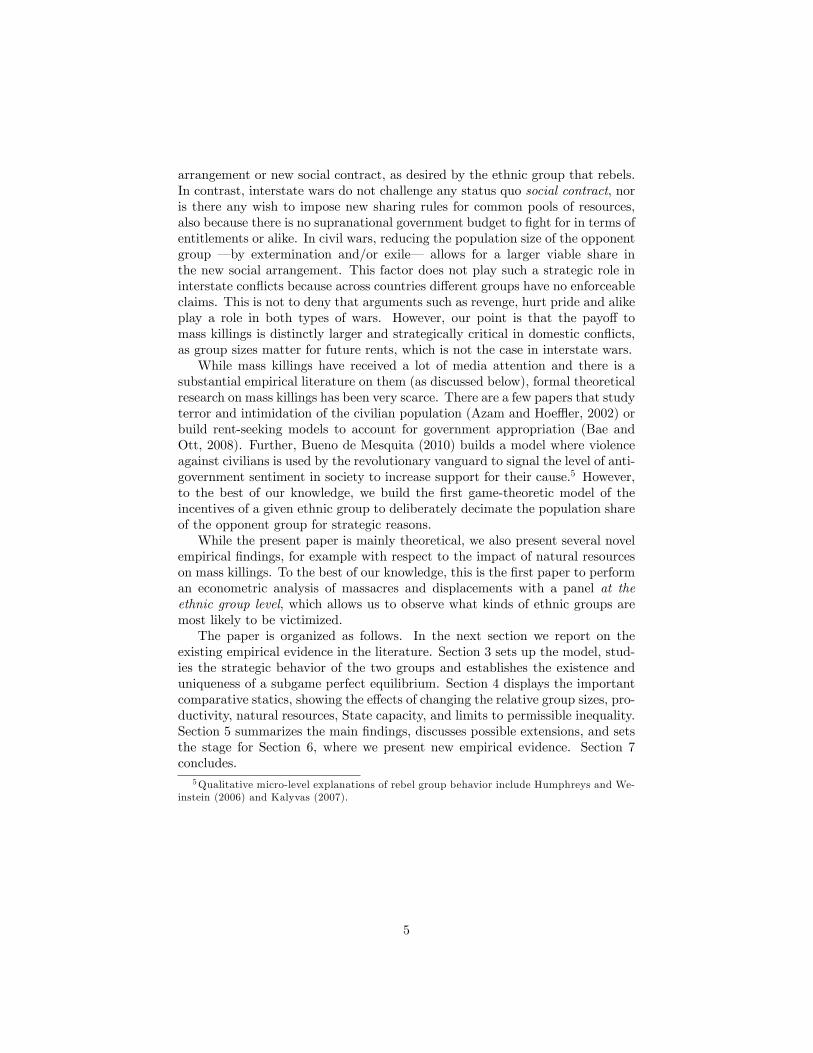
are present in many guerrilla wars (Valentino, Huth and Balch-Lindsay, 2004),there are also often episodes of mass killings perpetuated by the governmentin the absence of any armed opposition or rebellion. This was for examplethe case in several communist countries (e.g. Cambodia, China during theCultural Revolution, Stalinist USSR) or countries governed by military juntas(e.g. Myanmar) where the state controls most of the economy. Moreover, not allforms of war are equally likely to be accompanied by mass killings. A substantialfraction of civil wars entail deliberate mass killings of civil non-combatants on alarge scale, while there is almost no record of mass killings of this sort in post-WWII interstate wars. As shown in Figure 1, between 1960 and 2000 roughlya third of all civil wars (50 out of 152) featured mass killings, while in none ofthe interstate wars (23) there were mass killings.2
One distinctive feature is that mass killings are designed to kill, i.e. toreduce the size of the opponent groups, while other forms of con�ict are aboutwinning some �prize�and the fatalities they entail are merely a by-product ofappropriation. Hence, a natural question to ask is: Why could it be rational fora regime or group to engage in a costly activity that has as main goal to reducethe group size of the opponent?We will highlight the trade-o¤s involved when a group considers the possi-
bility of engaging in decimation of the opposition group�s size. While in thediscussion we mostly refer to mass killings, our analysis is meant to includeforced displacements, since they are another measure for reducing the size ofthe opposition group.3
In the model we assume that there are two groups,4 one of which initiallycontrols the government. The government and rebel factions decide �rst whetheror not to engage in �ghting and on the level of �ghting e¤ort. This endogenouslyyields the likelihood of the rebel faction taking over power at the end of thecon�ict. Then the group that is in power has the option to perform masskillings to decimate the group size of the opponent.Given that the minimum share of public spending that has to be given to the
2For Figure 1, data on mass killings in wars was taken from Valentino, Huth and Balch-Lindsay (2004), civil wars data from Collier, Hoe er and Rohner (2009), and data on interstatewars from Gleditsch and Ward (2007). According to Valentino, Huth and Balch-Lindsay (2004)the only mass killings during interstate war in recent decades took place during the KoreanWar, 1950-53 (which shared many features with civil wars).
3Given that the model will not distinguish between reductions of the size of a group bykilling and by forced displacements, we are basically thinking about the sum of the two. Aseparate research question could then be the study of the tradeo¤s between these potentiallysubstitute elimination methods.
4These groups could be identi�ed by any of the dividing lines in society, ethnicity, religion,race, class. We abstract from these distinctions. Also, we will not explicitly deal with morefractionalized societies. The countries with two large identi�able groups are empirically byfar the most dangerous places in terms of likelihood of the events we aim to rationalize (seebelow), hence we consider the di¢ cult extension to more than two groups something of lowpriority in the research agenda.
3
opposition group depends on their group size, mass killings allow the governmentgroup to increase their future rent share. This incentive has to be traded o¤against the reduction in economic output following mass killings. We �nd thatmass killings are more attractive for the group in power when natural resourcerents are large relative to economic production, and when state capacity isweak. Further, democratization and constraints on rent-sharing imposed fromthe outside can give incentives for the ruling group to substitute discriminationwith elimination. Paradoxically, if a�bad" regime is forced to treat minoritiesbetter than it otherwise would, this could fuel massacres, as killing opponentsbecomes more lucrative if the share of the rents is more closely tied to groupsizes. Further, it is found that large groups have greater incentives to engagein mass killings. This implies that in polarized societies there are symmetricequilibria where either both or none of the groups commit massacres, while inless polarized societies only the larger group performs mass killings.A recent, still ongoing case can illustrate the key features of mass killings that
we wish to capture. The mass killings in Sudan�s Darfur region started in 2003.�The primary perpetrators of the killings and expulsions are government-backed�Arab�militias. The main civilian victims are black �Africans�" (Straus, 2005:123). The estimates of the death toll vary between 70,000 and 400,000 fatalities,with an estimated 1.8 million people displaced (Straus, 2005, 2006; De Waal,2007). This corresponds to a signi�cant fraction of the total population in thisregion, which was about 6.5 million before the outbreak of the crisis. The killingsare clearly strategic, �directed by the state, targeted at a particular ethnicpopulation, and intended to destroy that ethnic population in substantial part�(Straus, 2006: 43). The early 21st century was characterized by natural resourceshocks (Sudan becomes an increasingly important oil producer) and politicalshocks (peace agreements in other parts of Sudan brought the expectation of�looming elections� and democratization) (Straus, 2005). At the same timeproductivity and state capacity of Sudan remained very low, and it becameincreasingly clear that the international community would be hesitant to rapidlyand forcefully intervene (Straus, 2005; 2006; De Waal, 2007). These factors ledto an explosive blend that made the mass killings in Darfur possible. Our papercontributes to bring together all these factors in a uni�ed model of strategicinteraction.Our framework also yields interesting predictions on how massacres and
warfare relate to each other. When selecting the optimal �ghting levels, thegroups take into account what levels of mass killings take place for each poten-tial outcome of the battle. In asymmetric equilibria � hence at low levels ofpolarization� the smaller group, which would not start massacres after victory,will compensate for this by �ghting harder in the �rst place. Thus, in thoseequilibria mass killings and warfare behave as substitutes. In contrast, compar-ing across symmetric equilibria � hence with high polarization� mass killingsand warfare behave as complements, i.e. the "shadow of massacres" makes bothgroups �ght harder.According to our theory, there is a fundamental di¤erence between civil
wars and interstate wars. The objective of a civil war is to impose a new social
4
arrangement or new social contract, as desired by the ethnic group that rebels.In contrast, interstate wars do not challenge any status quo social contract, noris there any wish to impose new sharing rules for common pools of resources,also because there is no supranational government budget to �ght for in terms ofentitlements or alike. In civil wars, reducing the population size of the opponentgroup � by extermination and/or exile� allows for a larger viable share inthe new social arrangement. This factor does not play such a strategic role ininterstate con�icts because across countries di¤erent groups have no enforceableclaims. This is not to deny that arguments such as revenge, hurt pride and alikeplay a role in both types of wars. However, our point is that the payo¤ tomass killings is distinctly larger and strategically critical in domestic con�icts,as group sizes matter for future rents, which is not the case in interstate wars.While mass killings have received a lot of media attention and there is a
substantial empirical literature on them (as discussed below), formal theoreticalresearch on mass killings has been very scarce. There are a few papers that studyterror and intimidation of the civilian population (Azam and Hoe er, 2002) orbuild rent-seeking models to account for government appropriation (Bae andOtt, 2008). Further, Bueno de Mesquita (2010) builds a model where violenceagainst civilians is used by the revolutionary vanguard to signal the level of anti-government sentiment in society to increase support for their cause.5 However,to the best of our knowledge, we build the �rst game-theoretic model of theincentives of a given ethnic group to deliberately decimate the population shareof the opponent group for strategic reasons.While the present paper is mainly theoretical, we also present several novel
empirical �ndings, for example with respect to the impact of natural resourceson mass killings. To the best of our knowledge, this is the �rst paper to performan econometric analysis of massacres and displacements with a panel at theethnic group level, which allows us to observe what kinds of ethnic groups aremost likely to be victimized.The paper is organized as follows. In the next section we report on the
existing empirical evidence in the literature. Section 3 sets up the model, stud-ies the strategic behavior of the two groups and establishes the existence anduniqueness of a subgame perfect equilibrium. Section 4 displays the importantcomparative statics, showing the e¤ects of changing the relative group sizes, pro-ductivity, natural resources, State capacity, and limits to permissible inequality.Section 5 summarizes the main �ndings, discusses possible extensions, and setsthe stage for Section 6, where we present new empirical evidence. Section 7concludes.
5Qualitative micro-level explanations of rebel group behavior include Humphreys and We-instein (2006) and Kalyvas (2007).
5
0
20
40
60
80
100
120
140
160
Interstatewars( IW)
Genocides inIW
% IW withgenocides
Civil wars (CW) Genocides inCW
% CW withgenocides
Figure 1: Mass killings in interstate and civil wars
2 Stylized Facts
2.1 De�nition of Mass Killings
Building on Charny (1999: 7) and Easterly, Gatti and Kurlat (2006: 132) wecan de�ne �mass killings� in the following way: �Mass killings are the killingsof substantial numbers of human beings, when not in the course of militaryaction against the military forces of an avowed enemy, under the conditions ofthe essential defenselessness and helplessness of the victims�. In the literaturethis class of phenomena is referred to sometimes as genocide, sometimes as masskillings, mass murder, massacres. Rudolph Rummel uses the expression �demo-cide�, while some scholars use �politicide� (political mass murder). We haveopted for the general use of the term mass killing, which was also the solutionadopted by Easterly, Gatti and Kurlat, 2006) and for the use of genocide onlyin the case in which one group is completely exterminated. For our empiricalinvestigation we will rely on the most widely used dataset on mass killings, col-lected by the �Political Instability Task Force�under the direction of BarbaraHar¤. The most accepted quantitative minimum threshold for a massacre tocount as mass killing is 50,000 (i.e., a mass killing is an intentional massacre ofcivilians with at least 50,000 fatalities).
6
2.2 The Quantitative Importance of Mass Killings andForced Migration
Let us start the review of the stylized facts by giving an overview of the impor-tance of mass killings. The exact numbers of fatalities are controversial,6 butthey are substantial by any standards. According to the �Political InstabilityTask Force�there have been 50 events of mass killings since World War II andthey have cost the lives of between 12 and 25 million noncombatants. Bae andOtt (2008) use even larger numbers: The con�ict-related deaths in the 20th cen-tury were as large as 109.7 millions, corresponding to 4.35 percent of the worldpopulation. Of these, 60 percent were civilian non-combatants. Rummel (1995)estimates that the number of civilians killed by governments in 1900-1987 isalmost 170 million. The punch line is that mass killings matter heavily, both inabsolute terms and relatively to combat-deaths.As explained in the introduction, the mechanisms of our model can also
account for incentives to force unwanted opposition into migration and dis-placements. These phenomena are quantitatively very important. According tothe o¢ cial statistics of UNHCR (2009), out of the current 42 million forciblydisplaced persons, 26 million were internally displaced population by cause ofcivil con�ict.
2.3 Empirical Literature on Mass Killings
Below we summarize the basic empirical results obtained by the existing lit-erature. We will revisit these �ndings again in section 6 where we test thepredictions of our paper.
1. Political regime. Autocratic regimes are more likely to commit masskillings than democracies.
Non-democratic regimes are found to be more likely to commit masskillings than democracies, especially when the autocrats are powerful(Rummel, 1994, 1995; Har¤, 2003; Valentino, Huth and Balch-Lindsay,2004; Easterly, Gatti and Kurlat, 2006; Eck and Hultman, 2007; Colaresiand Carey, 2008). We �nd in section 6 that autocracy does not remain asigni�cant explanatory variable for mass killings when one addresses theautocorrelation of the dependent variable and uses simple techniques forreducing the omitted variable bias.
Unfortunately, the existing quantitative literature focuses almost exclu-sively on the level of democracy rather than the process of democratiza-tion, which according to our model should play an important role. How-ever, there is ample case study evidence available. Based on extensivehistorical examples, Mann (2005) argues that �regimes newly embarked
6The estimates of how many civilians have fallen in this category vary a lot because of thedi¢ culties in distinguishing between degrees of intentionality and targeting.
7
upon democratization are more likely to commit murderous ethnic cleans-ing than are stable authoritarian regimes.�7
2. Group size and power. Mass killings are carried out almost exclusivelyby governments. Rebel violence is relatively low-scale. Rebel groups com-mit more civilian killings if they are militarily strong and after having wona military battle.
In most cases rebel violence is relatively low-scale, and mass killings arealmost only carried out by governments (Har¤, 2003; Valentino, Huth andBalch-Lindsay, 2004; Eck and Hultman, 2007).
In the words of Rummel (1994: 1): "Power kills; absolute power killsabsolutely". In order to be able to do mass killings a group needs thepower and military strength to do so. Rebel groups commit more civiliankillings if they are militarily strong relative to the government (Hultman,2009) and after having won a military battle (Bussmann, Haer and Schnei-der, 2009). Total fatalities are low in situations with weaker rebel armies(Heger and Salehyan, 2007).
3. Ethnic fractionalization and polarization. High levels of ethnic frac-tionalization are negatively correlated with the risk of mass killings, whileethnic polarization is often present in countries experiencing mass killings.
The e¤ect of ethnic cleavages appears to be non-linear, with mass killingsbeing less likely in fully homogenous societies or in societies with a largenumber of ethnic groups, and becoming more likely in the presence offew large ethnic groups. In particular, Krain (1997), Heger and Salehyan(2007), Bae and Ott (2008) and Querido (2009) �nd that large levels ofethnic fractionalization reduce the risk of mass killings, while Montalvoand Reynal-Querol (2008) show that ethnic polarization increases the riskof mass killings.
4. Economic conditions. Mass killings are most likely for low and inter-mediate levels of GDP, large natural resources, high inequality and lowtrade openness.
It has been found that less mass killings take place in richer countries(Scully, 1997; Bae and Ott, 2008). When allowing for a quadratic form ofdevelopment, an inverted U-shape relationship is found with mass killingsbeing most risky for intermediate levels of GDP (Easterly, Gatti andKurlat, 2006).
Natural resources seem to increase the risk of mass killings in Africa(Querido, 2009), and also inequality (especially human capital inequality)
7Mann (2005) sees the process of democratization as the main cause of ethnic cleansing:�Stably institutionalized democracies are less likely than either democratizing or authoritarianregimes to commit murderous cleansing. (...) But their past was not so virtuous. Most ofthem committed su¢ cient ethnic cleansing to produce an essentially mono-ethnic citizen bodyin the present. In their past, cleansing and democratization proceeded hand in hand." (p. 4)
8
tends to increase the risk of mass killings (Besançon, 2005). In contrast,trade openness reduces the risk of mass killings (Har¤, 2003).
5. International intervention. Interventions tend to reduce mass killings,but at the beginning of intervention killing e¤orts may increase.
International intervention, when directly directed against the perpetra-tors, can stop or at least slow down mass killings (Krain, 2005). Buss-mann, Haer and Schneider (2009) �nd that "partisan interventions in civilwars might deter the main perpetrators from continuing the slaughtering,but might invite the targets of these acts to seek reciprocal revenge underthe protection of the international community".
6. Civil wars. Mass killings are more likely in the presence of civil war.
In the presence of civil war mass killings are more likely (Krain, 1997;Valentino, Huth and Balch-Lindsay, 2004), in particular when guerrillagroups are strong and bene�t from support in the population (Valentino,Huth and Balch-Lindsay, 2004).
We should also brie�y discuss the factors that have been found to increase therisk of forced displacements. Refugee �ows are larger in conjunction with masskillings, in wars, under dissident repression, in non-democracies and in coun-tries with low agricultural productivity per worker (Schmeidl, 1997; Azam andHoe er, 2002; Davenport, Moore and Poe, 2003; Moore and Shellman, 2004).Davenport, Moore and Poe (2003) �nd that when regimes start democratizing,this can lead to more refugee �ows.The model that we now turn to is heavily inspired by all the stylized facts
of this section.
3 A Model of Civil War and Mass Killings
3.1 The Model
There are two groups, i and j, of population size (Ni; Nj). Hence, total pop-ulation is N = Ni + Nj . We take the convention that group j is currently inpower.Output Y is produced by labor. We assume a rigid labor supply, so that
output is proportional to population: Y = �N . We can think of � as individualproductivity determined by education as well as by technology. We assume thatboth groups carry out their economic activity separately, so that
Yh = �Nh; h = i; j; and Y = Yi + Yj : (1)
We assume that both groups have the same productivity.8
8 It is quite obvious that there is sizeable �horizontal" inequality among social groups inmost countries. However, there is no conclusive evidence that this inequality is a signi�cantsource of social con�ict. Cramer (2005) notes that the same data source appears to lead to
9
In addition, the country obtains an income from the exploitation and exportof natural resources, E, controlled by the government.9
The Government taxes output at a rate t. We can interpret the size of t asan indicator for the State�s �capacity�. Hence, the government�s revenue is
G = tY + E = t�N + E: (2)
We shall denote by � the share of the tax revenue over the total governmentrevenues, that is,
� � t�N
t�N + E: (3)
The government revenue is entirely distributed over the population. Thestatus quo share of government transfers or entitlements going to group h, h =i; j, is denoted by g0h: These shares are the outcome of past history and mayresult from previous �ghts between the two groups. The aggregate disposableincome to group h is
X0h = (1� t)�Nh + g0h(t�N + E): (4)
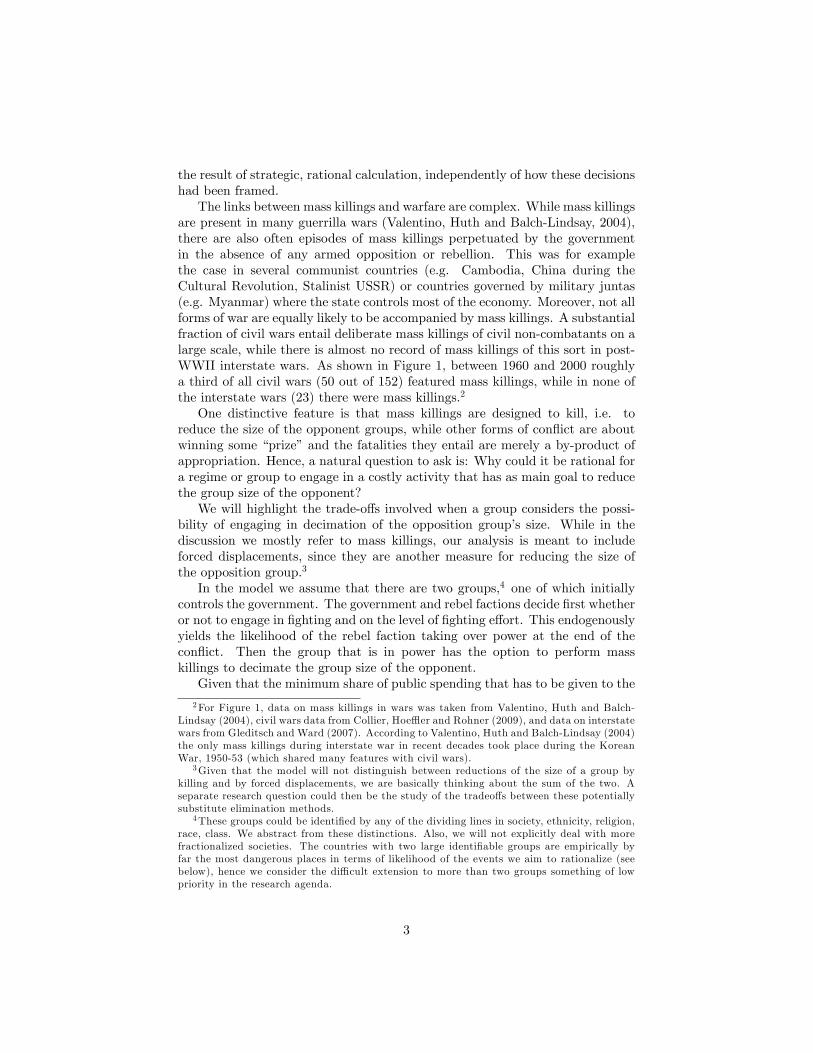
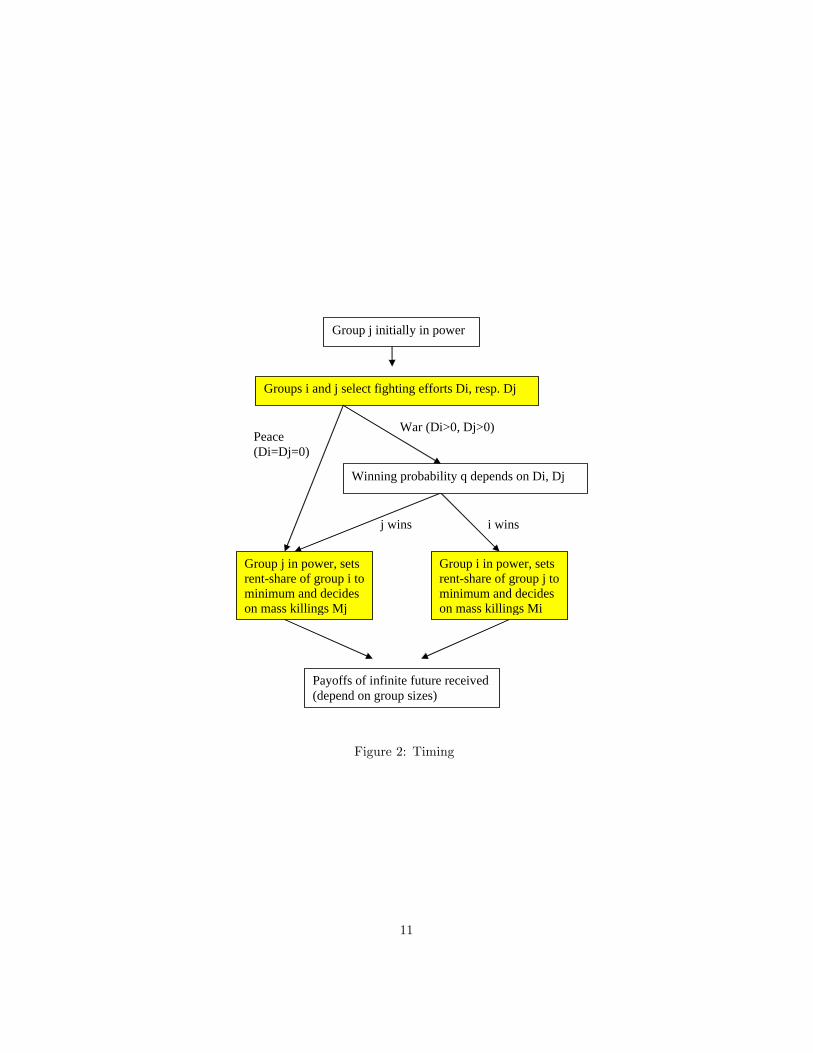
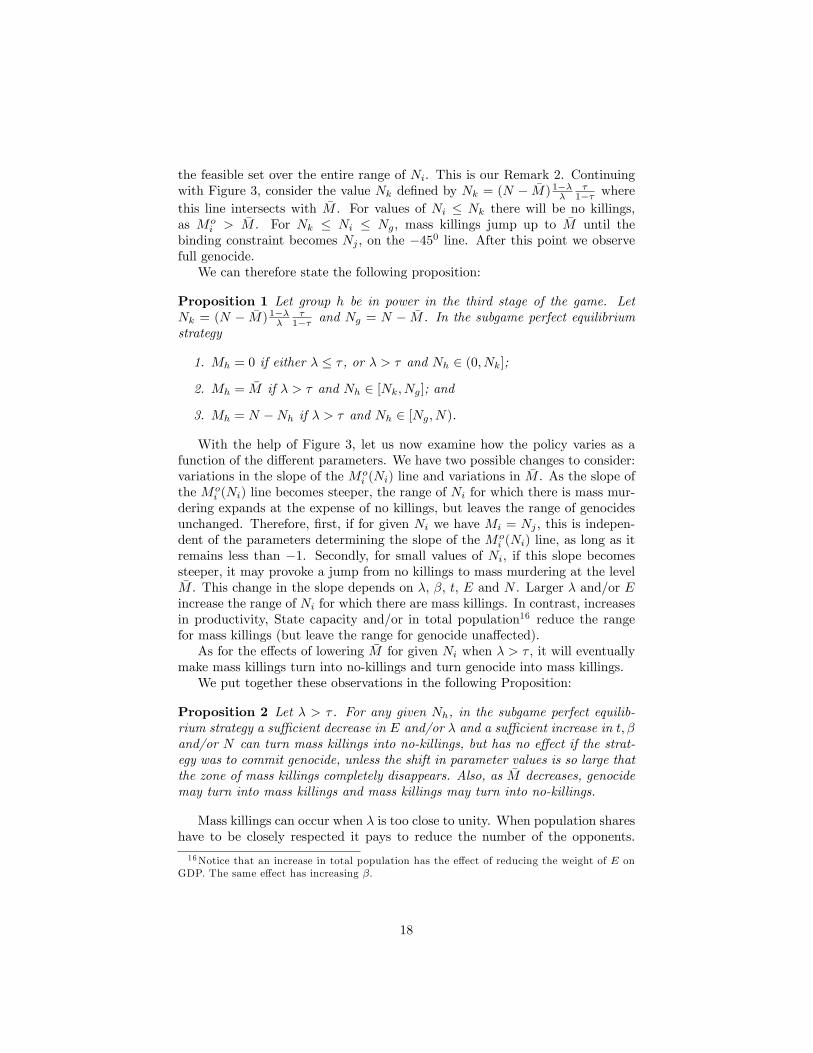
This situation may be disrupted by a shock perturbing some of the basicparameters. For instance, this shock could be originated by a change in theprice or amount of the natural resource relative to the produced output. Suchchange may signi�cantly alter the relative resources of the two groups and inducethe rebellion of the group out of power. After deciding on whether to rebelor not (�rst stage), the challenger and the group in power expend resourcesto mobilize forces for battle�eld warfare (second stage). The victorious groupseizes (or keeps) power. Power, either conquered or kept, can be used to setnew distribution shares over future government revenues and to perpetrate masskillings in the opponent population (third stage).10 Figure 2 displays the timingof the game graphically.
con�icting claims in Wintrobe (1995), Collier and Hoe er (1998), Stewart (2002), Nafzigerand Auvinen (2002), Cramer (2003), and Besançon (2005). As it will become apparent laterin the paper, assuming di¤erential productivity across groups would modify the results onlyin that ceteris paribus the likelihood of becoming a victimized group is higher for the lowerproductivity group.
9We will discuss at the end the minor di¤erences in the results that could derive fromallowing natural resource rents to be private property rather than publicly controlled. WhatE wants to capture is all the sources of public revenue that do not require intensive laborinput.10For the sake of expositional simplicity we assume that the �ghting groups do mass killings
only after seizing power. It is unquestionable that �ghting groups may and sometimes docombine battle�eld warfare with mass killings. However, allowing for mass killings at thissecond stage does not seem to add any interesting insight. If killings can be performed in twoperiods the groups will have to decide on the timing of the executions. This question mighthave some intrinsic interest, but is not at the core of what we want to examine. Furthermore,empirical evidence suggests that violent con�icts do not start with mass killings (see the sixththesis on ethnic cleansing by Mann, 2005). Allowing for killings in the two stages would alsopermit to compensate for the killings su¤ered from the opposing group in the second stage.Once more, while this possibility suggests that our model may underestimate the level ofkillings, we think that the motivations in this case are adequately captured by our model.Including this possibility would not add any new insight.
10
Groups i and j select fighting efforts Di, resp. Dj
Peace(Di=Dj=0)
War (Di>0, Dj>0)
i winsj wins
Group j in power, setsrentshare of group i tominimum and decideson mass killings Mj
Payoffs of infinite future received(depend on group sizes)
Winning probability q depends on Di, Dj
Group i in power, setsrentshare of group j tominimum and decideson mass killings Mi
Group j initially in power
Figure 2: Timing
11
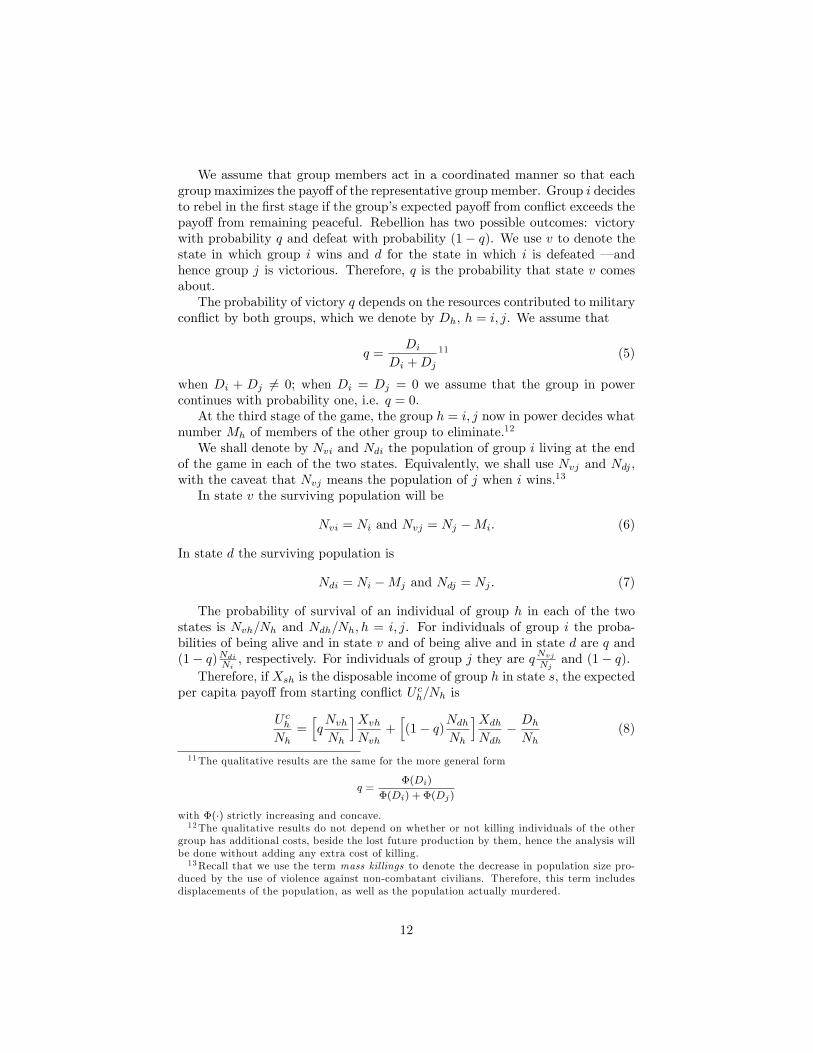
We assume that group members act in a coordinated manner so that eachgroup maximizes the payo¤of the representative group member. Group i decidesto rebel in the �rst stage if the group�s expected payo¤ from con�ict exceeds thepayo¤ from remaining peaceful. Rebellion has two possible outcomes: victorywith probability q and defeat with probability (1� q). We use v to denote thestate in which group i wins and d for the state in which i is defeated � andhence group j is victorious. Therefore, q is the probability that state v comesabout.The probability of victory q depends on the resources contributed to military
con�ict by both groups, which we denote by Dh, h = i; j. We assume that
q =Di
Di +Dj11 (5)
when Di + Dj 6= 0; when Di = Dj = 0 we assume that the group in powercontinues with probability one, i.e. q = 0.At the third stage of the game, the group h = i; j now in power decides what
number Mh of members of the other group to eliminate.12
We shall denote by Nvi and Ndi the population of group i living at the endof the game in each of the two states. Equivalently, we shall use Nvj and Ndj ,with the caveat that Nvj means the population of j when i wins.13
In state v the surviving population will be
Nvi = Ni and Nvj = Nj �Mi: (6)
In state d the surviving population is
Ndi = Ni �Mj and Ndj = Nj : (7)
The probability of survival of an individual of group h in each of the twostates is Nvh=Nh and Ndh=Nh; h = i; j. For individuals of group i the proba-bilities of being alive and in state v and of being alive and in state d are q and(1� q)Ndi
Ni, respectively. For individuals of group j they are qNvj
Njand (1� q).
Therefore, if Xsh is the disposable income of group h in state s, the expectedper capita payo¤ from starting con�ict U ch=Nh is
U chNh
=hqNvhNh
iXvhNvh
+h(1� q)Ndh
Nh
iXdhNdh
� DhNh
(8)
11The qualitative results are the same for the more general form
q =�(Di)
�(Di) + �(Dj)
with �(�) strictly increasing and concave.12The qualitative results do not depend on whether or not killing individuals of the other
group has additional costs, beside the lost future production by them, hence the analysis willbe done without adding any extra cost of killing.13Recall that we use the term mass killings to denote the decrease in population size pro-
duced by the use of violence against non-combatant civilians. Therefore, this term includesdisplacements of the population, as well as the population actually murdered.
12
where Xsh = (1� t)�Nsh + gsh�t�Ns + E
�.
Since Nh is exogenous and has no in�uence on individual decisions, we shallwork with the group�s total payo¤ U ch = qXvh + (1� q)Xdh �Dh.The winning group h imposes the shares gsh; s = v; d; h = i; j on the distrib-
ution of the government revenue in the future. To summarize the possibility thatfuture con�icts may also arise depending on what shares the winner chooses,we assume that there are constraints on the share that the winner can imposeupon the looser. Speci�cally, we assume that
gvj � �NvjNv
and gdi � �NdiNd
; � 2 [0; 1]: (9)
In each state the winner obtains the rest. The closer � is to unity, the closerthe imposed distribution will be to fairness.Let us momentarily pause and discuss in more detail the interpretation of
parameter �, as it plays a signi�cant role in our analysis. One speci�c feature ofa civil con�ict, as opposed to an interstate con�ict, is that the players are in anenvironment of repeated interaction and there is always going to be a commongovernment budget and common pool of resources to �ght over. The victoriousgroup replaces a division rule of the common resources �a �social contract��with another one. However, by how much the new distribution can depart froman egalitarian sharing � how low � can be� is constrained by at least two typesof factors: internal and external.The internal forces moderating the abuse of the loser by the winner are
the shadow of future rebellions and the degree of commitment to democracy.14
The threat of future rebellions by the losers clearly depends on their numbers.Hence, the minimum viable share has to be related to the population size of thelosers. Likewise, if we take equal treatment as the quintessence of the democraticvalues, the higher is the respect to these democratic values the closer the shareallocated to the loser will be to their population size.A second type of constraint on the distributional shares is external to the
country and originates in the international pressure for a �fair�treatment of thedefeated group as an essential ingredient of democratization. It is a universallyaccepted standard of behavior by international organizations to condition aidor preferential tari¤ treatment, for instance, to the respect of human rights andto democratic, clean elections. Once more the constraint can be captured bythe closeness of the distributional share to the population size of the losers.With an admittedly drastic simpli�cation we have pooled together all these
potential pressures for �fairness� into the parameter �. An increase in � cancapture either a process of democratization or a better coordination of the in-ternational community to impose a "fair" deal.How will this constraint condition the imposed distribution? A �rst ob-
servation is that Uh is strictly increasing in the own shares of the division of
14This commitment can be the outcome of a genuine domestic process or the pressureexerted by the international community, thus external.
13
the government revenue. Hence, the winner will always exploit victory by de-termining a share for the loser equal to the feasible minimum. This impliesthat
gvj = �NvjNv
; gvi = 1� �NvjNv
and gdi = �NdiNd
; gdj = 1� �NdiNd
: (10)
Therefore, the disposable income in the two states will be:
Xvi = (1� t)�Ni +�1� �Nj �Mi
N �Mi
��t��N �Mi
�+ E
�; (11)
and
Xdi = (1� t)�(Ni �Mj) + �Ni �Mj
N �Mj
�t��N �Mj
�+ E
�: (12)
Note that murdering part of the opponents has two e¤ects on one�s payo¤.First, by permanently weakening the opponent in its numbers, the winner cangrant for its own group a larger share of the contested revenue. Second, reducingthe population also reduces the part of the government revenue accruing fromtax collection. The trade-o¤ between these two e¤ects will be crucial in theanalysis, and will lead to some of the most interesting nuanced predictions aboutthe relative role of the various parameters describing the economic structure ofthe country.In the model, mass killings or any other method to change the distributive
claims of the currently powerless group have the sole purpose of maximizingthe monetary expected payo¤ of the group in power. Thus, the best strategyis independent of what happened earlier, war or peace. It follows that if groupi decides not to rebel it will enter the third stage as if it had been defeated,except that it will not have faced �ghting cost Di (plus the �x costs that we shallintroduce later on). Consequently, this group will be subject to the expectedrevised share of government revenue and potentially to mass killings. Taking allthis into account, we have that the payo¤ if i remains in peace, Upi , is
Upi = Xdi = (1� t)�(Ni �Mj) + �Ni �Mj
N �Mj
�t��N �Mj
�+ E
�: (13)
We can now turn to the analysis of the strategic behavior of players.
3.2 Mass Killings
We solve the game by backward induction using the solution concept of subgameperfect equilibrium. In the third stage of the game the group in power is theonly one who has a decision to make. Suppose that i is the winner so that weare in state v.The winner selects Mi to maximize the future period payo¤:
Uvi(Mi) = (1� t)�Ni +�1� �Nj �Mi
N �Mi
� �t�(N �Mi) + E
�(14)
14
subject to the constraint that Mi � �M .The upper bound �M corresponds to the maximum level of mass killings
beyond which the international community would intervene and stop killings.We conceive the intervention by the international community setting �M as quitedi¤erent from the pressures for a higher � on three counts. First, while oneis based on the humanitarian objective of sparing the lives of non-combatantcivilians, the other is politically motivated. Second, stopping the mass killingsis done by military intervention following the agreement of the internationalcommunity. Typically, the UN Security Council plays a crucial role (Doyleand Sambanis, 2006). In contrast, the pressures for democratization may not�nd such a unanimous support of the international community and this mayexplain why they are typically performed through international agencies suchas the World Bank or the IMF, essentially controlled by the US and the EU.Third, the threat of international military intervention is activated while thearmed con�ict takes place, while the pressures for democratization are partof the post-con�ict peace agreements and can extend over the future. We thusconsider the two types of international intervention as independent of each other.We assume that, for instance, there might be an e¤ective cap on mass killingsand no pressure for democratization.15 Symmetrically, there are instances � likethe case of Iraq� of pressure for democratization independent of the murdersof the ongoing civil war. Importantly, as shown in Doyle and Sambanis (2006),there are trends in UN interventionism, and hence our variable �M can vary overtime and may be subject to shocks.Coming back to the optimal choice of mass killings, by di¤erentiating with
respect to Mi we obtain:
@Uvi@Mi
=�NiE
(N �Mi)2� (1� �)t�:
Note that for E = 0 we have that @Uvi@Mi
< 0, so that the highest payo¤ isobtained with no mass killings, Mi = 0.
Remark 1 A necessary condition for mass killings is that E > 0.
Di¤erentiating again we have that
@2Uvi@M2
i
= 2�NiE
(N �Mi)3> 0:
For E > 0, the third stage payo¤ is convex in Mi and hence attains itsmaximum at a corner on the interval [0; �M ] (while Mj is zero for sure when iwins in stage 2).Let us denote by Mo
i (Ni) the threshold such that Uvi(Moi ) = Uvi(0). That
is
Moi (Ni) = N � �
1� �1� ��
Ni (15)
15This corresponds to what Doyle and Sambanis (2006) call "�rst generation peacekeepingoperations".
15
with � as de�ned in (3).The de�nition of Mo
j (Nj) is analogous.The term multiplying Ni in (15) plays a critical role in the analysis of the
third stage of the game. The threshold level Moi is strictly decreasing in this
term and in Ni. Hence higher values of �1��
1��� and higher relative size of the
group in power make mass killings more likely. Speci�cally, it is critical whether�1��
1��� > (<)1. Simply note that
�
1� �1� ��
> (<)1 as � > (<)� :
� is strictly increasing in productivity and State capacity, and it is decreasingin the natural resources.It can be easily shown that Xvi( �M) �Xvi(0) is increasing in �M . Hence, if
�M � Moi the subgame perfect equilibrium has to feature Mi = 0. If �M > Mo
i
in the subgame perfect equilibrium we will observe mass killings.This observation has an important implication: mass murdering is either
performed at a large scale, �M > Moi , or not performed at all. In other words,
it is when it is technologically or situationally feasible to implement a largemass killing (high �M) that such an option is likely to be chosen by the group inpower at its maximum feasible level. In contrast, when the maximum amountof mass killings implementable is not very high (low �M) the only continuationequilibrium is no civilian murdering at all.The choice of Mi is also subject to another feasibility constraint: the com-
plete extermination of the opponent, Mi � Nj . We say that there is geno-cide whenever this constraint is binding and Mi = Nj . Therefore, wheneverMoi � Nj , resp. Mo
j � Ni, we shall have that there will be no killings in thethird stage of the game. In view of (15) this inequality is satis�ed whenever
� � � :
That is, when � and/or E are small, and Y and/or t large. Notice that thiscondition generalizes the result in Remark 1.
Remark 2 A necessary condition for mass killings is that � > � .
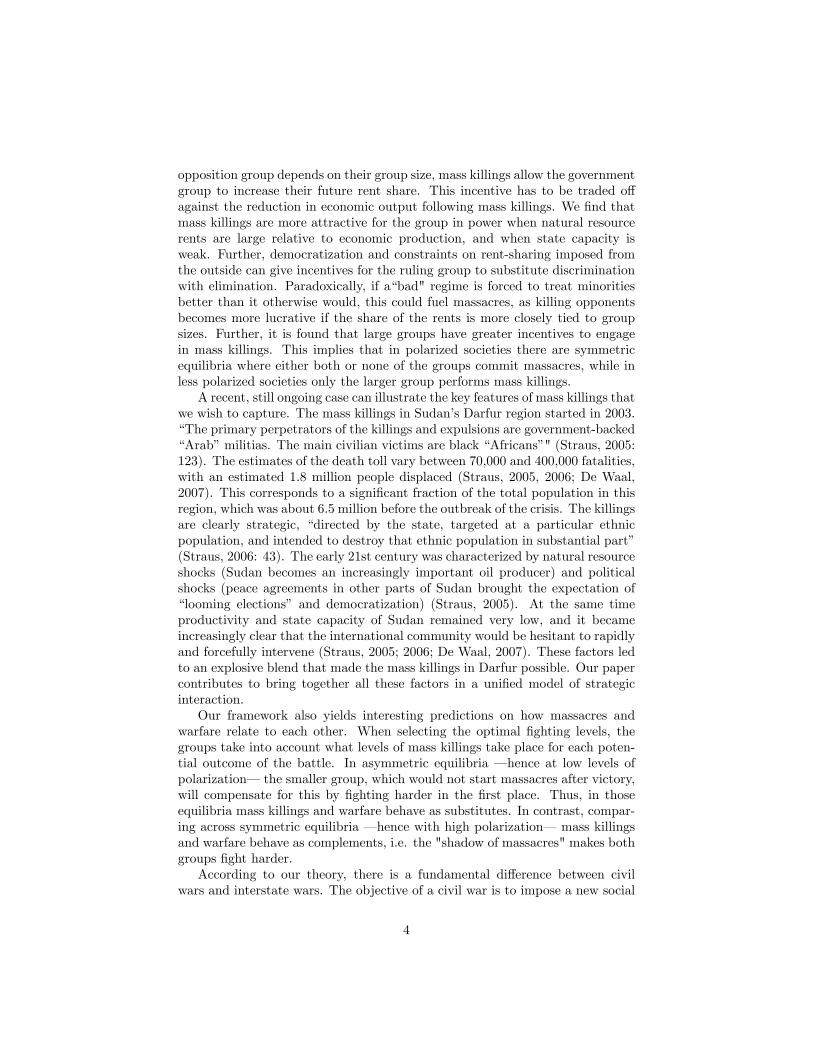
Before proceeding to the statement of our formal result, let us give a graph-ical presentation in Figure 3 of the conditions for mass killings.On the axes we have group sizes and mass killings bounds and thresholds.
We have drawn a �450 line passing through (N; 0) and (0; N), which representsthe pairs (Ni; Nj) that add up to the given total population, N . The set offeasible Mi is the area below min( �M;Nj), as it is constrained by Mi � �M andby Mi � Nj . After �M intersects the �450 line (at Ng = N � �M) we have thatMi = N�Ni = Nj and we have genocide with the complete extermination of theopposing group for all Ni � Ng. Passing through (0; N) we have the straight linewith slope � �
1��1��� that represents equation (15) expressing Mo
i as a functionofNi. Clearly, whenever � � � there will be no mass killings becauseMo
i exceeds
16
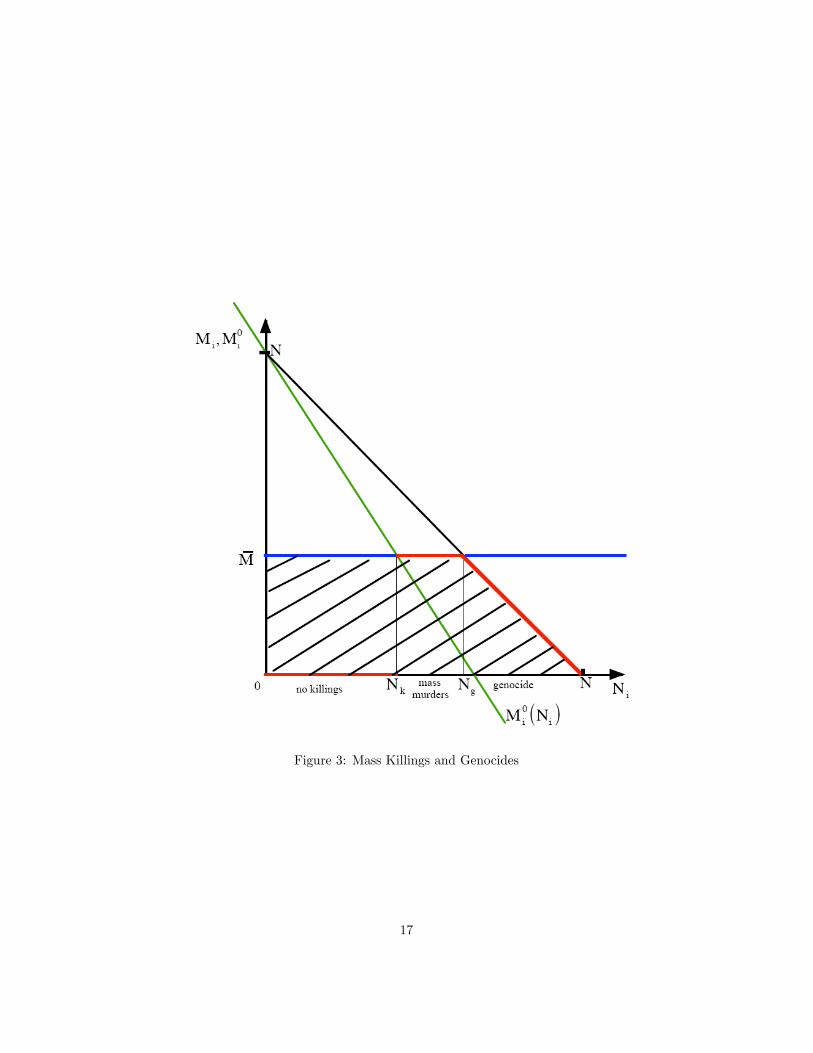
Figure 3: Mass Killings and Genocides
17
the feasible set over the entire range of Ni. This is our Remark 2. Continuingwith Figure 3, consider the value Nk de�ned by Nk = (N � �M) 1���
�1�� where
this line intersects with �M . For values of Ni � Nk there will be no killings,as Mo
i > �M . For Nk � Ni � Ng, mass killings jump up to �M until thebinding constraint becomes Nj , on the �450 line. After this point we observefull genocide.We can therefore state the following proposition:
Proposition 1 Let group h be in power in the third stage of the game. LetNk = (N � �M) 1���
�1�� and Ng = N � �M . In the subgame perfect equilibrium
strategy
1. Mh = 0 if either � � � , or � > � and Nh 2 (0; Nk];
2. Mh = �M if � > � and Nh 2 [Nk; Ng]; and
3. Mh = N �Nh if � > � and Nh 2 [Ng; N).
With the help of Figure 3, let us now examine how the policy varies as afunction of the di¤erent parameters. We have two possible changes to consider:variations in the slope of the Mo
i (Ni) line and variations in �M . As the slope ofthe Mo
i (Ni) line becomes steeper, the range of Ni for which there is mass mur-dering expands at the expense of no killings, but leaves the range of genocidesunchanged. Therefore, �rst, if for given Ni we have Mi = Nj , this is indepen-dent of the parameters determining the slope of the Mo
i (Ni) line, as long as itremains less than �1. Secondly, for small values of Ni, if this slope becomessteeper, it may provoke a jump from no killings to mass murdering at the level�M . This change in the slope depends on �, �, t, E and N . Larger � and/or Eincrease the range of Ni for which there are mass killings. In contrast, increasesin productivity, State capacity and/or in total population16 reduce the rangefor mass killings (but leave the range for genocide una¤ected).As for the e¤ects of lowering �M for given Ni when � > � , it will eventually
make mass killings turn into no-killings and turn genocide into mass killings.We put together these observations in the following Proposition:
Proposition 2 Let � > � . For any given Nh, in the subgame perfect equilib-rium strategy a su¢ cient decrease in E and/or � and a su¢ cient increase in t; �and/or N can turn mass killings into no-killings, but has no e¤ect if the strat-egy was to commit genocide, unless the shift in parameter values is so large thatthe zone of mass killings completely disappears. Also, as �M decreases, genocidemay turn into mass killings and mass killings may turn into no-killings.
Mass killings can occur when � is too close to unity. When population shareshave to be closely respected it pays to reduce the number of the opponents.
16Notice that an increase in total population has the e¤ect of reducing the weight of E onGDP. The same e¤ect has increasing �.
18
Similarly, if the non-produced rent E is too large relative to the tax revenuet�N , exterminating the enemy will have little cost in loss of tax collection.Using (14), let us �nally compute the third stage payo¤s for group i in state
v under the three possible levels of mass killings:
� for Mi = 0 we have
Uvi(0) = (1� t)�Ni +�1� �Nj
N
� �t�N + E
�: (16)
� for Mi = �M we have
Uvi( �M) = (1� t)�Ni +�1� �Nj �
�M
N � �M
� �t�(N � �M) + E
�: (17)
� for Mi = Nj we haveUvi(Nj) = �Ni + E: (18)
If group i enters the third stage as defeated there is no decision to be taken,but the payo¤ will be a¤ected by the actions of group j, then in power. Thecorresponding payo¤s are
� for Mj = 0 we have
Udi(0) = (1� t)�Ni + �NiN
�t�N + E
�: (19)
� for Mj = �M we have
Udi( �M) = (1� t)�(Ni � �M) + �Ni � �M
N � �M
�t�(N � �M) + E
�: (20)
� for Mj = Ni we haveUdi(Ni) = 0: (21)
Notice that these payo¤s are exactly the same player i will obtain if stayingin peace. The payo¤s to player j at the third stage of the game can be computedanalogously.
3.3 Fighting Intensity
In the second stage of the game, players use the payo¤s associated to the bestresponses in the third stage and compute the expected payo¤ using the winprobability q. Then each group chooses the amount of �ghting resources, Diand Dj , that maximizes the expected payo¤ as a response to the �ghting e¤ortcontributed by the opposing group.If the rebel group decides to start a con�ict in the �rst period, it has to incur
a �xed costK as well. The parameterK can be interpreted as a minimum size of
19
necessary investment to have a positive probability of success. This minimumexpenditure includes the establishment of an organization to coordinate theaction and minimum number of armed people the opposition group needs to puton the ground to start having an impact.17 In order to capture the advantageof being in power, we have assumed that the ruling group does not face this �xcost.As seen from the second stage, con�ict has two possible outcomes (v; d). The
expected payo¤s are
Ui =Di
Di +DjUvi + (1�
DiDi +Dj
)Udi � (Di + IK); (22)
where I denotes an indicator function taking value 1(0) if group i decides to(not to) rebel.
Uj =Dj
Di +DjUdj + (1�
DjDi +Dj
)Uvj �Dj : (23)
The precise values for (Uvi; Udi) and (Udj ; Uvj) are the ones computed in theprevious section.If group i decides not to rebel (I = 0), group i receives payo¤ Udi with
probability 1 while saving the �xed cost of con�ict; on the other hand, startingcon�ict and then choosing a zero �ghting e¤ort yields the same Udi with prob-ability 1 but after spending K; hence it can never be part of an equilibriumbehavior to declare war and then put zero �ghting e¤ort. Thus, the �rst stagedecision to remain in peace or to rebel is equivalent to solving whether Ui ismaximized by Di = 0 or by a strictly positive military e¤ort.The payo¤ Ui is strictly concave in Di. Di¤erentiating Ui with respect to
Di in (22) we obtain
@Ui@Di
=Dj
(Di +Dj)2
�Uvi � Udi
�� 1: (24)
Thus the FOC implies that
Dj(Di +Dj)2
�Uvi � Udi
�= 1; (25)
Denoting by �i the utility di¤erential Uvi � Udi, (25) can be written as
Di =pDjp�i �Dj : (26)
From this expression we can easily deduce that
DiDi +Dj
=
p�i �
pDjp
�i: (27)
17Small sized revolutionary groups are typically dismantled by the police, without an activeparticipation of the army. It is only after a movement has reached a threshold level that itbecomes a military threat. This is what K represents.
20
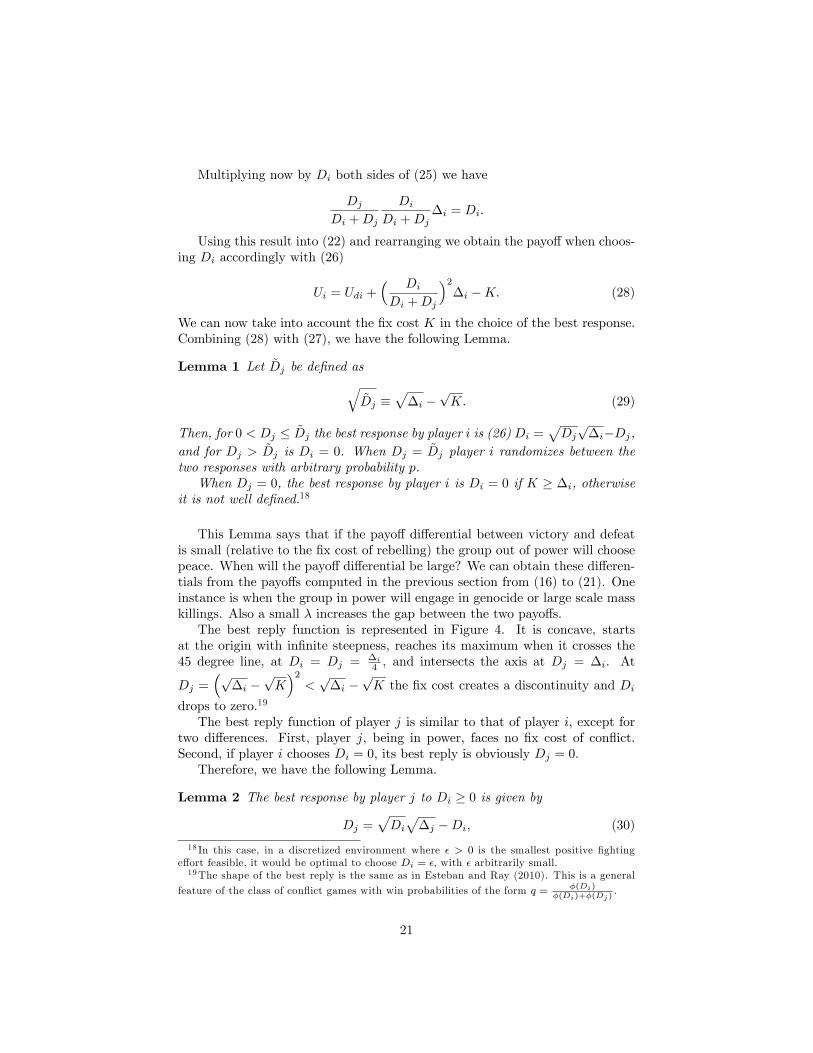
Multiplying now by Di both sides of (25) we have
DjDi +Dj
DiDi +Dj
�i = Di:
Using this result into (22) and rearranging we obtain the payo¤when choos-ing Di accordingly with (26)
Ui = Udi +� DiDi +Dj
�2�i �K: (28)
We can now take into account the �x cost K in the choice of the best response.Combining (28) with (27), we have the following Lemma.
Lemma 1 Let ~Dj be de�ned asq~Dj �
p�i �
pK: (29)
Then, for 0 < Dj � ~Dj the best response by player i is (26) Di =pDjp�i�Dj,
and for Dj > ~Dj is Di = 0. When Dj = ~Dj player i randomizes between thetwo responses with arbitrary probability p.When Dj = 0, the best response by player i is Di = 0 if K � �i, otherwise
it is not well de�ned.18
This Lemma says that if the payo¤ di¤erential between victory and defeatis small (relative to the �x cost of rebelling) the group out of power will choosepeace. When will the payo¤ di¤erential be large? We can obtain these di¤eren-tials from the payo¤s computed in the previous section from (16) to (21). Oneinstance is when the group in power will engage in genocide or large scale masskillings. Also a small � increases the gap between the two payo¤s.The best reply function is represented in Figure 4. It is concave, starts
at the origin with in�nite steepness, reaches its maximum when it crosses the45 degree line, at Di = Dj =
�i
4 , and intersects the axis at Dj = �i. At
Dj =�p�i �
pK�2<p�i �
pK the �x cost creates a discontinuity and Di
drops to zero.19
The best reply function of player j is similar to that of player i, except fortwo di¤erences. First, player j, being in power, faces no �x cost of con�ict.Second, if player i chooses Di = 0, its best reply is obviously Dj = 0.Therefore, we have the following Lemma.
Lemma 2 The best response by player j to Di � 0 is given by
Dj =pDip�j �Di; (30)
18 In this case, in a discretized environment where � > 0 is the smallest positive �ghtinge¤ort feasible, it would be optimal to choose Di = �, with � arbitrarily small.19The shape of the best reply is the same as in Esteban and Ray (2010). This is a general
feature of the class of con�ict games with win probabilities of the form q =�(Di)
�(Di)+�(Dj).
21

Figure 4:
22
where�j � Udj � Uvj :
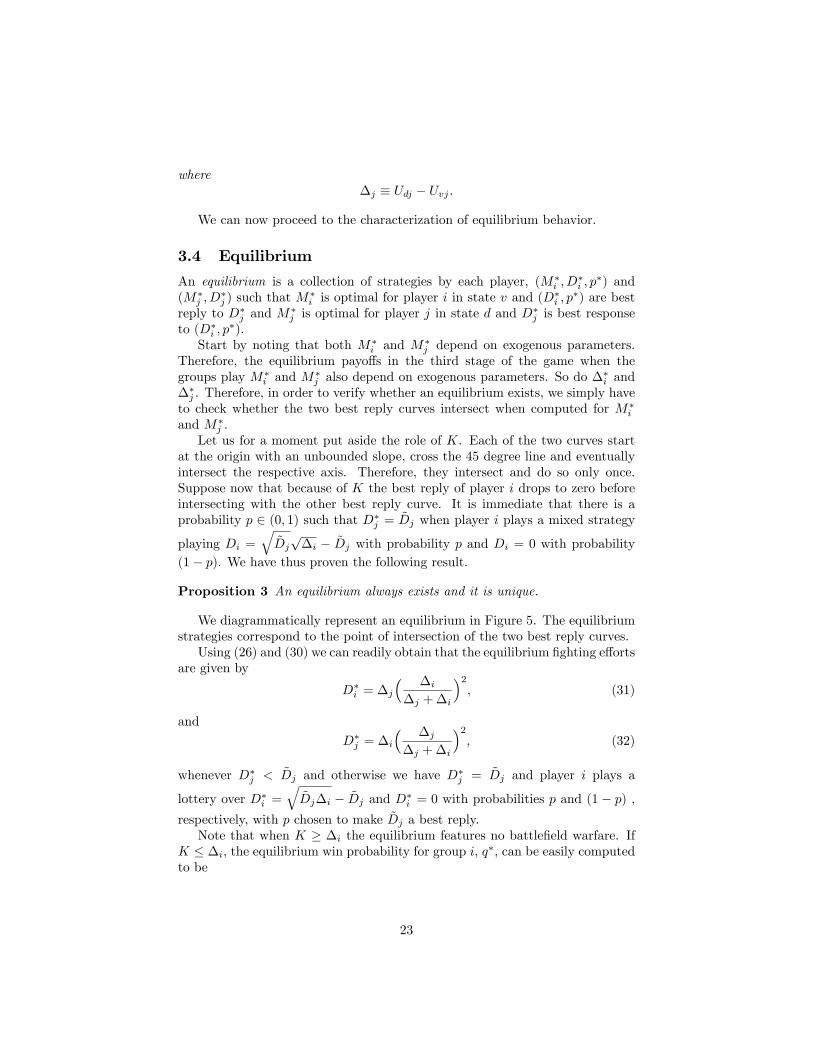
We can now proceed to the characterization of equilibrium behavior.
3.4 Equilibrium
An equilibrium is a collection of strategies by each player, (M�i ; D
�i ; p
�) and(M�
j ; D�j ) such that M
�i is optimal for player i in state v and (D
�i ; p
�) are bestreply to D�
j and M�j is optimal for player j in state d and D
�j is best response
to (D�i ; p
�).Start by noting that both M�
i and M�j depend on exogenous parameters.
Therefore, the equilibrium payo¤s in the third stage of the game when thegroups play M�
i and M�j also depend on exogenous parameters. So do �
�i and
��j . Therefore, in order to verify whether an equilibrium exists, we simply haveto check whether the two best reply curves intersect when computed for M�
i
and M�j .
Let us for a moment put aside the role of K. Each of the two curves startat the origin with an unbounded slope, cross the 45 degree line and eventuallyintersect the respective axis. Therefore, they intersect and do so only once.Suppose now that because of K the best reply of player i drops to zero beforeintersecting with the other best reply curve. It is immediate that there is aprobability p 2 (0; 1) such that D�
j =~Dj when player i plays a mixed strategy
playing Di =q~Djp�i � ~Dj with probability p and Di = 0 with probability
(1� p). We have thus proven the following result.
Proposition 3 An equilibrium always exists and it is unique.
We diagrammatically represent an equilibrium in Figure 5. The equilibriumstrategies correspond to the point of intersection of the two best reply curves.Using (26) and (30) we can readily obtain that the equilibrium �ghting e¤orts
are given by
D�i = �j
� �i�j +�i
�2; (31)
and
D�j = �i
� �j�j +�i
�2; (32)
whenever D�j <
~Dj and otherwise we have D�j =
~Dj and player i plays a
lottery over D�i =
q~Dj�i � ~Dj and D�
i = 0 with probabilities p and (1 � p) ,respectively, with p chosen to make ~Dj a best reply.Note that when K � �i the equilibrium features no battle�eld warfare. If
K � �i, the equilibrium win probability for group i, q�, can be easily computedto be
23
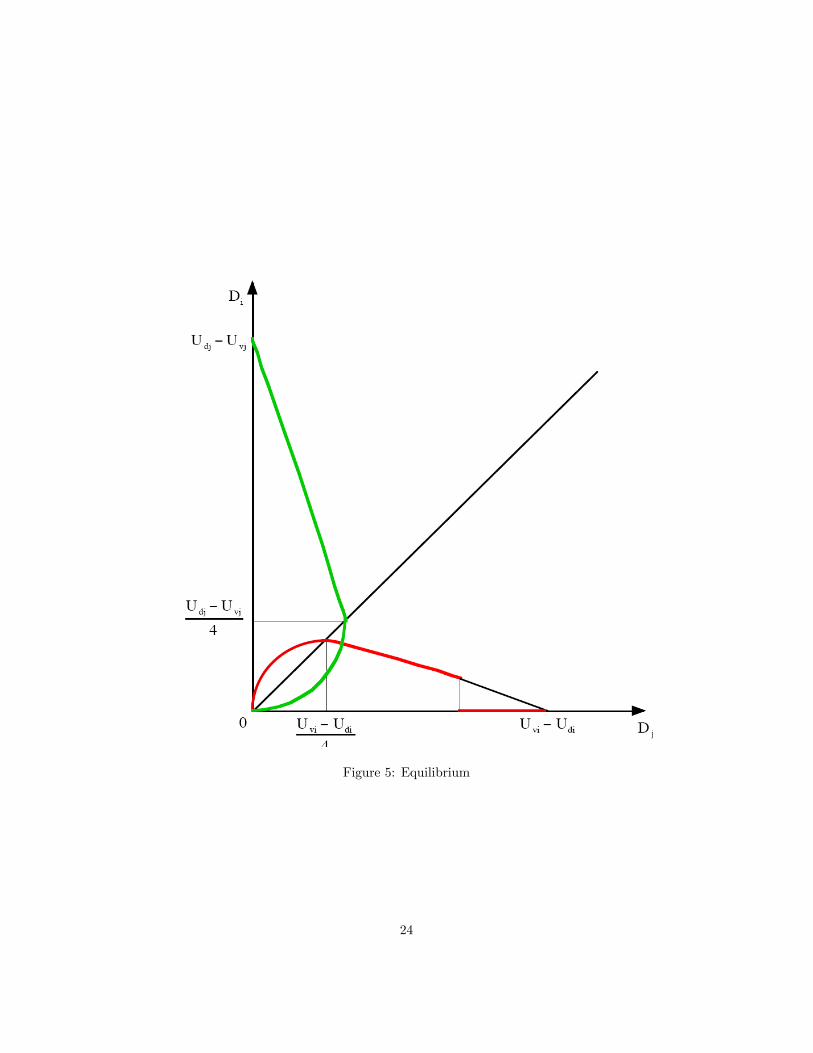
Figure 5: Equilibrium
24
q� =�i
�i +�j: (33)
This expression allows us to rewrite the equilibrium (D�i ; D
�j ) in a useful
form:
D�i = �iq
�(1� q�); and (34)
D�j = �jq
�(1� q�): (35)
Total warfare e¤ort is
D� = D�j +D
�i =
�i�j�j +�i
: (36)
In the subsequent discussion it will be useful to distinguish between twopossible equilibrium scenarios: symmetric and asymmetric third stage strate-gies of the groups. An equilibrium will display symmetric behavior if the twoplayers choose the same equilibrium strategy for the third stage of the game.An equilibrium is asymmetric otherwise.We shall denote by �h(Mi;Mj) the utility di¤erential between victory and
defeat for a player h under the third stage strategies (Mi;Mj). Note that Mh
can take on one of the following three values f0; �M;N �Nhg, corresponding tono murders, mass killings and genocide of the opponent.Using (16) through (21) and the equivalent expressions for group j we can
compute the corresponding utility di¤erentials.
Lemma 3 In symmetric equilibria the utility di¤erentials are
�i(0; 0) = �j(0; 0) = (1� �)(t�N + E) (37)
and
�i( �M; �M) = �j( �M; �M) = �i(0; 0) + ��ME
N � �M+�1� 2(1� �)t
�� �M ; (38)
for asymmetric equilibria with mass killings are
�`( �M; 0) = (1� �)(t�N + E) + �N` �ME
N(N � �M)� (1� �)t� �M; (39)
and�s( �M; 0) = �`( �M; 0) + � �M ; (40)
and with genocides are
�`(Ns; 0) = t�N` + E � �N`N(t�N + E); (41)
and�s(Ns; 0) = �`(Ns; 0) + �Ns; (42)
where s and ` stand for the smaller and larger group, respectively (here i = `).
25
Using now (31), (32), and (33) we can compute the equilibrium winningprobabilities and warfare e¤ort. Note that in an asymmetric equilibrium it hasto be that group ` is the one that is doing mass killings.
Proposition 4 We shall have peace with neither warfare nor mass killings ifand only if K � (1��)(t�N +E) and either � � � , or � > � and N` 2 (0; Nk].In case of con�ict, the equilibrium probabilities of winning and �ghting e¤orts
are the following functions of the expected behavior after victory:A. in symmetric equilibria:
q�(0; 0) = q�( �M; �M) =1
2; D�(0; 0) =
�j(0; 0)
2; D�( �M; �M) =
�j( �M; �M)
2; (43)
B. in asymmetric equilibria with mass killings:
1. when Nj = N`
q�(0; �M) =�j(0; �M) + � �M
2�j(0; �M) + � �M;D�(0; �M) =
�j(0; �M) + � �M
2�j(0; �M) + � �M�j(0; �M);
(44)
2. when Ni = N`
q�( �M; 0) =�i( �M; 0)
2�i( �M; 0) + � �M;D�( �M; 0) =
�i( �M; 0) + � �M
2�i( �M; 0) + � �M�i( �M; 0);
(45)
C. in asymmetric equilibria with genocide:
1. when Nj = N` > N � �M
q�(0; Ni) =�j(0; Ni) + �Ni2�j(0; Ni) + �Ni
; D�(0; Ni) =�j(0; Ni) + �Ni2�j(0; Ni) + �Ni
�j(0; Ni);
(46)
2. when Ni = N` > N � �M
q�(Nj ; 0) =�i(Nj ; 0)
2�i(Nj ; 0) + �Nj; D�(Nj ; 0) =
�i(Nj ; 0) + �Nj2�i(Nj ; 0) + �Nj
�i(Nj ; 0):
(47)
We now proceed to the study of the e¤ect of changes in group size and in theexogenous parameters on both types of strategic violence that we have analyzed.
26
4 Comparative Statics
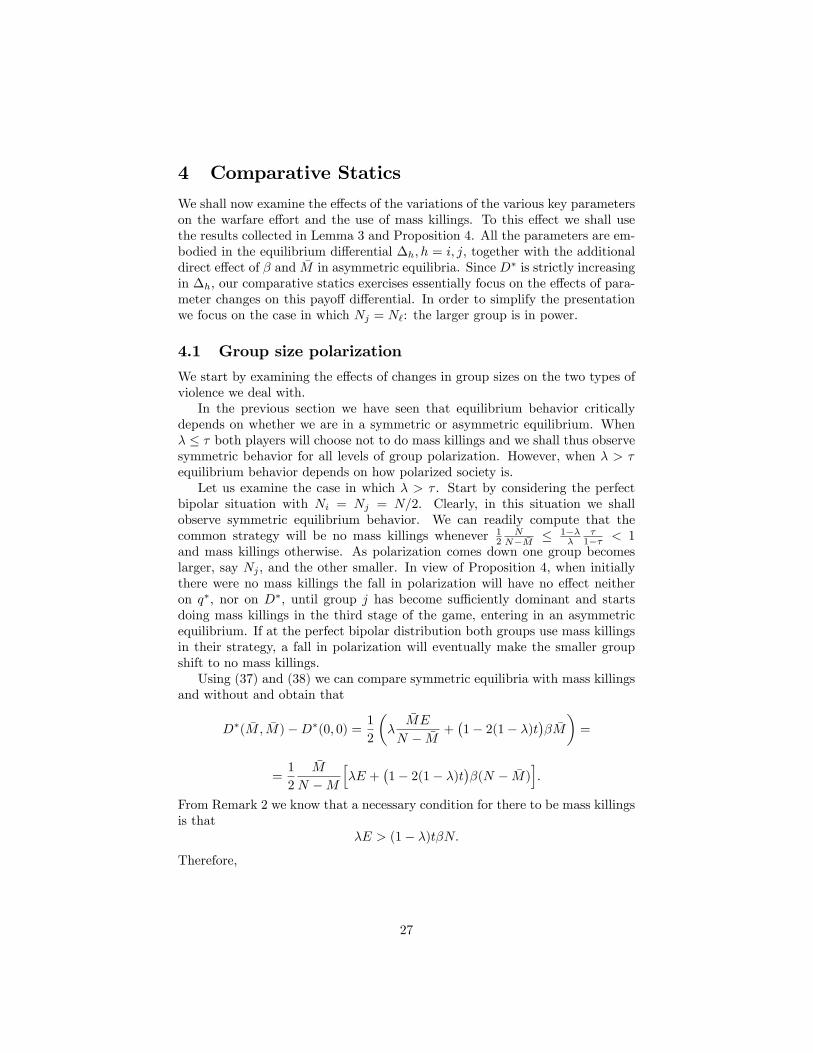
We shall now examine the e¤ects of the variations of the various key parameterson the warfare e¤ort and the use of mass killings. To this e¤ect we shall usethe results collected in Lemma 3 and Proposition 4. All the parameters are em-bodied in the equilibrium di¤erential �h; h = i; j, together with the additionaldirect e¤ect of � and �M in asymmetric equilibria. Since D� is strictly increasingin �h, our comparative statics exercises essentially focus on the e¤ects of para-meter changes on this payo¤ di¤erential. In order to simplify the presentationwe focus on the case in which Nj = N`: the larger group is in power.
4.1 Group size polarization
We start by examining the e¤ects of changes in group sizes on the two types ofviolence we deal with.In the previous section we have seen that equilibrium behavior critically
depends on whether we are in a symmetric or asymmetric equilibrium. When� � � both players will choose not to do mass killings and we shall thus observesymmetric behavior for all levels of group polarization. However, when � > �equilibrium behavior depends on how polarized society is.Let us examine the case in which � > � . Start by considering the perfect
bipolar situation with Ni = Nj = N=2. Clearly, in this situation we shallobserve symmetric equilibrium behavior. We can readily compute that thecommon strategy will be no mass killings whenever 1
2N
N� �M� 1��
��1�� < 1
and mass killings otherwise. As polarization comes down one group becomeslarger, say Nj , and the other smaller. In view of Proposition 4, when initiallythere were no mass killings the fall in polarization will have no e¤ect neitheron q�, nor on D�, until group j has become su¢ ciently dominant and startsdoing mass killings in the third stage of the game, entering in an asymmetricequilibrium. If at the perfect bipolar distribution both groups use mass killingsin their strategy, a fall in polarization will eventually make the smaller groupshift to no mass killings.Using (37) and (38) we can compare symmetric equilibria with mass killings
and without and obtain that
D�( �M; �M)�D�(0; 0) =1
2
��
�ME
N � �M+�1� 2(1� �)t
�� �M
�=
=1
2
�M
N �M
h�E +
�1� 2(1� �)t
��(N � �M)
i:
From Remark 2 we know that a necessary condition for there to be mass killingsis that
�E > (1� �)t�N:
Therefore,
27
D�( �M; �M)�D�(0; 0) �1
2
�M
N � �M
�(1� �)t�N � (2(1� �)t� 1)�(N � �M)
�> 0
because (1� �)t > 2(1� �)t� 1.
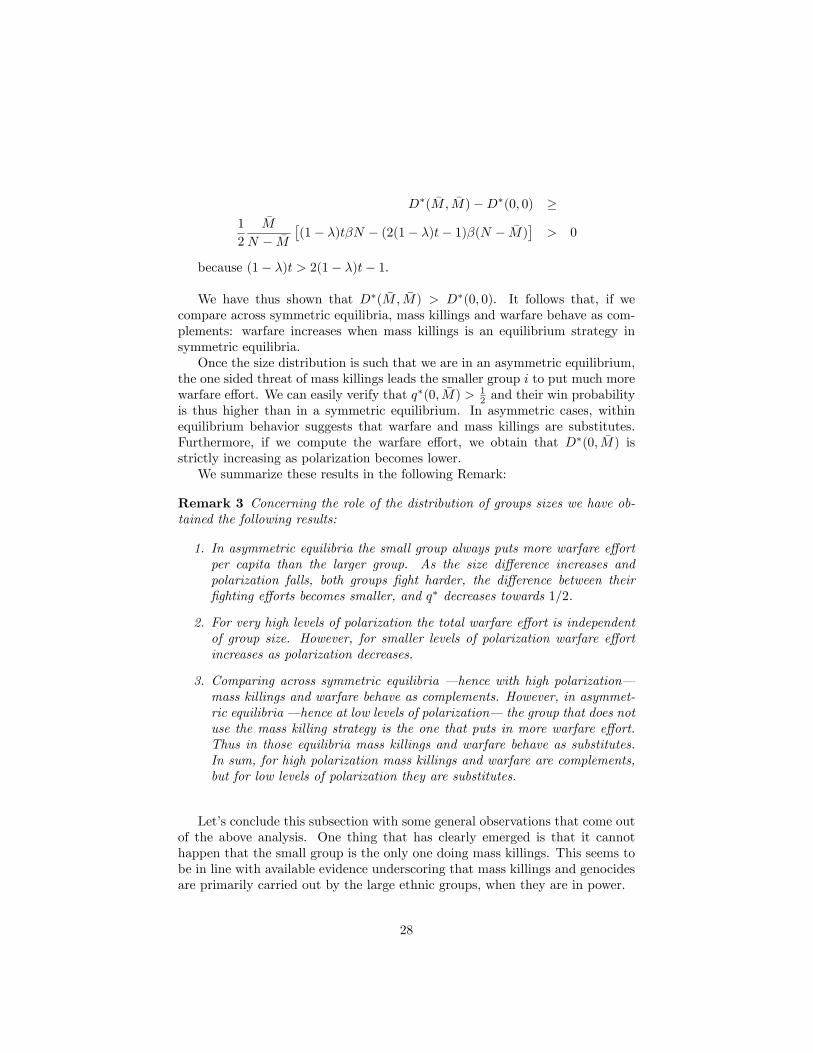
We have thus shown that D�( �M; �M) > D�(0; 0). It follows that, if wecompare across symmetric equilibria, mass killings and warfare behave as com-plements: warfare increases when mass killings is an equilibrium strategy insymmetric equilibria.Once the size distribution is such that we are in an asymmetric equilibrium,
the one sided threat of mass killings leads the smaller group i to put much morewarfare e¤ort. We can easily verify that q�(0; �M) > 1
2 and their win probabilityis thus higher than in a symmetric equilibrium. In asymmetric cases, withinequilibrium behavior suggests that warfare and mass killings are substitutes.Furthermore, if we compute the warfare e¤ort, we obtain that D�(0; �M) isstrictly increasing as polarization becomes lower.We summarize these results in the following Remark:
Remark 3 Concerning the role of the distribution of groups sizes we have ob-tained the following results:
1. In asymmetric equilibria the small group always puts more warfare e¤ortper capita than the larger group. As the size di¤erence increases andpolarization falls, both groups �ght harder, the di¤erence between their�ghting e¤orts becomes smaller, and q� decreases towards 1=2.
2. For very high levels of polarization the total warfare e¤ort is independentof group size. However, for smaller levels of polarization warfare e¤ortincreases as polarization decreases.
3. Comparing across symmetric equilibria � hence with high polarization�mass killings and warfare behave as complements. However, in asymmet-ric equilibria � hence at low levels of polarization� the group that does notuse the mass killing strategy is the one that puts in more warfare e¤ort.Thus in those equilibria mass killings and warfare behave as substitutes.In sum, for high polarization mass killings and warfare are complements,but for low levels of polarization they are substitutes.
Let�s conclude this subsection with some general observations that come outof the above analysis. One thing that has clearly emerged is that it cannothappen that the small group is the only one doing mass killings. This seems tobe in line with available evidence underscoring that mass killings and genocidesare primarily carried out by the large ethnic groups, when they are in power.
28
A second general observation is that the small group, due to the expectedviolent consequences of defeat, has more at stake and hence shows a higher�ghting activity in the battle�eld. Irrespective of group size, they never spendless � over and above the �x cost� than the large group. The prediction thatthe rebel minority will �ght relatively harder than the government also seemsaligned with available evidence.
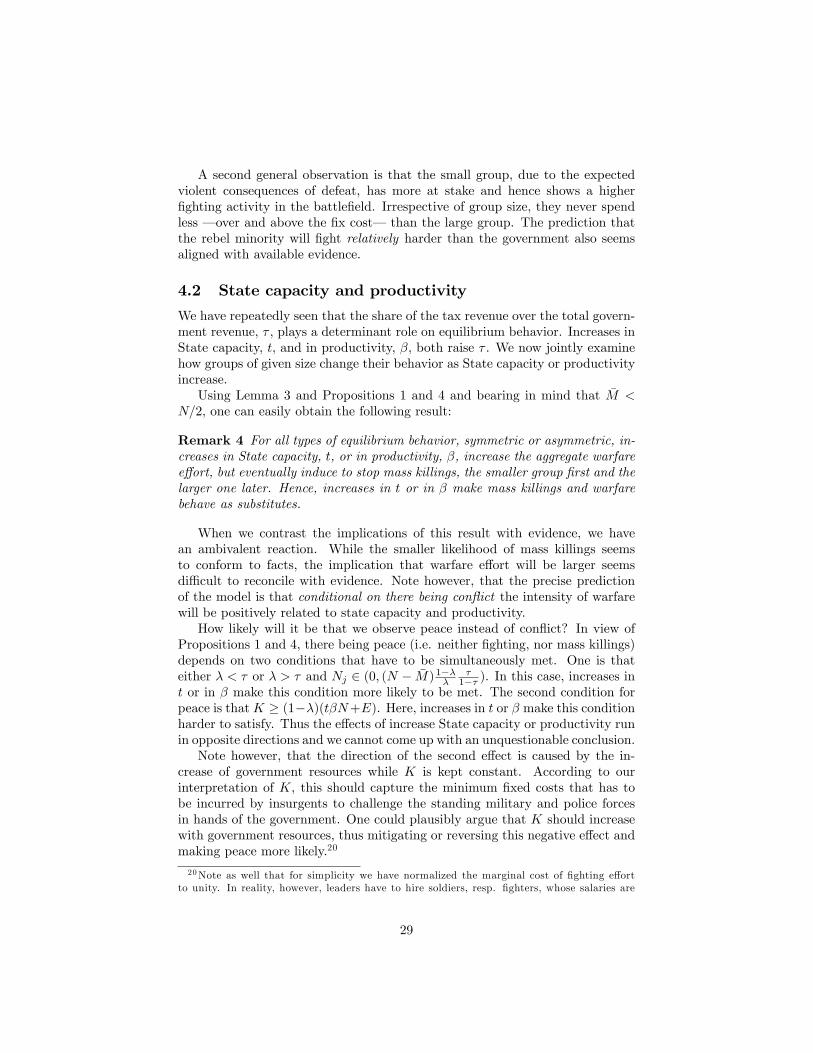
4.2 State capacity and productivity
We have repeatedly seen that the share of the tax revenue over the total govern-ment revenue, � , plays a determinant role on equilibrium behavior. Increases inState capacity, t, and in productivity, �, both raise � . We now jointly examinehow groups of given size change their behavior as State capacity or productivityincrease.Using Lemma 3 and Propositions 1 and 4 and bearing in mind that �M <
N=2, one can easily obtain the following result:
Remark 4 For all types of equilibrium behavior, symmetric or asymmetric, in-creases in State capacity, t, or in productivity, �, increase the aggregate warfaree¤ort, but eventually induce to stop mass killings, the smaller group �rst and thelarger one later. Hence, increases in t or in � make mass killings and warfarebehave as substitutes.
When we contrast the implications of this result with evidence, we havean ambivalent reaction. While the smaller likelihood of mass killings seemsto conform to facts, the implication that warfare e¤ort will be larger seemsdi¢ cult to reconcile with evidence. Note however, that the precise predictionof the model is that conditional on there being con�ict the intensity of warfarewill be positively related to state capacity and productivity.How likely will it be that we observe peace instead of con�ict? In view of
Propositions 1 and 4, there being peace (i.e. neither �ghting, nor mass killings)depends on two conditions that have to be simultaneously met. One is thateither � < � or � > � and Nj 2 (0; (N � �M) 1���
�1�� ). In this case, increases in
t or in � make this condition more likely to be met. The second condition forpeace is thatK � (1��)(t�N+E). Here, increases in t or � make this conditionharder to satisfy. Thus the e¤ects of increase State capacity or productivity runin opposite directions and we cannot come up with an unquestionable conclusion.Note however, that the direction of the second e¤ect is caused by the in-
crease of government resources while K is kept constant. According to ourinterpretation of K, this should capture the minimum �xed costs that has tobe incurred by insurgents to challenge the standing military and police forcesin hands of the government. One could plausibly argue that K should increasewith government resources, thus mitigating or reversing this negative e¤ect andmaking peace more likely.20
20Note as well that for simplicity we have normalized the marginal cost of �ghting e¤ortto unity. In reality, however, leaders have to hire soldiers, resp. �ghters, whose salaries are
29
4.3 Natural resources
Let us now examine the e¤ects of increases in the natural resource generatedrent component of public revenue E on the intensity of warfare, mass killingsand the likelihood of con�ict.Using again Lemma 3 and Propositions 1 and 4 we obtain the following
result concerning the natural resources abundance.
Remark 5 For all types of equilibrium behavior, symmetric or asymmetric,increases in natural resource revenue, E, increase the aggregate warfare e¤ortand make mass killings more likely. Hence, increases in E make mass killingsand warfare behave as complements.
As a country becomes more resource rich, the government revenue is lessdependent of the productive activity of its population. As the cost of doingmass killings is lower murdering becomes more lucrative. As for warfare, itseems natural that the e¤orts are higher the more is at stake.There is peace (i.e. both �ghting and massacres are absent) if and only if:
� either � < � or � > � and Nj 2 (0; (N � �M) 1����1�� ). Any increase in E
reduces � and this makes the conditions for peace � including the rangeof population levels� less likely to be met.
� The second condition for peace is that K � (1 � �)(t�N + E). Again,increases in E make this condition harder to satisfy.
We can thus conclude that an increase in E makes con�ict and mass killingsmore likely. This is consistent with the empirical literature showing that thepresence of natural resources increases the risk of civil war (see for example Ross,2006, for a survey). The existing evidence on natural resources and mass killingsis very scarce, but we will present in Section 6 some new �ndings consistent withthe above predictions.In the previous subsection we argued that as the government revenue in-
creases so do the army and police forces � and K with them. If this were thecase, the e¤ect of an increase of E on the second condition would be less clearcut.
4.4 Limits to exploitation
We now deal with the consequences of a tighter pressure for a fair treatment ofthe losers, captured by an increase in �. There seems to be a well establishedview that one of the essential roles of the international community is to stopunfair treatment of the opposition and to promote democracy. These are seenas means towards a more peaceful world. Our results challenge that wisdom.Using once more Lemma 3 and Propositions 1 and 4 we obtain the following
result concerning the tightening of the limits to unfairness.
an increasing function of �. Hence, in more productive countries the opportunity cost ofbecoming a professional soldier is higher, which makes con�ict costlier, and peace easier tosustain.
30
Remark 6 For all types of equilibrium behavior, symmetric or asymmetric,increases in � decrease the aggregate warfare e¤ort, but make mass killingsmore likely. Hence, increases in � make mass killings and warfare behave assubstitutes.
According to our model, while a moderate pressure for fairness may be bene-�cial in that it reduces the intensity of warfare, a tight pressure may precipitatemass killings. The rationale is that the tighter the limitations to unfairness, thesmaller is the gain in case of victory for the given population. This makes masskillings the most pro�table strategy. External intervention, while having a longrun positive e¤ect, may in the short run trigger episodes of mass killings.But, will an increase of pressure for fairness and democracy enhance or
hinder peace? Following the same steps as in the previous subsections we cansee that it will have an ambiguous e¤ect on the likelihood of peace. While the�rst condition is harder to meet, the second condition is easier with an increasein �. Once more the overall result is ambiguous.Notice, however, that if the second condition is met but not the �rst one
the model predicts that the government will do mass killings even without anuprising. Therefore, if a non-democratic country had been in peace and isinduced to commit to democratization, our model predicts that the governmentmay murder part of the opponents before starting the democratization process.
4.5 The "shadow" of mass killings
Even though the conditions for mass killings have been already dealt with whenanalyzing equilibrium behavior, we wish to brie�y discuss the speci�c role ofthe "shadow" of mass killings on strategic behavior.We have shown that in non polarized societies, where only the larger group
wants to commit massacres, mass killings and battle�eld warfare are substitutes,in the sense that the smaller group compensates for the fear of decimationif defeated by �ghting harder than the other group. We have also seen thatthere is complementarity in symmetric equilibria: when both groups plan massmurdering in case of victory, both �ght harder in the battle�eld.We can now ask what happens if �M is lowered, i.e. if the threshold on
mass killings before a foreign intervention is triggered is tightened. Lowering�M obviously reduces the number of victims (conditional on there being masskillings), and secondly it makes them less likely by shrinking the set of groupsizes for which there will be mass killings. Furthermore, in the symmetric case,with � > � , we can easily obtain that battle�eld e¤orts will also decrease.Let us now discuss the asymmetric case where Ni < Nj , and only group j
would want to commit massacres. Di¤erentiating with respect to �M in (42) weobtain that
@�i(0; �M)
@ �M=@�j(0; �M)
@ �M+ �:
It follows that the warfare e¤ort contributed by the smaller group relativeto the e¤ort by the larger one will have increased. Consequently, q� increases
31
too. Therefore, again, in relative terms warfare e¤orts are substitutes for masskillings in asymmetric equilibria.Note that because q� > 1=2 a further increase in q� reduces the term q�(1�
q�) in (34) and in (35), the expressions for D�i and D
�j . Hence, the total sign
of the e¤ect of �M on the absolute levels of warfare e¤orts D�i and D
�j cannot
unambiguously be established.The results obtained make sense. If the life toll of being defeated decreases
because of a lower �M , the threatened group decreases its warfare e¤ort. As forthe larger group, the reduced possibility of increasing its payo¤ via a larger rentshare (produced by murdering) partially compensates for a larger probability ofvictory.Overall, if the international community had to decide whether to change
policies in a way to reduce �M or increase �, the �rst channel should de�nitelybe preferred, according to our analysis. However, a reduction in �M also reducesthe probability of winning on the battle�eld for the minority group, and henceour analysis can also rationalize opposition to foreign intervention by leaders ofminority groups.
5 Discussion and extensions of results
5.1 Mass killing incentives do not apply to interstate con-�icts
If i and j are countries rather than groups in one country, then there are severaldi¤erences with respect to the model analyzed in this paper. Internationally itis harder to enforce treaties, hence the maximum exploitation bounds are harderto conceive and implement. This amounts to saying that in the interstate crisissettings, the � constraint that can be feasible is lower. If the � constraint thatcan be imposed is lower, this automatically implies lower likelihood of masskillings in interstate wars even keeping the rest of the model unchanged.Most importantly, two separate countries do not have a common government,
do not have a common pool of resources and a common State capacity, sothe incentives to exterminate the other country�s population are lower becausethese people are not claiming a proportional share of a signi�cant commonpool of resources. Moreover, even if two neighboring countries discover naturalresources at the borders and try to agree on a division of the future revenues, itis less likely than in domestic arrangements that the proportionality benchmarkto group sizes would have any bearing.
5.2 Democratization and foreign "political" intervention
Let us now return to the multiple potential sources of changes in �.The parameter � captures how well powerless groups expect to be treated
de facto in a country. In this sense, �Ni
N � g0i could be thought of as a measureof democratization or improved minority protection. We prefer to talk about
32
democratization rather than democracy, or improved minority protection ratherthan absolute level of minority protection. The reason is simple: if the countryhas a stable regime and there are no external or internal new pressures to changethe acceptable discrimination of minority groups, consistency would require thatthe initial share for group i, g0i, be exactly equal to �Ni
N . Thus the startingpoint, interpreted in that case as a steady state of a dynamic process, wouldhave to be peaceful.21
On the other hand, the situations in which �Ni
N � g0i is positive are insteadsituations in which our model fully applies, capturing therefore a transitionphase, a phase in which the ruling group is expecting tighter limits to its abilityto exploit or, by the same token, the rebel group expects the time to be rightto change the unfair status quo.Another interpretation of the variable � is how tight outside constraints are
for power-sharing. The variable � can re�ect foreign "political" interventions.It may depend on the pressure on the terms of the after war settlement. Thispressure can involve conditions for qualifying for foreign aid or access to loansfrom international �nancial institutions. A higher � could also re�ect an expec-tation of an incipient democratization process imposed from outside pressures,leading eventually to less group discrimination. If the world�s superpower(s)follow a so-called �Neo-Con" agenda and put a lot of pressure on rogue Statesand their leaders to adopt some ready-made democratic measures in favor ofpowerless groups this would be re�ected in our model by a large �.Suppose � was small because historically the international community had
not been able to e¤ectively intervene in civil wars. In this scenario, an increasein intervention � an increase in �� has bene�cial e¤ects because it reducesbattle�eld warfare. However, as soon as it goes above the threshold, foreignintervention may trigger mass killings or genocide. We would obtain the sameimplication if, consistently with our �rst interpretation, the change is due to anexpected democratization of the country (either domestically or internationalpropelled).Hence, one conclusion of our analysis is that at least in some situations
this will not work. Forcing a "bad" leader to exploit less some minority than hewould want in equilibrium may lead to a substitution and can give incentives forkilling rather than exploiting some minority. The failure of externally imposedpseudo-"democracy" in the absence of a strong civil society has for examplebeen observed in Iraq, Afghanistan, and in various African States.22
In what contexts is external intervention in domestic politics (i.e. imposinga large �) especially problematic? A large � increases the risk of mass killings.However, if the level of natural resources E is very low, even for a large � masskillings are not feasible. Hence, while the Neo-Con agenda of imposing democ-racy failed in resource rich countries like Iraq they may have better chances to
21For this to be true, one should imagine that one of the determinants of the lower boundon exploitation of minorities is indeed the elimination of the incentives to further rebellionsdown the road.22See Collier and Rohner (2008) for a systematic analysis of the conditions under which
democracy can back�re.
33
succeed in resource-poor countries.
5.3 Extensions of the model
The model could be easily extended by allowing each group to have di¤erentwealth endowments, di¤erent productivity levels, and even separate control orproperty rights on natural resource discoveries, rather than assuming govern-ment control of all natural resources. Adding separate endowments wi; wj andseparate natural resource rent controls, Ei; Ej , would be easy to do, and theresults would not change qualitatively. An advantage of this extension is that itwould make the model �t with the economic motivations behind the Holocaust(signi�cant wealth to appropriate).If we allowed for di¤erent distributions of property rights on natural resource
rents between private and public, our analysis would suggest that natural re-source discoveries would typically be more dangerous if the resources are directlyowned and controlled by the government.23
A second extension to consider could be an explicit interpretation of � asdetermined by the threat of future rebellions: the most the winners can ap-propriate is the �peace surplus", that is the equilibrium waste of a subsequentcivil war. This depends on the population sizes of the two groups. Therefore,a richer analysis of strategic mass killings should include as an additional mo-tivation that the decimation of the opponent also has an e¤ect on their futurecapacity to rebel. The extension of our model to a fully dynamic framework isin our research agenda.Beside the potential extensions to heterogeneous parameters mentioned above,
a third important extension that could be considered relates to the descriptionof economic activities: it is for example realistic to allow for decreasing re-turns in agricultural production. If one thinks of Rwanda, the really importantcontestable resource there is productive land, and a combination of excessivepopulation and decreasing returns from agricultural production could explainthe mass killings incentives there.24 This would require only a minor modi�ca-tion of the production function, which we did not want to do in the benchmarkmodel simply for the sake of tractability.We would like to emphasize that the logic of our model could also be useful
to capture the essential motivations behind the genocide of native Americantribes: the American Indians were holding o¤ the important development andexploitation of the great resources of the West, and their traditional use of theland was considered much less e¢ cient than the alternative, hence the elimina-tion of them had both a large impact on the amount of natural resources thatit became possible to extract and on the average productivity. To capture thisstory fully in the model, one would have to attribute a lower �i to the Indiansand consider E as E(Ni), capturing the fact that the amount of productive
23We also �nd in our empirical analysis that natural resources have a stronger impact onmass killings if they are State-owned (regression results are available from the authors).24Andre and Platteau (1998) show that in the genocide in Rwanda Tutsis with large land
holdings faced a particularly high risk of being targeted by the Hutu death squads.
34
land and other resources exploitable by the U.S. was considered decreasing inthe size of Indian occupied territories. Only when the Indians accepted (orwere forced to accept) the clear discrimination of reservations (low �) the masskillings stopped. In any case, it is obvious that these historical explorations area research subject on their own. Now we limit ourselves to the analysis of thericher available data on mass killings occurring after World War II.
6 Empirical Analysis
We shall confront some of our predictions with the data.One of the main purposes of the country level regressions in subsection 6.1 is
to assess how robust the existing empirical evidence on mass killings and refugeesis when important econometric issues are taken into account. Further, we wantto include in the analysis several new variables, e.g. on natural resources, thatplay a crucial role in our model, but have been largely neglected in the existingliterature.The ethnic group level analysis performed afterwards in subsection 6.2 aims
to study for the �rst time what kind of ethnic groups are targeted in masskillings. Surprisingly, the existing literature has only studied mass killings anddisplacements on either a very aggregate level (i.e. with cross-country panels) oron a very disaggregate level (i.e. case studies of single countries). Studying thesephenomena with a panel of ethnic group data makes sense, as in reality decisionsto commit massacres are strategic decisions at the group level (as emphasizedin our model).
6.1 Country level evidence
We shall start with assessing the explanatory factors of mass killings using paneldata for a cross-section of countries. Like in most of the existing literaturereviewed in section 2, we use a dummy variable for mass killings and we runlogit regressions. For the dependent variable in Table 1 we will rely on themost widely used dataset on mass killings, collected by the "Political InstabilityTask Force" under the direction of Barbara Har¤. All independent variables areexplained in detail in the Data Appendix. Our sample contains all countriesthat are in the Correlates of War system, i.e. which corresponds to all countriesthat have some minimum size and international recognition, and covers the years1960-2007. This leaves us with between 2500 and 5000 observations dependingon the speci�cation.Most of the existing empirical literature on mass killings su¤ers from three
weaknesses which we try to address:1) There is usually an important omitted variables bias. Most studies use a
pooled panel without controlling for unobserved heterogeneity. This is a seriousissue, as the variation between countries that experience mass killings and coun-tries that do not can be driven by various factors that are di¢ cult to observe.A good way to address these concerns would be to include country �xed e¤ects.
35
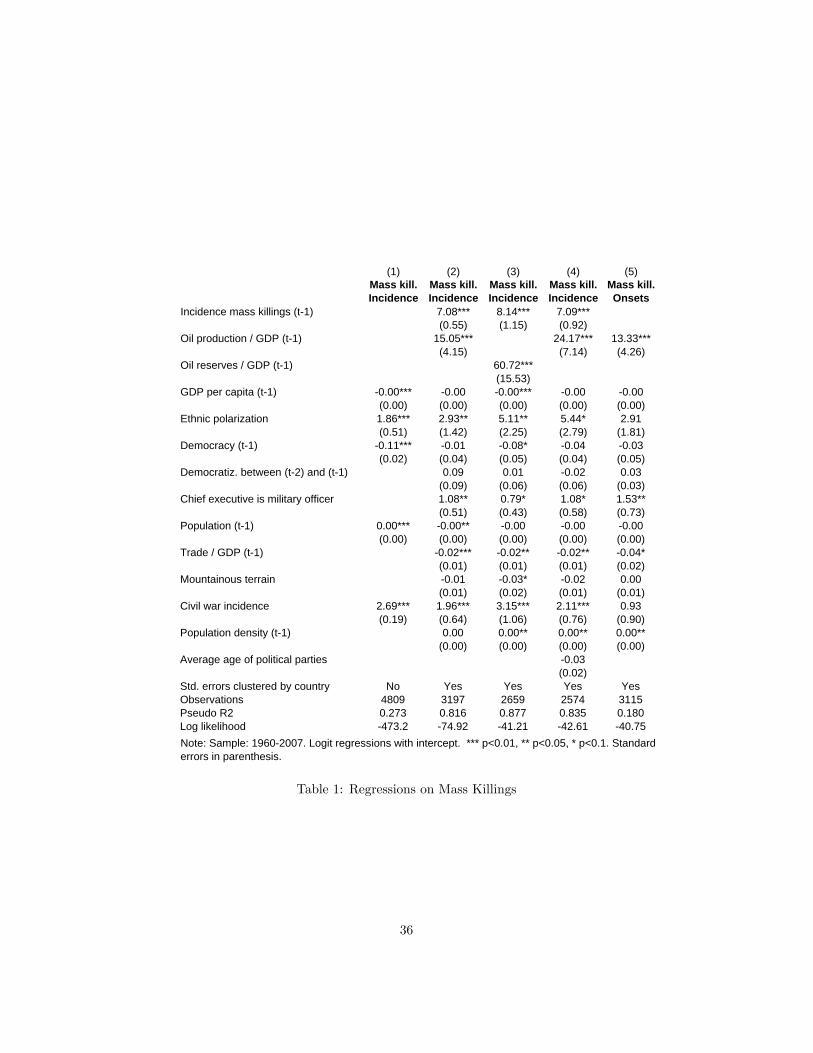
(1) (2) (3) (4) (5)Mass kill. Mass kill. Mass kill. Mass kill. Mass kill.Incidence Incidence Incidence Incidence Onsets
Incidence mass killings (t1) 7.08*** 8.14*** 7.09***(0.55) (1.15) (0.92)
Oil production / GDP (t1) 15.05*** 24.17*** 13.33***(4.15) (7.14) (4.26)
Oil reserves / GDP (t1) 60.72***(15.53)
GDP per capita (t1) 0.00*** 0.00 0.00*** 0.00 0.00(0.00) (0.00) (0.00) (0.00) (0.00)
Ethnic polarization 1.86*** 2.93** 5.11** 5.44* 2.91(0.51) (1.42) (2.25) (2.79) (1.81)
Democracy (t1) 0.11*** 0.01 0.08* 0.04 0.03(0.02) (0.04) (0.05) (0.04) (0.05)
Democratiz. between (t2) and (t1) 0.09 0.01 0.02 0.03(0.09) (0.06) (0.06) (0.03)
Chief executive is military officer 1.08** 0.79* 1.08* 1.53**(0.51) (0.43) (0.58) (0.73)
Population (t1) 0.00*** 0.00** 0.00 0.00 0.00(0.00) (0.00) (0.00) (0.00) (0.00)
Trade / GDP (t1) 0.02*** 0.02** 0.02** 0.04*(0.01) (0.01) (0.01) (0.02)
Mountainous terrain 0.01 0.03* 0.02 0.00(0.01) (0.02) (0.01) (0.01)
Civil war incidence 2.69*** 1.96*** 3.15*** 2.11*** 0.93(0.19) (0.64) (1.06) (0.76) (0.90)
Population density (t1) 0.00 0.00** 0.00** 0.00**(0.00) (0.00) (0.00) (0.00)
Average age of political parties 0.03(0.02)
Std. errors clustered by country No Yes Yes Yes YesObservations 4809 3197 2659 2574 3115Pseudo R2 0.273 0.816 0.877 0.835 0.180Log likelihood 473.2 74.92 41.21 42.61 40.75Note: Sample: 19602007. Logit regressions with intercept. *** p<0.01, ** p<0.05, * p<0.1. Standarderrors in parenthesis.
Table 1: Regressions on Mass Killings
36
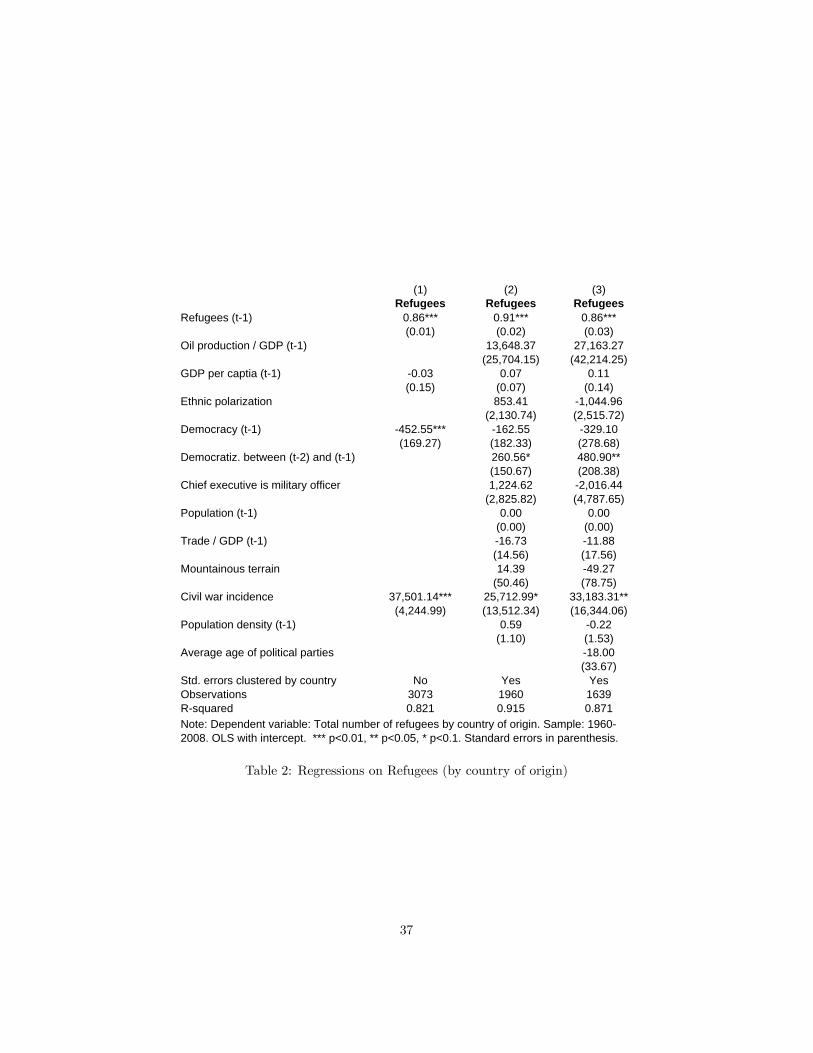
(1) (2) (3)Refugees Refugees Refugees
Refugees (t1) 0.86*** 0.91*** 0.86***(0.01) (0.02) (0.03)
Oil production / GDP (t1) 13,648.37 27,163.27(25,704.15) (42,214.25)
GDP per captia (t1) 0.03 0.07 0.11(0.15) (0.07) (0.14)
Ethnic polarization 853.41 1,044.96(2,130.74) (2,515.72)
Democracy (t1) 452.55*** 162.55 329.10(169.27) (182.33) (278.68)
Democratiz. between (t2) and (t1) 260.56* 480.90**(150.67) (208.38)
Chief executive is military officer 1,224.62 2,016.44(2,825.82) (4,787.65)
Population (t1) 0.00 0.00(0.00) (0.00)
Trade / GDP (t1) 16.73 11.88(14.56) (17.56)
Mountainous terrain 14.39 49.27(50.46) (78.75)
Civil war incidence 37,501.14*** 25,712.99* 33,183.31**(4,244.99) (13,512.34) (16,344.06)
Population density (t1) 0.59 0.22(1.10) (1.53)
Average age of political parties 18.00(33.67)
Std. errors clustered by country No Yes YesObservations 3073 1960 1639Rsquared 0.821 0.915 0.871Note: Dependent variable: Total number of refugees by country of origin. Sample: 19602008. OLS with intercept. *** p<0.01, ** p<0.05, * p<0.1. Standard errors in parenthesis.
Table 2: Regressions on Refugees (by country of origin)
37
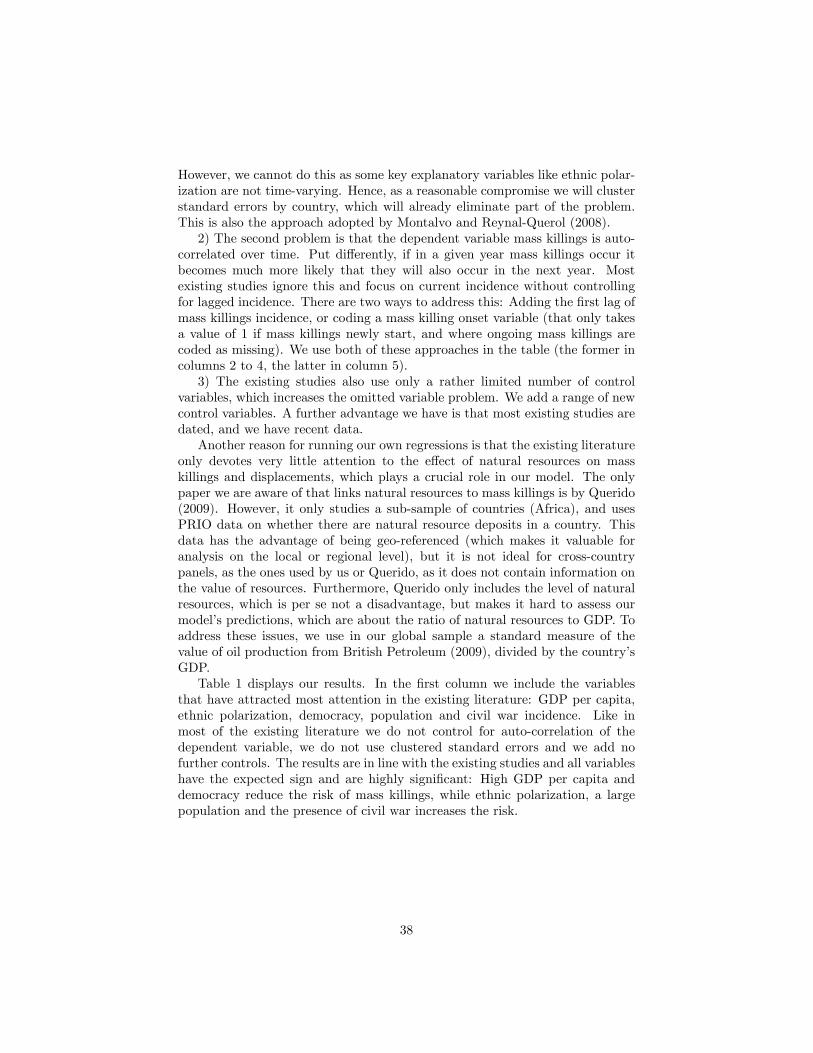
However, we cannot do this as some key explanatory variables like ethnic polar-ization are not time-varying. Hence, as a reasonable compromise we will clusterstandard errors by country, which will already eliminate part of the problem.This is also the approach adopted by Montalvo and Reynal-Querol (2008).2) The second problem is that the dependent variable mass killings is auto-
correlated over time. Put di¤erently, if in a given year mass killings occur itbecomes much more likely that they will also occur in the next year. Mostexisting studies ignore this and focus on current incidence without controllingfor lagged incidence. There are two ways to address this: Adding the �rst lag ofmass killings incidence, or coding a mass killing onset variable (that only takesa value of 1 if mass killings newly start, and where ongoing mass killings arecoded as missing). We use both of these approaches in the table (the former incolumns 2 to 4, the latter in column 5).3) The existing studies also use only a rather limited number of control
variables, which increases the omitted variable problem. We add a range of newcontrol variables. A further advantage we have is that most existing studies aredated, and we have recent data.Another reason for running our own regressions is that the existing literature
only devotes very little attention to the e¤ect of natural resources on masskillings and displacements, which plays a crucial role in our model. The onlypaper we are aware of that links natural resources to mass killings is by Querido(2009). However, it only studies a sub-sample of countries (Africa), and usesPRIO data on whether there are natural resource deposits in a country. Thisdata has the advantage of being geo-referenced (which makes it valuable foranalysis on the local or regional level), but it is not ideal for cross-countrypanels, as the ones used by us or Querido, as it does not contain information onthe value of resources. Furthermore, Querido only includes the level of naturalresources, which is per se not a disadvantage, but makes it hard to assess ourmodel�s predictions, which are about the ratio of natural resources to GDP. Toaddress these issues, we use in our global sample a standard measure of thevalue of oil production from British Petroleum (2009), divided by the country�sGDP.Table 1 displays our results. In the �rst column we include the variables
that have attracted most attention in the existing literature: GDP per capita,ethnic polarization, democracy, population and civil war incidence. Like inmost of the existing literature we do not control for auto-correlation of thedependent variable, we do not use clustered standard errors and we add nofurther controls. The results are in line with the existing studies and all variableshave the expected sign and are highly signi�cant: High GDP per capita anddemocracy reduce the risk of mass killings, while ethnic polarization, a largepopulation and the presence of civil war increases the risk.
38
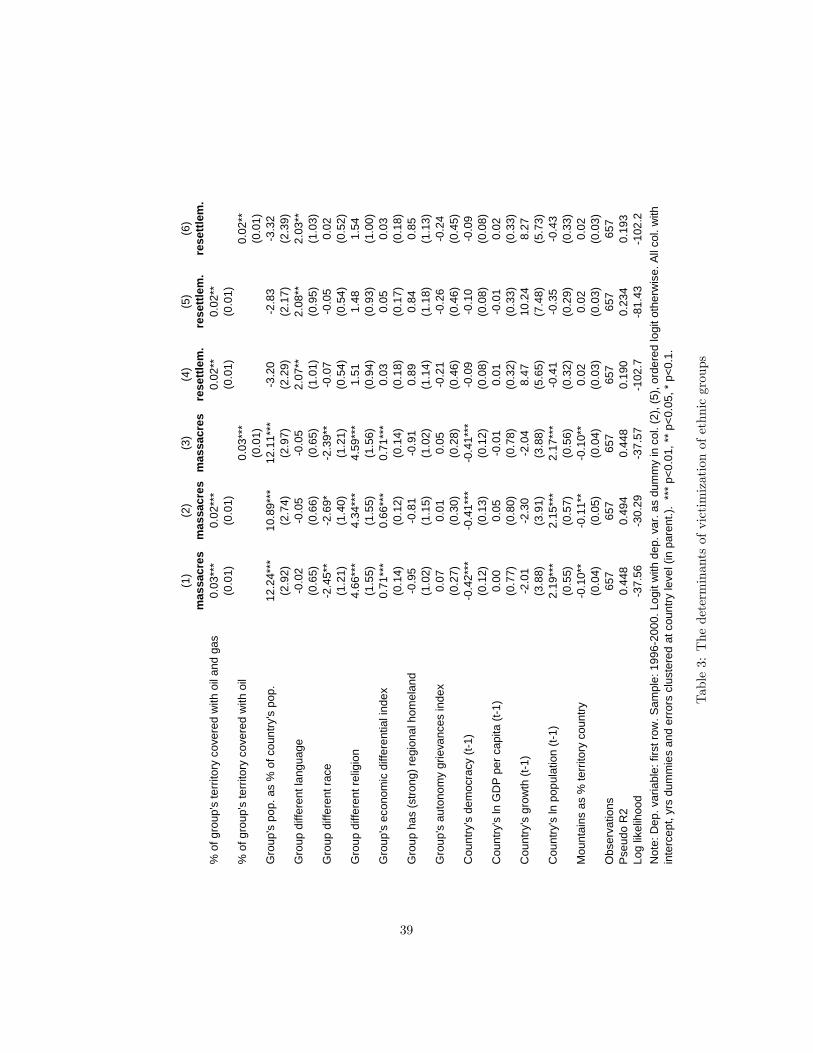
(1)
(2)
(3)
(4)
(5)
(6)
mas
sacr
esm
assa
cres
mas
sacr
esre
settl
em.
rese
ttlem
.re
settl
em.
% o
f gro
up's
terr
itory
cov
ered
with
oil
and
gas
0.03
***
0.02
***
0.02
**0.
02**
(0.0
1)(0
.01)
(0.0
1)(0
.01)
% o
f gro
up's
terr
itory
cov
ered
with
oil
0.03
***
0.02
**(0
.01)
(0.0
1)G
roup
's p
op. a
s %
of c
ount
ry's
pop
.12
.24*
**10
.89*
**12
.11*
**3
.20
2.8
33
.32
(2.9
2)(2
.74)
(2.9
7)(2
.29)
(2.1
7)(2
.39)
Gro
up d
iffer
ent l
angu
age
0.0
20
.05
0.0
52.
07**
2.08
**2.
03**
(0.6
5)(0
.66)
(0.6
5)(1
.01)
(0.9
5)(1
.03)
Gro
up d
iffer
ent r
ace
2.4
5**
2.6
9*2
.39*
*0
.07
0.0
50.
02(1
.21)
(1.4
0)(1
.21)
(0.5
4)(0
.54)
(0.5
2)G
roup
diff
eren
t rel
igio
n4.
66**
*4.
34**
*4.
59**
*1.
511.
481.
54(1
.55)
(1.5
5)(1
.56)
(0.9
4)(0
.93)
(1.0
0)G
roup
's e
cono
mic
diff
eren
tial i
ndex
0.71
***
0.66
***
0.71
***
0.03
0.05
0.03
(0.1
4)(0
.12)
(0.1
4)(0
.18)
(0.1
7)(0
.18)
Gro
up h
as (s
trong
) reg
iona
l hom
elan
d0
.95
0.8
10
.91
0.89
0.84
0.85
(1.0
2)(1
.15)
(1.0
2)(1
.14)
(1.1
8)(1
.13)
Gro
up's
aut
onom
y gr
ieva
nces
inde
x0.
070.
010.
050
.21
0.2
60
.24
(0.2
7)(0
.30)
(0.2
8)(0
.46)
(0.4
6)(0
.45)
Cou
ntry
's d
emoc
racy
(t1
)0
.42*
**0
.41*
**0
.41*
**0
.09
0.1
00
.09
(0.1
2)(0
.13)
(0.1
2)(0
.08)
(0.0
8)(0
.08)
Cou
ntry
's ln
GD
P p
er c
apita
(t1
)0.
000.
050
.01
0.01
0.0
10.
02(0
.77)
(0.8
0)(0
.78)
(0.3
2)(0
.33)
(0.3
3)C
ount
ry's
gro
wth
(t1
)2
.01
2.3
02
.04
8.47
10.2
48.
27(3
.88)
(3.9
1)(3
.88)
(5.6
5)(7
.48)
(5.7
3)C
ount
ry's
ln p
opul
atio
n (t
1)2.
19**
*2.
15**
*2.
17**
*0
.41
0.3
50
.43
(0.5
5)(0
.57)
(0.5
6)(0
.32)
(0.2
9)(0
.33)
Mou
ntai
ns a
s %
terr
itory
cou
ntry
0.1
0**
0.1
1**
0.1
0**
0.02
0.02
0.02
(0.0
4)(0
.05)
(0.0
4)(0
.03)
(0.0
3)(0
.03)
Obs
erva
tions
657
657
657
657
657
657
Pse
udo
R2
0.44
80.
494
0.44
80.
190
0.23
40.
193
Log
likel
ihoo
d3
7.56
30.
293
7.57
102
.78
1.43
102
.2N
ote:
Dep
. var
iabl
e: fi
rst r
ow. S
ampl
e: 1
996
2000
. Log
it w
ith d
ep. v
ar. a
s du
mm
y in
col
. (2)
, (5)
, ord
ered
logi
t oth
erw
ise.
All
col.
with
inte
rcep
t, yr
s du
mm
ies
and
erro
rs c
lust
ered
at c
ount
ry le
vel (
in p
aren
t.).
***
p<0.
01, *
* p<
0.05
, * p
<0.1
.
Table3:Thedeterminantsofvictimizationofethnicgroups
39
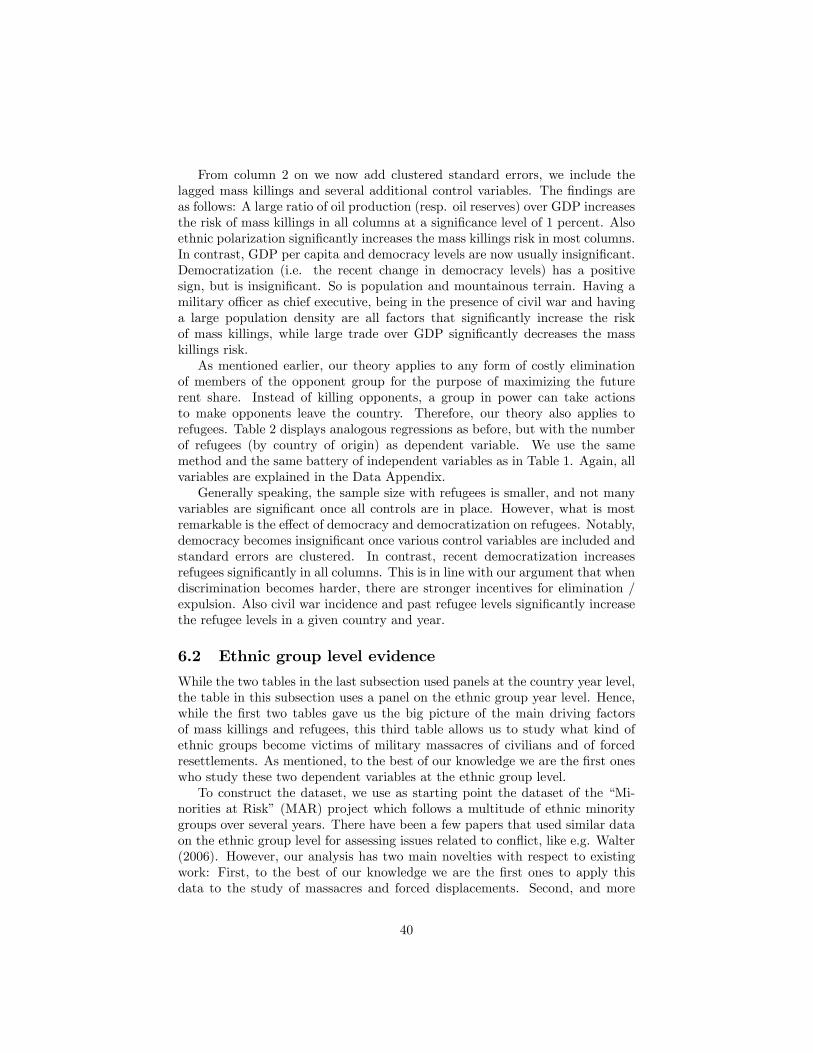
From column 2 on we now add clustered standard errors, we include thelagged mass killings and several additional control variables. The �ndings areas follows: A large ratio of oil production (resp. oil reserves) over GDP increasesthe risk of mass killings in all columns at a signi�cance level of 1 percent. Alsoethnic polarization signi�cantly increases the mass killings risk in most columns.In contrast, GDP per capita and democracy levels are now usually insigni�cant.Democratization (i.e. the recent change in democracy levels) has a positivesign, but is insigni�cant. So is population and mountainous terrain. Having amilitary o¢ cer as chief executive, being in the presence of civil war and havinga large population density are all factors that signi�cantly increase the riskof mass killings, while large trade over GDP signi�cantly decreases the masskillings risk.As mentioned earlier, our theory applies to any form of costly elimination
of members of the opponent group for the purpose of maximizing the futurerent share. Instead of killing opponents, a group in power can take actionsto make opponents leave the country. Therefore, our theory also applies torefugees. Table 2 displays analogous regressions as before, but with the numberof refugees (by country of origin) as dependent variable. We use the samemethod and the same battery of independent variables as in Table 1. Again, allvariables are explained in the Data Appendix.Generally speaking, the sample size with refugees is smaller, and not many
variables are signi�cant once all controls are in place. However, what is mostremarkable is the e¤ect of democracy and democratization on refugees. Notably,democracy becomes insigni�cant once various control variables are included andstandard errors are clustered. In contrast, recent democratization increasesrefugees signi�cantly in all columns. This is in line with our argument that whendiscrimination becomes harder, there are stronger incentives for elimination /expulsion. Also civil war incidence and past refugee levels signi�cantly increasethe refugee levels in a given country and year.
6.2 Ethnic group level evidence
While the two tables in the last subsection used panels at the country year level,the table in this subsection uses a panel on the ethnic group year level. Hence,while the �rst two tables gave us the big picture of the main driving factorsof mass killings and refugees, this third table allows us to study what kind ofethnic groups become victims of military massacres of civilians and of forcedresettlements. As mentioned, to the best of our knowledge we are the �rst oneswho study these two dependent variables at the ethnic group level.To construct the dataset, we use as starting point the dataset of the �Mi-
norities at Risk� (MAR) project which follows a multitude of ethnic minoritygroups over several years. There have been a few papers that used similar dataon the ethnic group level for assessing issues related to con�ict, like e.g. Walter(2006). However, our analysis has two main novelties with respect to existingwork: First, to the best of our knowledge we are the �rst ones to apply thisdata to the study of massacres and forced displacements. Second, and more
40
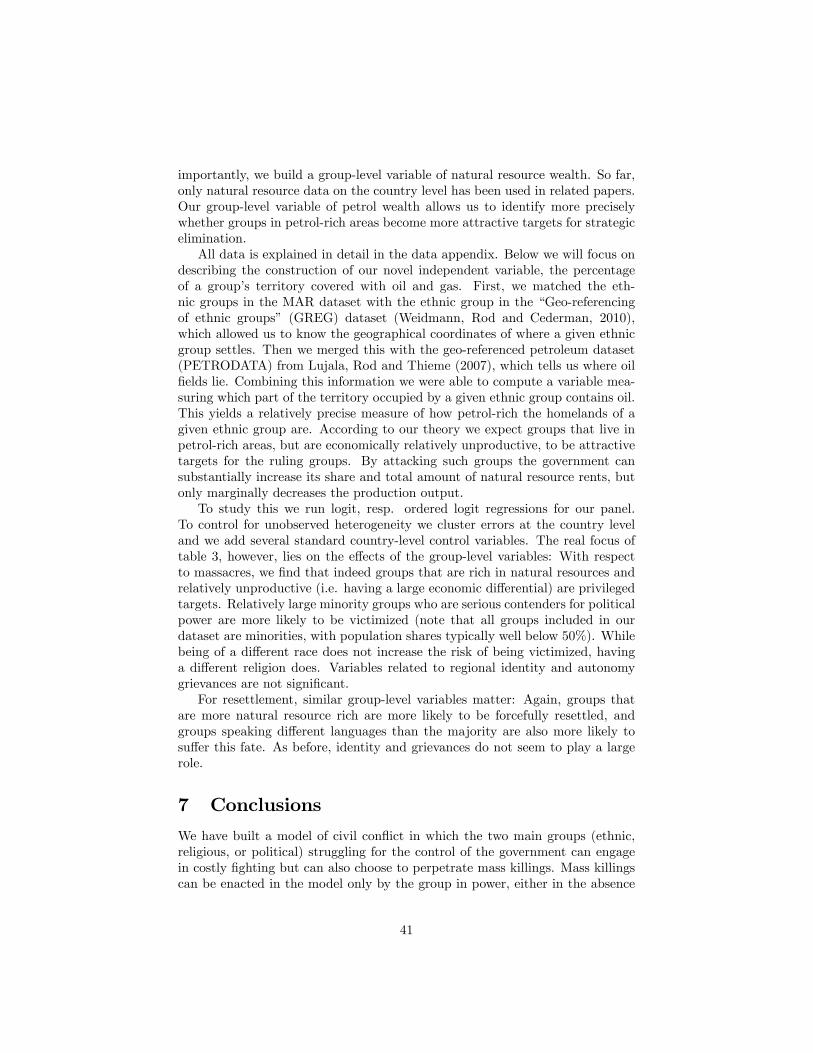
importantly, we build a group-level variable of natural resource wealth. So far,only natural resource data on the country level has been used in related papers.Our group-level variable of petrol wealth allows us to identify more preciselywhether groups in petrol-rich areas become more attractive targets for strategicelimination.All data is explained in detail in the data appendix. Below we will focus on
describing the construction of our novel independent variable, the percentageof a group�s territory covered with oil and gas. First, we matched the eth-nic groups in the MAR dataset with the ethnic group in the �Geo-referencingof ethnic groups� (GREG) dataset (Weidmann, Rod and Cederman, 2010),which allowed us to know the geographical coordinates of where a given ethnicgroup settles. Then we merged this with the geo-referenced petroleum dataset(PETRODATA) from Lujala, Rod and Thieme (2007), which tells us where oil�elds lie. Combining this information we were able to compute a variable mea-suring which part of the territory occupied by a given ethnic group contains oil.This yields a relatively precise measure of how petrol-rich the homelands of agiven ethnic group are. According to our theory we expect groups that live inpetrol-rich areas, but are economically relatively unproductive, to be attractivetargets for the ruling groups. By attacking such groups the government cansubstantially increase its share and total amount of natural resource rents, butonly marginally decreases the production output.To study this we run logit, resp. ordered logit regressions for our panel.
To control for unobserved heterogeneity we cluster errors at the country leveland we add several standard country-level control variables. The real focus oftable 3, however, lies on the e¤ects of the group-level variables: With respectto massacres, we �nd that indeed groups that are rich in natural resources andrelatively unproductive (i.e. having a large economic di¤erential) are privilegedtargets. Relatively large minority groups who are serious contenders for politicalpower are more likely to be victimized (note that all groups included in ourdataset are minorities, with population shares typically well below 50%). Whilebeing of a di¤erent race does not increase the risk of being victimized, havinga di¤erent religion does. Variables related to regional identity and autonomygrievances are not signi�cant.For resettlement, similar group-level variables matter: Again, groups that
are more natural resource rich are more likely to be forcefully resettled, andgroups speaking di¤erent languages than the majority are also more likely tosu¤er this fate. As before, identity and grievances do not seem to play a largerole.
7 Conclusions
We have built a model of civil con�ict in which the two main groups (ethnic,religious, or political) struggling for the control of the government can engagein costly �ghting but can also choose to perpetrate mass killings. Mass killingscan be enacted in the model only by the group in power, either in the absence
41
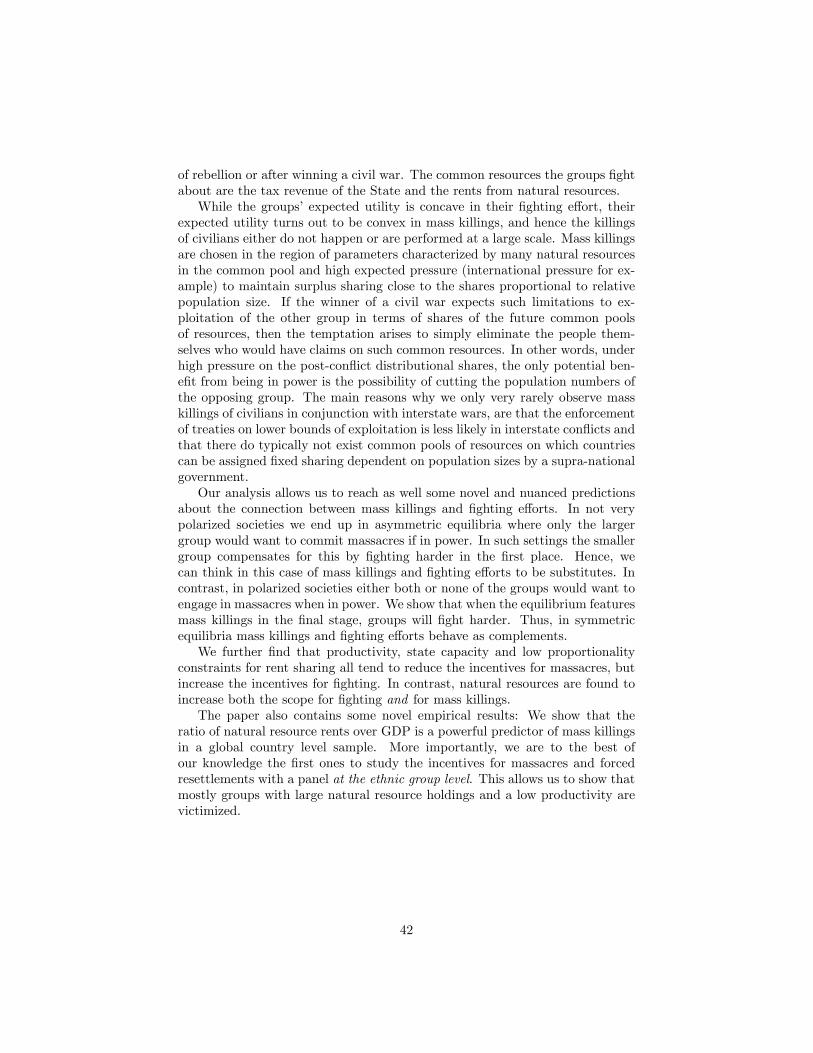
of rebellion or after winning a civil war. The common resources the groups �ghtabout are the tax revenue of the State and the rents from natural resources.While the groups�expected utility is concave in their �ghting e¤ort, their
expected utility turns out to be convex in mass killings, and hence the killingsof civilians either do not happen or are performed at a large scale. Mass killingsare chosen in the region of parameters characterized by many natural resourcesin the common pool and high expected pressure (international pressure for ex-ample) to maintain surplus sharing close to the shares proportional to relativepopulation size. If the winner of a civil war expects such limitations to ex-ploitation of the other group in terms of shares of the future common poolsof resources, then the temptation arises to simply eliminate the people them-selves who would have claims on such common resources. In other words, underhigh pressure on the post-con�ict distributional shares, the only potential ben-e�t from being in power is the possibility of cutting the population numbers ofthe opposing group. The main reasons why we only very rarely observe masskillings of civilians in conjunction with interstate wars, are that the enforcementof treaties on lower bounds of exploitation is less likely in interstate con�icts andthat there do typically not exist common pools of resources on which countriescan be assigned �xed sharing dependent on population sizes by a supra-nationalgovernment.Our analysis allows us to reach as well some novel and nuanced predictions
about the connection between mass killings and �ghting e¤orts. In not verypolarized societies we end up in asymmetric equilibria where only the largergroup would want to commit massacres if in power. In such settings the smallergroup compensates for this by �ghting harder in the �rst place. Hence, wecan think in this case of mass killings and �ghting e¤orts to be substitutes. Incontrast, in polarized societies either both or none of the groups would want toengage in massacres when in power. We show that when the equilibrium featuresmass killings in the �nal stage, groups will �ght harder. Thus, in symmetricequilibria mass killings and �ghting e¤orts behave as complements.We further �nd that productivity, state capacity and low proportionality
constraints for rent sharing all tend to reduce the incentives for massacres, butincrease the incentives for �ghting. In contrast, natural resources are found toincrease both the scope for �ghting and for mass killings.The paper also contains some novel empirical results: We show that the
ratio of natural resource rents over GDP is a powerful predictor of mass killingsin a global country level sample. More importantly, we are to the best ofour knowledge the �rst ones to study the incentives for massacres and forcedresettlements with a panel at the ethnic group level. This allows us to show thatmostly groups with large natural resource holdings and a low productivity arevictimized.
42
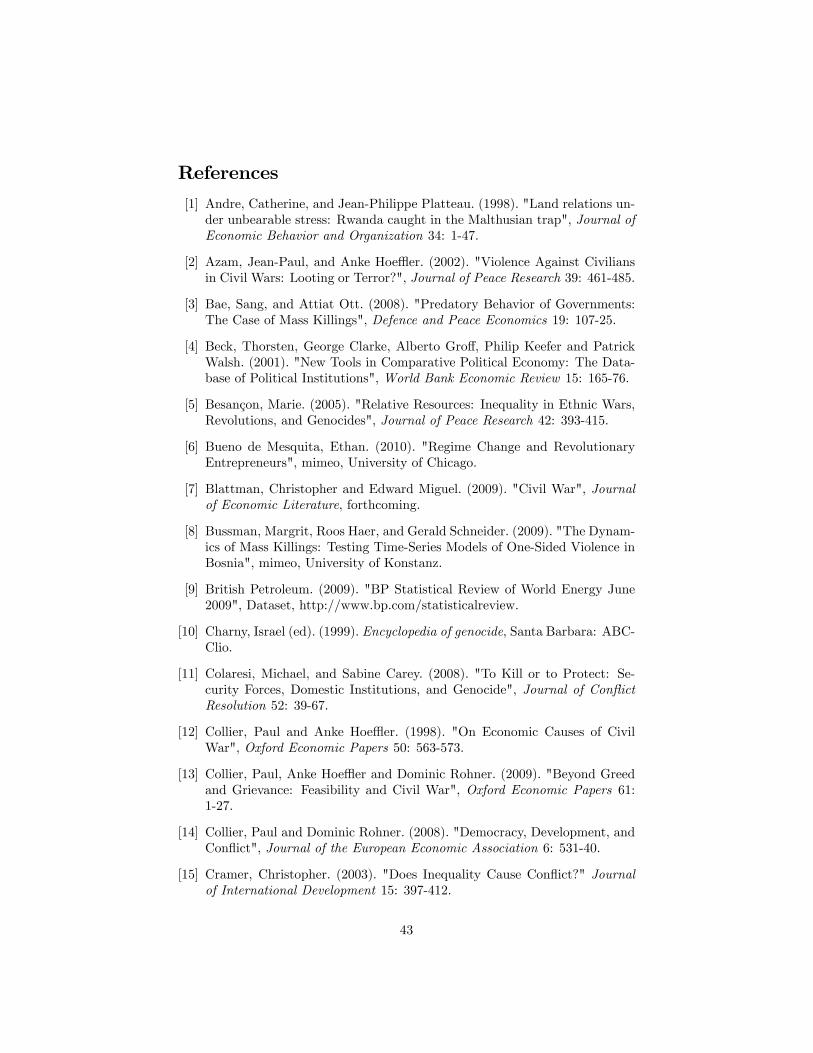
References
[1] Andre, Catherine, and Jean-Philippe Platteau. (1998). "Land relations un-der unbearable stress: Rwanda caught in the Malthusian trap", Journal ofEconomic Behavior and Organization 34: 1-47.
[2] Azam, Jean-Paul, and Anke Hoe er. (2002). "Violence Against Civiliansin Civil Wars: Looting or Terror?", Journal of Peace Research 39: 461-485.
[3] Bae, Sang, and Attiat Ott. (2008). "Predatory Behavior of Governments:The Case of Mass Killings", Defence and Peace Economics 19: 107-25.
[4] Beck, Thorsten, George Clarke, Alberto Gro¤, Philip Keefer and PatrickWalsh. (2001). "New Tools in Comparative Political Economy: The Data-base of Political Institutions", World Bank Economic Review 15: 165-76.
[5] Besançon, Marie. (2005). "Relative Resources: Inequality in Ethnic Wars,Revolutions, and Genocides", Journal of Peace Research 42: 393-415.
[6] Bueno de Mesquita, Ethan. (2010). "Regime Change and RevolutionaryEntrepreneurs", mimeo, University of Chicago.
[7] Blattman, Christopher and Edward Miguel. (2009). "Civil War", Journalof Economic Literature, forthcoming.
[8] Bussman, Margrit, Roos Haer, and Gerald Schneider. (2009). "The Dynam-ics of Mass Killings: Testing Time-Series Models of One-Sided Violence inBosnia", mimeo, University of Konstanz.
[9] British Petroleum. (2009). "BP Statistical Review of World Energy June2009", Dataset, http://www.bp.com/statisticalreview.
[10] Charny, Israel (ed). (1999). Encyclopedia of genocide, Santa Barbara: ABC-Clio.
[11] Colaresi, Michael, and Sabine Carey. (2008). "To Kill or to Protect: Se-curity Forces, Domestic Institutions, and Genocide", Journal of Con�ictResolution 52: 39-67.
[12] Collier, Paul and Anke Hoe er. (1998). "On Economic Causes of CivilWar", Oxford Economic Papers 50: 563-573.
[13] Collier, Paul, Anke Hoe er and Dominic Rohner. (2009). "Beyond Greedand Grievance: Feasibility and Civil War", Oxford Economic Papers 61:1-27.
[14] Collier, Paul and Dominic Rohner. (2008). "Democracy, Development, andCon�ict", Journal of the European Economic Association 6: 531-40.
[15] Cramer, Christopher. (2003). "Does Inequality Cause Con�ict?" Journalof International Development 15: 397-412.
43
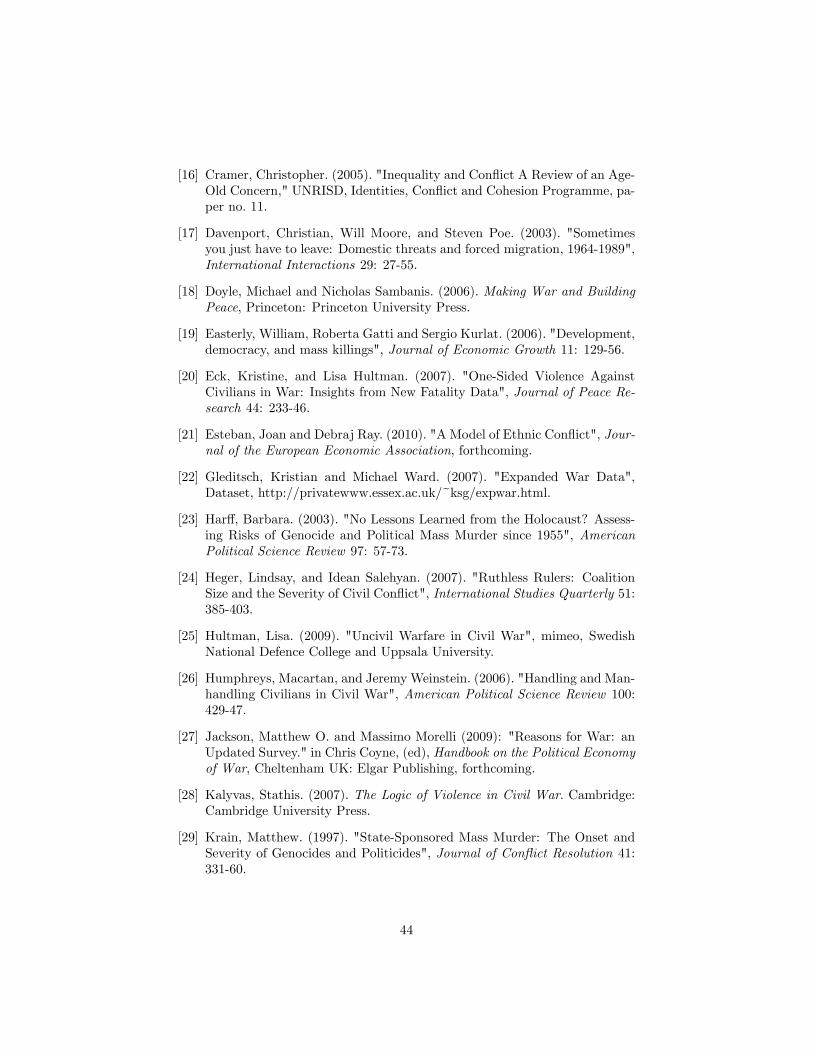
[16] Cramer, Christopher. (2005). "Inequality and Con�ict A Review of an Age-Old Concern," UNRISD, Identities, Con�ict and Cohesion Programme, pa-per no. 11.
[17] Davenport, Christian, Will Moore, and Steven Poe. (2003). "Sometimesyou just have to leave: Domestic threats and forced migration, 1964-1989",International Interactions 29: 27-55.
[18] Doyle, Michael and Nicholas Sambanis. (2006). Making War and BuildingPeace, Princeton: Princeton University Press.
[19] Easterly, William, Roberta Gatti and Sergio Kurlat. (2006). "Development,democracy, and mass killings", Journal of Economic Growth 11: 129-56.
[20] Eck, Kristine, and Lisa Hultman. (2007). "One-Sided Violence AgainstCivilians in War: Insights from New Fatality Data", Journal of Peace Re-search 44: 233-46.
[21] Esteban, Joan and Debraj Ray. (2010). "A Model of Ethnic Con�ict", Jour-nal of the European Economic Association, forthcoming.
[22] Gleditsch, Kristian and Michael Ward. (2007). "Expanded War Data",Dataset, http://privatewww.essex.ac.uk/~ksg/expwar.html.
[23] Har¤, Barbara. (2003). "No Lessons Learned from the Holocaust? Assess-ing Risks of Genocide and Political Mass Murder since 1955", AmericanPolitical Science Review 97: 57-73.
[24] Heger, Lindsay, and Idean Salehyan. (2007). "Ruthless Rulers: CoalitionSize and the Severity of Civil Con�ict", International Studies Quarterly 51:385-403.
[25] Hultman, Lisa. (2009). "Uncivil Warfare in Civil War", mimeo, SwedishNational Defence College and Uppsala University.
[26] Humphreys, Macartan, and JeremyWeinstein. (2006). "Handling and Man-handling Civilians in Civil War", American Political Science Review 100:429-47.
[27] Jackson, Matthew O. and Massimo Morelli (2009): "Reasons for War: anUpdated Survey." in Chris Coyne, (ed), Handbook on the Political Economyof War, Cheltenham UK: Elgar Publishing, forthcoming.
[28] Kalyvas, Stathis. (2007). The Logic of Violence in Civil War. Cambridge:Cambridge University Press.
[29] Krain, Matthew. (1997). "State-Sponsored Mass Murder: The Onset andSeverity of Genocides and Politicides", Journal of Con�ict Resolution 41:331-60.
44

[30] Krain, Matthew. (2005). "International Intervention and the Severity ofGenocides and Politicides", International Studies Quarterly 49: 363-387.
[31] Lujala, Paivi, Jan Ketil Rod and Nadja Thieme. (2007). "Fighting over Oil:Introducing a New Dataset", Con�ict Management and Peace Science 24:239-56.
[32] Mann, Michael. (2005). The Dark Side of Democracy. Explaining EthnicCleansing. Cambridge: Cambridge University Press.
[33] Minorities at Risk. (2009). Dataset, www.cidcm.umd.edu/mar.
[34] Montalvo, Jose, and Marta Reynol-Querol. (2008). "Discrete Polarisationwith an Application to the Determinants of Genocides", Economic Journal118: 1835-65.
[35] Moore, Will, and Stephen Shellman. (2004). "Fear of Persecution: ForcedMigration, 1952-1995", Journal of Con�ict Resolution 40: 723-45.
[36] Nafziger, E. Wayne and Juha Auvinen. (2002). "Economic Development,Inequality, War, and State Violence", World Development 30: 153�63.
[37] Political Instability Task Force. (2010). "Genocides", Dataset,http://globalpolicy.gmu.edu/pitf/.
[38] Polity IV. (2009). "Political Regime Characteristics and Transitions, 1800-2007", Dataset, www.systemicpeace.org/polity4.
[39] Querido, Chyanda. (2009). "State-Sponsored Mass Killing in African Wars -Greed or Grievance?", International Advances in Economic Research, pub-lished online.
[40] Reynal-Querol, Marta. (2009). "Data on Ethnic Polarization and Fraction-alization", Dataset, http://www.econ.upf.edu/~reynal/data_web.htm.
[41] Ross, Michael. (2006). "A Closer Look at Oil, Diamonds, and Civil War",Annual Review of Political Science 9: 265-300.
[42] Rummel, Rudolph. (1994). "Power, Genocide and Mass Murder", Journalof Peace Research 31: 1-10.
[43] Rummel, Rudolph. (1995). "Democracy, Power, Genocide, and Mass Mur-der", Journal of Con�ict Resolution 39: 3-26.
[44] Schmeidl, Susanne. (1997). "Exploring the Causes of Forced Migration:A Pooled Time-Series Analysis, 1971-1990", Social Science Quarterly 78:284-308.
[45] Scully, Gerald. (1997). "Democide and genocide as rent-seeking activities",Public Choice 93: 77-97.
45
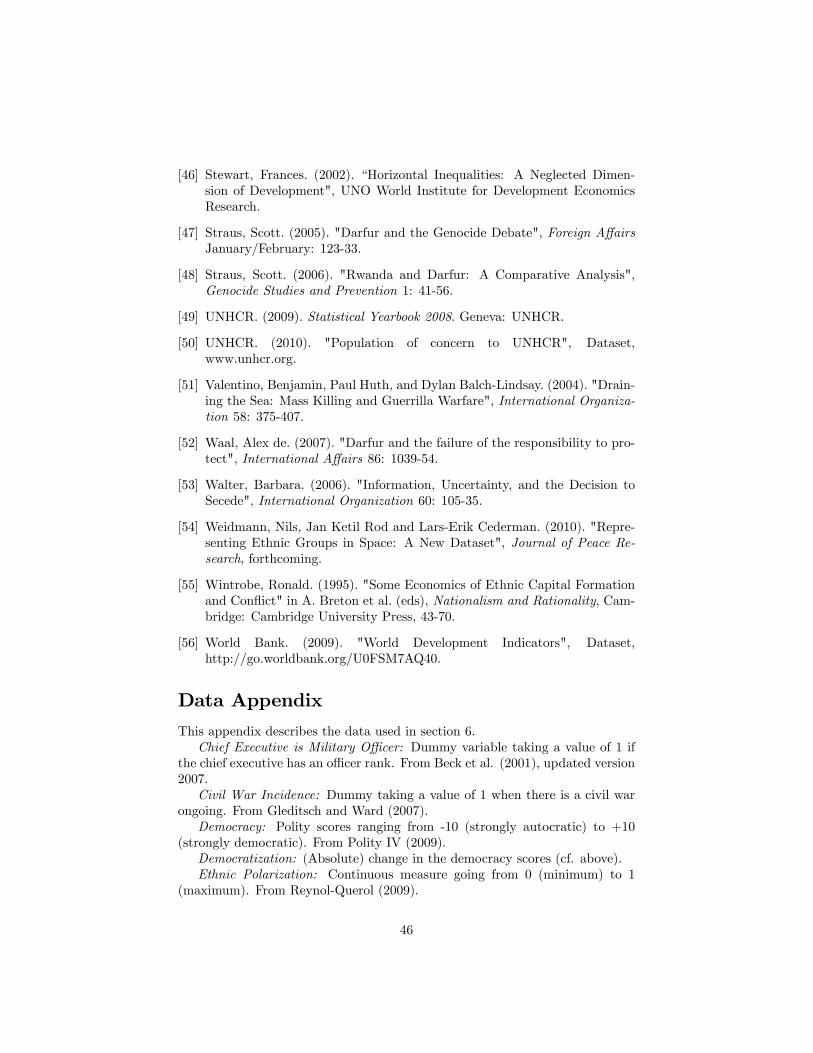
[46] Stewart, Frances. (2002). �Horizontal Inequalities: A Neglected Dimen-sion of Development", UNO World Institute for Development EconomicsResearch.
[47] Straus, Scott. (2005). "Darfur and the Genocide Debate", Foreign A¤airsJanuary/February: 123-33.
[48] Straus, Scott. (2006). "Rwanda and Darfur: A Comparative Analysis",Genocide Studies and Prevention 1: 41-56.
[49] UNHCR. (2009). Statistical Yearbook 2008. Geneva: UNHCR.
[50] UNHCR. (2010). "Population of concern to UNHCR", Dataset,www.unhcr.org.
[51] Valentino, Benjamin, Paul Huth, and Dylan Balch-Lindsay. (2004). "Drain-ing the Sea: Mass Killing and Guerrilla Warfare", International Organiza-tion 58: 375-407.
[52] Waal, Alex de. (2007). "Darfur and the failure of the responsibility to pro-tect", International A¤airs 86: 1039-54.
[53] Walter, Barbara. (2006). "Information, Uncertainty, and the Decision toSecede", International Organization 60: 105-35.
[54] Weidmann, Nils, Jan Ketil Rod and Lars-Erik Cederman. (2010). "Repre-senting Ethnic Groups in Space: A New Dataset", Journal of Peace Re-search, forthcoming.
[55] Wintrobe, Ronald. (1995). "Some Economics of Ethnic Capital Formationand Con�ict" in A. Breton et al. (eds), Nationalism and Rationality, Cam-bridge: Cambridge University Press, 43-70.
[56] World Bank. (2009). "World Development Indicators", Dataset,http://go.worldbank.org/U0FSM7AQ40.
Data Appendix
This appendix describes the data used in section 6.Chief Executive is Military O¢ cer: Dummy variable taking a value of 1 if
the chief executive has an o¢ cer rank. From Beck et al. (2001), updated version2007.Civil War Incidence: Dummy taking a value of 1 when there is a civil war
ongoing. From Gleditsch and Ward (2007).Democracy: Polity scores ranging from -10 (strongly autocratic) to +10
(strongly democratic). From Polity IV (2009).Democratization: (Absolute) change in the democracy scores (cf. above).Ethnic Polarization: Continuous measure going from 0 (minimum) to 1
(maximum). From Reynol-Querol (2009).
46
GDP per Capita: At constant 2000 US$. From World Bank (2009).Group di¤erent language: Dummy taking a value of 1 if an ethnic group
speaks another language than the dominant group(s) in society. From Minoritiesat Risk (2009) (coded as 1 if their variable Lang takes values of 2 or 3).Group di¤erent race: Dummy taking a value of 1 if an ethnic group is of
another race than the dominant group(s) in society. From Minorities at Risk(2009) (coded as 1 if their variable Race takes values of 2 or 3).Group di¤erent religion: Dummy taking a value of 1 if an ethnic group has
a di¤erent religion than the dominant group(s) in society. From Minorities atRisk (2009) (coded as 1 if their variable Belief takes values of 2 or 3).Group has (strong) regional homeland: Dummy recoded from the gc2 vari-
able from Minorities at Risk (2009).Group autonomy grievances index: Variable Autlost from Minorities at Risk
(2009). High values correspond to large grievances.Group economic di¤erential index: Variable Ecdifxx from Minorities at Risk
(2009). High values correspond to ethnic minority groups that are economicallyless productive with respect to the country average.Group population as % of country population: From Walter (2006).Massacres (in Table 3): Military massacres of suspected rebel supporters (on
the group level). From Minorities at Risk (2009), variable Rep22. In column (2)of Table 3 coded as dummy, taking a value of 1 when Rep22 equals 1 or more.Mass Killings (in Tables 1 and 2): Dummy variable taking a value of 1 when
mass killings are reported. From Political Instability Task Force (2010).Mountainous Terrain: Percentage of territory covered by mountains. From
Collier et al. (2009).Oil Production: In million tones. From British Petroleum (2009).Oil Reserves: Proved reserves in thousand million barrels. From British
Petroleum (2009).Party Age: Average age of the main government and opposition parties.
From Beck et al. (2001), updated version 2007.Percentage of group territory covered with oil and gas: As explained in the
main text.Percentage of group territory covered with oil: As explained in the main
text.Population: From World Bank (2009).Population Density: From World Bank (2009).Refugees (in Tables 1 and 2): Total number of refugees by country of origin.
From UNHCR (2010).Resettlements (in Table 3): Forced resettlements (on the group level). From
Minorities at Risk (2009), variable Rep12. In column (5) of Table 3 coded asdummy, taking a value of 1 when Rep12 equals 1 or more.Trade over GDP: Total value of trade divided by total GDP. From World
Bank (2009).
47