structural change and new zealand’s productivity performance · structural change and new...
TRANSCRIPT

Structural change and New Zealand’s productivity performance Working Paper 2014/4
June 2014
Author: Lisa Meehan

New Zealand Productivity Commission Working Paper 2014/4: Structural change and New Zealand’s productivity performance Date: June 2014
Author: Lisa Meehan
JEL classification: L16; O46; O57; O56 JEL keywords: Industry Mix; Macroeconomic Industrial Structure; Productivity; New Zealand; Comparative Country Studies.
ISBN: 978-0-478-44000-3 (online only)
Acknowledgements: Thanks to New Zealand Productivity Commission staff who provided useful comments and suggestions, particularly Paul Conway (Director – Economics & Research) and the Services Inquiry team led by Geoff Lewis. Also thanks to staff of the New Zealand Treasury, Ministry of Business, Innovation & Employment and Statistics New Zealand who inputted into this analysis, including Roger Proctor, John Janssen and Adam Tipper. I am grateful to Statistics New Zealand for assistance with the New Zealand data.
Disclaimer: The views expressed in this Working Paper are strictly those of the author. They do not necessarily reflect the views of the New Zealand Productivity Commission or the New Zealand Government. The author is solely responsible for any errors or omissions.
Information on the Productivity Commission can be found on www.productivity.govt.nz or by contacting +64 4 903 5150.

Structural change and New Zealand’s productivity performance 3
Abstract Shift-share analysis decomposes aggregate labour productivity growth into a contribution from within-industry productivity growth and a contribution from employment movements across industries with differing labour productivity levels. Because the role that structural change plays in productivity growth differs with the level of a country’s economic development, this paper focuses on New Zealand in comparison with other OECD countries.
New Zealand’s economy-wide labour productivity growth has been lower than most other OECD countries. As in all other OECD countries examined in this paper, the majority of New Zealand’s labour productivity growth since the early 1990s has come from within-industry productivity growth. Like most other OECD countries, New Zealand has experienced productivity-detracting structural change with employment moving towards industries with below-average levels of labour productivity. In aggregate, New Zealand’s poor labour productivity growth compared with other OECD countries reflects both below-average performance of its within-industry productivity growth and a larger employment shifting towards low-productivity industries. Although the structural change component is a relatively smaller part of overall labour productivity growth, New Zealand’s structural change effect was further behind the OECD average structural change effect than its within-industry productivity growth.
New Zealand’s comparatively large negative structural change was due to small differences in employment share changes and relative labour productivity levels in a few industries. Industries that were undergoing significant reforms during the 1990s were the main culprits, with larger employment movements away from high labour productivity industries such as electricity, gas & water and transport, storage & communications in New Zealand than other OECD countries.
These differences highlight some of the limitations of shift-share analysis that may be particularly acute during times of reform. For example, the assumption that the average and marginal productivity in an industry are equivalent may result in an overestimation of the negative contribution of structural change.
As a small open economy, New Zealand could, in principle, increase output in high-productivity industries through exporting. In practice, New Zealand’s propensity to export is low compared with other small, open economies and this export-led employment shift has not occurred.
The shift-share analysis presented in this paper is a first step in understanding the role of resource reallocation in productivity growth in New Zealand. In interpreting the results of this paper it is important to note that shift-share analysis is a descriptive tool to look at high-level structural change. Taken in isolation, it does not provide information on the drivers and dynamics of resource reallocation, nor does it necessarily indicate the mis-allocation of resources. Firm-level data offers the opportunity to explore these issues further.
Contents Abstract .......................................................................................................................................... 3
Contents ......................................................................................................................................... 4
1 Introduction ........................................................................................................................... 6
2 Methodology and data .......................................................................................................... 7 2.1 International comparisons ...................................................................................................... 7 2.2 Detailed New Zealand analysis .............................................................................................. 8
3 International comparisons .................................................................................................... 10 3.1 Structural transformation and productivity growth .............................................................. 10 3.2 Shift-share analysis: international comparisons .................................................................... 11
4 A closer look at New Zealand .............................................................................................. 21 4.1 Shift-share in detail ............................................................................................................... 21
5 Discussion ............................................................................................................................ 24 5.1 Interpretation and the role of reform ................................................................................... 24 5.2 Increasing output in high-productivity industries through exporting .................................. 27
6 Conclusion ........................................................................................................................... 29
References .................................................................................................................................... 31
Appendix A Shift-share methodology in detail ..................................................................... 34
Appendix B Estimating hours paid for New Zealand ............................................................ 36
Appendix C Statistics New Zealand indexes versus calculated growth rates ........................ 38 Tables
Table 1 Summary of industry contribution to structural change level and growth effects for detailed New Zealand analysis ............................................................................................... 9
Figures
Figure 1 Labour productivity growth shift-share decomposition, OECD countries, 1990-2005 ....... 12 Figure 2 Shift-share decomposition as a share of labour productivity growth, OECD countries,
1990-2005 ............................................................................................................................. 12 Figure 3 Economy-wide labour productivity growth versus the structural change effect, 1990-
2005 ...................................................................................................................................... 13 Figure 4 Initial industry employment shares: New Zealand versus OECD average, 1990 ................ 14 Figure 5 Industry labour productivity growth rates: New Zealand versus OECD average,
1990-2005 ............................................................................................................................. 15 Figure 6 Industry contributions to the within-industry effect: New Zealand versus OECD
average, 1990-2005 .............................................................................................................. 15 Figure 7 Industry contributions to the structural change effect: New Zealand versus OECD
average, 1990-2005 .............................................................................................................. 16 Figure 8 Industry productivity and change in employment share: New Zealand versus OECD
average, 1990-2005 .............................................................................................................. 17 Figure 9 Average industry employment shares for country groups, 1990 ......................................... 19 Figure 10 Agricultural productivity relative to manufacturing productivity by country, 1990 ............. 19 Figure 11 Change in economy-wide labour productivity if a country had average OECD
employment structure, 1990 ................................................................................................ 20 Figure 12 Shift-share decomposition of labour productivity growth: Asia and Latin American
countries, 1990-2005 ............................................................................................................ 21

Structural change and New Zealand’s productivity performance 5
Figure 13 Shift-share decomposition of labour productivity growth over productivity cycles, 1978-2011 ............................................................................................................................. 22
Figure 14 Industry contributions to labour productivity growth between 1978 and 2011 .................. 23 Figure 15 Industry contributions to labour productivity growth over productivity cycles in the
1990s and 2000s ................................................................................................................... 24 Figure 16 Hours paid and labour productivity growth in selected industries ...................................... 25 Figure 17 Growth in employment (hours) in OECD countries, 1990-2005 .......................................... 26 Figure 18 Average labour productivity and capital share of income, 2010 ......................................... 27 Figure 19 Industry productivity and change in employment share: Australia, 1990-2005 .................. 28

1 Introduction The Terms of Reference for the New Zealand Productivity Commission’s inquiry into Boosting Services Sector Productivity asks for analysis on “… the extent to which employment has shifted from high to low productivity sectors”.1 To address this Terms of Reference item, this paper uses shift-share analysis to decompose labour productivity growth into contributions from within-industry productivity growth and structural change.
The concern over the movement of employment towards low-productivity industries stems from recent literature highlighting the importance of structural change in driving productivity growth in developing countries. In particular, McMillan & Rodrik (2011) finds that differences in structural change have been more important than within-industry productivity growth in explaining differences in the labour productivity performance of Asian and Latin American countries. Asian countries have generally experienced productivity-enhancing structural change as employment has moved from low- to high-productivity industries while employment has moved towards low-productivity industries in Latin American countries.
A country’s stage of economic development matters for the role of structural change in productivity growth. Developing countries generally have greater potential for productivity-enhancing structural change as employment moves from low-productivity agriculture to higher-productivity industries, particularly manufacturing. The role of structural change in productivity growth is less clear in developed countries where employment tends to move from agriculture and manufacturing industries to service industries, including low-productivity community and personal services (discussed in Section 3.1). While much of the international literature concentrates on developing countries, this paper focuses on New Zealand in comparison with other OECD countries.
New Zealand’s economy-wide labour productivity growth has been lower than most other OECD countries, with its growth between 1990 and 2005 ranking 14th out of the 20 OECD countries examined in this paper. The majority of labour productivity growth in New Zealand, as in all the other OECD countries included in the analysis, came from within-industry productivity growth. Like most other OECD countries, New Zealand experienced productivity-detracting structural change with employment moving towards industries with below-average levels of labour productivity. New Zealand’s comparatively poor labour productivity growth reflects a below-average performance of its within-industry productivity growth and a larger employment shift towards low-productivity industries. Although the structural change component was a smaller part of overall labour productivity growth, New Zealand’s structural change effect was further behind the OECD average than its within-industry growth (Section 3.2).
A closer look at the industry contributions to New Zealand’s comparatively large negative structural change effect shows it was due to small differences in employment share changes and relative labour productivity levels in a few industries. Industries that were undergoing significant reforms during the 1990s were the main culprits, with larger employment movements away from high labour productivity industries such as electricity, gas & water and transport, storage & communications in New Zealand than other OECD countries (Section 3.2). A more detailed look at New Zealand confirms the negative contributions to the structural change effect of these reforming industries (Section 4).
These differences highlight some of the limitations of shift-share analysis that may be particularly acute during times of reform (Section 5.1). For example, the assumption that average and marginal productivity of an industry are equivalent may result in an overestimation of within-industry productivity growth component and an overestimation of the negative contribution of structural change (Timmer & Szirmai, 2000).
1 The full Terms of Reference and Inquiry reports are available from www.productivity.govt.nz.
Structural change and New Zealand’s productivity performance 7
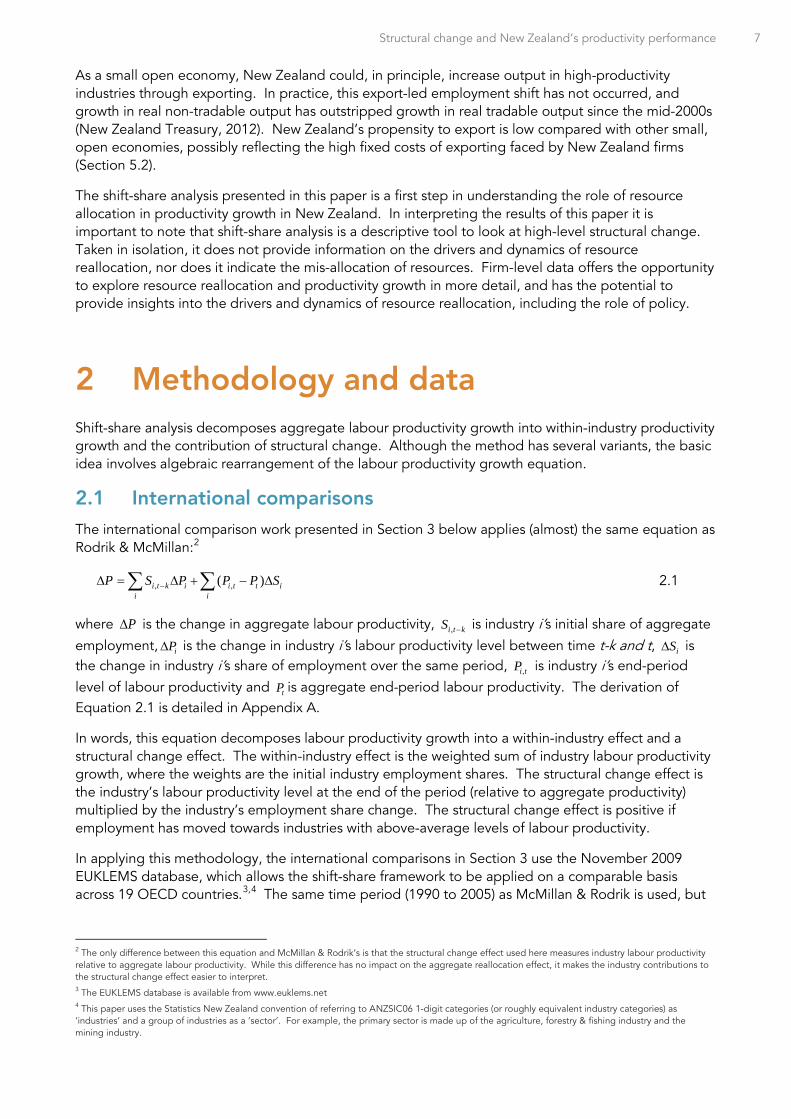
As a small open economy, New Zealand could, in principle, increase output in high-productivity industries through exporting. In practice, this export-led employment shift has not occurred, and growth in real non-tradable output has outstripped growth in real tradable output since the mid-2000s (New Zealand Treasury, 2012). New Zealand’s propensity to export is low compared with other small, open economies, possibly reflecting the high fixed costs of exporting faced by New Zealand firms (Section 5.2).
The shift-share analysis presented in this paper is a first step in understanding the role of resource allocation in productivity growth in New Zealand. In interpreting the results of this paper it is important to note that shift-share analysis is a descriptive tool to look at high-level structural change. Taken in isolation, it does not provide information on the drivers and dynamics of resource reallocation, nor does it indicate the mis-allocation of resources. Firm-level data offers the opportunity to explore resource reallocation and productivity growth in more detail, and has the potential to provide insights into the drivers and dynamics of resource reallocation, including the role of policy.
2 Methodology and data Shift-share analysis decomposes aggregate labour productivity growth into within-industry productivity growth and the contribution of structural change. Although the method has several variants, the basic idea involves algebraic rearrangement of the labour productivity growth equation.
2.1 International comparisons The international comparison work presented in Section 3 below applies (almost) the same equation as Rodrik & McMillan:2
, ,( )i t k i i t t ii i
P S P P P S−∆ = ∆ + − ∆∑ ∑ 2.1
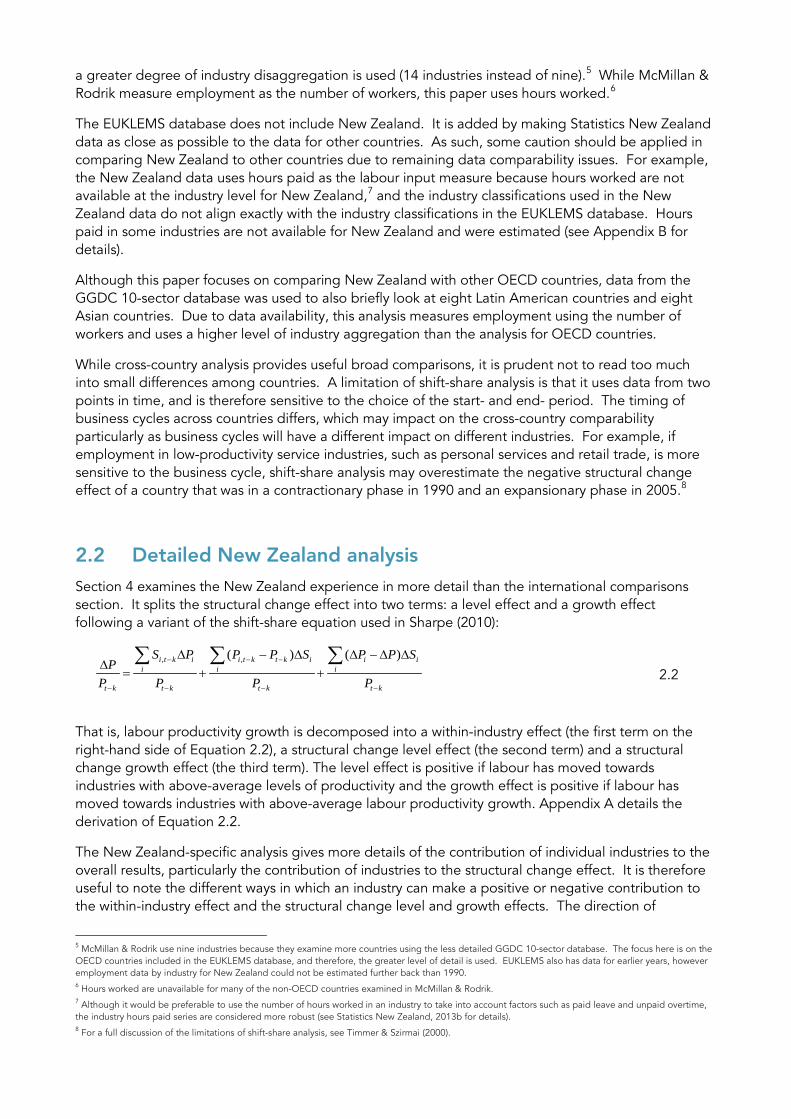
where P∆ is the change in aggregate labour productivity, ,i t kS − is industry i’s initial share of aggregate
employment, iP∆ is the change in industry i’s labour productivity level between time t-k and t, iS∆ is the change in industry i’s share of employment over the same period, ,i tP is industry i’s end-period
level of labour productivity and tP is aggregate end-period labour productivity. The derivation of Equation 2.1 is detailed in Appendix A.
In words, this equation decomposes labour productivity growth into a within-industry effect and a structural change effect. The within-industry effect is the weighted sum of industry labour productivity growth, where the weights are the initial industry employment shares. The structural change effect is the industry’s labour productivity level at the end of the period (relative to aggregate productivity) multiplied by the industry’s employment share change. The structural change effect is positive if employment has moved towards industries with above-average levels of labour productivity.
In applying this methodology, the international comparisons in Section 3 use the November 2009 EUKLEMS database, which allows the shift-share framework to be applied on a comparable basis across 19 OECD countries.3,4 The same time period (1990 to 2005) as McMillan & Rodrik is used, but
2 The only difference between this equation and McMillan & Rodrik’s is that the structural change effect used here measures industry labour productivity relative to aggregate labour productivity. While this difference has no impact on the aggregate reallocation effect, it makes the industry contributions to the structural change effect easier to interpret. 3 The EUKLEMS database is available from www.euklems.net 4 This paper uses the Statistics New Zealand convention of referring to ANZSIC06 1-digit categories (or roughly equivalent industry categories) as ‘industries’ and a group of industries as a ‘sector’. For example, the primary sector is made up of the agriculture, forestry & fishing industry and the mining industry.
a greater degree of industry disaggregation is used (14 industries instead of nine).5 While McMillan & Rodrik measure employment as the number of workers, this paper uses hours worked.6
The EUKLEMS database does not include New Zealand. It is added by making Statistics New Zealand data as close as possible to the data for other countries. As such, some caution should be applied in comparing New Zealand to other countries due to remaining data comparability issues. For example, the New Zealand data uses hours paid as the labour input measure because hours worked are not available at the industry level for New Zealand,7 and the industry classifications used in the New Zealand data do not align exactly with the industry classifications in the EUKLEMS database. Hours paid in some industries are not available for New Zealand and were estimated (see Appendix B for details).
Although this paper focuses on comparing New Zealand with other OECD countries, data from the GGDC 10-sector database was used to also briefly look at eight Latin American countries and eight Asian countries. Due to data availability, this analysis measures employment using the number of workers and uses a higher level of industry aggregation than the analysis for OECD countries.
While cross-country analysis provides useful broad comparisons, it is prudent not to read too much into small differences among countries. A limitation of shift-share analysis is that it uses data from two points in time, and is therefore sensitive to the choice of the start- and end- period. The timing of business cycles across countries differs, which may impact on the cross-country comparability particularly as business cycles will have a different impact on different industries. For example, if employment in low-productivity service industries, such as personal services and retail trade, is more sensitive to the business cycle, shift-share analysis may overestimate the negative structural change effect of a country that was in a contractionary phase in 1990 and an expansionary phase in 2005.8
2.2 Detailed New Zealand analysis Section 4 examines the New Zealand experience in more detail than the international comparisons section. It splits the structural change effect into two terms: a level effect and a growth effect following a variant of the shift-share equation used in Sharpe (2010):
, ,( ) ( )i t k i i t k t k i i i
i i i
t k t k t k t k
S P P P S P P SP
P P P P
− − −
− − − −
∆ − ∆ ∆ −∆ ∆∆
= + +∑ ∑ ∑
2.2
That is, labour productivity growth is decomposed into a within-industry effect (the first term on the right-hand side of Equation 2.2), a structural change level effect (the second term) and a structural change growth effect (the third term). The level effect is positive if labour has moved towards industries with above-average levels of productivity and the growth effect is positive if labour has moved towards industries with above-average labour productivity growth. Appendix A details the derivation of Equation 2.2.
The New Zealand-specific analysis gives more details of the contribution of individual industries to the overall results, particularly the contribution of industries to the structural change effect. It is therefore useful to note the different ways in which an industry can make a positive or negative contribution to the within-industry effect and the structural change level and growth effects. The direction of
5 McMillan & Rodrik use nine industries because they examine more countries using the less detailed GGDC 10-sector database. The focus here is on the OECD countries included in the EUKLEMS database, and therefore, the greater level of detail is used. EUKLEMS also has data for earlier years, however employment data by industry for New Zealand could not be estimated further back than 1990. 6 Hours worked are unavailable for many of the non-OECD countries examined in McMillan & Rodrik. 7 Although it would be preferable to use the number of hours worked in an industry to take into account factors such as paid leave and unpaid overtime, the industry hours paid series are considered more robust (see Statistics New Zealand, 2013b for details). 8 For a full discussion of the limitations of shift-share analysis, see Timmer & Szirmai (2000).
Structural change and New Zealand’s productivity performance 9
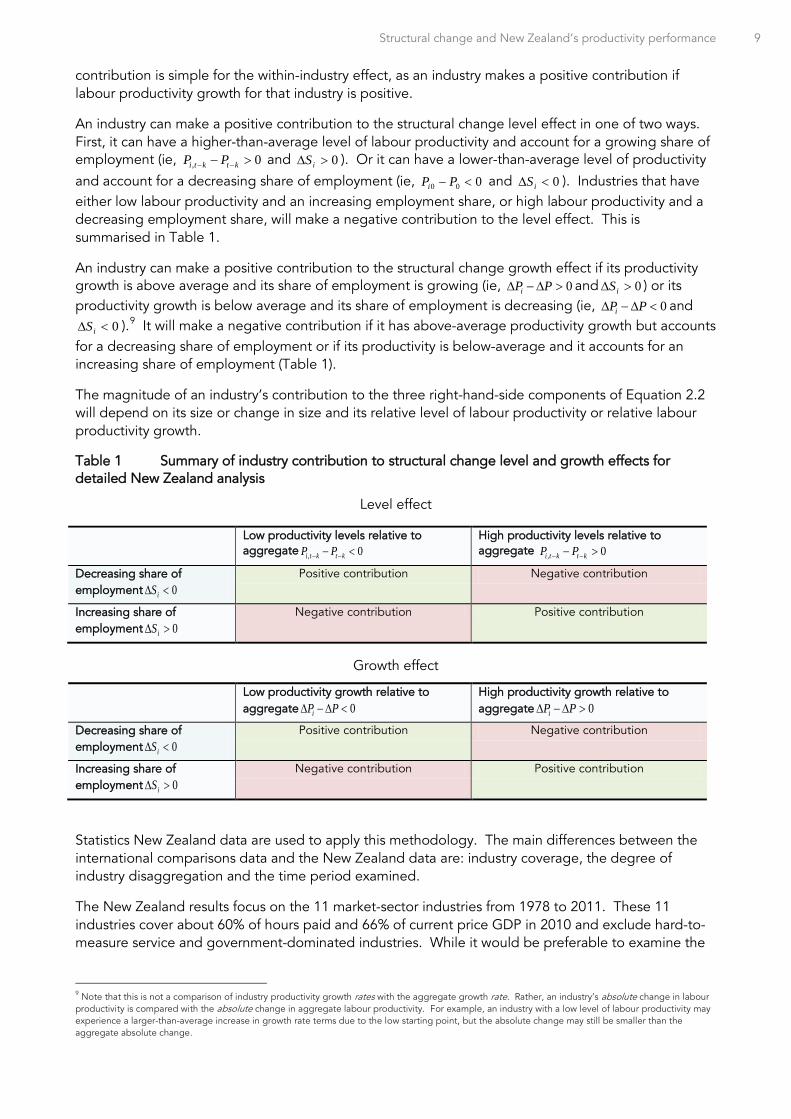
contribution is simple for the within-industry effect, as an industry makes a positive contribution if labour productivity growth for that industry is positive.
An industry can make a positive contribution to the structural change level effect in one of two ways. First, it can have a higher-than-average level of labour productivity and account for a growing share of employment (ie, , 0i t k t kP P− −− > and 0>∆ iS ). Or it can have a lower-than-average level of productivity
and account for a decreasing share of employment (ie, 000 <− PPi and 0<∆ iS ). Industries that have either low labour productivity and an increasing employment share, or high labour productivity and a decreasing employment share, will make a negative contribution to the level effect. This is summarised in Table 1.
An industry can make a positive contribution to the structural change growth effect if its productivity growth is above average and its share of employment is growing (ie, 0iP P∆ −∆ > and 0>∆ iS ) or its productivity growth is below average and its share of employment is decreasing (ie, 0iP P∆ −∆ < and
0<∆ iS ).9 It will make a negative contribution if it has above-average productivity growth but accounts for a decreasing share of employment or if its productivity is below-average and it accounts for an increasing share of employment (Table 1).
The magnitude of an industry’s contribution to the three right-hand-side components of Equation 2.2 will depend on its size or change in size and its relative level of labour productivity or relative labour productivity growth.
Table 1 Summary of industry contribution to structural change level and growth effects for detailed New Zealand analysis
Level effect
Low productivity levels relative to aggregate , 0i t k t kP P− −− <
High productivity levels relative to aggregate , 0i t k t kP P− −− >
Decreasing share of employment 0<∆ iS
Positive contribution Negative contribution
Increasing share of employment 0>∆ iS
Negative contribution Positive contribution
Growth effect
Low productivity growth relative to aggregate 0iP P∆ −∆ <
High productivity growth relative to aggregate 0iP P∆ −∆ >
Decreasing share of employment 0<∆ iS
Positive contribution Negative contribution
Increasing share of employment 0>∆ iS
Negative contribution Positive contribution
Statistics New Zealand data are used to apply this methodology. The main differences between the international comparisons data and the New Zealand data are: industry coverage, the degree of industry disaggregation and the time period examined.
The New Zealand results focus on the 11 market-sector industries from 1978 to 2011. These 11 industries cover about 60% of hours paid and 66% of current price GDP in 2010 and exclude hard-to-measure service and government-dominated industries. While it would be preferable to examine the
9 Note that this is not a comparison of industry productivity growth rates with the aggregate growth rate. Rather, an industry’s absolute change in labour productivity is compared with the absolute change in aggregate labour productivity. For example, an industry with a low level of labour productivity may experience a larger-than-average increase in growth rate terms due to the low starting point, but the absolute change may still be smaller than the aggregate absolute change.
whole economy, the choice of 11 industries is a trade-off favouring the longer time coverage and robustness of the 11-industry-market-sector series over fuller coverage of economic activity.
The industries used in the New Zealand section are more narrowly defined than those used in the international section. The analysis, however, still involves a high degree of industry aggregation. For example, manufacturing is not disaggregated into sub-industries. This high degree of aggregation may lead to an underestimation of the impact of structural change as it does not capture, for example, the movement of employment from low-productivity manufacturing sub-industries to high-productivity ones. While Statistics New Zealand does not release more disaggregated labour volume series, a possible extension of this work could involve using the dataset of Mason (2013) which has manufacturing hours data disaggregated into nine sub-industries. Another possible and very worthwhile extension is the use of Statistics New Zealand’s Longitudinal Business Database to look at the contribution of employment reallocation at the firm level.10
The results in Section 4 are presented over the whole 1978 to 2011 period and over aggregate productivity growth cycles. Breaking the data into cycles better accounts for factors that tend to vary within a cycle, such as capacity utilisation (Statistics New Zealand, 2007). Aggregate productivity cycles are, however, unlikely to completely eliminate cyclical components as industry cycles may not match economy-wide cycles.11 There are six complete cycles over the 1978 to 2011 period: 1978 to 1982, 1982 to 1985, 1985 to 1990, 1990 to 1997, 1997 to 2000 and 2000 to 2008. The latest period, 2008 to 2011, is an incomplete cycle.
3 International comparisons
3.1 Structural transformation and productivity growth This paper focuses on New Zealand in comparison with other OECD countries. As important background, however, this sub-section outlines the general path of structural transformation and highlights the different role structural change plays in the productivity growth of developing versus developed countries.
The general path of economic development involves resources moving from agriculture, to manufacturing, and then to service industries. In the early stages of economic development, agriculture employs the majority of workers. As the economy industrialises, employment in agriculture decreases and employment shifts towards manufacturing. In later stages of development, employment shifts from agriculture and manufacturing industries to the services sector (Kruger, 2008).
Most recent literature on structural change and its role in productivity growth focuses on developing countries, reflecting the greater scope for productivity-enhancing structural change in these countries.12 Generally, a developing country not only has a larger share of employment in agriculture, but its labour productivity in agriculture is considerably lower than in developed countries (both in absolute terms and relative to the productivity of a country’s other industries). As an economy develops, excess labour moves from agriculture to higher-productivity industries, such as manufacturing, resulting in productivity-enhancing structural change.
McMillan & Rodrik (2011) highlights the importance of structural change to productivity growth in developing countries. Since 1990, developing Asian countries have generally experienced productivity-enhancing structural change, with employment moving from low-productivity agriculture
10 The Productivity Hub plans on doing this firm-level work as part of its forward-looking research agenda. See Nolan (2014) details. 11 Industry productivity cycles have not been calculated for New Zealand. Australian research suggests some industry cycles, such as agriculture, may differ from the aggregate productivity cycle (Barnes, 2011). 12 For example, McMillan & Rodrik (2011), Timmer & Szirmai (2000) and de Vries, Erumban, Timmer, Voskoboynikov, & Wu (2012).
Structural change and New Zealand’s productivity performance 11
to higher-productivity industries such as manufacturing. Employment in Latin American countries, in contrast, has moved away from manufacturing and towards lower-productivity service industries. McMillan & Rodrik suggest that the strong labour productivity growth in Asian countries versus the relatively weaker growth in Latin American countries is due not to differences in within-industry productivity growth, but to differences in the productivity impact of structural change (see Box 1 for a discussion of structural change in Asian and Latin American countries).
The potential contribution of structural change to productivity growth in developed countries is less clear. Developed countries do not tend to have large agricultural industries with excess labour. In addition, the variation in labour productivity across industries tends to be lower than in developing countries. These factors leave less scope for productivity-enhancing structural change (at least in terms of resource allocation at the industry level).13
While developing countries generally improve productivity through industrialisation, other forces may be important in developed countries. The share of employment in services in post-industrialised economies has been rising, including employment in low-productivity labour-intensive services such as accommodation, restaurants and recreational services. This increase in employment in low-productivity services may reflect a combination of Baumol’s disease and an increase in demand for these services. Baumol’s disease means that labour-intensive service industries will account for an increasing share of employment as the potential for productivity growth in these industries is low compared with other industries (Baumol & Bowen, 1966). At the same time, the demand for the output of these labour-intensive service industries tends to rise as incomes rise (Dennis & İşcan, 2009). Indeed, the lack of consideration of the demand-side factors behind resource movements is a limitation of shift-share analysis that flows from its use of productivity, which is a supply-side concept (see Australian Productivity Commission, 2013 for a discussion).
The differences in initial economic development and industry structure and the amount of variation in industry labour productivity levels between developing and developed countries is borne out in the data (see Box 1). Since the stage of a country’s economic development matters for the role of structural change in productivity growth, the next sub-section focuses on comparing New Zealand with other OECD countries.
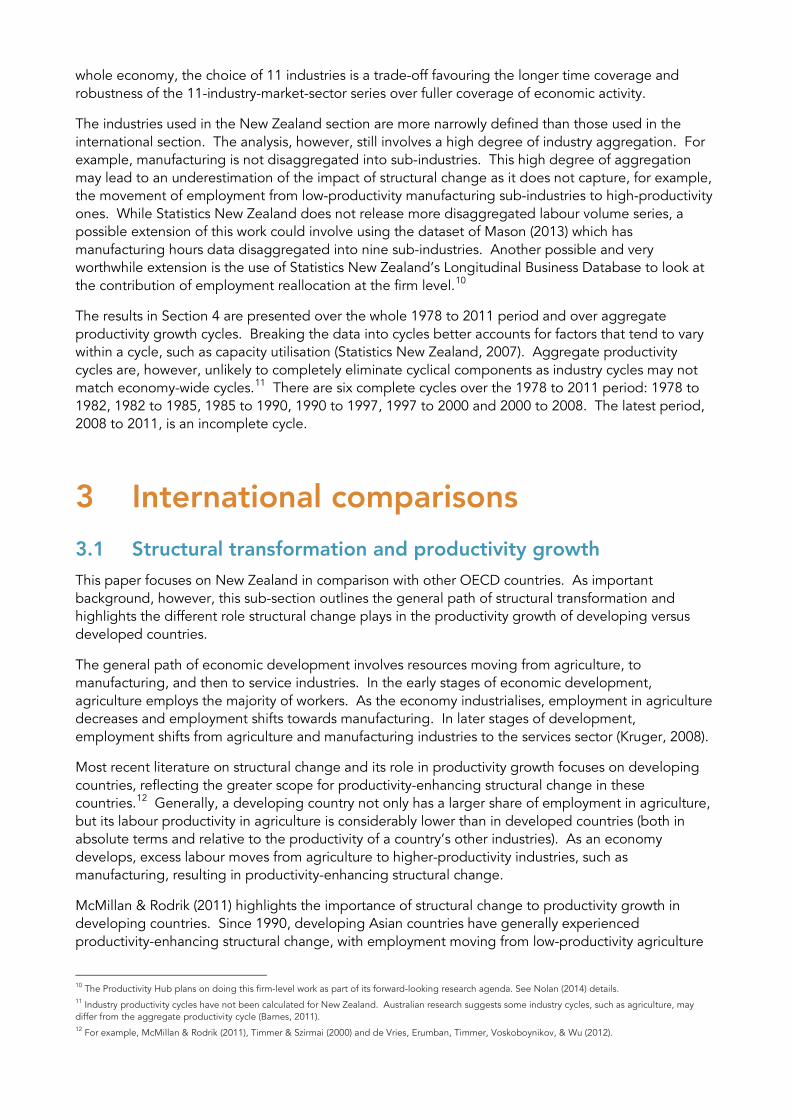
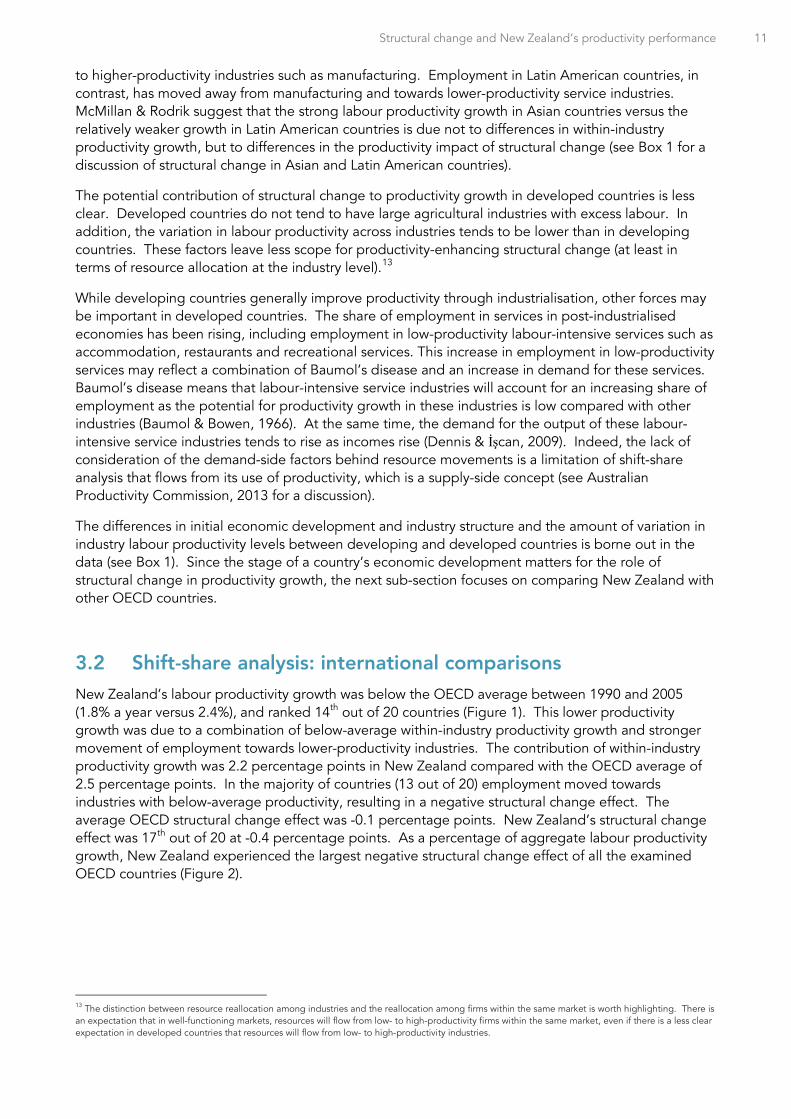
3.2 Shift-share analysis: international comparisons New Zealand’s labour productivity growth was below the OECD average between 1990 and 2005 (1.8% a year versus 2.4%), and ranked 14th out of 20 countries (Figure 1). This lower productivity growth was due to a combination of below-average within-industry productivity growth and stronger movement of employment towards lower-productivity industries. The contribution of within-industry productivity growth was 2.2 percentage points in New Zealand compared with the OECD average of 2.5 percentage points. In the majority of countries (13 out of 20) employment moved towards industries with below-average productivity, resulting in a negative structural change effect. The average OECD structural change effect was -0.1 percentage points. New Zealand’s structural change effect was 17th out of 20 at -0.4 percentage points. As a percentage of aggregate labour productivity growth, New Zealand experienced the largest negative structural change effect of all the examined OECD countries (Figure 2).
13 The distinction between resource reallocation among industries and the reallocation among firms within the same market is worth highlighting. There is an expectation that in well-functioning markets, resources will flow from low- to high-productivity firms within the same market, even if there is a less clear expectation in developed countries that resources will flow from low- to high-productivity industries.
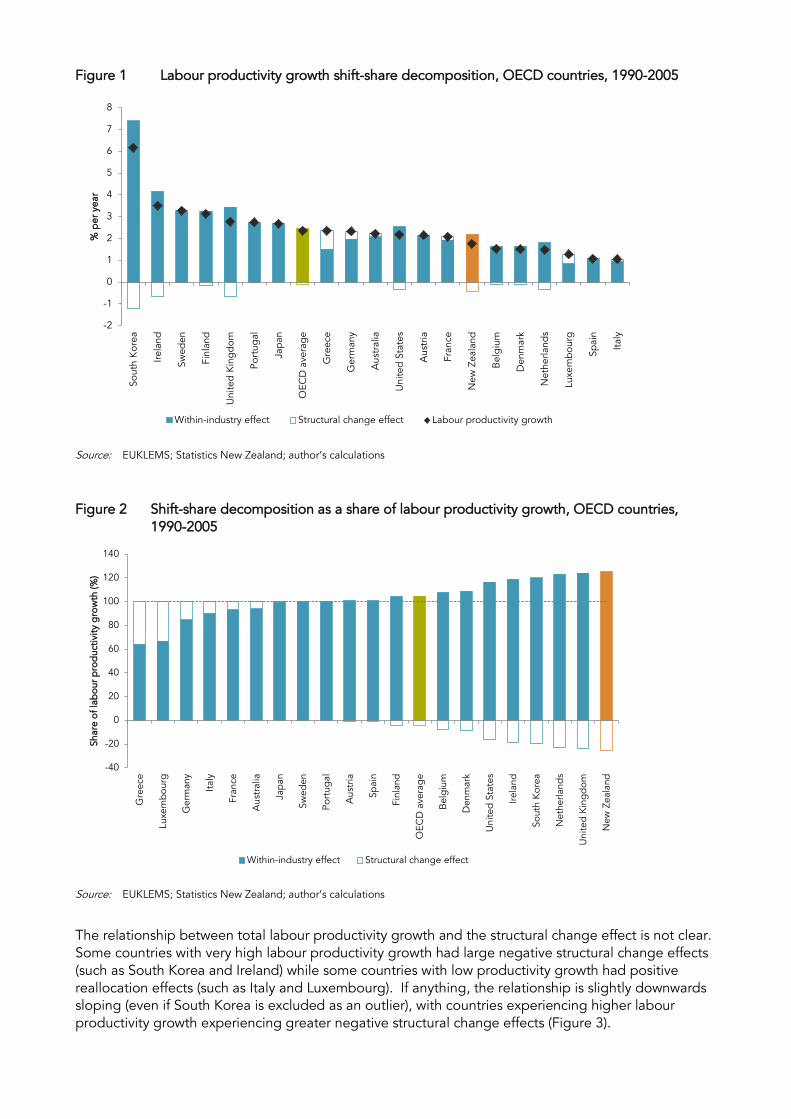
Figure 1 Labour productivity growth shift-share decomposition, OECD countries, 1990-2005
Source: EUKLEMS; Statistics New Zealand; author’s calculations
Figure 2 Shift-share decomposition as a share of labour productivity growth, OECD countries, 1990-2005
Source: EUKLEMS; Statistics New Zealand; author’s calculations
The relationship between total labour productivity growth and the structural change effect is not clear. Some countries with very high labour productivity growth had large negative structural change effects (such as South Korea and Ireland) while some countries with low productivity growth had positive reallocation effects (such as Italy and Luxembourg). If anything, the relationship is slightly downwards sloping (even if South Korea is excluded as an outlier), with countries experiencing higher labour productivity growth experiencing greater negative structural change effects (Figure 3).
-2
-1
0
1
2
3
4
5
6
7
8
Sout
h K
orea
Irela
nd
Swed
en
Finl
and
Uni
ted
Kin
gd
om
Port
ugal
Jap
an
OEC
D a
vera
ge
Gre
ece
Ger
man
y
Aus
tral
ia
Uni
ted
Stat
es
Aus
tria
Fran
ce
New
Zea
land
Bel
giu
m
Den
mar
k
Net
herla
nds
Luxe
mbo
urg
Spai
n
Italy
% p
er y
ear
Within-industry effect Structural change effect Labour productivity growth
-40
-20
0
20
40
60
80
100
120
140
Gre
ece
Luxe
mbo
urg
Ger
man
y
Italy
Fran
ce
Aus
tral
ia
Jap
an
Swed
en
Port
ugal
Aus
tria
Spai
n
Finl
and
OEC
D a
vera
ge
Bel
giu
m
Den
mar
k
Uni
ted
Stat
es
Irela
nd
Sout
h K
orea
Net
herla
nds
Uni
ted
Kin
gd
om
New
Zea
land
Shar
e of
lab
our p
rod
uctiv
ity g
row
th (%
)
Within-industry effect Structural change effect
Structural change and New Zealand’s productivity performance 13
Figure 3 Economy-wide labour productivity growth versus the structural change effect, 1990-2005
Source: EUKLEMS; Statistics New Zealand; author’s calculations
One issue with the preceding analysis is that it uses a high level of industry aggregation. For example, Ireland’s negative structural change effect may be because manufacturing is not split into sub-industries. If employment has shifted towards higher-productivity manufacturing sub-industries in Ireland, the current shift-share analysis would attribute this movement of employment to within-industry productivity growth in manufacturing rather than a positive contribution to the structural change effect (and this is likely to be one of the reasons behind Ireland’s very high within-industry effect for manufacturing).
Manufacturing is not the only point of interest in the Irish reallocation story. It had the largest employment share shift towards the low-productivity construction industry in the OECD, consistent with its property boom. Ireland’s construction employment share increased by 7.1 percentage points between 1990 and 2005. Arguably, this strong shift to construction due to the property boom was a key reason behind Ireland’s unsustainable growth and subsequent poor economic performance in the second half of the 2000s (OECD, 2011).
New Zealand’s employment shift towards construction was the fifth largest in the OECD (behind Ireland, Spain, Australia and Greece). While at 1.6 percentage points, New Zealand’s employment share increase in construction was much lower than Ireland’s, unsustainable growth driven by a property and domestic-consumption boom have also been raised as concerns for New Zealand (for example, see New Zealand Treasury, 2010). It is also possible that New Zealand’s coming construction boom will be larger than the boom of the early 2000s as residential housing growth in Auckland and the Canterbury rebuild drive unprecedented demand (Pacifecon (NZ) Ltd. & BRANZ, 2013).
It is difficult to say whether New Zealand’s structural change effect would be larger or smaller compared with other OECD countries if a greater level of industry disaggregation was used. The most disaggregated analysis involves firm-level information, and assessing the contribution of firm exit, entry, within-firm productivity growth and reallocation of resources across firms in the same industry is an important area of further research using Statistics New Zealand’s Longitudinal Business Database (Nolan, 2014).
AustraliaAustria
BelgiumDenmark
Spain
Finland
FranceGermany Greece
Ireland
Italy
Japan
South Korea
LuxembourgNetherlands
New Zealand
Portugal
Sweden
United Kingdom
United States
0
1
2
3
4
5
6
7
-1.5 -1 -0.5 0 0.5 1
Econ
omy-
wid
e la
bou
r pro
duc
tivity
gro
wth
(% p
er y
ear)
Contribution of structural change effect (percentage points)
Industry contributions to the within-industry effect Which industries contributed to New Zealand’s 2.2% a year within-industry effect compared with the OECD average of 2.5%? A New Zealand industry can make a lower contribution to the within-industry effect compared with the OECD average if it had lower labour productivity growth and/or accounted for a smaller share of employment in 1990.
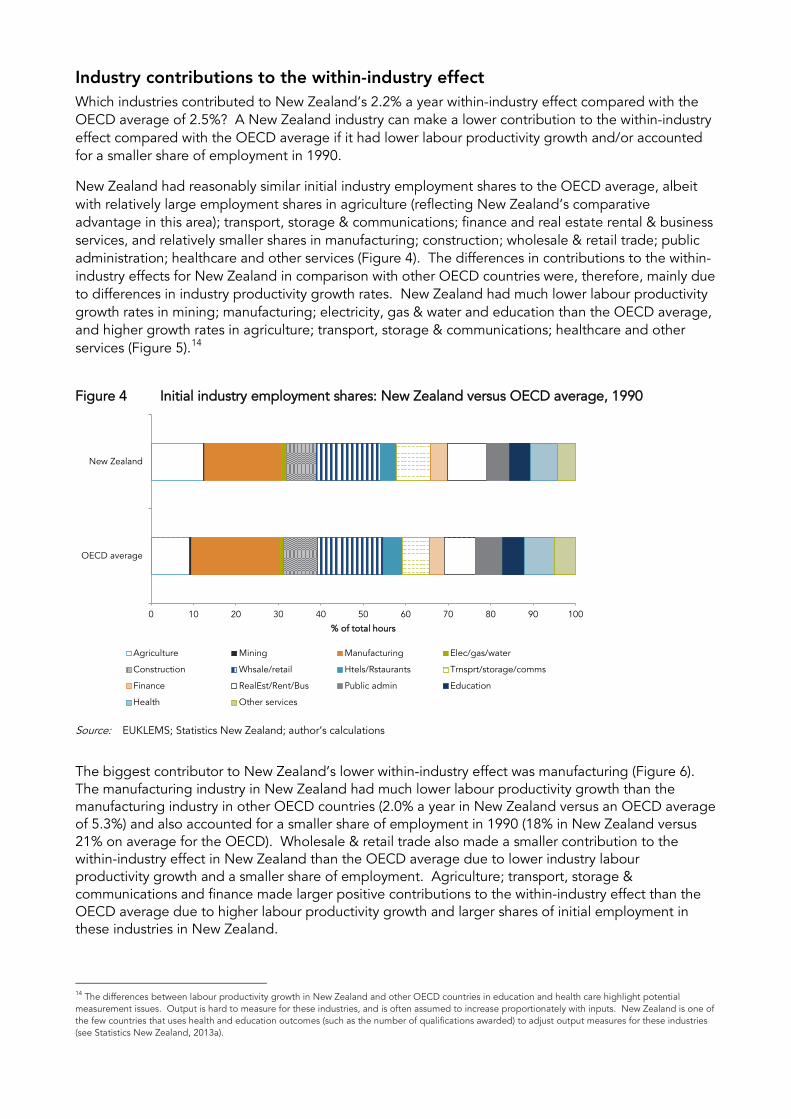
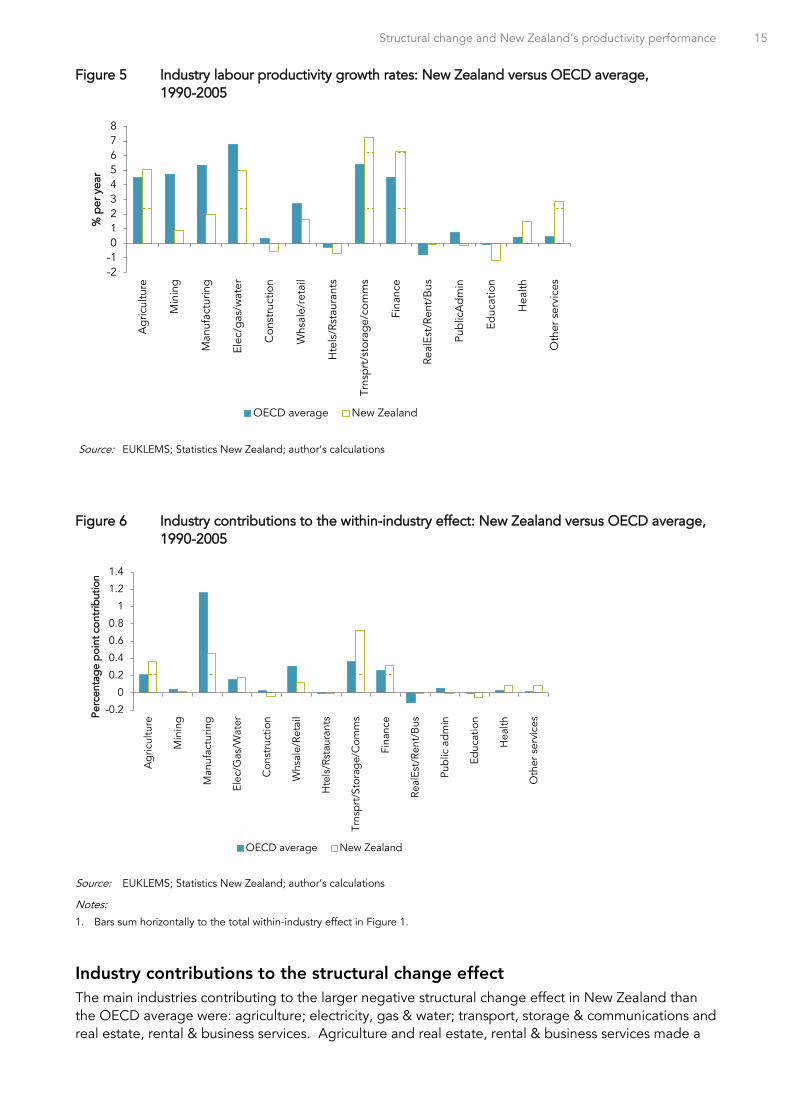
New Zealand had reasonably similar initial industry employment shares to the OECD average, albeit with relatively large employment shares in agriculture (reflecting New Zealand’s comparative advantage in this area); transport, storage & communications; finance and real estate rental & business services, and relatively smaller shares in manufacturing; construction; wholesale & retail trade; public administration; healthcare and other services (Figure 4). The differences in contributions to the within-industry effects for New Zealand in comparison with other OECD countries were, therefore, mainly due to differences in industry productivity growth rates. New Zealand had much lower labour productivity growth rates in mining; manufacturing; electricity, gas & water and education than the OECD average, and higher growth rates in agriculture; transport, storage & communications; healthcare and other services (Figure 5).14
Figure 4 Initial industry employment shares: New Zealand versus OECD average, 1990
Source: EUKLEMS; Statistics New Zealand; author’s calculations
The biggest contributor to New Zealand’s lower within-industry effect was manufacturing (Figure 6). The manufacturing industry in New Zealand had much lower labour productivity growth than the manufacturing industry in other OECD countries (2.0% a year in New Zealand versus an OECD average of 5.3%) and also accounted for a smaller share of employment in 1990 (18% in New Zealand versus 21% on average for the OECD). Wholesale & retail trade also made a smaller contribution to the within-industry effect in New Zealand than the OECD average due to lower industry labour productivity growth and a smaller share of employment. Agriculture; transport, storage & communications and finance made larger positive contributions to the within-industry effect than the OECD average due to higher labour productivity growth and larger shares of initial employment in these industries in New Zealand.
14 The differences between labour productivity growth in New Zealand and other OECD countries in education and health care highlight potential measurement issues. Output is hard to measure for these industries, and is often assumed to increase proportionately with inputs. New Zealand is one of the few countries that uses health and education outcomes (such as the number of qualifications awarded) to adjust output measures for these industries (see Statistics New Zealand, 2013a).
0 10 20 30 40 50 60 70 80 90 100
OECD average
New Zealand
% of total hours
Agriculture Mining Manufacturing Elec/gas/water
Construction Whsale/retail Htels/Rstaurants Trnsprt/storage/comms
Finance RealEst/Rent/Bus Public admin Education
Health Other services
Structural change and New Zealand’s productivity performance 15
Figure 5 Industry labour productivity growth rates: New Zealand versus OECD average, 1990-2005
Source: EUKLEMS; Statistics New Zealand; author’s calculations
Figure 6 Industry contributions to the within-industry effect: New Zealand versus OECD average, 1990-2005
Source: EUKLEMS; Statistics New Zealand; author’s calculations
Notes:
1. Bars sum horizontally to the total within-industry effect in Figure 1.
Industry contributions to the structural change effect The main industries contributing to the larger negative structural change effect in New Zealand than the OECD average were: agriculture; electricity, gas & water; transport, storage & communications and real estate, rental & business services. Agriculture and real estate, rental & business services made a
-2-1012345678
Ag
ricul
ture
Min
ing
Man
ufac
turin
g
Elec
/gas
/wat
er
Con
stru
ctio
n
Whs
ale/
reta
il
Hte
ls/R
stau
rant
s
Trns
prt
/sto
rag
e/co
mm
s
Fina
nce
Real
Est/
Rent
/Bus
Pub
licA
dm
in
Educ
atio
n
Hea
lth
Oth
er s
ervi
ces
% p
er y
ear
OECD average New Zealand
-0.2
0
0.2
0.4
0.6
0.8
1
1.2
1.4
Ag
ricul
ture
Min
ing
Man
ufac
turin
g
Elec
/Gas
/Wat
er
Con
stru
ctio
n
Whs
ale/
Reta
il
Hte
ls/R
stau
rant
s
Trns
prt
/Sto
rag
e/C
omm
s
Fina
nce
Real
Est/
Rent
/Bus
Pub
lic a
dm
in
Educ
atio
n
Hea
lth
Oth
er s
ervi
cesPe
rcen
tag
e p
oint
con
trib
utio
n
OECD average New Zealand
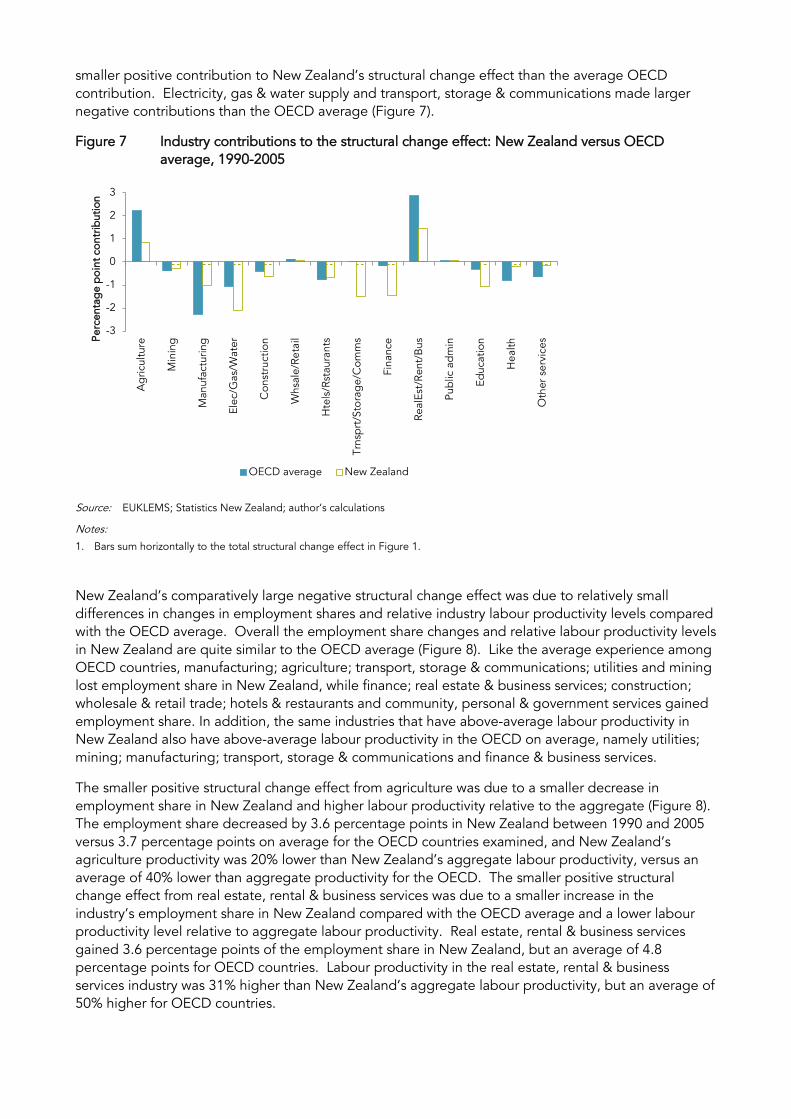
smaller positive contribution to New Zealand’s structural change effect than the average OECD contribution. Electricity, gas & water supply and transport, storage & communications made larger negative contributions than the OECD average (Figure 7).
Figure 7 Industry contributions to the structural change effect: New Zealand versus OECD average, 1990-2005
Source: EUKLEMS; Statistics New Zealand; author’s calculations
Notes:
1. Bars sum horizontally to the total structural change effect in Figure 1.
New Zealand’s comparatively large negative structural change effect was due to relatively small differences in changes in employment shares and relative industry labour productivity levels compared with the OECD average. Overall the employment share changes and relative labour productivity levels in New Zealand are quite similar to the OECD average (Figure 8). Like the average experience among OECD countries, manufacturing; agriculture; transport, storage & communications; utilities and mining lost employment share in New Zealand, while finance; real estate & business services; construction; wholesale & retail trade; hotels & restaurants and community, personal & government services gained employment share. In addition, the same industries that have above-average labour productivity in New Zealand also have above-average labour productivity in the OECD on average, namely utilities; mining; manufacturing; transport, storage & communications and finance & business services.
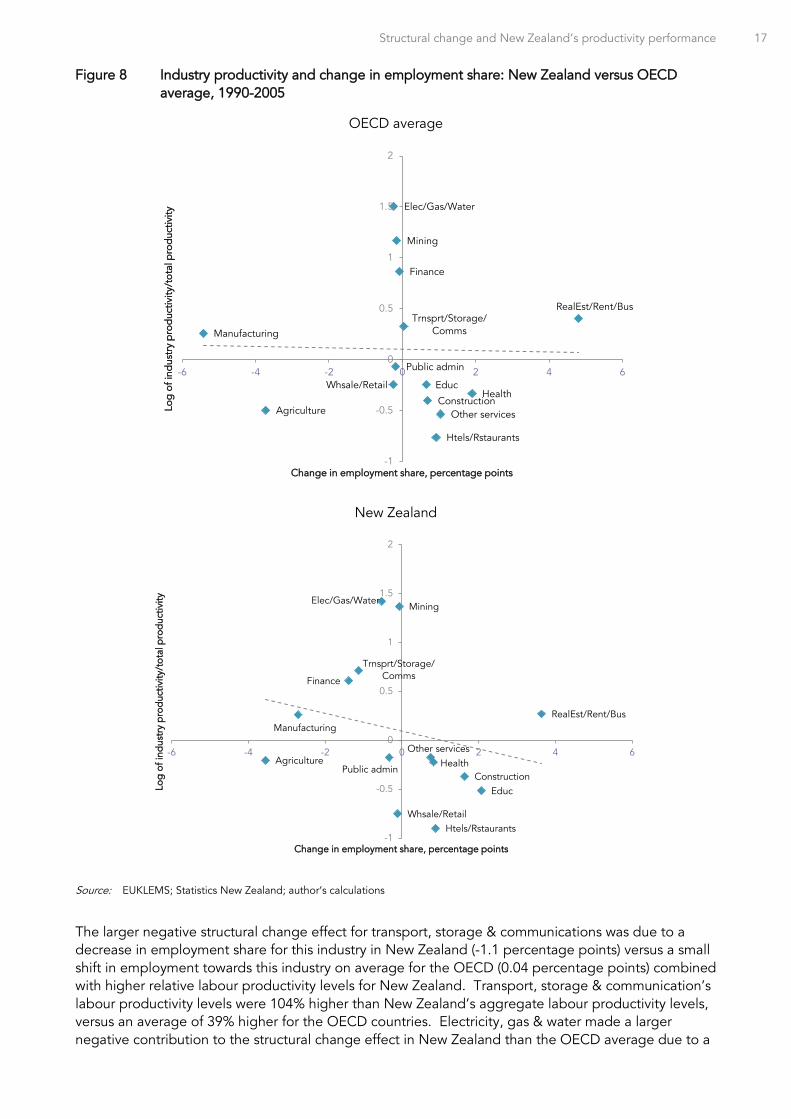
The smaller positive structural change effect from agriculture was due to a smaller decrease in employment share in New Zealand and higher labour productivity relative to the aggregate (Figure 8). The employment share decreased by 3.6 percentage points in New Zealand between 1990 and 2005 versus 3.7 percentage points on average for the OECD countries examined, and New Zealand’s agriculture productivity was 20% lower than New Zealand’s aggregate labour productivity, versus an average of 40% lower than aggregate productivity for the OECD. The smaller positive structural change effect from real estate, rental & business services was due to a smaller increase in the industry’s employment share in New Zealand compared with the OECD average and a lower labour productivity level relative to aggregate labour productivity. Real estate, rental & business services gained 3.6 percentage points of the employment share in New Zealand, but an average of 4.8 percentage points for OECD countries. Labour productivity in the real estate, rental & business services industry was 31% higher than New Zealand’s aggregate labour productivity, but an average of 50% higher for OECD countries.
-3
-2
-1
0
1
2
3
Ag
ricul
ture
Min
ing
Man
ufac
turin
g
Elec
/Gas
/Wat
er
Con
stru
ctio
n
Whs
ale/
Reta
il
Hte
ls/R
stau
rant
s
Trns
prt
/Sto
rag
e/C
omm
s
Fina
nce
Real
Est/
Rent
/Bus
Pub
lic a
dm
in
Educ
atio
n
Hea
lth
Oth
er s
ervi
cesPe
rcen
tag
e p
oint
con
trib
utio
n
OECD average New Zealand
Structural change and New Zealand’s productivity performance 17
Figure 8 Industry productivity and change in employment share: New Zealand versus OECD average, 1990-2005
OECD average
New Zealand
Source: EUKLEMS; Statistics New Zealand; author’s calculations
The larger negative structural change effect for transport, storage & communications was due to a decrease in employment share for this industry in New Zealand (-1.1 percentage points) versus a small shift in employment towards this industry on average for the OECD (0.04 percentage points) combined with higher relative labour productivity levels for New Zealand. Transport, storage & communication’s labour productivity levels were 104% higher than New Zealand’s aggregate labour productivity levels, versus an average of 39% higher for the OECD countries. Electricity, gas & water made a larger negative contribution to the structural change effect in New Zealand than the OECD average due to a
Agriculture
Mining
Manufacturing
Elec/Gas/Water
Construction
Whsale/Retail
Htels/Rstaurants
Trnsprt/Storage/Comms
Finance
RealEst/Rent/Bus
Public admin
EducHealth
Other services
-1
-0.5
0
0.5
1
1.5
2
-6 -4 -2 0 2 4 6
Log
of i
ndus
try
pro
duc
tivity
/tot
al p
rod
uctiv
ity
Change in employment share, percentage points
Agriculture
Mining
Manufacturing
Elec/Gas/Water
Construction
Whsale/RetailHtels/Rstaurants
Trnsprt/Storage/CommsFinance
RealEst/Rent/Bus
Public admin
Educ
HealthOther services
-1
-0.5
0
0.5
1
1.5
2
-6 -4 -2 0 2 4 6
Log
of i
ndus
try
pro
duc
tivity
/tot
al p
rod
uctiv
ity
Change in employment share, percentage points
larger decrease in employment share of this industry in New Zealand which was not fully offset by slightly lower relative labour productivity in New Zealand than the OECD average. New Zealand’s employment share in this industry decreased by 0.5 percentage points versus an average of 0.2 percentage points for the OECD, and industry labour productivity was 3.15 times higher than the New Zealand aggregate, versus an average of 3.5 times higher than the OECD.
It is also worth reiterating that the comparison between New Zealand and other OECD countries is indicative only and small differences between New Zealand and other OECD countries should be interpreted with caution. There are likely to be comparability issues since New Zealand is not included in the EUKLEMS database and Statistics New Zealand data was used to add New Zealand to the analysis.
The relatively large negative structural change effect does, however, warrant further investigation. Accordingly, the next section takes a more detailed look at New Zealand.
Box 1 Structural change and productivity growth in developing countries15
Developing countries have greater potential for productivity-enhancing structural change. This greater potential stems from lower initial levels of economic development, a high share of employment in low-productivity agriculture, and a greater gap between productivity in agriculture and other industries, particularly manufacturing.
The most common measure of economic development, GDP per capita, was much lower in Latin American and developing Asian countries than in New Zealand and other OECD countries. For example, New Zealand’s GDP per capita in 1990 was about three times higher than that of Latin American countries such as Costa Rica, Brazil and Chile, and more than eight times higher than that of lower-income Asian countries such as Indonesia and the Philippines.
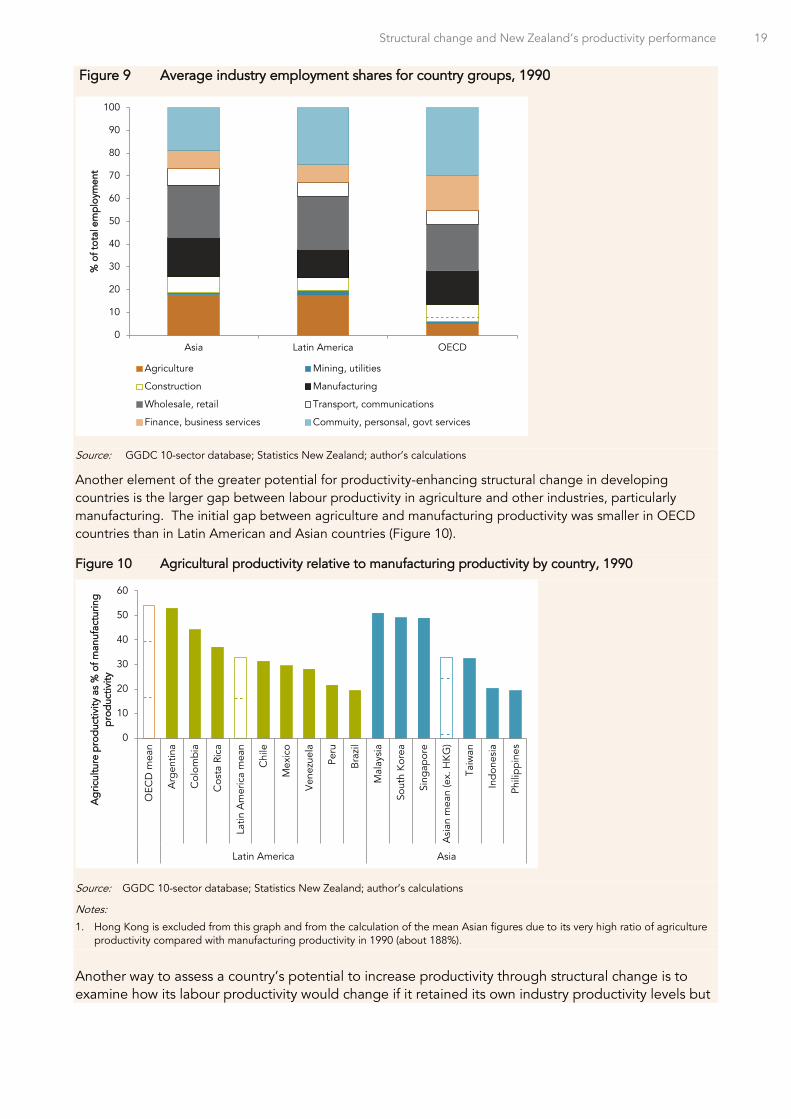
A higher starting share of employment in agriculture generally indicates greater opportunity for employment to shift towards higher-productivity industries. Latin American and Asian countries had a much higher share of employment in agriculture than OECD countries in 1990. Recently-industrialised Asian countries, such as Taiwan, had a larger share of employment than OECD countries in manufacturing, while lower-income Asian countries such as Indonesia had a lower share of manufacturing employment. As expected, Asian countries had a lower average share of employment in community, personal & government services than OECD countries. Latin American countries had, on average, a similar proportion of employment in community, personal & government services as the OECD average, which is higher than expected given the level of economic development (Figure 9).
15 Due to data availability, the figures in Box 1 measure employment as the number of workers (rather than hours worked) and industries are more aggregated here than in the main body of the paper. South Korea is included in the ‘Asia’ group of countries in Box 1, whereas it is included in the ‘OECD’ group in the main body of the paper. Mexico and Chile are included in the ‘Latin America’ group of countries in Box 1 but is not included in the ‘OECD’ group in the main body of the paper due to lack of data on hours worked by industry. The figures in Box 1, therefore, may not match exactly the figures in the main body of the paper.
Structural change and New Zealand’s productivity performance 19
Figure 9 Average industry employment shares for country groups, 1990
Source: GGDC 10-sector database; Statistics New Zealand; author’s calculations
Another element of the greater potential for productivity-enhancing structural change in developing countries is the larger gap between labour productivity in agriculture and other industries, particularly manufacturing. The initial gap between agriculture and manufacturing productivity was smaller in OECD countries than in Latin American and Asian countries (Figure 10).
Figure 10 Agricultural productivity relative to manufacturing productivity by country, 1990
Source: GGDC 10-sector database; Statistics New Zealand; author’s calculations
Notes:
1. Hong Kong is excluded from this graph and from the calculation of the mean Asian figures due to its very high ratio of agriculture productivity compared with manufacturing productivity in 1990 (about 188%).
Another way to assess a country’s potential to increase productivity through structural change is to examine how its labour productivity would change if it retained its own industry productivity levels but
0
10
20
30
40
50
60
70
80
90
100
Asia Latin America OECD
% o
f tot
al e
mp
loym
ent
Agriculture Mining, utilities
Construction Manufacturing
Wholesale, retail Transport, communications
Finance, business services Commuity, personsal, govt services
0
10
20
30
40
50
60
OEC
D m
ean
Arg
entin
a
Col
ombi
a
Cos
ta R
ica
Latin
Am
eric
a m
ean
Chi
le
Mex
ico
Ven
ezue
la
Peru
Bra
zil
Mal
aysi
a
Sout
h K
orea
Sing
apor
e
Asi
an m
ean
(ex.
HK
G)
Taiw
an
Ind
ones
ia
Phili
pp
ines
Latin America Asia
Ag
ricul
ture
pro
duc
tivity
as
% o
f man
ufac
turin
g
pro
duc
tivity
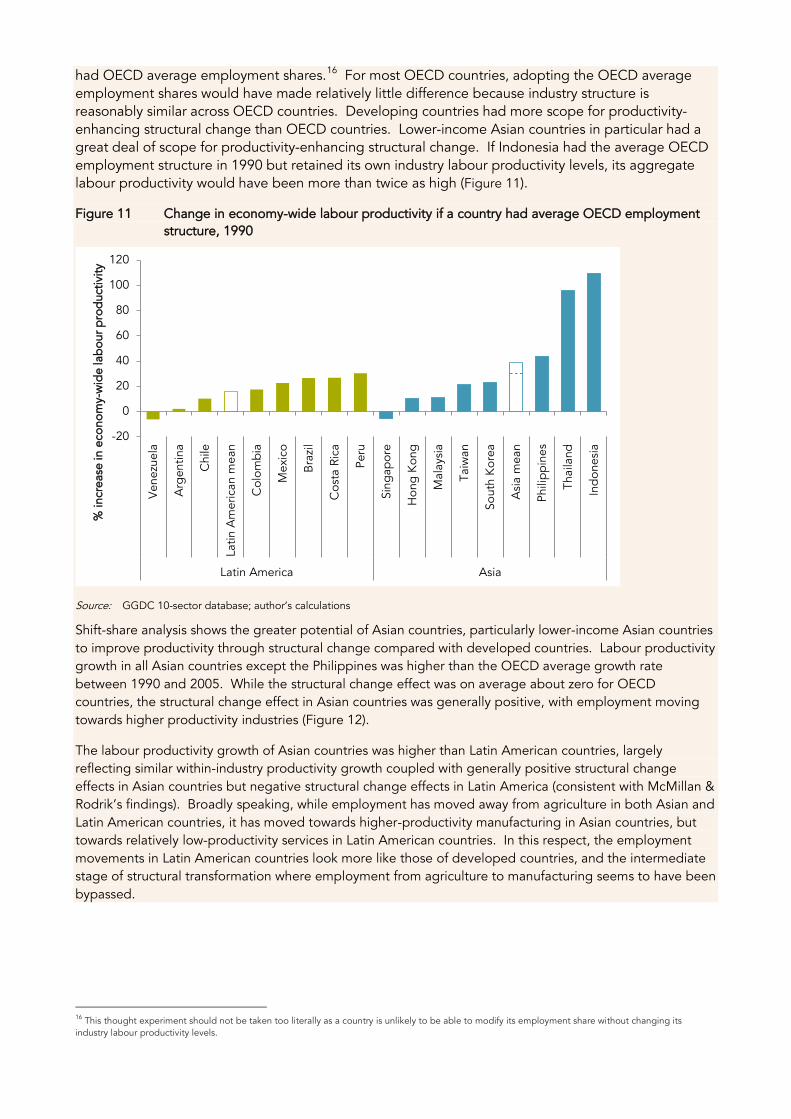
had OECD average employment shares.16 For most OECD countries, adopting the OECD average employment shares would have made relatively little difference because industry structure is reasonably similar across OECD countries. Developing countries had more scope for productivity-enhancing structural change than OECD countries. Lower-income Asian countries in particular had a great deal of scope for productivity-enhancing structural change. If Indonesia had the average OECD employment structure in 1990 but retained its own industry labour productivity levels, its aggregate labour productivity would have been more than twice as high (Figure 11).
Figure 11 Change in economy-wide labour productivity if a country had average OECD employment structure, 1990
Source: GGDC 10-sector database; author’s calculations
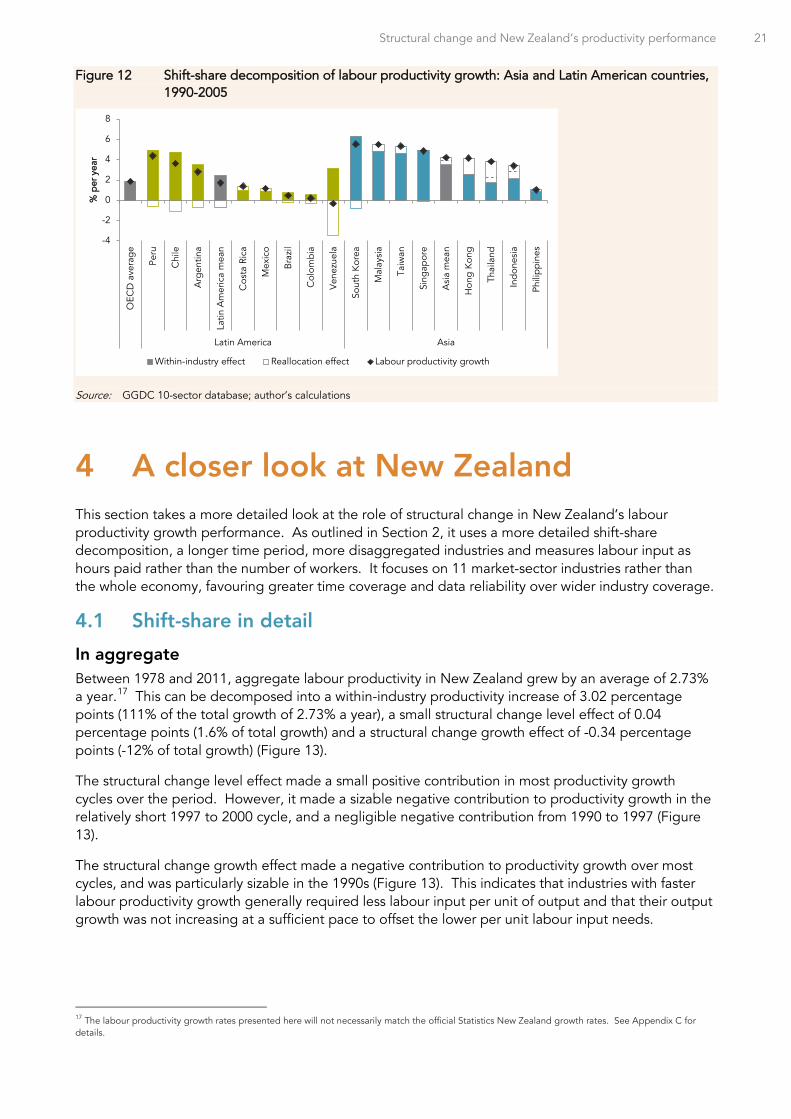
Shift-share analysis shows the greater potential of Asian countries, particularly lower-income Asian countries to improve productivity through structural change compared with developed countries. Labour productivity growth in all Asian countries except the Philippines was higher than the OECD average growth rate between 1990 and 2005. While the structural change effect was on average about zero for OECD countries, the structural change effect in Asian countries was generally positive, with employment moving towards higher productivity industries (Figure 12).
The labour productivity growth of Asian countries was higher than Latin American countries, largely reflecting similar within-industry productivity growth coupled with generally positive structural change effects in Asian countries but negative structural change effects in Latin America (consistent with McMillan & Rodrik’s findings). Broadly speaking, while employment has moved away from agriculture in both Asian and Latin American countries, it has moved towards higher-productivity manufacturing in Asian countries, but towards relatively low-productivity services in Latin American countries. In this respect, the employment movements in Latin American countries look more like those of developed countries, and the intermediate stage of structural transformation where employment from agriculture to manufacturing seems to have been bypassed.
16 This thought experiment should not be taken too literally as a country is unlikely to be able to modify its employment share without changing its industry labour productivity levels.
-20
0
20
40
60
80
100
120
Ven
ezue
la
Arg
entin
a
Chi
le
Latin
Am
eric
an m
ean
Col
ombi
a
Mex
ico
Bra
zil
Cos
ta R
ica
Peru
Sing
apor
e
Hon
g K
ong
Mal
aysi
a
Taiw
an
Sout
h K
orea
Asi
a m
ean
Phili
pp
ines
Thai
land
Ind
ones
ia
Latin America Asia
% in
crea
se in
eco
nom
y-w
ide
lab
our p
rod
uctiv
ity
Structural change and New Zealand’s productivity performance 21
Figure 12 Shift-share decomposition of labour productivity growth: Asia and Latin American countries, 1990-2005
Source: GGDC 10-sector database; author’s calculations
4 A closer look at New Zealand This section takes a more detailed look at the role of structural change in New Zealand’s labour productivity growth performance. As outlined in Section 2, it uses a more detailed shift-share decomposition, a longer time period, more disaggregated industries and measures labour input as hours paid rather than the number of workers. It focuses on 11 market-sector industries rather than the whole economy, favouring greater time coverage and data reliability over wider industry coverage.
4.1 Shift-share in detail
In aggregate Between 1978 and 2011, aggregate labour productivity in New Zealand grew by an average of 2.73% a year.17 This can be decomposed into a within-industry productivity increase of 3.02 percentage points (111% of the total growth of 2.73% a year), a small structural change level effect of 0.04 percentage points (1.6% of total growth) and a structural change growth effect of -0.34 percentage points (-12% of total growth) (Figure 13).
The structural change level effect made a small positive contribution in most productivity growth cycles over the period. However, it made a sizable negative contribution to productivity growth in the relatively short 1997 to 2000 cycle, and a negligible negative contribution from 1990 to 1997 (Figure 13).
The structural change growth effect made a negative contribution to productivity growth over most cycles, and was particularly sizable in the 1990s (Figure 13). This indicates that industries with faster labour productivity growth generally required less labour input per unit of output and that their output growth was not increasing at a sufficient pace to offset the lower per unit labour input needs.
17 The labour productivity growth rates presented here will not necessarily match the official Statistics New Zealand growth rates. See Appendix C for details.
-4
-2
0
2
4
6
8O
ECD
ave
rag
e
Peru
Chi
le
Arg
entin
a
Latin
Am
eric
a m
ean
Cos
ta R
ica
Mex
ico
Bra
zil
Col
ombi
a
Ven
ezue
la
Sout
h K
orea
Mal
aysi
a
Taiw
an
Sing
apor
e
Asi
a m
ean
Hon
g K
ong
Thai
land
Ind
ones
ia
Phili
pp
ines
Latin America Asia
% p
er y
ear
Within-industry effect Reallocation effect Labour productivity growth
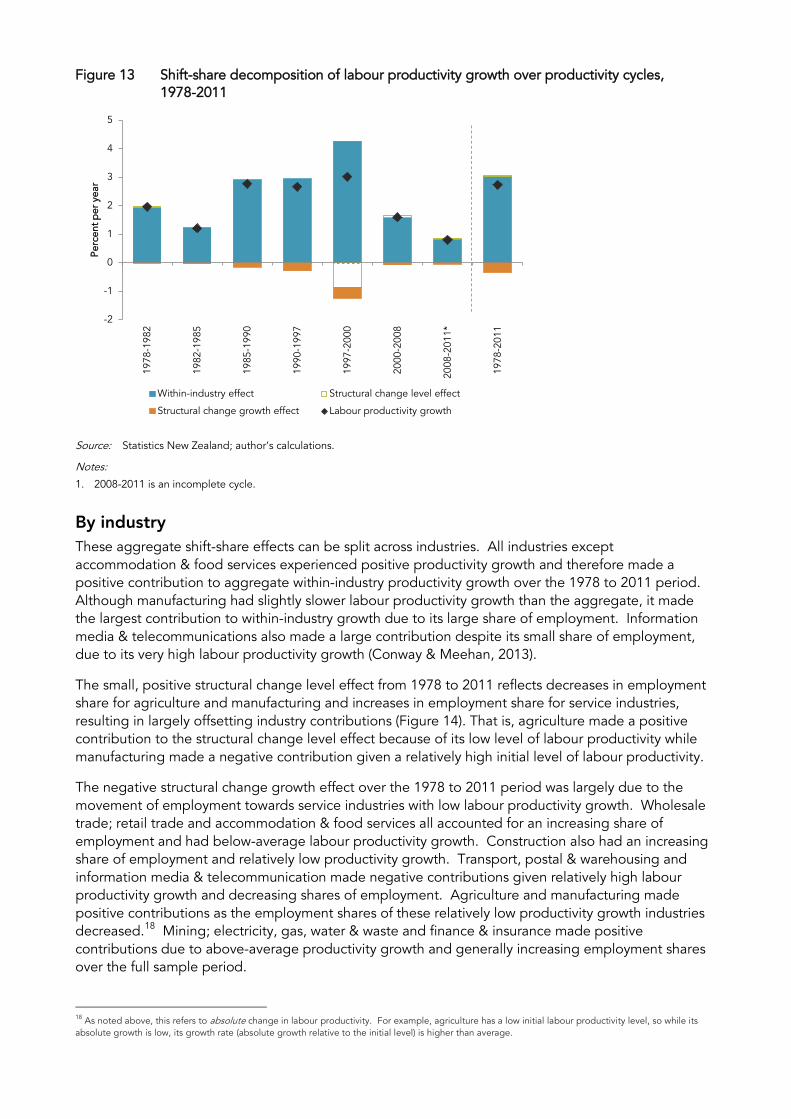
Figure 13 Shift-share decomposition of labour productivity growth over productivity cycles, 1978-2011
Source: Statistics New Zealand; author’s calculations.
Notes:
1. 2008-2011 is an incomplete cycle.
By industry These aggregate shift-share effects can be split across industries. All industries except accommodation & food services experienced positive productivity growth and therefore made a positive contribution to aggregate within-industry productivity growth over the 1978 to 2011 period. Although manufacturing had slightly slower labour productivity growth than the aggregate, it made the largest contribution to within-industry growth due to its large share of employment. Information media & telecommunications also made a large contribution despite its small share of employment, due to its very high labour productivity growth (Conway & Meehan, 2013).
The small, positive structural change level effect from 1978 to 2011 reflects decreases in employment share for agriculture and manufacturing and increases in employment share for service industries, resulting in largely offsetting industry contributions (Figure 14). That is, agriculture made a positive contribution to the structural change level effect because of its low level of labour productivity while manufacturing made a negative contribution given a relatively high initial level of labour productivity.
The negative structural change growth effect over the 1978 to 2011 period was largely due to the movement of employment towards service industries with low labour productivity growth. Wholesale trade; retail trade and accommodation & food services all accounted for an increasing share of employment and had below-average labour productivity growth. Construction also had an increasing share of employment and relatively low productivity growth. Transport, postal & warehousing and information media & telecommunication made negative contributions given relatively high labour productivity growth and decreasing shares of employment. Agriculture and manufacturing made positive contributions as the employment shares of these relatively low productivity growth industries decreased.18 Mining; electricity, gas, water & waste and finance & insurance made positive contributions due to above-average productivity growth and generally increasing employment shares over the full sample period.
18 As noted above, this refers to absolute change in labour productivity. For example, agriculture has a low initial labour productivity level, so while its absolute growth is low, its growth rate (absolute growth relative to the initial level) is higher than average.
-2
-1
0
1
2
3
4
5
1978
-198
2
1982
-198
5
1985
-199
0
1990
-199
7
1997
-200
0
2000
-200
8
2008
-201
1*
1978
-201
1
Perc
ent p
er y
ear
Within-industry effect Structural change level effect
Structural change growth effect Labour productivity growth

Structural change and New Zealand’s productivity performance 23
Figure 14 Industry contributions to labour productivity growth between 1978 and 2011
Source: Statistics New Zealand; author’s calculations.
Notes:
1. Bars and diamonds add horizontally to aggregates of the within-industry effect, structural change level effect, structural change growth effect and labour productivity growth.
By industry over time The large negative structural change effect in the 1990s, particularly during the 1997-2000 cycle, warrants further investigation. The 1990s was a decade of historically high labour productivity growth, which is likely to at least partly reflect the significant economic reforms that began in the mid-1980s (see Evans, Grimes, Wilkinson, & Teece, 1996 for an overview of these reforms).
The role of reforms in the 1990s is evident when the industry contributions to the structural change effect are examined over time (Figure 15). Utilities are a big part of the story behind the negative structural change effect in the 1990s. In the 1990-1997 cycle, electricity, gas, water & waste made the largest negative contribution to the structural change level effect and second largest contribution to the growth effect. Over the 1997 to 2000 cycle, the negative contribution of this industry increased and was the largest negative contribution to both the structural change level and growth effects.19
The information media & telecommunications industry also made considerable negative, albeit smaller, contributions to the structural change level and growth effects in both productivity cycles over the 1990s. Transport, postal & warehousing was a high productivity-growth industry that made a negative contribution to the structural change growth effect in the 1990-to-1997 cycle and the structural change level and growth effects in the 1997-to-2000 cycle. The negative structural change contribution of the construction industry increased steadily from the late 1990s until the end of the 2000-2008 productivity cycle, presumably reflecting the impact of the New Zealand housing boom. The accommodation & food services industry has had a negative impact on structural change over the entire sample period 1990-2011 while the structural change impact of retail has been consistently negative from 1997.
19 In the 1990-1997 cycle the electricity, gas, water & waste industry accounted for -0.1 percentage points of the -0.02 total (ie, 561%) reallocation level effect; and for the reallocation growth effect, it accounted for -0.05 percentage points of the -0.3 total (ie, 20%). In the 1997-to-2000 cycle, electricity, gas, water & waste accounted for -0.3 percentage points of the -0.9 total for the level effect (32%) and -0.16 percentage points of the -0.39 total for the growth effect (41%).
-0.4
-0.2
0
0.2
0.4
0.6
0.8
1
Ag
, for
est,
fish
Min
ing
Man
ufac
turin
g
Elec
/gas
/wat
er/w
aste
Con
stru
ctio
n
Who
lesa
le
Reta
il
Acc
omm
. & fo
od
Tran
spor
t
Tele
com
ms
Fina
nce,
insu
ranc
e
Perc
enta
ge
poi
nt c
ontr
ibut
ion
Within-industry effect Structural change level effect
Structural change growth effect Labour productivity growth
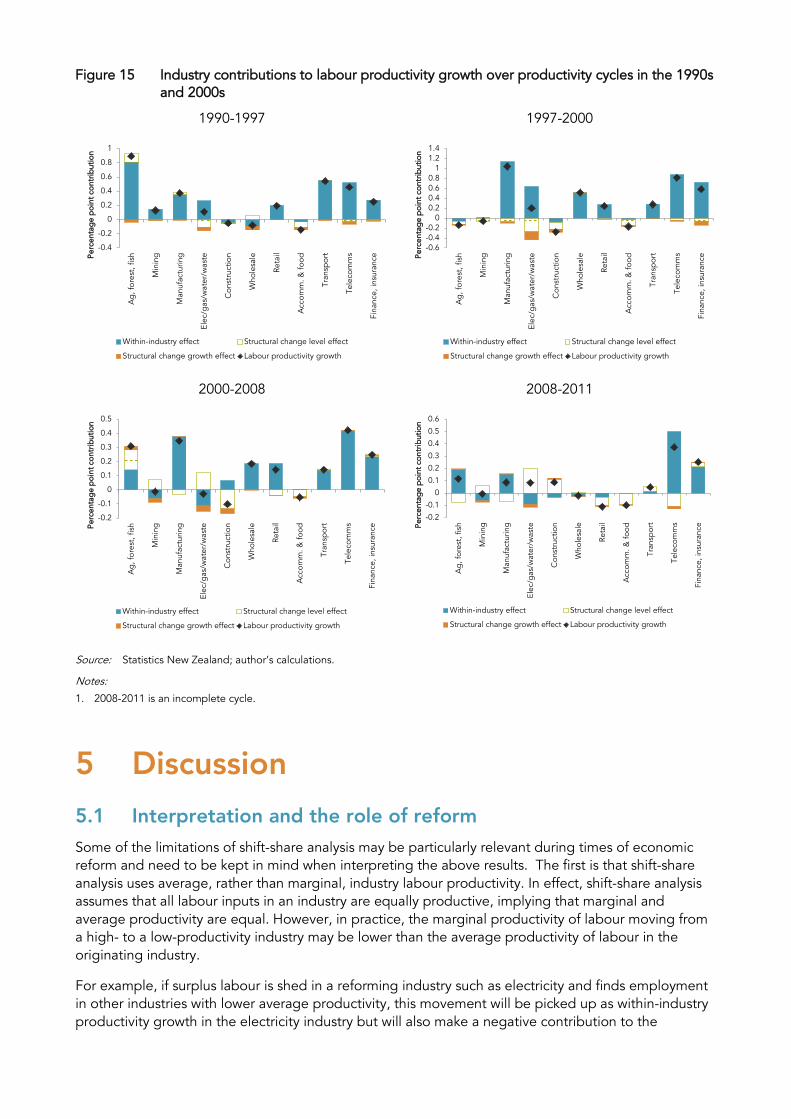
Figure 15 Industry contributions to labour productivity growth over productivity cycles in the 1990s and 2000s
1990-1997
1997-2000
2000-2008
2008-2011
Source: Statistics New Zealand; author’s calculations.
Notes:
1. 2008-2011 is an incomplete cycle.
5 Discussion
5.1 Interpretation and the role of reform Some of the limitations of shift-share analysis may be particularly relevant during times of economic reform and need to be kept in mind when interpreting the above results. The first is that shift-share analysis uses average, rather than marginal, industry labour productivity. In effect, shift-share analysis assumes that all labour inputs in an industry are equally productive, implying that marginal and average productivity are equal. However, in practice, the marginal productivity of labour moving from a high- to a low-productivity industry may be lower than the average productivity of labour in the originating industry.
For example, if surplus labour is shed in a reforming industry such as electricity and finds employment in other industries with lower average productivity, this movement will be picked up as within-industry productivity growth in the electricity industry but will also make a negative contribution to the
-0.4
-0.2
0
0.2
0.4
0.6
0.8
1
Ag
, for
est,
fish
Min
ing
Man
ufac
turin
g
Elec
/gas
/wat
er/w
aste
Con
stru
ctio
n
Who
lesa
le
Reta
il
Acc
omm
. & fo
od
Tran
spor
t
Tele
com
ms
Fina
nce,
insu
ranc
ePerc
enta
ge
poi
nt c
ontr
ibut
ion
Within-industry effect Structural change level effect
Structural change growth effect Labour productivity growth
-0.6-0.4-0.2
00.20.40.60.8
11.21.4
Ag
, for
est,
fish
Min
ing
Man
ufac
turin
g
Elec
/gas
/wat
er/w
aste
Con
stru
ctio
n
Who
lesa
le
Reta
il
Acc
omm
. & fo
od
Tran
spor
t
Tele
com
ms
Fina
nce,
insu
ranc
ePerc
enta
ge
poi
nt c
ontr
ibut
ion
Within-industry effect Structural change level effect
Structural change growth effect Labour productivity growth
-0.2
-0.1
0
0.1
0.2
0.3
0.4
0.5
0.6
Ag
, for
est,
fish
Min
ing
Man
ufac
turin
g
Elec
/gas
/wat
er/w
aste
Con
stru
ctio
n
Who
lesa
le
Reta
il
Acc
omm
. & fo
od
Tran
spor
t
Tele
com
ms
Fina
nce,
insu
ranc
ePerc
enta
ge
poi
nt c
ontr
ibut
ion
Within-industry effect Structural change level effect
Structural change growth effect Labour productivity growth
Structural change and New Zealand’s productivity performance 25
structural change effect as labour moves from an industry with high average productivity to one with lower average productivity (see Box 2).
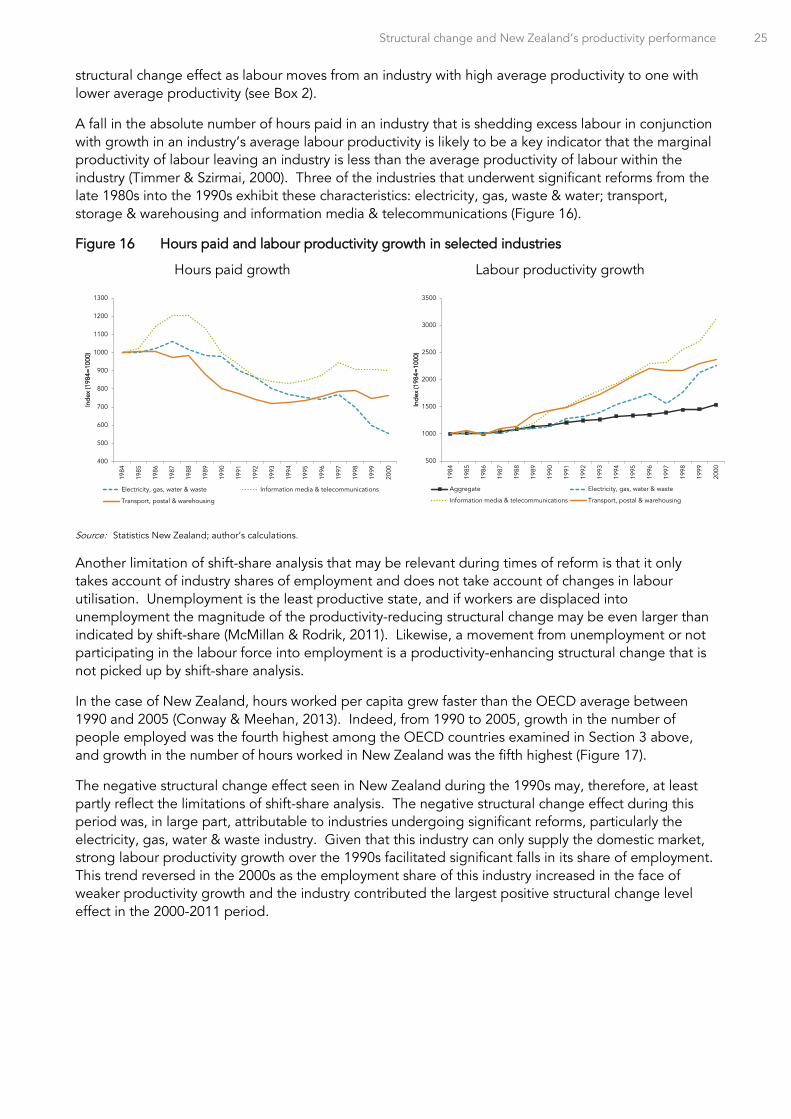
A fall in the absolute number of hours paid in an industry that is shedding excess labour in conjunction with growth in an industry’s average labour productivity is likely to be a key indicator that the marginal productivity of labour leaving an industry is less than the average productivity of labour within the industry (Timmer & Szirmai, 2000). Three of the industries that underwent significant reforms from the late 1980s into the 1990s exhibit these characteristics: electricity, gas, waste & water; transport, storage & warehousing and information media & telecommunications (Figure 16).
Figure 16 Hours paid and labour productivity growth in selected industries
Hours paid growth
Labour productivity growth
Source: Statistics New Zealand; author’s calculations.
Another limitation of shift-share analysis that may be relevant during times of reform is that it only takes account of industry shares of employment and does not take account of changes in labour utilisation. Unemployment is the least productive state, and if workers are displaced into unemployment the magnitude of the productivity-reducing structural change may be even larger than indicated by shift-share (McMillan & Rodrik, 2011). Likewise, a movement from unemployment or not participating in the labour force into employment is a productivity-enhancing structural change that is not picked up by shift-share analysis.
In the case of New Zealand, hours worked per capita grew faster than the OECD average between 1990 and 2005 (Conway & Meehan, 2013). Indeed, from 1990 to 2005, growth in the number of people employed was the fourth highest among the OECD countries examined in Section 3 above, and growth in the number of hours worked in New Zealand was the fifth highest (Figure 17).
The negative structural change effect seen in New Zealand during the 1990s may, therefore, at least partly reflect the limitations of shift-share analysis. The negative structural change effect during this period was, in large part, attributable to industries undergoing significant reforms, particularly the electricity, gas, water & waste industry. Given that this industry can only supply the domestic market, strong labour productivity growth over the 1990s facilitated significant falls in its share of employment. This trend reversed in the 2000s as the employment share of this industry increased in the face of weaker productivity growth and the industry contributed the largest positive structural change level effect in the 2000-2011 period.
400
500
600
700
800
900
1000
1100
1200
1300
1984
1985
1986
1987
1988
1989
1990
1991
1992
1993
1994
1995
1996
1997
1998
1999
2000
Ind
ex (1
984=
1000
)
Electricity, gas, water & waste Information media & telecommunications
Transport, postal & warehousing
500
1000
1500
2000
2500
3000
3500
1984
1985
1986
1987
1988
1989
1990
1991
1992
1993
1994
1995
1996
1997
1998
1999
2000
Ind
ex (1
984=
1000
)
Aggregate Electricity, gas, water & waste
Information media & telecommunications Transport, postal & warehousing
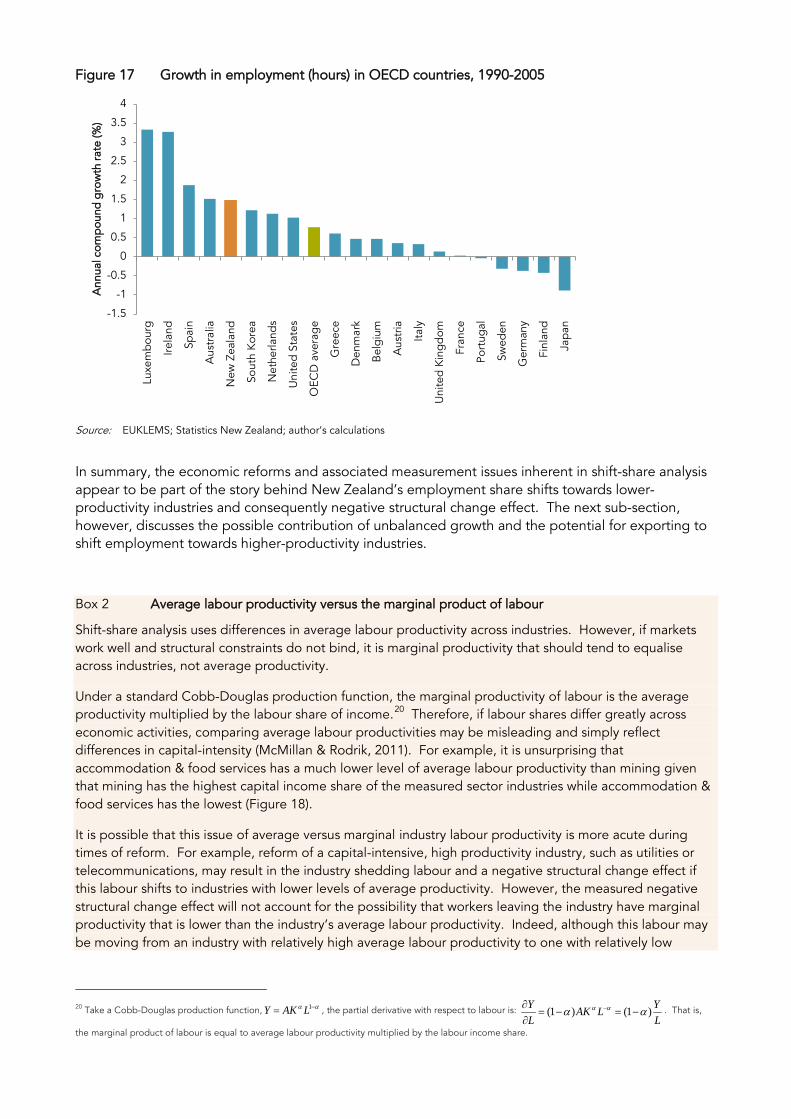
Figure 17 Growth in employment (hours) in OECD countries, 1990-2005
Source: EUKLEMS; Statistics New Zealand; author’s calculations
In summary, the economic reforms and associated measurement issues inherent in shift-share analysis appear to be part of the story behind New Zealand’s employment share shifts towards lower-productivity industries and consequently negative structural change effect. The next sub-section, however, discusses the possible contribution of unbalanced growth and the potential for exporting to shift employment towards higher-productivity industries.
Box 2 Average labour productivity versus the marginal product of labour
Shift-share analysis uses differences in average labour productivity across industries. However, if markets work well and structural constraints do not bind, it is marginal productivity that should tend to equalise across industries, not average productivity.
Under a standard Cobb-Douglas production function, the marginal productivity of labour is the average productivity multiplied by the labour share of income.20 Therefore, if labour shares differ greatly across economic activities, comparing average labour productivities may be misleading and simply reflect differences in capital-intensity (McMillan & Rodrik, 2011). For example, it is unsurprising that accommodation & food services has a much lower level of average labour productivity than mining given that mining has the highest capital income share of the measured sector industries while accommodation & food services has the lowest (Figure 18).
It is possible that this issue of average versus marginal industry labour productivity is more acute during times of reform. For example, reform of a capital-intensive, high productivity industry, such as utilities or telecommunications, may result in the industry shedding labour and a negative structural change effect if this labour shifts to industries with lower levels of average productivity. However, the measured negative structural change effect will not account for the possibility that workers leaving the industry have marginal productivity that is lower than the industry’s average labour productivity. Indeed, although this labour may be moving from an industry with relatively high average labour productivity to one with relatively low
20 Take a Cobb-Douglas production function, αα −= 1LAKY , the partial derivative with respect to labour is:
LYLAK
LY )1()1( αα αα −=−=∂∂ − . That is,
the marginal product of labour is equal to average labour productivity multiplied by the labour income share.
-1.5
-1
-0.5
0
0.5
1
1.5
2
2.5
3
3.5
4
Luxe
mbo
urg
Irela
nd
Spai
n
Aus
tral
ia
New
Zea
land
Sout
h K
orea
Net
herla
nds
Uni
ted
Stat
es
OEC
D a
vera
ge
Gre
ece
Den
mar
k
Bel
giu
m
Aus
tria
Italy
Uni
ted
Kin
gd
om
Fran
ce
Port
ugal
Swed
en
Ger
man
y
Finl
and
Jap
an
Ann
ual c
omp
ound
gro
wth
rate
(%)
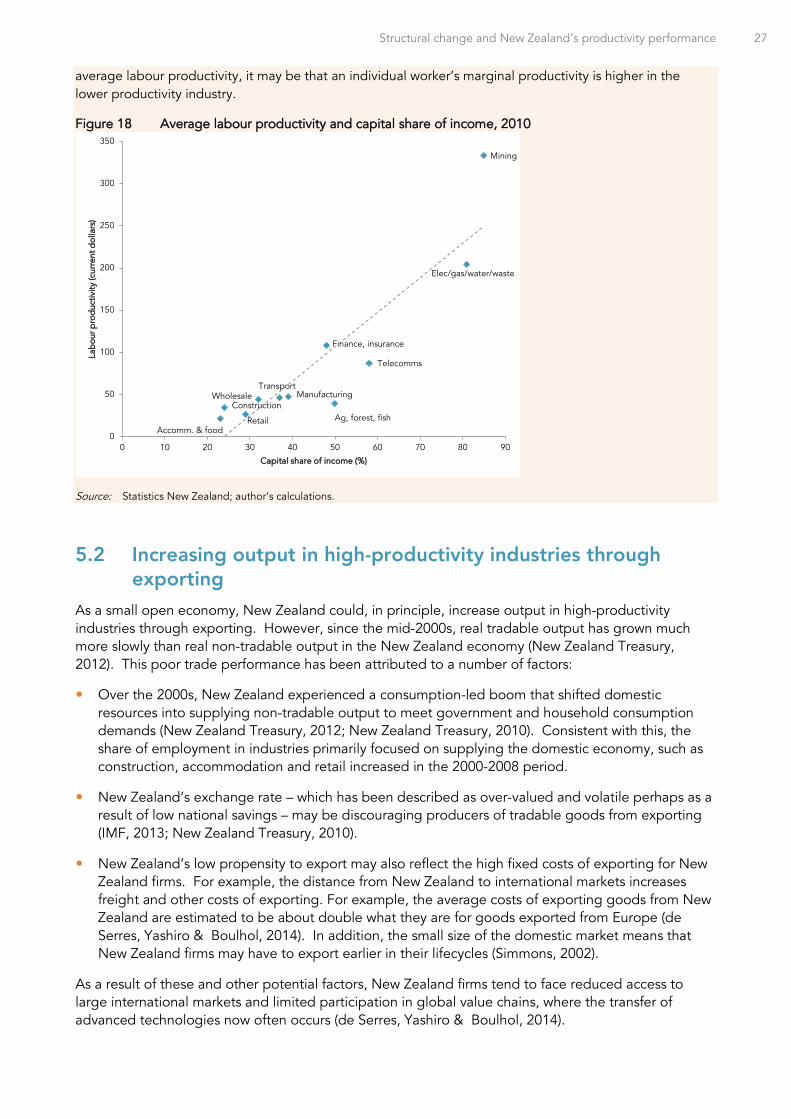
Structural change and New Zealand’s productivity performance 27
average labour productivity, it may be that an individual worker’s marginal productivity is higher in the lower productivity industry.
Figure 18 Average labour productivity and capital share of income, 2010
Source: Statistics New Zealand; author’s calculations.
5.2 Increasing output in high-productivity industries through exporting
As a small open economy, New Zealand could, in principle, increase output in high-productivity industries through exporting. However, since the mid-2000s, real tradable output has grown much more slowly than real non-tradable output in the New Zealand economy (New Zealand Treasury, 2012). This poor trade performance has been attributed to a number of factors:
Over the 2000s, New Zealand experienced a consumption-led boom that shifted domestic resources into supplying non-tradable output to meet government and household consumption demands (New Zealand Treasury, 2012; New Zealand Treasury, 2010). Consistent with this, the share of employment in industries primarily focused on supplying the domestic economy, such as construction, accommodation and retail increased in the 2000-2008 period.
New Zealand’s exchange rate – which has been described as over-valued and volatile perhaps as a result of low national savings – may be discouraging producers of tradable goods from exporting (IMF, 2013; New Zealand Treasury, 2010).
New Zealand’s low propensity to export may also reflect the high fixed costs of exporting for New Zealand firms. For example, the distance from New Zealand to international markets increases freight and other costs of exporting. For example, the average costs of exporting goods from New Zealand are estimated to be about double what they are for goods exported from Europe (de Serres, Yashiro & Boulhol, 2014). In addition, the small size of the domestic market means that New Zealand firms may have to export earlier in their lifecycles (Simmons, 2002).
As a result of these and other potential factors, New Zealand firms tend to face reduced access to large international markets and limited participation in global value chains, where the transfer of advanced technologies now often occurs (de Serres, Yashiro & Boulhol, 2014).
Ag, forest, fish
Mining
Manufacturing
Elec/gas/water/waste
ConstructionWholesale
RetailAccomm. & food
Transport
Telecomms
Finance, insurance
0
50
100
150
200
250
300
350
0 10 20 30 40 50 60 70 80 90
Lab
our p
rod
uctiv
ity (c
urre
nt d
olla
rs)
Capital share of income (%)
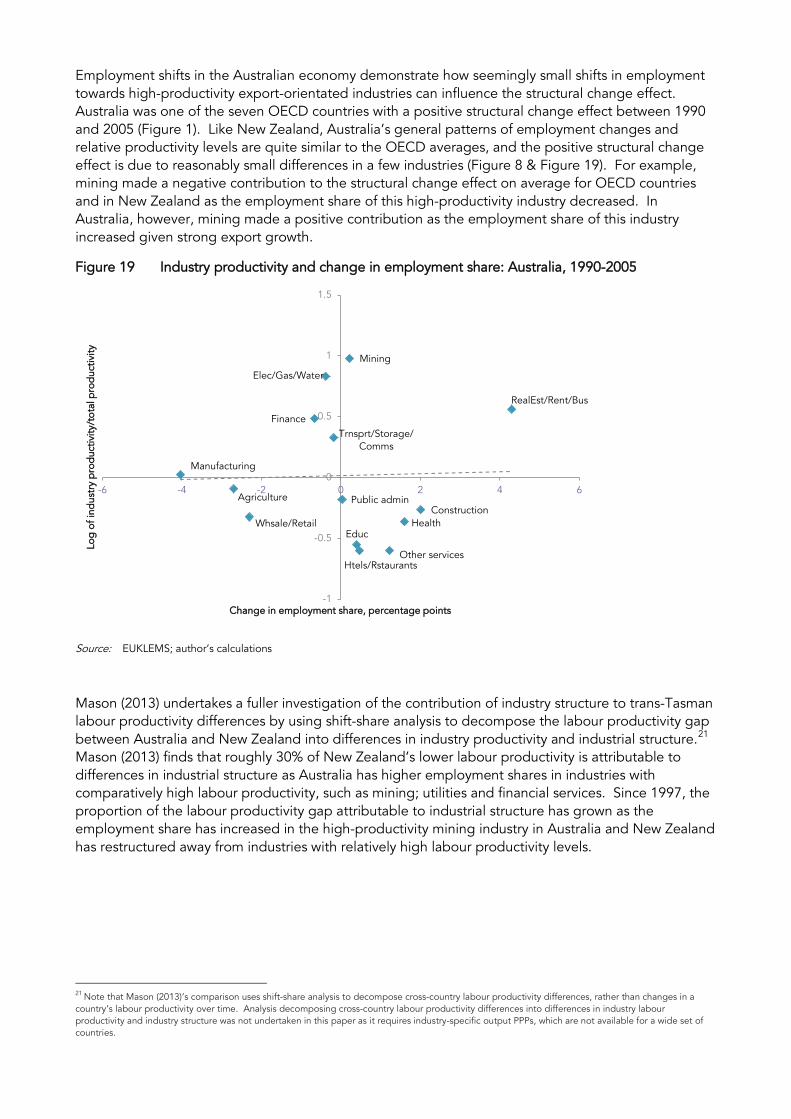
Employment shifts in the Australian economy demonstrate how seemingly small shifts in employment towards high-productivity export-orientated industries can influence the structural change effect. Australia was one of the seven OECD countries with a positive structural change effect between 1990 and 2005 (Figure 1). Like New Zealand, Australia’s general patterns of employment changes and relative productivity levels are quite similar to the OECD averages, and the positive structural change effect is due to reasonably small differences in a few industries (Figure 8 & Figure 19). For example, mining made a negative contribution to the structural change effect on average for OECD countries and in New Zealand as the employment share of this high-productivity industry decreased. In Australia, however, mining made a positive contribution as the employment share of this industry increased given strong export growth.
Figure 19 Industry productivity and change in employment share: Australia, 1990-2005
Source: EUKLEMS; author’s calculations
Mason (2013) undertakes a fuller investigation of the contribution of industry structure to trans-Tasman labour productivity differences by using shift-share analysis to decompose the labour productivity gap between Australia and New Zealand into differences in industry productivity and industrial structure.21 Mason (2013) finds that roughly 30% of New Zealand’s lower labour productivity is attributable to differences in industrial structure as Australia has higher employment shares in industries with comparatively high labour productivity, such as mining; utilities and financial services. Since 1997, the proportion of the labour productivity gap attributable to industrial structure has grown as the employment share has increased in the high-productivity mining industry in Australia and New Zealand has restructured away from industries with relatively high labour productivity levels.
21 Note that Mason (2013)’s comparison uses shift-share analysis to decompose cross-country labour productivity differences, rather than changes in a country’s labour productivity over time. Analysis decomposing cross-country labour productivity differences into differences in industry labour productivity and industry structure was not undertaken in this paper as it requires industry-specific output PPPs, which are not available for a wide set of countries.
Agriculture
Mining
Manufacturing
Elec/Gas/Water
ConstructionWhsale/Retail
Htels/Rstaurants
Trnsprt/Storage/Comms
Finance
RealEst/Rent/Bus
Public admin
EducHealth
Other services
-1
-0.5
0
0.5
1
1.5
-6 -4 -2 0 2 4 6
Log
of i
ndus
try
pro
duc
tivity
/tot
al p
rod
uctiv
ity
Change in employment share, percentage points
Structural change and New Zealand’s productivity performance 29
6 Conclusion McMillan & Rodrik (2011) suggest that the success of Asian countries and failure of Latin American countries to improve labour productivity between 1990 and 2005 was due to differences in the movement of employment among industries, rather than differences in within-industry productivity improvements. New Zealand has experienced employment moving from high- to low-productivity industries, raising concerns that structural change has had a similar impact on labour productivity growth as in a Latin American country.
A country’s level of development impacts on the potential for structural change to enhance its productivity performance – developing countries tend to have large, low-productivity agricultural industries to draw employment from while developed countries are more likely to experience employment shifts towards low-productivity service industries.
Even so, compared with other OECD countries, New Zealand has one of the lowest labour productivity growth rates and largest incidence of productivity-detracting structural change (Figure 1). This begs the question: is this negative structural change responsible for New Zealand’s poor productivity performance?
To answer that question, the analysis presented above shows that movements in New Zealand’s employment shares over recent decades have been broadly similar to the OECD average. New Zealand did, however, have the largest employment shift away from the electricity, gas & water and transport, storage & communication industries of the OECD countries examined. The contribution of these industries to the negative structural change effect was particularly large in the 1990s, a time when these industries were undergoing significant reforms. Like other OECD countries, New Zealand has also experienced an employment shift towards low-productivity service industries. This shift towards low-productivity services in New Zealand and other OECD countries may reflect some combination of Baumol’s disease and increases in demand for these services.
New Zealand’s period of economic reform may have exacerbated limitations in the shift-share technique. In particular, by comparing average labour productivity across industries, shift-share analysis assumes that each unit of labour within an industry has the same labour productivity. This limitation may be particularly problematic in times of significant reforms, where high-productivity industries such as utilities are shedding excess labour whose marginal productivity is likely to be lower than the industry’s average productivity. Increases in labour force participation and employment following reforms is another example. While these factors have most likely contributed to negative structural change and possibly lower labour productivity growth in New Zealand, it has also increased labour utilisation and GDP per capita.
It should also be noted that the within-industry component of productivity growth has been larger than the structural change effect in New Zealand and other OECD countries. Whatever the role of structural change, therefore, enhancing within-industry productivity growth remains critically important.
Even though cross-industry employment shifts do not appear to have been unusually problematic for New Zealand, it is important to consider the potential for international trade to counter the tendency for high-productivity industries to reduce their labour share. As a small open economy, New Zealand could, in principle, increase output in high-productivity industries through exporting. While this could occur in principle, New Zealand’s propensity to export is low compared with other small, open economies (New Zealand Treasury, 2009), suggesting that there may be impediments to this process
Finally, shift-share analysis may underestimate the importance of structural change as it analyses labour reallocation among fairly aggregated industries (Timmer & Szirmai, 2000). Statistics New Zealand’s Longitudinal Business Database could be used to analyse resource reallocation among firms. This analysis would allow labour productivity and MFP growth to be decomposed into contributions from firm exit, firm entry, the productivity growth of existing firms, and the reallocation of resources among existing firms. Some work in this area has already been undertaken (for example, see Law & McLellan,

2005 and Devine, Doan, Iyer, Mok, & Stevens, 2012) but there is scope for further investigation. Further analysis may aim to address whether there are impediments to resources moving from low- to high-productivity firms, how these impediments compare with other countries, and what conditions may be driving these impediments (for example, the role of competition in a small domestic market).
Structural change and New Zealand’s productivity performance 31
References Australian Productivity Commission. (2013). On efficiency and effectiveness: some definitions. Productivity
Commission Staff Research Note. Retrieved from www.pc.gov.au/__data/assets/pdf_file/0003/123357/efficiency-effectiveness.pdf
Barnes, P. (2011). Multifactor productivity growth cycles at the industry level. Productivity Commission Staff Working Paper. Retrieved from www.pc.gov.au/__data/assets/pdf_file/0005/110867/industry-multifactor-productivity.pdf
Baumol, W. J., & Bowen, W. G. (1966). Performing arts: The economic dilemma. New York: Twentieth Century Fund.
Conway, P., & Meehan, L. (2013). Productivity by the numbers: New Zealand’s experience. Productivity Commission Working Paper 2013/1. Retrieved from www.productivity.govt.nz/research-paper/productivity-by-the-numbers-the-new-zealand-experience
de Serres, A., Yashiro, N., & Boulhol, H. (2014). An international perspective on the New Zealand productivity paradox . Productivity Commission Working Paper 2014/1. Retrieved from www.productivity.govt.nz/working-paper/an-international-perspective-on-the-new-zealand-productivity-paradox
de Vries, G. J., Erumban, A. A., Timmer, M. P., Voskoboynikov, I., & Wu, H. X. (2012). Deconstructing the BRICs: Structural transformation and aggregate productivity growth. Journal of Comparative Economics, 40(2), 211–227.
Dennis, B. N., & İşcan, T. B. (2009). Engel versus Baumol: Accounting for structural change using two centuries of U.S. data. Explorations in Economic History, 46(2), 186–202.
Devine, H., Doan, T., Iyer, K., Mok, P., & Stevens, P. (2012). Decomposition of New Zealand firm productivity, 2001-2008. Paper presented to NZ Association of Economists Conference 2012. Retrieved from www.nzae.org.nz/wp-content/uploads/2012/07/Doan_NZAE-2012-submission_Tinh-Doan.pdf
Evans, L., Grimes, A., Wilkinson, B., & Teece, D. (1996). Economic reform in New Zealand 1984-95: The pursuit of efficiency. Journal of Economic Literature1, 34(4), 1856–1902.
Evans, L. T., & Meade, R. B. (2005). Alternating currents or counter-revolution? Contemporary electricity reform in New Zealand. Wellington: Victoria University Press. Retrieved from www.iscr.org.nz/f310,8474/Alternating_Currents_e-book.pdf
Foster, L., Haltiwanger, J., & Krizan, C. (2001). Aggregate productivity growth: Lessons from microeconomic evidence. In C. R. Hulten, E. R. Dean, & M. J. Harper (Eds.), New Developments in Productivity Analysis (pp. 303–372). University of Chicago Press.
Kruger, J. J. (2008). Productivity and structural change: a review of the literature. Journal of Economic Surveys, 22(2), 330–363.
IMF. (2013). New Zealand 2013 Article IV consultation. IMF Country Report No. 13/117. Retrieved from http://www.imf.org/external/pubs/ft/scr/2013/cr13117.pdf
Law, D., & McLellan, N. (2005). The contributions from firm entry, exit and continuation to labour productivity growth in New Zealand (No. 05/01). New Zealand Treasury Working Paper 05/01. Retrieved from www.treasury.govt.nz/publications/research-policy/wp/2005/05-01/twp05-01.pdf
Maré, D. C., & Hyslop, D. R. (2008). Cyclical earnings variation and the composition of employment. Retrieved from www.dol.govt.nz/publication-view.asp?ID=314
Mason, G. (2013). Explaining New Zealand-Australia productivity differences: New comparisons at industry level. New Zealand Productivity Commission Working Paper 2013/2. Retrieved from www.productivity.govt.nz/working-paper/nz-australia-productivity-differences
McMillan, M., & Rodrik, D. (2011). Globalization, structural change and productivity growth. In M. Bacchetta & M. Jansen (Eds.), Making Globalization Socially Sustainable (pp. 49–85). Geneva: International Labour Organization and World Trade Organization. Retrieved from www.ilo.org/global/publications/books/WCMS_170968/lang--en/index.htm
Meehan, L. (2014). New Zealand's international trade in services: A background note. New Zealand Productivity Commission Research Note 2014/1. Available from www.productivity.govt.nz/research-papers-list
New Zealand Treasury. (2009). International connections and productivity: Making globalisation work for New Zealand. New Zealand Treasury Productivity Paper No. 09/01. Retrieved from www.treasury.govt.nz/publications/research-policy/tprp/09-01
New Zealand Treasury. (2010). Saving in New Zealand: Issues and options. New Zealand Treasury. Retrieved from www.treasury.govt.nz/publications/research-policy/tp/saving
New Zealand Treasury. (2012). Monthly economic indicators: April 2012. Wellington. Retrieved from www.treasury.govt.nz/economy/mei/apr12
Nolan, P. (2014). Lifting New Zealand’s productivity: A research agenda. Policy Quarterly, 10(2), 22-29.
OECD. (2011). OECD Economic Surveys: Ireland 2011. OECD Publishing. Retrieved from http://dx.doi.org/10.1787/eco_surveys-irl-2011-en
Pacifecon (NZ) Ltd., & BRANZ. (2013). New Zealand Building and Construction Productivity Partnership: National construction pipeline. Retrieved from www.mbie.govt.nz/news-and-media/news-from-around-mbie/2013-news/december/national-construction-pipeline-report-released
Rajanayagam, S., & Warmke, N. (2012, June). Can we level the playing field? A comparative analysis of the levels of labour productivity between industries in New Zealand. Paper presented at the New Zealand Association of Economists Conference 2012. Retrieved from www.nzae.org.nz/wp-content/uploads/2012/06/Rajanayagam_Can-we-level-the-playing-field.pdf
Sharpe, A. (2010). Can sectoral reallocations of labour explain Canada’s absymal productivity performance? International Productivity Monitor, 19(Spring), 40–49. Retrieved from www.csls.ca/ipm/19/IPM-19-sharpe.pdf
Simmons, G. (2002). Growing pains: New Zealand qualitative evidence on hurdles to exporting growth. New Zealand Treasury Working Paper No. 02/10. Retrieved from www.treasury.govt.nz/publications/research-policy/wp/2002/02-10
Statistics New Zealand. (2007). Extracting growth cycles from productivity indexes. Retrieved from www.stats.govt.nz/browse_for_stats/income-and-work/employment_and_unemployment/extracting-growth-cycles.aspx
Statistics New Zealand. (2013a). Measuring value added in the education and health industries. Retrieved from www.stats.govt.nz/browse_for_stats/economic_indicators/GDP/health-and-education-gdp.aspx

Structural change and New Zealand’s productivity performance 33
Statistics New Zealand. (2013b). Productivity statistics: Sources and methods (ninth edition). Retrieved from www.stats.govt.nz/browse_for_stats/economic_indicators/productivity/productivity-stats-sources-methods-ninth-ed.aspx
Szeto, K. L., & McLoughlin, S. (2008). Does quality matter in labour input? The changing pattern of labour composition in New Zealand. New Zealand Treasury Working Paper No. 08/01. Retrieved from www.treasury.govt.nz/publications/research-policy/wp/2008/08-01/
Timmer, M. P., & Szirmai, A. (2000). Productivity growth in Asian manufacturing: The structural bonus hypothesis examined. Structural Change and Economic Dynamics, 11(4), 371–392.
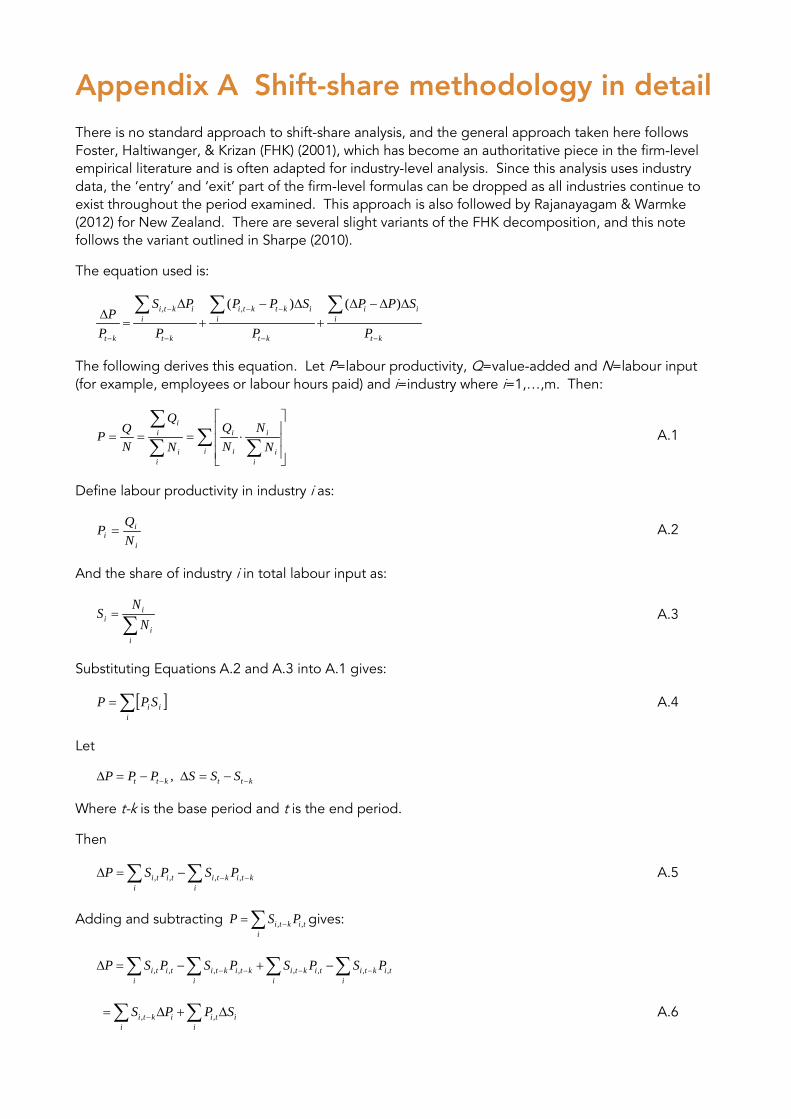
Appendix A Shift-share methodology in detail There is no standard approach to shift-share analysis, and the general approach taken here follows Foster, Haltiwanger, & Krizan (FHK) (2001), which has become an authoritative piece in the firm-level empirical literature and is often adapted for industry-level analysis. Since this analysis uses industry data, the ‘entry’ and ‘exit’ part of the firm-level formulas can be dropped as all industries continue to exist throughout the period examined. This approach is also followed by Rajanayagam & Warmke (2012) for New Zealand. There are several slight variants of the FHK decomposition, and this note follows the variant outlined in Sharpe (2010).
The equation used is:
, ,( ) ( )i t k i i t k t k i i i
i i i
t k t k t k t k
S P P P S P P SP
P P P P
− − −
− − − −
∆ − ∆ ∆ −∆ ∆∆
= + +∑ ∑ ∑
The following derives this equation. Let P=labour productivity, Q=value-added and N=labour input (for example, employees or labour hours paid) and i=industry where i=1,…,m. Then:
∑ ∑∑∑
⋅===
ii
i
i
i
i
ii
ii
NN
NQ
N
Q
NQP A.1
Define labour productivity in industry i as:
i
ii N
QP = A.2
And the share of industry i in total labour input as:
∑
=
ii
ii N
NS A.3
Substituting Equations A.2 and A.3 into A.1 gives:
[ ]∑=i
ii SPP A.4
Let
,t t k t t kP P P S S S− −∆ = − ∆ = −
Where t-k is the base period and t is the end period.
Then
, , , ,i t i t i t k i t ki i
P S P S P− −∆ = −∑ ∑ A.5
Adding and subtracting , ,i t k i ti
P S P−= ∑ gives:
, , , , , , , ,i t i t i t k i t k i t k i t i t k i ti i i i
P S P S P S P S P− − − −∆ = − + −∑ ∑ ∑ ∑
, ,i t k i i t ii i
S P P S−= ∆ + ∆∑ ∑ A.6
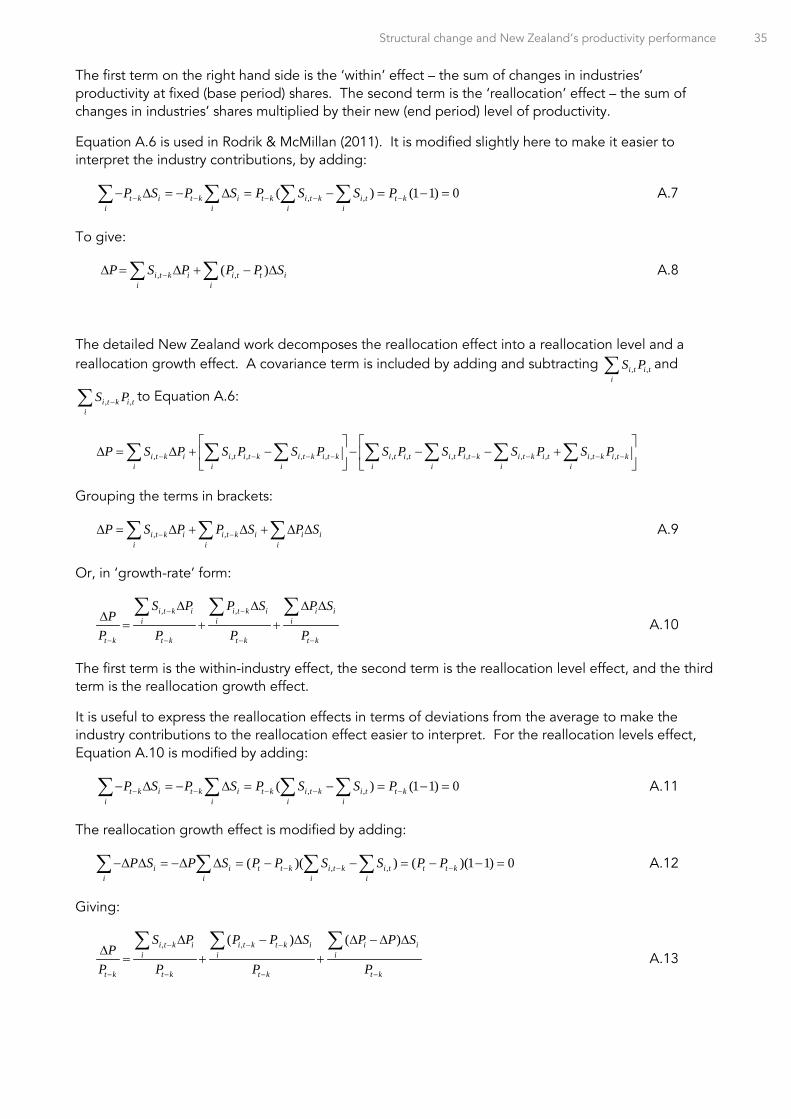
Structural change and New Zealand’s productivity performance 35
The first term on the right hand side is the ‘within’ effect – the sum of changes in industries’ productivity at fixed (base period) shares. The second term is the ‘reallocation’ effect – the sum of changes in industries’ shares multiplied by their new (end period) level of productivity.
Equation A.6 is used in Rodrik & McMillan (2011). It is modified slightly here to make it easier to interpret the industry contributions, by adding:
, ,( ) (1 1) 0t k i t k i t k i t k i t t ki i i i
P S P S P S S P− − − − −− ∆ = − ∆ = − = − =∑ ∑ ∑ ∑ A.7
To give:
, ,( )i t k i i t t ii i
P S P P P S−∆ = ∆ + − ∆∑ ∑ A.8
The detailed New Zealand work decomposes the reallocation effect into a reallocation level and a reallocation growth effect. A covariance term is included by adding and subtracting , ,i t i t
i
S P∑ and
, ,i t k i ti
S P−∑ to Equation A.6:
, , , , , , , , , , , , ,i t k i i t i t k i t k i t k i t i t i t i t k i t k i t i t k i t ki i i i i i i
P S P S P S P S P S P S P S P− − − − − − − −
∆ = ∆ + − − − − +
∑ ∑ ∑ ∑ ∑ ∑ ∑
Grouping the terms in brackets:
, ,i t k i i t k i i ii i i
P S P P S P S− −∆ = ∆ + ∆ + ∆ ∆∑ ∑ ∑ A.9
Or, in ‘growth-rate’ form:
, ,i t k i i t k i i i
i i i
t k t k t k t k
S P P S P SP
P P P P
− −
− − − −
∆ ∆ ∆ ∆∆
= + +∑ ∑ ∑
A.10
The first term is the within-industry effect, the second term is the reallocation level effect, and the third term is the reallocation growth effect.
It is useful to express the reallocation effects in terms of deviations from the average to make the industry contributions to the reallocation effect easier to interpret. For the reallocation levels effect, Equation A.10 is modified by adding:
, ,( ) (1 1) 0t k i t k i t k i t k i t t ki i i i
P S P S P S S P− − − − −− ∆ = − ∆ = − = − =∑ ∑ ∑ ∑ A.11
The reallocation growth effect is modified by adding:
, ,( )( ) ( )(1 1) 0i i t t k i t k i t t t ki i i i
P S P S P P S S P P− − −−∆ ∆ = −∆ ∆ = − − = − − =∑ ∑ ∑ ∑ A.12
Giving:
, ,( ) ( )i t k i i t k t k i i i
i i i
t k t k t k t k
S P P P S P P SP
P P P P
− − −
− − − −
∆ − ∆ ∆ −∆ ∆∆
= + +∑ ∑ ∑
A.13
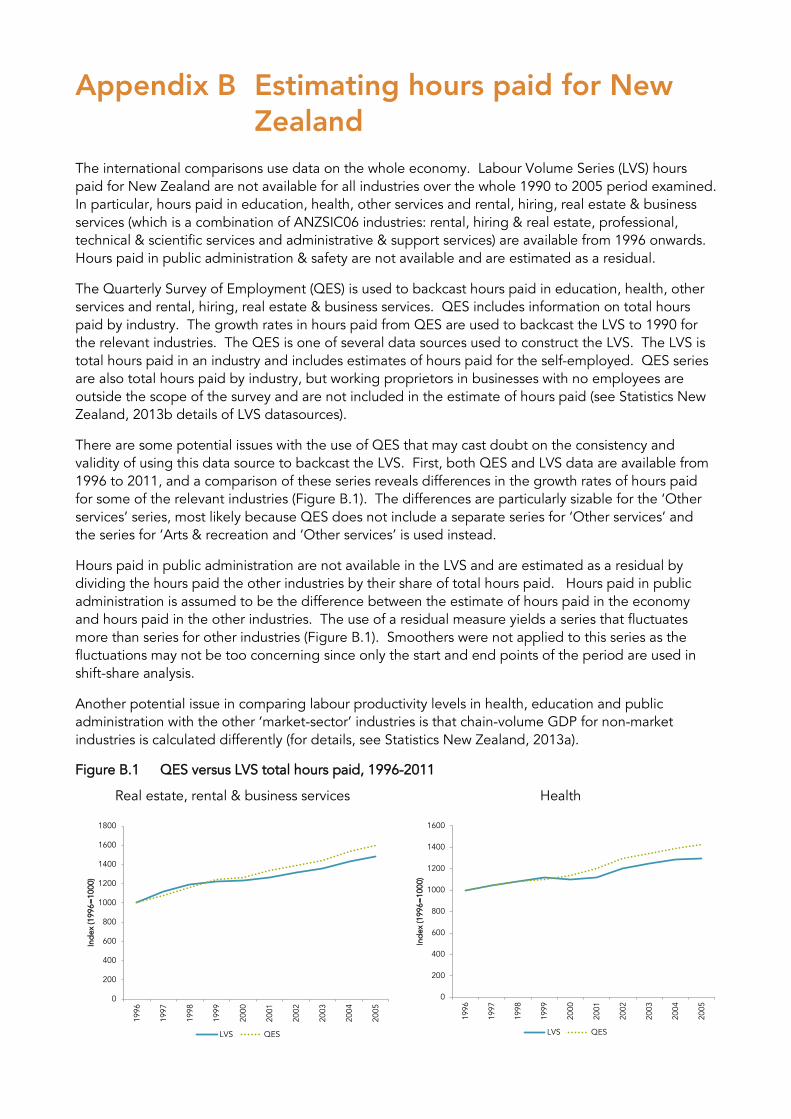
Appendix B Estimating hours paid for New Zealand
The international comparisons use data on the whole economy. Labour Volume Series (LVS) hours paid for New Zealand are not available for all industries over the whole 1990 to 2005 period examined. In particular, hours paid in education, health, other services and rental, hiring, real estate & business services (which is a combination of ANZSIC06 industries: rental, hiring & real estate, professional, technical & scientific services and administrative & support services) are available from 1996 onwards. Hours paid in public administration & safety are not available and are estimated as a residual.
The Quarterly Survey of Employment (QES) is used to backcast hours paid in education, health, other services and rental, hiring, real estate & business services. QES includes information on total hours paid by industry. The growth rates in hours paid from QES are used to backcast the LVS to 1990 for the relevant industries. The QES is one of several data sources used to construct the LVS. The LVS is total hours paid in an industry and includes estimates of hours paid for the self-employed. QES series are also total hours paid by industry, but working proprietors in businesses with no employees are outside the scope of the survey and are not included in the estimate of hours paid (see Statistics New Zealand, 2013b details of LVS datasources).
There are some potential issues with the use of QES that may cast doubt on the consistency and validity of using this data source to backcast the LVS. First, both QES and LVS data are available from 1996 to 2011, and a comparison of these series reveals differences in the growth rates of hours paid for some of the relevant industries (Figure B.1). The differences are particularly sizable for the ‘Other services’ series, most likely because QES does not include a separate series for ‘Other services’ and the series for ‘Arts & recreation and ‘Other services’ is used instead.
Hours paid in public administration are not available in the LVS and are estimated as a residual by dividing the hours paid the other industries by their share of total hours paid. Hours paid in public administration is assumed to be the difference between the estimate of hours paid in the economy and hours paid in the other industries. The use of a residual measure yields a series that fluctuates more than series for other industries (Figure B.1). Smoothers were not applied to this series as the fluctuations may not be too concerning since only the start and end points of the period are used in shift-share analysis.
Another potential issue in comparing labour productivity levels in health, education and public administration with the other ‘market-sector’ industries is that chain-volume GDP for non-market industries is calculated differently (for details, see Statistics New Zealand, 2013a).
Figure B.1 QES versus LVS total hours paid, 1996-2011
Real estate, rental & business services
Health
0
200
400
600
800
1000
1200
1400
1600
1800
1996
1997
1998
1999
2000
2001
2002
2003
2004
2005
Ind
ex (1
996=
1000
)
LVS QES
0
200
400
600
800
1000
1200
1400
1600
1996
1997
1998
1999
2000
2001
2002
2003
2004
2005
Ind
ex (1
996=
1000
)
LVS QES
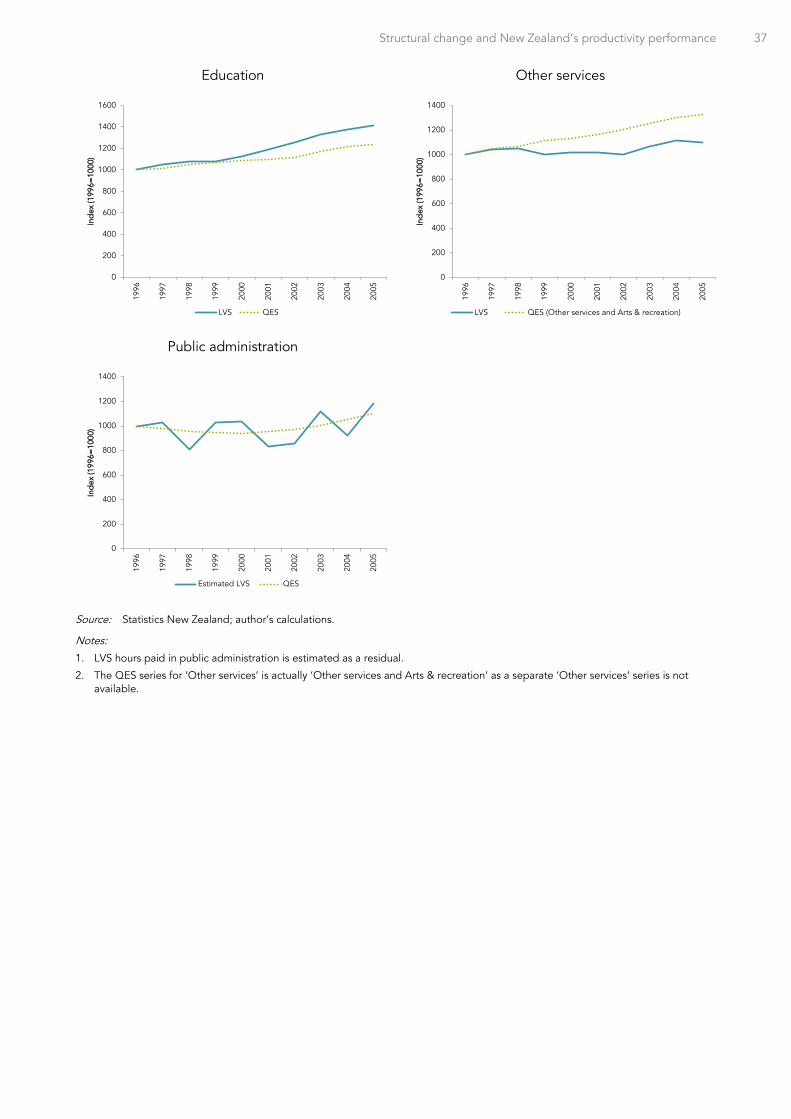
Structural change and New Zealand’s productivity performance 37
Education
Other services
Public administration
Source: Statistics New Zealand; author’s calculations.
Notes:
1. LVS hours paid in public administration is estimated as a residual.
2. The QES series for ‘Other services’ is actually ‘Other services and Arts & recreation’ as a separate ‘Other services’ series is not available.
0
200
400
600
800
1000
1200
1400
1600
1996
1997
1998
1999
2000
2001
2002
2003
2004
2005
Ind
ex (1
996=
1000
)
LVS QES
0
200
400
600
800
1000
1200
1400
1996
1997
1998
1999
2000
2001
2002
2003
2004
2005
Ind
ex (1
996=
1000
)
LVS QES (Other services and Arts & recreation)
0
200
400
600
800
1000
1200
1400
1996
1997
1998
1999
2000
2001
2002
2003
2004
2005
Ind
ex (1
996=
1000
)
Estimated LVS QES
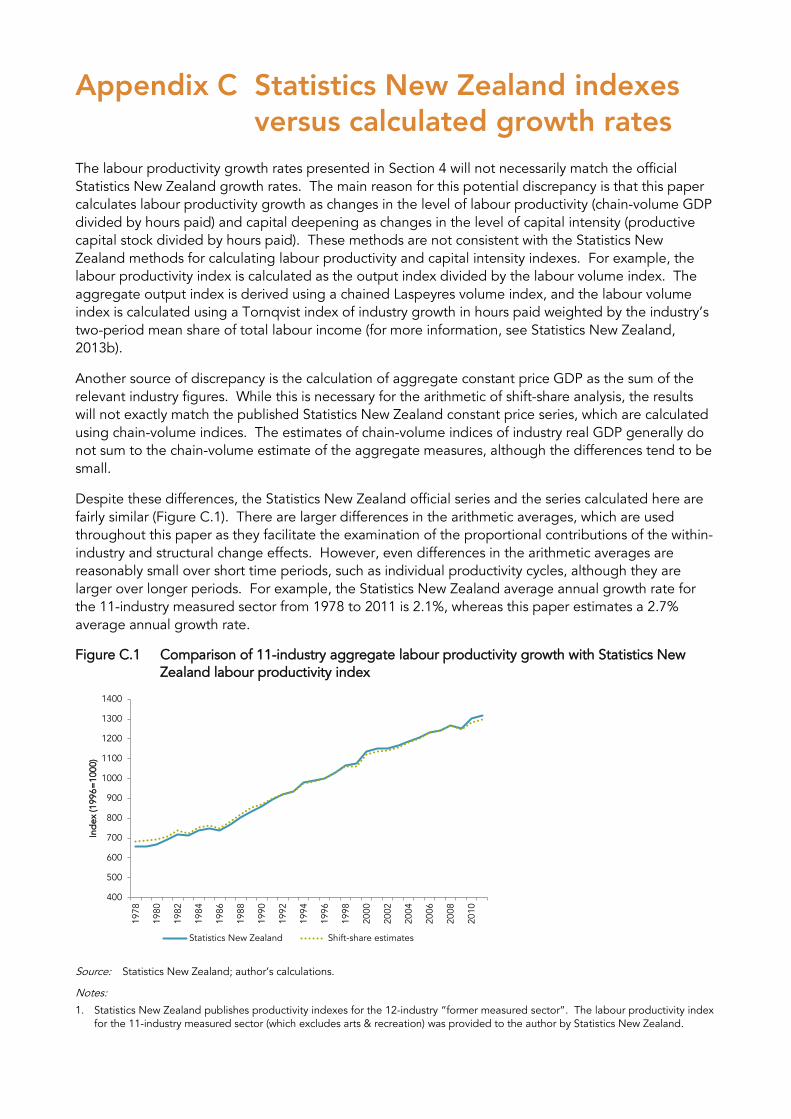
Appendix C Statistics New Zealand indexes versus calculated growth rates
The labour productivity growth rates presented in Section 4 will not necessarily match the official Statistics New Zealand growth rates. The main reason for this potential discrepancy is that this paper calculates labour productivity growth as changes in the level of labour productivity (chain-volume GDP divided by hours paid) and capital deepening as changes in the level of capital intensity (productive capital stock divided by hours paid). These methods are not consistent with the Statistics New Zealand methods for calculating labour productivity and capital intensity indexes. For example, the labour productivity index is calculated as the output index divided by the labour volume index. The aggregate output index is derived using a chained Laspeyres volume index, and the labour volume index is calculated using a Tornqvist index of industry growth in hours paid weighted by the industry’s two-period mean share of total labour income (for more information, see Statistics New Zealand, 2013b).
Another source of discrepancy is the calculation of aggregate constant price GDP as the sum of the relevant industry figures. While this is necessary for the arithmetic of shift-share analysis, the results will not exactly match the published Statistics New Zealand constant price series, which are calculated using chain-volume indices. The estimates of chain-volume indices of industry real GDP generally do not sum to the chain-volume estimate of the aggregate measures, although the differences tend to be small.
Despite these differences, the Statistics New Zealand official series and the series calculated here are fairly similar (Figure C.1). There are larger differences in the arithmetic averages, which are used throughout this paper as they facilitate the examination of the proportional contributions of the within-industry and structural change effects. However, even differences in the arithmetic averages are reasonably small over short time periods, such as individual productivity cycles, although they are larger over longer periods. For example, the Statistics New Zealand average annual growth rate for the 11-industry measured sector from 1978 to 2011 is 2.1%, whereas this paper estimates a 2.7% average annual growth rate.
Figure C.1 Comparison of 11-industry aggregate labour productivity growth with Statistics New Zealand labour productivity index
Source: Statistics New Zealand; author’s calculations.
Notes:
1. Statistics New Zealand publishes productivity indexes for the 12-industry “former measured sector”. The labour productivity index for the 11-industry measured sector (which excludes arts & recreation) was provided to the author by Statistics New Zealand.
400
500
600
700
800
900
1000
1100
1200
1300
1400
1978
1980
1982
1984
1986
1988
1990
1992
1994
1996
1998
2000
2002
2004
2006
2008
2010
Ind
ex (1
996=
1000
)
Statistics New Zealand Shift-share estimates