study assessment of technologies in view of zero-emission iwt
TRANSCRIPT

Study
“Assessment of technologies
in view of zero-emission
IWT“
Part of the overarching study
“Financing the energy transition
towards a zero-emission Euro-
pean IWT sector“

Assessment of technologies in
view of zero-emission IWT
Report No. 2293
October 2020
Entwicklungszentrum für Schiffstechnik und Transportsysteme e. V. DST – Development Centre for Ship Technology and Transport Systems
Oststr. 77
47057 Duisburg
Germany
Tel. +49 203 99369-0
Fax +49 203 99369-70
e-mail [email protected]
web www.dst-org.de
Member of the German Federation of Industrial Research Associations
(Arbeitsgemeinschaft industrieller Forschungsvereinigungen
“Otto von Guericke” e. V.)
Member of the Johannes-Rau-Forschungsgemeinschaft e. V.
Institute at the University Duisburg-Essen
Member of the International Towing Tank Conference
Member of the Center of Maritime Technologies e. V.

Imprint
Contracting Authorities: Eidgenössisches Departement für Umwelt, Verkehr,
Energie und Kommunikation
Bundesamt für Verkehr (BAV)
Abteilung Sicherheit / Sektion Schifffahrt
Mühlestraße 6
3063 ITTIGEN
SCHWEIZ
Contractor: DST – Development Centre for Ship Technology and
Transport Systems
Oststraße 77
47057 Duisburg
Tel.: +49-203 99369-0 | Fax: +49-203 99369-70
[email protected] | www.dst-org.de
Authors: Friederike Dahlke-Wallat
Benjamin Friedhoff
Sophie Martens
Copyright: Federal Authorities of the Swiss Confederation.
Copyright and any other rights relating to texts, illustrations, photographs or
any other data available on the study “Assessment of technologies in view of
zero-emission IWT” are the exclusive property of the Federal Office of
Transport (FOT) or of any other expressly mentioned owners.
Any reproduction requires the prior written consent of the copyright holder.
All rights reserved

Table of Contents
1 INTRODUCTION 9
2 DESCRIPTION OF THE SITUATION IN 2015 12
2.1 DIVERSITY OF THE FLEET 14
2.2 OPERATIONAL PROFILES 15
2.3 RESULTS FROM THE H2020 PROMINENT PROJECT 17
3 GREENING TECHNOLOGIES 22
3.1 ENERGY CARRIERS 23
3.1.1 HYDROGEN 25
3.1.2 METHANOL 25
3.1.3 DROP-IN FUELS GTL, HVO AND PTL 27
3.1.4 BATTERY 29
3.1.5 LNG 31
3.2 EMISSION REDUCTION POTENTIAL 33
3.3 ENERGY CONVERTERS 34
3.3.1 STAGE V AND EURO VI ENGINES 34
3.3.2 GAS AND GAS-ELECTRIC PROPULSION CONCEPTS 35
3.3.3 HYDROGEN IN COMBUSTION ENGINES 39
3.3.4 BATTERY ELECTRIC DRIVES 40
3.3.5 FUEL CELL SYSTEMS 42
3.4 ENERGY EFFICIENCY 46
4 COST FIGURES AND PREDICTIONS 47
4.1 INVESTMENT 48
4.2 CAPITAL COSTS AND DEPRECIATION 50
4.3 OPERATIONAL COSTS 51
4.4 FUELS 51
4.5 MAINTENANCE 53
5 FLEET FAMILIES 55
5.1 MAIN CHARACTERISTICS OF THE FLEET FAMILIES 55
5.2 FLEET DEVELOPMENT 56
5.3 TECHNOLOGIES DIFFERENTIATED TO THE FLEET FAMILIES 57
5.3.1 EXEMPLARILY TYPE SHIPS PER FLEET FAMILY 64

6 TRANSITION PATHWAYS 85
6.1 REDUCTION OF EMISSIONS BY 35 % UNTIL 2035 85
6.2 EMISSION REDUCTION TARGET 2050 86
6.2.1 SCENARIO HVO 80 % REDUCTION 89
6.2.2 SCENARIO 80 % REDUCTION 89
6.2.3 SCENARIO HVO 90 % REDUCTION 90
6.2.4 SCENARIO 90 % REDUCTION 91
6.2.5 SCENARIO 98 % REDUCTION 92
6.2.6 SCENARIO 100 % REDUCTION 92
6.3 COSTS OF THE SCENARIOS 93
7 SUMMARY, CONCLUSIONS AND OUTLOOK 95
8 BIBLIOGRAPHY 97

Assessment of Technologies in view of zero-emission IWT
Report No. 2293
6
List of abbreviations
AC Alternating Current
AFOLU Agriculture, Forestry and Other Land-Use
BTL Biomass to Liquid
CAPEX Investment Costs
CDNI Convention Relative a la Collecte, au Depôt et a la Recep-
tion des Dechets Survenant en Navigation Rhenane et In-
tertieure (Convention on the Collection, Deposit and Re-
ception of Waste Generated During Navigation on the
Rhine and Other Inland Waterways)
DC Direct Current
DNV GL Det Norske Veritas
DPF Diesel Particulate Filter
FC Fuel Cell
GHG Greenhouse Gas
GTL Gas-to-Liquid
HT High Temperature
HVO Hydrotreated Vegetable Oil
ICE Internal Combustion Engine
IWT Inland Waterway Transport
IPCC Intergovernmental Panel on Climate Change
LCO Lithium Cobalt Oxide
LFP Lithium Iron Phosphate
LMO Lithium Manganese Oxide
LNG Liquefied Natural Gas
LTO Lithium Titanate Oxide Anode
LT Low Temperature
NCA Lithium Nickel Cobalt Aluminium Oxide
NCM Lithium Nickel Cobalt Manganese Oxide
OEM Original Equipment Manufacturer
OPEX Operational Costs
PEM FC Proton Exchange Membrane Fuel Cell
PM Particulate Matters
PTL Power to Liquid
PTX Power to X
RED II Renewable Energy Directive

Assessment of Technologies in view of zero-emission IWT
Report No. 2293
7
ROI Return on Investment
RPM Revolutions per Minute
SCR Selective Catalytic Reduction
SULEV Super Ultra-Low Emissions Vehicle
TCS Tank Connection Space
TCO Total Cost of Ownership
TRL Technological Readiness Level
TtW Tank to Wake
US EPA United States Environmental Protection Agency
VDMA Verband Deutscher Maschinen- und Anlagenbau (Ger-
man Mechanical Engineering Industry Association)
WEO World Energy Outlook
XTL X to Liquid


Assessment of Technologies in view of zero-emission IWT
Report No. 2293
9
1 Introduction
Against the background of the expected climate change and the requirements
of society as regards a clean and green transport, also for Inland Waterway
Transport (IWT) a greening of the fleet, i.e. a transition towards zero-emis-
sions is desired. Concretely, greenhouse gas and air pollutant emissions shall
be reduced by 35 % (compared to 2015) until 2035 and almost completely elim-
inated until 2050. Given the since many decades (almost a century) estab-
lished, reliable and proven diesel technology and the long life-cycles of inland
vessels this claim constitutes an extraordinary challenge. If combustion en-
gines are ruled out it requires nothing less than a complete transformation of
the whole propulsion technology (drive system) of the European IWT-fleet and
hence a complete system change. It’s within its nature, that a step of such di-
mension requires deep and sound preparations as well as time.
Much of the necessary information needed for such decisions and assess-
ments, e.g. as regards the technologies themselves, their impacts, and costs,
especially for future scenarios, are presently not available or incomplete.
Therefore, it is self-evident, that the investigations reported herein can only
provide a first, preliminary step of the intended transformation process which
has to be continuously further developed within the next years and decades
based on the prospectively available energy sources and technological devel-
opments and related costs. In the light of the mentioned requirements and
frame conditions the investigations cannot provide ultimate and final assess-
ments. They rather provide well-grounded and justified estimations based on
available knowledge and information.
The advantages of ships in transport are well known. Based on hydrostatic
buoyancy, large masses can be moved slowly but with very modest power.
While maritime transport is almost without alternative for large quantities of
goods, inland navigation competes with rail and road transport. The low in-
frastructure costs and emissions contribute to the reputation of inland navi-
gation as a gentle mode of transport. The high energy efficiency, which is ex-
pressed e.g. in the energy requirement per tonne-kilometre, is also accompa-
nied by low CO2 emissions.
At the same time, inland navigation vessels are extremely durable. This spe-
cial feature is generally assessed positively in a life cycle analysis or ecological
efficiency analysis. However, this also leads to the conclusion that the renewal
rate of the engines is low, which in turn results in disproportionately high
emissions of nitrogen oxides and particulate matter. Although the engines are
renewed during the course of a ship's life, with cycles of typically 15 to 20
years, they are renewed less frequently than in road transportation. Older en-
gines have even longer service lives. As a result, a large majority of inland
waterway vessels do not operate with the latest engine technology and

Assessment of Technologies in view of zero-emission IWT
Report No. 2293
10
without exhaust after-treatment systems. The small quantities of marine en-
gines lead to longer product cycles and thus additionally to a delayed spread
of new technologies.
Considerable efforts are required to maintain the position as the most envi-
ronmentally friendly mode of transport in the long term. Since the beginning
of 2019 (2020 for engines with 300 kW or more output), stricter exhaust emis-
sion limits apply to new inland waterway engines placed on the market in ac-
cordance with Regulation (EU) 2016/1628, which, at least for large engines, are
only achieved with particulate filters and SCR-systems. SCR stands for selec-
tive catalytic reduction. In this process, nitrogen oxides are converted into wa-
ter vapour and nitrogen in special catalytic converters with the addition of an
aqueous urea solution. Proof of compliance with these Stage V limits requires
a dedicated type approval for engines, which is not only time-consuming but
also costly in view of the small market. In addition, the type approval includes
the specification of the fuel. Therefore, it is important to consider the (future)
use of non-fossil drop-in fuels like HVO and PTL, which can be used as blends
or pure fuels, as soon as possible. Drop-in fuels are a synthetic and widely in-
terchangeable substitute for conventional petroleum-derived hydrocarbons
as further described in 3.1.5. Especially GTL (Gas-to-Liquid) and HVO (Hy-
drotreated Vegetable Oil) standardized by EN 15940 are considered important
for inland navigation among the synthetic fuels.
Compared to other modes of transport, inland shipping still has considerable
capacity reserves for additional transport performance on most waterways,
which makes the desired shift of freight traffic to relieve the roads possible.
At the same time, there is a high inter- and intramodal cost pressure. Measures
to improve the environmental compatibility of inland navigation must there-
fore be developed and implemented in a complex field of tension. Essential
boundary conditions are the consideration of the existing fleet and economic
efficiency. The many small entrepreneurs, who operate the majority of the
fleet as private owners and suffer from the lack of available credit, could not
comply with excessively strict legislation, so that the desired modal shift
would be jeopardised. Nor is it possible to modernise the fleet with public
money alone. Thus, the sustainable improvement of emissions requires a care-
ful analysis of the overall situation and a multitude of initiatives and solutions.
Almost every ship is different from a technical point of view. The differences
are based on the respective transport task of the ship and the boundary con-
ditions under which the transport service is to be provided. As a result of the
diversity of the fleet, very different measures can be target-oriented.
In the following chapters, the energy carriers and technologies for the corre-
sponding energy conversion are first presented and analysed with regard to
their suitability for inland navigation. The focus is put on a set of technologies
with high technological readiness, which was agreed upon between the CCNR,
the Swiss delegation and DST. Technologies like battery cell types with higher
energy density, ammonia as an energy carrier for combustion engines or fuel

Assessment of Technologies in view of zero-emission IWT
Report No. 2293
11
cells and more exotic solutions are being researched and developed. They
might contribute to the energy transition in IWT at a later stage. However,
they are not considered mature enough to be used for the cost predictions at
this time. Further on, the fleet structure and the boundary conditions of inland
navigation are presented. Due to the limited energy density and the -at least
in the medium term- weakly developed infrastructure of alternative energy
carriers, the importance of the operational profiles is also discussed. After-
wards, the cost figures for investment and operation today and forecasted for
the next 30 years are discussed. The fleet families defined in the H2020 project
PROMINENT are expanded slightly and the technologies are assessed for these
ship types. For each of them a possible zero-emission system and the related
investment and operational costs are described. Afterwards, several exem-
plary chains of measures for each segment of the fleet were iteratively chosen
to meet the emission reduction goals by 2035 and 2050.
The Mannheim Declaration clearly specifies the 35 % reduction target for air
pollutants and CO2 emissions by 2035 compared to 2015. For 2050 the target to
“largely eliminate greenhouse gases and other pollutants” leaves more room
for interpretations. Therefore, for 2050 the costs are estimated for chains of
measures with different ambition levels, i.e. proportions of more or less ad-
vanced technologies. While this study was finalized, the ambition was made
concrete to an “emission reduction of at least 90 %”.
Putting the focus on air pollutants, emissions can largely be reduced by a fleet
modernisation with modern combustion engines with exhaust gas aftertreat-
ment. In case climate-neutrality is aimed at, the complexity of measures and
evaluation criteria increases. There is a broad consensus that the use of fossil
fuels should be avoided in the long term. However, the possible role of biofuels
is under discussion. With second generation biofuels like HVO used in com-
bustion engines with aftertreatment, the local emissions of CO2 and air pollu-
tants are almost the same as with fossil diesel. Nevertheless, biofuels are con-
sidered carbon-neutral as the amount of carbon dioxide that is absorbed by
the feedstock plants during the next growing season is equal to the carbon
dioxide that is released during the combustion process as per IPCC (Volume 4,
Chapter 5, 5.2.4 Non-CO2 greenhouse gas emissions from biomass burning [1]).
The source of these biofuels is similar to that of fossil fuels except that the
process is much faster. Usually, today the upstream chain of these fuels includ-
ing production and transport are not ideal and limiting the climate-neutrality.
This is also addressed in the renewable energy directive (RED II) which is not
considered further in detail within the current report since so far only a tank-
to-wake (TtW) perspective is used. Additionally, the quantity of sustainable
feedstocks is limited, so that a global replacement of fossil fuels is not likely
until 2050. Advanced zero-emission technologies like batteries and fuel cells
require extensive investments for infrastructure ashore and the installations
aboard while also still facing sustainability challenges in the upstream chains
or at the end of lifecycles.

Assessment of Technologies in view of zero-emission IWT
Report No. 2293
12
2 Description of the situation in 2015
The European inland waterway fleet in general is best explained by the wa-
terway network, as the ship’s size is based on the dimensions of the water-
ways, locks and bridges. European inland waterways have a total length of
41,500 kilometres, divided into navigable rivers and lakes and artificial canals.
This transport network is divided by the European Conference of Ministers of
Transport (ECMT) into seven waterway classes with additional subgroups as
indicated in the table below.
Table 1: Classification of the European Inland Waterways into CEMT-Classes
Motor Vessels Pushed Convoys Clear-ance height
Class Length Breadth Depth Length Breadth Depth
[m] [m] [m] [m] [m] [m] [m]
I 38.5 5.05 1.8 – 2.2 4.0
II 50 – 55 6.60 2.5 4.0 – 5.0
III 67 – 80 8.20 2.5 4.0 – 5.0
IV 80 – 85 9.50 2.5 85 9.5 2.5 – 2.8 5.25
Va 95 – 110 11.40 2.5 – 2.8 95 11.4 2.5 – 4.5 5.25
Vb 172 11.4 2.5 – 4.5 5.25
VIa 95 22.8 2.5 – 4.5 7.0
VIb 140 15.0 185 22.8 2.5 – 4.5 7.0
VIc 270 195
22.8 33.0
2.5 – 4.5 9.1
VII 285 33.0 2.5 – 4.5 9.1
The western European market is characterised by a relatively old fleet, which
can be seen in Figure 1 provided by the CCNR secretariat (based on the IVR
data base [2]). Figure 1 shows the commissioning activity for the Rhine fleet.

Assessment of Technologies in view of zero-emission IWT
Report No. 2293
13
It should be mentioned that floating equipment is excluded from the consid-
erations in this report.
Figure 1: Commissioning activity for the Rhine fleet [2]
Figure 2 is exemplarily showing the age structure of the German fleet. Partic-
ularly older, smaller vessels are sometimes operated for more than 100 years.
Therefore, retrofitting plays a significant role in IWT. In accordance with the
changing transport tasks and other boundary conditions, these ships are
sometimes significantly altered. Initially, dumb barges were converted to mo-
tor vessels. Today, the vessels are lengthened or even widened and converted
for carrying barges in coupled convoys. The fleet is correspondingly heteroge-
neous in terms of ship dimensions. Considering the propulsion units, the vari-
ety once again increases significantly.
Figure 2: Age development of the German inland fleet [3]
In Figure 3 the commissioning activity for the Danube is shown (plot provided
by CCNR secretariat based on the Danube Commission market observation re-
port [4]). The Danube fleet has a high number of vessels that were built be-
tween 1960 and 1990. Since the year 2000 not many new vessels were built for
the Danube.

Assessment of Technologies in view of zero-emission IWT
Report No. 2293
14
Figure 3: Number of vessels per year of construction in Danube countries [4]
2.1 Diversity of the fleet
To showcase the fleet diversity, the push boats are analysed exemplarily. The
following figure shows the structure of the European fleet of push boats. It can
be seen that the vessels can be classified according to the installed power,
length and number of propellers installed. The wide spread of classes neces-
sary to classify this segment of the fleet makes the diversity obvious.
Figure 4: Installed power, number of propellers and length distribution of the European push boat fleet [2]
The different motorization suggests that the engine rooms are also designed
very differently. Different numbers of propellers also mean that there are
many differently designed aft sections. It can be concluded that there can be
no standard solution for large parts of the fleet, but that each ship requires an
individual solution.

Assessment of Technologies in view of zero-emission IWT
Report No. 2293
15
In addition, the push boats operate in very diverse areas. Some only operate
on large rivers such as the Rhine, others operate mainly in the canal network
and there are fixed as well as highly variable routes that are used. This wide
variety of different sailing areas and associated operational profiles also con-
tributes to the fact that each vessel has to be equipped with a more individual
propulsion solution.
The next figure shows the age structure of the push boat fleet. Here too, a wide
spread can be seen.
Figure 5: Age classes for European push boats [2]
The age of the vessels also has an influence on the installation options for
zero-emission technologies. For example, the design of the engine room or
the investment options for an older ship can be decisive.
2.2 Operational profiles
While maritime transport often operates around the clock with largely con-
stant operating conditions of the propulsion system, the boundary conditions
of inland navigation result in a complex operational profile. First of all, a dis-
tinction must be made here according to the type of operation, i.e. the maxi-
mum daily operating time of a ship depending on crew size and equipment, in
accordance with the Inland Waterways Vessel Inspection Regulation or the
Rhine Vessel Personnel Regulation. Then the area of operation plays an im-
portant role. While only a small part of the installed capacity is usually used
in the canal network and in downstream navigation, the power requirement
is for example significantly higher on the Rhine in upstream navigation. How-
ever, more recent studies within the framework of the EU project PROMINENT
[5] show that, contrary to previous assumptions, less than half of the available
drive power is often used when sailing against the direction of flow. Figure 6
shows operating profiles of a container ship during five up and down voyages
between Antwerp and Mainz. Nevertheless, the vessels are not generally

Assessment of Technologies in view of zero-emission IWT
Report No. 2293
16
overpowered, but the power reserve can be necessary and safety-relevant for
local and rarely occurring discharge conditions or the prescribed stopping ca-
pacity.
Figure 6: Operational profile of a container ship during 10 voyages in ARA-Rhine traffic [6]
Figure 7 shows the variation of water depth and current velocity at mean wa-
ter level for a 70 km long segment of the Middle Rhine. The strong change in
flow velocity is clearly visible. In addition, there is the skipper's way of driv-
ing, a high variability of loading cases and the fact that in inland navigation
manoeuvring is virtually normal operation. Thus, even on the same route,
voyages with the same ship are difficult to compare. Large differences be-
tween the temporary and average energy and power requirements are possi-
ble. However, many vessels have significant reserve power installed today.
This resulted from desired longer service intervals with low utilization and
the moderate costs of conventional direct drives. Facing the need to improve
environmental performance and the size and costs of advanced technologies,
it is expected that on average the installed power can be reduced by approxi-
mately 25 % for new drive trains. The characteristics of electric drives, e.g.
with high torque of the electric motors and batteries for peak shaving, are
helping in critical situations.
Figure 7: Environmental conditions at medium flow on a section of the Middle Rhine [6]

Assessment of Technologies in view of zero-emission IWT
Report No. 2293
17
2.3 Results from the H2020 PROMINENT project
As proposed, the fleet families were taken from the project PROMINENT and
supplemented by the fleet families “Daytrip Cruise Vessels” and “Ferries”. The
fleet families in the PROMINENT project were set up according to the following
scheme:
Different classification systems and data sources have been used for the defi-
nition of the fleet families in PROMINENT [5]:
“For motor cargo vessels, the length has been used to classify the various vessel
types.
The CEMT classification system has been used as a basis for the division of the
smaller vessel types. The motor cargo vessels of CEMT class I, II and III (mainly
below 80 m) are considered of regional importance and have been included into
one family. No distinction is made here between dry and liquid cargo vessels.
For the larger and newer vessel sizes, the newer RWS classification system (RWS
2010) has been used. This classification system has grouped more or less com-
parable vessels into 12 classes. The most representative classes in Europe have
been identified using vessel traffic counts. One of the most common vessel types
used in Europe is the Large Rhine Vessel, with a reference vessel dimension of
110 metre in length and 11.4 metre in width. This length has been used to identify
the lower limit of the largest vessel sizes. A distinction is made between dry and
liquid cargo vessels. Therefore, all the dry cargo motor vessels equal to or
above 110 m have been included into one family and all the liquid cargo motor
vessels equal to or above 110 m have been included into another fleet family.
The remaining category (i.e. vessels between 80 – 109 m) has been included
into the other fleet families for motor cargo vessels. A distinction is also made
here between dry and liquid cargo vessels.
For push boats, the vessels have been classified based on the total propulsion
power. According to the vessel traffic counts in Europe (see section 2.2 and 2.3),
the most common push barge formations (following the RWS classification sys-
tem) are:
• Pusher with 1 Europa II barge;
• Pusher with 2 Europa II barges;
• Pusher with 4 Europa II barges;
• Pusher with 6 Europa II barges.
Pusher with 1 or 2 Europa II barges are more common on specific waterways
(e.g. on the North-South corridor between the Netherlands and Belgium),
whereas pusher with 4 Europa II barges or more travel on larger waterways
(e.g. Rhine).
The pusher with one Europa II barge has in general a propulsion power around
500 kW. In the study by PANTEIA et al. (2013) ‘Contribution to impact assess-
ment of measures for reducing emissions of inland navigation’ a range between

Assessment of Technologies in view of zero-emission IWT
Report No. 2293
18
1,000 - 2,000 kW was used for a pusher with 2 Europa II barges. A total propul-
sion power above 2,000 kW is more common for pushers with 4 Europa II barges
or more. The other smaller pushed convoys have in general a total propulsion
power below 500 kW.
In this study, the push boats have been divided into the following categories:
• Push boats below 500 kW (total propulsion power);
• Push boats between 500 - 2,000 kW (total propulsion power);
• Push boats above 2,000 kW (total propulsion power).
Coupled convoys have been classified into one family as the large majority of
them are class Va vessels sailing with a Europe II lighter. Passenger vessels have
been classified into one family as well and include hotel and cruise vessels.”
The fleet analysis came to the following distribution of the fleet families within
the European inland waterway fleet (see Figure 8):
Figure 8: Fleet structure [5]
Figure 9 shows that unregulated engines have still a big share in the current
fleet. Figure 10 shows how much fuel is consumed by the fleet family per ves-
sel per year while Figure 11 shows the share per fleet family of the overall fuel
consumption.
While the numbers for the installed power only include the main propulsion
engines, it is assumed that the fuel consumption also includes the consump-
tion of auxiliary power generators for cargo conditioning, pumps,

Assessment of Technologies in view of zero-emission IWT
Report No. 2293
19
accommodation and thrusters etc.. The overall fuel consumption also reflects
the share of the overall emission as there is no significant number of zero-
emission concepts operating up to now.
These findings are very important for the later development of recommenda-
tions for actions related to the fleet, as it becomes clear that many vessels op-
erate with a very low emission standard.
Figure 9: Engine type per main fleet family [5]
Figure 10: Average fuel consumption per vessel per year [5]

Assessment of Technologies in view of zero-emission IWT
Report No. 2293
20
Figure 11: Share of fuel consumption [5]
Table 2: Number of vessels per fleet family [5]
Fleet families identified in PROMINENT Total number of operational vessels in Eu-
rope
Passenger vessels (hotel/cruise vessels) 2,553
Push boats < 500 kW (total engine power) 890
Push boats 500-2,000 kW (total engine power)
520
Push boats ≥ 2,000 kW (total engine power)
36
Motor vessels dry cargo ≥ 110 m length 610
Motor vessels liquid cargo ≥ 110 m length 602
Motor vessels dry cargo 80-109 m length 1,802
Motor vessels liquid cargo 80-109 m length
647
Motor vessels < 80 m length 4,463
Coupled convoy (mainly class Va+Europe II lighter)
140
Total 12,263
Furthermore, from the engines’ emission standard distribution (see Figure 9)
and the average fuel consumption per fleet family (see Figure 10) and the

Assessment of Technologies in view of zero-emission IWT
Report No. 2293
21
corresponding number of vessels the emissions in 2015 were determined.
Those are shown in the following Table 3. In average for all engines before
CCNR 1, the emission standard US EPA TIER 1 [7] is assumed [8]. In more detail
the derived emission factors differentiated per fleet family are given in Table
4. Emission data for the Danube fleet has been developed based on data from
CDNI and PROMINENT, in consultation with the Danube Commission and
ViaDonau.
Table 3: Estimated emissions of the European fleet in 2015 (calculations based on [9])
2015
CO2 NOx PM
[t] [t] [t]
4,281,650 47,307 2,386
Table 4: Emission factors differentiated per fleet family for 2015 [9]; for CO2 always the same value of 720 g/kWh is assumed (see also section 3.2)
Fleet Family Emission factors [g/kWh]
NOx PM
Passenger vessels (hotel/cruise vessels) 9.22 0.48
Push boats < 500 kW (total engine power) 9.75 0.52
Push boats 500-2,000 kW (total engine power) 9.07 0.48
Push boats ≥ 2,000 kW (total engine power) 8.26 0.41
Motor vessels dry cargo ≥ 110 m length 8.13 0.42
Motor vessels liquid cargo ≥ 110 m length 7.47 0.35
Motor vessels dry cargo 80-109 m length 9.53 0.51
Motor vessels liquid cargo 80-109 m length 8.39 0.41
Motor vessels < 80 m length 9.63 0.52
Coupled convoys 7.77 0.38
Ferries 10.30 0.54
Daytrip and small cruise vessels 10.30 0.54

Assessment of Technologies in view of zero-emission IWT
Report No. 2293
22
3 Greening Technologies
In the context of the finite resources of fossil fuels and the energy transition
that has necessarily been initiated in the meantime, as well as climate protec-
tion and the discussion about air pollutants emitted by diesel engines, numer-
ous alternatives are being discussed and examined for inland navigation. In
general, fleet modernisation and greening are motivated by several aspects:
• Addressing climate change by reduced emissions of fossil CO2
(global/societal).
• Improved air quality and reduced health related risks by reduced emis-
sions of air pollutants (regional/societal and individual).
• Reduced operating costs by increased efficiency (owners/operators).
At the same time several barriers to reach the desired greening exist:
• Most greening measures are associated with significant investments.
• Complexity of the systems rises, which also increases maintenance
costs.
• Energy density of alternative energy carriers requires more space
and/or more frequent bunkering.
• Bunkering infrastructure for alternative energy carriers hardly exists.
• Future developments of costs for energy carriers and technologies as
well as development of infrastructure are extremely uncertain.
• Today most emission reduction technologies increase the operating
costs. No Return on Investment (ROI) can be achieved compared to the
current cost structure for conventional diesel drives.
• For most zero-emission technologies the maturity of the technologies
themselves can possibly also lead to a barrier as they are not yet
broadly in use (fuel cells) or even developed to a satisfying readiness
level (battery capacity related to weight and space).
• To avoid an excessive climate change, the energy transition has to hap-
pen while there are still large resources of fossil fuels left. Therefore,
the balance of supply and demand will not drive the transition suffi-
ciently with increasing costs for fossil fuels.
• The production of green fuels requires sufficient resources of sustaina-
ble feedstocks and/or large amounts of cheap renewable electricity.
For the long-term conversion of the fleet, diesel-electric propulsion systems
play an important role. Around 200 to 300 diesel-electric vessels are currently
in operation on European inland waterways. The electric motors are well
suited to the characteristics of the propeller and they can be supplied with

Assessment of Technologies in view of zero-emission IWT
Report No. 2293
23
energy from different sources. A complete avoidance of exhaust emissions
during ship operation is possible with the energy supply from batteries and/or
fuel cells.
The first battery-powered Rhine ferry Godesberg - Niederdollendorf was built
in Duisburg as early as 1908. On the Straussee in Brandenburg a passenger
cable ferry with overhead line, which was put into operation in 1894, is still in
operation today. Later, however, such developments were almost completely
replaced by robust and economical diesel drives. In the meantime, the long-
term increase in gas oil prices and especially the technologies for reducing
emissions have led to rising investment and operating costs. At the same time,
other energy sources and energy converters are being developed further and
are becoming cheaper, so that alternative drive systems are gaining a growing
market opportunity and can contribute to a significant reduction in air pollu-
tants and, in some cases, the climate impact of transport in the long term.
Various alternative energy sources are presented in the following as an option
to diesel. These can be divided into three groups:
- Hydrocarbon-based energy sources
- Hydrogen-based energy carriers
and
- storage for electrical energy.
Afterwards the related energy converters are described and discussed. The list
of assessed technologies was agreed upon with the contracting authorities
based on technological maturity, emission reduction potential, suitability for
the inland shipping sector and availability of information. As a result, some
technologies are not taken into account although they might seem promising.
3.1 Energy Carriers
Nowadays there are various alternatives to diesel available which all have
their individual advantages and downsides. As mentioned above, energy car-
riers can be divided into three groups. The hydrocarbon-based energy carriers
all consist of chains of different lengths. Diesel and diesel-like fuels have the
longest chains. The following figure shows the proportions of carbon and hy-
drogen in the various energy sources in their liquid state. In this study, diesel-
like fuels, methane, methanol and hydrogen are considered as energy carriers
for inland vessels. Production and marine applications of green ammonia as
a fuel for internal combustion engines and fuel cells are studied in several
current R&D projects. As of today, however, ammonia has not reached suffi-
cient TRL to be included here yet. Batteries are also described in this chapter
even though they are rather the tank system than the energy carrier.
Assessment of Technologies in view of zero-emission IWT
Report No. 2293
24
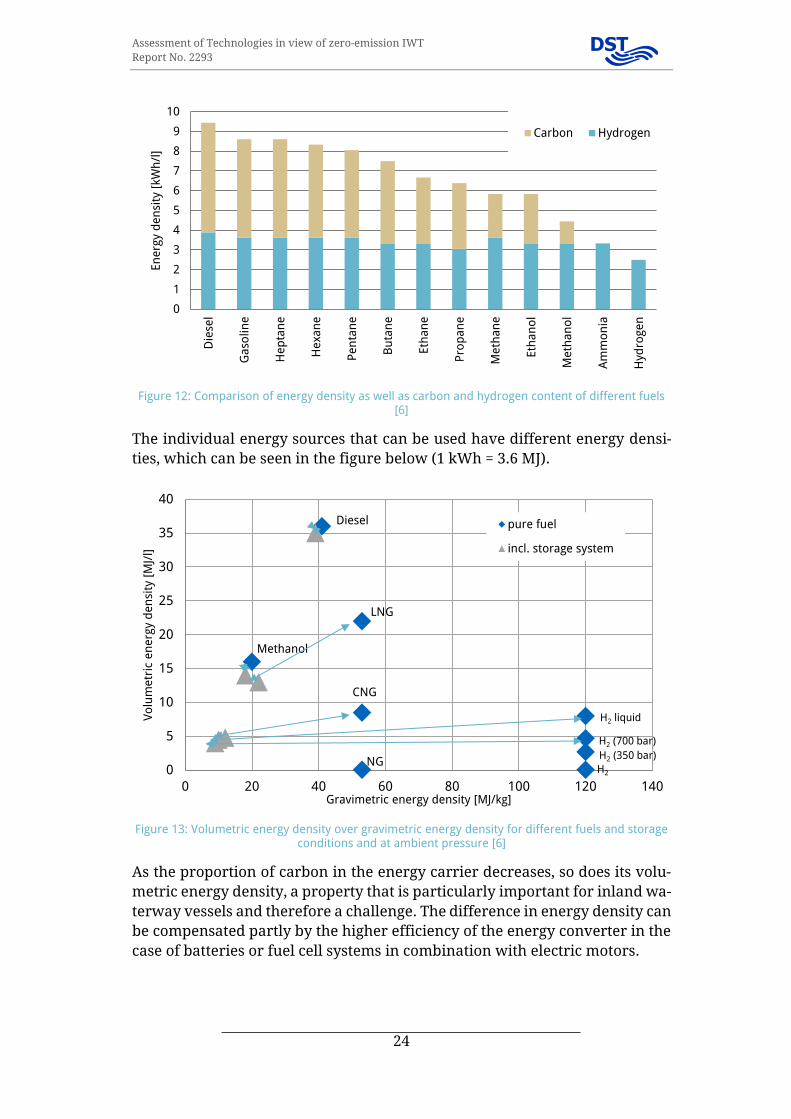
Figure 12: Comparison of energy density as well as carbon and hydrogen content of different fuels [6]
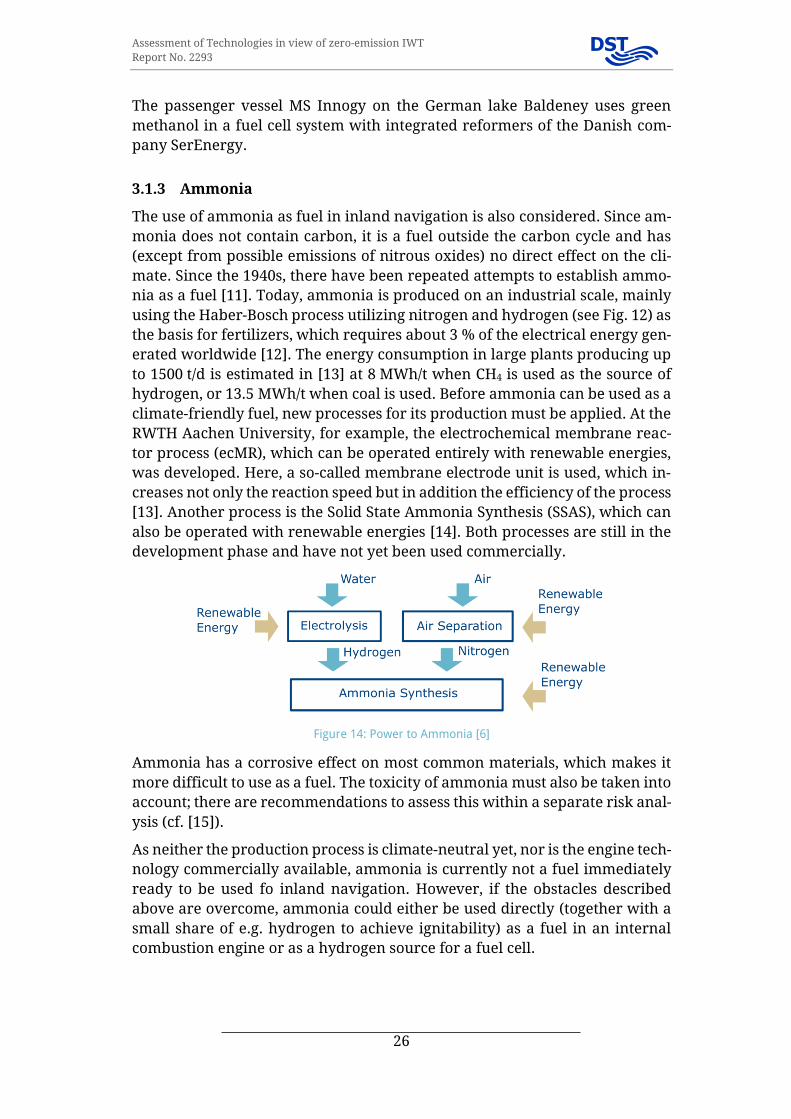
The individual energy sources that can be used have different energy densi-
ties, which can be seen in the figure below (1 kWh = 3.6 MJ).
Figure 13: Volumetric energy density over gravimetric energy density for different fuels and storage conditions and at ambient pressure [6]
As the proportion of carbon in the energy carrier decreases, so does its volu-
metric energy density, a property that is particularly important for inland wa-
terway vessels and therefore a challenge. The difference in energy density can
be compensated partly by the higher efficiency of the energy converter in the
case of batteries or fuel cell systems in combination with electric motors.
0
1
2
3
4
5
6
7
8
9
10
Die
sel
Ga
solin
e
He
pta
ne
He
xan
e
Pe
nta
ne
Bu
tan
e
Eth
an
e
Pro
pa
ne
Me
tha
ne
Eth
an
ol
Me
tha
no
l
Am
mo
nia
Hyd
roge
n
En
erg
y d
en
sity
[kW
h/l
]
Carbon Hydrogen
Methanol
Diesel
LNG
CNG
NG0
5
10
15
20
25
30
35
40
0 20 40 60 80 100 120 140
Vo
lum
etr
ic e
ne
rgy
de
nsi
ty [
MJ/
l]
Gravimetric energy density [MJ/kg]
pure fuel
incl. storage system
H2 (350 bar)
H2 (700 bar)
H2 liquid
H2

Assessment of Technologies in view of zero-emission IWT
Report No. 2293
25
3.1.1 Hydrogen
Since hydrogen does not occur naturally on earth as a single molecule, but
only as a chemical compound, it must always be separated to obtain pure hy-
drogen. Currently, there is much active research on how this process can be
made as energy-efficient and climate-neutral as possible.
Hydrogen (H2) is gaseous under normal conditions (0 °C and 1 bar) with a den-
sity of 0.0899 kg/m³. Hydrogen can be transported as compressed gas or liquid
and is the most commonly known chemical element. The most advanced pro-
cesses for the production of hydrogen are reforming and water electrolysis.
When hydrogen is used in the PEM FC, attention must be paid to hydrogen
purity. In principle, any hydrogen contamination can impair the performance
and service life of the fuel cell system. The required purity is particularly dif-
ficult to achieve during the reforming process from natural gas or methanol.
The hydrogen purity should be above 99.99 vol%.
The internal combustion engine running on H2 is also considered in this re-
port. It is described in chapter 3.3.3. For further reading on hydrogen as fuel
for inland shipping the feasibility study written within the MariGreen project
is recommended [10].
3.1.2 Methanol
Methanol is the simplest member of the group of alcohols with the molecular
formula CH3OH making it rich in hydrogen with only a single carbon bond. It
is a clear colourless liquid with a density of 0.79 kg/l. It is produced from fossil
sources (natural gas), but can also be produced regeneratively. There are var-
ious ways to produce renewable methanol. One is to capture CO2 from geo-
thermal power generation which is then reacted together with renewable hy-
drogen (produced via electrolysis) into renewable methanol. Other methods
are to convert biogas from fermentation or gasification of sustainable biomass
into bio-methanol as well as producing it from solid waste feedstocks. It is also
produced as a by-product of the kraft pulping process by process industries.
Methanol can be used in adapted combustion engines or as energy carrier for
hydrogen fuel cells. Reforming at 300 °C produces H2-rich reformate gas.
When used with a low temperature PEM FC, a fine purification is necessary.
Reforming reduces the system efficiency of a FC system.
Methanol is harmful to the environment (same water hazard class as diesel)
and health but biodegradable. Due to the liquid property of methanol (it re-
mains liquid up to a temperature of 60 °C and ambient pressure), handling is
similar to that of diesel or petrol, i.e. it can be stored in simple tanks. In com-
bination with the comparably high energy density this is the strongest ad-
vantage of methanol.
Assessment of Technologies in view of zero-emission IWT
Report No. 2293
26
The passenger vessel MS Innogy on the German lake Baldeney uses green
methanol in a fuel cell system with integrated reformers of the Danish com-
pany SerEnergy.
3.1.3 Ammonia
The use of ammonia as fuel in inland navigation is also considered. Since am-
monia does not contain carbon, it is a fuel outside the carbon cycle and has
(except from possible emissions of nitrous oxides) no direct effect on the cli-
mate. Since the 1940s, there have been repeated attempts to establish ammo-
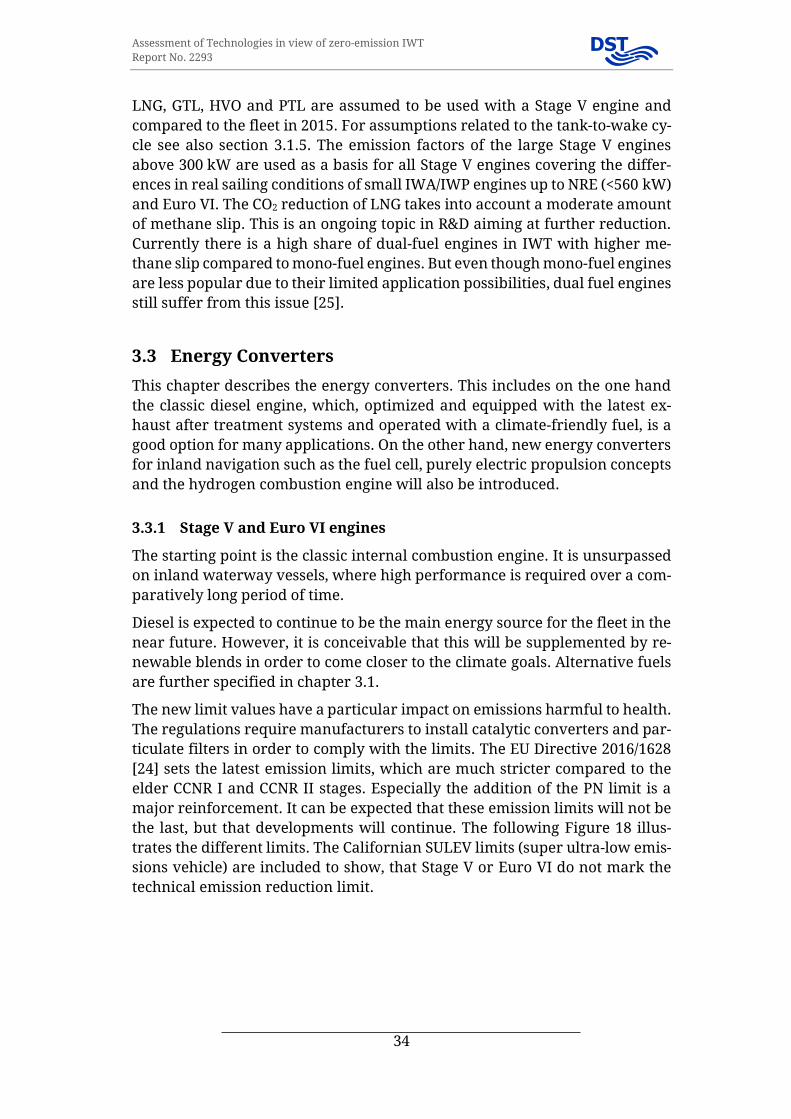
nia as a fuel [11]. Today, ammonia is produced on an industrial scale, mainly
using the Haber-Bosch process utilizing nitrogen and hydrogen (see Fig. 12) as
the basis for fertilizers, which requires about 3 % of the electrical energy gen-
erated worldwide [12]. The energy consumption in large plants producing up
to 1500 t/d is estimated in [13] at 8 MWh/t when CH4 is used as the source of
hydrogen, or 13.5 MWh/t when coal is used. Before ammonia can be used as a
climate-friendly fuel, new processes for its production must be applied. At the
RWTH Aachen University, for example, the electrochemical membrane reac-
tor process (ecMR), which can be operated entirely with renewable energies,
was developed. Here, a so-called membrane electrode unit is used, which in-
creases not only the reaction speed but in addition the efficiency of the process
[13]. Another process is the Solid State Ammonia Synthesis (SSAS), which can
also be operated with renewable energies [14]. Both processes are still in the
development phase and have not yet been used commercially.
Figure 14: Power to Ammonia [6]
Ammonia has a corrosive effect on most common materials, which makes it
more difficult to use as a fuel. The toxicity of ammonia must also be taken into
account; there are recommendations to assess this within a separate risk anal-
ysis (cf. [15]).
As neither the production process is climate-neutral yet, nor is the engine tech-
nology commercially available, ammonia is currently not a fuel immediately
ready to be used fo inland navigation. However, if the obstacles described
above are overcome, ammonia could either be used directly (together with a
small share of e.g. hydrogen to achieve ignitability) as a fuel in an internal
combustion engine or as a hydrogen source for a fuel cell.

Assessment of Technologies in view of zero-emission IWT
Report No. 2293
27
3.1.4 Dimethyl Ether
Dimethyl Ether (CH3OCH3) is the simplest ether compound. It can be produced
directly from syngas. The feedstock and the required energy can be obtained
from renewable sources [16]. Moreover, DME can be produced in a Power-to-
X process plant. The colourless and highly flammable substance is gaseous un-
der ambient conditions. When subjected to modest pressure (10 bar) or cool-
ing (-25°C) it changes to a liquid. In contrast to most other fuels, DME is almost
non-toxic.
Under the Biofuels Directive 2009/28/EC, dimethyl ether is considered a biofuel
if it is produced from biomass and is intended for use as biofuel. The Horizon
2020 project FLEDGED (grant agreement N° 727600) deals with the production
of DME from biomass using more efficient process technology [17].
3.1.5 Drop-In Fuels GTL, HVO and PTL
Drop-in fuels are a synthetic and completely interchangeable substitute for
conventional petroleum-derived hydrocarbons (gasoline, jet fuel, and diesel),
meaning it does not require significant adaptation of the engine or the fuel
system. Usually, they are standardized as paraffinic fuels according to
EN 15940 and can be used “as is” in currently available engines either in pure
form and/or blended in any amount with conventional fuels. However, lubri-
cants and some engine control parameters might need to be changed in coor-
dination with the engine manufacturer to improve efficiency and / or environ-
mental performance. Therefore, the fuel has to be specified in the manufac-
turer’s fuel directive and the type approval for each engine series according
to the recent emission standards. Since the type approval process is elaborate
and costly compared to the small market, standardization and the future us-
age and availability of blends or pure drop-in fuels have to be coordinated far
in advance. The guidelines related to this topic and published by the Internal
Combustion Engine Manufacturers (EUROMOT) [18] can be surveyed online
and are subject to continuous further development.
Among the synthetic fuels that are considered important for inland navigation
are GTL (Gas-to-Liquid) and HVO (Hydrotreated Vegetable Oil). GTL is pro-
duced with the Fischer-Tropsch synthesis, a process generally called XTL (X to
Liquid) that was developed by Franz Fischer and Hans Tropsch in 1925. The
"X" is a variable and is replaced by an abbreviation of the original energy car-
rier, e.g. “G” for gas. Within this process various liquid synthetic fuels such as
GTL, lubricating oils and other paraffinic products for the chemical industry
can be obtained from natural gas, other gasified fossil fuels or biomass. If bio-
mass is used as a starting material, also the term BTL (Biomass-to-Liquid) is
commonly used, replacing the “X” by “B”. BTL is completely derived from re-
newable energy.
HVO is a mixture of straight-chain and branched paraffins, the simplest form
of hydrocarbon molecules under the aspect of clean and complete

Assessment of Technologies in view of zero-emission IWT
Report No. 2293
28
combustion. Typical carbon numbers are C15 ... C18. In addition to paraffins,
fossil diesel fuels contain also significant amounts of aromatics and naph-
thenes. Aromatics impair a clean combustion. HVO, on the contrary, does not
contain aromatics, and its composition is similar to that of GTL and BTL diesel
fuels, produced by the Fischer-Tropsch synthesis from natural gas and gasified
biomass. Having said that, it is to be emphasised that HVO is not to be mistaken
with Biodiesel (see also Figure 15). Biodiesel is a chemically fatty acid methyl
ester (FAME) and could cause trouble being used as a fuel substitute in a con-
ventional engine. Increasing the blends of FAME is a greater challenge than
for HVO and not covered by usual test fuels. The feedstock for HVO consists of
renewable sources. These can be residual plant and animal fractions from the
food industry or residues from vegetable oil processing. The fuel HVO is con-
sidered to be climate neutral in the tank-to-wake cycle. This is in line with the
IPCC assumptions [1] and also confirmed by the 2019 energy transition outlook
published by DNV GL [19]. Here it is explained that carbon contained in bio-
mass is eventually absorbed from the atmosphere by photosynthesis by the
plants replacing the burned plants. Other factors such as potential additional
emissions due to e.g. deforestation to make room for crops producing biofuel
are accordingly accounted for under agriculture, forestry and other land-use
(AFOLU) not the transport sector also documented in IPCC volume 2, chapter
3 mobile combustion [20].
Figure 15: Process of HVO production, which is a catalytic process with hydrogen (hydrogenation)
and difference to the production process for biodiesel (FAME, shown to the right), which is an esteri-fication [21]
The synthetic fuel produced entirely from renewable energy sources is called
PTL. Here the P stands for power. An electrolyser is operated with electricity
generated from renewable sources to separate hydrogen. Then, again using a
Fischer-Tropsch process, a synthetic, diesel-like fuel is produced from the hy-
drogen and added carbon. The output of today’s PTL refineries is still very low;
and therefore, an immediate switch to this fuel is unfeasible. However, as mar-
ket interest in this fuel increases, it can be expected that production capacity
will increase significantly. Figure 16 shows the production cost for different
fuels from renewable sources. Besides the sustainable feedstocks the viability
of these fuels is highly dependent on cheap renewable electricity.

Assessment of Technologies in view of zero-emission IWT
Report No. 2293
29
Figure 16: Production cost for different fuels from renewable sources [22], [23]
Following a report published by [22] possible quantities of alternative fuels in
2030 are as outlined hereafter: “Due to current fuel standards, individual bio-
mass-based fuels (BTX) and synthetic fuels (PTX) such as ethanol, methanol or
dimethyl ether (DME)/oxymethylene ether (OME) can currently only be
blended to a limited extent. Today's most important BTX fuel, biodiesel (fatty
acid methyl ester, or FAME), is used as a 7 % blend with fossil diesel (B7), but
can also be used as B20, B30 or B100 (pure fuel) by approved commercial ve-
hicles in closed fleets. Other biomass or electricity-based products, for exam-
ple methane, can be blended with fossil fuels (in the case of methane to Com-
pressed Natural Gas (CNG) or Liquefied Natural Gas (LNG)) in any amount (0-
100 %). After a successful drop-in phase and when substantial production
quantities have been reached, special PTX fuels can also be marketed as "de-
signer fuels" at separate fuel stations.”
Anyhow, without further measures the expected share of renewable fuel as
per [22] in Germany in 2030 will be approx. 9 % of the overall fuel consump-
tion. This also holds a percentage already applied in 2015. Therewith it con-
tributes but will not yet archive the aim of increasing the use of renewable
energy by 35 % compared to 2015.
In combination with the latest emission standards, the use of drop-in fuels can
make a major contribution both to reducing climate-impacting emissions and
to lowering air pollutants. The emission potential of drop-in fuels is described
in section 3.2.
3.1.6 Battery
Batteries provide the possibility to store electrical energy and make it availa-
ble on the move. Batteries are used in a wide range of application with a lot of
different requirement. Thus, there is a wide range of battery types and devel-
opments are going in various directions. Batteries can be characterised by the

Assessment of Technologies in view of zero-emission IWT
Report No. 2293
30
following factors: power density, capacity, cycle lifetime, energy density, cap-
ital costs, charging time, reliability and safety.
The following battery types are available: • Lead-acid • Li-ion • Sodium sulphur • Nickel-based • Others: sodium-ion, magnesium-ion, zinc, and aluminium
Figure 17 shows an example of the functional principle of a battery based on
a lithium-ion cell. Beside all varieties of different batteries, they all share
about the same construction. A battery cell consists of two electrodes, the neg-
ative anode and the positive cathode, which are enclosed by an electrolyte.
The electrolyte can be made of liquid, gel or solid materials. For both elec-
trodes and electrolyte different chemical matters are used.
Figure 17: Functional principle of a lithium-ion battery
Discharging of a battery means to convert chemical energy to electrical en-
ergy. For charging a battery, current has to be spread. All reactions are re-
turned. Nevertheless, the controlled reversal for most cases is not perfect.
Therefore, the number of charges is bounded.
The different battery types are usually classified by their cathode chemistry.
The five current available solutions are:
1. lithium cobalt oxide (LCO)
2. lithium iron phosphate (LFP)
3. lithium nickel cobalt aluminium oxide (NCA)
4. lithium nickel cobalt manganese oxide (NCM)
5. lithium manganese oxide (LMO)
Further, the anode material as well as the electrolyte can change. An example
is the lithium titanate oxide anode (LTO).

Assessment of Technologies in view of zero-emission IWT
Report No. 2293
31
Battery systems
Maritime battery systems typically consist of several thousand cells. It is,
therefore, important that each cell works consistently with all other cells. The
individual battery cells are interconnected to form battery modules, whereby
the required voltage is reached. Due to the net-working of these units, large
systems with a high capacity can be assembled.
The advantage is that the battery systems can either be integrated into the hull
of the ship or it can be installed in separate battery cabinets assembled e.g. in
a container. Battery containers could then be inter-changeably stored on the
ship. This solution might be of special interest for ships handling containers
as their usual business anyhow.
3.1.7 LNG
Liquefied natural gas (LNG) mainly consists of methane (CH4). Due to its lowest
possible carbon content (see also Figure 12) methane has a great potential to
reduce CO2 emissions when used as fuel. Nevertheless, since methane is a very
climate-impacting gas, methane slip must be kept under control when LNG is
used as fuel in order to maintain the advantage of low emissions from com-
bustion; and to ensure reductions in greenhouse gas (GHG) emissions while
using LNG.
LNG is produced by cooling down the natural gas to minus 162 °C (-260 °F),
thus converting it to liquid state for ease of storage and transport. Methane
could also be produced as a power-to-X fuel. Just like bio methane, it can be
used directly as a renewable substitution.
LNG consists of more than 90 % methane (CH4) with the rest mostly ethane,
propane, butane and nitrogen. It is odourless, colourless, non-toxic, non-cor-
rosive and has a flammability range of 5-15 % of fuel-air mixture. LNG shall
not be mistaken for LPG – Liquefied Petroleum Gas (mainly consisting of pro-
pane and butane). In case LNG is spilled it evaporates, forming visible
“clouds”. Portions of the cloud could be flammable or explosive under certain
conditions. A fuel-air mixture of about 10 % methane in air (about the middle
of the 5–15 % flammability limit) and atmospheric pressure might be ignited
if it does encounter an ignition source (a flame or spark or a source of heat of
540 °C or greater). Otherwise the vapour will generally dissipate into the at-
mosphere
LNG contributes to significant reduction of sulphur oxides emissions (SOx), ni-
trogen oxides emissions (NOx), particulate matters (PM) and carbon dioxide
emissions (CO2) from engine exhaust emissions in comparison to traditional
fuels. However, differences are substantially reduced by low sulphur fuels
and exhaust gas aftertreatment.
In comparison to diesel: • CO2 reduced up to 25 %
In comparison to LPG: • GHG reduced by up to 15 %

Assessment of Technologies in view of zero-emission IWT
Report No. 2293
32
(for near zero methane slip, in the following calculated with 13 %)
• PM reduced by nearly 100 % • NOx reduced up to 90 % • SOx reduced up to 95 %
• PM reduced by up to 10 % • NOx reduced by up to 50 %

Assessment of Technologies in view of zero-emission IWT
Report No. 2293
33
3.2 Emission reduction potential
The following tables summarize the emission factors used (Table 5) and the
corresponding reduction potential (Table 6) compared to the situation in 2015
(Table 4) for the clean drivetrains in a tank-to-wake perspective. For the diesel
engines an average CO2 emission factor of 720 g/kWh was used, though e.g. old
unregulated and modern engines have a slightly better efficiency than a
CCNR II engine. The value is based on a specific fuel consumption of 230 g/kWh
which represents the average value for an operating profile of a vessel with
frequent operating conditions in partial load range. The emissions output de-
pends on the fuel molecular structures and was set to 3.15 gCO2/gDiesel for Diesel.
The numbers presented in the tables below are based on own calculations tak-
ing into account numbers from [24] and [5].
Table 5: Emission factors for drivetrains complying with Stage V or better
CO2 NOX PM
Drivetrain technology [g/kWh] [g/kWh] [g/kWh]
Battery 0 0 0
Hydrogen in fuel cells 0 0 0
Bio-Methanol in fuel cells 0 0 0
LNG 637 1.8 0.015
Hydrogen in ICE 0 1.8 0
GTL 720 1.8 0.015
HVO 0 1.8 0.015
PTL 0 1.8 0.015
Table 6: Emission reduction potential of alternative fuels with ideal upstream chains
Fuel CO2 NOX PM
Battery -100 % -100 % -100 %
Hydrogen in fuel cells -100 % -100 % -100 %
Bio-Methanol in fuel cells -100 % -100 % -100 %
LNG -13 % -84 % -97 %
Hydrogen in ICE -100 % -84 % -100 %
GTL -0 % -84 % -97 %
HVO -100 % -84 % -97 %
PTL -100 % -84 % -97 %
Assessment of Technologies in view of zero-emission IWT
Report No. 2293
34
LNG, GTL, HVO and PTL are assumed to be used with a Stage V engine and
compared to the fleet in 2015. For assumptions related to the tank-to-wake cy-
cle see also section 3.1.5. The emission factors of the large Stage V engines
above 300 kW are used as a basis for all Stage V engines covering the differ-
ences in real sailing conditions of small IWA/IWP engines up to NRE (<560 kW)
and Euro VI. The CO2 reduction of LNG takes into account a moderate amount
of methane slip. This is an ongoing topic in R&D aiming at further reduction.
Currently there is a high share of dual-fuel engines in IWT with higher me-
thane slip compared to mono-fuel engines. But even though mono-fuel engines
are less popular due to their limited application possibilities, dual fuel engines
still suffer from this issue [25].
3.3 Energy Converters
This chapter describes the energy converters. This includes on the one hand
the classic diesel engine, which, optimized and equipped with the latest ex-
haust after treatment systems and operated with a climate-friendly fuel, is a
good option for many applications. On the other hand, new energy converters
for inland navigation such as the fuel cell, purely electric propulsion concepts
and the hydrogen combustion engine will also be introduced.
3.3.1 Stage V and Euro VI engines
The starting point is the classic internal combustion engine. It is unsurpassed
on inland waterway vessels, where high performance is required over a com-
paratively long period of time.
Diesel is expected to continue to be the main energy source for the fleet in the
near future. However, it is conceivable that this will be supplemented by re-
newable blends in order to come closer to the climate goals. Alternative fuels
are further specified in chapter 3.1.
The new limit values have a particular impact on emissions harmful to health.
The regulations require manufacturers to install catalytic converters and par-
ticulate filters in order to comply with the limits. The EU Directive 2016/1628
[24] sets the latest emission limits, which are much stricter compared to the
elder CCNR I and CCNR II stages. Especially the addition of the PN limit is a
major reinforcement. It can be expected that these emission limits will not be
the last, but that developments will continue. The following Figure 18 illus-
trates the different limits. The Californian SULEV limits (super ultra-low emis-
sions vehicle) are included to show, that Stage V or Euro VI do not mark the
technical emission reduction limit.

Assessment of Technologies in view of zero-emission IWT
Report No. 2293
35
Figure 18: Emission limits for Stage I to Stage V for HC, NOx and PM [26]
3.3.2 Gas and gas-electric propulsion concepts
The technical approach applied to the propulsion of inland waterway vessels
depends on the type of vessel, the speed targeted and the sailing profile. In
order for gas and gas-electric propulsion to be applicable, a vessel should meet
one or more of the following criteria:
• High energy demand and a load factor benefitting from reduced energy
costs
• LNG bunkering infrastructure within the operational area
• Benefits from LNG retrofitting in combination with lengthening of the
hull (applicable especially for pushers).
The technology for using LNG on ships is commercially available. However,
the comparatively high price of the cryogenic system components is an obsta-
cle, especially in inland navigation. The following picture shows the necessary
equipment:
Figure 19: General schema of the system components of a LNG powered drive train
The use of LNG to power fuel cells is also feasible. Guidelines for the use of
fuel cell systems on board of ships are amongst others available by the classi-
fication company DNV GL and currently further under development. With the

Assessment of Technologies in view of zero-emission IWT
Report No. 2293
36
ambition to take zero-emission technology a big step ahead considerable de-
velopment work is provided in this field.
Engine types
LNG power offers a number of engine configurations for inland waterway ves-
sels. Either a full gas-engine (Otto-cycle) as displayed in Figure 21 or a dual-
fuel engine (Diesel-cycle) displayed in Figure 20 can be used. In case of the
dual-fuel engine, which is the majority of the current LNG fleet, the ratio of
diesel and gas is variable. However, the emission performance is lower than
for the mono-fuel engines, which are preferred in gas electric installations.
Dual fuel engine
(Diesel-cycle)
In dual-fuel mode, natural gas is
fed into the engine’s intake system.
The air-natural gas mixture is then
drawn into the cylinder, just as it
would be in a spark-ignited engine,
but with a leaner air-to-fuel ratio.
Near the end of the compression
stroke, diesel fuel is injected and
ignites the natural gas. A dual-fuel engine can operate on pure diesel fuel
or a mixture of diesel and natural gas, delivering the same power density,
torque curve and transient response as the base diesel engine.
Gas engine (Otto-Cycle)
Mono-fuel gas-engines work with
the Otto principle and have a spark-
ignition. They also have a different
characteristic which is slightly
more suitable for gas-electric appli-
cations in gensets than for direct
drives.
Propulsion concepts
Basically, one can divide between direct drive (see Figure 22) and gas-electric
drive propulsion concepts (see Figure 23). The two concepts are listed hereaf-
ter.
Figure 21: Gas engine (Otto-Cycle)
Figure 20: Dual fuel engine (Diesel-cycle)

Assessment of Technologies in view of zero-emission IWT
Report No. 2293
37
Direct drive system
The direct drive system with a gas engine is comparable to a diesel di-
rect drive system. In the context of the required redundancy, it may be
necessary to install two independent gas supply systems including a
tank for multi screw vessels. A single screw vessel has the option to use
the bow thruster (360° thruster) as redundant propulsion device in
case the gas system fails. The bow thruster then also needs an inde-
pendent energy source.
Figure 22: General schema of the components of a direct drive system
1 Pipes and tanks have safety valves to protect them from overpres-
sure. All systems are redundant. This means that of each safety sys-
tem there are at least two individual ones available in case one fails.
2 In the Cold Box the LNG is evaporated. The resulting gas is then
pressurized. The energy (heat) for the evaporation process is often
delivered by the cooling water of other engines on board. This part
of the installation is also known as gas treatment system. The pipes
are double walled. The space between the inner and the outer pipes
is flooded with Nitrogen. Each pipe has an automatic and a hand
operated valve; each piping section also has a release valve. The au-
tomatic valves are closed at an emergency shutdown.
3 The gas valve unit (GVU) controls the gas flow to the engine and can
also perform an emergency stop.
4 In the engine the gas is burned. The two main engine types are dual-
fuel engines running on diesel as well as gas and pure gas engines
running on gas only. In case of a dual-fuel engine, an additional die-
sel tank is necessary.

Assessment of Technologies in view of zero-emission IWT
Report No. 2293
38
Gas-electric system
The design of the gas-electric system is comparable to that of the diesel-
electric system: both are using gensets and electric drive motors. Only
the gensets in the concept descripted here now run on gas. A require-
ment of the applicable regulation ES-TRIN 2019 is a redundant electric
energy source. One solution to satisfy this demand, the installation of
two gensets is shown below in Figure 23. The gensets may differ in size.
Figure 23: General schema of the components of a gas-electric system
1 Pipes and tanks have safety valves to protect them from overpres-
sure. All systems are redundant. This means that of each safety sys-
tem there are at least two individual ones available in case one fails.
2 In the Cold Box the LNG is evaporated. The resulting gas is then
pressurized. The energy (heat) for the evaporation process is often
delivered by the cooling water of other engines on board. This part
of the installation is also known as gas treatment system.
3 The Gas Valve Unit (GVU) controls the gas flow to the engine and
can also perform an emergency stop.
4 In the engine the gas is burned. The two main engine types are dual-
fuel engines running on diesel as well as gas and pure gas engines
running on gas only. In case of a dual-fuel engine, an additional die-
sel tank is necessary.
5 The generator set consists of a combustion engine combined with
an electric generator. The combustion engine drives the generator
to convert the chemical energy of the fuel into electrical energy. The
generator can provide AC or DC power, depending on the selected
main switch board and frequency converters.
6 The main switch board distributes the energy from all sources to all
consumers. The consumers are frequency converters of the propul-
sion systems, hotel load, pump systems and so on. The system could
be designed as a single AC or DC rail, which can be separated in a
starboard and portside system.
7 The frequency converter supplies the electric motor with a fre-
quency and voltage amplitude variable AC voltage. The converter
can be supplied by any AC or DC on board energy grid. The

Assessment of Technologies in view of zero-emission IWT
Report No. 2293
39
rotational speed of the electric motor is controlled, by varying the
output frequency.
8 The electric motor drives the propeller at any desired load case. Its
advantage is a nearly constant efficiency at all load cases. Depend-
ing on the selected electric motor a gear box is omittable.
Equipment for gas powered inland vessels
Besides engines, special safety provisions (crew training, bunkering require-
ments) and additional equipment are required to propel an inland waterway
vessel on LNG. These are components like LNG tanks as well as systems for
LNG withdrawal from a tank or a cold box as descript hereafter.
LNG Tanks
Two different types of LNG tanks are available: Membrane Tanks and Pres-
sure Tanks. For LNG as fuel only the Pressure Tanks (IMO Type C Tanks) are
interesting. They are mostly cylindrical and have either a vacuum or foam in-
sulation as shown in Figure 24 and Figure 25. For the vacuum insulation the
space between the inner and outer hull is filled with perlite, an insulation ma-
terial, then the vacuum is drawn. Another option is foam insulation; here the
heat transfer is higher.
Figure 24: Pressure tank (vacuum insul.)
Figure 25: Pressure tank (foam insulated)
3.3.3 Hydrogen in combustion engines
Not only can hydrogen be used as fuel for a fuel cell but also for the classic
internal combustion engine (ICE). Lately manufacturers have started the de-
velopment of commercially available engines [27].
In contrast to the fuel cell or the battery, no rare-earth metals are needed for
the production of the combustion engine.
Being carbon-free, makes the hydrogen operation of the combustion engine at
least theoretically CO2, CO and hydrocarbon-free. In real operation, however,
traces of hydrocarbons in the exhaust gas can be detected due to lubricating
oil in the combustion chamber. The local emission of nitrogen oxides, though,
must be taken into account [28].

Assessment of Technologies in view of zero-emission IWT
Report No. 2293
40
The formation of nitrogen oxides in combustion can, for example, be greatly
reduced by appropriate regulation. The remaining nitrogen oxides in the ex-
haust gas are then retained by a catalyst (SCR) [29].
Theory
The wide ignition limits of hydrogen allow quality control over the entire op-
erating range of the engine. In contrast to conventional fuels, hydrogen can
theoretically be burned homogeneously up to an air ratio of lambda = 10. As
with conventional fuels, the required ignition energy increases with the air
ratio. To ignite a stoichiometric hydrogen-air mixture, only one tenth of the
energy required to ignite a gasoline-air mixture is needed. In contrast, the self-
ignition temperature of hydrogen is significantly higher than that of conven-
tional liquid fuels. Although this can bring advantages in terms of knocking
behaviour in the case of premixed combustion, it requires very high compres-
sion ratios or other measures to increase the charge temperature in the case
of the self-igniting hydrogen engine.
The high laminar flame velocity of about 230 cm/s shows that extremely short,
efficient burning times can be achieved with hydrogen. Even with lean mix-
tures, the laminar burning speed is significantly higher than that of conven-
tional fuels. However, in the premixed combustion of stoichiometric mixtures
the engine is more heavily loaded and induced by the rapid and thus higher
pressure increase, which also leads to higher combustion noise.
Being carbon-free, makes the hydrogen operation of the combustion engine at
least theoretically CO2, CO and hydrocarbon-free. In real operation, however,
traces of hydrocarbons in the exhaust gas can be detected due to lubricating
oil in the combustion chamber. The local emission of nitrogen oxides, though,
must be taken into account. [28]
The formation of nitrogen oxides in combustion can, for example, be greatly
reduced by appropriate engine control. The remaining nitrogen oxides in the
exhaust gas are then retained by a catalyst (SCR). [29].
3.3.4 Battery Electric Drives
The concept of electric propulsion describes in the first place the propulsion
with a motor that converts electrical power into motion, regardless the origin
of the electric power. Thus, the whole system can be divided into the motor
itself and the energy supply. As energy supply batteries and fuel cells can be
considered.
For an integrated assessment of the ecological and economical benefit, all
components have to be considered, meaning the hardware, such as the motor,
battery and fuel cell, as well as the origin of the power for charging the batter-
ies and the kind of fuel which is used for the fuel cell.
The first applications for battery electric propulsion were realised on small
vessels like ferries or excursion ships, where the travel path and time is short

Assessment of Technologies in view of zero-emission IWT
Report No. 2293
41
and the possibility for loading the batteries is given during breaks. Thus, the
battery can be small. For a long time, the problem was that the battery for long
travels would had been too big and too heavy, or the capacity and therefore
the range of travel too short.
However, technology has developed and since 2017 two battery electric driven
vessels operate in the port of Rotterdam and Antwerp. With 110 m length and
11.45 m width, both vessels are able to transport 280 containers. The batteries
are stored in containers underneath the liftable wheelhouse. They can either
be exchanged or loaded within 4 h at special loading stations. The capacity of
the batteries is 7.2 MWh, which corresponds to a travel time of 35 h.
Engine types
The basic principle of electric motors is the conversion of current (electric
power) into movement with the help of magnetic fields. The motor consists of
a fixed, magnetic outer part (stator) and a rotating inner part, with a changing
magnetic field (rotator). The rotation of the rotator is induced by the changing
magnetic field and the alternative pushing and pulling forces of same and dif-
ferent magnetic poles. The current is used to switch the magnetic field. Electric
motors can be classified according to the type of current source. They can op-
erate either with direct current (DC), alternating current (AC) or three-phase
current. Alternating current and three-phase current driven motors can fur-
ther be divided according to other specifications. Depending on the specific
application, the optimum motor can be chosen.
The efficiency of converting electrical power into movement is about 85 %
compared to diesel engines with an efficiency of about 40 %. Compared to
combustion engines there are further advantages.
Electric motors are used in a wide range of application and scales and for a
long time. Thus, the development is well-advanced. Nevertheless, there is still
potential to make them even more efficient.
Some possible improvements:
1. The use of high-temperature superconductors: With the use of high-
temperature superconductors a lossless transport of electric energy
would be possible. However, the need to cool the system down to ~77 K
is not suitable for all applications.
2. The optimization of the control system, such as the optimization of the
speed control.
3. Optimization of the motor construction. Use of aluminium instead of
copper. More precise construction to minimize the gap between stator
and rotor.

Assessment of Technologies in view of zero-emission IWT
Report No. 2293
42
Figure 26: General schema of the components of a battery electric drive system
The electric motor drives the propeller with constant rpm (revolutions per minute) at any load case. Its advantage is a nearly constant efficiency at all load cases. Depending on the selected electric motor a gear box can be omitted. The frequency converter supplies the electric motor with a frequency and voltage amplitude variable AC voltage. The converter can be supplied by any AC or DC on board energy grid. The rotational speed of the electric motor is controlled by varying the output frequency. The loads are frequency converters at the propulsion systems, bow thruster (5), board net (6), pump systems, etc.. It can be designed as a single AC or DC rail, which can be split in a starboard and portside system. The batter-ies can also be charged via a shore power connection.
3.3.5 Fuel cell systems
Installing a fuel cell system requires space for the hydrogen tank, the fuel cell
itself as well as batteries. The general schema of a fuel cell system is shown in
Figure 27.
Technical concept
The electric motor (1)
drives the propeller
with constant rpm at
any load case. Its ad-
vantage is a nearly con-
stant efficiency at all
load cases. Depending
on the selected electric
motor a gear box can
be omitted. The fre-
quency converter (2) supplies the electric motor with a frequency and volt-
age amplitude variable AC voltage. The rotational speed of the electric mo-
tor is controlled by varying the output frequency of the converter. The
Figure 27: General schema of a fuel cell system
1 2 3
5
6
4
7

Assessment of Technologies in view of zero-emission IWT
Report No. 2293
43
converter can be supplied by any AC or DC on board energy grid. The main
switch board (3) distributes the energy from all sources to all loads. The
fuel cell (4) provides the base load. The fuel is stored in the tank (5). Peak
loads are absorbed by the battery (6) which can be charged either by the
fuel cell or via shore power (7).
Fuel cell types
The following diagram shows the basic conversion process in a fuel cell us-
ing the example of hydrogen as a fuel.
Basic working principle of fuel cells
All fuel cells consist of two
electrodes - the anode and the
cathode as shown in Figure
28. These are separated by an
electrolyte with an ion-per-
meable membrane. After the
fuel has been supplied to the
anode, it is divided into elec-
trons and protons. The free
electrons flow into an outer
circuit between the anode
and cathode to be used as an
electric current. The protons
spread through the electro-
lyte to the cathode. At the cathode, the oxygen from the air combines with
the electrons from the outer circuit and protons from the electrolyte. This
results in water and heat.
Several fuel cells in a row make up a fuel cell stack. The number of individ-
ual cells that are connected in series can be used to variegate the perfor-
mance of the stack and adapt it to the respective requirements.
All fuel cell types are based on the reaction of a fuel with oxygen. The elec-
trochemical reaction generates basically electricity, heat and water. From
the fuel cell, the electricity is provided as direct current (DC). If alternating
current (AC) is required for further use, DC from the fuel cell is routed to an
inverter is converted there to AC.
Figure 28: Basic working principle of fuel cells
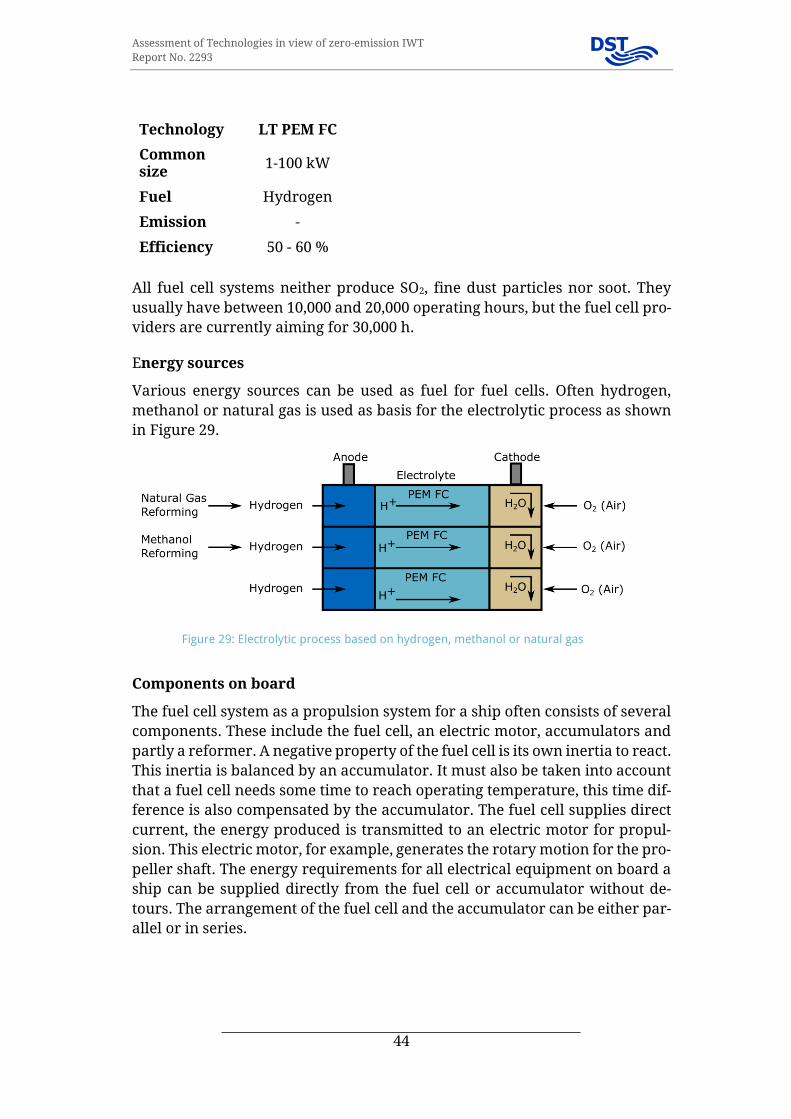
Assessment of Technologies in view of zero-emission IWT
Report No. 2293
44
Technology LT PEM FC
Common size
1-100 kW
Fuel Hydrogen
Emission -
Efficiency 50 - 60 %
All fuel cell systems neither produce SO2, fine dust particles nor soot. They
usually have between 10,000 and 20,000 operating hours, but the fuel cell pro-
viders are currently aiming for 30,000 h.
Energy sources
Various energy sources can be used as fuel for fuel cells. Often hydrogen,
methanol or natural gas is used as basis for the electrolytic process as shown
in Figure 29.
Figure 29: Electrolytic process based on hydrogen, methanol or natural gas
Components on board
The fuel cell system as a propulsion system for a ship often consists of several
components. These include the fuel cell, an electric motor, accumulators and
partly a reformer. A negative property of the fuel cell is its own inertia to react.
This inertia is balanced by an accumulator. It must also be taken into account
that a fuel cell needs some time to reach operating temperature, this time dif-
ference is also compensated by the accumulator. The fuel cell supplies direct
current, the energy produced is transmitted to an electric motor for propul-
sion. This electric motor, for example, generates the rotary motion for the pro-
peller shaft. The energy requirements for all electrical equipment on board a
ship can be supplied directly from the fuel cell or accumulator without de-
tours. The arrangement of the fuel cell and the accumulator can be either par-
allel or in series.

Assessment of Technologies in view of zero-emission IWT
Report No. 2293
45
Hydrogen system for a PEM FC
The hydrogen’s high pressure in the tank (1) is lowered to an amount suitable for the fuel cell (3) in the pressure reduction unit (2). The hydrogen is then fed into the fuel cell.
The voltage of the electric current produced is transformed into the usual on-board voltage by the voltage transformer (4).
The reaction heat is emitted in a separate heat exchanger system (5).
Methanol system for a
HT PEM FC
From the methanol tank
(1) the fuel is taken to the
reformer unit (3) to extract
the hydrogen from it. The
process needs heat which
is produced by burning an
amount of methanol in the
heater (2). The pure hydro-
gen is then fed in the fuel
cell (4). Some of the reac-
tion heat in the fuel cell is
fed back in the reformer.
The remaining heat is
emitted in a separate heat exchanger system (6). The voltage of the electric
current produced is transformed into the usual on-board voltage by the
voltage transformer (5).
Figure 30: General schema of the Hydrogen system
Figure 31: General schema of the Methanol system
2
1
3
4
6
5
1
2
3
4
5

Assessment of Technologies in view of zero-emission IWT
Report No. 2293
46
3.4 Energy efficiency
Besides the changes in the drive train technologies, also the basic measure of
increase of efficiency and reduction of fuel consumption should not be under-
estimated. Within the past decades the hydrodynamic efficiency of ships has
been improved significantly. Ships built in the 1960s and 1970s have about 20
to 25 % higher power demands at the same speed than a new ship. Ships from
the 1980s and later still leave about 10 % room for improvements.
Besides the ship design also operation has to be considered. The power de-
mand rises disproportionately with speed and also with decreasing water
depth. Accepting 10 % more sailing time compared to the minimum time at-
tainable at full throttle allows up to 30 % reduced fuel consumption [30]. Even
maintaining the same sailing time between origin and destination many
stretches allow significant fuel savings by means of so-called smart steaming,
i.e. the optimized choice of track and speed according to the local waterway
conditions. Also, smooth steering with minimized rudder activity helps to in-
crease the speed with a given power.
Rising awareness for energy efficient navigation amongst the boat masters
and scheduling staff, known as smart steaming can have a positive effect on
fuel saving. The effect enlarges with the amount of details known about the
topology of the waterway and flow data.

Assessment of Technologies in view of zero-emission IWT
Report No. 2293
47
4 Cost figures and predictions
In this section the investment costs (CAPEX) and operational costs (OPEX) of
the above described technologies are identified. A differentiation into current
costs and expected future costs has been made. The data presented were de-
rived from desk-research supported by some expert knowledge.
The development of costs between 2020, 2035 and 2050 is assumed to be lin-
ear. Extreme price drops at certain points in time are not assumed, as these
cannot be specified or the sources present data that differ so greatly from each
other that they cannot be reconciled. Also, these jumps in the predictions de-
pend on so many soft factors that they are difficult to quantify. However, the
twists and turns that a change in these soft factors would produce are too great
an influence on the change in costs. Therefore, these jumps have been omitted
as they are too speculative.
An example of an assumed technological leap is the breakthrough of carbon
capture and storage technologies without the direct use of the captured CO2.
Previous pilot applications show that the technology is not mature and that
especially the storage of CO2 under the seabed (e.g. under the Sleipner field),
is difficult to control. Moreover, the technology is energy-intensive. Develop-
ments to date show that even meeting today's energy requirements with re-
newable energies is a major challenge. Major price drops from such a vague
prediction relying on so many factors are not taken into account.
A good example for the price development is the evolution of battery prices.
In recent years, the price has fallen sharply due to increasing demand and
technological leaps, especially in the automotive industry. Looking at the de-
velopment, it becomes clear that the price decreases are slowing down. The
heavy-duty battery suitable for inland waterway vessels has undergone a sim-
ilar development, but is still at a higher price level. In the assumed price de-
velopment scenario in this study, the price of heavy-duty batteries for inland
waterway vessels now follows the development in the automotive sector, but
more slowly and at a higher level. In general, it is assumed that prices in in-
land navigation follow those of other modes of transport and energy consum-
ers and are not themselves indicative. The same applies to the further devel-
opment of individual technologies or would also apply to the breakthrough of
a technology: The development of technologies for inland navigation follows
the global development and is not leading.
Exemplary references used for the cost figures are linked in the bibliography.
Many more sources were analysed and used to check plausibility. Further-
more, there are sources marked as “expert consultation”. This information
then comes from manufacturers and users in the industry or is in-house
knowledge.
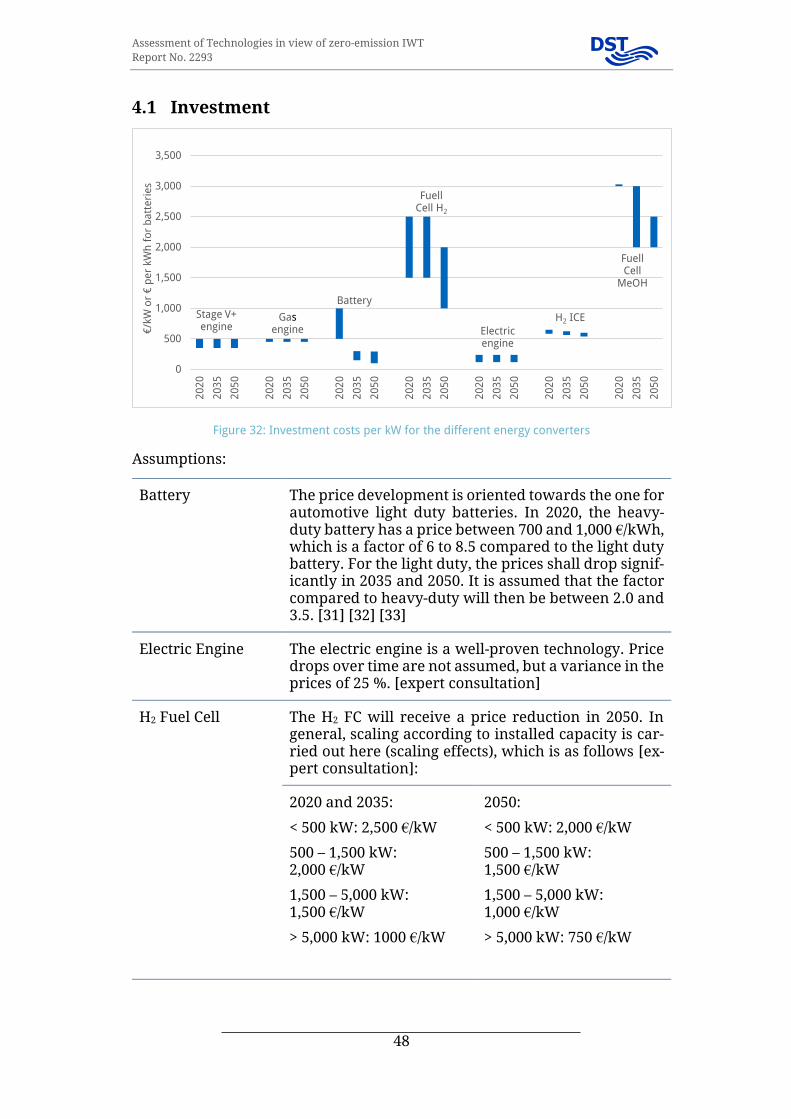
Assessment of Technologies in view of zero-emission IWT
Report No. 2293
48
4.1 Investment
Figure 32: Investment costs per kW for the different energy converters
Assumptions:
Battery The price development is oriented towards the one for automotive light duty batteries. In 2020, the heavy-duty battery has a price between 700 and 1,000 €/kWh, which is a factor of 6 to 8.5 compared to the light duty battery. For the light duty, the prices shall drop signif-icantly in 2035 and 2050. It is assumed that the factor compared to heavy-duty will then be between 2.0 and 3.5. [31] [32] [33]
Electric Engine The electric engine is a well-proven technology. Price drops over time are not assumed, but a variance in the prices of 25 %. [expert consultation]
H2 Fuel Cell The H2 FC will receive a price reduction in 2050. In general, scaling according to installed capacity is car-ried out here (scaling effects), which is as follows [ex-pert consultation]:
2020 and 2035:
< 500 kW: 2,500 €/kW
500 – 1,500 kW: 2,000 €/kW
1,500 – 5,000 kW: 1,500 €/kW
> 5,000 kW: 1000 €/kW
2050:
< 500 kW: 2,000 €/kW
500 – 1,500 kW: 1,500 €/kW
1,500 – 5,000 kW: 1,000 €/kW
> 5,000 kW: 750 €/kW
0
500
1,000
1,500
2,000
2,500
3,000
3,500
20
20
20
35
20
50
20
20
20
35
20
50
20
20
20
35
20
50
20
20
20
35
20
50
20
20
20
35
20
50
20
20
20
35
20
50
20
20
20
35
20
50
€/k
W o
r €
pe
r kW
h f
or
ba
tte
rie
s
Stage V+ engine
Gas engine
Fuell Cell H2
Battery
Electric engine
H2 ICE
Fuell Cell
MeOH

Assessment of Technologies in view of zero-emission IWT
Report No. 2293
49
Fuel Cell MeOH The Methanol fuel cell prices include the on-board re-former system. The integrated reformer ensures a consistently high hydrogen quality. The high price therefore results from the complexity of the system. It is assumed that from 2035 to 2050 a learning curve will lower the price [34].
Gas engine The gas engine, whether as a pure or dual-fuel engine, is a mature technology that does not assume signifi-cantly lower prices. A price variance of 10 % is as-sumed [expert consultation].
Stage V The Stage V engine, representative of all future emis-sion standards, is a technically mature diesel engine. Therefore, a constant price variance is assumed here, but not a significantly decreasing average price.
Funding is considered to be already existing and in-vestments to be placed within the usual framework of periodic replacements. Therefore, the costs for this kind of engines are not added to the price of measures to reach the 2050 goal [expert consultation].
H2 ICE The H2 internal combustion engine is not ready for mass production yet. Nonetheless it is based on the mature technology of the internal combustion engine. A price variance of 10 % and a learning curve will lower the price over time steps 2035 and 2050 [expert consultation].
For the installation of the new technologies some base prices were assumed.
These include the baseline prices.
Electrification base price
350,000 € to 850,000 € The price is dependent on the amount of changes that need to be made towards an electric drive system. Major conversions such as an exchange of the whole aft ship are not included [expert consultation].
LNG-System base price 1,100,000 € LNG tank, Tank con-trol system, wiring, piping, etc. [expert consultation].
Installation Diesel en-gine
20,000 € [expert consultation]

Assessment of Technologies in view of zero-emission IWT
Report No. 2293
50
Installation H2 engine 50,000 € [expert consultation]
The prices for electrification and an LNG system are including all installation
costs and the hardware like the LNG tank, TCS, wiring, piping, etc., except for
respective electric motors, batteries or gas engines.
Diesel-electric and DPF + SCR
Diesel-electric system Gensets 350 €/kW
Electric motor 120 €/kW
Installation costs
30,000 € for conver-sion, wiring and power management [expert consultation]
DPF and SCR DPF: 25,000 € + 100 €/kW installed SCR: 25,000 € + 100 €/kW installed ➔ Here: 25,000€ +
200 €/kW
[expert consultation]
Operating costs:
Maintenance 6,000 – 10,000 €/year AdBlue® consumption approximately 5 % of fuel con-
sumption AdBlue® costs 0.20 - 0.50 €/l which is approxi-
mately 25 €/1,000 l diesel [expert consultation]
4.2 Capital Costs and depreciation
The weighted average costs of capital are assumed to be 6 %. This is based on
a Cost of Capital Study [35] and represents the mean value and a linear depre-
ciation. This assumption is especially for some old vessels (already written off)
still optimistic, as banks will be reluctant to make a major investment.
The total service life of the systems is assumed to be 20 years. The new price
is therefore depreciated over this period. However, there is a not negligible
reinvestment in batteries and fuel cells, namely when the cells or membranes
have to be replaced. These are allocated to the OPEX costs.

Assessment of Technologies in view of zero-emission IWT
Report No. 2293
51
4.3 Operational costs
Operational costs are an important factor in the use of new zero-emission
technologies. Most fuels are, at least at present, more expensive up to signifi-
cantly more expensive than conventional diesel.
Related to certain aspects maintenance costs will grow as with the new tech-
nologies the level of complexity of the system in most cases will increase. Spe-
cial system conditions like working with high pressure or cryogenic system
components contribute to this situation compared to a simple and well-known
diesel engine. This will make it more difficult to maintain the system by them-
selves without advanced education or even special tools and often software
applications. Out of different discussions, amongst others consultation with
manufacturers and based on in-house knowledge this has led to the adoption
of an average of 10% per year of the initial investment for maintenance costs.
This is considering that there is less maintenance for electric drives compared
to conventional drivetrains. At the same time it is taken into account that less
can be done by the crew and for some technologies the maintenance costs ap-
ply on a regular basis while others require significant reinvestment after a
longer period e.g. for the exchange of cells or membrane-assemblies, also in-
cluded within the 10 %.For further information on maintenance costs see sec-
tion 4.5.
4.4 Fuels
Figure 33: Operational costs per kg for different energy carriers
0
1
2
3
4
5
6
7
8
20
20
20
35
20
50
20
20
20
35
20
50
20
20
20
35
20
50
20
20
20
35
20
50
20
20
20
35
20
50
20
20
20
35
20
50
20
20
20
35
20
50
€/k
g
Diesel GTL
PTL, e-fuels
HVOLNG
H2
MeOH

Assessment of Technologies in view of zero-emission IWT
Report No. 2293
52
Figure 34 Operational costs per kWh for different energy carriers
The bandwidths in Figure 34 result from the different sources. In some cases,
the predictions for the maximum are optimistic, the minimum remains the
same. The apparent accuracy for future predictions is therefore only obtained
by limiting the maximum.
GTL GTL price development: medium-term rising price levels are assumed followed by decreasing costs later according to [36].
HVO The deviating scenario, measured against source forecasts, is based on the assumption that there are no production bottlenecks caused by rising demand, which would be re-flected in rising costs, and that suffi-cient capacity is made available for shipping from the quantities availa-ble. Learning effects are also consid-ered [22] [37] [38] [21] [39]. Other than for Diesel there is no CO2 tax assumed.
PTL, e-fuels The prices for pure e-fuels from Power-to-X plants remain high com-pared to other diesel-like fuels. There is a price drop in 2035 since by then the first larger-scale produc-tion is starting [36], [40], [6] [41].
LNG The LNG price has a slight drop in 2035. The spot-market prices are de-rived from the world energy outlook (WEO) scenarios. Assumption: The LNG bunker price is three times as
0.00
0.05
0.10
0.15
0.20
0.25
0.30
0.35
0.40
0.45
0.50
20
20
20
35
20
50
20
20
20
35
20
50
20
20
20
35
20
50
20
20
20
35
20
50
20
20
20
35
20
50
20
20
20
35
20
50
20
20
20
35
20
50
20
20
20
35
20
50
PTL, e-fuels
HVO
LNGElectricity
H2
MeOH
GTLDiesel
€ /
kW
h
Assessment of Technologies in view of zero-emission IWT
Report No. 2293
53
high as the worldwide wholesale price [19] [42].
Electricity The electricity price scenarios are the same for all three dates. The minimum of 3 ct/kWh is kept since this is assumed to be the reasonable lowest power generation costs [43].
Hydrogen (H2) The price for hydrogen with a suffi-cient purity has a price drop in 2035. Then the production of electrolysis is assumed to rise and lead to drop-ping prices [19], [44], [10].
Diesel The diesel price is derived from the world energy outlook WEO2019 stated policies scenario [45].
MeOH MeOH is more and more blended with renewable parts towards 2050. The price of fossil MeOH is drop-ping, renewable MeOH prices are also assumed to lower, but are higher compared to the fossil source. The changing blend will therefore be kept at the same price level [46] [23].
4.5 Maintenance
Experience from the automotive sector shows that a battery or fuel cell system
tends to require less maintenance than combustion engines. However, on in-
land waterway vessels, many maintenance tasks have so far been carried out
by the vessel's own personnel, which reduced maintenance costs by the price
of hiring service technicians. The complexity of the new technologies, on the
other hand, means that a service technician almost always has to be hired,
which increases the price of maintenance costs. There is also hardly any ex-
perience so far as of the long-term use of new zero-emission technologies on
inland waterway vessels, so that no reliable estimate of maintenance costs is
possible based on empirical values. After balancing both scenarios and taking
into account amongst others consultation with manufacturers it is now as-
sumed that both types of systems can be estimated with maintenance costs of
10 % per year. For batteries and fuel cells this includes the reinvestment for
new cells or membrane-assemblies that is due after a certain operating period.
For batteries the life time depends on many factors like e.g. chemistry, depth
of discharge and C-rate. The assumed life span for batteries taken into account
was decided to be 8 years. For FC 25,000 hours are envisaged as per Mari-
Green, a H2 study that pursues the objective of an integrated approach to the
implementation of GreenShipping technologies and developments [10]. As
there is not sufficient experience yet this could change within the coming
years.

Assessment of Technologies in view of zero-emission IWT
Report No. 2293
54
Here it is assumed that 10 % p.a. of the initial investment for battery cells or
fuel cells must be saved over the depreciation period of 20 years in order to
make the reinvestment. This is a normal depreciation period required by the
shipping companies for accounting reasons and also based on the fact that es-
pecially for small shipping companies, according to the consulted shipowners,
the investment could not otherwise be raised.
The additional costs for the AdBlue consumption of the SCR system described
in section 4.1 are also included within the 10 % p.a. of maintenance costs in
case of ICE systems.

Assessment of Technologies in view of zero-emission IWT
Report No. 2293
55
5 Fleet Families
Summarizing the information presented above, the proposed fleet families
used for the analysis are as listed hereafter:
• Passenger vessels (large hotel)
• Push boats < 500 kW (total propulsion power)
• Push boats 500 - 2,000 kW (total propulsion power)
• Push boats ≥ 2,000 kW (total propulsion power)
• Motor vessels dry cargo ≥ 110 m length
• Motor vessels liquid cargo ≥ 110 m length
• Motor vessels dry cargo 80 – 109 m length
• Motor vessels liquid cargo 80 – 109 m length
• Motor vessels < 80 m length
• Coupled convoys (mainly class Va + Europe II lighter)
• Ferries • Daytrip and small hotel vessels
The numbers for the categories “Passenger vessels (large hotel), “Ferries” and
“Daytrip and small hotel vessels” were derived from the IVR database.
5.1 Main characteristics of the fleet families
The table below gives some information on the main characteristics of the
fleet families. It is important to know the specific characteristics of the fleet
families in order to assign zero-emission technologies to them as appropriate
as possible.
In addition, the energy demand gives an indication which technologies are
suitable for the different fleet families. However, this is not the only factor to
base the decision upon.
Table 7: Description of the fleet families
Fleet Families Description Passenger vessels (large hotel) • High energy demand for hotel load
Push boats < 500 kW (total propulsion power)
• Moderate energy demand
Push boats 500 - 2,000 kW (total propul-sion power)
• High energy demand
Push boats ≥ 2,000 kW (total propulsion power)
• High energy demand
Motor vessels dry cargo ≥ 110 m length • High energy demand
• Heterogeneous age
• The amount of coal transported may sink

Assessment of Technologies in view of zero-emission IWT
Report No. 2293
56
Motor vessels liquid cargo ≥ 110 m length
• High energy demand
• Younger vessels (double hull regula-tion in 2008)
Motor vessels dry cargo 80 – 109 m length
• High energy demand
• Heterogeneous age
Motor vessels liquid cargo 80 – 109 m length
• High energy demand
• Younger vessels (double hull regula-tion in 2008)
Motor vessels < 80 m length • Moderate energy demand
• Limited space on board
Coupled convoys (mainly class Va + Eu-rope II lighter)
• High energy demand
Ferries • Fixed short route
• Fixed schedule
Day trip and small hotel vessels • Short trips
• Sailing area limited
• Fixed routes and berths
• Fixed schedule
Table 8: Average fuel consumption of the main fleet families per vessel per year (based on detailed
information from Western-European countries)
Fleet families Average annual fuel consumption [m³]
Average total engine power installed [kW]
Passenger vessels (large hotel) 350 750
Push boats < 500 kW 22 185
Push boats 500 – 2,000 kW 110 635
Push boats ≥ 2,000 kW 1,449 2,594
Motor vessels dry cargo ≥ 110 m 237 1,307
Motor vessels liquid cargo ≥ 110 m 240 1,335
Motor vessels dry cargo 80 – 109 m 113 573
Motor vessels liquid cargo 80 – 109 m 166 716
Motor vessels < 80 m 34 227
Coupled convoys 391 1,678
Ferries 69 281
Day trip and small hotel vessels 38 375
5.2 Fleet development
For the analysis, the development of the fleet until 2050 also had to be mapped.
For this purpose, it was assumed that the age structure of the fleet would re-
main similar to what was presented in the IVR vessel database for 2015 [2].
The values for the fleet families determined for 2015 were used as a starting
point for 2020. Vessels above a certain age will be decommissioned. This
means that the corresponding age varies per fleet family in relation to [2] and

Assessment of Technologies in view of zero-emission IWT
Report No. 2293
57
for the future development of the fleet, vessels are decommissioned in a way
that the fleet composition is maintained, including the age structure. 95 % of
the decommissioned vessels are replaced which is following a trend as per
CCNR market observations [47]. Only the hotel/cruise vessels have a 100 %
newbuilt rate. As they are decommissioned at around 30 years of age, it is ex-
pected to have a fleet family whose oldest members in 2050 will be built not
long before 2020.
Figure 35: Development of the fleet from 2020 to 2050 - maintaining the original age structures within the fleet families
5.3 Technologies differentiated to the fleet families
The table presented below shows the technologies assigned to the fleet fami-
lies. They are all evaluated according to the criteria TRL, volume, weight, costs,
range and emission reduction potential for the respective fleet family. Se-
lected decisions are explained below the table. To keep the level of complexity
as low as possible only few colours are chosen to illustrate the rating of the
criteria. That does not mean that LNG is as good as HVO related to their emis-
sion reduction potential (compare also section 3.2) but they are both better
than diesel and worse than zero-emission technologies and therefore get the
rating “yellow”. One criterion can also change the colour from one fleet family
to the next as the rating additionally includes how the specific fleet family is
able to handle the fact that for example batteries take up quiet some space and
are heavy. Therefore, the same criteria might be red for one fleet family mem-
ber as it depicts almost an exclusion while it is rated yellow for another fleet
family as the battery stays big but anyhow there are possibilities to make the
technology fit. To stay with the example, for the next case the energy demand
might be less so that a battery despite the restricted space of that fleet family
is suitable for the application and nevertheless gets the rating “yellow” for
0
500
1,000
1,500
2,000
2,500
3,000
3,500
4,000
4,500
Pa
sse
nge
r ve
sse
ls (
larg
eh
ote
l)
Pu
sh b
oa
ts<
50
0 k
W
Pu
sh b
oa
ts5
00
-20
00
kW
Pu
sh b
oa
ts ≥
20
00
kW
Mo
torv
ess
els
dry
ca
rgo
≥
11
0m
Mo
torv
ess
els
liq
uid
ca
rgo
≥
11
0m
Mo
torv
ess
els
dry
ca
rgo
80
-10
9m
Mo
torv
ess
els
liq
uid
ca
rgo
80
-10
9m
Mo
torv
ess
els
<8
0 m
Co
up
led
co
nvo
ys
Ferr
ies
Da
y tr
ip a
nd
sm
all
ho
tel
vess
els
2020
2035
2050

Assessment of Technologies in view of zero-emission IWT
Report No. 2293
58
volume. This shall give an idea on how the colours were chosen without going
too much into detail as this would go beyond the scope of what is the intention
to be shown with the table below.
Besides, it must be borne in mind that the type ships each represent the aver-
age value of a fleet family. This means that vessels with significantly smaller
or even significantly larger installed capacities and energy consumption are
located at the edges of the fleet families. The sailing area and the profile are
very important factors in inland navigation. A technology selected for the type
ship may not appear optimal, but for individual members of the fleet family it
might be a very good solution. These particular constraints have been taken
into account as far as possible in the allocation of technologies to fleet families.
Examples are vessels that sail a considerable time in the canal and therefore
often have low energy and power requirements. Another example are vessels
that operate in a liner service along a certain, constant route.

Assessment of Technologies in view of zero-emission IWT
Report No. 2293
59
Table 9: Selection criteria for technologies per fleet family
Fleet family Technology Selection criteria
Passenger vessels (large hotel)
TRL Volume Weight CAPEX OPEX Range Em. Red.
Battery
H2 FC
MeOH FC
LNG
H2 ICE
Stage V GTL
Stage V HVO
Stage V PTL
Fleet family Technology Selection criteria
Push boats < 500 kW
TRL Volume Weight CAPEX OPEX Range Em. Red.
Battery
H2 FC
MeOH FC
LNG
H2 ICE
Stage V GTL
Stage V HVO
Stage V PTL
Fleet family Technology Selection criteria Push boats 500 –2,000 kW TRL Volume Weight CAPEX OPEX Range Em. Red.
Battery
H2 FC
MeOH FC
LNG
H2 ICE
Stage V GTL
Stage V HVO
Stage V PTL

Assessment of Technologies in view of zero-emission IWT
Report No. 2293
60
Fleet family Technology Selection criteria
Push boats ≥ 2,000 kW
TRL Volume Weight CAPEX OPEX Range Em. Red.
Battery
H2 FC
MeOH FC
LNG
H2 ICE
Stage V GTL
Stage V HVO
Stage V PTL
Fleet family Technology Selection criteria
Motor vessel dry cargo ≥ 110 m
TRL Volume Weight CAPEX OPEX Range Em. Red.
Battery
H2 FC
MeOH FC
LNG
H2 ICE
Stage V GTL
Stage V HVO
Stage V PTL
Fleet family Technology Selection criteria
Motor vessel liquid cargo ≥ 110 m
TRL Volume Weight CAPEX OPEX Range Em. Red.
Battery
H2 FC
MeOH FC
LNG
H2 ICE
Stage V GTL
Stage V HVO
Stage V PTL

Assessment of Technologies in view of zero-emission IWT
Report No. 2293
61
Fleet family Technology Selection criteria
Motor vessel dry cargo 80 - 109 m
TRL Volume Weight CAPEX OPEX Range Em. Red.
Battery
H2 FC
MeOH FC
LNG
H2 ICE
Stage V GTL
Stage V HVO
Stage V PTL
Fleet family Technology Selection criteria
Motor vessel liquid cargo 80 - 109 m
TRL Volume Weight CAPEX OPEX Range Em. Red.
Battery
H2 FC
MeOH FC
LNG
H2 ICE
Stage V GTL
Stage V HVO
Stage V PTL
Fleet family Technology Selection criteria
Motor vessels < 80 m
TRL Volume Weight CAPEX OPEX Range Em. Red.
Battery
H2 FC
MeOH FC
LNG
H2 ICE
Stage V GTL
Stage V HVO
Stage V PTL

Assessment of Technologies in view of zero-emission IWT
Report No. 2293
62
Fleet family Technology Selection criteria
Coupled convoys TRL Volume Weight CAPEX OPEX Range Em. Red.
Battery
H2 FC
MeOH FC
LNG
H2 ICE
Stage V GTL
Stage V HVO
Stage V PTL
Fleet family Technology Selection criteria
Ferries TRL Volume Weight CAPEX OPEX Range Em. Red.
Battery
H2 FC
MeOH FC
LNG
H2 ICE
Stage V GTL
Stage V HVO
Stage V PTL
Fleet family Technology Selection criteria
Day trip and small hotel vessels
TRL Volume Weight CAPEX OPEX Range Em. Red.
Battery
H2 FC
MeOH FC
LNG
H2 ICE
Stage V GTL
Stage V HVO
Stage V PTL

Assessment of Technologies in view of zero-emission IWT
Report No. 2293
63
Additional information on the choices made:
• For vessels that are still driven by a combustion engine burning fossil
fuel in 2050 it is assumed that at least a stage V engine is installed or
measures are taken to reach equivalent emission limits. LNG contrib-
utes to CO2 reduction but is still emitting GHG [25].
• For LNG it should be noted that the high initial costs to changeover to
this fuel are only viable for vessels with high fuel consumption. Based
on lower costs per kWh LNG systems would allow acceptable amortisa-
tion times. In addition, the expenses only remain acceptable for larger
fleets or shipowners not operating only one ship. This is presumed to
be fulfilled for some coupled convoys, as well as some motor vessels for
dry and liquid cargo of 110 m in length and above and some large push
boats.
• Bio-methane is not expected to play a significant role in the future. Fos-
sil gas is liquefied for the transport with sea-going ships from gas
sources, which are too remote for pipelines. Therefore, it is available as
LNG in many sea ports with a hinterland connection to the inland wa-
terways. For sea-going ships there is a business case to use LNG as they
benefit from the bunkering infrastructure and the high energy
throughput. In addition, the emissions are reduced as maritime fuels
still contain more sulphur. Inland vessels however require more or less
the same expensive hardware but have less energy demand to allow
amortisation. The investment for the hardware also hinders the use of
liquefied bio-methane. When fuel is produced from biomass and/or re-
newable energy, it is more likely to favour fuels with easier handling
and less challenges like methane slip [48].
• Due to its range batteries are not suitable for vessels with high energy
demand like hotel and cruise vessels as well as large push boats. In ad-
dition, large push boats often operate 24/7 and have therewith no room
in their operational profile to get recharged. For smaller push boats
with lesser energy demands the operation profile is considered to
match with charging cycles for part of the fleet.
• For the fuel cell (FC) the floor space is critical. However, example pro-
jects like ‘ELEKTRA’ demonstrate the practicability for pushers though
coupled with a drastic reduction of the deckhouse. To reach the zero-
emission target at all creative solutions remain necessary especially in
combination with existing vessel configurations.
• Main advantages of the methanol FC compared to hydrogen is the less
critical handling without cryogenic or high-pressure technology and
the lower fuel price. Therefore, a reformer is needed in addition which
for hotel and cruise vessels has the advantage that produced process

Assessment of Technologies in view of zero-emission IWT
Report No. 2293
64
heat finds multiple applications. The larger volumetric requirements
to store hydrogen makes it more attractive to be used by ships with
shorter ranges like daytrip vessels also having the possibility to bunker
more frequently and always at the same location.
• The H2 internal combustion engine (ICE) has not yet reached a techno-
logical readiness level for a broad application. Only for ferries there is
an application example currently being developed.
5.3.1 Exemplarily type ships per fleet family
In this section one exemplary advanced and clean solution per fleet family is
presented. The selection is based on the criteria listed above (section 5.3).
However, the concept of the fleet families is a practical but simplifying ap-
proach. In principle, every ship is different. When vessels are similar in size
and cargo and, therefore, bundled in one fleet family, the difference in oper-
ating mode and operational profile becomes relevant for the layout of zero-
emission technologies. E.g. the power requirement strongly depends on the
operating area and the storage capacity of energy (fuel) should match the
boundary conditions of bunkering infrastructure, operating mode and re-
quired range. Some options may be too heavy for a ship frequently operating
in stretches with low water depth, while another option is too voluminous for
a ship limited by bridge heights or locks. The cargo or handling facilities of a
liquid cargo ship or the safety requirements of a passenger vessel might also
limit the use of solutions with higher risks.
Therefore, the ship design in general and the clean drivetrain for both retrofits
and newbuilds should be tailored to the transport task and operational profile
of the ship. Nevertheless, standardization and modular concepts will play an
important role to lower the costs for most clean drivetrain solutions. With
stackable fuel cells and batteries, the tailored approach with a strong differ-
entiation of the solutions is not a contradiction with standardization. Com-
pared to the conventional diesel system with moderate costs for fuel and en-
gine combined with the high energy density, some flexibility is lost for the us-
age of the ship. Still retrofitting zero-emission technologies is complex and re-
quires major conversions in most cases. For cargo vessels replacing the rear
hull of an existing ship can be a cost-effective approach to bring older vessels
up to date in relatively short docking time with the latest developments in-
cluding hydro-dynamic improvements, e.g. for operation in low water levels.
However, a tailored system can benefit from significantly lower costs, less
losses in cargo space and a higher chance for a return on investment. To gain
this cost efficiency the system has to be tailored very much in detail for the
exact future use. The examples do not allow this specific consideration to be
taken. An averaged scenario is used. This means that the installation costs are
approx. 500,000 € per ship.

Assessment of Technologies in view of zero-emission IWT
Report No. 2293
65
The installed power for the main propulsion refers to the identified power of
the main engine in the PROMINENT project.
A distinction must be made here between several aspects:
• The hydrodynamics efficiency continues to improve with the renewed
fleet.
• In the future, energy costs will account for a larger share of the total
costs, also motivating the improvement of energy efficiency during op-
eration supported by developments of advice tools (smart navigation,
lock scheduling, awareness.
• Current installed engine powers leave some room for right sizing. Also
motivated by increasing costs for clean drivetrains.
The resulting assumptions are supported by in-house knowledge based on ob-
servations of the development of inland waterway vessels in relation with re-
search and development projects at the DST.
Two important assumptions are made:
• Firstly, it is assumed that the efficiency of ships can be increased by
20 % compared to the PROMINENT fleet families on average.
• Secondly, many of the vessels in the current fleet combined in the
PROMINENT evaluation are overpowered for reasons such as the mod-
erate engine costs, longer service intervals for low utilization, increas-
ing flexibility for not yet known applications. Motorization thus leaves
room for so-called right sizing.
As a result, only 75 % of the average power of the main propulsion system
identified in PROMINENT is assumed here. These assumptions are also pre-
sented in Table 8.
Additionally, it is assumed that the vessel will be equipped with systems ac-
cording to the average price scenario. The price developments refer to the rep-
resentative year 2042 based on linear interpolation between the numbers for
2035 and 2050. For the presented advanced drive-trains it is not likely that a
widespread implementation starts before 2035.
All examples are derived directly from the fleet families and show an average,
not an optimized design. This is done to be able to keep up with the fleet family
categorisation. The space requirement is only taken into account for hydrogen
as this is particularly critical. The examples equipped with H2 receive an opti-
mized pressure tank which contains reserves for two days. The assumption
regarding the two days has been made in order to make the costs comparable.
Costs for larger or smaller tanks would be taken into account in a ship-specific
design.

Assessment of Technologies in view of zero-emission IWT
Report No. 2293
66
The average ship design represents the initial situation before the conversion.
Based on this, the new motorization is then provided. All vessels with fuel cells
are calculated with hybrid installations since fuel cells are expensive per kilo-
watt and may have insufficient dynamic performance. 60 % of the previously
installed engine power is replaced by the fuel cell. In addition, a battery with
a capacity in kWh corresponding to 60 % of the formerly installed engine
power is foreseen for peak shaving. This is just an averaged rough estimate.
An optimized system will deviate from this based on the operational profile
and further details.
Passenger vessels (large hotel)
The large passenger vessels, besides the consumption of the main engine also
have a hotel load to serve. The load is expected to be 3.6 MWh per day. For
passenger vessels the advantages of the methanol FC to have a less critical
handling without cryogenic or high-pressure technology than with hydrogen
is especially important and counts more than for other cargo carriers. Also,
the needed reformer is more an advantage for the application on large hotel
vessels as there is quite a heat demand anyhow. Therefore, the process heat
easily finds multiple applications. The power installed for the hotel load is also
included in the calculation below:

Assessment of Technologies in view of zero-emission IWT
Report No. 2293
67
Average ship design
Main dimensions 110 m × 10 m ×1.5 m
Main propulsion power 750 kW
Hotel load 3.6 MWh/d
Energy consumption 3.6 MWh/d + 3.6 MWh/d
Exemplarily new system
Electric motor 750 kW
MeOH FC installed 450 kW +450 kW
Batteries installed 450 kWh + 450 kWh
Weight and space requirement for batteries
9 t weight and 11.9 m³ space require-ment
Cost prognosis main propulsion and hotel load system
MeOH FC system CAPEX 3,509,688€
Capital Costs 105,290 €/a
Depreciation 175,484 €/a
OPEX 1,164,656 €/a
TCO 1,445,432 €/a
Push boats < 500 kW
The power demand per day is rather moderate for this fleet family. Therefore,
it is possible to use a hydrogen fuel cell combined with batteries. The batteries
also compensate for peak loads. As this specific fleet member will mostly op-
erates in canal systems or port areas the shorter interval for bunkering or re-
spectively charging is expected to be realistic. Even though the required space
is critical, with a creative design the use of a fuel cell system is feasible.
For comparison reasons of the cost aspect the push boat presented here is as-
sumed to have H2 fuel tank for two days regardless of the real application size.

Assessment of Technologies in view of zero-emission IWT
Report No. 2293
68
Average ship design
Main dimensions 20 m × 7 m ×1.2 m
Main propulsion power 185 kW
Energy Consumption 463 kWh/d
Exemplarily new system
Electric Motor 185 kW
H2 FC installed 111 kW
Batteries installed 111 kWh
Space requirement for pressure tanks 2.3 m³ for 28 kg H2 at 500 bar
Cost prognosis propulsion system
H2 FC system CAPEX 836,103 €
Thereof tank system for 2 days 22,452 €
Capital Costs 25,083 €/a
Depreciation 41,805 €/a
OPEX 40,133 €/a
TCO 100,915 €/a
Push boats 500 - 2,000 kW
The push boat with a former installed power of about 635 kW internal com-
bustion engine is equipped with a MeOH fuel cell in combination with a bat-
tery as a peak shaving device. Due to the fact that the tank is easier to be in-
cluded into the vessel’s geometry, this technology is less space consuming com-
pared to hydrogen tanks and therefore the favoured technology to be used in
this example. In addition, even though the energy and volumetric density is
less compared to diesel, it does not lead to a substantially larger tank volume.
Furthermore, the OPEX costs are moderate.

Assessment of Technologies in view of zero-emission IWT
Report No. 2293
69
Average ship design
Main dimensions 32 m × 11.0 m × 1.6 m
Main propulsion power 635 kW
Energy consumption 1,143 kWh/d
Exemplarily new system
Electric motor 635 kW
MeOH FC installed 381 kW
Batteries installed 381 kWh
Cost prognosis propulsion system
MeOH FC system CAPEX 1,562,853 €
Capital Costs 46,886 €/a
Depreciation 78,143 €/a
OPEX 250,648 €/a
TCO 375,676 €/a
Push boats ≥ 2,000 kW
The representative of the large push boats is equipped with Stage V engines
and uses HVO as fuel. As this type of vessel has such a large energy demand,
other technologies are not realistic together with the compact size of the vessel
itself. Moreover, these vessels only have a minor contribution to the overall
fleet emission due to their small number. The use of HVO with regards to air
pollutants is therefore justifiable. Key assumption is the use of the best possi-
ble available exhaust gas level.
Average ship design
Main dimensions 40 m × 15 m × 1.7 m
Main propulsion power 2,594 kW

Assessment of Technologies in view of zero-emission IWT
Report No. 2293
70
Energy consumption 14,977 kWh/d
Exemplarily new system
Stage V engine installed 2,594 kW
Cost prognosis propulsion system
Stage V system CAPEX 1,122,238 €
Capital Costs 33,667 €/a
Depreciation 56,112 €/a
OPEX 730,389 €/a
TCO 804,607 €/a
Motor vessels dry cargo ≥ 110 m
The main characteristics of the representative are based on the large Rhine
vessel. The propulsion concept presented here consists of a 100 kW hydrogen
fuel cell combined with 5 MWh of batteries. Here the focus is put on the fuel
cell as a range extender other than for previous presented concepts having
batteries as the range extender. Besides this, the fuel cell could also serve as
peak shaving device in case of high load requirements due to uncommonly
extensive manoeuvring activities.
The concept presented is foreseen for vessels mostly operating in the tributar-
ies of the rhine and in the canal system. This is the reason that the comparably
low power installation is suitable.
Average ship design
Main dimensions 100 m 11.45 m 2.5 m
Main propulsion power 1,307 kW
Energy consumption 2,453 kWh/d
Exemplarily new system
Electric motor 750 kW

Assessment of Technologies in view of zero-emission IWT
Report No. 2293
71
H2 FC installed 100 kW
Batteries installed 5 MWh
Space requirement for pressure tanks 25 m³ for 297 kg H2 at 500 bar
Weight and space requirement for batteries
50 t and 18.7 m³
Cost prognosis propulsion system
H2 FC system CAPEX 2,600,476 €
Thereof H2 tank system for 2 days 237,846 €
Capital Costs 78,014 €/a
Depreciation 130,024 €/a
OPEX 291,564 €/a
TCO 467,608 €/a
Motor vessels liquid cargo ≥ 110 m
Here the MeOH fuel cell is chosen to give an example of a larger sized vessel
being powered by a MeOH fuel cell. Also, here the fact that the tank can be
easier included in the vessel’s geometry compared to a hydrogen tank, is fa-
vourable as less cargo space has to be rededicated.
Average ship design
Main dimensions 100 m 11.45 m 2.5 m
Main propulsion power 1,335 kW
Energy consumption 2,482 kWh/d
Exemplarily new system
Electric motor 1,335 kW
MeOH FC installed 801 kW
Batteries installed 801 kWh

Assessment of Technologies in view of zero-emission IWT
Report No. 2293
72
Weight and space requirement for batteries
8 t and 11 m³
Cost prognosis propulsion system
MeOH FC system CAPEX 2,733,623 €
Capital Costs 82,009 €/a
Depreciation 136,681 €/a
OPEX 536,757 €/a
TCO 755,447 €/a
Motor vessels dry cargo 80 – 109 m
H2 FC with Batteries for peak shaving.
Average ship design
Main dimensions 86 m
Main propulsion power 573 kW
Energy consumption 1,172 kWh/d
Exemplarily new system
Electric Motor 573 kW
H2 FC installed 344 kW
Batteries installed 344 kWh
Space requirement for pressure tanks 12 m³ for 142 kg H2 at 500 bar
Weight and space requirement for batteries
3.4 t and 4.5 m³
Cost prognosis propulsion system
H2 FC System CAPEX 1,583,822 €

Assessment of Technologies in view of zero-emission IWT
Report No. 2293
73
Thereof H2 tank system for 2 days 113,661 €
Capital Costs 47,515 €/a
Depreciation 79,191 €/a
OPEX 147,908 €/a
TCO 255,725 €/a
Motor vessel liquid cargo 80 – 109 m
MeOH FC with Batteries for peak shaving.
Average ship design
Main dimensions 86 m
Main propulsion power 716 kW
Energy consumption 1,715 kWh/d
Exemplarily new system
Electric motor 716 kW
MeOH FC installed 430 kW
Batteries installed 430 kWh
Weight and space requirement for batteries
4.3 t and 5.7 m³
Cost prognosis propulsion system
MeOH FC System CAPEX 1,697,121 €
Capital Costs 50,914 €/a
Depreciation 84,856 €/a
OPEX 336,256€/a
TCO 472,026 €/a

Assessment of Technologies in view of zero-emission IWT
Report No. 2293
74
Motor vessels < 80 m length
Small motor vessels have a low energy demand and limited power installed.
Therefore, they are more suitable for pure battery propulsion. This example
serves for vessels mainly operating on channels.
Especially the low noise level and the zero-emissions of the battery electric
propulsion are an advantage for vessels operating in urban areas. The space
requirement is considered for this specific case as space is limited on this ship
type.
Average ship design
Main dimensions 67 m 8.2 m 2.5 m
Main propulsion power 227 kW
Energy consumption 355 kWh/d
Exemplarily new system
Electric motor 227 kW
Batteries installed 710 kWh
Weight and space requirement for batteries
7.1 t and 9.4 m³
Cost prognosis propulsion system
Battery system CAPEX 721,730 €
Capital Costs 21,646 €/a
Depreciation 36,067 €/a
OPEX 28,585 €/a
TCO 114,146 €/a
Coupled convoys
This example is to illustrate that even very large sized vessels are applicable
for the use of a MeOH fuel cell. In addition, other technologies are even less
an option since they require too much space and are even more costly either
in terms of investment (batteries) or operation (hydrogen).

Assessment of Technologies in view of zero-emission IWT
Report No. 2293
75
Average ship design
Exemplary main dimensions Approx. 110 m+86 m
Average main propulsion power 1,678 kW
Energy consumption 4,037 kWh/d
Exemplarily new system
Electric motor 1,678 kW
MeOH FC installed 1,012 kW
Batteries installed 1,012 kWh
Weight and space requirement for batteries
10 t and 13 m³
Cost prognosis propulsion system
MeOH FC System CAPEX 3,307,087 €
Capital Costs 99,213 €/a
Depreciation 165,354 €/a
OPEX 790,546 €/a
TCO 1,055,113 €/a
Ferries
Ferries have a low energy demand and limited power installed. Therefore,
they are suitable for pure battery propulsion. In addition, the possibility is
given that they recharge between the trips at the berthing point at each side
of the river.
Average ship design
Main dimensions 35 m x 10 m x 1.00 m
Main propulsion power 281 kW
Energy consumption 716 kWh/d

Assessment of Technologies in view of zero-emission IWT
Report No. 2293
76
Exemplarily new system
Electric motor 281 kW
Batteries installed 1,431 kWh
Weight and space requirement for batteries
14 t and 19 m³
Cost prognosis propulsion system
Battery system CAPEX 915,738 €
Capital Costs 27,460 €/a
Depreciation 45,747 €/a
OPEX 54,515 €/a
TCO 136,192 €/a
Day trip and small hotel vessels
Especially day trip vessels have a very short range and usually run on fixed
routes. This makes them predestined for the use of an H2 ICE to be installed.
Also, the fixed operational area offers them the possibility to always use the
same bunkering installation.
The system installation cost for the H2 ICE system is, differing from above, as-
sumed to be 100,000 €.
Average ship design
Main dimensions
Main propulsion power 375 kW
Energy consumption 391 kWh/d
Exemplarily new system
H2 engine 357 kW
Space requirement for pressure tank 4 m³ for 47 kg H2 at 500 bar

Assessment of Technologies in view of zero-emission IWT
Report No. 2293
77
Cost prognosis propulsion system
H2 ICE system CAPEX 356,387 €
Thereof H2 tank system for 2 days 37,887 €
Capital Costs 10,692 €/a
Depreciation 17,819 €/a
OPEX 70,369 €/a
TCO 98,880 €/a

Assessment of Technologies in view of zero-emission IWT
Report No. 2293
78
5.4 TCO for the drivetrain for fleet families / type ships
This section presents the TCO costs for all identified fleet families. For all pro-
pulsion technologies, the costs for 2020, 2035 and 2050 are listed in Figure 36
to Figure 44. They each refer to a system consisting of several components.
With the battery electric systems, the installed batteries can cover the 2-day
power demand of the type ship. TCO costs include OPEX, depreciation and cap-
ital costs. As in the approach of the PROMINENT project, the fuel costs included
in the OPEX costs are only for the main engine.
It is noticeable that the battery costs for 2020 are much higher than the as-
sumptions for later dates. The same applies to fuel cell technology. This is due
to the fact that these technologies are still at the beginning of a wide dissemi-
nation. A mass-rollout of the technologies is assumed to have a significant ef-
fect on the price development. A similar effect applies to PTL as it is not com-
monly used yet but the more wide-spread production is assumed to have a
similar effect on the price. For GTL the effect is expected to be inverted, as long
as the price is coupled to diesel.
It can be seen that some systems can be especially economically advantageous
for some type ships. For example, the H2 fuel cell tends to be economically
advantageous for smaller ships (Figure 44), while the MeOH fuel cell fits better
for larger ships (Figure 36). However, when designing a single ship, the spe-
cific case must be considered. Amongst other effects the loss of cargo space or
payload is not calculated in this high-level approach for entire fleet families.
These differ significantly for vessels within the same fleet family e.g. based on
the transport task and waterway stretches.
It is also possible to identify some relationships between energy throughput
and appropriate propulsion technology for the different type ships. The exam-
ple of LNG illustrates this well: this technology can be a good alternative for a
coupled convoy (Figure 45), but it is rather unsuitable for a small push boat
(see Figure 37).

Assessment of Technologies in view of zero-emission IWT
Report No. 2293
79
Figure 36: TCO for the type ship of the fleet family large hotel passenger vessels
Figure 37: TCO for the type ship of the fleet family push boats with a main propulsion power of less
than 500 kW
0
200,000
400,000
600,000
800,000
1,000,000
1,200,000
1,400,000
1,600,000
1,800,000
20
20
20
35
20
50
20
20
20
35
20
50
20
20
20
35
20
50
20
20
20
35
20
50
20
20
20
35
20
50
20
20
20
35
20
50
20
20
20
35
20
50
20
20
20
35
20
50
20
20
20
35
20
50
€/y
ea
r
Passenger vessels (large hotel)
Stage V, Diesel
Stage V, GTL
Stage V, PTL
Stage V, HVO
LNGH2 FCMeOH
FCBattery H2 ICE
0
50,000
100,000
150,000
200,000
250,000
20
20
20
35
20
50
20
20
20
35
20
50
20
20
20
35
20
50
20
20
20
35
20
50
20
20
20
35
20
50
20
20
20
35
20
50
20
20
20
35
20
50
20
20
20
35
20
50
20
20
20
35
20
50
€/y
ea
r
Push boats <500 kW
Stage V, Diesel
Stage V, GTL
Stage V, PTL
Stage V, HVO
LNGH2 FCMeOH
FCBattery H2 ICE

Assessment of Technologies in view of zero-emission IWT
Report No. 2293
80
Figure 38: TCO for the type ship of the fleet family push boats with a main propulsion power be-tween 500 kW and 2,000 kW
Figure 39: TCO for the type ship of the fleet family push boats with a main propulsion power of more than 2,000 kW
0
100,000
200,000
300,000
400,000
500,000
600,000
700,000
20
20
20
35
20
50
20
20
20
35
20
50
20
20
20
35
20
50
20
20
20
35
20
50
20
20
20
35
20
50
20
20
20
35
20
50
20
20
20
35
20
50
20
20
20
35
20
50
20
20
20
35
20
50
€/y
ea
r
Push boats 500-2000 kW
Stage V, Diesel
Stage V, GTL
Stage V, PTL
Stage V, HVO
LNGH2 FCMeOH
FCBattery H2 ICE
0
1,000,000
2,000,000
3,000,000
4,000,000
5,000,000
6,000,000
7,000,000
20
20
20
35
20
50
20
20
20
35
20
50
20
20
20
35
20
50
20
20
20
35
20
50
20
20
20
35
20
50
20
20
20
35
20
50
20
20
20
35
20
50
20
20
20
35
20
50
20
20
20
35
20
50
€/y
ea
r
Push boats ≥2000 kW
Stage V, Diesel
Stage V, GTL
Stage V, PTL
Stage V, HVO
LNGH2 FCMeOH
FCBattery H2 ICE

Assessment of Technologies in view of zero-emission IWT
Report No. 2293
81
Figure 40: TCO for the type ship of the fleet family motorvessels with liquid cargo ≥ 110 m
Figure 41: TCO for the type ship of the fleet family motorvessels with dry cargo ≥ 110 m
0
200,000
400,000
600,000
800,000
1,000,000
1,200,000
20
20
20
35
20
50
20
20
20
35
20
50
20
20
20
35
20
50
20
20
20
35
20
50
20
20
20
35
20
50
20
20
20
35
20
50
20
20
20
35
20
50
20
20
20
35
20
50
20
20
20
35
20
50
€/y
ea
r
Motorvessels liquid cargo ≥110m
Stage V, Diesel
Stage V, GTL
Stage V, PTL
Stage V, HVO
LNGH2 FCMeOH
FCBattery H2 ICE
0
200,000
400,000
600,000
800,000
1,000,000
1,200,000
20
20
20
35
20
50
20
20
20
35
20
50
20
20
20
35
20
50
20
20
20
35
20
50
20
20
20
35
20
50
20
20
20
35
20
50
20
20
20
35
20
50
20
20
20
35
20
50
20
20
20
35
20
50
€/y
ea
r
Motorvessels dry cargo ≥110m
Stage V, Diesel
Stage V, GTL
Stage V, PTL
Stage V, HVO
LNGH2 FCMeOH
FCBattery H2 ICE

Assessment of Technologies in view of zero-emission IWT
Report No. 2293
82
Figure 42: TCO for the type ship of the fleet family motorvessels with liquid cargo between 80 m and
109 m
Figure 43: TCO for the type ship of the fleet family motorvessels with dry cargo between 80 m and 109 m
0
100,000
200,000
300,000
400,000
500,000
600,000
700,000
800,000
900,000
20
20
20
35
20
50
20
20
20
35
20
50
20
20
20
35
20
50
20
20
20
35
20
50
20
20
20
35
20
50
20
20
20
35
20
50
20
20
20
35
20
50
20
20
20
35
20
50
20
20
20
35
20
50
€/y
ea
r
Motorvessels liquid cargo 80-109m
Stage V, Diesel
Stage V, GTL
Stage V, PTL
Stage V, HVO
LNGH2 FCMeOH
FCBattery H2 ICE
0
100,000
200,000
300,000
400,000
500,000
600,000
700,000
20
20
20
35
20
50
20
20
20
35
20
50
20
20
20
35
20
50
20
20
20
35
20
50
20
20
20
35
20
50
20
20
20
35
20
50
20
20
20
35
20
50
20
20
20
35
20
50
20
20
20
35
20
50
€/y
ea
r
Motorvessels dry cargo 80-109m
Stage V, Diesel
Stage V, GTL
Stage V, PTL
Stage V, HVO
LNGH2 FCMeOH
FCBattery H2 ICE

Assessment of Technologies in view of zero-emission IWT
Report No. 2293
83
Figure 44: TCO for the type ship of the fleet family motorvessels smaller than 80 m
Figure 45 TCO for the type ship of the fleet family coupled convoys
0
50,000
100,000
150,000
200,000
250,000
300,000
20
20
20
35
20
50
20
20
20
35
20
50
20
20
20
35
20
50
20
20
20
35
20
50
20
20
20
35
20
50
20
20
20
35
20
50
20
20
20
35
20
50
20
20
20
35
20
50
20
20
20
35
20
50
€/y
ea
r
Motorvessels <80 m
Stage V, Diesel
Stage V, GTL
Stage V, PTL
Stage V, HVO
LNGH2 FCMeOH
FCBattery H2 ICE
0
200,000
400,000
600,000
800,000
1,000,000
1,200,000
1,400,000
1,600,000
1,800,000
20
20
20
35
20
50
20
20
20
35
20
50
20
20
20
35
20
50
20
20
20
35
20
50
20
20
20
35
20
50
20
20
20
35
20
50
20
20
20
35
20
50
20
20
20
35
20
50
20
20
20
35
20
50
€/y
ea
r
Coupled convoys
Stage V, Diesel
Stage V, GTL
Stage V, PTL
Stage V, HVO
LNGH2 FCMeOH
FCBattery H2 ICE

Assessment of Technologies in view of zero-emission IWT
Report No. 2293
84
Figure 46: TCO for the type ship of the fleet family ferries
Figure 47: TCO for the type ship of the fleet family day trip and small hotel vessels
0
50,000
100,000
150,000
200,000
250,000
300,000
350,000
400,000
20
20
20
35
20
50
20
20
20
35
20
50
20
20
20
35
20
50
20
20
20
35
20
50
20
20
20
35
20
50
20
20
20
35
20
50
20
20
20
35
20
50
20
20
20
35
20
50
20
20
20
35
20
50
€/y
ea
r
Ferries
Stage V, Diesel
Stage V, GTL
Stage V, PTL
Stage V, HVO
LNGH2 FCMeOH
FCBattery H2 ICE
0
50,000
100,000
150,000
200,000
250,000
300,000
350,000
20
20
20
35
20
50
20
20
20
35
20
50
20
20
20
35
20
50
20
20
20
35
20
50
20
20
20
35
20
50
20
20
20
35
20
50
20
20
20
35
20
50
20
20
20
35
20
50
20
20
20
35
20
50
€/y
ea
r
Day trip and small hotel vessels
Stage V, Diesel
Stage V, GTL
Stage V, PTL
Stage V, HVO
LNGH2 FCMeOH
FCBattery H2 ICE

Assessment of Technologies in view of zero-emission IWT
Report No. 2293
85
6 Transition pathways
6.1 Reduction of emissions by 35 % until 2035
According to the Mannheim Declaration [49] both the pollutant and the CO2
emissions shall be reduced by 35 % by 2035 compared to 2015. To achieve this
goal the following measures can be taken:
Pollutants: There is still a large number of unregulated engines in service.
The CCNR I was put into force in 2003. This means that all unregulated engines
are built before 2003. In 2035 these engines are well over 30 years old, mean-
ing they are then written off in any case. It can also be assumed from a tech-
nical point of view that the major part of those engines is near end of lifetime,
since service life is commonly given with 20 years. To reach the 35 % emission
reduction it is assumed that 75 % of all unregulated engines then reach the
Stage V standard by either replacement or by retrofitting an exhaust after-
treatment system. However, especially old engines might have trouble with
the installation of an aftertreatment system due to low back pressure toler-
ance. Therefore, the option whether retrofit or replacement is done is left
open. Depending on the vessel type and use, for very old engines, which are
not replaced or retrofitted by the operators in reasonable time, a ban can also
be a hard but appropriate measure.
If 75 % of those unregulated engines have reached their end of life and are
replaced with Stage V engines until 2035, approx. 29 % of NOx and 35 % of PM
emissions could be reduced. If old engines are well maintained and the oper-
ational profile allows extended lifetime, retrofitted exhaust gas aftertreatment
systems with emission levels equivalent to Stage V should be considered as
well. Moreover, as all newbuilt vessels are required to conform to Stage V or
even Euro VI standard, the emissions are further reduced by up to 10 % for
each air pollutant for the whole fleet. It is difficult to estimate how many of
these engines will be upgraded within business as usual. The calculated over-
all investment amounts to 0.86 billion Euro for the low, 1.02 billion Euro for
the average and 1.18 billion Euro for the high price scenario.
CO2 emission: A large number of vessels in today’s fleet is not very energy-
efficient. By assuming that all newbuilt vessels will be 20 % more energy-effi-
cient (number generated from DST expertise) 11 % of CO2 emissions can be
saved for the whole fleet. The use of renewable fuels like HVO also contributes
to CO2 savings. E.g. a 30 % blend for 30 % of the fleet would lead to 9 % CO2
savings. If these measures are taken, there are still 15 % CO2 reductions that
need to be covered.
Since not only the vessel’s equipment but also the operation can contribute to
emission reduction, it is recommended to take the following actions: reduction
of speed, raising awareness for energy efficient navigation amongst the ship-
ping personnel and optimization of the logistics chains. Digitalisation with

Assessment of Technologies in view of zero-emission IWT
Report No. 2293
86
track and speed advice tools for energy efficient navigation, smart tools for
lock and terminal approach and efficient integration of inland vessels in sea
ports can contribute to emission reductions. Increasing energy costs can be a
powerful driver.
Remaining CO2 emissions can be saved by covering a low percentage of the
fleet’s energy demand with zero-emission technologies such as hydrogen as
fuel in either fuel cells or internal combustion engines and higher bio blends.
There is also an energy efficiency potential in the existing fleet that can be
used to lower CO2 emissions.
6.2 Emission reduction target 2050
The Mannheim Declaration [49] states “to largely eliminate the greenhouse
gases and other pollutants by 2050” leading to the question: “How much is
largely enough?”
Achieving the 2°C target requires an 80-95 % reduction in the climate-impact-
ing emissions of industrialised countries by 2050 [50]. From this, the 80 % and
90 % scenarios were derived. For the 1.5°C target an effort beyond that is nec-
essary. Therefore, 98 % were assumed in order to significantly tighten up the
effort and make the leap in financial expenditure clear. The 100 % reduction
scenario is intended to illustrate how great the effort is to achieve absolute
climate-neutrality. When this study was almost finished it was concretised,
that for upcoming in-depth assessments the emission reduction target should
be “at least 90 %”.
In the following, three ambition levels with the reduction of CO2, NOx and PM
by 80 %, 90 % and 98 % are worked out. For all scenarios targeting 2050 it is
no longer sufficient to equip only new buildings with zero-emission technolo-
gies. The more ambitious the scenario, the greater is the share and significance
of retrofits. Alternatively, new construction activity could be increased, but
this is not considered here due to the assumptions made for fleet development.
On the one hand, some countries consider initiating new-build programmes
for smaller cargo vessels. On the other hand, high costs for clean technologies
may lead to a further decrease of investment activities in some segments.
Therefore, a constant age distribution per fleet family is assumed.
For all scenarios described in the sections below a climate-neutral tank-to-
wake balance is assumed for all energy carriers except LNG and GTL. This as-
sumption is a perquisite to achieve the scenario. Concludingly, important
work is also needed from an energy supply point of view not in the scope of
this research. The following Table 10 shows the achieved reductions per sce-
nario. The scenarios with HVO contain a very high share of 100 % HVO usage
in modern combustion engines (at least Stage V or equivalent) with exhaust
gas aftertreatment. The scenarios not having the focus on HVO do also com-
prise HVO but additionally fossil fuel is still used. To get the same emission
reduction this means that at the same time the share of more costly zero-

Assessment of Technologies in view of zero-emission IWT
Report No. 2293
87
emission technologies has to be increased. A general overview of all scenarios
and their composition and share per technology compared to each other can
be seen in Figure 48. The scenario HVO 80 % exceeds the intended reductions
also for the air pollutants with a small share of zero-emission technologies in
the fleet. Even a scenario where all vessels use 100 % HVO by 2050 would
achieve a NOx reduction of approximately 84 % compared to 2015. This results
from a combination of the predicted reduction in energy demand due to im-
proved efficiency of ships, drivetrains and operation in combination with the
Stage V emission limits. However, the availability of HVO will remain limited
by the sustainable feedstocks and it is not likely, that the entire global HVO
production is available to be used in the inland navigation sector.
Table 10: Summary of the achieved reductions per scenario
Scenario CO2 NOX PM HVO 80 % 100 % 86 % 98 %
80 % 84 % 87 % 98 % HVO 90 % 100 % 91 % 98 %
90 % 92 % 91 % 99 % 98 % 98 % 97 % 99 %
100 % 100 % 100 % 100 %

Assessment of Technologies in view of zero-emission IWT
Report No. 2293
88
Figure 48: General overview of all scenarios
0
500
1,000
1,500
2,000
2,500
3,000
3,500
4,000
4,500
5,000
HV
O 8
0%
90
%
98
%
80
%
HV
O 9
0%
10
0%
HV
O 8
0%
90
%
98
%
80
%
HV
O 9
0%
10
0%
HV
O 8
0%
90
%
98
%
80
%
HV
O 9
0%
10
0%
HV
O 8
0%
90
%
98
%
80
%
HV
O 9
0%
10
0%
HV
O 8
0%
90
%
98
%
80
%
HV
O 9
0%
10
0%
HV
O 8
0%
90
%
98
%
80
%
HV
O 9
0%
10
0%
Nu
mb
er
of
Ve
sse
lsBattery H2 ICE
LNG MeOH FC
H2 FC Stage V PTL
Stage V HVO Stage V GTL
Passenger vessels (large hotel)
PB < 500 kW
PB500-2,000 kW
PB≥2,000 kW
MVdry cargo ≥110 m
MVliquid cargo ≥110 m
MV dry cargo 80-109 m
MV < 80 m
Coupled convoys
Ferries
Day trip and small hotel vessels
MVliquid cargo 80-109 m
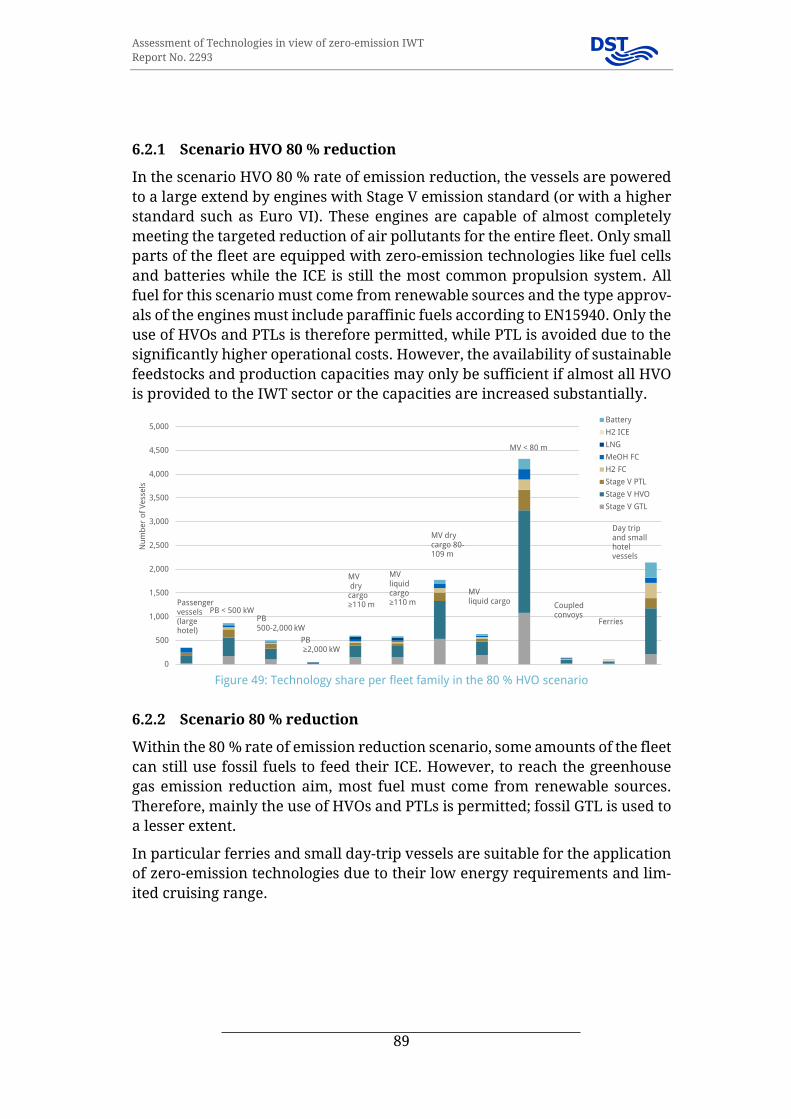
Assessment of Technologies in view of zero-emission IWT
Report No. 2293
89
6.2.1 Scenario HVO 80 % reduction
In the scenario HVO 80 % rate of emission reduction, the vessels are powered
to a large extend by engines with Stage V emission standard (or with a higher
standard such as Euro VI). These engines are capable of almost completely
meeting the targeted reduction of air pollutants for the entire fleet. Only small
parts of the fleet are equipped with zero-emission technologies like fuel cells
and batteries while the ICE is still the most common propulsion system. All
fuel for this scenario must come from renewable sources and the type approv-
als of the engines must include paraffinic fuels according to EN15940. Only the
use of HVOs and PTLs is therefore permitted, while PTL is avoided due to the
significantly higher operational costs. However, the availability of sustainable
feedstocks and production capacities may only be sufficient if almost all HVO
is provided to the IWT sector or the capacities are increased substantially.
Figure 49: Technology share per fleet family in the 80 % HVO scenario
6.2.2 Scenario 80 % reduction
Within the 80 % rate of emission reduction scenario, some amounts of the fleet
can still use fossil fuels to feed their ICE. However, to reach the greenhouse
gas emission reduction aim, most fuel must come from renewable sources.
Therefore, mainly the use of HVOs and PTLs is permitted; fossil GTL is used to
a lesser extent.
In particular ferries and small day-trip vessels are suitable for the application
of zero-emission technologies due to their low energy requirements and lim-
ited cruising range.
0
500
1,000
1,500
2,000
2,500
3,000
3,500
4,000
4,500
5,000
Nu
mb
er
of
Ve
sse
ls
Battery
H2 ICE
LNG
MeOH FC
H2 FC
Stage V PTL
Stage V HVO
Stage V GTL
Passenger vessels (large hotel)
PB < 500 kW PB500-2,000 kW
PB≥2,000 kW
MVdry cargo ≥110 m
MVliquid cargo ≥110 m
MV dry cargo 80-109 m
MV < 80 m
Coupled convoys
Ferries
Day trip and small hotel vessels
MVliquid cargo

Assessment of Technologies in view of zero-emission IWT
Report No. 2293
90
Figure 50: Technology share per fleet family in the 80 % scenario
6.2.3 Scenario HVO 90 % reduction
Within the HVO 90 % emission reduction scenario, a considerable share of the
fleet is expected to be equipped with Stage V emission standard engines (and
engines with a higher standard such as Euro VI). Some amounts of the fleet
can still use an ICE coupled with fossil fuels for propulsion as long as it is com-
bined with an adequate exhaust aftertreatment. However, to reach the green-
house gas emission reduction aim, while keeping the investment costs ac-
ceptable all drop-in fuels must come from renewable sources. The use of HVOs
is highly encouraged and PTLs are also permitted; fossil GTL is not used in this
scenario at all.
Only a minor share of the fleet is equipped with zero-emission technologies.
In particular the fleet families of ferries and small day-trip vessels are appro-
priate for the use of zero-emission technologies due to their low energy re-
quirements and limited cruising range. Also, large hotel vessels are particu-
larly useful for the application of the methanol fuel cell in combination with a
battery. Although small motor vessels are expected to have more difficulties
to finance zero-emission technologies like fuel cells and batteries they have to
contribute to these sections as there are too many of them to otherwise suc-
cessfully reach the aim.
0
500
1,000
1,500
2,000
2,500
3,000
3,500
4,000
4,500
5,000
Nu
mb
er
of
Ve
sse
ls
Battery
H2 ICE
LNG
MeOH FC
H2 FC
Stage V PTL
Stage V HVO
Stage V GTL
Passenger vessels (large hotel)
PB < 500 kW PB500-2,000 kW
PB≥2,000 kW
MVdry cargo ≥110 m
MVliquid cargo ≥110 m
MV dry cargo 80-109 m
MV < 80 m
Coupled convoys
Ferries
Day trip and small hotel vessels
MVliquid cargo

Assessment of Technologies in view of zero-emission IWT
Report No. 2293
91
Figure 51: Technology share per fleet family in the HVO 90 % scenario
6.2.4 Scenario 90 % reduction
The alternative 90 % rate of emission reduction scenario is not mainly based
on HVO as in addition the availability of larger volumes is not ensured. Still a
considerable share of the fleet is expected to be equipped with Stage V emis-
sion standard engines (and engines with a higher standard such as Euro VI).
Also, some amounts of the fleet can still use an ICE coupled with fossil fuels
for propulsion as long as it is combined with an adequate exhaust aftertreat-
ment. However, the investment costs for this scenario rise as more vessels are
equipped with zero-emission technologies like fuel cells and batteries. There
is still quite some amount of HVOs being used as well as PTLs, both permitted
due to their renewable bases; fossil GTL can be used to an even lesser extent
than in the 80 % scenario.
Figure 52: Technology share per fleet family in the 90 % scenario
0
500
1,000
1,500
2,000
2,500
3,000
3,500
4,000
4,500
5,000
Nu
mb
er
of
Ve
sse
ls
Battery
H2 ICE
LNG
MeOH FC
H2 FC
Stage V PTL
Stage V HVO
Stage V GTL
Passenger vessels (large hotel)
PB < 500 kW
PB500-2,000 kW
PB≥2,000 kW
MVdry cargo ≥110 m
MVliquid cargo ≥110 m
MV dry cargo 80-109 m
MV < 80 m
Coupled convoys
Ferries
Day trip and small hotel vessels
MVliquid cargo
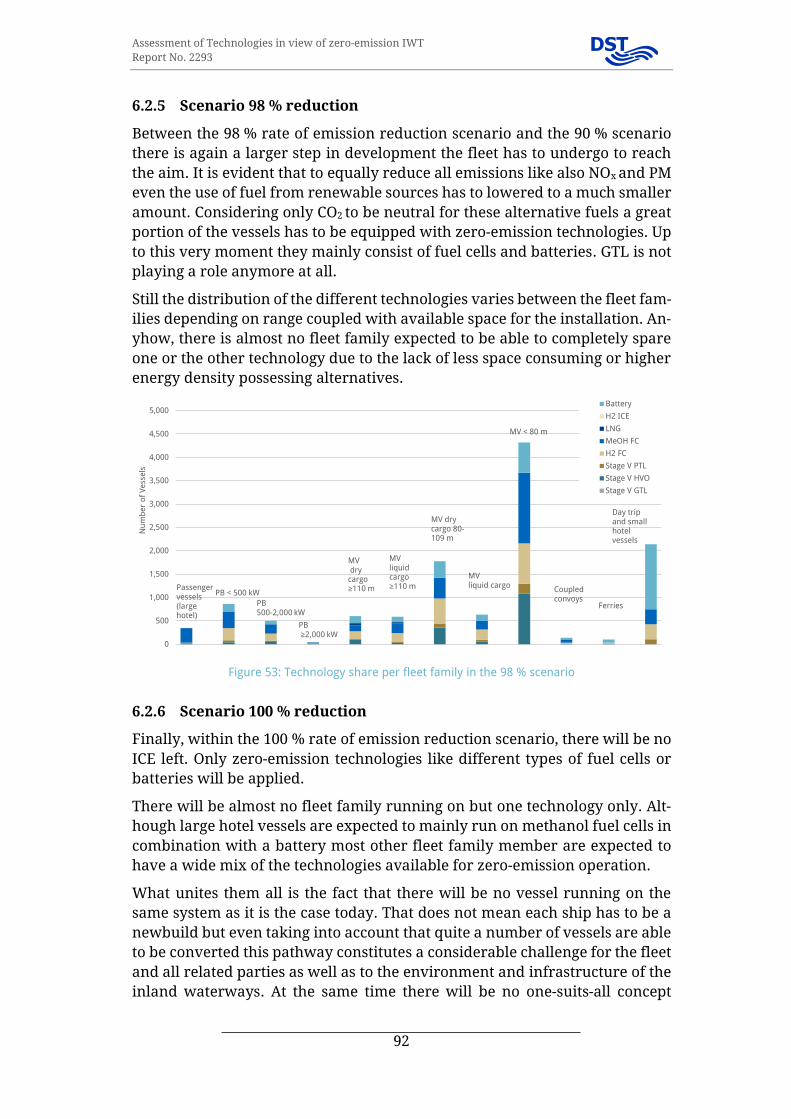
Assessment of Technologies in view of zero-emission IWT
Report No. 2293
92
6.2.5 Scenario 98 % reduction
Between the 98 % rate of emission reduction scenario and the 90 % scenario
there is again a larger step in development the fleet has to undergo to reach
the aim. It is evident that to equally reduce all emissions like also NOx and PM
even the use of fuel from renewable sources has to lowered to a much smaller
amount. Considering only CO2 to be neutral for these alternative fuels a great
portion of the vessels has to be equipped with zero-emission technologies. Up
to this very moment they mainly consist of fuel cells and batteries. GTL is not
playing a role anymore at all.
Still the distribution of the different technologies varies between the fleet fam-
ilies depending on range coupled with available space for the installation. An-
yhow, there is almost no fleet family expected to be able to completely spare
one or the other technology due to the lack of less space consuming or higher
energy density possessing alternatives.
Figure 53: Technology share per fleet family in the 98 % scenario
6.2.6 Scenario 100 % reduction
Finally, within the 100 % rate of emission reduction scenario, there will be no
ICE left. Only zero-emission technologies like different types of fuel cells or
batteries will be applied.
There will be almost no fleet family running on but one technology only. Alt-
hough large hotel vessels are expected to mainly run on methanol fuel cells in
combination with a battery most other fleet family member are expected to
have a wide mix of the technologies available for zero-emission operation.
What unites them all is the fact that there will be no vessel running on the
same system as it is the case today. That does not mean each ship has to be a
newbuild but even taking into account that quite a number of vessels are able
to be converted this pathway constitutes a considerable challenge for the fleet
and all related parties as well as to the environment and infrastructure of the
inland waterways. At the same time there will be no one-suits-all concept
0
500
1,000
1,500
2,000
2,500
3,000
3,500
4,000
4,500
5,000
Nu
mb
er
of
Ve
sse
ls
Battery
H2 ICE
LNG
MeOH FC
H2 FC
Stage V PTL
Stage V HVO
Stage V GTL
Passenger vessels (large hotel)
PB < 500 kW
PB500-2,000 kW
PB≥2,000 kW
MVdry cargo ≥110 m
MVliquid cargo ≥110 m
MV dry cargo 80-109 m
MV < 80 m
Coupled convoys
Ferries
Day trip and small hotel vessels
MVliquid cargo

Assessment of Technologies in view of zero-emission IWT
Report No. 2293
93
designing a type ship per fleet and technology as even the members of each
fleet family are to divers to allow such principle to be applied.
Figure 54: Technology share per fleet family in the 100 % scenario
6.3 Costs of the scenarios
The investment costs for the HVO 80 % scenario including the use of a large
volume of HVOs is the scenario with the lowest investment needs. Just very
few zero-emission drivetrains are included, as the reduction of air pollutant
emissions is sufficient with Stage V (or equivalent) aftertreatment. However,
the availability of carbon-neutral drop-in fuels will be limited and priority for
use in IWT is not probable.
The investment costs for the 80 % scenario are a bit higher than for the HVO
80 % one as more vessels are equipped with zero-emission technologies to
compensate for the fossil fuels still being burned. Emission reduction by 90 %
already costs about twice as much, even while trying to keep the investment
costs acceptable with the use of fuel from renewable sources only (scenario
HVO 90 %). In the 90 % scenario the costs rise with the decreasing use of drop-
in fuels from renewable sources (whose capacities free to be used by the ship-
ping sector are still uncertain at this point) being replaced by fuel cells and
batteries.
Between the 98 % scenario and the 90 % scenario there is again a larger step
related to the costs. As even the use of drop-in fuel from renewable sources
for combustion engines shrink to a much smaller amount now. This is due to
the fact that not only CO2 (assumed to be neutral for these alternative fuels)
but also other emissions like NOx and PM have to be equally reduced.
The 100 % scenario however, has the highest costs and is requiring the biggest
change in energy supply for IWT. To get 20 % more efficient we have to spend
approximately four times the amount than to get 80 % more efficient com-
pared to 2015. The last 2 % between the 98 % and the 100 % scenario are al-
most as cost intensive as the whole HVO 80 % scenario by itself. Therefore
0
500
1,000
1,500
2,000
2,500
3,000
3,500
4,000
4,500
5,000
Nu
mb
er
of
Ve
sse
lsBattery
H2 ICE
LNG
MeOH FC
H2 FC
Stage V PTL
Stage V HVO
Stage V GTL
Passenger vessels (large hotel)
PB < 500 kW
PB500-2,000 kW
PB≥2,000 kW
MVdry cargo ≥110 m
MVliquid cargo ≥110 m
MV dry cargo 80-109 m
MV < 80 m
Coupled convoys
Ferries
Day trip and small hotel vessels
MVliquid cargo

Assessment of Technologies in view of zero-emission IWT
Report No. 2293
94
becoming 100 % emission free has to be the goal on the long term but for the
goal reached by 2050 this will be highly price driven.
Figure 55: Cost range per scenario
For the 90 % scenario as the mean of the scenarios, with average cost figures
the costs for each percent emission reduction were derived once for the re-
duction within the fleet family and once for the whole fleet (see Table 11). This
simplified approach shows that investment is made most efficiently in vessels
with the highest energy throughput. Another factor for the prioritization can
be derived from the operational area. Especially, the air pollutants should be
reduced first in sensitive areas like ports and stretches with a high density of
population.
Table 11: Reduction costs in the 90 % scenario
Costs per % reduction per fleet family
Costs per % reduction for the entire fleet
Passenger vessels (large hotel) 6,169,735 € 58,590,040 € Push boats < 500 kW 6,076,432 € 350,519,415 € Push boats 500 - 2,000 kW 7,744,900 € 154,866,975 € Push boats ≥ 2,000 kW 2,482,574 € 54,730,921 € Motorvessels dry cargo ≥ 110 m 15,038,133 € 119,472,458 € Motorvessels liquid cargo ≥ 110 m 14,205,222 € 113,021,438 € Motorvessels dry cargo 80-109 m 24,531,619 € 138,057,440 € Motorvessels liquid cargo 80-109 m 10,645,053 € 114,050,877 € Motorvessels < 80 m 33,102,182 € 248,677,825 € Coupled convoys 4,556,346 € 95,820,376 € Ferries 888,655 € 143,317,501 € Day trip and small hotel vessels 17,762,207 € 244,852,335 €

Assessment of Technologies in view of zero-emission IWT
Report No. 2293
95
7 Summary, Conclusions and Outlook
The study reported herein was undertaken in the context of the declaration of
Mannheim and the underlying objective of emission reductions up to largely
zero-emission inland shipping by 2050. First, the status quo of the European
fleet and its emissions for the year 2015 was summarized on the basis of data
available from the CCNR, the Danube Commission, assessments performed
within the H2020 project PROMINENT and several other sources. Afterwards,
energy carriers and energy conversion technologies with at least TRL 7 with
their basic characteristics were described and assed regarding applicability in
the inland navigation sector. For each solution cost figures and predictions for
the next 30 years were collected, filtered and compiled to optimistic, moderate
and pessimistic scenarios. Other technological options like lithium-air batter-
ies, LOHC, formic acid (hydrozine) or the use of green ammonia with appro-
priate crackers in combination with fuel cells or internal combustion engines
might play significant roles in later stages of the energy transition. However,
they have not yet reached sufficient TRL and well-founded cost figures to rec-
ommend the widespread implementation and are, therefore, not considered
in the calculation.
The fleet families defined in the PROMINENT project were expanded slightly
and the suitability of technologies was rated for twelve ship types. For each
family a representative ship was described with a possible zero-emission sys-
tem and the related investment and operational costs. Afterwards, several ex-
emplary chains of measures for each segment of the fleet were iteratively cho-
sen to meet the emission reduction goals by 2035 and 2050. The related invest-
ment costs for advanced drive trains were calculated for the three cost levels
mentioned above. It was assumed that the age distribution in each fleet seg-
ment remains constant. Therefore, both newbuilt ships and conversions of ex-
isting vessels are considered. Especially retrofitting zero-emission technolo-
gies to older vessels is complex and requires major conversions in most cases.
At the same time, it can be a cost-effective approach which need to be weighed
in the light of the remaining lifespan of each vessel. Nevertheless, as it is not
realistic that the fleet will be completely renewed by 2050 this aspect has to be
part of the concept.
The chains of measures for 2050 were elaborated for different ambition levels
of emission reduction by at least 80 %, 90 %, 98 % and complete avoidance of
air pollutants and CO2 in a tank-to-wake perspective. Air pollutants can be
avoided to a large extent with combustion engines and modern aftertreatment
systems. A fleet fully equipped with Stage V IWP/IWA engines would emit 79 %
less NOx and 97 % less particles compared to the 2015 baseline. With NRE or
Euro VI truck engines NOx emissions were reduced by approximately 95 %.
Due to the differing test cycles for these engine types no exact numbers can be
given. A future emission regulation going beyond the Stage V limits would al-
low further reductions also for large IWP engines.

Assessment of Technologies in view of zero-emission IWT
Report No. 2293
96
CO2 emissions are the most challenging part. They can be primary reduced by
decreasing the energy demand with improved utilization of the vessels, slow
and smart steaming with less waiting times at locks and efficient integration
of IWT in sea ports. Secondary, alternative drop-in fuels with sustainable feed-
stock and upstream chain can play a major role to reduce the carbon footprint.
In the study HVO and PTL were considered as carbon-neutral fuels which is in
line with the IPCC assumptions [19] (see also section 3.1.5). However, the avail-
ability of these fuels and the related bunkering costs are hard to predict. If
other transport modes are prioritized to use these advanced bio-fuels, the re-
sources may be insufficient for predominant use in the inland shipping sector.
Costs and sustainability depend on feedstocks and green electric energy. With
the efficiency measures, approximately 15 % of the energy demand may be
covered by fossil fuels in 2050 to achieve 90 % CO2 reduction.
Decarbonisation without conventional combustion engines comes with signif-
icant challenges for energy storage and much higher costs. Today the authors
consider it too early to decide for one or few technologies. Further technology-
neutral developments and pilot applications are required. Multiple research
and development projects are running or planned. Their success regarding
sustainable zero-emission solutions at feasible costs cannot be foreseen as of
today.
For the relatively small sector decisive technological leaps are unlikely to hap-
pen internally. Therefore, the developments in other sectors like long-distance
road haulage should be monitored. On a midterm basis, electric drives with
modern combustion gensets, potentially already including a battery and/or
fuel cell to avoid emissions in ports and urban areas and future proof power
management can be considered as a precursor for the later implementation
of affordable zero-emission power sources. Since the retrofitting of existing
vessels often requires extensive and costly conversions, the focus for ad-
vanced drivetrains should be on newbuilds. To equip many fleets with clean
systems in a relatively short time, it is recommended to prepare for and use
standardized systems, e.g. battery containers or fuel cells and hydrogen stor-
age in container modules.
When an engine needs to be replaced on an existing ship, some of these vessels
will not operate until 2050 and the environmental performance is significantly
increased with a right-sized Stage V engine ready for the use of drop-in fuels.
A long-term roadmap for the implementation of these second and third gen-
eration biofuels and blends is required. Engine suppliers have to include them
in their fuel directives and production capacities need to be increased.
Given the long lifecycles in the sector the transition should be started as soon
as possible while the legal framework, the market parameters and the cost
structures will hardly bring the required momentum. Therefore, the studies
“Financing the energy transition towards a zero-emission European IWT sec-
tor” are an important step to prepare the Europe-wide coordination.

Assessment of Technologies in view of zero-emission IWT
Report No. 2293
97
8 Bibliography
[1] R. D. Lasco et al., “2006 IPCC Guidelines for National Greenhouse Gas
Inventories, Chapter 5 CROPLAND,” 2006.
[2] National administrations, “IVR Database”.
[3] WSV, „Altersstruktur der deutschen Binnenflotte,“ 2016.
[4] Danube Commission, “Danube Commission market observation report,”
2018.
[5] B. Kelderman, B. Friedhoff, T. Guesnet, B. Holtmann, R. Kaiser, M.
Eppich, R. Rafael, N. Dasburg, R. Liere, M. Quispel, G. Maierbrugger and
J. Schweighofer, PROMINENT - D1.1 List of operational profiles and fleet
families, 2016.
[6] F. Dahlke und B. Friedhoff, „Energieträger für die Binnenschifffahrt
von Morgen,“ in Jahrbuch der Schiffbautechnischen Gesellschaft, 2018.
[7] VDMA, “Abgasgesetzgebung Diesel- und Gasmotoren,” 2011.
[8] P. Mensch, D. Abma, R. Verbeek and W. Hekman, “D5.7 Technical
evaluation of procedures for Certification, Monitoring & Enforcement,”
2017.
[9] IAKS, “Bericht der IAKS über die jährliche Bewertung des
Finanzierungssystems und Vorschlag für den Betrag der
Entsorgungsgebühr 2019 (CDNI),” 2019.
[10] MariGreen, “Perspectives for the Use of Hydrogen as Fuel in Inlad
Shipping, 2018,” https://www.dst-org.de/wp-
content/uploads/2018/11/Hydrogen-Feasibility-Study-MariGreen.pdf.
[11] E. A. Brohi, “Ammonia as fuel for internal combustion engines?,” 2014.
[12] H. Matschiner, “Nutzung von Ammoniak zu Energieerzeugung,” in
Fachtagung Möglichkeiten des Betriebs von Brennstoffzellen mit
Verbrennungsgas, Magdeburg, 2007.
[13] K. Kugler, A. Mitsos, G. Wang and M. Wessling, “Ammoniaksynthese 2.0
– Elektrochemie versus Haber Bosch Ergebnisse einer
Prozesssimulation,” 2015.
[14] Institute for Sustainable Process Technology, “Power to Ammonia -
Feasibility Study for the value chains and business cases to produce
CO2-Free ammonia suitable for various mar-ket applications,” 2017.
[15] A. Valera-Medina, et al., “Ammonia for power,” Progress in Energy and
Combustion Science, vol. 69, 2018.
[16] International DME Association, Simple, Available, Sustainable, Low-
Emission,Infrastructure Compatible Fuel, https://www.aboutdme.org,
2020.
[17] FLEDGED, Flexible Dimethyl Ether Production from Biomassgasification
with Soprtion Enhanced Process, http://www.fledged.eu, 2020.

Assessment of Technologies in view of zero-emission IWT
Report No. 2293
98
[18] EUROMOT, “FAQ / Guidance notes,” 2020.
[19] DNVGL, “2019 ENERGY TRANSITION OUTLOOK A global and regional
forecast to 2050,” 2019.
[20] C. Davies Waldron, et al. , “2006 IPCC Guidelines for National
Greenhouse Gas Inventories, Chapter 3 MOBILE COMBUSTION,” 2006.
[21] Neste Corporation, “Neste Renewable Diesel Handbuch,” 2016.
[22] Arbeitsgruppe 2: Alternative Antriebe und Kraftstoffe für nachhaltige
Mobilität, Elektromobilität, Brennstoffzelle, “Elektromobilität,
Brennstoffzelle, alternative Kraftstoffe - Einsatzmöglichkeiten aus
technologischer Sicht,” 2019.
[23] IRENA, “Production of Bio-methanol: Technology Brief,” 2013.
[24] European Union, “REGULATION (EU) 2016/1628 OF THE EUROPEAN
PARLIAMENT AND OF THE COUNCIL of 14 September 2016 on
requirements relating to gaseous and particulate pollutant emission
limits and type-approval for internal combustion engines for non-road
mobile machinery, amending Regulations (EU) No 1024/2012 and (EU)
No 167/2013, and amending and repealing Directive 97/68/EC,” 2016.
[25] S. Cornelis, “Do gas trucks reduce emissions?,” 2019.
[26] ICCT, “EUROPEAN STAGE V NON-ROAD EMISSION STANDARS,” 2016.
[27] H. Stellmach, “Deutz baut Wasserstoff-Verbrennungsmotor,” B_I
baumagazin, 2020.
[28] H. Eichsleder and M. Klell, Wasserstoff in der Fahrzeugtechnik,
Vieweg+Teubner, 2010.
[29] Keyou Website, 2020.
[30] Central Commission for the Navigation of the Rhine, “Possibilities for
reducing fuel consumption and greenhouse gas emissions from inland
navigation,” 2012.
[31] K. Baes, “Future of batteries,” 2018.
[32] L. Goldie-Scot, “A Behind the Scenes Take on Lithium-ion Battery
Prices,” 2019.
[33] I. Tsiropoulos, D. Tarvydas and N. Lebedeva, “Li-ion batteries for
mobility and stationary storage applications Scenarios for costs and
market growth,” 12 2018.
[34] DST, “E-Binnenschiff Online Tool,” [Online]. Available: dst-org.de/e-
binnenschiff/.
[35] S. S. Marc Castedello, “Cost of Capital Study 2018,” 2018.
[36] J. Hobohm, A. A. der Maur, H. Dambeck, D. A. Kemmler, S. Koziel, S.
Kreidelmeyer, D. A. Piégsa and P. Wendring, “Status und Perspektiven
flüssiger Energieträger in der Energiewende,” 2018.
[37] M. Kaltschmitt, H. Hartmann and H. Hofbauer, Energie aus Biomasse,
Springer Berlin Heidelberg, 2009.

Assessment of Technologies in view of zero-emission IWT
Report No. 2293
99
[38] W. Maus, Zukünftige Kraftstoffe, Springer Vieweg, 2019.
[39] D. Unruh, M. Rohde and G. Schaub, “Fischer-Tropsch Synthese von
Kohlenwasserstoffen ausgehend von Biomasse –In-situ H2O-
Abscheidung und Verbesserung der Kohlenstoff-Nutzung,” 2003.
[40] Audi, “Audi e-gas Projekt,” 2016.
[41] German Environment Agency, “Power-to-Liquids Potentials and
Perspectives for the Future Supply of Renewable Aviation Fuel,” 2016.
[42] J. A. Ryste, “Comparison of Alternative Marine Fuels,” 2019.
[43] M. Zapf, Stromspeicher und Power-to-Gas im deutschen Energiesystem,
Springer Fachmedien Wiesbaden, 2017.
[44] IEA, “The future of hydrogen,” 2019.
[45] IEA, “World Energy Outlook 2019,” Paris,
https://www.iea.org/reports/world-energy-outlook-2019, 2019.
[46] EA-ETSAP and IRENA, Production of Bio-Methanol, 2013.
[47] Central Commission for the Navigation of the Rhine, “Jahresbericht
2018, Europäische Binnenschifffahrt, Marktbeobachtung,” 2019.
[48] N. Pavlenko, B. Comer, Y. Zhou, N. Clark and D. Rutherford, “The
climate implications of using LNG as a marine fuel,” ICCT WORKING
PAPER 2020-02, 2020.
[49] Central Commission for the Navigation of the Rhine, Mannheim
Declaration “150 years of the Mannheim Act – the driving force behind
dynamic Rhine and inland navigation”, 2018.
[50] Schellnhuber, H.J. et al. , “Kassensturz für den Weltklimavertrag – Der
Budgetansatz (Sondergutachten),” Wissenschaftlicher Beirat der
BundesregierungGlobale Umweltveränderungen (WBGU), Berlin, 2009.
[51] M. Zapf, Stromspeicher und Power-to-Gas im deutschen Energiesystem,
Springer Fachmedien Wiesbaden, 2017.
[52] G. Zachmann, M. Holtermann, J. Radeke, M. Tam, M. Huberty, D.
Naumenko and A. Ndoye, The great transformation: decarbonising
Europe's energy and transport systems, 2020.
[53] P. Kurzweil and O. K. Dietlmeier, Elektrochemische Speicher, Springer
Fachmedien Wiesbaden, 2015.
[54] M. Klell, H. Eichlseder and A. Trattner, Wasserstoff in der
Fahrzeugtechnik, Springer Fachmedien Wiesbaden, 2018.
[55] IRENA, Global Renewables Outlook: Energy transformation 2050,
IRENA, 2020.
[56] M. Fröba, “Wasserstoff als Energiespeicher - Vorkommen, Darstellung
und Nutzung,” 2014.
[57] L. Bauer, “Methanol and Bio-economy: Now and the Future,” 2017.
[58] P. Gerbert et al., “Klimapfade für Deutschland,” 2018.

Assessment of Technologies in view of zero-emission IWT
Report No. 2293
100
[59] CESNI and EUROMOT, “Frequently asked questions about Regulation
(EU) 2016/1628,” 2019.
[60] “Final Report Summary - JOULES (Joint Operation for Ultra Low
Emission Shipping),” Grant agreement ID: 605190, 2017.
[61] European Union, Directive 2014/94/EU of the European Parliament and
of the Council of 22 October 2014 on the deployment of alternative fuels
infrastructure Text with EEA relevance, 2014.
[62] Bundesverband der Deutschen Binnenschifffahrt e.V, Daten & Fakten
2015/2016, 2016.
[63] Danube Commission, “DANUBE NAVIGATION STATISTICS in 2014-
2015,” 2016.
[64] B. Friedhoff, D. Abma, P. V. Mensch, R. Verbeek, A.-C. Schulz and A.
Lutz, “Digital solutions for environmental performance and efficient
navigation using on-board monitoring and river modelling,” 2018.
[65] European Union, The European Green Deal, 2020.
[66] DST, “GRENDEL Fact Sheets on Greening Technologies,” 2020.
[67] M. Quispel et al., D 6.7 Assessment, Recommendation and Roadmap,
2018.