towards zero-emission electric bus commuting
TRANSCRIPT
ELECTRIC BUS TOWARDS ZERO-EMISSION COMMUTING
Author: Anumita Roychowdhury and Sayan Roy
Editor: Archana Shankar
Cover design: Ajit Bajaj
Production: Rakesh Shrivastava and Gundhar Das
© 2021 Centre for Science and Environment
Material from this publication can be used, but with acknowledgement.Maps in this report are indicative and not to scale.
Citation: Anumita Roychowdhury and Sayan Roy 2021, Electric Bus: Towards Zero-Emission Commuting, Centre for Science and Environment, New Delhi.
Published byCentre for Science and Environment41, Tughlakabad Institutional AreaNew Delhi 110 062Phones: 91-11-40616000 Fax: 91-11-29955879E-mail: [email protected]: www.cseindia.org
The views/analysis expressed in this report/document do not necessarily reflect the views of Shakti Sustainable Energy Foundation. The Foundation also does not guarantee the accuracy of any data included in this publication nor does it accept any responsibility for the consequences of its use.
ELECTRIC BUS TOWARDS ZERO-EMISSION COMMUTING

5
Contents
WHY THIS STUDY? 7
SUMMARY HIGHLIGHTS 12
Changing nature of the market 12
Challenges faced by State Transport Undertakings 13
The way forward 17
SECTION 1 21
E-buses—rules of the game 21
Policy mandate 22
SECTION 2 28
Emergence of e-bus market 28
Who produces e-buses in India? 29
Characterizing product portfolio 32
Summary pattern in Indian e-bus market 34
SECTION 3 44
E-bus operations in India 44
Bus operation model 45
How bus tendering is changing 48
Deployment strategy 56
Challenge faced by OEMs 58
Challenges faced by authorities, STUs and operators 59
SECTION 4 61
The way forward 61
Strengthen the FAME II incentive framework 61
Interventions needed at the state and/or city level 62
6
ELECTRIC BUS: TOWARDS ZERO-EMISSION COMMUTING
ANNEXURES 64
Annexure 1: Electric and hybrid buses sanctioned under FAME I 64
Annexure 2: Planned electric bus deployment under FAME II 64
Annexure 3: List of sanctioned buses under FAME II 65
Annexure 4: Status of e-bus operations in India (till March 2021) 67
Annexure 5: List of approved e-bus supply order under FAME II (till March 2021) 68
Annexure 6: Number of operational e-buses vis-à-vis approved supply order in India (till March 2021) 71
REFERENCES 72
7
Why this study?Electric buses (e-buses) are central to India’s electric mobility programme. They are a unique opportunity to decarbonize a sizeable share of daily travel trips in cities and reduce toxic exposures. The second phase of the incentive programme of the Government of India for electric vehicles, Faster Adoption and Manufacturing of (Hybrid and) Electric Vehicles in India Phase 2 (FAME II) Scheme, supports procurement of electric buses by the states or cities and is an early strategy to promote electric mobility. It is necessary to understand the learnings so far to inform the next stage of transition, especially during these pandemic times.
The public-transport-centric e-mobility programme is greatly relevant to India’s decarbonization goal of reducing the energy intensity of growth by 2030 by at least 33–35 per cent from the 2005 level as part of its nationally determined commitment for climate mitigation. It can also be a major contributer to meeting by 2024 the target of reducing particulate pollution by 20–30 per cent from the 2017 level under the National Clean Air Programme. Several non-attainment cities that have access to funding of e-buses have included this strategy as part of their clean air action plan.
As buses play a crucial role in mobility, there is a strong case for prioritizing the e-bus programme. Almost 90 per cent of the demand for formal public transport is said to be met by buses in cities that have organized bus transport.1
The 2016 National Sample Survey Organization (NSSO) of the Government of India recognized buses as the most preferred mode of mass transport in both rural and urban India. An NSSO survey revealed that for approximately 66 per cent of rural households and 62 per cent of urban households, transport expenditure is highest for buses compared to other modes.2
According to 2016 Central Institute of Road Transport (CIRT) report, public State Transport Undertaking (STUs) collectively owned 150,000 buses—which was 10 per cent of the total buses in India—and carried 69 million passengers, including both intra-city and intercity services, each day. While this number has changed over time, it is also an indicator that electrification of buses can potentiality convert millions of trips into zero-emission trips.
Bus transport falls largely within the ambit of the jurisdiction of state, and most cash-strapped state governments find it challenging to fund extensive bus sector reforms. Central funding of buses has always remained small and intermittent. The last major
8
ELECTRIC BUS: TOWARDS ZERO-EMISSION COMMUTING
Central funding of buses was under the urban renewal programme Jawaharlal Nehru National Urban Renewal Mission (JnNURM), introduced in 2007.
The electric bus programme is a policy-driven market. The FAME programme has been designed to catalyse the e-bus market. Since its inception it has been progressively amended to respond to the needs. This presents a learning curve to chart next steps.
FAME I, which commenced in 2015, initiated the e-bus programme but could not provide the desired push. It slipped milestones and deadlines and started slow. Its scale and focus on cities was limited. Cities had very little time to prepare and plan. Also, the focus on buses was fairly diluted and did not pay adequate attention to technology selection, fleet planning and deployment strategies in cities that have bearing on their performance and total cost of ownership. Less than 500 buses could be deployed during this phase.
Subsequently, FAME II—which came into force in 2019—attempted to address several limitations of FAME I in terms of coverage, promotion of cleaner technology, clear deployment targets of 7,000 e-buses, dedicated fund allocation, bus operation models etc. It provided a uniform demand incentive of Rs 20,000 per KWh (kilowatt-hour) for a maximum of up to Rs 50 lakh per bus for battery size up to 250 KWh. Rules were changed further to adopt an operational model based on gross cost contract that allows shared responsibility and costs. Bus transport agencies do not have to make outright purchase of buses; instead, the original equipment manufacturer (OEM) or the designated operators take the responsibility of providing the buses as well as operating, managing and maintaining the fleet and are paid on a per kilometre basis. This reduces the risk for the State Transport Undertaking (STU) buses with regard to the new technology. Under this framework, incentives are limited to 40 per cent of bus cost.
There has still been considerable uncertainty in the market, sometime leading to delay or cancellation of bus tenders. Nonetheless, FAME II has been more successful in catalysing the bus market.
In addition to Central support, state-level interventions in terms of adoption of electric vehicle policy with targeted e-bus deployment, tax incentives, subsidy or special tariff on electricity etc. have aided in the transition. For instance, Andhra Pradesh has targeted 100 per cent conversion of the bus fleet to electric in major cities by 2024 and in the entire state by 2029. Delhi has pledged to convert 50 per cent of all stage carriage buses by 2022. Kerala targets converting the entire bus fleet by 2025. Tamil Nadu aims to procure 1,000 e-buses every year. The draft policies of Madhya Pradesh and Telangana have targeted 100 per cent conversion of their bus fleets by 2028 and 2030, respectively. Punjab has
9
waived off the permit fee and motor vehicle (MV) tax for private operators. Assam has decided to exempt e-buses from the state goods and services tax (GST).
Pandemic disruption: At this stage of take-off of the electric vehicle sector, the Covid-19 pandemic has hit hard, slowing down progress. An announcement regarding invites for procurement of new e-buses is delayed. Disruption of the global supply chain in this import-dependent market has added to the challenges. Even after receiving orders, the manufacturers have not been able to supply buses. For the same reason, even after a year of receiving the supply order of almost 2,450 buses under FAME II, the original equipment manufacturers (OEMs) or bus manufacturers are able to supply just a few buses.
Overall, the bus sector has been battling ridership and revenue losses for several years. The public transit agencies are struggling to cope with operational losses. As their funding is constrained, major infrastructure upgradation or fleet augmentation has also not been possible for nearly 10 years. At the same time, fleet size is reducing annually due to ageing and phasing out of old buses.
The pandemic has made this worse. The cumulative effects of hygiene and physical distancing norms and fear of virus infection during the pandemic has reduced ridership by 30–40 per cent compared to normal times and viability gap funding has increased by nearly 70 per cent. Public transit agencies have been forced to decrease services by half or more to reduce their operational expenses. Maintaining Covid protocol has increased the cost of operation. When bus agencies are struggling to operate their existing fleets and survive the new normal, it’s likely that augmentation of new services, especially the e-bus service, will face a slowdown.
New FAME II amendment for e-buses: While pandemic disruption has cast a long shadow on the prospect of the e-bus future in India, there was movement in June 2021 when the Ministry of Heavy Industries amended the existing scheme. While amending rules for several vehicle segments, it has adopted the strategy of aggregating the demand for e-buses for deployment in cities.
Accordingly, the responsibility of aggregating the demand for both three-wheelers and buses was given to the Energy Efficiency Services Limited (EESL), a joint venture between the Central Public Sector Undertakings (CPSUs), which includes NTPC Limited, PFC Limited, REC Limited and the Power Grid Corporation of India Limited. The EESL has been entrusted to create demand for the remaining FAME II buses—those not so far tendered out in Phase 1 of FAME-II—in nine mega cities of India, including Mumbai, Delhi, Bangalore, Hyderabad, Ahmedabad, Chennai, Kolkata, Surat and Pune on the Gross Cost Contract (GCC) model.
10
ELECTRIC BUS: TOWARDS ZERO-EMISSION COMMUTING
The context of this amendment is that FAME is currently targeting as many as 100 cities, including cities with population of one million-plus (as per the 2011 census), state capitals, smart cities etc., with an outlay of Rs 10,000 crore for three years, which is a small amount to create substantial demand in such a vast geography. This has led to a demand for focused investment to be able to create a few electric vehicle (EV) growth centres in the country for a concentrated development of infrastructure. This is expected to reduce the overall cost of vehicles to achieve scale and be a greater enabler for state governments. These cities also become demonstration centres to present a learning curve to other cities.
The majority of these cities have already placed orders for close to 300 or more buses. Approximately 2,500 or more buses are still to be procured (as only 4,500 out of a total of 7,000 buses have been tendered so far). Even if the remaining buses are distributed among nine cities, each city will have 500 or more e-buses in the end, which can help them achieve some scale. Delhi and Bengaluru are moving towards a fleet strength of 500–600 e-buses, i.e. almost 10 per cent of the overall e-bus fleet.
Additionally, EESL is also developing EV charging infrastructures in Indian cities. They have already planned to set up around 2,000 EV charging stations across India, including the target of installing 500 charging station in Delhi-NCR alone. Similarly, they have also partnered with cities such as Hyderabad, Ahmedabad, Chennai and a few more to set up such infrastructures. Thus, now entrusting the same authority for demand aggregation shall certainly help in better coordination and creation of EV ecosystems in these cities.
Currently, the e-bus fleet is not uniformly distributed across states. If the current fleet of running e-buses is considered, the top four states include Maharashtra—with 276 e-buses—followed by West Bengal with 80, Himachal Pradesh with 75 and Goa with 50. Other states with smaller fleets include Uttar Pradesh, Telangana and Madhya Pradesh. However, this order changes if the new supply orders that has been approved are considered. In that case, Uttar Pradesh leads with approved 600 e-buses followed by Maharashtra at 590, Tamil Nadu at 525, Gujarat at 500, Madhya Pradesh at 340, Karnataka at 300 and Delhi at 300. The top metropolitan cities in these states are deploying these buses.
On the whole, it is important to recognize that the success of the e-bus programme is also linked with the recovery of the overall bus sector. To tide over this crisis, financial recovery packages are essential not only for e-buses but also for the overall bus sector. At the same time, state governments have to prioritize electric mobility and channelize state support to sustain the e-bus programme. The bus sector otherwise is a high employment-generator. Every bus can generate direct employment for six to seven people and much more indirect employment. Post-Covid, reviving the sector can address job losses as well.
11
The 2021–22 Union budget package of Rs 18,000 crore for procurement of 20,000 new buses will have to be designed well for green recovery. At least half of this new fleet can be targeted for electrification to build scale and to achieve cost parity. The government should utilize this post-pandemic recovery strategy for targeted reform, which is long pending. Issues such as public transport tax reform, creation of dedicated urban transport funds like the railways’, making budgetary provisions for urban transport, especially for buses etc. are needed to put buses back on the sustainability track.
Against this backdrop, this policy paper assesses the emerging trends in the e-bus market and examines how bus operation models are being reinvented, indicating a departure from the way Internal Combustion Engine (ICE) buses are purchased, managed and operated. The e-bus programme is not only about the purchase and plying of buses. There is the larger context of product portfolio offered by manufacturers, fleet planning and deployment strategies, revenue models, operational models for e-bus services, infrastructure development and the role of incentive programme in promoting e-buses within the overall challenges faced by the sector.
This analysis explores some of these policy questions to understand the way forward.
12
Summary highlights
Changing nature of the marketWhile polices related to public transport are changing rapidly, the e-bus sector is evolving with its own character, structure and scope.
New entrants dominate the sector: The e-bus programme is changing the profile of the industry. This has led to some shake-up, bringing new players to produce e-buses, leading to repositioning of the traditional bus manufacturers. Until 2020–21, about 74 per cent of the total e-bus supply order was received by new market players such as Olectra-BYD, PMI-Foton and JBM-Solaris, who have leveraged the opportunity of the growing electric mobility market. But the traditional bus OEMs such as Tata Motors and Ashok Leyland—who at 81 per cent of the total ICE bus market together dominate the segment—are 26 per cent of the e-bus market. The rest of the market is in the hands of new entrants. However, if individual positioning is considered, Tata Motors is the second highest seller of e-buses.3 The e-bus policy has attracted investments from new and non-conventional players, increasing the diversity of players. This is different from the ICE bus market that was largely dominated by a handful of players.
Limited technology approaches under FAME II: Although FAME II is an improvement over FAME I in terms of setting up clear targets, creating targeted market etc., its design is still not conducive to driving more innovation and building product diversity. For instance, the FAME II incentive framework is linked to battery sizes, and larger battery size have a better chance of grabbing more incentive than smaller ones. It does not provide a level playing field for all approaches such as battery swapping or opportunity charging technology, which can have smaller batteries. Only electric buses with conduction charging facilities that are supported dominate the market. Other charging options like pentagraph charging or battery swapping or any other approach are currently limited to the initiative of only individual OEMs. By limiting funding availability to only one approach of electric buses with conduction charging facilities, FAME II is limiting innovation. Smaller batteries can be innovated to have higher energy density. As the e-bus market is in a nascent stage, the product range is limited and low bus demand is not stimulating research and development.
Import dependence stymies growth: In the absence of substantial localization of production, almost all e-bus manufacturers are highly dependent on the global supply chain for sourcing of major e-bus components, including battery, battery monitoring technology, charging technology etc. Therefore, pandemic-induced global supply chain
13
disruption has slowed down production. Even after a year of receiving supply orders, the OEMs are unable to supply the buses to the cities and/or STUs. Electric vehicle policy requires a more ecosystem approach to planning of upstream, midstream and downstream technologies, especially associated with battery technology to address this challenge. The production-linked incentive programme that has been announced for batteries for electric vehicles needs to be leveraged well.
Reinventing business model: The shift from ICE buses to e-buses is also transforming the business model of the OEMs. The ICE market is based on direct purchase by the bus operators and the OEMs do not have any role in bus operations. But in the e-bus business, buses are being purchased based on gross cost contract (GCC) that requires the OEMs or designated operators to provide the bus and also operate and maintain the buses on behalf of the State Transport Undertakings (STUs) on a per kilometre payment basis.
In the majority of cases, OEMs tie up with traditional private bus operators in India to provide these services. Nonetheless, this is a new form of engagement for OEMs and this framework is emerging when bus volumes are still low and entirely dependent on government subsidy. The current FAME-supported e-bus programme translates into deployment of a few buses—a minimum of 25 e-buses—per targeted city. Low volume makes it difficult for OEMs to set up after-sale service arrangements.
Challenges faced by State Transport Undertakings
Huge capital investment: The upfront capital investment required for e-buses is more than double that of ICE buses. Paying for battery as well as charging infrastructure add to the cost. Generally, capex needed for ICE is 20 per cent of its overall cost. But in the case of e-bus it is 45–50 per cent. Additionally, even though the FAME subsidy is available it has not reduced the cost burden of operators as they have to submit an almost equal amount of bank guarantee for the entire project period. The total cost of operation (TCO) for operating one e-bus, even after subsidy, is almost equal to the cost for its ICE counterpart. This will have to further inform the financing and incentive strategy.
The comprehensive official TCO calculation of e-buses versus diesel buses is not available yet. The estimates available from studies provide indicative information. For instance, a 2020 World Resource Institute study4 shows that without the FAME subsidy while the TCO for a 12 m standard e-bus with 320 kWh battery size is about Rs 77.75 per km, the TCO for a 12 m standard diesel bus (high-cost diesel variant) is Rs 78.57 per km. However, with the FAME subsidy, TCO of 12 m standard e-bus with 320 kWh battery size is reduced to Rs 65.90 per km as opposed to Rs 78.57 per km for a 12 m standard diesel bus (high-cost diesel variant).
14
ELECTRIC BUS: TOWARDS ZERO-EMISSION COMMUTING
A 2019 study published in International Journal of Technology5 calculated TCO for a period of 25 years (assuming the normal life of transport infrastructure in India). According to this, while the TCO for electric buses is Rs 36.6 million, for diesel buses it is Rs 39.1 million. This also shows that with a well-designed incentive programme it is possible to achieve price parity and eventually scale. With further improvement in emissions standards and real world emission monitoring requirement the complexity and costs of diesel buses are expected to increase further.
Shift in bus procurement and operation strategy: Unlike ICE buses, which are purchased directly by the public transport agencies for operations, e-buses are procured on the basis of gross cost contractual (GCC) model of bus operations. This is a big shift from the FAME-I strategy that allowed outright purchase of e-buses by the STUs. GCC is now the requirement under FAME II. Under this model, buses are owned by the OEMs or the designated operators, not by the STUs. Bus operators take care of the entire investment required for procurement and developing charging infrastructure, including technology selection, locations etc. They ensure operational performance of the services and maintenance and repair. They are paid on a per km basis while conforming to pre-decided service criteria. Given the uncertainties around the new technologies, lack of skills in STUs and high upfront cost, the GCC model has been designed to help de-risk the STUs.
Otherwise, the outright purchase model that allows the STUs to have full control over bus procurement and services puts the entire responsibility of dealing with upfront costs and service delivery and associated risk on the STUs, which is challenging given the uncertainties around the new programme. GCC therefore helps to overcome some of these challenges. Major STUs in Pune, Hyderabad and Mumbai, among others, have adopted the GCC model of operation.
This has also helped the STUs to operate their e-buses at fairly more competitive rates compared to diesel or CNG buses. For example, while in BEST, the per km cost of operation for diesel and CNG buses is more than Rs 100 per km, the cost of running a 12 m AC e-buses is less than Rs 60 per km. In fact, completed and closed FAME-II tenders in 32 cities show the average per km cost of operating 9 m (9 m denotes the chassis length) and 12 m e-buses to be around Rs 64 and Rs 69.51, respectively. E-bus deployment under GCC model requires holistic planning of the system, including identification of bus routes, depot infrastructure, quality of power supply, tariff etc. as these have a considerable impact on the cost of the project.
From bus specifications to stating service needs: E-bus procurement has made a profound impact on the tendering process. While procuring buses, cities/STUs now
15
prefer to specify their service needs instead of only specifying details of the vehicles. This is an interesting and appropriate shift in bus procurement and tendering process. For instance, in the majority of tenders, cities and/or STUs have not specified the battery capacity or energy consumption ratio. Instead, they have mentioned other requirements like expected service range in a single charge and requirement of AC facilities, electricity charge etc. Battery range and life are the major concern areas for transit operators as operational efficiency and project costs are hugely dependent on it. This varies across OEMs. Thus, slowly, operators are focusing on service performance while tendering.
Tenders for bus procurement now mention the defined routes and depots for electrification as part of procurement. It is important for the operators to know the driving condition during peak and non-peak hours, and headways during peak and non-peak periods to decide scheduling and services. Bus requirement and associated costs are dependent on this. Although FAME II tenders of several cities have improved in terms of providing operational details, 43 per cent cities/STUs have not yet specified the route details in their respective tender documents. Similarly, 29 per cent of cities/STUs have not provided details about the depots. Even though some cities/STUs have provided the required information, most of them lack the necessary details that influence rationalization of cost etc.
To make the tender process more service oriented it is necessary to ask for details related to expected daily km run per bus and daily operational schedules and let OEMs come up with an e-bus deployment strategy to achieve the desired level of service delivery. Information on passenger load and occupancy factor for each route, congestion and traffic conditions, depot location and distance from route origin/destination have bearing on service planning and costs.
Need upfront city-specific fleet planning and deployment strategy: Electric bus deployment requires fleet planning and deployment strategy according to the service requirements based on real-world driving conditions on different bus routes. This has enormous bearing on the performance of the bus. Fast and slow traffic, undulating terrain, passenger load, use of air conditioners and temperature, among other factors, affect the real-world range and ageing of batteries. While manufacturers keep innovating to improve battery capacity, sizing, range etc., controlling operational parameters is also very important to address the real-world range, ageing and degradation of batteries. Proper route planning is needed to optimize range and to reduce dead mileage. These have bearing on the total cost of ownership of e-buses as well.
Studies are available to demonstrate this effect. The International Council on Clean Transportation (ICCT)6 carried out granular assessment of the e-bus routes operated
16
ELECTRIC BUS: TOWARDS ZERO-EMISSION COMMUTING
by the Bangalore Metropolitan Transport Corporation. This route-wise comparison of driving cycle (pattern of slow and fast driving, stop and go frequency, idling etc.) brings out the variation in route-wise and technology-wise energy consumption. This has a bearing on the total cost of ownership of e-buses. This shows that route-based planning helps decide optimal battery size, charging strategy, charge-point locations, route distance, route-specific energy usage, battery reserve capacity, expected battery degradation, scheduling, and other factors that affect vehicle performance. Such planning also accounts for air-conditioning load or charging speed when selecting battery size. This assessment and planning can help avoid purchasing of buses with insufficient range that can otherwise increase the requirement of additional buses for the same level of service and adversely affect the operational performance of the fleet.
Several cities, including Navi Mumbai, Pune, Hyderabad, Bengaluru, Kolkata and Delhi among others that have embarked on an electric bus programme, are beginning to look deeper for granular planning to identify type, number, capability and location of the chargers, and the charging schedule to optimize the operation of the fleet. This improves staff awareness and skilling for deployment, management and monitoring of the fleet for verified fuel savings.
Over-dependence on Central government incentive; need strong state level e-bus policy: Urban transport being the state subject, over-dependence of the Central FAME will limit the prospect of growth of the e-bus sector. The state policies and funding also need to align with the requirements of e-bus transition. Till date, only 10 Indian states have notified their electric vehicle (EV) policy and another seven states have prepared their drafts. As transport is a state subject, all the states have to prepare and align their EV policies while national missions/schemes need to get stronger. A handful of state policies have set targets for e-buses. However, looking at the present pace of transformation, it seems difficult that they will achieve the targets in the stipulated time frame.
Moreover, integration of private bus agencies in cities will have to be guided well. In India, 90 per cent of the bus fleet is owned and served by private operators. Presently, financial conditions, i.e. quantum of bank guarantee, to avail the FAME incentive are somewhat tilted towards financially strong entities. Thus, OEMs are becoming the lead in concessionaire agreement.
9:900 rule: 9m and 900mm floor height buses are coming up as the most preferred choice for bus operators. Nearly 93 per cent of the total demand of STUs is for the 9m bus variant. Three cities/STUs that represent 7 per cent of the demand have opted specifically for standard size 12m e-buses. These include Bengaluru and Delhi. Half of the STUs are expecting a range of 150–200 km from the 9 m variant while 62 per cent are expecting a
17
range of 200–250 km from 12 m variant. Irrespective of bus size, 900 mm floor height of buses are in demand. Almost 85 and 62 per cent of cities/ STUs have shown their interest in procuring 900 mm floor height for 9m and 12m e-buses respectively.
Selecting suitable charging technology: Installation of the right kind of charging infrastructure plays a vital role in increasing operational efficiency of e-bus services. Every charging technology has its own pros and cons. Depot charging facilities provide a safe and secure environment for charging of e-buses. But in the case of top-up charging requirement, buses have to travel long distances and that increases non-revenue kilometres. This also impacts the scheduling of the services and consequently the ridership. Similarly, installation of additional charging facilities at bus terminals to provide opportunity charging services add to costs of setting up charging infrastructure. Even though battery swapping seems easier, it also requires a safe place with robotic arms to carry out the swapping activities. Two-thirds of cities opt for the most popular overnight depot charging options, along with opportunity charging in a few cases. Several STUs have kept their options open to allow OEMs to decide.
Performance monitoring of e-buses and skill building: Day-to-day monitoring of buses, especially of battery performance, is crucial for e-bus operation. Although technology is available to monitor and report, the operators are facing challenges to find right technical skills to analyse and understand the data to apply corrective measures on time. This points towards deployment of monitoring infrastructure and skill building.
E-bus operators need to train staff and the existing workforce to orient them towards the new technology. They also require performance monitoring mechanism as these technologies are new. There are special training needs for drivers and other mechanical staffs. This has become a big challenge for many STUs.
The way forwardElectrification of bus fleet has to be the priority focus of the electrification strategy to maximize decarbonization of urban commuting. But the critical challenge is that this objective will have to be met affordably when the entire bus sector requires reform and scaling up.
Overall, India is said to require massive investments to augment its bus fleet to at least 1.5 lakh to meet the burgeoning travel demand. Therefore, this requires strategic intervention to ensure that while moving towards electrification the incentives and other supports must enable massive upscaling of bus fleet. With well-designed strategies at both the Central and state level, industry participation and ecosystem development it is possible to bring price parity between e-buses and mainstream diesel and CNG buses.
18
ELECTRIC BUS: TOWARDS ZERO-EMISSION COMMUTING
Strengthen the FAME II incentive framework Build scale: FAME II incentive framework is an improvement over FAME I to provide more targeted support for e-buses. But target volumes are still very small. As the bus sector is already going through a difficult phase, a much more concentrated effort is required for e-bus transition. The Central government has already announced assistance for procuring 20,000 buses in its Union Budget. This is an opportunity to design this scheme in such a way that at least one-fourth of these new buses are procured as e-buses. This can create a more competitive environment among OEMs to innovate and achieve economy of scale.
The new FAME amendment that has vested the responsibility on EESL to create aggregated demand and support nine cities, including Mumbai, Delhi, Bengaluru, Hyderabad, Ahmedabad, Chennai, Kolkata, Surat and Pune on the GCC model, is expected to lead to concentrated development of infrastructure that can help to build scale and reduce costs and also support the state governments. This needs to be implemented with comprehensive fleet planning to maximize benefits and demonstrate the pathways and generate a learning curve for others.
Reform the incentive structure for e-buses: Preference for GCC model comes from the fact that this helps to reduce the upfront cost while improving the efficiency of services. However, as many big STUs in India have the organizational strength to manage their services, an open FAME incentive structure may provide more flexibility to STUs to choose the appropriate operational model for themselves.
FAME II currently provides capital incentive of up to 40 per cent of total bus cost. The cost of a bus is calculated on the basis of the prescribed formula and the maximum demand incentive is capped as per bus size (i.e. a maximum of Rs 55 lakh for >10m buses). Now, instead of providing the whole subsidy amount within a few months of bus operation (i.e. six to seven months), if government provides similar support for a longer duration of at least seven years, taking into consideration requirement for battery replacement, it will be equal to a subsidy of Rs 12 per km (assuming an average of daily operation of 180 km per bus). This can make the cost of operations almost equal to low-floor diesel (at par with Tata or Volvo) services. This will also ensure operation of e-buses for a longer time. Additionally, when capex subsidy is provided, the operator does not have any control over price and OEM tend to quote high price. Without capex subsidy, private operators will be in a position to negotiate the price through bulk purchase.
Create opportunity for diverse technology with different charging options: Design the incentives to create more options for the combination of technology and charging options.
19
In addition to battery-operated electric buses with only conduction charging facilities that dominate the market today, charging options for pentagraph charging or battery swapping or any other approach should be promoted. Incentive should be more flexibly provided on the basis of technical and financial viability of projects. Transit agencies should have the right to strategize e-bus deployment according to their local planning and strength. It is possible to adopt battery lease model (in which the responsibility of the battery and setting up charging infrastructure is given to a private partner). This can reduce the high upfront cost and allow STUs or other public transport agencies to hold significant control over the system.
Interventions needed at the state and/or city levelState-level EV policy to have more specific provisions on targets and support for e-buses: States have to prepare and align their EV policy to create more targeted opportunity for e-bus deployment. States/cities have to identify bus services as essential services—not for profit—and prepare a long-term e-bus transformation plan including provisions for providing viability gap funding for bus operations. E-buses require detailed planning before deployment and city/level comprehensive fleet planning for routes and charging should be done in advance for e-bus deployment. City-level e-bus deployment plans are needed to provide for e-bus-oriented transit infrastructures such as depots, terminals, bus stops etc. The state should also proactively assist the power sector in improving their grid capacity by providing some benefits to them as well.
State policies have to provide for category-wise targets of EV penetration, especially focusing on e-buses. This will provide long-term policy visibility to the industry and also help in monitoring the progress towards policy objectives.
Leverage PLI for bus sector: Recently, the Central government announced a production linked incentive (PLI) scheme of Rs 18,000 crore for setting up big units to manufacture advanced batteries for electrical storage. This will surely boost e-bus development in the near future, as locally made batteries will reduce the cost of buses substantially. A similar PLI scheme for EV-component manufacturers will expedite the overall electric vehicle transition, especially for e-buses in India.
Need strategy for private bus operations: Currently, only public sector STUs qualify for FAME incentives. But given the fact that private operations dominate public transport services in most cities with some variation across regions, there is need for a strategy to catalyse this sector to electrify as well. The state government policies can play an important role in providing common public charging and maintenance facilities for commercial use by private players. If these facilities are available, private operators can also invest in electric
20
ELECTRIC BUS: TOWARDS ZERO-EMISSION COMMUTING
buses and benefit from the lowering of bus costs. This will also help to build scale and achieve economy of scale. This approach of common facilities for commercial use is needed as the private operators cannot invest in depot and charging infrastructure.
Build basics: As the sector is entirely new, cities need to create all the required documents, guidelines and/or regulations from the e-bus perspective. Extensive training programmes for different categories of staff involved in e-bus operations to build their capacity should be conducted.
21
SECTION 1E-buses—rules of the gameElectrification of bus transport has enormous potential to decarbonize urban commuting and reduce toxic exposures in polluted cities of India. The International Council on Clean Transportation (ICCT) study estimated in 2015 a whopping 74,000 premature deaths in India were solely attributed to transportation tailpipe emissions.7 The transport sector is also responsible for high greenhouse gas (GHG) emissions. Between 2005 and 2015, GHG emissions from the transport sector more than doubled, with a high compound annual rate of 7.4 per cent.8 This is expected to get worse with rapid motorization as motor vehicles are doubling in every eight to 10 years in India.
Further, in the transport sector, heavy-duty diesel buses, despite their smaller numbers than personal vehicles, emit disproportionately higher particulate matter and nitrogen oxides that are also ozone forming. According to the World Health Organization, diesel exhaust is also carcinogenic to humans and long exposure may increase the risk of lung cancer.9 Not only do zero-emission engines eliminate near-road exposure to carcinogenic diesel exhaust, but, as the ICCT estimate shows, they are also at least four times more energy efficient compared to diesel engines.
Within this context, electric mobility that links zero emissions electric vehicle programme with public transport strategy has a special relevance in India with a big domestic bus market. In 2018, India has sold approximately 70,000 ICE buses,10 which represents almost 16 per cent of the global bus market. Currently, 93 per cent of the total bus fleet that is owned or managed by state-owned transport corporation (STUs) are diesel buses.11
According to a report published by the Department of Heavy Industry (DHI), Government of India, India could emerge as the second-largest e-bus market by 2030 if four out of 10 sold buses are electric.12 Even a small conversion of 20 per cent of all diesel buses owned or managed by Indian State Transport Corporations (STUs) into electric buses can benefit India through annual savings of 4.6 million barrels of oil purchase equivalent to approximately Rs 1,700 crore (assuming a barrel of crude oil barrel costs US $50). Additionally, it will also help reduce 2.6 million tonnes of CO2 per annum. Moreover, battery-operated electric buses (BEB) have zero exhaust and even their life-cycle emissions that depend on the upstream emissions from power generation that charge the batteries can be reduced drastically with expansion of renewable energy.
The focus on electric buses also underscores the importance of decarbonizing substantial share of urban commuting trips and converting them to zero-emissions trips. India has a special advantage in its high share of public transport usage and modal share.
22
ELECTRIC BUS: TOWARDS ZERO-EMISSION COMMUTING
Policy mandateThe electric bus programme is policy-driven as customized incentive programmes have been crafted to create and catalyse this market. It has become necessary to understand the changing contours of the current e-bus policy and incentive programme of the Government of India—the FAME schemes, its role in catalysing the e-bus market and its progressive amendment to respond to the new learnings and challenges to build the e-bus market.
Learning from FAME I: The first phase of the FAME scheme, FAME I, commenced on 1 April 2015 for a period of two years that was subsequently extended until 31 March 2019, with total outlay to Rs 895 crore.13 FAME I focused on demand creation, technology platform, pilot project and charging infrastructure. Under FAME I, 425 e-buses were sanctioned to various cities or states with a total cost of Rs 300 crore14 (see Annexure 1: Electric and hybrid buses sanctioned under FAME I). FAME I offered incentives to promote e-buses, which was 60 per cent of total purchase cost or 0.85–1 crore per bus depending upon the localization factor of 15–35 per cent, respectively. In addition, to provide direct incentives for e-bus purchase, FAME I also provided an additional incentive of 10 per cent of the total demand incentive for setting up charging infrastructure for e-buses.
In terms of e-bus deployment, FAME I fell short of meeting the initial target of deploying a minimum of 500 e-buses. But it was an important experiment to conceptualize redesigning of the next phase of intensive scheme. An evaluation of the FAME I e-bus deployment strategy provides some interesting insights on why it failed to give the desired push.
Slow start: There were procedural delays to kick-start the procurement process. After the commencement of FAME I on 1 April 2015, an expression of interest (EOI) to avail the grant from the FAME scheme was first issued on 3 November 2017, more than two and a half years late.
Limited coverage: Initially, an EOI was issued for a minimum of five cities. The participation was restricted within million-plus cities (as per Census 2011). However, the grant was later sanctioned for nine cities.15 Even then the number was very small compared to the scale of urban bus requirement in India.
Limited time for preparation of procurement and deployment plans: From issuance of the EOI to proposal submission, cities effectively had less than a month to prepare such a multi-dimensional transport proposal. Being a completely new technology and with limited technical knowhow about the electric ecosystem, the majority of the cities faced challenges while hurriedly preparing and submitting the proposal. It also led to implementation challenges.
23
Direct focus of e-bus deployment limited: In FAME I, all the participating cities were asked to submit a multi-modal transport proposal including e-buses, commercial e-4Ws, and e-3Ws. Further, allocation of grant was limited to only Rs 105 crore16 for each city for the entire composite basket of e-segments, including e-buses. This diluted the focus on e-buses that requires special planning for e-bus procurement and deployment.
Delays due to inappropriate technology selection: Initially, FAME I initiatives were more focused on deployment of hybrid e-buses where a clear incentive structure was laid out for different variant of hybrid (i.e. mild or strong hybrid e-buses) according to their fuel type (i.e. CNG and diesel). Incentive mechanism for pure electric buses was introduced at a much later stage, in September 2017.
Uncertainty around available technology, high cost of buses (i.e. three to four times higher than conventional diesel bus of that time), rapidly changing technology scenario and limited market players contributed to impeding the process. The agencies who had shown interest in procurement, faced issues while deciding technology specifications for e-buses and e-bus operational model (outright purchase versus GCC) etc. Any mistake would cost and the problem would get locked in for next 10–12 years. In fact, Bengaluru was unable to avail of their FAME-I incentives even after selection because of this dilemma.
Role of FAME II in prioritizing e-bus transition: After long speculation and repeated extension of FAME I, FAME II finally commenced from 1 April 2019, with a budgetary support of Rs 10,000 crore till 2022.17 Even though the scheme was delayed by almost two years, FAME II tried to address several limitations of FAME I, including coverage, promotion of cleaner technology, setting up clear deployment targets along with dedicated fund allocation etc.
FAME II, which is underway, provides special attention to generation of e-bus demand, with an aim to deploy approximately 7,000 pure e-buses (battery electric vehicle) in three years. A dedicated fund of Rs 3,545 crore18 (i.e. the highest among other e-vehicle segments eligible for FAME II demand incentives) has been allotted for e-buses. Unlike FAME I, where demand incentives varied depending upon the localization factor (i.e. for 15 per cent and 35 per cent of localization factor, incentive amount shall be 60 per cent of purchase cost or a maximum of 1 crore and 1.5 crore, respectively), FAME II started to provide uniform demand incentive at Rs 20,000 per KWh (kilowatt-hour) battery size for maximum up to Rs 50 lakh (i.e. battery size up to 250 KWh) per bus. The maximum incentive amount has also been increased from ex-factory price of Rs 1.5 crore (i.e. maximum under FAME I) to Rs 2 crore.19
24
ELECTRIC BUS: TOWARDS ZERO-EMISSION COMMUTING
Within two months of commencement, the Department of Heavy Industry (DHI), the nodal agency to manage the entire FAME programme, issued an EOI to avail incentives under FAME II for the deployment of electric buses on an operational cost model. To achieve economies of scale, coverage of the FAME II incentives was extended to 40 cities with planned deployment of 5,000 e-buses20 (see Annexure 2: Planned electric bus deployment under FAME II).
The EOI document is specifically designed for operational cost-based e-bus deployment, where an operator is expected to bear the costs, including purchase cost of a bus, cost of operation, electricity, drivers, management of fleet, charging infrastructure, replacement of the battery, maintenance cost, etc. In return, the authority will pay them on per km basis. Thus, it has provided a completely different incentive structure from what was proposed earlier. Under the new framework, incentives are limited to 40 per cent of bus cost. The cost of the bus is calculated on the basis of the prescribed formula mentioned in the EOI document. Additionally, maximum demand incentive is fixed as per bus size, i.e. a. standard bus (length > 10–12 m): Rs 55 lakh; b. midi bus (length > 8–10 m): Rs 45 lakh; c. minibus (length > 6 m to 8 m): Rs 35 lakh.21
After issuance of the EOI, the Department of Heavy Industry (DHI) received an overwhelming response from 26 states and Union territories, with a total of 86 proposals for deployment of 14,588 e-buses, of which the government has sanctioned 5,595 e-buses for 64 cities—5,095 e-buses for intra-city, 400 e-buses for intercity bus operations and 100 e-buses to Delhi Metro Rail Corporation (DMRC) to enhance last-mile connectivity22
(see Annexure 3: List of sanctioned buses under FAME II). An estimation provided DHI shows that over their lifetime, these buses will operate for 4 billion km without any tailpipe emissions. This is expected to save approximately 1.2 billion litres of oil import, resulting in avoidance of 2.6 million tCO2 emissions.23
Initially, the tender was issued for 4,52024 buses of which 2,450 e-buses have been granted for FAME II incentives till FY 2019–20. About 30 cities (with around 2,270 e-buses for intra-city operations) and four State Transport Corporations (with 180 e-buses for intercity operations) have been awarded the contracts for their respective bus operators/OEMs.25 Eighteen cities have lost their opportunity by not initiating their tendering process.
Furthermore, after issuing the tender, Andhra Pradesh and Karnataka cancelled their respective tenders of approximately for 750 e-buses (i.e. 350 e-buses by APSRTC, 300 e-buses by BMTC and 100 e-buses by KSRTC).26, 27, 28 However, Bengaluru was quick to float a new tender even during the pandemic. E-bus OEMs received an additional supply order of 950 e-buses for 2020–21 from three major cities, including Bengaluru.29, 30
25
Along with FAME II incentives, other policy decisions taken by government during this time such as reducing GST rate on electric vehicles from 12 per cent to 5 per cent and on electric charger from 18 per cent to 5 per cent, with effect from 1 August 2019,31 have also made a positive impact on the sector.
The FAME incentive structure still provides greater preference to larger batteries. It does not provide any level playing field for battery swapping or opportunity charging technology to compete with plug in battery technology. More attention will have to be given to product diversification.
State-level interventions in e-bus transition: FAME incentives have provided a big push towards e-bus transition in India. Nevertheless, bus transport is a state subject and also requires additional and equally strong commitment at the local level. State-level interventions like targeted EV-policy for e-bus deployment within the state, tax concession and subsidy or special tariff on electricity can give the much needed push. Some state-level interventions include:
• Andhra Pradesh has targeted 100 per cent conversion of bus fleet to electric in major cities by 2024 and in the entire state by 2029.
• Delhi has pledged to convert 50 per cent of all stage carriage buses by 2022.
• Kerala has decided to convert their entire bus fleet for more than 6,000 buses by 2025.
• Tamil Nadu has decided to procure 1,000 e-buses every year.
• Draft EV policy of Madhya Pradesh and Telangana has targeted 100 per cent conversion of their bus fleet by 2028 and 2030, respectively.
• Government of Punjab has given a waiver to private e-bus operator on permit fee and MV tax.
• Assam has decided to exempt state GST from e-buses.
States can also assist in developing e-bus infrastructures to create the whole ecosystem for smooth transition. In this regard, the government of Gujarat has decided to create additional depots for e-buses in the public–private partnership (PPP) model. They have also extended the Chief Minister’s urban bus service scheme for providing viability gap funding (a maximum of 50 per cent or Rs 25 per km, whichever is lower) to operate e-buses.
26
ELECTRIC BUS: TOWARDS ZERO-EMISSION COMMUTING
COVID-19 slowdown: When the Indian e-bus sector was expected to accelerate, Covid-19 created market disruption. However, even during the pandemic, the Central government provided the first tranche of FAME II incentives to the respective beneficiaries. But an announcement regarding the new invites for the remaining 2,000 e-buses that were supposed to roll in February 2020 are awaited.32
Delay in upcoming projects is expected as pandemic has disrupted the budgetary provisions at various levels of government. The pandemic has impacted the transit agencies in terms of revenue and ridership losses due to the cumulative effects of physical distancing norms and fear of virus spreading. On the other hand, the cost of bus operation has increased by approximately Rs 17 lakh per 100 buses per month,33 following sanitization protocols to disinfect the bus and make crews safe. In this given situation, it is challenging for cash-trapped bus agencies to invest in e-buses in the short to medium term.34
Additionally, the pandemic and associated global slowdown have completely dislocated the global supply chain.35 Almost all Indian e-bus manufactures, including Tata Motors and Ashok Leyland, are dependent on the global supply chain to produce their finished product. Thus, disruption in global supply chain has forced them to stop or slow their production. With the Indian e-bus sector greatly dependent on China with regard to EV technology, major EV parts, batteries and other metals, the recent tension with China has negatively impacted the sector.36
Thus, even after a year of receiving supply orders for almost 2,450 buses under FAME II, OEMs are unable to supply them. In some cases, public transit agencies are not willing to receive these buses—first, there is no or very low demand for public transport in cities and, second, this will increase their financial burden. Earlier Delhi had planned to induct 1,000 e-buses into its city bus services by the end of 2020 but they just placed the order for supplying 300 e-buses in March 2021. Similarly, after observing the heat of financial crunches, almost all city authorities have either delayed or cancelled the procurement process.
Subsequently, in June 2021, the Ministry of Heavy Industry and Public Enterprises made a major amendment to the existing FAME II scheme by increasing demand incentives by Rs 5,000 per kilowatt hour (kWh) for electric two-wheelers and aggregating the demand for three-wheelers and buses.
FAME II amendment during pandemic for aggregation of bus demand: Amid slowdown, FAME II was further amended in June 2021. This has rested the responsibility on the Energy Efficiency Services Limited (EESL), a joint venture of the Central Public
27
Sector Undertaking (i.e. NTPC Limited, PFC Limited, REC Limited and Power Grid Corporation of India Limited) to aggregate the bus demand on behalf of the cities for targeted deployment. EESL is responsible for creating demand for the remaining FAME II buses in nine mega cities in India—Mumbai, Delhi, Bengaluru, Hyderabad, Ahmedabad, Chennai, Kolkata, Surat and Pune—on an operational cost or GCC model.
Focusing on these cities is particularly important as the majority have already placed orders. Approximately 2,500 or more buses have to be purchased from the original sanction of 7,000 e-buses. About 4,500 e-buses have been tendered so far. If these are distributed among nine cities, each city will have 500 or more buses that can enable concentrated scale and ecosystem development. For example, assuming Delhi and Bengaluru will have a fleet strength is 500–600 e-buses each—almost 10 per cent of the overall fleet for each city—e-bus penetration will be much more in case of the other seven cities.
EESL has planned to set up around 2,000 EV charging stations across India. They have already set a target of installing 500 charging stations in Delhi-NCR alone. Similarly, they have also partnered with cities such as Hyderabad, Ahmedabad, Chennai and a few more for setting up similar infrastructures. Thus, entrusting the same authority for demand aggregation will help in better coordination and creation of the electric vehicle ecosystem in those cities.
The experience with FAME II has thrown up several lessons for catalysing the market for scale as well as improving and optimizing levels of service delivery based on fleet planning in cities. This needs deeper insights to chart the next steps.
28
SECTION 2Emergence of e-bus marketThe Indian e-bus sector is in a nascent stage. It is predicted to reach 7,000 units by 2025.37 The progress of the Indian e-bus sector has been largely shaped by the government’s policies and incentive programmes, especially the FAME II initiatives that were specially designed to promote e-buses (see Graph 1: Annual progress of Indian e-bus market).
As only State Transport Corporations (STUs) or city bus agencies qualify for these incentives, e-buses have grown predictably in the public-bus sector. Otherwise, high purchasing cost of e-buses—due to high battery cost—has failed to attract private investment. Additionally, there is a generic lack of confidence in the new e-bus technology, further compounded by the lack of suitable long-term financing support and limited domestic expertise on e-bus technology. These have bred more hesitation in the market.
The situation is however expected to change with the continuous drop in electric battery prices in the global market and as e-buses become more competitive with time and scale.38 Studies have now emerged to show that in next couple of years even the e-bus purchase cost can be comparable or even less than that of a CNG or diesel bus. It is to be noted that after the introduction of BS VI emission norms the cost of an ICE engine bus has increased due to advancement in emission control systems.
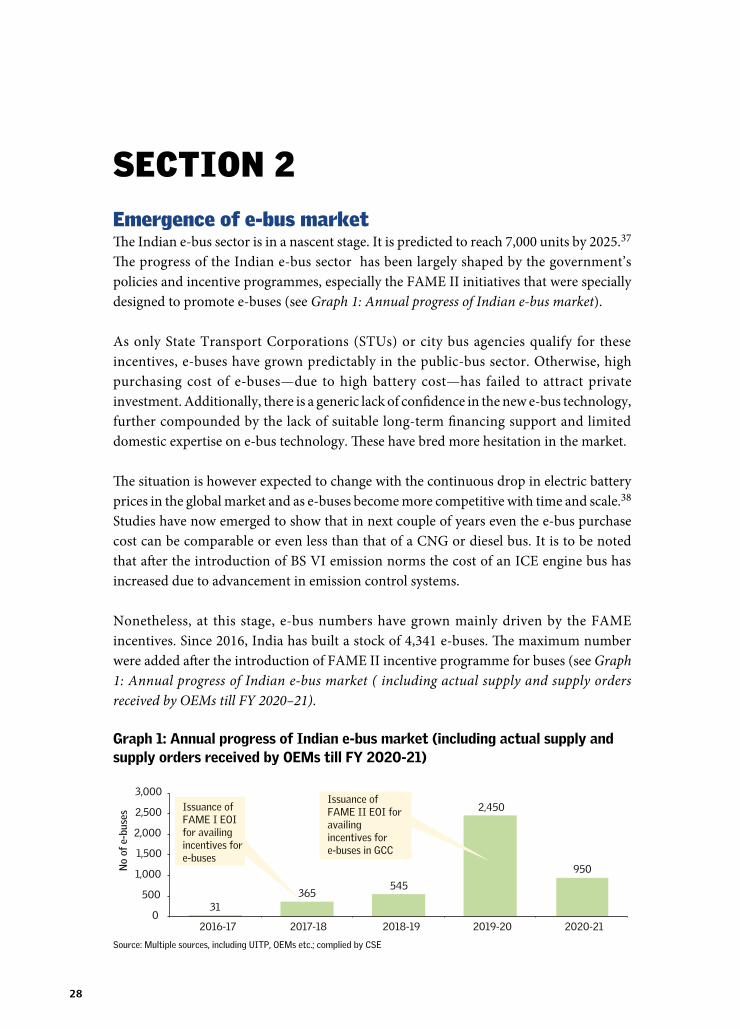
Nonetheless, at this stage, e-bus numbers have grown mainly driven by the FAME incentives. Since 2016, India has built a stock of 4,341 e-buses. The maximum number were added after the introduction of FAME II incentive programme for buses (see Graph 1: Annual progress of Indian e-bus market ( including actual supply and supply orders received by OEMs till FY 2020–21).
Graph 1: Annual progress of Indian e-bus market (including actual supply and supply orders received by OEMs till FY 2020-21)
31365
545
2,450
950
0
500
1,000
1,500
2,000
2,500
3,000
2016-17 2017-18 2018-19 2019-20 2020-21
Issuance of FAME II EOI for availing incentives for e-buses in GCC
Issuance of FAME I EOI for availing incentives for e-buses
No
of e
-bus
es
Source: Multiple sources, including UITP, OEMs etc.; complied by CSE
29
Who produces e-buses in India? The e-bus programme is changing the structure and profile of the industry as there are varying responses from the traditional Original Equipment Manufacturers (OEMs) and the new entrants that are new to the business to leverage the new opportunity.
There is a distinct characterization of the bus products in the market and OEM preferences. A lot of this is influenced by legacy strength and experience of the traditional OEMs and choices that new players have made.
There are broadly three categories of e-bus manufacturers in India today. The first group is traditional bus manufacturers such as Tata Motors and Ashok Leyland that have tie-ups with different Indian or foreign companies for e-bus technology and parts, including EV-power train, battery and charging technology. Though these companies are dependent on their partners for developing fully built e-buses, the ownership of the brand and responsibilities of vehicle performance rest on them.
The second group includes comparatively new Indian bus manufacturers or even traditional bus-body makers that have joint ventures with foreign bus manufacturers for e-bus technology transfer and management, including battery and charging technology. This group includes Olectra-BYD, PMI-Foton and JBM-Solaris. Big foreign bus OEMs and/or makers are tying up with their Indian partners to sell e-buses in India.
The third category includes a set of new companies that are new to the bus business and have started manufacturing e-buses by assembling various e-bus parts from India and abroad. This includes Mytrah Mobility, which started as a technology company to support e-bus development in India.
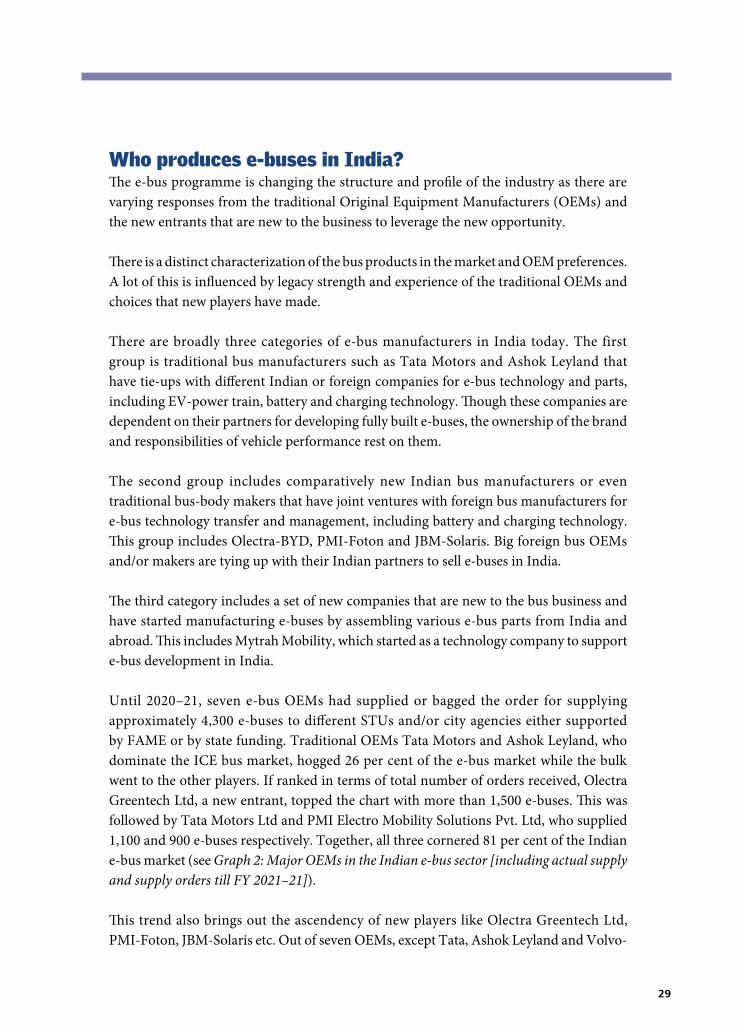
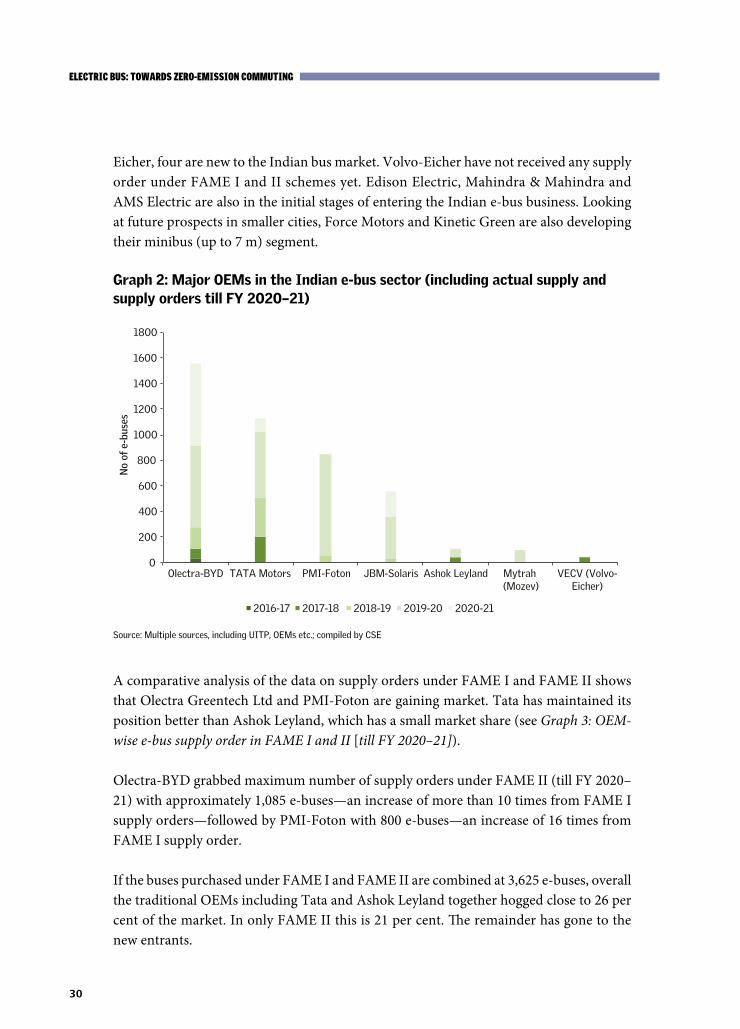
Until 2020–21, seven e-bus OEMs had supplied or bagged the order for supplying approximately 4,300 e-buses to different STUs and/or city agencies either supported by FAME or by state funding. Traditional OEMs Tata Motors and Ashok Leyland, who dominate the ICE bus market, hogged 26 per cent of the e-bus market while the bulk went to the other players. If ranked in terms of total number of orders received, Olectra Greentech Ltd, a new entrant, topped the chart with more than 1,500 e-buses. This was followed by Tata Motors Ltd and PMI Electro Mobility Solutions Pvt. Ltd, who supplied 1,100 and 900 e-buses respectively. Together, all three cornered 81 per cent of the Indian e-bus market (see Graph 2: Major OEMs in the Indian e-bus sector [including actual supply and supply orders till FY 2021–21]).
This trend also brings out the ascendency of new players like Olectra Greentech Ltd, PMI-Foton, JBM-Solaris etc. Out of seven OEMs, except Tata, Ashok Leyland and Volvo-
30
ELECTRIC BUS: TOWARDS ZERO-EMISSION COMMUTING
Eicher, four are new to the Indian bus market. Volvo-Eicher have not received any supply order under FAME I and II schemes yet. Edison Electric, Mahindra & Mahindra and AMS Electric are also in the initial stages of entering the Indian e-bus business. Looking at future prospects in smaller cities, Force Motors and Kinetic Green are also developing their minibus (up to 7 m) segment.
Graph 2: Major OEMs in the Indian e-bus sector (including actual supply and supply orders till FY 2020–21)
0
200
400
600
800
1000
1200
1400
1600
1800
Olectra-BYD TATA Motors PMI-Foton JBM-Solaris Ashok Leyland Mytrah (Mozev)
VECV (Volvo-Eicher)
No
of e
-bus
es
2016-17 2017-18 2018-19 2019-20 2020-21
Source: Multiple sources, including UITP, OEMs etc.; compiled by CSE
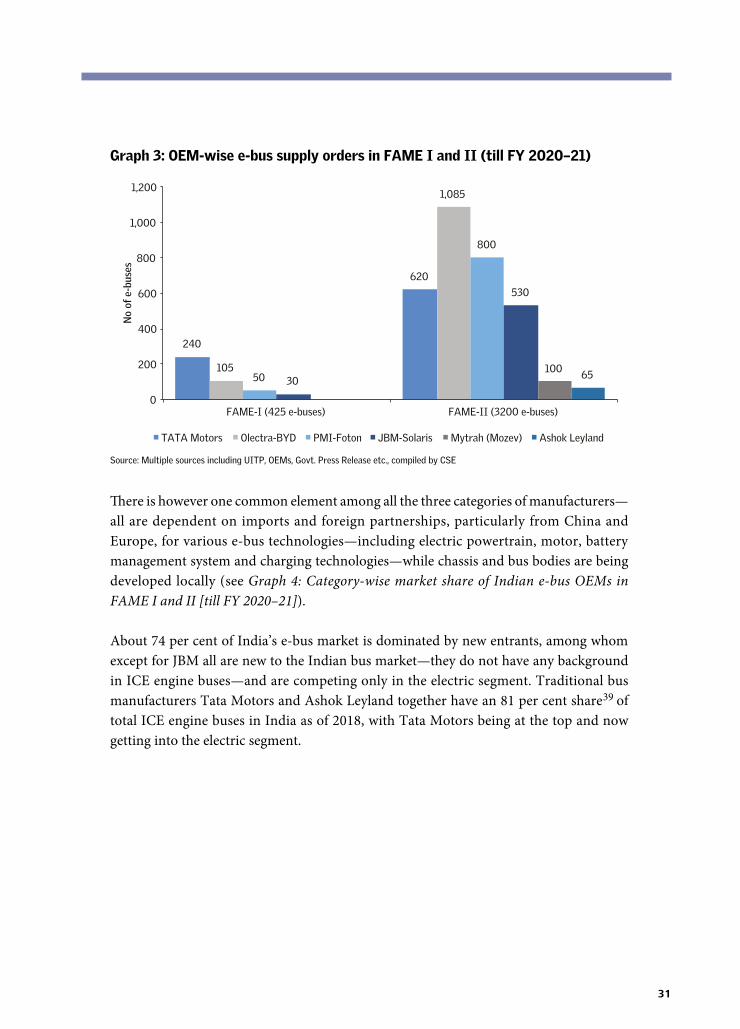
A comparative analysis of the data on supply orders under FAME I and FAME II shows that Olectra Greentech Ltd and PMI-Foton are gaining market. Tata has maintained its position better than Ashok Leyland, which has a small market share (see Graph 3: OEM-wise e-bus supply order in FAME I and II [till FY 2020–21]).
Olectra-BYD grabbed maximum number of supply orders under FAME II (till FY 2020–21) with approximately 1,085 e-buses—an increase of more than 10 times from FAME I supply orders—followed by PMI-Foton with 800 e-buses—an increase of 16 times from FAME I supply order.
If the buses purchased under FAME I and FAME II are combined at 3,625 e-buses, overall the traditional OEMs including Tata and Ashok Leyland together hogged close to 26 per cent of the market. In only FAME II this is 21 per cent. The remainder has gone to the new entrants.
31
Graph 3: OEM-wise e-bus supply orders in FAME I and II (till FY 2020–21)
240
620
105
1,085
50
800
30
530
10065
0
200
400
600
800
1,000
1,200
FAME-I (425 e-buses) FAME-II (3200 e-buses)
TATA Motors Olectra-BYD PMI-Foton JBM-Solaris Mytrah (Mozev) Ashok Leyland
No
of e
-bus
es
Source: Multiple sources including UITP, OEMs, Govt. Press Release etc., compiled by CSE
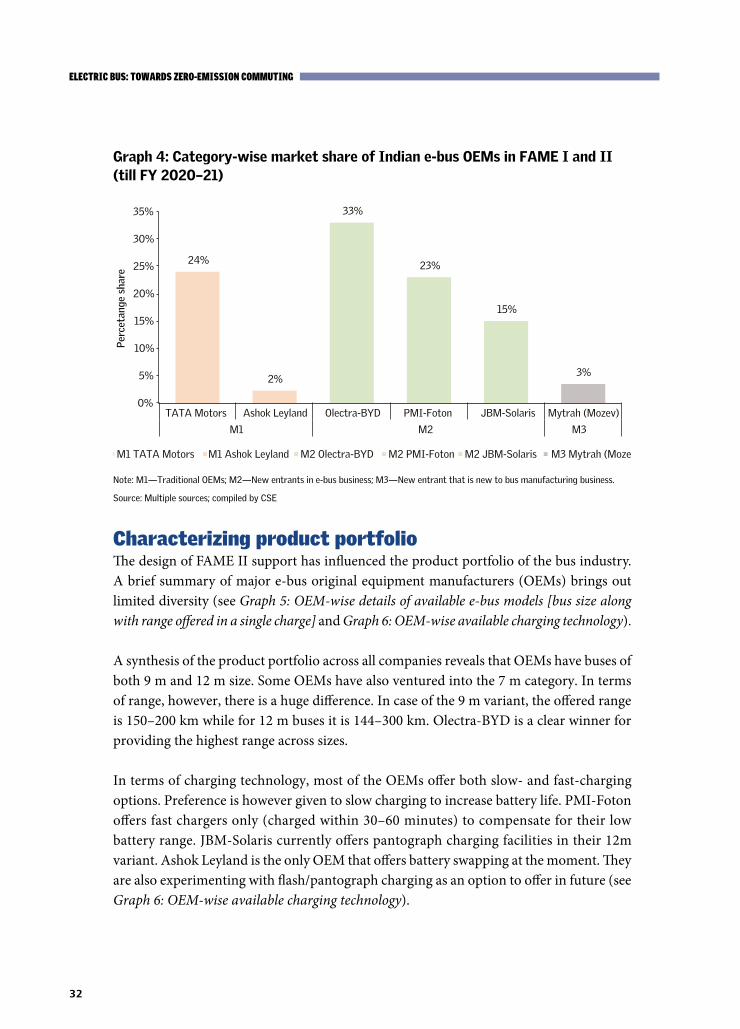
There is however one common element among all the three categories of manufacturers— all are dependent on imports and foreign partnerships, particularly from China and Europe, for various e-bus technologies—including electric powertrain, motor, battery management system and charging technologies—while chassis and bus bodies are being developed locally (see Graph 4: Category-wise market share of Indian e-bus OEMs in FAME I and II [till FY 2020–21]).
About 74 per cent of India’s e-bus market is dominated by new entrants, among whom except for JBM all are new to the Indian bus market—they do not have any background in ICE engine buses—and are competing only in the electric segment. Traditional bus manufacturers Tata Motors and Ashok Leyland together have an 81 per cent share39 of total ICE engine buses in India as of 2018, with Tata Motors being at the top and now getting into the electric segment.
32
ELECTRIC BUS: TOWARDS ZERO-EMISSION COMMUTING
Graph 4: Category-wise market share of Indian e-bus OEMs in FAME I and II (till FY 2020–21)
24%
2%
33%
23%
15%
3%
0%
5%
10%
15%
20%
25%
30%
35%
TATA Motors Ashok Leyland Olectra-BYD PMI-Foton JBM-Solaris Mytrah (Mozev)
M1 M2 M3
M1 TATA Motors M1 Ashok Leyland M2 Olectra-BYD M2 PMI-Foton M2 JBM-Solaris M3 Mytrah (Mozev)
Per
ceta
nge
shar
e
Note: M1—Traditional OEMs; M2—New entrants in e-bus business; M3—New entrant that is new to bus manufacturing business.
Source: Multiple sources; compiled by CSE
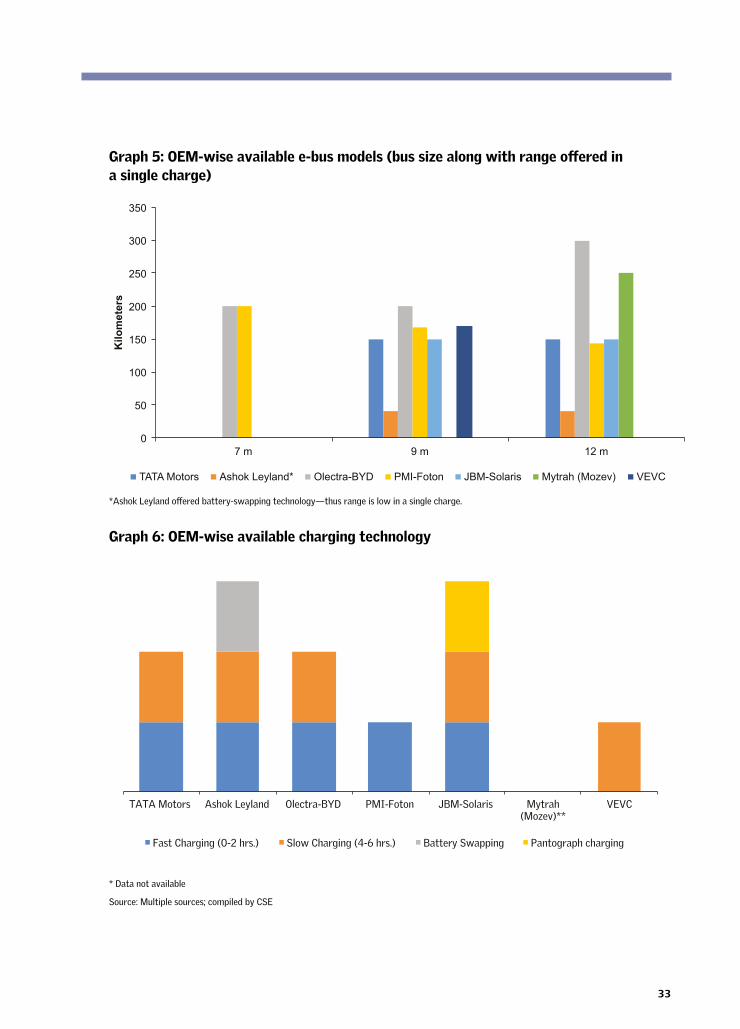
Characterizing product portfolio The design of FAME II support has influenced the product portfolio of the bus industry. A brief summary of major e-bus original equipment manufacturers (OEMs) brings out limited diversity (see Graph 5: OEM-wise details of available e-bus models [bus size along with range offered in a single charge] and Graph 6: OEM-wise available charging technology).
A synthesis of the product portfolio across all companies reveals that OEMs have buses of both 9 m and 12 m size. Some OEMs have also ventured into the 7 m category. In terms of range, however, there is a huge difference. In case of the 9 m variant, the offered range is 150–200 km while for 12 m buses it is 144–300 km. Olectra-BYD is a clear winner for providing the highest range across sizes.
In terms of charging technology, most of the OEMs offer both slow- and fast-charging options. Preference is however given to slow charging to increase battery life. PMI-Foton offers fast chargers only (charged within 30–60 minutes) to compensate for their low battery range. JBM-Solaris currently offers pantograph charging facilities in their 12m variant. Ashok Leyland is the only OEM that offers battery swapping at the moment. They are also experimenting with flash/pantograph charging as an option to offer in future (see Graph 6: OEM-wise available charging technology).
33
Graph 5: OEM-wise available e-bus models (bus size along with range offered in a single charge)
0
50
100
150
200
250
300
350
7 m 9 m 12 m
Kilo
met
ers
TATA Motors Ashok Leyland* Olectra-BYD PMI-Foton JBM-Solaris Mytrah (Mozev) VEVC
*Ashok Leyland offered battery-swapping technology—thus range is low in a single charge.
Graph 6: OEM-wise available charging technology
TATA Motors Ashok Leyland Olectra-BYD PMI-Foton JBM-Solaris Mytrah (Mozev)**
VEVC
Fast Charging (0-2 hrs.) Slow Charging (4-6 hrs.) Battery Swapping Pantograph charging
* Data not available
Source: Multiple sources; compiled by CSE
34
ELECTRIC BUS: TOWARDS ZERO-EMISSION COMMUTING
Summary pattern in Indian e-bus marketAll the available e-buses are currently pure battery electric buses. Although Tata Motors had introduced hybrid electric buses in the initial years in India, they discontinued the model.
Indian e-bus market is largely dominated by new market players who either do not have any existence or have a small presence in the ICE (including both CNG and diesel) bus market in India. Currently, the majority of e-bus OEMs offer both 9 m and 12 m variants. Additionally, OEMs like JBM-Solaris and PMI-Foton also have 7 m e-buses.
Predictably, there is high import dependence for major e-bus parts, including electric powertrain, battery and charging technology. Almost 58 per cent of current e-bus market share is directly dominated by OEMs partnerships with Chinese partners. Chinese firms are also indirectly involved in the larger supply chain for many essential EV parts, including batteries for e-buses.
In terms of battery technology, all OEMs currently rely fully on lithium-ion batteries. It is reported however that the OEMs use various battery chemistries, e.g. Tata Motors uses lithium nickel manganese cobalt (lithium-NMC) while Olectra-BYD provides lithium phosphate batteries. Almost all the OEMs use normal conductive charging technology (plug-in battery charging technology) to charge their e-buses (see Box: OEM-wise product portfolio). Although everyone claims to have flexible charging options of both slow and fast charging, slow charging option is preferred.
Only JBM-Solaris currently offers opportunity charging facilities in their buses. However, Ashok Leyland is also trying to develop a similar technology for future applications.
Ashok Leyland was the only OEM that has the experience of operating buses in the battery-swapping model. Difficulty in swapping batteries in real-world conditions and low demand for it has constrained its growth.
After mandatory implementation of the Gross Cost Contract (GCC) model in e-bus operation under FAME II, OEMs have the additional responsibility of operations and management of e-buses. Given the uncertainty around e-bus technology and unavailability of open-ended warranty on batteries and other expensive e-bus parts, OEMs perform an additional role of operating the buses as a main concessioner. This is how the GCC contractual engagement is working under the FAME II.
It is expected that the OEMs will innovate further to continue to improve battery capacity and energy efficiency to reduce energy consumption per kilometre and achieve higher
35
range on a single charge. ICCT estimates that the energy consumption (kWh/km) on a year-on-year basis is decreasing. According to their projection, a decrease of 0.70 per cent for buses and trucks will continue. Given the projected increase in battery capacity expected due to increase in total battery capacity related to the electric vehicle programme, buses will account for 18 per cent of the cumulative battery demand from 2020 to 2035 due to the rapid increase in electrification of the heavy-duty segment.40 There is expected to be rapid uptake of buses in the coming decade.
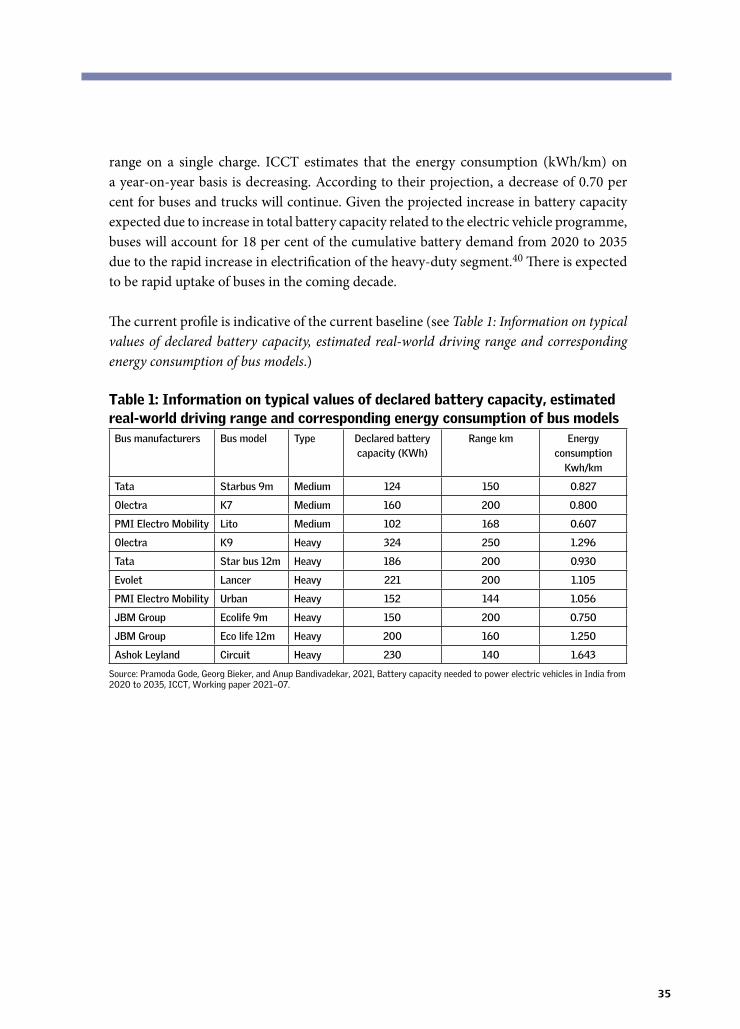
The current profile is indicative of the current baseline (see Table 1: Information on typical values of declared battery capacity, estimated real-world driving range and corresponding energy consumption of bus models.)
Table 1: Information on typical values of declared battery capacity, estimated real-world driving range and corresponding energy consumption of bus models
Bus manufacturers Bus model Type Declared battery capacity (KWh)
Range km Energy consumption
Kwh/km
Tata Starbus 9m Medium 124 150 0.827
Olectra K7 Medium 160 200 0.800
PMI Electro Mobility Lito Medium 102 168 0.607
Olectra K9 Heavy 324 250 1.296
Tata Star bus 12m Heavy 186 200 0.930
Evolet Lancer Heavy 221 200 1.105
PMI Electro Mobility Urban Heavy 152 144 1.056
JBM Group Ecolife 9m Heavy 150 200 0.750
JBM Group Eco life 12m Heavy 200 160 1.250
Ashok Leyland Circuit Heavy 230 140 1.643
Source: Pramoda Gode, Georg Bieker, and Anup Bandivadekar, 2021, Battery capacity needed to power electric vehicles in India from 2020 to 2035, ICCT, Working paper 2021–07.
36
ELECTRIC BUS: TOWARDS ZERO-EMISSION COMMUTING
OEM-wise product portfolio
TRADITIONAL OEMs
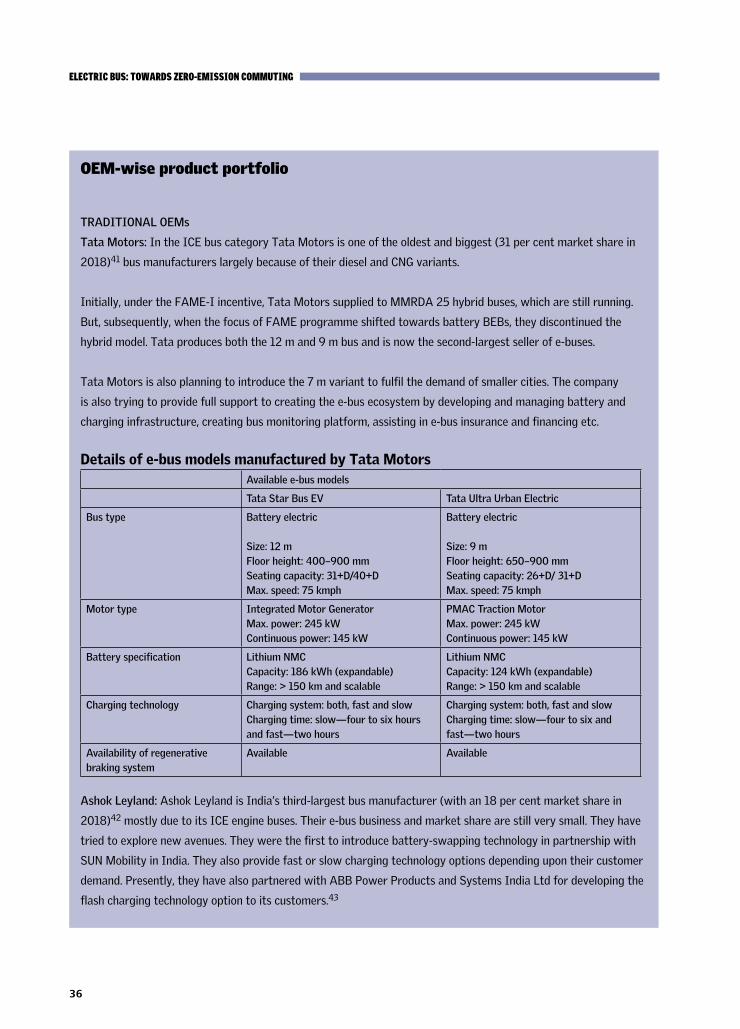
Tata Motors: In the ICE bus category Tata Motors is one of the oldest and biggest (31 per cent market share in
2018)41 bus manufacturers largely because of their diesel and CNG variants.
Initially, under the FAME-I incentive, Tata Motors supplied to MMRDA 25 hybrid buses, which are still running.
But, subsequently, when the focus of FAME programme shifted towards battery BEBs, they discontinued the
hybrid model. Tata produces both the 12 m and 9 m bus and is now the second-largest seller of e-buses.
Tata Motors is also planning to introduce the 7 m variant to fulfil the demand of smaller cities. The company
is also trying to provide full support to creating the e-bus ecosystem by developing and managing battery and
charging infrastructure, creating bus monitoring platform, assisting in e-bus insurance and financing etc.
Details of e-bus models manufactured by Tata MotorsAvailable e-bus models
Tata Star Bus EV Tata Ultra Urban Electric
Bus type Battery electric
Size: 12 mFloor height: 400–900 mmSeating capacity: 31+D/40+DMax. speed: 75 kmph
Battery electric
Size: 9 mFloor height: 650–900 mmSeating capacity: 26+D/ 31+DMax. speed: 75 kmph
Motor type Integrated Motor GeneratorMax. power: 245 kWContinuous power: 145 kW
PMAC Traction MotorMax. power: 245 kWContinuous power: 145 kW
Battery specification Lithium NMC Capacity: 186 kWh (expandable)Range: > 150 km and scalable
Lithium NMCCapacity: 124 kWh (expandable)Range: > 150 km and scalable
Charging technology Charging system: both, fast and slowCharging time: slow—four to six hours and fast—two hours
Charging system: both, fast and slowCharging time: slow—four to six and fast—two hours
Availability of regenerative braking system
Available Available
Ashok Leyland: Ashok Leyland is India’s third-largest bus manufacturer (with an 18 per cent market share in
2018)42 mostly due to its ICE engine buses. Their e-bus business and market share are still very small. They have
tried to explore new avenues. They were the first to introduce battery-swapping technology in partnership with
SUN Mobility in India. They also provide fast or slow charging technology options depending upon their customer
demand. Presently, they have also partnered with ABB Power Products and Systems India Ltd for developing the
flash charging technology option to its customers.43
37
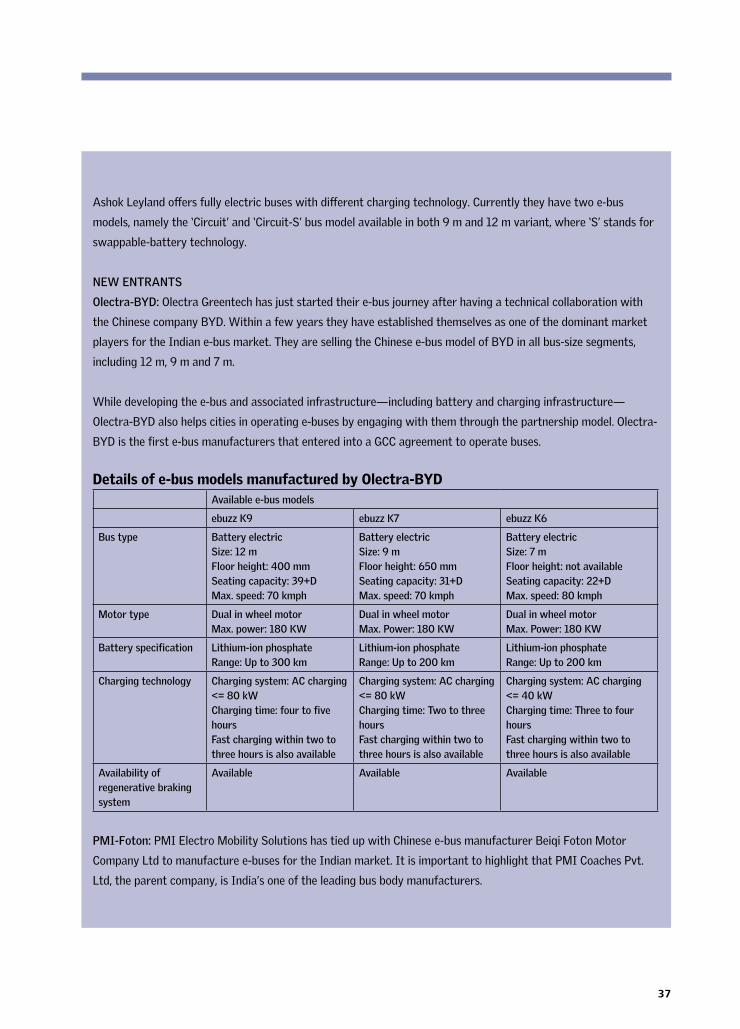
Ashok Leyland offers fully electric buses with different charging technology. Currently they have two e-bus
models, namely the ‘Circuit’ and ‘Circuit-S’ bus model available in both 9 m and 12 m variant, where ‘S’ stands for
swappable-battery technology.
NEW ENTRANTS
Olectra-BYD: Olectra Greentech has just started their e-bus journey after having a technical collaboration with
the Chinese company BYD. Within a few years they have established themselves as one of the dominant market
players for the Indian e-bus market. They are selling the Chinese e-bus model of BYD in all bus-size segments,
including 12 m, 9 m and 7 m.
While developing the e-bus and associated infrastructure—including battery and charging infrastructure—
Olectra-BYD also helps cities in operating e-buses by engaging with them through the partnership model. Olectra-
BYD is the first e-bus manufacturers that entered into a GCC agreement to operate buses.
Details of e-bus models manufactured by Olectra-BYDAvailable e-bus models
ebuzz K9 ebuzz K7 ebuzz K6
Bus type Battery electricSize: 12 mFloor height: 400 mmSeating capacity: 39+DMax. speed: 70 kmph
Battery electricSize: 9 mFloor height: 650 mmSeating capacity: 31+DMax. speed: 70 kmph
Battery electricSize: 7 mFloor height: not availableSeating capacity: 22+D Max. speed: 80 kmph
Motor type Dual in wheel motor Max. power: 180 KW
Dual in wheel motor Max. Power: 180 KW
Dual in wheel motor Max. Power: 180 KW
Battery specification Lithium-ion phosphateRange: Up to 300 km
Lithium-ion phosphateRange: Up to 200 km
Lithium-ion phosphateRange: Up to 200 km
Charging technology Charging system: AC charging <= 80 kWCharging time: four to five hoursFast charging within two to three hours is also available
Charging system: AC charging <= 80 kWCharging time: Two to three hoursFast charging within two to three hours is also available
Charging system: AC charging <= 40 kWCharging time: Three to four hoursFast charging within two to three hours is also available
Availability of regenerative braking system
Available Available Available
PMI-Foton: PMI Electro Mobility Solutions has tied up with Chinese e-bus manufacturer Beiqi Foton Motor
Company Ltd to manufacture e-buses for the Indian market. It is important to highlight that PMI Coaches Pvt.
Ltd, the parent company, is India’s one of the leading bus body manufacturers.
38
ELECTRIC BUS: TOWARDS ZERO-EMISSION COMMUTING
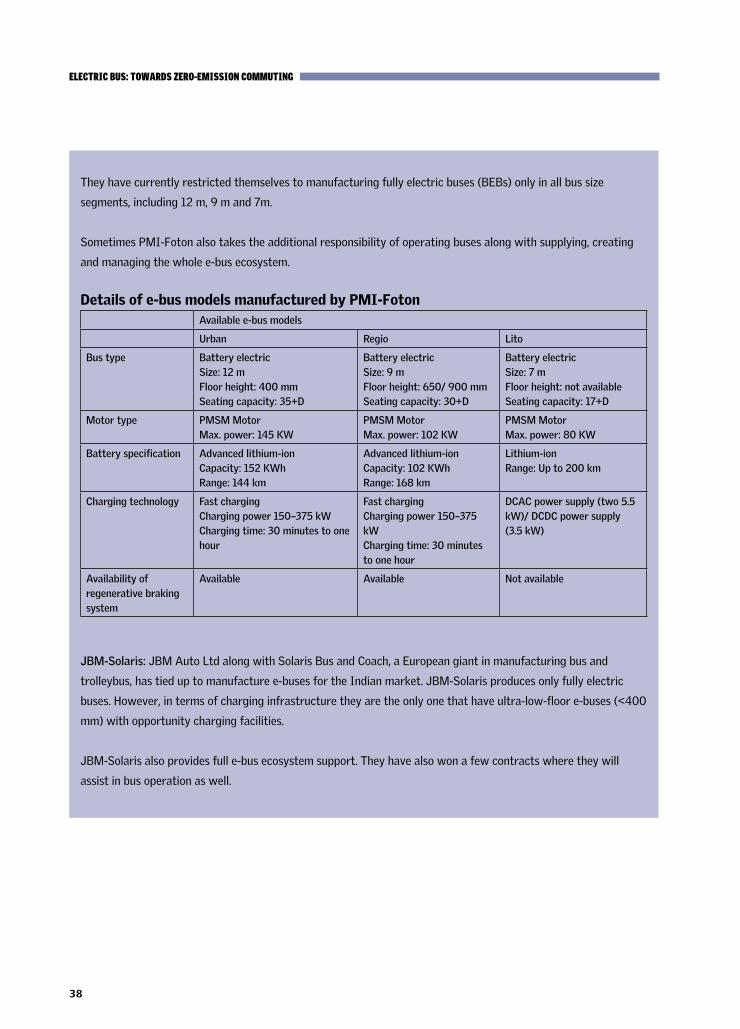
They have currently restricted themselves to manufacturing fully electric buses (BEBs) only in all bus size
segments, including 12 m, 9 m and 7m.
Sometimes PMI-Foton also takes the additional responsibility of operating buses along with supplying, creating
and managing the whole e-bus ecosystem.
Details of e-bus models manufactured by PMI-FotonAvailable e-bus models
Urban Regio Lito
Bus type Battery electricSize: 12 mFloor height: 400 mmSeating capacity: 35+D
Battery electricSize: 9 mFloor height: 650/ 900 mmSeating capacity: 30+D
Battery electricSize: 7 mFloor height: not availableSeating capacity: 17+D
Motor type PMSM MotorMax. power: 145 KW
PMSM MotorMax. power: 102 KW
PMSM MotorMax. power: 80 KW
Battery specification Advanced lithium-ion Capacity: 152 KWhRange: 144 km
Advanced lithium-ionCapacity: 102 KWhRange: 168 km
Lithium-ionRange: Up to 200 km
Charging technology Fast charging Charging power 150–375 kWCharging time: 30 minutes to one hour
Fast chargingCharging power 150–375 kWCharging time: 30 minutes to one hour
DCAC power supply (two 5.5 kW)/ DCDC power supply (3.5 kW)
Availability of regenerative braking system
Available Available Not available
JBM-Solaris: JBM Auto Ltd along with Solaris Bus and Coach, a European giant in manufacturing bus and
trolleybus, has tied up to manufacture e-buses for the Indian market. JBM-Solaris produces only fully electric
buses. However, in terms of charging infrastructure they are the only one that have ultra-low-floor e-buses (<400
mm) with opportunity charging facilities.
JBM-Solaris also provides full e-bus ecosystem support. They have also won a few contracts where they will
assist in bus operation as well.
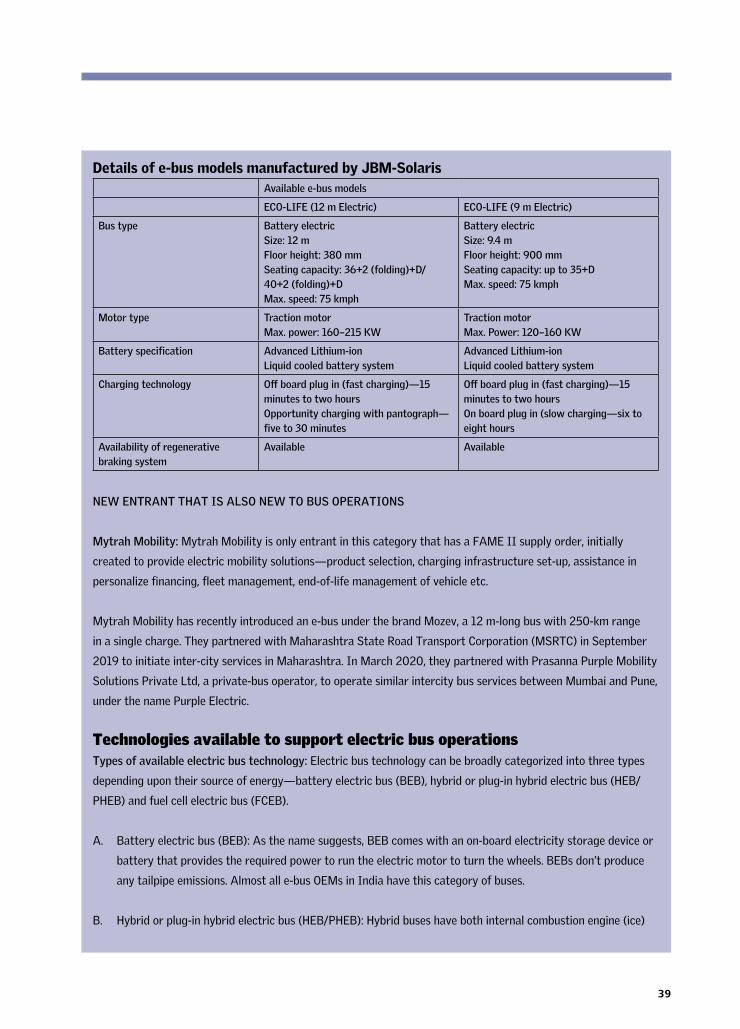
39
Details of e-bus models manufactured by JBM-SolarisAvailable e-bus models
ECO-LIFE (12 m Electric) ECO-LIFE (9 m Electric)
Bus type Battery electricSize: 12 mFloor height: 380 mmSeating capacity: 36+2 (folding)+D/ 40+2 (folding)+DMax. speed: 75 kmph
Battery electricSize: 9.4 mFloor height: 900 mmSeating capacity: up to 35+DMax. speed: 75 kmph
Motor type Traction motor Max. power: 160–215 KW
Traction motor Max. Power: 120–160 KW
Battery specification Advanced Lithium-ionLiquid cooled battery system
Advanced Lithium-ionLiquid cooled battery system
Charging technology Off board plug in (fast charging)—15 minutes to two hoursOpportunity charging with pantograph—five to 30 minutes
Off board plug in (fast charging)—15 minutes to two hoursOn board plug in (slow charging—six to eight hours
Availability of regenerative braking system
Available Available
NEW ENTRANT THAT IS ALSO NEW TO BUS OPERATIONS
Mytrah Mobility: Mytrah Mobility is only entrant in this category that has a FAME II supply order, initially
created to provide electric mobility solutions—product selection, charging infrastructure set-up, assistance in
personalize financing, fleet management, end-of-life management of vehicle etc.
Mytrah Mobility has recently introduced an e-bus under the brand Mozev, a 12 m-long bus with 250-km range
in a single charge. They partnered with Maharashtra State Road Transport Corporation (MSRTC) in September
2019 to initiate inter-city services in Maharashtra. In March 2020, they partnered with Prasanna Purple Mobility
Solutions Private Ltd, a private-bus operator, to operate similar intercity bus services between Mumbai and Pune,
under the name Purple Electric.
Technologies available to support electric bus operations Types of available electric bus technology: Electric bus technology can be broadly categorized into three types
depending upon their source of energy—battery electric bus (BEB), hybrid or plug-in hybrid electric bus (HEB/
PHEB) and fuel cell electric bus (FCEB).
A. Battery electric bus (BEB): As the name suggests, BEB comes with an on-board electricity storage device or
battery that provides the required power to run the electric motor to turn the wheels. BEBs don’t produce
any tailpipe emissions. Almost all e-bus OEMs in India have this category of buses.
B. Hybrid or plug-in hybrid electric bus (HEB/PHEB): Hybrid buses have both internal combustion engine (ice)
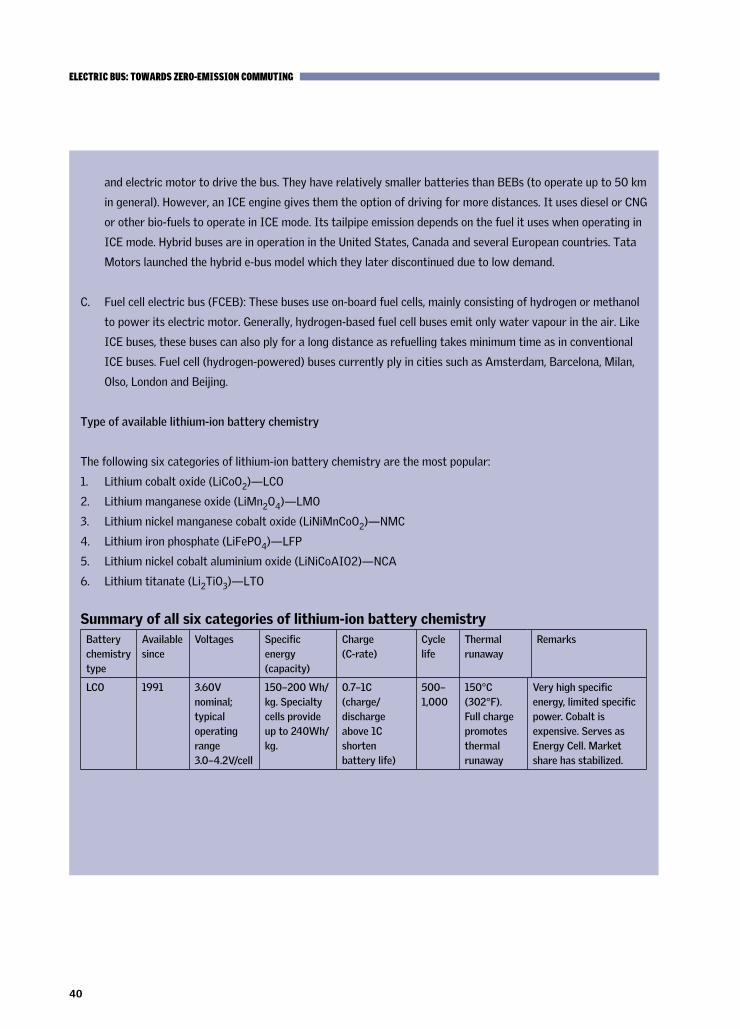
40
ELECTRIC BUS: TOWARDS ZERO-EMISSION COMMUTING
and electric motor to drive the bus. They have relatively smaller batteries than BEBs (to operate up to 50 km
in general). However, an ICE engine gives them the option of driving for more distances. It uses diesel or CNG
or other bio-fuels to operate in ICE mode. Its tailpipe emission depends on the fuel it uses when operating in
ICE mode. Hybrid buses are in operation in the United States, Canada and several European countries. Tata
Motors launched the hybrid e-bus model which they later discontinued due to low demand.
C. Fuel cell electric bus (FCEB): These buses use on-board fuel cells, mainly consisting of hydrogen or methanol
to power its electric motor. Generally, hydrogen-based fuel cell buses emit only water vapour in the air. Like
ICE buses, these buses can also ply for a long distance as refuelling takes minimum time as in conventional
ICE buses. Fuel cell (hydrogen-powered) buses currently ply in cities such as Amsterdam, Barcelona, Milan,
Olso, London and Beijing.
Type of available lithium-ion battery chemistry
The following six categories of lithium-ion battery chemistry are the most popular:
1. Lithium cobalt oxide (LiCoO2)—LCO
2. Lithium manganese oxide (LiMn2O4)—LMO
3. Lithium nickel manganese cobalt oxide (LiNiMnCoO2)—NMC
4. Lithium iron phosphate (LiFePO4)—LFP
5. Lithium nickel cobalt aluminium oxide (LiNiCoAIO2)—NCA
6. Lithium titanate (Li2TiO3)—LTO
Summary of all six categories of lithium-ion battery chemistry Battery chemistry type
Available since
Voltages Specific energy (capacity)
Charge (C-rate)
Cycle life
Thermal runaway
Remarks
LCO 1991 3.60V nominal; typical operating range 3.0–4.2V/cell
150–200 Wh/kg. Specialty cells provide up to 240Wh/kg.
0.7–1C(charge/ discharge above 1C shorten battery life)
500–1,000
150°C (302°F). Full charge promotes thermal runaway
Very high specific energy, limited specific power. Cobalt is expensive. Serves as Energy Cell. Market share has stabilized.
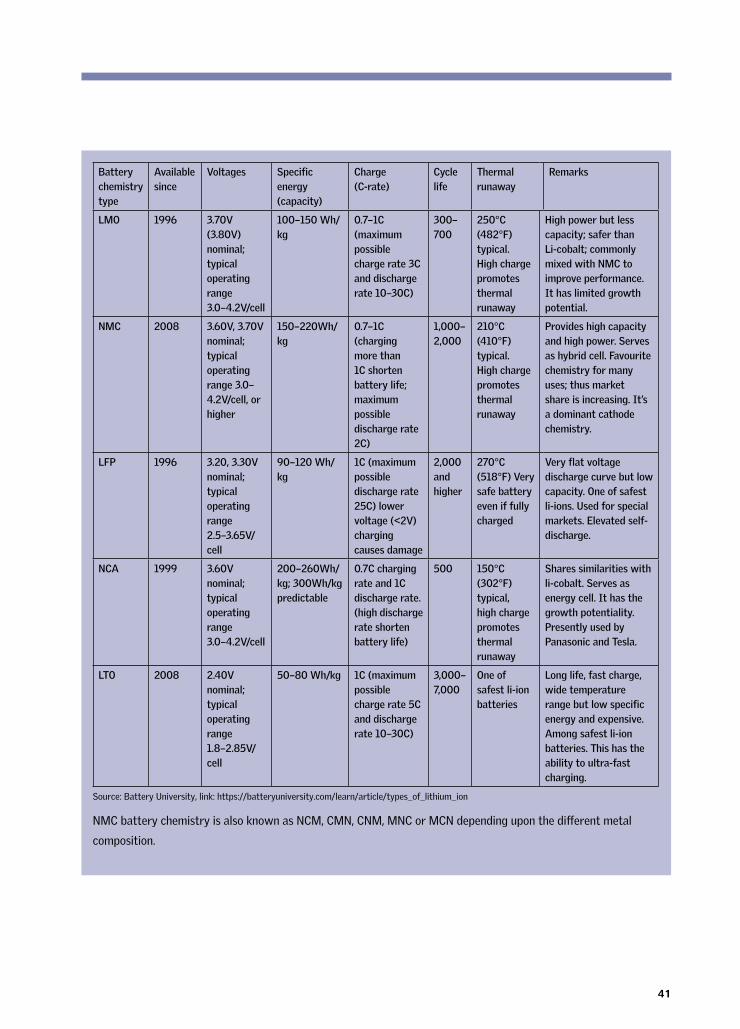
41
Battery chemistry type
Available since
Voltages Specific energy (capacity)
Charge (C-rate)
Cycle life
Thermal runaway
Remarks
LMO 1996 3.70V (3.80V) nominal; typical operating range 3.0–4.2V/cell
100–150 Wh/kg
0.7–1C(maximum possible charge rate 3C and discharge rate 10–30C)
300– 700
250°C (482°F) typical. High charge promotes thermal runaway
High power but less capacity; safer than Li-cobalt; commonly mixed with NMC to improve performance.It has limited growth potential.
NMC 2008 3.60V, 3.70V nominal; typical operating range 3.0–4.2V/cell, or higher
150–220Wh/kg
0.7–1C(charging more than 1C shorten battery life; maximum possible discharge rate 2C)
1,000–2,000
210°C (410°F) typical. High charge promotes thermal runaway
Provides high capacity and high power. Serves as hybrid cell. Favourite chemistry for many uses; thus market share is increasing. It’s a dominant cathode chemistry.
LFP 1996 3.20, 3.30V nominal; typical operating range 2.5–3.65V/cell
90–120 Wh/kg
1C (maximum possible discharge rate 25C) lower voltage (<2V) charging causes damage
2,000 and higher
270°C (518°F) Very safe battery even if fully charged
Very flat voltage discharge curve but low capacity. One of safest li-ions. Used for special markets. Elevated self-discharge.
NCA 1999 3.60V nominal; typical operating range 3.0–4.2V/cell
200–260Wh/kg; 300Wh/kg predictable
0.7C charging rate and 1C discharge rate. (high discharge rate shorten battery life)
500 150°C (302°F) typical, high charge promotes thermal runaway
Shares similarities with li-cobalt. Serves as energy cell. It has the growth potentiality. Presently used by Panasonic and Tesla.
LTO 2008 2.40V nominal; typical operating range 1.8–2.85V/cell
50–80 Wh/kg 1C (maximum possible charge rate 5C and discharge rate 10–30C)
3,000– 7,000
One of safest li-ion batteries
Long life, fast charge, wide temperature range but low specific energy and expensive. Among safest li-ion batteries. This has the ability to ultra-fast charging.
Source: Battery University, link: https://batteryuniversity.com/learn/article/types_of_lithium_ion
NMC battery chemistry is also known as NCM, CMN, CNM, MNC or MCN depending upon the different metal
composition.
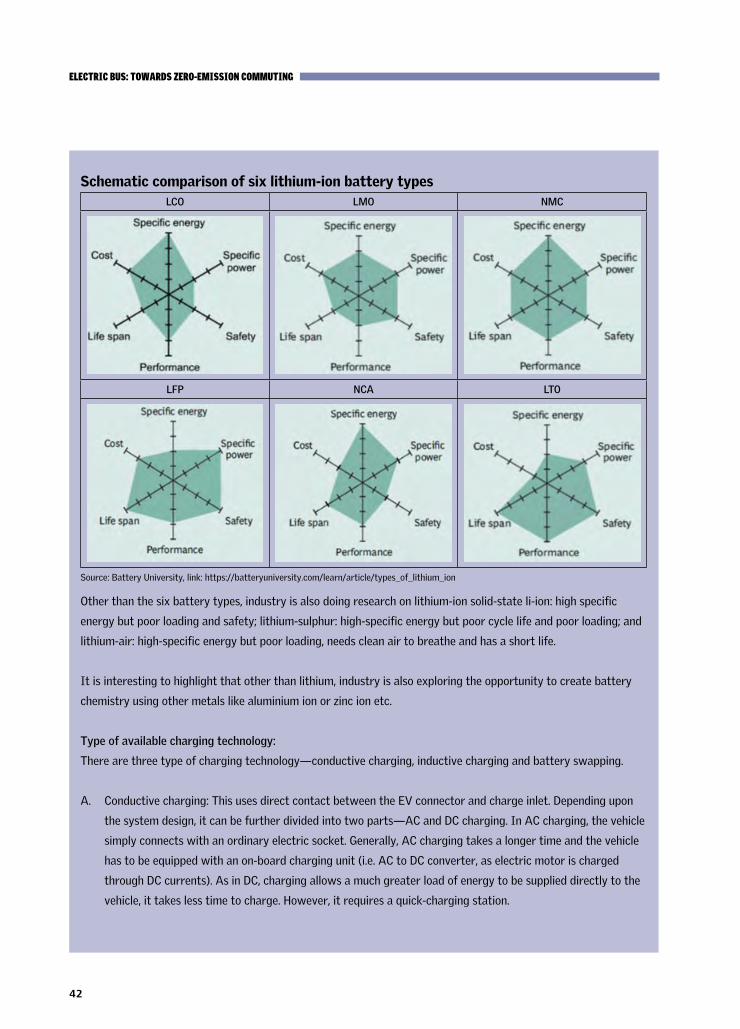
42
ELECTRIC BUS: TOWARDS ZERO-EMISSION COMMUTING
Schematic comparison of six lithium-ion battery typesLCO LMO NMC
LFP NCA LTO
Source: Battery University, link: https://batteryuniversity.com/learn/article/types_of_lithium_ion
Other than the six battery types, industry is also doing research on lithium-ion solid-state li-ion: high specific
energy but poor loading and safety; lithium-sulphur: high-specific energy but poor cycle life and poor loading; and
lithium-air: high-specific energy but poor loading, needs clean air to breathe and has a short life.
It is interesting to highlight that other than lithium, industry is also exploring the opportunity to create battery
chemistry using other metals like aluminium ion or zinc ion etc.
Type of available charging technology:
There are three type of charging technology—conductive charging, inductive charging and battery swapping.
A. Conductive charging: This uses direct contact between the EV connector and charge inlet. Depending upon
the system design, it can be further divided into two parts—AC and DC charging. In AC charging, the vehicle
simply connects with an ordinary electric socket. Generally, AC charging takes a longer time and the vehicle
has to be equipped with an on-board charging unit (i.e. AC to DC converter, as electric motor is charged
through DC currents). As in DC, charging allows a much greater load of energy to be supplied directly to the
vehicle, it takes less time to charge. However, it requires a quick-charging station.
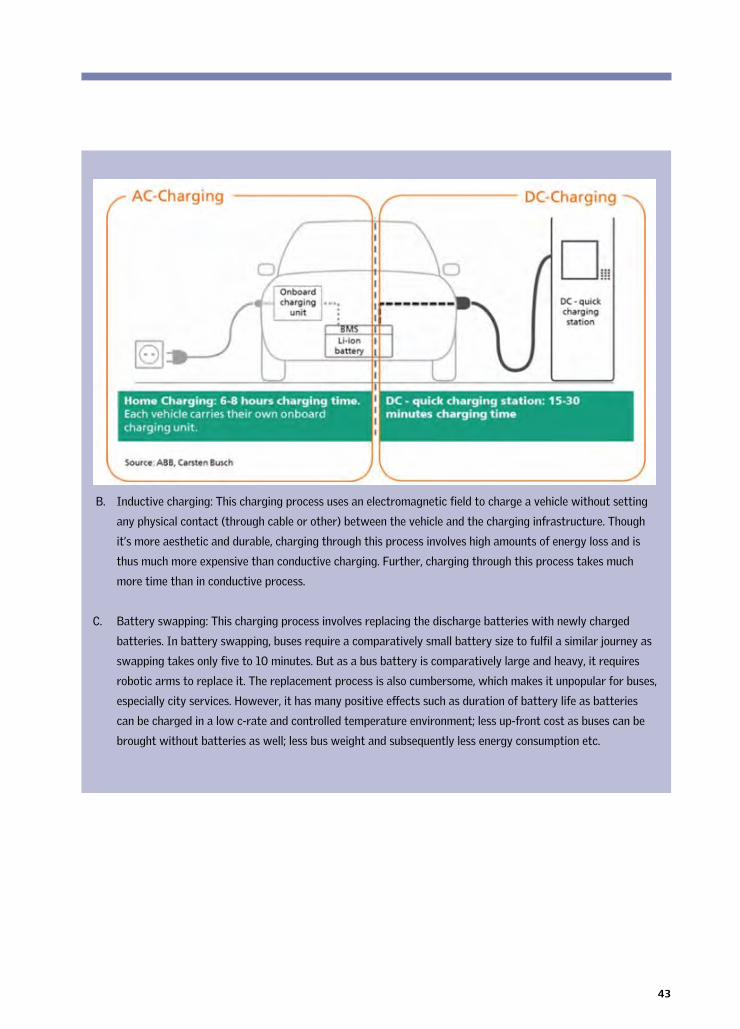
43
B. Inductive charging: This charging process uses an electromagnetic field to charge a vehicle without setting
any physical contact (through cable or other) between the vehicle and the charging infrastructure. Though
it’s more aesthetic and durable, charging through this process involves high amounts of energy loss and is
thus much more expensive than conductive charging. Further, charging through this process takes much
more time than in conductive process.
C. Battery swapping: This charging process involves replacing the discharge batteries with newly charged
batteries. In battery swapping, buses require a comparatively small battery size to fulfil a similar journey as
swapping takes only five to 10 minutes. But as a bus battery is comparatively large and heavy, it requires
robotic arms to replace it. The replacement process is also cumbersome, which makes it unpopular for buses,
especially city services. However, it has many positive effects such as duration of battery life as batteries
can be charged in a low c-rate and controlled temperature environment; less up-front cost as buses can be
brought without batteries as well; less bus weight and subsequently less energy consumption etc.
44
SECTION 3E-bus operations in IndiaCurrently, approximately 670 e-buses are in operation in India, of which about 85 per cent are deployed for intra-city operations. Only very few services are meant for intercity travel. For example, 50 e-buses each of Himachal Road Transport Corporation and Karnataka Transport Corporation are deployed for intercity operations.
Approximately, 75 per cent of the all-operational buses are funded under FAME I and II schemes; the rest are funded through state or other funding sources (see Annexure 1: Electric and hybrid buses sanctioned under FAME I). Except for 25 buses, i.e. hybrid buses operated by BEST on behalf of MMRDA (procured under FAME I), all the buses are fully battery electric buses.
Since the announcement of FAME II, the tender for around 4,000 e-bus has been completed, including state-sponsored buses, and approximately 3,200 e-buses have given approval for supply. However, still almost 1935 FAME II e-buses have been left out from the first phase (see Annexure 2: Planned electric bus deployment under FAME II).
There is a distinct variation in the geographical distribution of bus deployment based on the responses from the state governments. On the basis of the actual number of operational e-buses and those that have approval for supply (after finishing the tender process), the major concentration so far is in western and southern states of India (see Annexure 6: Number of operational e-buses vis-à-vis approved supply order in India [till March 2021]). Five big metropolitan cities, i.e. Delhi, Mumbai, Pune, Ahmedabad and Bengaluru, have each already placed orders of 300 or more e-buses under FAME II.
Initial hiccups under FAME I: During the initial phase, public transport agencies were sceptical about the e-bus performance and the very high costs of buses. As a result, Delhi and Bengaluru did not place any order under FAME I even though they were eligible for FAME benefits. Bengaluru even cancelled tenders at the final stage, citing high cost of buses.
However, the cost curve started to reduce even during the initial phase of FAME I. A deeper analysis of e-bus purchase (that were in the category of direct purchase or out-right model) under FAME I reveals how the cost curve has gone down over time (see Graph 7: Trend of an individual e-bus purchase cost vis-a-vis bus size [in 2017–18).
The cost of e-buses in India has reduced substantially—by as much as approximately 50 per cent—due to more competition among OEMs. Tata Motors, which supplied 12 m AC
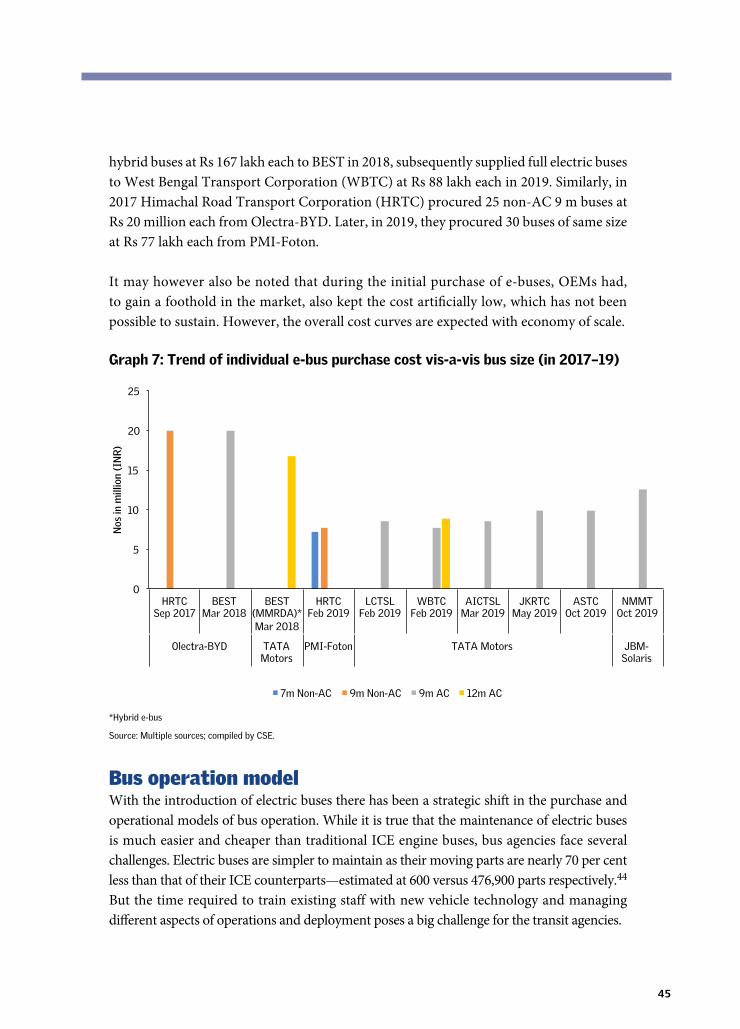
45
hybrid buses at Rs 167 lakh each to BEST in 2018, subsequently supplied full electric buses to West Bengal Transport Corporation (WBTC) at Rs 88 lakh each in 2019. Similarly, in 2017 Himachal Road Transport Corporation (HRTC) procured 25 non-AC 9 m buses at Rs 20 million each from Olectra-BYD. Later, in 2019, they procured 30 buses of same size at Rs 77 lakh each from PMI-Foton.
It may however also be noted that during the initial purchase of e-buses, OEMs had, to gain a foothold in the market, also kept the cost artificially low, which has not been possible to sustain. However, the overall cost curves are expected with economy of scale.
Graph 7: Trend of individual e-bus purchase cost vis-a-vis bus size (in 2017–19)
0
5
10
15
20
25
HRTCSep 2017
BESTMar 2018
BEST (MMRDA)*Mar 2018
HRTCFeb 2019
LCTSLFeb 2019
WBTCFeb 2019
AICTSLMar 2019
JKRTCMay 2019
ASTCOct 2019
NMMTOct 2019
Olectra-BYD TATA Motors
PMI-Foton TATA Motors JBM-Solaris
Nos
in m
illio
n (I
NR
)
7m Non-AC 9m Non-AC 9m AC 12m AC
*Hybrid e-bus
Source: Multiple sources; compiled by CSE.
Bus operation modelWith the introduction of electric buses there has been a strategic shift in the purchase and operational models of bus operation. While it is true that the maintenance of electric buses is much easier and cheaper than traditional ICE engine buses, bus agencies face several challenges. Electric buses are simpler to maintain as their moving parts are nearly 70 per cent less than that of their ICE counterparts—estimated at 600 versus 476,900 parts respectively.44 But the time required to train existing staff with new vehicle technology and managing different aspects of operations and deployment poses a big challenge for the transit agencies.
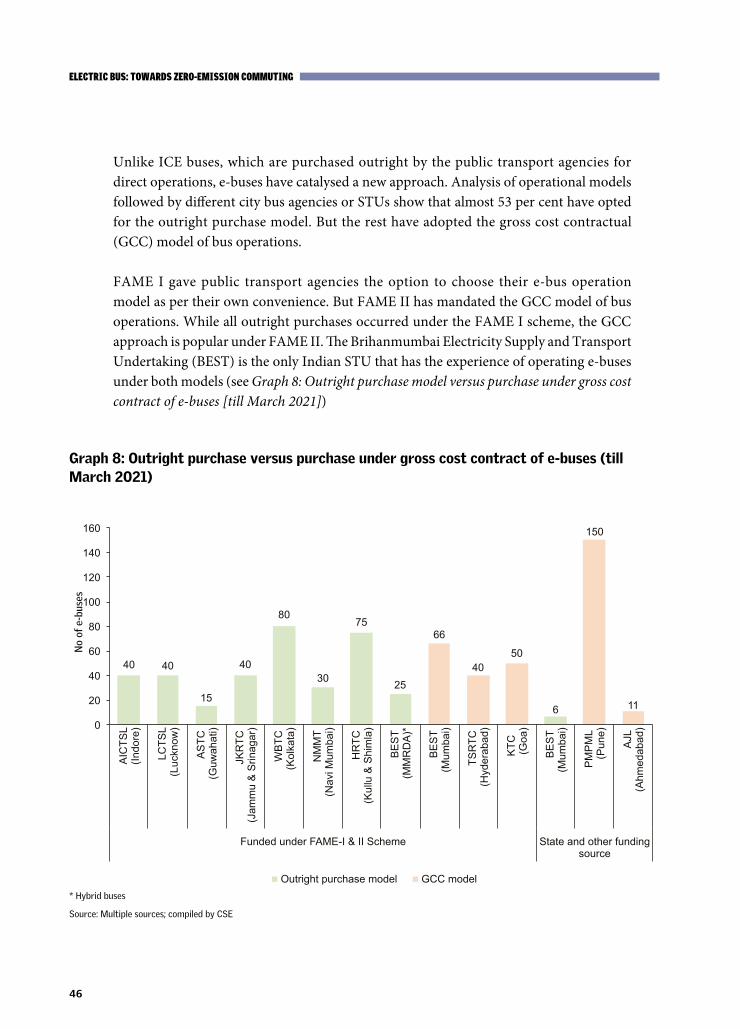
46
ELECTRIC BUS: TOWARDS ZERO-EMISSION COMMUTING
Unlike ICE buses, which are purchased outright by the public transport agencies for direct operations, e-buses have catalysed a new approach. Analysis of operational models followed by different city bus agencies or STUs show that almost 53 per cent have opted for the outright purchase model. But the rest have adopted the gross cost contractual (GCC) model of bus operations.
FAME I gave public transport agencies the option to choose their e-bus operation model as per their own convenience. But FAME II has mandated the GCC model of bus operations. While all outright purchases occurred under the FAME I scheme, the GCC approach is popular under FAME II. The Brihanmumbai Electricity Supply and Transport Undertaking (BEST) is the only Indian STU that has the experience of operating e-buses under both models (see Graph 8: Outright purchase model versus purchase under gross cost contract of e-buses [till March 2021])
Graph 8: Outright purchase versus purchase under gross cost contract of e-buses (till March 2021)
40 40
15
40
80
30
75
25
6
66
40 50
150
11
0
20
40
60
80
100
120
140
160
AIC
TSL
(Indo
re)
LCTS
L (L
uckn
ow)
AS
TC
(Guw
ahat
i)
JKR
TC
(Jam
mu
& S
rinag
ar)
WB
TC
(Kol
kata
)
NM
MT
(N
avi M
umba
i)
HR
TC
(Kul
lu &
Shi
mla
)
BE
ST
(M
MR
DA
)*
BE
ST
(M
umba
i)
TSR
TC
(Hyd
erab
ad)
KTC
(G
oa)
BE
ST
(M
umba
i)
PM
PM
L
(Pun
e)
AJL
(A
hmed
abad
)
Funded under FAME-I & II Scheme State and other funding source
Outright purchase model GCC model
No
of e
-bus
es
* Hybrid buses
Source: Multiple sources; compiled by CSE
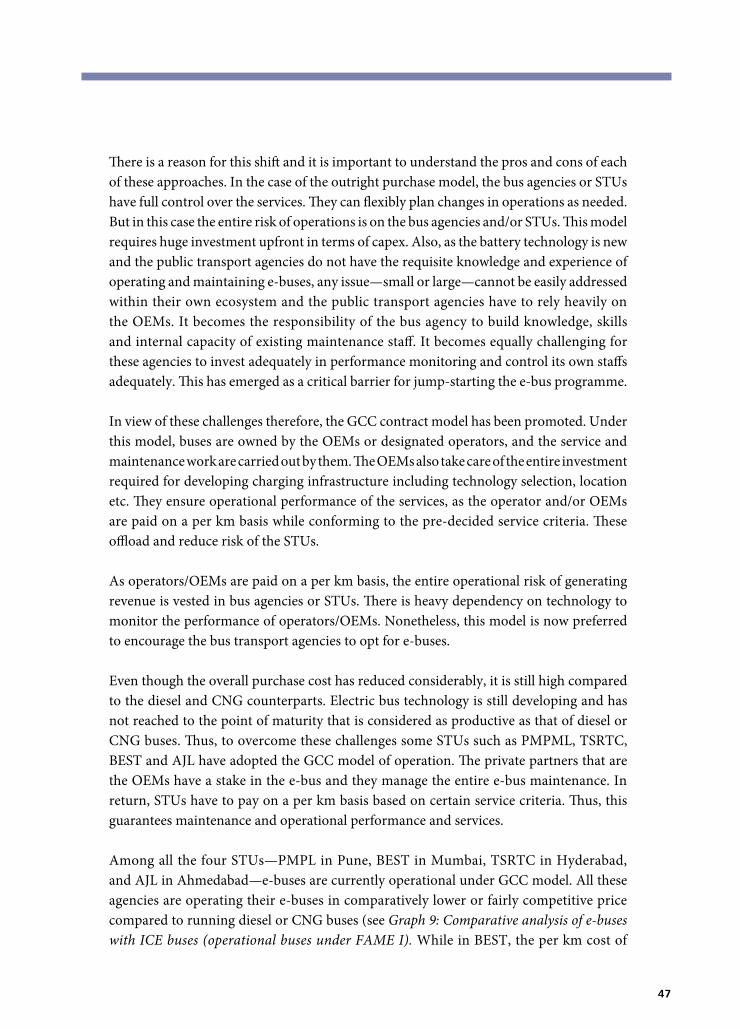
47
There is a reason for this shift and it is important to understand the pros and cons of each of these approaches. In the case of the outright purchase model, the bus agencies or STUs have full control over the services. They can flexibly plan changes in operations as needed. But in this case the entire risk of operations is on the bus agencies and/or STUs. This model requires huge investment upfront in terms of capex. Also, as the battery technology is new and the public transport agencies do not have the requisite knowledge and experience of operating and maintaining e-buses, any issue—small or large—cannot be easily addressed within their own ecosystem and the public transport agencies have to rely heavily on the OEMs. It becomes the responsibility of the bus agency to build knowledge, skills and internal capacity of existing maintenance staff. It becomes equally challenging for these agencies to invest adequately in performance monitoring and control its own staffs adequately. This has emerged as a critical barrier for jump-starting the e-bus programme.
In view of these challenges therefore, the GCC contract model has been promoted. Under this model, buses are owned by the OEMs or designated operators, and the service and maintenance work are carried out by them. The OEMs also take care of the entire investment required for developing charging infrastructure including technology selection, location etc. They ensure operational performance of the services, as the operator and/or OEMs are paid on a per km basis while conforming to the pre-decided service criteria. These offload and reduce risk of the STUs.
As operators/OEMs are paid on a per km basis, the entire operational risk of generating revenue is vested in bus agencies or STUs. There is heavy dependency on technology to monitor the performance of operators/OEMs. Nonetheless, this model is now preferred to encourage the bus transport agencies to opt for e-buses.
Even though the overall purchase cost has reduced considerably, it is still high compared to the diesel and CNG counterparts. Electric bus technology is still developing and has not reached to the point of maturity that is considered as productive as that of diesel or CNG buses. Thus, to overcome these challenges some STUs such as PMPML, TSRTC, BEST and AJL have adopted the GCC model of operation. The private partners that are the OEMs have a stake in the e-bus and they manage the entire e-bus maintenance. In return, STUs have to pay on a per km basis based on certain service criteria. Thus, this guarantees maintenance and operational performance and services.
Among all the four STUs—PMPL in Pune, BEST in Mumbai, TSRTC in Hyderabad, and AJL in Ahmedabad—e-buses are currently operational under GCC model. All these agencies are operating their e-buses in comparatively lower or fairly competitive price compared to running diesel or CNG buses (see Graph 9: Comparative analysis of e-buses with ICE buses (operational buses under FAME I). While in BEST, the per km cost of
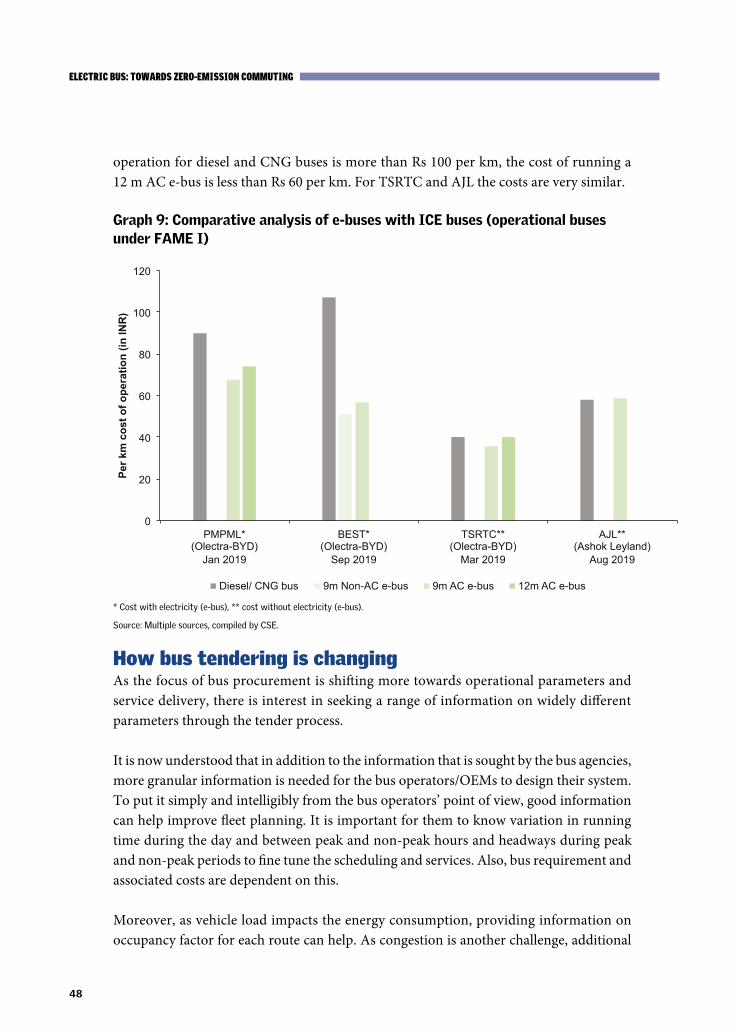
48
ELECTRIC BUS: TOWARDS ZERO-EMISSION COMMUTING
operation for diesel and CNG buses is more than Rs 100 per km, the cost of running a 12 m AC e-bus is less than Rs 60 per km. For TSRTC and AJL the costs are very similar.
Graph 9: Comparative analysis of e-buses with ICE buses (operational buses under FAME I)
0
20
40
60
80
100
120
PMPML* (Olectra-BYD)
Jan 2019
BEST* (Olectra-BYD)
Sep 2019
TSRTC** (Olectra-BYD)
Mar 2019
AJL** (Ashok Leyland)
Aug 2019
Per k
m c
ost o
f ope
ratio
n (in
INR
)
Diesel/ CNG bus 9m Non-AC e-bus 9m AC e-bus 12m AC e-bus
* Cost with electricity (e-bus), ** cost without electricity (e-bus).
Source: Multiple sources, compiled by CSE.
How bus tendering is changingAs the focus of bus procurement is shifting more towards operational parameters and service delivery, there is interest in seeking a range of information on widely different parameters through the tender process.
It is now understood that in addition to the information that is sought by the bus agencies, more granular information is needed for the bus operators/OEMs to design their system. To put it simply and intelligibly from the bus operators’ point of view, good information can help improve fleet planning. It is important for them to know variation in running time during the day and between peak and non-peak hours and headways during peak and non-peak periods to fine tune the scheduling and services. Also, bus requirement and associated costs are dependent on this.
Moreover, as vehicle load impacts the energy consumption, providing information on occupancy factor for each route can help. As congestion is another challenge, additional
49
information regarding traffic conditions on routes can help. Not just depot location but also information on the distance from route origin to destination is important. Also, operators and OEMs need to know the crew schedules or crew changing patterns during operations. In addition, information regarding major terminals which can be developed as opportunity charging locations (if needed) should be provided.
It is interesting to note how tenders for bus procurement now mention defined routes and depots for electrification as part of procurement (see Graph 10: Operational details prescribed in tenders).
Graph 10: Operational details prescribed in tenders
Mentioned 57%
Not mentioned
43%
Mentioned 71%
Not mentioned
29%
Source: UITP
Until March 2021, the tendering process has been completed for approximately 3,660 e-buses (for 42 cities/STUs). But the Letter of Award (LoA) has not been issued for a few cities. Completed and closed FAME II tenders reveal price differences across cities for both the variants. Almost 32 cities/STUs have finished their final bidding process. The average per km cost of operating 9 m and 12 m e-buses is around Rs 64 and Rs 69.51, respectively, a difference of Rs 5.51.
However, a cumulative percentage distribution graph of cities/STUs clearly shows that almost 80 per cent cities/STUs have received a quote less than Rs 65 and Rs 70 for 9 m and 12 m variant, respectively. Just a few outliers affect the average (see Graph 11: Cumulative percentage distribution of cities/STUs vis-a-vis per km cost).
It is important to note that the bulk of per km cost includes the cost of electricity. Two cities have not specified electricity charges, but the rest have.
Defined routes Number of depots
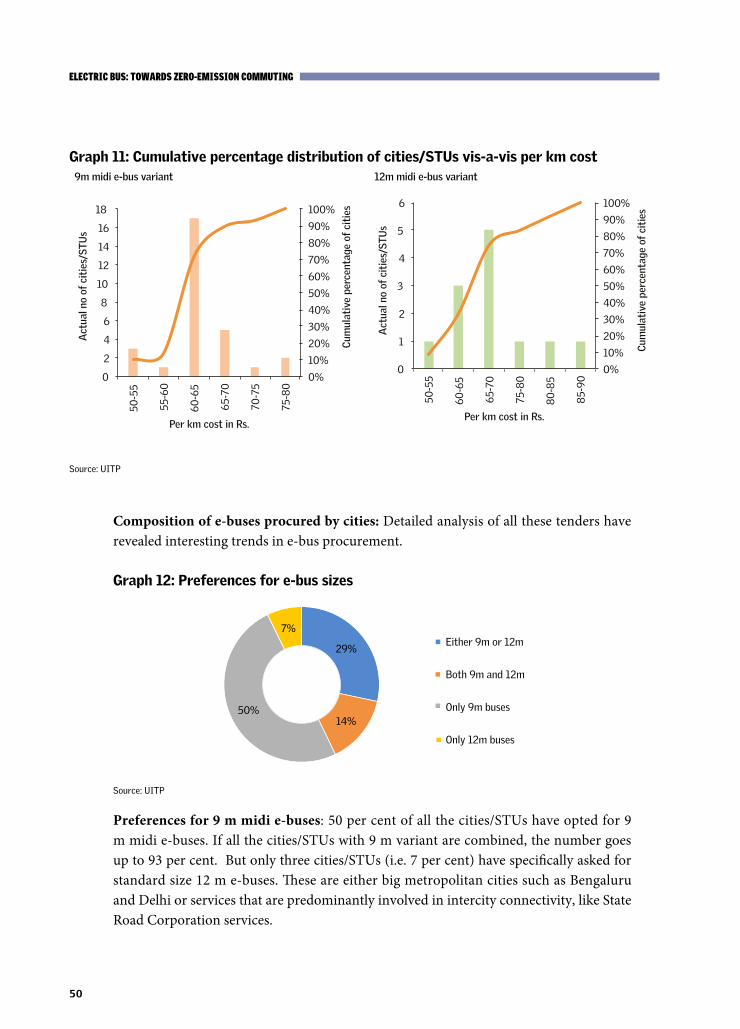
50
ELECTRIC BUS: TOWARDS ZERO-EMISSION COMMUTING
Composition of e-buses procured by cities: Detailed analysis of all these tenders have revealed interesting trends in e-bus procurement.
Graph 12: Preferences for e-bus sizes
29%
14%50%
7%Either 9m or 12m
Both 9m and 12m
Only 9m buses
Only 12m buses
Source: UITP
Preferences for 9 m midi e-buses: 50 per cent of all the cities/STUs have opted for 9 m midi e-buses. If all the cities/STUs with 9 m variant are combined, the number goes up to 93 per cent. But only three cities/STUs (i.e. 7 per cent) have specifically asked for standard size 12 m e-buses. These are either big metropolitan cities such as Bengaluru and Delhi or services that are predominantly involved in intercity connectivity, like State Road Corporation services.
Graph 11: Cumulative percentage distribution of cities/STUs vis-a-vis per km cost9m midi e-bus variant
0%
10%
20%
30%
40%
50%
60%
70%
80%
90%
100%
0
2
4
6
8
10
12
14
16
18
50-5
5
55-6
0
60-6
5
65-7
0
70-7
5
75-8
0
Cum
ulat
ive
perc
enta
ge o
f ci
ties
Act
ual n
o of
cit
ies/
STU
s
Per km cost in Rs.
12m midi e-bus variant
0%
10%
20%
30%
40%
50%
60%
70%
80%
90%
100%
0
1
2
3
4
5
6
50-5
5
60-6
5
65-7
0
75-8
0
80
-85
85-
90
Per km cost in Rs.
Cum
ulat
ive
perc
enta
ge o
f ci
ties
Act
ual n
o of
cit
ies/
STU
s
Source: UITP
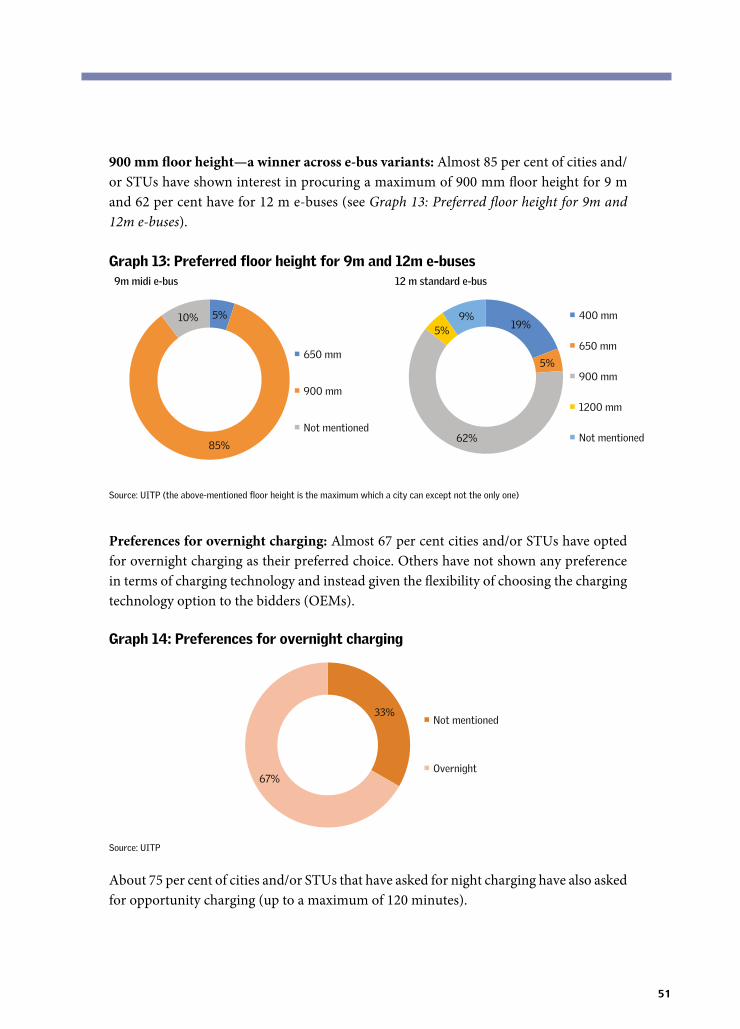
51
900 mm floor height—a winner across e-bus variants: Almost 85 per cent of cities and/or STUs have shown interest in procuring a maximum of 900 mm floor height for 9 m and 62 per cent have for 12 m e-buses (see Graph 13: Preferred floor height for 9m and 12m e-buses).
Graph 13: Preferred floor height for 9m and 12m e-buses9m midi e-bus
5%
85%
10%
650 mm
900 mm
Not mentioned
12 m standard e-bus
19%
5%
62%
5%9% 400 mm
650 mm
900 mm
1200 mm
Not mentioned
Source: UITP (the above-mentioned floor height is the maximum which a city can except not the only one)
Preferences for overnight charging: Almost 67 per cent cities and/or STUs have opted for overnight charging as their preferred choice. Others have not shown any preference in terms of charging technology and instead given the flexibility of choosing the charging technology option to the bidders (OEMs).
Graph 14: Preferences for overnight charging
33%
67%
Not mentioned
Overnight
Source: UITP
About 75 per cent of cities and/or STUs that have asked for night charging have also asked for opportunity charging (up to a maximum of 120 minutes).
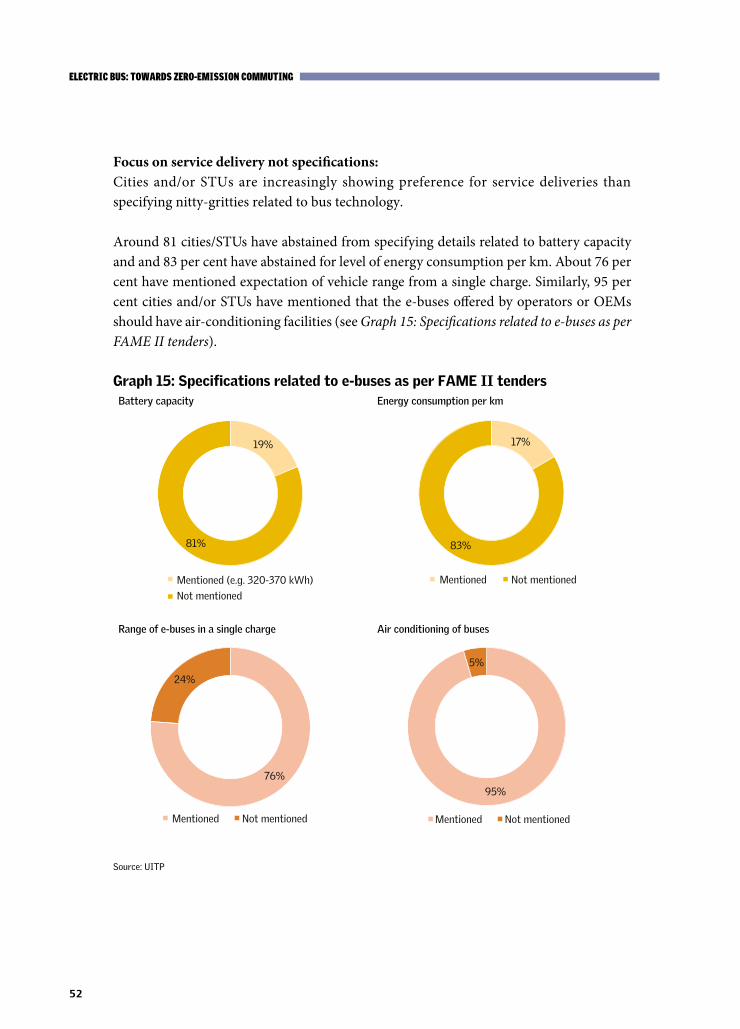
52
ELECTRIC BUS: TOWARDS ZERO-EMISSION COMMUTING
Focus on service delivery not specifications:Cities and/or STUs are increasingly showing preference for service deliveries than specifying nitty-gritties related to bus technology.
Around 81 cities/STUs have abstained from specifying details related to battery capacity and and 83 per cent have abstained for level of energy consumption per km. About 76 per cent have mentioned expectation of vehicle range from a single charge. Similarly, 95 per cent cities and/or STUs have mentioned that the e-buses offered by operators or OEMs should have air-conditioning facilities (see Graph 15: Specifications related to e-buses as per FAME II tenders).
Graph 15: Specifications related to e-buses as per FAME II tendersBattery capacity
19%
81%
Mentioned (e.g. 320-370 kWh)
Not mentioned
Energy consumption per km
17%
83%
Mentioned Not mentioned
Range of e-buses in a single charge
76%
24%
Mentioned Not mentioned
Air conditioning of buses
95%
5%
Mentioned Not mentioned
Source: UITP
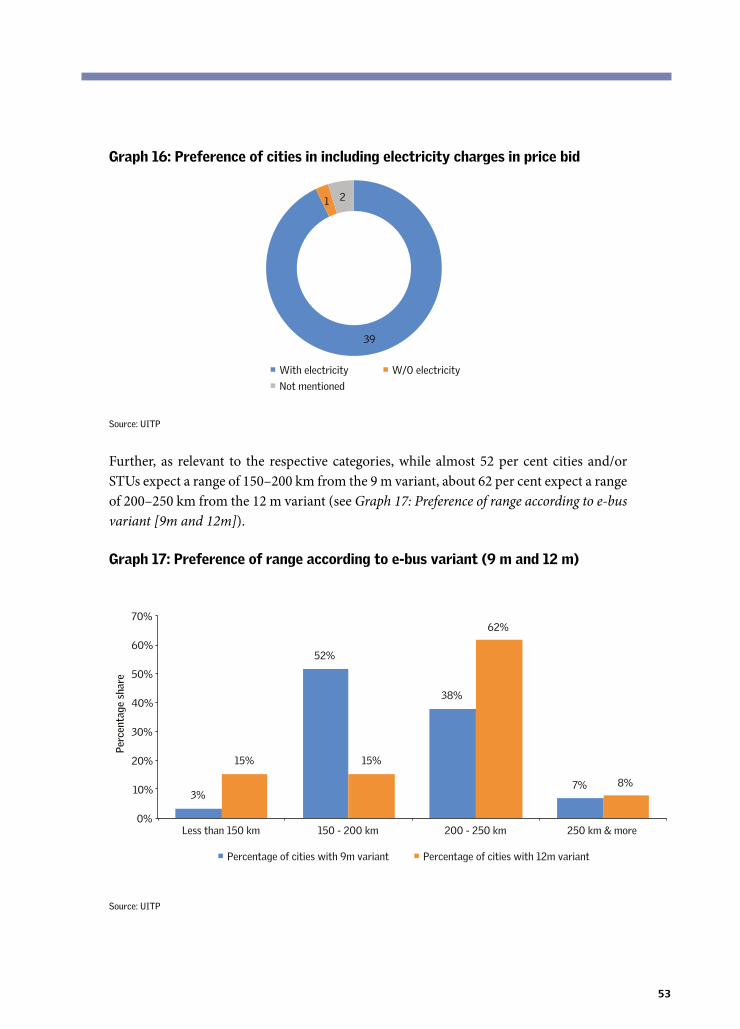
53
Graph 16: Preference of cities in including electricity charges in price bid
39
1 2
With electricity W/O electricity
Not mentioned
Source: UITP
Further, as relevant to the respective categories, while almost 52 per cent cities and/or STUs expect a range of 150–200 km from the 9 m variant, about 62 per cent expect a range of 200–250 km from the 12 m variant (see Graph 17: Preference of range according to e-bus variant [9m and 12m]).
Graph 17: Preference of range according to e-bus variant (9 m and 12 m)
3%
52%
38%
7%
15% 15%
62%
8%
0%
10%
20%
30%
40%
50%
60%
70%
Less than 150 km 150 - 200 km 200 - 250 km 250 km & more
Percentage of cities with 9m variant Percentage of cities with 12m variant
Per
cent
age
shar
e
Source: UITP
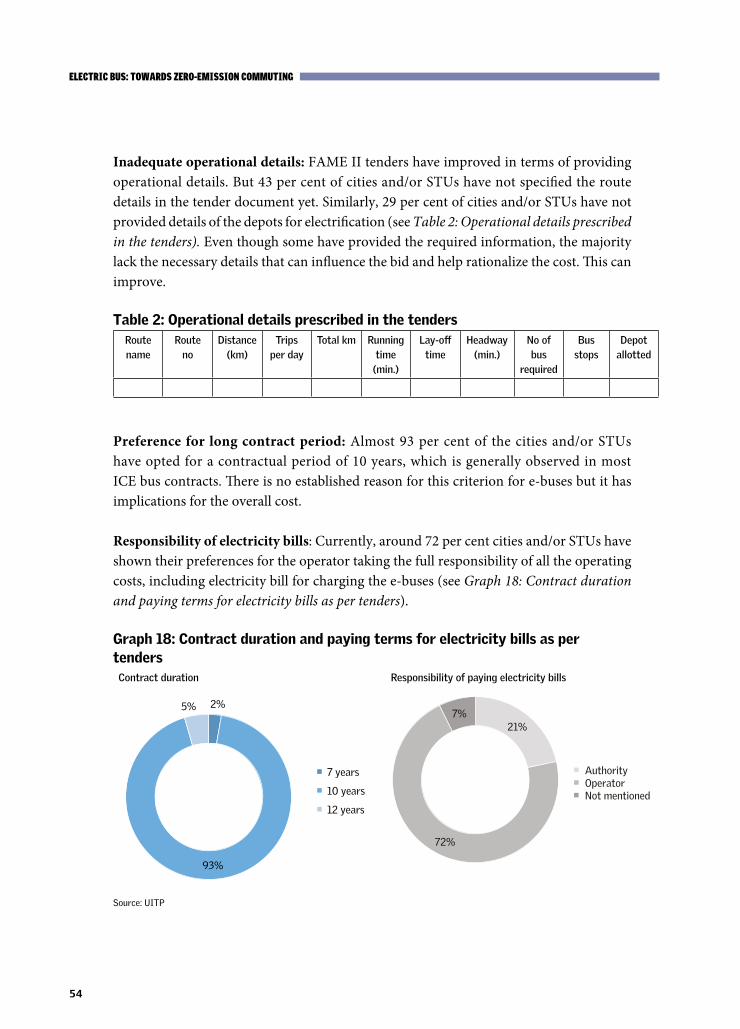
54
ELECTRIC BUS: TOWARDS ZERO-EMISSION COMMUTING
Inadequate operational details: FAME II tenders have improved in terms of providing operational details. But 43 per cent of cities and/or STUs have not specified the route details in the tender document yet. Similarly, 29 per cent of cities and/or STUs have not provided details of the depots for electrification (see Table 2: Operational details prescribed in the tenders). Even though some have provided the required information, the majority lack the necessary details that can influence the bid and help rationalize the cost. This can improve.
Table 2: Operational details prescribed in the tendersRoute name
Route no
Distance(km)
Trips per day
Total km Running time
(min.)
Lay-off time
Headway (min.)
No of bus
required
Bus stops
Depot allotted
Preference for long contract period: Almost 93 per cent of the cities and/or STUs have opted for a contractual period of 10 years, which is generally observed in most ICE bus contracts. There is no established reason for this criterion for e-buses but it has implications for the overall cost.
Responsibility of electricity bills: Currently, around 72 per cent cities and/or STUs have shown their preferences for the operator taking the full responsibility of all the operating costs, including electricity bill for charging the e-buses (see Graph 18: Contract duration and paying terms for electricity bills as per tenders).
Graph 18: Contract duration and paying terms for electricity bills as per tendersContract duration
2%
93%
5%
7 years
10 years
12 years
Responsibility of paying electricity bills
21%
72%
7%
AuthorityOperatorNot mentioned
Source: UITP
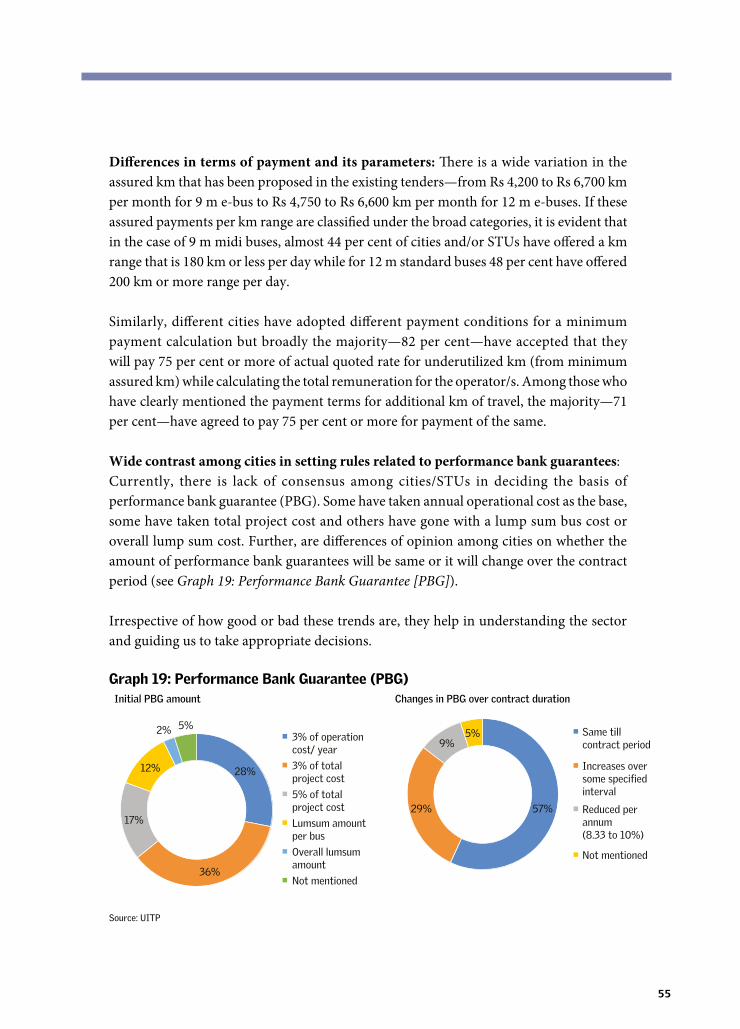
55
Differences in terms of payment and its parameters: There is a wide variation in the assured km that has been proposed in the existing tenders—from Rs 4,200 to Rs 6,700 km per month for 9 m e-bus to Rs 4,750 to Rs 6,600 km per month for 12 m e-buses. If these assured payments per km range are classified under the broad categories, it is evident that in the case of 9 m midi buses, almost 44 per cent of cities and/or STUs have offered a km range that is 180 km or less per day while for 12 m standard buses 48 per cent have offered 200 km or more range per day.
Similarly, different cities have adopted different payment conditions for a minimum payment calculation but broadly the majority—82 per cent—have accepted that they will pay 75 per cent or more of actual quoted rate for underutilized km (from minimum assured km) while calculating the total remuneration for the operator/s. Among those who have clearly mentioned the payment terms for additional km of travel, the majority—71 per cent—have agreed to pay 75 per cent or more for payment of the same.
Wide contrast among cities in setting rules related to performance bank guarantees: Currently, there is lack of consensus among cities/STUs in deciding the basis of performance bank guarantee (PBG). Some have taken annual operational cost as the base, some have taken total project cost and others have gone with a lump sum bus cost or overall lump sum cost. Further, are differences of opinion among cities on whether the amount of performance bank guarantees will be same or it will change over the contract period (see Graph 19: Performance Bank Guarantee [PBG]).
Irrespective of how good or bad these trends are, they help in understanding the sector and guiding us to take appropriate decisions.
Graph 19: Performance Bank Guarantee (PBG)Initial PBG amount
28%
36%
17%
12%
2% 5%3% of operation cost/ year
3% of total project cost
5% of total project cost
Lumsum amount per bus
Overall lumsum amount
Not mentioned
Changes in PBG over contract duration
57%29%
9%5% Same till
contract period
Increases over some specified interval
Reduced per annum (8.33 to 10%)
Not mentioned
Source: UITP
56
ELECTRIC BUS: TOWARDS ZERO-EMISSION COMMUTING
Deployment strategyIn contrast to ICE buses, electric buses require different deployment strategy and operational planning. While the manufacturers may design buses to improve range and power, real-world delivery is influenced by the driving pattern on roads and loading of passengers. Also, especially in the case of e-buses, use of air conditioners and heating systems that draw upon the same battery have an impact on the range. The driving duty cycle in the city that reflects slow and fast driving conditions and frequent start and stop pattern affects the range. An unladen bus without AC will have higher range but otherwise the range can reduce by up to 40 per cent.
This therefore demands very detailed and granular operational planning taking into account the duty cycle in the city, passenger loading pattern, use of AC and charging strategy to be able to reduce and control deviation. This is needed even if the manufacturers continue to improve the battery capacity and sizing and provide regenerative braking systems to recover some kinetic power during driving. Controlling operational parameters is critical to also control the ageing and degradation of batteries that is the prime mover. Lack of route planning can increase dead mileage that can further reduce the range. Thus, estimation of power consumption has to account for all these parameters. In fact, in the case of e-buses, the total cost of ownership has to account for the real-world driving conditions and its impact.
Increasingly, experts are underscoring the fact that fleet-wide planning supports are necessary for evaluating and selecting alternative vehicle technologies and infrastructure to be deployed in an urban bus fleet. Fleet-wide planning is necessary to determine the appropriate vehicle technology, infrastructure and operations that will deliver range and performance comparable to diesel-powered buses along any given route.
ICCT has carried out granular assessment of the bus routes operated by Bangalore Metropolitan Transport Corporation (BMTC) to compare the route-wise driving cycle by using GPS data (the pattern of slow and fast driving, stop and go frequency, idling etc.) to assess route-wise and technology-wise energy consumption that has bearing on the total cost of ownership of e-bus. It found energy consumption differences in the range of 6–15 per cent, with an average absolute error of approximately 5 per cent.45
Based on this assessment ICCT concludes that such data and planning can help to decide on optimal battery size, charging strategy, charge-point locations, route distance, route-specific energy usage, battery reserve capacity, expected battery degradation, scheduling, and other factors that shape vehicle performance. In fact, if air-conditioning load or charging speed when selecting battery size is not accounted for, it can lead to purchasing buses with insufficient range, which may require additional buses. A poor choice of vehicle
57
technology and charging strategy can adversely impact the operational performance of the fleet and lead to higher costs, decreased rider satisfaction and affect fleet capacity.46
ICCT cites example of early deployment of electric bus fleets in Shenzhen, Beijing, Wuhan, Qingdao, and Chongqing, where due to lack of planning 1.5–2 battery electric buses were needed to provide the same level of service as an existing diesel or CNG bus. Thus, fleet-wide planning becomes necessary to optimize level of service and alternative charging strategies to minimize costs.47
Thus, a route-level assessment of total cost-of-ownership (TCO) that includes route-level drive cycle development, vehicle simulation, and a TCO assessment can help with fleet planning and selection of appropriate vehicle technology and charging strategy to meet the performance of vehicles. Based on this, bus operators can plan routes and operation schedules, assess financing and procurement needs, and plan staff training. This can also help to inform the specifications for tenders to electrify a route and plan infrastructure.48
Thus, there is merit in developing GPS-based route-level driving cycle. For example, this study has shown that their variation in bus drive cycles on different routes. For example, BMTC airport drive cycles have higher average and maximum speeds. Other selected routes reflect congested urban driving patterns. This difference needs to be accounted for in fleet operation planning.
Several cities, including Navi Mumbai, Pune, Hyderabad, Bengaluru, Kolkata and Delhi among others, have embarked on an electric bus programme. They are now looking deeper for granular planning.
Evidence is slowly emerging from different cities. The experience of Kolkata presents a learning curve in this regard. West Bengal Transport Corporation (WBTC) has opted for electrification of public transportation and procured 80 electric buses from Tata Motors (40 of 12-metre buses and 40 of 9-metre buses) under FAME I. It has also identified nine bus depots and nine bus terminals for operation of e-buses.49 The World Bank is supporting this programme and its ESMAP programme has conducted preliminary analyses, including modelling of the charging process based on the operation data, quantification of electrical demands, assessment of impact on the electrical network and optimization of size of the charging infrastructure.50
It is evident that the price of an electric bus is about three and a half times that of a diesel bus, which means a payback period of eight years compared to four years for a diesel bus. Based on the operational parameters in Kolkata, buses with smaller battery capacity—125 kWh for 9m buses and 188 kWh for 12m buses (NMC battery)—were procured, which
58
ELECTRIC BUS: TOWARDS ZERO-EMISSION COMMUTING
reduced the capital expenditures significantly and allowed scaling up. The TCO is about Rs 45–50/km while the TCO for diesel buses is Rs 37/km. According to the ESMAP study, on the operational side e-buses are 50 per cent cheaper than diesel as per the operational data from Kolkata (Rs 15/km for electric buses, Rs 30/km for diesel buses).51
Such programme modelling can help optimize the battery size based on requirement, utilize existing transformers to cater to charging station requirement, optimize electrical connectivity requirement to reduce connectivity cost, and consider demand charges. This can further help identify type, number, capability and location of the chargers and the charging schedule to optimize the operation of the fleet. This improves staff awareness and skilling for deployment, management and monitoring of the fleet for verified fuel savings.52
The pilot demonstration shows that replacing five per cent of the conventional bus fleet with electric buses can lead to reduction in CO2 emissions of 3,094 tonnes per year (daily round trips of 100 km per bus and an emission factor of 1.19 kg CO2 emissions/km per bus is considered). By 2030, the government plans to increase the city fleet to 5,000 e-buses, which can provide cumulative CO2 emissions reduction of 782,560 tonnes.53
These emerging evidence from cities show the depth of fleet planning needed to inform the process of successful implementation.
Challenges faced by OEMs Currently, the sector is evolving and everything is in the experimental phase. Thus, all stakeholders involved with service delivery including OEMs and operators or service providers are struggling with new challenges.
The target to introduce 7,000 buses under FAME II in three years translates into an average of around 2,500 buses per year—just 3 per cent of overall annual demand for buses in India. The current programme is low volume and spreads the e-bus fleet thin across cities—a minimum of 25 e-buses per targeted city. With such a low volume it is difficult for OEMs to achieve economies of scale or even set up after sale-service arrangements. The scale has to grow to make the OEMs innovate and augment. Also, almost all e-bus manufacturers are highly dependent on import for major e-bus components, including battery, battery monitoring technology, charging technology etc. Thus, the pandemic-induced supply chain disruption has affected the production.
The added challenge is the new role of OEMs in operating e-buses as well under the GCC model. Most OEMs are tying up with traditional private bus operators in India for
59
delivery of services. But this new form of engagement is posing challenges for the OEMs. During FAME I, traditional OEMs preferred outright purchase. But new OEMs are more amenable to the GCC model to capture the market.
Challenges faced by authorities, STUs and operatorsHuge capital investment: The upfront capital investment required for e-buses is more than double of what is needed for ICE buses. Paying for battery as well as setting up of charging infrastructure adds to the cost. Generally, capex needed for ICE is 20 per cent of its overall cost. But for e-buses it is almost 45–50 per cent. Additionally, even though the FAME subsidy is available it has not reduced the cost burden of operators as they have to submit an almost equal amount of bank guarantee for entire project period. The total cost of operation (TCO) for operating one e-bus (after subsidy) is almost equal to TCO for its ICE counterpart. This will have to further inform the financing and incentive strategy.
Range anxiety: Concern around driving range per charge poses major challenge in the entire e-bus deployment. Generally, an urban ICE-engine bus operates for 180–200 km (average) per day. But, the majority of the OEMs have e-bus models that run hardly that much distance in real-world field operations. Buses with different range require different deployment strategy to achieve desired operational output. Due to lack of prior planning along with poor deployment of low range buses, costs increase. Many STUs have to operate two buses in two shifts when the same can be achieved with one bus. As the technology is not proven yet, agencies also face challenges related to actual versus expected bus range. This further impacts the overall operation planning. It has also been observed that congested routes provide lesser km travel as energy is wasted in congestion. Thus, selection of route is also become important for e-buses.
Selecting suitable charging technology and limited options: Currently, the majority of OEMs provide limited technological options in terms of vehicle technologies, including battery, charging options etc. This hampers competitive advantage. More bottom-up information from route-based planning in cities also has to inform the process of product diversification.
Installation of the right kind of charging infrastructure plays a vital role in increasing operational efficiency of e-bus services. Every charging technology has its own pros and cons. For example, depot-charging facilities provide a safe and secure environment for charging e-buses, but in the case of any top-up charging requirement, buses have to travel long distances, which increase the non-revenue kilometres and impacts the scheduling of the services. Similarly, installation of additional charging facilities at bus terminals to provide opportunity charging services add to costs of setting up charging infrastructure. Even though battery swapping seems much easier it also requires safe place with robotic
60
ELECTRIC BUS: TOWARDS ZERO-EMISSION COMMUTING
arms to carry out the swapping activities. Two-thirds of cities are opting for the most popular overnight depot-charging options, along with opportunity charging in a few cases. The rest have kept these options open to selected OEMs to decide.
Fleet planning and preparing e-bus schedules: There is very little route-wise information at the ground level on the duty cycle, passenger loading pattern etc. to guide the selection of e-bus routes. Moreover, planning of the electric bus schedule—the routine of the bus service for the day—is also not easy. Bus schedules have to be aligned with charging schedule while combining with crew schedules. Additionally, demand for bus energy is hugely dependent on characteristics of specific routes, including passenger loading, congestion, gradient, temperature etc. Thus, it requires a through detailed planning exercise, unlike ICE, for optimum usage.
Performance monitoring of buses: E-buses will require stringent an Intelligent Transport System (ITS)-based monitoring system. Day-to-day monitoring of buses, especially battery performance, is crucial for e-bus operation. Although there is the technology to monitor and report, operators face challenges in finding the right technical person to analyse and understand those to apply corrective measures on time.
Capacity enhancement of existing staffs: As these technologies are new, special training needs to be imparted to the existing workforce, including drivers and other mechanical staff. Understanding and providing for this need has become a big challenge for many STUs.
61
SECTION 4The way forwardIf India is serious about meeting its intended target of 30 per cent electrification of vehicle fleet by 2030, there will be rapid uptake of electric buses in both the medium and heavy categories in the coming decades. While the Central government’s incentive programme FAME will be the initial catalyst, a bigger boost is expected from the state government policies that are being designed to expand and renew the bus fleet based on electric buses, and reforming operational parameters for efficient deployment and building charging infrastructure. Further reduction in costs of batteries and improved cost parity can help to build scale.
Electrification of the bus fleet has to be the priority focus of the electrification strategy to maximize decarbonization of urban commuting. But the critical challenge is that this objective will have to be met affordably when the entire bus sector requires reform and scaling up. It is said that overall, India requires massive investments to augment its bus fleet to at least 1.5 lakh to meet the burgeoning travel demand. This requires strategic intervention to ensure that while moving towards electrification the incentives and other supports must enable massive upscaling of bus fleets. With well-designed strategies at both the Central and state levels as well as industry participation and ecosystem development it is possible to bring price parity between e-buses and mainstream diesel and CNG buses.
Strengthen the FAME II incentive framework Build scale: FAME II incentive framework is an improvement over FAME I to provide more targeted support for e-buses. But target volumes are still very small. As the bus sector is already going through a difficult phase, a much more concentrated effort is required for e-bus transition. The Central government has already announced assistance for procuring 20,000 buses in its Union Budget. This is an opportunity to design this scheme in such a way that at least half of these new buses are procured as e-buses. This can create a more competitive environment among OEMs to innovate and achieve economies of scale.
The new FAME amendment that has vested the responsibility on EESL to create aggregated demand and support nine cities—including Mumbai, Delhi, Bengaluru, Hyderabad, Ahmedabad, Chennai, Kolkata, Surat and Pune—on the GCC model is expected to lead to concentrated development of infrastructure that can help to build scale and reduce costs and also support the state governments. This needs to be implemented with comprehensive fleet planning to maximize benefits and demonstrate the pathways and generate a learning curve for others.
62
ELECTRIC BUS: TOWARDS ZERO-EMISSION COMMUTING
Reform the incentive structure for e-buses: Preference for the GCC model comes from the fact that it helps reduce upfront costs while improving the efficiency of services. However, as many big STUs in India have the organizational strength to manage their services, an open FAME incentive structure may provide more flexibility to the STUs to choose the appropriate operational model for themselves.
Currently, FAME II is providing capital incentive up to 40 per cent of total bus cost. The cost of the bus is calculated on the basis of the prescribed formula and the maximum demand incentive is capped as per bus size (i.e., a maximum of Rs 55 lakh for >10m buses). Instead of providing the whole subsidy amount within a few months of bus operations (i.e. six to seven months), if the government provides similar support for a longer duration of at least seven years, considering battery replacement requirement, it will be equal to a subsidy of Rs 12 per km (considering an average of daily operation of 180 km per bus). This can make the cost of operations almost equal to low floor diesel (at par with Tata or Volvo) services. It will also ensure operation of e-buses for longer. Additionally, when capex subsidy is provided, operators do not have control over price and OEMs tend to quote high prices. Without capex subsidy private operators will be in a position to negotiate the price through bulk purchase.
Create opportunity for diverse technology with different charging options: Design the incentives to create more options for the combination of technology and charging options. In addition to the battery-operated electric buses with only conduction charging facilities that dominates the market today, promote charging options for pentagraph charging or battery swapping or any other approach. Incentive should be more flexibly provided based on technical and financial viability of the projects. Transit agencies should have the right to strategize e-bus deployment according to their local planning and strength. It is possible to adopt the battery lease model (in which responsibility of battery and setting up charging infrastructure is given to a private partner). This can reduce the high upfront cost and allow STUs or other public transport agency to hold significant control over the system.
Interventions needed at the state and/or city level
State-level electric vehicle policy to have more specific provisions on targets and support for e-buses: States have to prepare and align their EV policy to create a more targeted opportunity for e-bus deployment. States/cities have to identify the bus services as essential services—not for profit—and prepare a long-term e-bus transformation plan including provisions for providing viability gap funding for bus operations. E-buses require detailed planning before deployment and city/level comprehensive fleet planning for routes and charging should be done in advance for e-bus deployment. City-level e-bus
63
deployment plans are needed to provide for e-bus oriented transit infrastructures like depot, terminal, bus stops etc. State should also proactively assist the power sector in improving their grid capacity by providing some benefits to them as well.
State policies have to provide for category-wise targets of EV penetration, especially focusing on e-buses. This will provide long-term policy visibility to the industry and also help monitor progress towards policy objectives.
Leverage PLI for bus sector: Recently, the Central government has announced a PLI scheme of Rs 18,000 crore for setting up big units to manufacture advanced batteries for electrical storage. This will surely boost e-bus development in the near future, as locally made batteries will reduce the cost of buses substantially. A similar PLI scheme for electric vehicle-component manufacturer will expedite the overall electric vehicle transition, especially for e-buses in India.
Need strategy for private bus operations: Currently, only public sector STUs qualify for FAME incentives. But given the fact that private operations dominate public transport services in most cities with some variation across regions, there is need for a strategy to catalyse this sector to electrify as well. The state government policies can play an important role in providing common public charging and maintenance facilities for commercial use by private players. If these facilities are available, private operators can also invest in electric buses and benefit from lowering of bus costs. This will also help to build scale and achieve economy of scale. This approach of common facilities for commercial use is needed as the private operators cannot invest in depot and charging infrastructure.
Build basics: As the sector is entirely new, cities need to create all the required documents, guidelines and/or regulations from e-bus perspective. Conduct extensive training programme for different categories of staffs involved in e-bus operations to build their capacity.
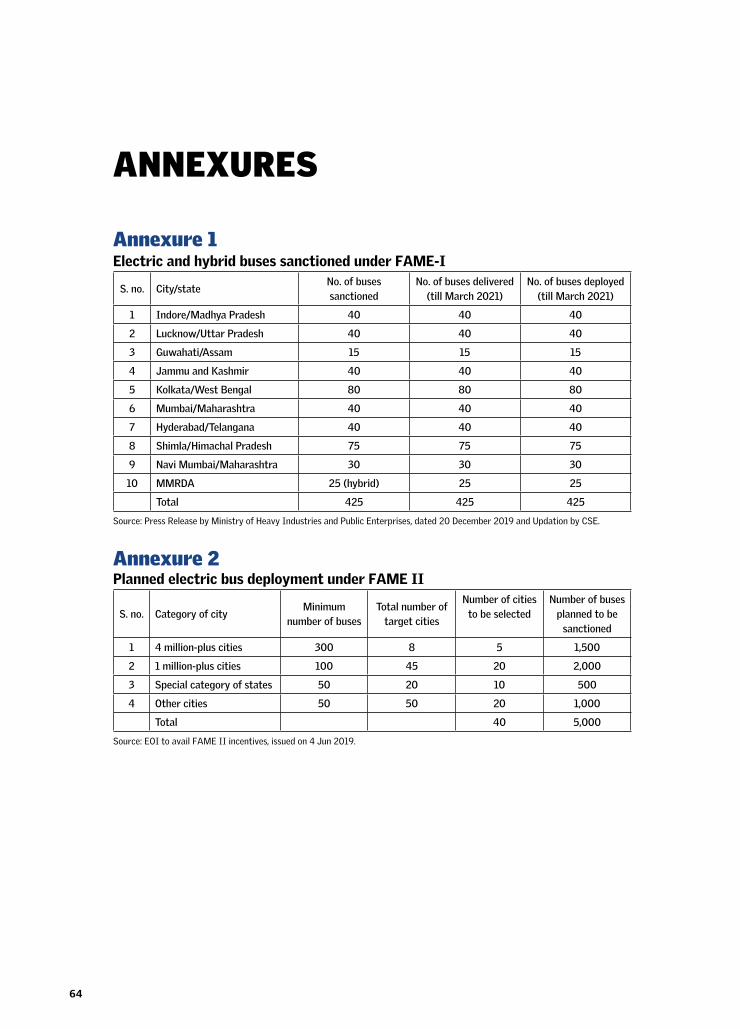
64
ANNEXURES
Annexure 1 Electric and hybrid buses sanctioned under FAME-I
S. no. City/stateNo. of buses sanctioned
No. of buses delivered (till March 2021)
No. of buses deployed (till March 2021)
1 Indore/Madhya Pradesh 40 40 40
2 Lucknow/Uttar Pradesh 40 40 40
3 Guwahati/Assam 15 15 15
4 Jammu and Kashmir 40 40 40
5 Kolkata/West Bengal 80 80 80
6 Mumbai/Maharashtra 40 40 40
7 Hyderabad/Telangana 40 40 40
8 Shimla/Himachal Pradesh 75 75 75
9 Navi Mumbai/Maharashtra 30 30 30
10 MMRDA 25 (hybrid) 25 25
Total 425 425 425
Source: Press Release by Ministry of Heavy Industries and Public Enterprises, dated 20 December 2019 and Updation by CSE.
Annexure 2Planned electric bus deployment under FAME II
S. no. Category of cityMinimum
number of busesTotal number of
target cities
Number of cities to be selected
Number of buses planned to be
sanctioned
1 4 million-plus cities 300 8 5 1,500
2 1 million-plus cities 100 45 20 2,000
3 Special category of states 50 20 10 500
4 Other cities 50 50 20 1,000
Total 40 5,000
Source: EOI to avail FAME II incentives, issued on 4 Jun 2019.
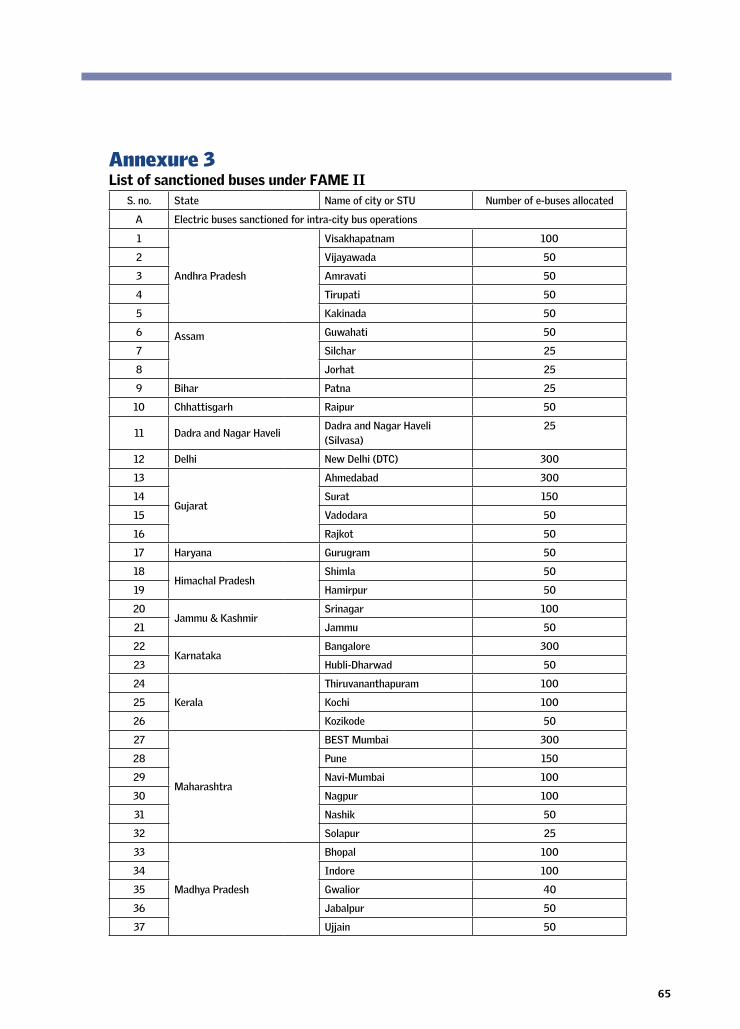
65
Annexure 3List of sanctioned buses under FAME II
S. no. State Name of city or STU Number of e-buses allocated
A Electric buses sanctioned for intra-city bus operations
1
Andhra Pradesh
Visakhapatnam 100
2 Vijayawada 50
3 Amravati 50
4 Tirupati 50
5 Kakinada 50
6 Assam Guwahati 50
7 Silchar 25
8 Jorhat 25
9 Bihar Patna 25
10 Chhattisgarh Raipur 50
11 Dadra and Nagar HaveliDadra and Nagar Haveli (Silvasa)
25
12 Delhi New Delhi (DTC) 300
13
Gujarat
Ahmedabad 300
14 Surat 150
15 Vadodara 50
16 Rajkot 50
17 Haryana Gurugram 50
18Himachal Pradesh
Shimla 50
19 Hamirpur 50
20Jammu & Kashmir
Srinagar 100
21 Jammu 50
22Karnataka
Bangalore 300
23 Hubli-Dharwad 50
24
Kerala
Thiruvananthapuram 100
25 Kochi 100
26 Kozikode 50
27
Maharashtra
BEST Mumbai 300
28 Pune 150
29 Navi-Mumbai 100
30 Nagpur 100
31 Nashik 50
32 Solapur 25
33
Madhya Pradesh
Bhopal 100
34 Indore 100
35 Gwalior 40
36 Jabalpur 50
37 Ujjain 50
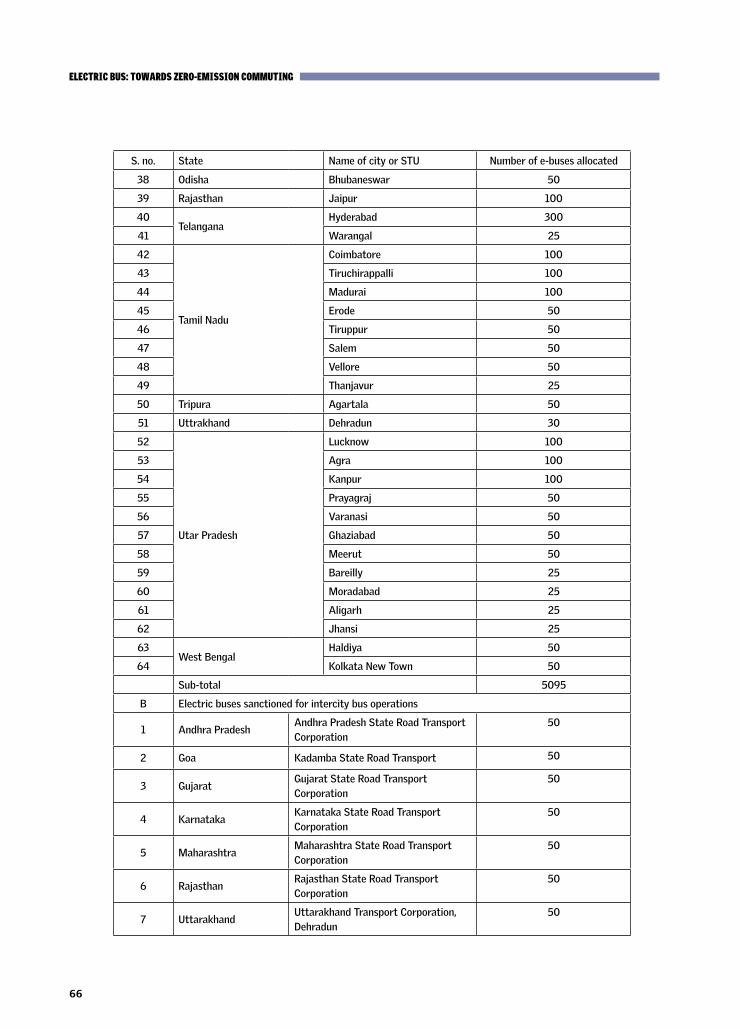
66
ELECTRIC BUS: TOWARDS ZERO-EMISSION COMMUTING
S. no. State Name of city or STU Number of e-buses allocated
38 Odisha Bhubaneswar 50
39 Rajasthan Jaipur 100
40Telangana
Hyderabad 300
41 Warangal 25
42
Tamil Nadu
Coimbatore 100
43 Tiruchirappalli 100
44 Madurai 100
45 Erode 50
46 Tiruppur 50
47 Salem 50
48 Vellore 50
49 Thanjavur 25
50 Tripura Agartala 50
51 Uttrakhand Dehradun 30
52
Utar Pradesh
Lucknow 100
53 Agra 100
54 Kanpur 100
55 Prayagraj 50
56 Varanasi 50
57 Ghaziabad 50
58 Meerut 50
59 Bareilly 25
60 Moradabad 25
61 Aligarh 25
62 Jhansi 25
63West Bengal
Haldiya 50
64 Kolkata New Town 50
Sub-total 5095
B Electric buses sanctioned for intercity bus operations
1 Andhra PradeshAndhra Pradesh State Road Transport Corporation
50
2 Goa Kadamba State Road Transport 50
3 GujaratGujarat State Road Transport Corporation
50
4 KarnatakaKarnataka State Road Transport Corporation
50
5 MaharashtraMaharashtra State Road Transport Corporation
50
6 RajasthanRajasthan State Road Transport Corporation
50
7 UttarakhandUttarakhand Transport Corporation, Dehradun
50
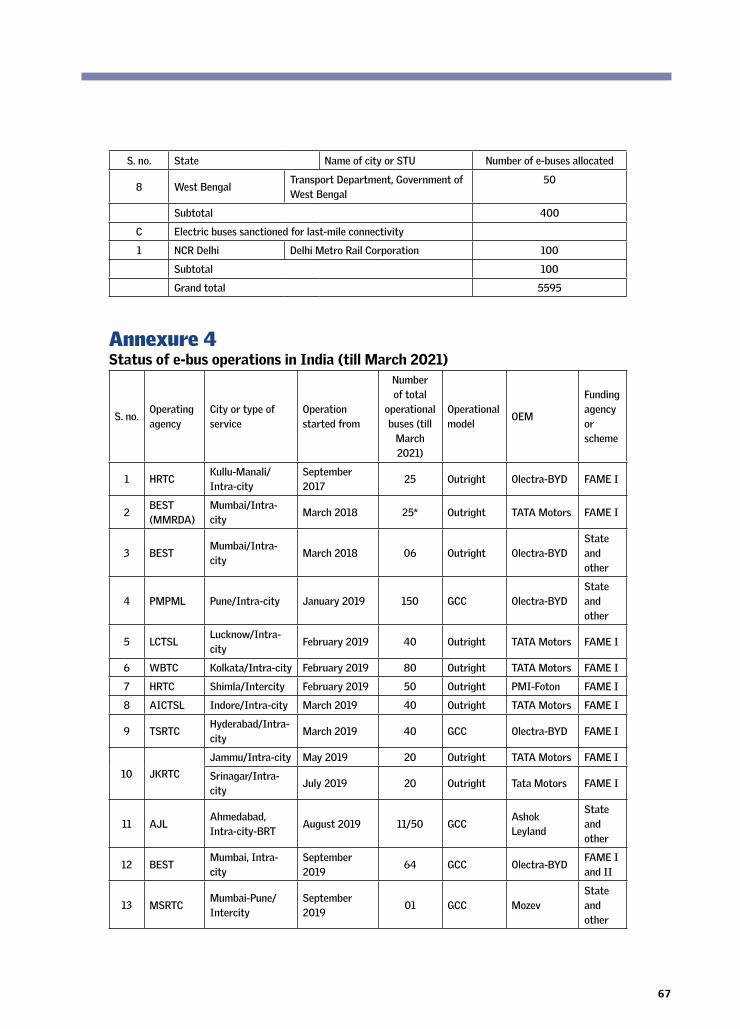
67
S. no. State Name of city or STU Number of e-buses allocated
8 West BengalTransport Department, Government of West Bengal
50
Subtotal 400
C Electric buses sanctioned for last-mile connectivity
1 NCR Delhi Delhi Metro Rail Corporation 100
Subtotal 100
Grand total 5595
Annexure 4Status of e-bus operations in India (till March 2021)
S. no.Operating agency
City or type of service
Operation started from
Number of total
operational buses (till
March 2021)
Operational model
OEM
Funding agency or scheme
1 HRTCKullu-Manali/ Intra-city
September 2017
25 Outright Olectra-BYD FAME I
2BEST (MMRDA)
Mumbai/Intra-city
March 2018 25* Outright TATA Motors FAME I
3 BESTMumbai/Intra-city
March 2018 06 Outright Olectra-BYDState and other
4 PMPML Pune/Intra-city January 2019 150 GCC Olectra-BYDState and other
5 LCTSLLucknow/Intra-city
February 2019 40 Outright TATA Motors FAME I
6 WBTC Kolkata/Intra-city February 2019 80 Outright TATA Motors FAME I
7 HRTC Shimla/Intercity February 2019 50 Outright PMI-Foton FAME I
8 AICTSL Indore/Intra-city March 2019 40 Outright TATA Motors FAME I
9 TSRTCHyderabad/Intra-city
March 2019 40 GCC Olectra-BYD FAME I
10 JKRTC
Jammu/Intra-city May 2019 20 Outright TATA Motors FAME I
Srinagar/Intra-city
July 2019 20 Outright Tata Motors FAME I
11 AJLAhmedabad, Intra-city-BRT
August 2019 11/50 GCCAshok Leyland
State and other
12 BESTMumbai, Intra-city
September 2019
64 GCC Olectra-BYDFAME I and II
13 MSRTCMumbai-Pune/ Intercity
September 2019
01 GCC MozevState and other
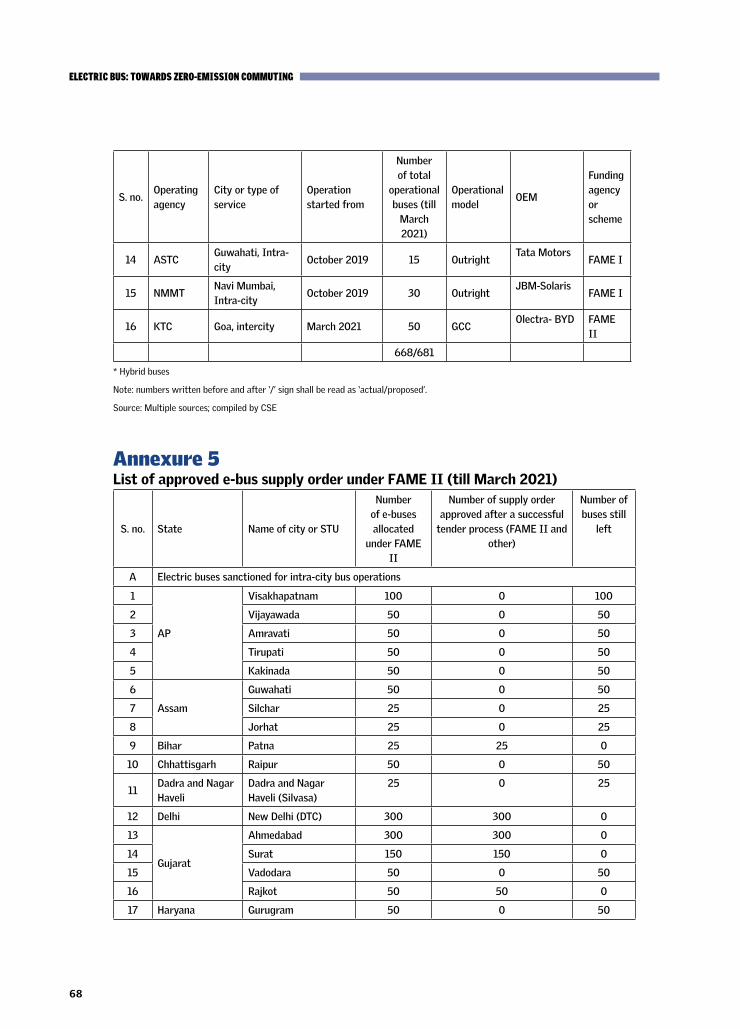
68
ELECTRIC BUS: TOWARDS ZERO-EMISSION COMMUTING
S. no.Operating agency
City or type of service
Operation started from
Number of total
operational buses (till
March 2021)
Operational model
OEM
Funding agency or scheme
14 ASTCGuwahati, Intra-city
October 2019 15 OutrightTata Motors
FAME I
15 NMMTNavi Mumbai, Intra-city
October 2019 30 OutrightJBM-Solaris
FAME I
16 KTC Goa, intercity March 2021 50 GCCOlectra- BYD FAME
II
668/681
* Hybrid buses
Note: numbers written before and after ‘/’ sign shall be read as ‘actual/proposed’.
Source: Multiple sources; compiled by CSE
Annexure 5List of approved e-bus supply order under FAME II (till March 2021)
S. no. State Name of city or STU
Number of e-buses allocated
under FAME II
Number of supply order approved after a successful
tender process (FAME II and other)
Number of buses still
left
A Electric buses sanctioned for intra-city bus operations
1
AP
Visakhapatnam 100 0 100
2 Vijayawada 50 0 50
3 Amravati 50 0 50
4 Tirupati 50 0 50
5 Kakinada 50 0 50
6
Assam
Guwahati 50 0 50
7 Silchar 25 0 25
8 Jorhat 25 0 25
9 Bihar Patna 25 25 0
10 Chhattisgarh Raipur 50 0 50
11Dadra and Nagar Haveli
Dadra and Nagar Haveli (Silvasa)
25 0 25
12 Delhi New Delhi (DTC) 300 300 0
13
Gujarat
Ahmedabad 300 300 0
14 Surat 150 150 0
15 Vadodara 50 0 50
16 Rajkot 50 50 0
17 Haryana Gurugram 50 0 50
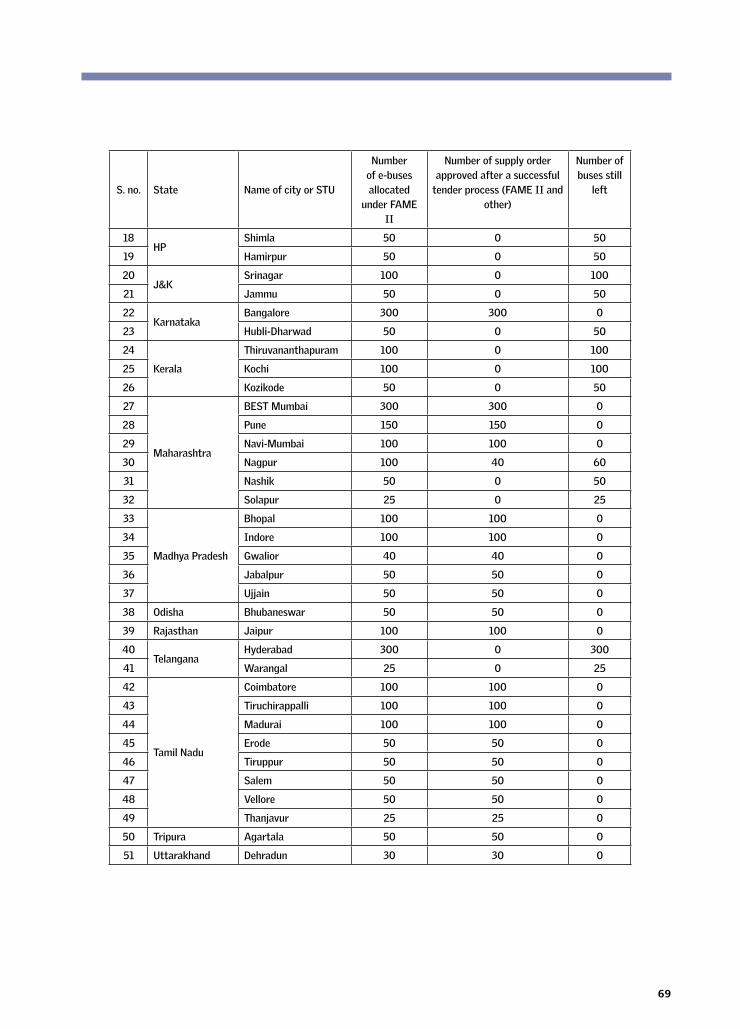
69
S. no. State Name of city or STU
Number of e-buses allocated
under FAME II
Number of supply order approved after a successful
tender process (FAME II and other)
Number of buses still
left
18HP
Shimla 50 0 50
19 Hamirpur 50 0 50
20J&K
Srinagar 100 0 100
21 Jammu 50 0 50
22Karnataka
Bangalore 300 300 0
23 Hubli-Dharwad 50 0 50
24
Kerala
Thiruvananthapuram 100 0 100
25 Kochi 100 0 100
26 Kozikode 50 0 50
27
Maharashtra
BEST Mumbai 300 300 0
28 Pune 150 150 0
29 Navi-Mumbai 100 100 0
30 Nagpur 100 40 60
31 Nashik 50 0 50
32 Solapur 25 0 25
33
Madhya Pradesh
Bhopal 100 100 0
34 Indore 100 100 0
35 Gwalior 40 40 0
36 Jabalpur 50 50 0
37 Ujjain 50 50 0
38 Odisha Bhubaneswar 50 50 0
39 Rajasthan Jaipur 100 100 0
40Telangana
Hyderabad 300 0 300
41 Warangal 25 0 25
42
Tamil Nadu
Coimbatore 100 100 0
43 Tiruchirappalli 100 100 0
44 Madurai 100 100 0
45 Erode 50 50 0
46 Tiruppur 50 50 0
47 Salem 50 50 0
48 Vellore 50 50 0
49 Thanjavur 25 25 0
50 Tripura Agartala 50 50 0
51 Uttarakhand Dehradun 30 30 0
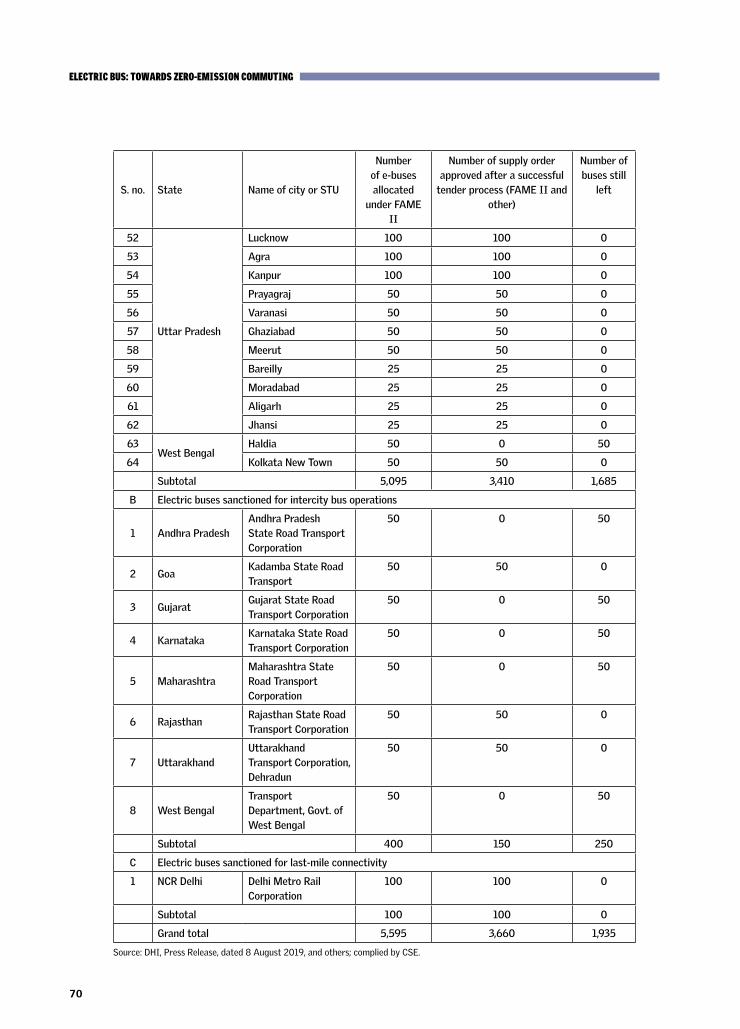
70
ELECTRIC BUS: TOWARDS ZERO-EMISSION COMMUTING
S. no. State Name of city or STU
Number of e-buses allocated
under FAME II
Number of supply order approved after a successful
tender process (FAME II and other)
Number of buses still
left
52
Uttar Pradesh
Lucknow 100 100 0
53 Agra 100 100 0
54 Kanpur 100 100 0
55 Prayagraj 50 50 0
56 Varanasi 50 50 0
57 Ghaziabad 50 50 0
58 Meerut 50 50 0
59 Bareilly 25 25 0
60 Moradabad 25 25 0
61 Aligarh 25 25 0
62 Jhansi 25 25 0
63West Bengal
Haldia 50 0 50
64 Kolkata New Town 50 50 0
Subtotal 5,095 3,410 1,685
B Electric buses sanctioned for intercity bus operations
1 Andhra PradeshAndhra Pradesh State Road Transport Corporation
50 0 50
2 GoaKadamba State Road Transport
50 50 0
3 GujaratGujarat State Road Transport Corporation
50 0 50
4 KarnatakaKarnataka State Road Transport Corporation
50 0 50
5 MaharashtraMaharashtra State Road Transport Corporation
50 0 50
6 RajasthanRajasthan State Road Transport Corporation
50 50 0
7 UttarakhandUttarakhand Transport Corporation, Dehradun
50 50 0
8 West BengalTransport Department, Govt. of West Bengal
50 0 50
Subtotal 400 150 250
C Electric buses sanctioned for last-mile connectivity
1 NCR Delhi Delhi Metro Rail Corporation
100 100 0
Subtotal 100 100 0
Grand total 5,595 3,660 1,935
Source: DHI, Press Release, dated 8 August 2019, and others; complied by CSE.
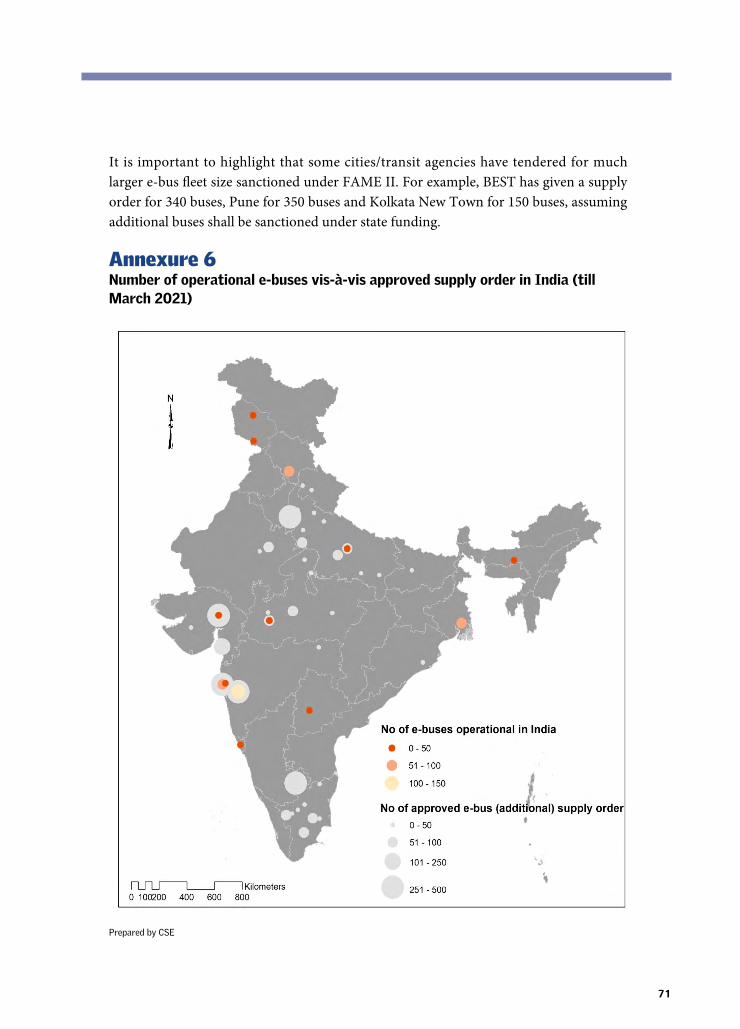
71
It is important to highlight that some cities/transit agencies have tendered for much larger e-bus fleet size sanctioned under FAME II. For example, BEST has given a supply order for 340 buses, Pune for 350 buses and Kolkata New Town for 150 buses, assuming additional buses shall be sanctioned under state funding.
Annexure 6Number of operational e-buses vis-à-vis approved supply order in India (till March 2021)
Prepared by CSE
72
References1. Pawan Mulukutla and Priyanka Vasudevan 2014. ‘Increasing mode share of bus
transport in Indian cities’, The City Fix. Available at https://thecityfix.com/blog/increasing-mode-share-bus-transport-indian-cities-bus-karo-case-studies-pawan-mulukutla-priyanka-vasudevan/, accessed on 30 Jul 2020.
2. Anon. 2016, ‘Key indicators of household expenditure on services and durable goods’, NSS 72nd round, National Sample Survey Organization, Ministry of Statistics and Programme Implementation, GOI, New Delhi. Available at http://mospi.nic.in/sites/default/files/publication_reports/ki_durable_29june16.pdf, accessed on 30 July 2020.
3. https://www.statista.com/statistics/1094600/india-bus-market-share-by-manufacturer/
4. Aparna Vijaykumar and Dr. Parveen Kumar et. al. 2021, Procurement of Electric Buses: Insights from Total Cost of Ownership (TCO) Analysis, WRI India – Ross Center. Available at https://wri-india.org/sites/default/files/WRI_EBus_Procurement_Commentary_FINAL.pdf, accessed in Jun 2021.
5. Anal Sheth and Debasis Sarkar 2019, Life Cycle cost analysis for electric vs diesel bus transit in an Indian scenario, International Journal of Technology.
6. Strategies for deploying zero-emission bus fleets: Development of real-world drive cycles to simulate zero-emission technologies along existing bus routes, Authors: Lingzhi Jin, Oscar Delgado, Ravi Gadepalli and Ray Minjares, International Council on Clean Transportation Working Paper 2020–10.
7. Anon. 2019. ‘Health impact of air pollution from transportation sources in Delhi’, Fact Sheet: India, International Council on Clean Transportation. Available at https://theicct.org/sites/default/files/ICCT_factsheet_health_impact_airpollution_Delhi_20190705.pdf, accessed on 30 July 2020.
8. Rachel Mohan et al. 2019. Methodology note national and state level, Greenhouse Gas Estimates 2005 to 2015. Available at http://www.ghgplatform-india.org/data-and-emissions/energy/GHGPI-PhaseIII-Methodology%20Note-Energy-Sep%202019.pdf, accessed in July 2020.
73
9. Anon. 2012. ICAR: Diesel engine exhaust carcinogenic, World Health Organization. Available at https://www.iarc.fr/wp-content/uploads/2018/07/pr213_E.pdf, accessed on 30 July 2020.
10. Rueben Seriven 2018. Confusion and Uncertainty Prevent Indian Electric Bus Market from Reaching Full Potential, Despite Rapid Growth, Interact Analysis. Available at https://www.interactanalysis.com/confusion-and-uncertainty-prevent-indian-electric-bus-market-from-reaching-full-potential-despite-rapid-growth/, accessed on 30 July 2020.
11. Anon. 2019. State Transport Undertaking profile and performance 2016–17, Central Institute of Road Transport. Pune.
12. Agarwal et al. 2019. Building an electric bus ecosystem in Indian cities, Department of Heavy Industry, Ministry of Heavy Industry and Public Enterprises, Government of India. Available at https://rmi.org/wp-content/uploads/2020/02/ebus_report.pdf, accessed on 30 July 2020.
13. Anon. 2019. Promotion of electric vehicles, Press Release, Ministry of Heavy Industries and Public Enterprises. PIB Delhi. Available at https://pib.gov.in/PressReleseDetail.aspx?PRID=1576608, accessed on 30 July 2020.
14. Anon. 2019. 5595 e-Buses to 64 Cities in 26 States under FAME II, Press Release, Ministry of Heavy Industries & Public Enterprises. PIB Delhi. Available at https://pib.gov.in/PressReleseDetailm.aspx?PRID=1597099, accessed on 30 July 2020.
15. Ibid.
16. Anon. 2017. Expression of Interest for inviting proposal for availing incentives under FAME India scheme of Government of India form State Government Departments/ Undertakings/ Municipal Corporations for million plus, Department of Heavy Industry. Ministry of Heavy Industries & Public Enterprises. New Delhi.
17. Anon. 2019. Publication of notification in Gazette of India (Extraordinary) regarding phase-II of FAME India scheme, Department of Heavy Industry. Ministry of Heavy Industries & Public Enterprises. New Delhi.
18. Ibid.
19. Ibid.
74
ELECTRIC BUS: TOWARDS ZERO-EMISSION COMMUTING
20. Anon 2019. Expression of Interest for inviting proposal for availing incentives under FAME India scheme phase II for deployment of electric buses on operational cost model. Department of Heavy Industry. Ministry of Heavy Industries & Public Enterprises. New Delhi. Available at https://dhi.nic.in/writereaddata/UploadFile/Final%20EOI%2004%20June%202019%20Published.pdf, accessed on 28 July 2020.
21. Ibid.
22. Anon. 2019. Sanction for 5595 electric buses under Fame phase II, Press Release, Ministry of Heavy Industries & Public Enterprises. PIB Delhi. Available at https://pib.gov.in/Pressreleaseshare.aspx?PRID=1581525, accessed on 28 July 2020.
23. Ibid.
24. Akhil Koshy 2020. Electric Buses Modus Operandi in India, JMK Research and Analytics. Available at https://jmkresearch.com/electric-buses-modus-operandi-in-india/, accessed on 1 August 2020.
25. Anon. 2020. UITP India analysis of FAME II tenders across the country, UITP. Available at https://india.uitp.org/uitp-india-analysis-FAME II-tenders-across-country, accessed on Jul 2020.
26. Anon. 2019. Andhra Pradesh Government rolls back tender for 350 electric buses, Financial Express. Available at https://www.financialexpress.com/auto/car-news/andhra-pradesh-government-rolls-back-tender-for-350-electric-buses/1769825/, accessed on 1 August 2020.
27. Christin Mathew Philip 2020. BMTC rejects higher bid for e-buses; new tender floated, Times of India. Available at https://timesofindia.indiatimes.com/city/bengaluru/bmtc-rejects-higher-bid-for-e-buses-new-tender-floated/articleshow/73568096.cms, accessed on 30 August 2020.
28. Now, KSRTC decides to cancel electric bus tenders, The Hindu. Available at https://www.thehindu.com/news/cities/bangalore/now-ksrtc-decides-to-cancel-electric-bus-tenders/article31032668.ece#:~:text=Following%20in%20the%20footsteps%20of,bidder%20quoted%20exorbitant%20operational%20costs., accessed on 5 Aug 2020.
75
29. Zachary Shahan 2021, Olectra Greentech limited wins order for 350 electric buses in india, Clean Technica, available at https://cleantechnica.com/2021/02/14/olectra-greentech-limited-wins-order-for-350-electric-buses-in-india-who/ , accessed on 7 February 2021.
30. Anon. 2021, Delhi Cabinet gives green signal for 300 electric buses, The Hindu, available at https://www.thehindu.com/news/cities/Delhi/delhi-cabinet-gives-green-signal-for-300-electric-buses/article34173573.ece, accessed on 9 April 2021.
31. Anon. 2019. Tax boost for EVs, GST slashed to 5% from 12%, Economic Times. Available at https://economictimes.indiatimes.com/news/economy/policy/gst-on-evs-slashed-to-5-from-12/articleshow/70407309.cms#:~:text=*The%20GST%20Council%20slashed%20the,Electric%20Buses%20by%20local%20authorities., accessed in Jul 2020.
32. Ibid.
33. Additional cost estimates shared by Prasanna Patwardhan, President Bus Operator Confederation of India.
34. Anon. 2020. Pune: PMPML defers proposal to buy 350 e-bus from China-based company, Sakal Times. Available at https://www.sakaltimes.com/pune/pune-pmpml-defers-proposal-buy-350-e-bus-china-based-company-52158, accessed on 15 July 2020.
35. Seric et al. 2020. Managing COVID-19: How the pandemic disrupts global value chains, World Economic Forum. Available at https://www.weforum.org/agenda/2020/04/covid-19-pandemic-disrupts-global-value-chains/, accessed on 18 July 2020.
36. Anon. 2020. Pune: PMPML defers proposal to buy 350 e-bus from China-based company, Sakal Times. Available at https://www.sakaltimes.com/pune/pune-pmpml-defers-proposal-buy-350-e-bus-china-based-company-52158, accessed on 15 July 2020.
37. Indian electric bus market to exceed 7,000 units by 2025. Sustainable bus. Available at https://www.sustainable-bus.com/news/indian-electric-bus-market-to-exceed-7000-units-by-2025/, accessed on 15 July 2020.
76
ELECTRIC BUS: TOWARDS ZERO-EMISSION COMMUTING
38. Anon. 2018. Electric buses in cities, Driving towards cleaner air and lower CO2. Bloomberg New Energy Finance. Available at https://about.bnef.com/blog/electric-buses-cities-driving-towards-cleaner-air-lower-co2/, accessed on 16 July 2020.
39. Anon. 2020. Market share of bus sales India 2018 by manufacturer. Statista Research Department. Available at https://www.statista.com/statistics/1094600/india-bus-market-share-by-manufacturer/, accessed on 30 August 2020.
40. Pramoda Gode, Georg Bieker, and Anup Bandivadekar, 2021, Battery capacity needed to power electric vehicles in India froxm 2020 to 2035, ICCT, working paper 2021–07
41. Ibid.
42. Ibid.
43. ABB Power Grids and Ashok Leyland team up for greener electric buses. Press Release, ABB. Available at https://new.abb.com/news/detail/55292/abb-power-grids-and-ashok-leyland-team-up-for-greener-electric-buses, accessed in Jul 2020.
44. Estimates available from PManifold
45. Strategies for deploying zero-emission bus fleets: Development of real-world drive cycles to simulate zero-emission technologies along existing bus routes Authors: Lingzhi Jin, Oscar Delgado, Ravi Gadepalli, Ray Minjares, International Council on Clean Transportation Working Paper 2020–10
46. Ibid.
47. Ibid.
48. Ibid.
49. India: Transition to electric vehicles puts Kolkata on the road to clean transport, ESMAP, Issue 22 | January 2021, https://documents1.worldbank.org/curated/en/479341609914443074/pdf/India-Transition-to-Electric-Vehicles-Puts-Kolkata-on-the-Road-to-Clean-Transport.pdf

77
50. Ibid.
51. Ibid.
52. Ibid.
53. Ibid.
78
ELECTRIC BUS: TOWARDS ZERO-EMISSION COMMUTING
As the majority in Indian cities use public transport, especially buses, the public-transport-centric e-mobility programme is greatly relevant to India’s decarbonization goal. Electric buses are a unique opportunity to decarbonize a sizeable share of daily commute in cities as well as reduce toxic exposure.
While the current incentive programmes for electric vehicles have a priority focus on buses—and rightly so—there is considerable scope of further improvement in design of the incentive for effective deployment. Future reforms will have to enable a new ecosystem for e-buses that have bearing on strategies for procurement, deployment, service conditions, charging options, skilling and monitoring of service level to maximize ridership and emissions gains.
Centre for Science and Environment
41, Tughlakabad Institutional Area, New Delhi 110 062
Phones: 91-11-40616000 Fax: 91-11-29955879
Website: www.cseindia.org