zero-emission tractor-trailers in canada
TRANSCRIPT

WWW.THEICCT.ORG© INTERNATIONAL COUNCIL ON CLEAN TRANSPORTATION, 2019
Zero-emission tractor-trailers in CanadaAuthor: Ben Sharpe
Date: March 2019
Keywords: zero-emission vehicles, tractor-trailers, Canada, greenhouse gas emissions, technology cost
IntroductionThere is growing interest in deploy-ing electrified drivetrains in heavy-duty freight vehicles for a number of reasons, including climate change, energy diversification, and local air quality. Climate change provides a key overarching motivation for most major national and local governments, and the contribution of trucking activity to greenhouse gas (GHG) emissions helps underscore the imperative to focus not just on cars, but on heavy-duty freight vehicles as well.
As shown in Figure 1, the transpor-tation sector represents about 25% of Canada’s CO2-equivalent (CO2e) emissions. Of that 25%, heavy-duty trucks make up roughly 35% of trans-port emissions (rail represents about 3 percentage points of the heavy-duty trucks and rail portion) and 8% of total GHGs in Canada (Environment and Climate Change Canada 2018).
Figure 2 summarizes the breakdown of the vehicle population, travel activity, and GHG emissions for the on-road fleet in Canada. Heavy-duty trucks account for a large and growing share of local pollutant and GHG emissions. Despite representing merely 14% of the
vehicle stock and 21% of total vehicle kilometers driven, heavy-duty freight trucks accounted for approximately 37% of the life-cycle road vehicle GHG emissions (International Council on Clean Transportation 2019).
In Canada, the majority of goods that are transported by road are borne by heavy-duty combination tractor-trail-ers. As a result, tractor-trailers account for the largest percentage of vehicle kilometers traveled (VKT) and thus the
WORKING PAPER 2019-04
Acknowledgements: This study was funded by Transport Canada and Environment and Climate Change Canada. This report reflects the views of the authors only and does not reflect the views or policies of the Government of Canada. The Government of Canada is not responsible for the accuracy or completeness of the report and does not endorse any products or companies mentioned. The author appreciates the reviews of Oscar Delgado, Felipe Rodriguez, and Nit Lutsey of the ICCT, as well as those by Transport Canada and Environment and Climate Change Canada. Their input was helpful in strengthening the data sources and methodology used in this study.
Transport
Oil & gas
Buildings
Electricity
Heavyindustry
Other
0%
10%
20%
30%
40%
50%
60%
70%
80%
90%
100%
Heavy-dutytrucks & rail
38%
Light-dutyvehicles
49%
Othertransport
13%
Figure 1. Breakdown of CO2e emissions in Canada by sector in 2016

ZERO-EMISSION TRACTOR-TRAILERS IN CANADA
2 INTERNATIONAL COUNCIL ON CLEAN TRANSPORTATION WORKING PAPER 2019-04
most fuel consumption and emissions from the heavy-duty vehicle sector. Figure 3 illustrates the contribution of tractor trucks to CO2e emissions from 2015 projected through 2050. Based on business-as-usual vehicle efficiency trends for policies currently in place, the share of fuel use and GHGs from tractor-trailers is projected to grow from 18% in 2015 to 29% in 2050 (International Council on Clean Transportation 2019).
Many governments seek to break down barriers to decarbonize heavy-duty freight trucks by leveraging progress on electric cars. Given the activity and emissions trends intro-duced above, it is increasingly clear that long-term climate and air-quality goals will require that all major trans-port modes move toward much lower emissions, including through the broad application of plug-in electric and hydrogen fuel cell technology. Many of these technologies, in greater use in light-duty vehicles, are also being explored for deployment in heavy-duty freight vehicles.
To inform such government activities on zero-emission heavy-duty vehicles, it is important to gain a clearer under-standing of the potential viability for the various zero-emission heavy-duty vehicle technologies. In this study, we focus on the following zero-emis-sion technology options, which are all in the very early stages of devel-opment and commercialization for Class 7 and 8 trucks: hydrogen fuel cell, battery electric, and overhead catenary electric. The primary objec-tive of this study is to estimate the Canada-specific operations costs and CO2e emissions for these zero-emis-sion trucks as compared with their diesel and natural gas counterparts. This research builds on an earlier ICCT study (Moultak, Lutsey et al. 2017).
We first review the literature to explore two issues that are of particu-lar significance for the performance
of electric trucks in Canada: vehicle weight and cold temperatures. We then assess vehicle-related cost of ownership for diesel, diesel hybrid, natural gas, hydrogen fuel cell, battery electric, and overhead catenary trucks in the 2025–2030 time frame. We then analyze these technologies by their life-cycle greenhouse gas emissions, including upstream fuel cycle emis-sions. We next analyze the costs and emissions benefits of battery electric trucks compared with conventional
diesel for certain high-volume trucking corridors in Canada. Finally, we sum-marize and discuss the results.
Weight and temperature considerations for battery electric tractor-trailersWhile few zero-emission heavy-duty commercial freight vehicles are on the road today, a number of studies over the past five years have con-sidered the feasibility of a variety of
0%
20%
40%
60%
80%
100%
Vehicle population Annual kilometers Fuel use and CO2
Freight trucks
Light-duty vehicles
BusesTwo- and three-wheelers
Figure 2. Canada vehicle stock, distance traveled, and life-cycle road transport GHG emissions by vehicle type in 2015
0%
10%
20%
30%
40%
50%
60%
70%
80%
90%
100%
2015 2020 2025 2030 2035 2040 2045 2050
Per
cent
of
on-
road
veh
icle
em
issi
ons
Heavy-duty freight trucks
Other on-road vehicles
Figure 3. Contribution of tractor-trailers in Canada to total CO2e emissions from 2015 to 2050

ZERO-EMISSION TRACTOR-TRAILERS IN CANADA
WORKING PAPER 2019-04 INTERNATIONAL COUNCIL ON CLEAN TRANSPORTATION 3
technologies and their potential to reduce emissions. A previous ICCT paper summarizes several research studies that examine the technical prospects and fuel use and emission reduction potential of zero-emission propulsion options for medium- and heavy-duty vehicles (Moultak, Lutsey et al. 2017). Those authors also discuss the current state of technology and commercial status for zero-emission options, including battery electric and hydrogen fuel cell, as well as electric trucks that are dynamically charged —via overhead catenary transmission, on-road conductive tracks, or in-road inductive wireless charging.
Of these zero-emission options, battery electric and hydrogen fuel cell trucks are emerging as the early leaders in terms of prototypes and commercialization in the Class 7 and 8 trucking space.1 In the past year, there have been product launch announce-ments from startups (e.g., Tesla, Thor, Nikola) and more well-established vehicle and engine manufacturers (e.g., Daimler, Cummins, Toyota). Many of these companies have rolled out prototypes and are in the begin-ning stages of deploying trucks into real-world service in Canada and the United States. (Nikola Corporation 2016, Claflin 2017, Visnic 2018, Daimler Trucks North America LLC 2019, Tesla 2019, Thor Trucks Inc. 2019).
Financial considerations aside, for zero-emission trucks to reach large-scale deployment, they must be able to meet or exceed the performance, reli-ability, and durability of diesel trucks.
1 In North America, a Class 7 truck is classified as a vehicle with a maximum weight (including payload) of 26,501 to 33,000 lb and a Class 8 truck as greater than 33,000 lb. Virtually all tractor-trailers are either Class 7 or 8 vehicles, though many other truck and bus types are included in these weight categories (e.g., transit buses, refuse trucks, delivery trucks, cement mixers).
In terms of performance, there are two areas that are of particular concern for zero-emission trucks: heavier curb (empty) weights of the vehicles and reduced driving range in cold tem-peratures. In the following two sub-sections, we review the literature and use publicly available data to estimate the additional weight and cold-tem-perature impacts of a battery electric truck. Hydrogen fuel cell trucks are not included in the weight analysis due to limitations in our vehicle simula-tion software. Regarding temperature, data from several years of fuel cell bus evaluations indicate that the range and performance of fuel cell vehicles is not compromised in cold weather (Eudy and Post 2018).
WEIGHT CONSIDERATIONS OF BATTERY ELECTRIC TRACTOR-TRAILERS
For this analysis, we simulated a generic electric truck in Autonomie using the vehicle input parameters shown in Table 1. Autonomie is a vehicle performance evaluation software platform that was developed by the U.S. Department of Energy’s Argonne National Laboratory (UChicago Argonne LLC 2019). With several of the battery electric truck makers claiming their vehicles can perform well at maximum allowable weight,
we analyzed the vehicle at 36,287 kg (80,000 lb), which is the weight limit for the combination tractor-trailer in many jurisdictions across North America. Though this analysis is done at 80,000 lb, an important consider-ation is that while the large majority of tractor-trailers in the United States are subject to an 80,000-lb weight limit, Canada has a much larger per-centage of tractor-trailers carrying heavier payloads. In Canada, where tractor-trailers are often heavier than 120,000 lb, zero-emission trucks must operate at these heavy loads if they are going to eventually replace diesels completely.
For the remaining vehicle parameters, we used inputs based on a 2015 study (Delgado and Lutsey 2015) and our best judgment. We ran the vehicle over the highway cruise portion of the Heavy Heavy-Duty Diesel Truck (HHDDT) cycle2, where speeds hover around 105 km/h (65 mph). The result-ing energy demand at the wheels is approximately 1.6 kilowatt-hour per kilometer (kWh/km).
2 The heavy heavy-duty diesel truck (HHDDT) is a chassis dynamometer test that consists of four modes: idle, creep, transient, and cruise. A fifth mode, also known as the high-speed cruise HHDDT65 cycle, represents higher speed freeway operation at 65 mph and combines elements of each of these modes.
Table 1. Parameters for battery electric tractor-trailer energy demand analysis
Component Parameter Value Source
ChassisTotal tractor-trailer weight (kg) 36,287 -
Aerodynamic drag coefficient (-) 0.36 Tesla (2019)
Final drive Final drive ratio (-) 2.64
Delgado & Lutsey (2015)
Wheel axle
Drive tire coeff. of rolling resistance (CRR) 4.5
Steer tire CRR 4.3
Trailer tire CRR 4
Accessories Electrical (kW) 1.35
Simulated energy demand at the wheels
Kilowatt-hours per kilometer 1.6 This study

ZERO-EMISSION TRACTOR-TRAILERS IN CANADA
4 INTERNATIONAL COUNCIL ON CLEAN TRANSPORTATION WORKING PAPER 2019-04
With this data point for total energy demand at the wheels, we are able to calculate an estimated weight of the battery pack. Table 2 summarizes the various steps and data used in the cal-culation. With 1.6 kWh/km needed to power the truck, if we assume a range of 805 km (500 miles) and a usable battery capacity of 80%3, that results in a battery size of roughly 1,640 kWh. Based on information from existing l ight-duty electric vehicles and assumed improvements that will be achieved for heavy-duty applications, we estimate a battery pack energy density of 0.2 kWh/kg (EVANNEX 2019). Dividing the battery size (1,643 kWh) by 0.2 kWh/kg gives a total pack weight of about 8,400 kg. We then estimate the weight of the power electronics (i.e., inverter, motors, and gearboxes), again using data from the passenger vehicle segment (Teslarati 2013, Motor Trend 2017, InsideEVs.com 2019). Altogether, we estimate nearly 9,000 kg for the weight of the battery pack and power electron-ics. Removing the powertrain and fluids from a diesel truck eliminates about 3,000 kg (U.S. Department of Energy: Office of Energy Efficiency and Renewable Energy 2019), so the electric truck in this example would have a net weight increase of about 6,000 kg compared with a conven-tional vehicle. At roughly 36,300 kg, the maximum payload a diesel truck can haul is about 21,600 kg (assuming roughly 14,700 kg empty weight). Thus, the 6,000 kg of additional weight of the battery electric truck in this example represents a loss of payload of 28%. This is a significant reduction in maximum payload, and fleets that tend to carry heavy loads would have great difficulty in deploy-ing battery electric trucks unless there
3 According to the CALSTART study on truck electrification (2014), fleets typically apply a safety factor to the advertised maximum range limit. We use the same 80% value as in the CALSTART analysis.
are significant advances in battery energy density. Even with a 50% improvement in energy density (0.3 kWh/kg), the battery electric truck in this example would have a roughly 3,200-kg loss of payload.
Figure 4 shows the impacts of increas-ing the energy density of the battery
pack. At the left end of the figure, the baseline battery energy density is 0.2 kWh/kg, which increases in 10 percent-age point increments moving to the right. The blue curve is the resulting additional net weight of the electric truck, assuming a constant range of 805 km. For the electric truck in this example to be at maximum weight
Table 2. Vehicle parameters for battery electric tractor-trailer energy demand analysis
Parameter Formula Value Source
A Power demand at the wheels (kWh/km) 1.6 This study
B Nominal range (km) 805 Tesla (2019)
C Usable battery capacity 80% Tesla (2019)
D Required battery pack size (kWh) A x B / C 1,643 -
E Battery pack energy density (kWh/kg) 0.20EVANNEX (2019) and author’s best judgment
F Battery pack weight (kg) D / E 8,378 -
G Motor rated power (kW) 175 Motor Trend (2017)
H Number of motors needed for semi truck 4 InsideEVs.com (2019)
I Total rated power (kW) G x H 700 -
J Weight of motor, inverter, and gearbox (kg/kW) 0.88 Teslarati (2013)
K Weight of motor, inverter, and gearbox (kg) I x J 618 -
L Total weight of battery and power electronics (kg) F + K 8,996 -
M Weight of powertrain and fluids in diesel truck (kg) 3,000 U.S. DOE, EERE
(2019)
NET ADDITIONAL WEIGHT OF BATTERY ELECTRIC TRACTOR-TRAILER (kg) L – M 5,996 -
0
100
200
300
400
500
600
700
800
900
0
1,000
2,000
3,000
4,000
5,000
6,000
7,000
Ran
ge
(km
)
Net
ad
dit
iona
l wei
ght
vs.
die
sel t
ruck
(kg
)
50% 100% 200%150% 250%
Increase in battery pack energy density
Net additional weight, holdingrange constant (805 km)
Resulting range, holding vehicleweight constant (36,287 kg)
Figure 4. Battery pack density impacts on electric tractor-trailer weight and range

ZERO-EMISSION TRACTOR-TRAILERS IN CANADA
WORKING PAPER 2019-04 INTERNATIONAL COUNCIL ON CLEAN TRANSPORTATION 5
(36,287 kg) and successfully complete 805 km of driving without any weight penalties versus a conventional diesel, the battery energy density would need to be 0.69 kWh/kg. The orange curve shows the resulting vehicle range if we hold the total truck weight constant at 36,287 kg. As shown, the baseline energy density of 0.2 kWh/kg results in a range of about 230 km, and this value grows linearly as battery pack energy density increases.
Continued improvements in battery technology are expected, and battery pack energy densities in vehicle appli-cations are projected to double over the next 5 to 7 years (Cano, Banham et al. 2018). Heavy-duty electric vehicle manufacturers will certainly depend on these advancements in battery tech-nology to be competitive with diesel and other fossil fuel-powered trucks.
TEMPERATURE IMPACTS ON BATTERY ELECTRIC TRACTOR-TRAILER PERFORMANCE
In additional to the weight concerns, reduced battery performance in cold temperatures is an important barrier to large-scale commercialization of zero-emission trucks, especially in Canada. There are several studies that analyze the effects of cold temperatures on the battery performance and driving range of light-duty electric cars (Christenson, Loiselle-Lapointe et al. 2014, Loiselle-Lapointe, Conde et al. 2015, Taggart 2017, Loiselle-Lapointe, Pedroso et al. 2018), and one study examines this issue for commercial trucks (CalStart 2014). According to the literature, colder temperatures affect battery electric vehicle performance in two ways: 1) increase in auxiliary power consumption for cabin heating and window defrosting, and 2) battery chemistry is less efficient in severe temperatures (cold or hot).
To estimate the reduction in battery electric truck range due to increased
auxiliary loads, we used the same vehicle modeling parameters as in the previous section, though we assumed a vehicle test weight of 31,900 kg. This test weight was selected because it is roughly the weight under which Class 8 tractor-trailers are evaluated in the GHG regulation for on-road commer-cial vehicles in Canada and the United States. For the increased power demand of a cabin heater, we assumed an addi-tional 5 kW of constant load (CalStart 2014). With this additional accessory load, energy consumption over the HHDDT 65 mph cycle and HHDDT tran-sient cycle increased by 4% and 13%, respectively. The increase in energy consumption is larger over the transient cycle because accessory loads make up a larger percentage of overall losses in cycles with lower speeds and more acceleration and deceleration events (Delgado and Lutsey 2015).
We did not estimate the reduction in range due to battery temperature effects in Autonomie, but rather we adapted the data provided in Figure 3 in Taggart (2017), which analyzed electric vehicle performance from
approximately 2.5 mil l ion tr ips. Compared with tractor-trailers, light-duty vehicles typically have much shorter trips and therefore spend a higher percentage of time with the battery operating at colder tempera-tures, and range impacts are more significant. To account for the fact that cold temperature impacts on driving range are more significant for shorter trips, Taggart analyzes driving range as a function of temperature for different trip distances. Figure 3 in that study estimates the relationship between ambient temperature and reduction in driving range for trips of three different ranges including 80-plus mile trips, the longest trips within the dataset. We translated the Taggart data from 80-plus mile trips into percentage reduction in driving range, which is shown in the blue curve in Figure 5. The “No cabin heating” scenario represents the reduction in range due solely to battery tempera-ture effects.
To estimate the loss in driving range due to increased cabin heating demands, we assumed an additional
-40%
-35%
-30%
-25%
-20%
-15%
-10%
-5%
0%
-20 -15 -10 -5 0 5 10 15 20 25
Red
ucti
on
in d
rivi
ng r
ang
e
Temperature (degrees Celsius)
No cabin heating
With cabin heating
Figure 5. Estimated loss in driving range of battery electric tractor-trailer as a function of temperature

ZERO-EMISSION TRACTOR-TRAILERS IN CANADA
6 INTERNATIONAL COUNCIL ON CLEAN TRANSPORTATION WORKING PAPER 2019-04
heating power demand of 5 kW at -20°C and a linear reduction of this accessory load down to zero at 25°C, where we assume the battery pack operates at maximum efficiency. The orange curve in Figure 5 represents the decrease in range due to both battery temperature effects and addi-tional cabin heating over the HHDDT transient cycle. Because the losses due to additional accessory loads are larger in the transient cycle than in the highway cruise cycle, the orange curve represents our estimated upper bound for the total losses in driving range for battery electric trucks as a function of temperature.
As battery electric tractor-trailers are increasingly deployed as replace-ments for diesel (and other fossil-fuel-powered) vehicles, trucking fleets are going to expect that the per-formance is roughly comparable to their conventional counterparts. As discussed in this section, the battery weight concerns and cold temperature impacts are considerable barriers to the accelerated deployment of battery electric trucks across the full spectrum of trucking applications.
Technology cost analysis To assess zero-emission vehicle tech-nology costs, in the two subsections below we develop a cost of ownership evaluation of the various vehicle tech-nology alternatives.
VEHICLE COST OF OWNERSHIP
To gain an understanding of the viabil-ity of various zero-emission heavy-duty technologies for long-haul heavy-duty tractor-trailer applications, we analyzed the technologies under a vehicle-related cost of ownership framework. We base the analysis on the research and available data on vehicle technology costs, efficiency, and emissions from Moultak et al. (2017). We report on results for 2015 through 2030 to show our best esti-mates of the progression of the costs over time.
The objective of the cost analysis is to illustrate the cost differences of various tractor-trailer technologies over different periods of time. The analysis includes capital costs (tractor-trailer purchase price), maintenance costs, and fuel costs experienced by
the owner over the vehicle lifetime. The fuels and technologies consid-ered in the analysis are diesel, diesel hybrid, compressed natural gas, lique-fied natural gas, overhead catenary line electric, and hydrogen fuel cells. All costs in the analysis are in 2018 Canadian dollars. The analysis is con-strained to vehicle and fuel costs. Motor vehicle taxes, insurance costs, driver wages, tolls, and road fees are excluded. We make a series of assump-tions on average annual vehicle use, efficiency technology, cost, and fuel cost to develop bottom-up cost models for the various tractor-trailer technologies. Vehicle technology and maintenance costs are taken directly from our 2017 study (Moultak, Lutsey et al. 2017), so the focus here will be on highlighting the Canada-specific fuel cost inputs in the analysis.
The data and methods used to estimate historical and projected end user fuel costs for diesel, natural gas, hydrogen (natural gas-sourced and renewable-sourced), and electricity are summa-rized in the bottom portion of Table 3.
Figure 6 shows the vehicle-related cost of ownership for 2015 through 2030.
0
200
400
600
800
1,000
1,200
1,400
1,600
2015
2020
2025
2030
2015
2020
2025
2030
2015
2020
2025
2030
2015
2020
2025
2030
2015
2020
2025
2030
2015
2020
2025
2030
2015
2020
2025
2030
2015
2020
2025
2030
2015
2020
2025
2030
Diesel Dieselhybrid
Natural gasLNG-CI
Natural gasLNG-SI
Natural gasCNG-SI
Fuel cell(natural gas)
Fuel cell(renewable)
Electric(overhead)
Electric(battery)
Co
st (
tho
usan
d C
AD
)
Capital cost Maintenance cost Fuel cost
Figure 6. Cost of ownership for each tractor-trailer technology for a vehicle purchased in 2015–2030 broken down by capital cost, maintenance cost, and fuel cost, excluding infrastructure costs. No battery replacements are assumed for either type of electric truck.

ZERO-EMISSION TRACTOR-TRAILERS IN CANADA
WORKING PAPER 2019-04 INTERNATIONAL COUNCIL ON CLEAN TRANSPORTATION 7
Table 3. Canada-specific data inputs
Parameter Value and/or method Source
U.S. dollars (2015) to Canadian dollars (2018)
(1) Convert USD 2015 to 2018 (annual average)
(2) For 2018 annual average, convert USD to CAD(Bureau of Labor Statistics 2019, USForex Inc. 2019))
Average annual vehicle kilometers traveled 90,000 km
(Cheminfo Services Inc. and the North American Council for Freight Efficiency 2017))
Carbon intensity of fuels
Diesel 94.2 gCO2e/MJ
((S&T) Squared Consultants Inc. 2019))
Hydrogen (gaseous) from natural gas 105.7 gCO2e/MJ
Compressed natural gas 64.4 gCO2e/MJ
Liquefied natural gas 68.9 gCO2e/MJ(California Air Resources Board 2018, (S&T) Squared Consultants Inc. 2019))
Electricity grid mix and CO2e emissions, and carbon intensity 1990–2016. National average and by province and territory.
Carbon intensity calculated by dividing total CO2e emissions by total generation capacity
(Environment and Climate Change Canada 2018))
Electricity grid mix and CO2e emissions, and carbon intensity 2017–2040. National average and by province and territory.
Using baseline (2016) electricity grid mix from Environment and Climate Change Canada, 2017–2040 values are estimated using National Energy Board projections.
(National Energy Board 2017, Environment and Climate Change Canada 2018))
End user prices for fuels
DieselHistorical: 2015–2018 (Natural Resources Canada
2019))
Growth rate derived from IEA projections out to 2040 (International Energy Agency 2017))
Hydrogen (gaseous) from natural gas
(1) Price from the STEPS study for liquid hydrogen from natural gas is adjusted based on the average price difference between natural gas in the United States and Canada and the estimated portion of hydrogen fuel costs due to natural gas feedstock costs.
(2) The price of gaseous hydrogen is estimated based on ratio of the price of gaseous to liquid natural gas.
(National Research Council and National Academy of Engineering 2004, Fulton and Miller 2015, U.S. Department of Energy: Office of Energy Efficiency and Renewable Energy 2016, BP 2018))
Hydrogen (gaseous) from renewables
(1) The price from the STEPS study for liquid hydrogen from renewables is adjusted based on the average price difference between electricity in the U.S. and Canada and the estimated portion of hydrogen fuel costs due to electricity costs.
(2) The price of gaseous hydrogen is estimated based on ratio of the price of gaseous to liquid natural gas.
Natural gas
Historical and projected values for Canada based on a ratio of the difference between U.S. and Canadian price data from BP. The difference in price between Canada and the United States is assumed to be constant over the study period. U.S. price data for 2015– 2040 comes from the U.S. EIA.
(U.S. Energy Information Administration 2017, BP 2018))
Electricity: national average and major cities
Historical: 2015– 2018 (Hydro-Québec 2018))
Growth rate derived from U.S. EIA projections out to 2050 (U.S. Energy Information Administration 2017))

ZERO-EMISSION TRACTOR-TRAILERS IN CANADA
8 INTERNATIONAL COUNCIL ON CLEAN TRANSPORTATION WORKING PAPER 2019-04
The graphs show the breakdown of the tractor-trailer capital cost, mainte-nance cost, and fuel cost over 10 years of operation. The cost analysis excludes infrastructure cost for overhead catenary technologies. By analyzing the 10-year operating cycle, we intend to cover at least the first phase of the tractor life while it is in long-haul operation. With uncertainties about total electricity throughput, charging-discharging cycles, and any degrada-tion over time for catenary and in-road charging electric tractors, we do not include battery replacements. The results are summarized for the various vehicle technologies as compared with conventional diesel (which increases in efficiency over time), diesel hybrid (which retains an efficiency advan-tage over conventional diesel), and three natural gas technologies: lique-fied compression ignition (LNG-CI), liquefied spark ignition (LNG-SI), and compressed spark ignition(CNG-SI). Two fuel cell technology pathways are shown: the first for natural gas-derived hydrogen and the second for renew-able source-derived hydrogen.
The figure shows how conventional diesel vehicle costs increase incremen-tally, but are relatively consistent into future years, as compared with the alternative fuel technologies. Essentially all the other technologies see reduced cost of ownership over time, primarily because their capital technology costs drop from 2015 through 2030. Natural gas trucks consistently yield the lowest cost of ownership.
The zero-emission vehicle technolo-gies show the greatest cost reductions from 2015 to 2030. Fuel cell technol-ogy shows the largest reduction in cost over time, due to the expected drops in fuel cell costs and hydrogen costs. Excluding infrastructure costs, the two electric vehicle scenarios, catenary and battery electric, ulti-mately arrive at among the lowest total vehicle cost in the 2025–2030 time frame, similar to natural gas. As compared with diesel vehicles in the 2030 time frame, overhead catenary and battery electric result in roughly 30% to 35% lower costs, and hydrogen fuel cells result in 15% to 25% lower costs to own, operate, and fuel. The
projected costs for electric tractor-trailers would bring their upfront costs in line with conventional diesel trailers in the 2025–2030 time frame.
PROVINCE AND TERRITORY-SPECIFIC COST RESULTS FOR BATTERY ELECTRIC TRACTOR-TRAILERS
We used electricity price data for com-mercial customers in several cities in Canada to estimate average prices at the provincial and territorial level, and Figure 7 shows the results. In the figure, each of the 10 provinces and three territories has two bars: the solid bar represents the difference in electricity prices versus the national average, and the dashed bar shows the difference in total costs, factoring in capital and maintenance costs. Because fuel costs are a subset of the total costs, the dif-ference in fuel costs (solid columns) for each province is larger in absolute value than the difference in total costs. Provinces with red columns—Alberta, British Columbia (BC), Manitoba, Newfoundland and Labrador, and
-12%-19%
-34%
13%
-17%
154%
22%
164%
19%
42%
-24%
21%
137%
-3% -4% -7%
3%
-4%
34%
5%
36%
4% 9%
-5%
5%
30%
-100%
-50%
0%
50%
100%
150%
200%
250%
Alberta
BC
Manitoba
NewBrunswick
Newfoundlandand Labrador
NorthwestTerritories
Nova Scotia
Nunavut
Ontario
Prince EdwardIsland
Quebec
Saskatchewan
Yukon
Di�
eren
ce f
rom
nat
iona
l Can
ada
aver
age
Fuel costs Total costs
Figure 7. Battery electric tractor-trailers: Factor difference in electricity costs and vehicle cost of ownership from the Canada average

ZERO-EMISSION TRACTOR-TRAILERS IN CANADA
WORKING PAPER 2019-04 INTERNATIONAL COUNCIL ON CLEAN TRANSPORTATION 9
Quebec—have electricity costs lower than the national average, and the opposite is true for the remaining eight provinces. The three northern-most territories—the Northwest Territories, Nunavut, and Yukon—have the highest electricity costs, at roughly 2.5 times the national average. These higher electricity costs translate to between 30% and 36% increased cost of own-ership for an electric truck versus the national average. For the remaining 10 provinces, the cost of ownership for an electric truck is within plus/minus 10% of the Canada average.
Analysis of emissions impacts
PER-VEHICLE LIFETIME GREENHOUSE GAS EMISSIONS
To gain an understanding of the emis-sions impacts of the various tractor-trailer technologies, we analyze the life-cycle GHG emissions for each technology for a truck purchased from 2015 to 2030. In addition to the assumptions used above in the cost of ownership analysis, we include the upstream fuel cycle emissions impacts
associated with the production of the various fuel. The data and methods we used to estimate fuel carbon intensi-ties were summarized in Table 3.
Table 4 shows the assumed fuel carbon intensities that we apply to our life-cycle analysis. Carbon intensities for diesel and natural gas are assumed to remain constant from 2015 through 2030, while the carbon intensity of hydrogen is expected to decrease sig-nificantly as hydrogen transitions from being produced mainly from fossil fuels through steam-methane reformation to being produced from renewable energy sources. For hydrogen’s carbon inten-sity, we apply a 5% annual reduction
to assume that progressive policy is in place to ensure that fuel supply is increasingly low-carbon. The carbon intensity of electricity for 2015 and 2016 is based on the National Inventory Report, and projections are based on the data provided in Canada’s Energy Future report (National Energy Board 2017, Environment and Climate Change Canada 2018). We note that there are certain provinces (e.g., BC, Manitoba, and Québec), where the electricity carbon intensity is already near zero, due to electricity generation predomi-nantly coming from renewable energy sources—namely hydro. In Ontario, hydro and nuclear together account for nearly 80% of electricity generation,
Table 4. Fuel carbon intensities (gCO2e/MJ) for 2015 and 2030 and the percentage reduction in emissions from 2015 to 2030
Fuel
Fuel carbon intensity (gCO2e/MJ) Greenhouse gas emission
reductions in 2030a2015 2030
Diesel 94 94 -
Compressed natural gas 64 64 -
Liquefied natural gas 69 69 -
Hydrogen 106 64 -40%
Electricity 42 21 -50%a Greenhouse gas emission reductions include on-vehicle efficiency improvement (i.e., relative mega-
joule (MJ) per kilometer)
0
200
400
600
800
1000
0
500
1,000
1,500
2015
2020
2025
2030
2015
2020
2025
2030
2015
2020
2025
2030
2015
2020
2025
2030
2015
2020
2025
2030
2015
2020
2025
2030
2015
2020
2025
2030
2015
2020
2025
2030
Diesel DieselHybrid
Natural GasLNG-SI
Natural GasLNG-CI
Natural GasCNG-SI
Fuel Cell(Hydrogen)
Electric(overhead)
Electric(battery)
Life
cycl
e em
issi
ons
per
kilo
met
e (
gC
O2e
/km
)
Life
cycl
e em
issi
ons
(to
ns C
O2e
)
Figure 8. Life-cycle CO2 emissions over vehicle lifetime (left axis) and per kilometer (right axis) by vehicle technology type

ZERO-EMISSION TRACTOR-TRAILERS IN CANADA
10 INTERNATIONAL COUNCIL ON CLEAN TRANSPORTATION WORKING PAPER 2019-04
which also leads to a relatively low overall carbon intensity. In such cases, electric trucks offer a more than 95% reduction in carbon emissions versus conventional diesel vehicles.
The total life-cycle wheel-to-well GHG emissions in carbon dioxide equiva-lents (CO2e) for each long-haul heavy-duty freight truck technology pur-chased from 2015 through 2030 are shown in Figure 8.
Major emission differences across the technologies and over time are apparent from the figure. The electric heavy-duty trucks have by far the lowest lifetime emissions. The two electric truck technologies have 84%, 86%, 87%, and 88% lower lifetime CO2e emissions than conventional diesel vehicles in 2015, 2020, 2025, and 2030, respectively. In those four years, hydrogen fuel cell vehicles have 32%, 53%, 62%, and 72% lower emis-sions than diesel vehicles. The natural gas technologies have emission levels that are roughly 15% to 20% lower than diesel over the study period. As shown, there is the potential for major reductions in all the vehicle technology types in the 2025–2030 time frame. In the case of the diesel and natural gas technologies, the emission reductions are driven by efficiency technology on
the vehicle. On the electric and fuel cell technologies, the emission reductions are driven primarily by the reduced fuel carbon intensity. The diesel tractor-trailer is shown with greatly reduced carbon intensity, with a 35% reduc-tion from 2015 to 2030. The fuel cell technology sees reduced carbon emis-sions from 2015 to 2030 by 73%. The catenary and battery electric vehicle technology both show a reduction of 54% by 2030.
PROVINCE- AND TERRITORY-SPECIFIC EMISSIONS RESULTS FOR BATTERY ELECTRIC TRACTOR-TRAILERS
We used electricity feedstock mix data from the National Energy Board to
estimate electric truck life-cycle CO2e emissions at the provincial level, and Figure 9 shows the results. The five provinces with near-zero emissions —BC, Manitoba, Newfoundland and Labrador, Prince Edward Island, and Quebec—get virtually all electricity from hydro power. Ontario’s grid is also relatively clean, as it derives roughly 80% of its electricity from hydro and nuclear power. The remaining prov-inces and territories have a higher percentage of their electricity coming from fossil sources, though carbon intensities are projected to drop 15% to 45% between 2015 and 2030.
Using the region-specific carbon intensities for electricity, we per-formed route-specific analyses for five high-volume trucking corridors
0
200
400
600
800
1000
0
500
1,000
1,500
2015
2020
2025
2030
2015
2020
2025
2030
2015
2020
2025
2030
2015
2020
2025
2030
2015
2020
2025
2030
2015
2020
2025
2030
2015
2020
2025
2030
2015
2020
2025
2030
2015
2020
2025
2030
2015
2020
2025
2030
2015
2020
2025
2030
2015
2020
2025
2030
2015
2020
2025
2030
2015
2020
2025
2030
Canada
Alberta
BC
Manitoba
NewBrunswick
Newfoundlandand Labrador
NorthwestTerritories
NovaScotia
Nunavut
Ontario
PrinceEdwardIsland
Quebec
Saskatchewan
Yukon
Life
cycl
e em
issi
ons
pe
kilo
met
er (
gC
O2e
/km
)
Life
cycl
e em
issi
ons
(to
ns C
O2e
)
Figure 9. Battery electric tractor-trailers: Province- and territory-specific life-cycle CO2 emissions over vehicle lifetime (left axis) and per kilometer (right axis)
Table 5. Fuel carbon intensities (gCO2e/MJ) for 2015 and 2030 in Canada and the United States and the percentage difference
Fuel
2015 2030
CanadaUnited States Difference Canada
United States Difference
Diesel 94 102 -8% 94 102 -8%
Compressed natural gas 64 81 -21% 64 81 -21%
Liquefied natural gas 69 86 -20% 69 86 -20%
Hydrogen 106 151 -30% 49 70 -30%
Electricity 42 144 -71% 21 49 -57%
ZERO-EMISSION TRACTOR-TRAILERS IN CANADA
WORKING PAPER 2019-04 INTERNATIONAL COUNCIL ON CLEAN TRANSPORTATION 11
in Canada. These analyses are sum-marized in the Annex.
DIFFERENCES IN PER-VEHICLE EMISSIONS BETWEEN CANADA AND THE UNITED STATES
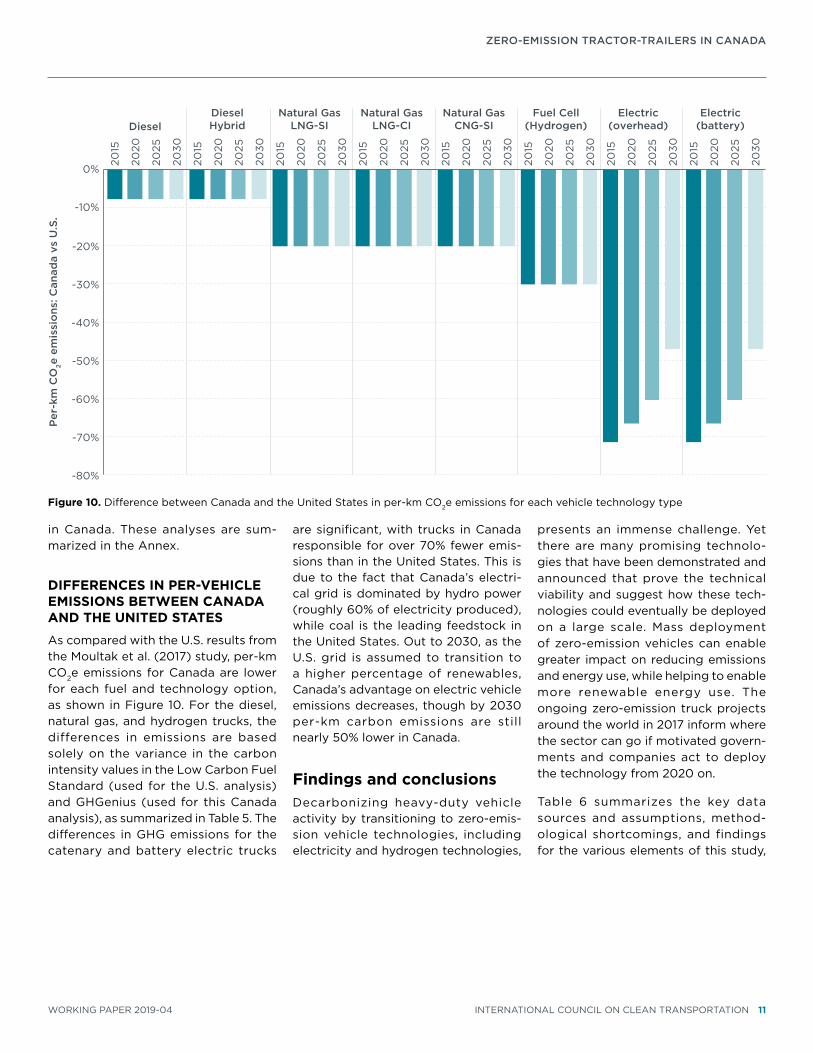
As compared with the U.S. results from the Moultak et al. (2017) study, per-km CO2e emissions for Canada are lower for each fuel and technology option, as shown in Figure 10. For the diesel, natural gas, and hydrogen trucks, the differences in emissions are based solely on the variance in the carbon intensity values in the Low Carbon Fuel Standard (used for the U.S. analysis) and GHGenius (used for this Canada analysis), as summarized in Table 5. The differences in GHG emissions for the catenary and battery electric trucks
are significant, with trucks in Canada responsible for over 70% fewer emis-sions than in the United States. This is due to the fact that Canada’s electri-cal grid is dominated by hydro power (roughly 60% of electricity produced), while coal is the leading feedstock in the United States. Out to 2030, as the U.S. grid is assumed to transition to a higher percentage of renewables, Canada’s advantage on electric vehicle emissions decreases, though by 2030 per-km carbon emissions are still nearly 50% lower in Canada.
Findings and conclusionsDecarbonizing heavy-duty vehicle activity by transitioning to zero-emis-sion vehicle technologies, including electricity and hydrogen technologies,
presents an immense challenge. Yet there are many promising technolo-gies that have been demonstrated and announced that prove the technical viability and suggest how these tech-nologies could eventually be deployed on a large scale. Mass deployment of zero-emission vehicles can enable greater impact on reducing emissions and energy use, while helping to enable more renewable energy use. The ongoing zero-emission truck projects around the world in 2017 inform where the sector can go if motivated govern-ments and companies act to deploy the technology from 2020 on.
Table 6 summarizes the key data sources and assumptions, method-ological shortcomings, and findings for the various elements of this study,
-80%
-70%
-60%
-50%
-40%
-30%
-20%
-10%
0%
2015
2020
2025
2030
2015
2020
2025
2030
2015
2020
2025
2030
2015
2020
2025
2030
2015
2020
2025
2030
2015
2020
2025
2030
2015
2020
2025
2030
2015
2020
2025
2030
DieselDieselHybrid
Natural GasLNG-SI
Natural GasLNG-CI
Natural GasCNG-SI
Fuel Cell(Hydrogen)
Electric(overhead)
Electric(battery)
Per
-km
CO
2e e
mis
sio
ns: C
anad
a vs
U.S
.
Figure 10. Difference between Canada and the United States in per-km CO2e emissions for each vehicle technology type

ZERO-EMISSION TRACTOR-TRAILERS IN CANADA
12 INTERNATIONAL COUNCIL ON CLEAN TRANSPORTATION WORKING PAPER 2019-04
Table 6. Summary of key data sources and assumptions, methodological shortcomings, and findings in the study
Key data sources and assumptionsPrimary shortcomings in the
methodology Findings
Battery electric tractor-trailers: additional weight vs. diesels
• Battery pack energy densities for electric trucks in the 2020 time frame are 0.2 kWh/kg, or ~ 25% to 50% improvement compared with packs in available light-duty vehicles
• Vehicle simulation tool: Autonomie, Version 16
• Energy demand assumptions are based on only one drive cycle (HHDDT 65 mph cruise)
• Battery pack energy density data and kW/kg assumptions for the weight of power electronics come solely from the light-duty vehicle sector
• Road load (i.e., aerodynamic and rolling resistance drag) assumptions are based on unverified manufacturer data and our best judgment
• For an 805-km (500 mile) range and at 36 tonnes (80,000 lb) test weight, a battery electric truck with our modeling parameters weighs ~ 6,000 kg more than a diesel (28% loss in available payload capacity)
• Assuming no additional weight vs. a diesel, this battery electric truck has ~ 230-km range
• Significant advances in battery pack energy density are needed for battery electric trucks to more effectively compete with diesels
Battery electric tractor-trailers: cold temperature impacts on driving range
• Temperature effects on the battery packs of tractor trucks will be comparable to the light-duty sector; based on Figure 3 in Taggart (2017)
• Cabin heating poses a maximum additional load of 5 kW
• 31,900-kg test weight
• Evaluation from -20° to 25° C
• Lack of literature regarding temperature impacts as a function of battery pack size
• Virtually all available literature is centered around light-duty vehicles
• From battery temperature effects, driving range is reduced by ~ 25% at -20° C
• Losses due to additional cabin heating result in greater percentage increase in fuel consumption for transient cycle as compared with highway cruise cycle
• At -20° C, the estimated upper bound for the total loss in driving range is 35%
Zero-emission vs. fossil fuel-powered tractor-trailers: vehicle-related cost of ownership
• Capital and maintenance costs for all vehicle types are identical to the values used in Moultak et al. (2017)
• Canada-specific fuel costs were available for diesel, natural gas, and electricity
• We assume that over the entire study period (2015 to 2030), zero-emission trucks are comparable on performance, reliability, and durability
• Infrastructure costs for diesel, natural gas, hydrogen, and electricity refueling are not taken into account
• We assume no battery replacements over the 10-year life of the battery electric truck
• Changes in fuel prices over time are an exogenous input and are not linked to overall demand for the fuel in the transportation sector
• Natural gas prices are indexed to the United States and based on an average difference in natural gas prices between Canada and the United States since 1990
• Changes in prices over time for diesel, natural gas, and electricity are based on projections for the United States
• Natural gas trucks are the lowest TCO option over the entire study period
• Due to relatively low-cost electricity, electric trucks are lower than diesels on TCO over the entire study period (~ 5% lower in 2015, growing to over 30% lower by 2030)
• Hydrogen fuel cell trucks (renewable H2) have the largest TCO reduction between 2015 and 2030 (nearly 40%)
• In 2030, electric trucks have lower TCO than fuel cell trucks by 7% to 20%
Zero-emission vs. fossil fuel-powered tractor-trailers: CO2e emissions
• GHGenius data (Canada-specific) is used for the carbon intensity of all fuels except electricity
• Carbon intensities of diesel and natural gas are assumed to be constant over time, whereas hydrogen and electricity values decrease by 40% and 50%, respectively
• Electricity carbon intensity is based on grid mix and emissions data from the National Inventory Report (historical) and the National Energy Board (projections)
• More analysis is needed to better understand the differences in fuel carbon intensity factors in GHGenius (this study) vs. California’s Low Carbon Fuel Standard (Moultak et al., 2017 study)
• Life-cycle emissions estimates do not take into account emissions associated with vehicle production or end-of-life disposal
• Reduced emissions vs. diesels à electric trucks (~ 85% to 90%); hydrogen fuel cell (~ 30 to 70%)
• Provinces with a large percentage of hydro-sourced electricity yield battery electric trucks with nearly zero emissions
• Electric trucks in Canada have ~ 70% fewer emissions than those in the United States due to Canada’s large reliance on carbon-free hydro power (and to a smaller extent, nuclear power, which is also relatively low carbon, after taking power plant construction emissions into account)
Route-specific costs and CO2e for battery electric vs. diesel tractor-trailers (Appendix)
• City-specific diesel prices and province-specific electricity prices are used in the analysis
• Trucks are assumed to fuel up in only the origin city
• City-specific electricity costs were not utilized
• Grade and estimated vehicle speed data are not factored into the assumed energy consumption rates
• Overall costs are between 15% and 30% lower for the electric trucks vs. the diesel
• Emissions are nearly eliminated (92% to 99% reduction)

ZERO-EMISSION TRACTOR-TRAILERS IN CANADA
WORKING PAPER 2019-04 INTERNATIONAL COUNCIL ON CLEAN TRANSPORTATION 13
including the route-specific analyses, which are summarized in the Appendix.
Zero-emission trucks offer the prospect of lower climate emissions, no tailpipe pollutant emissions, lower fueling cost, greater renewable energy use, and higher on-vehicle energy efficiency. The zero-emission vehicle technolo-gies do, however, present consider-able challenges. They have a combina-tion of near- and long-term barriers, issues, and questions that will have to be addressed before they can become
widespread replacements for conven-tional trucks and tractor-trailers that are typically diesel-fueled. These chal-lenges are somewhat different for the three zero-emission vehicle technolo-gies. As a result, the three technolo-gies have different truck segments for which they offer the most promise for widespread commercialization, based on our assessment in 2017 (Moultak, Lutsey et al. 2017). We emphasize the high uncertainty in how these technol-ogies could evolve over the long term
for 2030 and beyond. With sustained government and private industry investment, each of these electric-drive technologies has the potential to overcome the various barriers faster than the others. Considering the vast scale of the problem of decarbonizing freight transport, it appears likely that many of the battery and fuel cell tech-nologies will need to grow in parallel to meet medium- and long-distance freight demands as soon as they prove themselves.

ZERO-EMISSION TRACTOR-TRAILERS IN CANADA
14 INTERNATIONAL COUNCIL ON CLEAN TRANSPORTATION WORKING PAPER 2019-04
Appendix
TOTAL COSTS AND CO2E RESULTS FOR HIGH-VOLUME TRUCKING CORRIDORS IN CANADA
In the main body of the paper, we describe the vehicle-related cost of ownership and emissions analyses for the fuel and technology options that were included in this study. We also present province- and territory-specific results for the battery electric trucks.
In this appendix, we perform route-specific comparisons for battery electric versus diesel trucks for five
high-volume trucking corridors in Canada. For each of the five routes (Toronto to Montreal; Montreal to Quebec City; Toronto to London, ON; Vancouver to Seattle; and Hamilton to Woodstock, ON), we assume that both the diesel and battery electric trucks are fully fueled in the origin city and complete the route without refuel-ing along the route. Thus, the battery electric trucks have upstream emis-sions associated with the carbon inten-sity of the electricity in the province of origin. We do not have the required data granularity to estimate electric-ity carbon intensity at the city level, so the battery electric trucks leaving Toronto and Hamilton are assumed to
have identical CO2e-per-km emissions based on the average electricity carbon intensity in Ontario. The Montreal-to-Quebec City and Vancouver-to-Seattle trips use Quebec- and British Columbia-based carbon intensities, respectively. Finally, we do not take grade into account, and the analysis is set in the year 2020.
For each route, Figures 11 through 15 show the input assumptions for trip length and fuel costs, as well as the TCO and emissions results in terms of percentage reduction versus the diesel truck. The geographic boundary maps for the provinces were created in Mapchart.net (Mapchart.net 2019).
QUEBEC
ONTARIO
MANITOBA
0
0 200 KM
200 Miles
Toronto ¨ MontrealDistance: 542 kmDiesel price: $1.12/literElectricity: $0.139/kWh
-16%
-92%
Totalcosts
CO2eemissions
Battery electric truck
Figure 11. Difference between battery electric and diesel trucks in costs and CO2e emissions for the Toronto-to-Montreal corridor
0
0 200 KM
200 Miles
-27%
-100%
Totalcosts
CO2eemissions
Battery electric truck
Montreal ¨ Quebec CityDistance: 268 kmDiesel price: $1.26/literElectricity: $0.078/kWh
QUEBEC
NEWFOUNDLANDAND LABRADOR
NEWBRUNSWICK
ONTARIO
Figure 12. Difference between battery electric and diesel trucks in costs and CO2e emissions for the Montreal-to-Quebec City corridor

ZERO-EMISSION TRACTOR-TRAILERS IN CANADA
WORKING PAPER 2019-04 INTERNATIONAL COUNCIL ON CLEAN TRANSPORTATION 15
0
0 200 KM
200 Miles
-16%
-92%
Totalcosts
CO2eemissions
Battery electric truck
Toronto ¨ LondonDistance: 194 kmDiesel price: $1.12/literElectricity: $0.139/kWh
QUEBEC
ONTARIO
Figure 13. Difference between battery electric and diesel trucks in costs and CO2e emissions for the Toronto-to-London corridor
BRITISHCOLUMBIA
ALBERTA
0
0
500 Miles
500 KM
Vancouver ¨ SeattleDistance: 229 kmDiesel price: $1.27/literElectricity: $0.125/kWh
-27%
-99%
Totalcosts
CO2eemissions
Battery electric truck
Figure 14. Difference between battery electric and diesel trucks in costs and CO2e emissions for the Vancouver-to-Seattle corridor
0
0 200 KM
200 Miles
-17%
-92%
Totalcosts
CO2eemissions
Battery electric truck
Hamilton ¨ WoodstockDistance: 79 kmDiesel price: $1.14/literElectricity: $0.139/kWh
QUEBEC
ONTARIO
Figure 15. Difference between battery electric and diesel trucks in costs and CO2e emissions for the Hamilton-to-Woodstock

ZERO-EMISSION TRACTOR-TRAILERS IN CANADA
16 INTERNATIONAL COUNCIL ON CLEAN TRANSPORTATION WORKING PAPER 2019-04
References(S&T) Squared Consultants Inc. (2019). GHGenius. 5.0c.
BP (2018). BP Statistical Review of World Energy June 2018.
Bureau of Labor Statistics. (2019). “Consumer Price Index.” Retrieved January 19, 2019, from https://stats.bls.gov/cpi/#tables.
California Air Resources Board. (2018, December 31). “LCFS Pathway Certified Carbon Intensities.” Retrieved January 19, 2019, from https://www.arb.ca.gov/fuels/lcfs/fuelpathways/pathwaytable.htm.
CalStart (2014). E-Truck Performance in Cold Weather. Pasadena, CA.
Cano, Z. P., D. Banham, S. Ye, A. Hintennach, J. Lu, M. Fowler and Z. Chen (2018). “Batteries and fuel cells for emerging electric vehicle markets.” Nature Energy 3(4): 279.
Cheminfo Services Inc. and the North American Council for Freight Efficiency (2017). Heavy-Duty Vehicle Tire Market Analysis Study. Ottawa, ON, Transport Canada.
Christenson, M., A. Loiselle-Lapointe, I. Whittal and N. Meyer (2014). Impact of Mileage Accumulation, Vehicle Aging, Cold Ambient Temperature, and Driving Style on Range and Energy Consumption of Two Japanese Battery Electric Passenger Vehicles. 2nd International Electric Vehicle Technology & Automobile Power Electronics Japan Conference. Yokohama, Japan.
Claflin, B. (2017, August 29). “5 Cool Things About Our Electric Powertrain Concept Truck.” Retrieved January 21, 2019, from https://www.cummins.com/news/2017/08/29/5-cool-things-about-our-electric-powertrain-concept-truck.
Daimler Trucks North America LLC. (2019). “Leading the Charge: e-Mobility.” Retrieved January 21, 2019, from https://freightliner.com/e-mobility/.
Delgado, O. and N. Lutsey (2015). Advanced Tractor-Trailer Efficiency Technology Potential in the 2020-2030 Timeframe. Washington, DC, The International Council on Clean Transportation.
Environment and Climate Change Canada (2018). National Inventory Report 1990 - 2016: Greenhouse Gas Sources and Sinks in Canada (Part 3). Ottawa, ON, United Nations Framework Convention on Climate Change.
Eudy, L. and M. Post (2018). Fuel Cell Buses in U.S. Transit Fleets: Current Status 2018 Golden, CO, National Renewable Energy Laboratory.
EVANNEX. (2019). “Battery Expert: Tesla Model 3 has ‘most advanced large scale lithium battery ever produced’.” Retrieved January 20, 2019, from https://evannex.com/blogs/news/tesla-s-battery-pack-is-both-mysterious-and-alluring-work-in-progress.
Fulton, L. and M. Miller (2015). Strategies for Transitioning to Low-Carbon Emission Trucks in the United States. Davis, CA, Institute of Transportation Studies - Davis.
Hydro-Québec (2018). Comparison of Electricity Prices in Major North American Cities. Montreal, QC.
InsideEVs.com. (2019). “The Four Model 3 Motors that Power the Tesla Semi.” Retrieved January 20, 2019, from https://insideevs.com/four-model-3-motors-power-tesla-semi/.
International Council on Clean Transportation. (2019). “Roadmap model baseline results (August 2017).” Retrieved January 7, 2019, from https://www.theicct.org/transportation-roadmap.
International Energy Agency (2017). World Energy Outlook 2017. Paris, France.
Loiselle-Lapointe, A., A. Conde and H. Ribberink (2015). “Chevrolet Volt On-Road Test Programs in Canada Part 1: Effects of Drive Cycle, Ambient Temperature and Accessory Usage on Energy Consumption and Electric Range.” World Electric Vehicle Journal 7(1): 142-153.
Loiselle-Lapointe, A., S. Pedroso, M. Gennaro, E. Paffumi, M. Christenson and M. Safoutin (2018). Impacts of Mileage Accumulation and Fast Charging on EV Range and Energy Usage. The 31st International Electric Vehicles Symposium & Exhibition (EVS 31) & International Electric Vehicle Technology Conference 2018 (EVTeC 2018). Kobe, Japan.
Mapchart.net. (2019). “Canada.” Retrieved January 18, 2019, from https://mapchart.net/canada.html.
Motor Trend. (2017, July 29). “Exclusive: Tesla Model 3 First Drive Review.” Retrieved January 20, 2019, from https://www.motortrend.com/cars/tesla/model-3/2018/exclusive-tesla-model-3-first-drive-review/.
Moultak, M., N. Lutsey and D. Hall (2017). Transitioning to zero-emission heavy-duty freight vehicles. Washington, DC, The International Council on Clean Transportation.
National Energy Board. (2017, October 25). “Reference Case: Electricity Generation - Primary Fuel (GWh).” Retrieved January 19, 2019, from https://apps.neb-one.gc.ca/ftrppndc/dflt.aspx?GoCTemplateCulture=en-CA.
National Research Council and National Academy of Engineering (2004). The Hydrogen Economy: Opportunities, Costs, Barriers, and R&D Needs. Washington, DC.
Natural Resources Canada. (2019, January 18). “Average Retail Prices for Diesel in 2019.” Retrieved January, 2019, from http://www2.nrcan.gc.ca/eneene/sources/pripri/prices_bycity_e.cfm?productID=5&locationID=26&locationID=28&locationID=29&locationID=17&locationID=2&locationID=81&frequency=D&priceYear=2019&Redisplay=.
Nikola Corporation. (2016, December 1). “Nikola One Truck Revealed Tonight at 7:00 PM MST.” Retrieved January 22, 2019, from https://nikolamotor.com/press_releases/nikola-one-truck-revealed-tonight-700-p-m-mst-32.

ZERO-EMISSION TRACTOR-TRAILERS IN CANADA
WORKING PAPER 2019-04 INTERNATIONAL COUNCIL ON CLEAN TRANSPORTATION 17
Taggart, J. (2017). Ambient temperature impacts on real-world electric vehicle efficiency and range. IEEE Transportation Electrification Conference and Expo (ITEC). Chicago, IL.
Tesla. (2019). “Tesla Semi.” Retrieved January 20, 2019, from https://www.tesla.com/semi.
Teslarati. (2013, July 19). “Tesla Model S Weight Distribution.” Retrieved January 20, 2019, from https://www.teslarati.com/tesla-model-s-weight/.
Thor Trucks Inc. (2019). “ET-One.” Retrieved January 22, 2019, from https://www.thortrucks.com/et-one/.
U.S. Department of Energy: Office of Energy Efficiency and Renewable Energy (2016). Alternative Fuel Price Report. Washington, DC, Clean Cities.
U.S. Department of Energy: Office of Energy Efficiency and Renewable Energy. (2019). “Class 8 Truck Tractor Weight by Component.” Retrieved January 20, 2019, from https://www.energy.gov/eere/vehicles/fact-620-april-26-2010-class-8-truck-tractor-weight-component.
U.S. Energy Information Administration. (2017). “Annual Energy Outlook 2017. Electricity: End-Use Prices: Transportation.” Retrieved January 19, 2019, from https://www.eia.gov/outlooks/aeo/data/browser/#/?id=8-AEO2017®ion=0-0&cases=ref2017&start=2015&end=2050&f=A&linechart=~~~ref2017-d120816a.63-8-AEO2017&map=&ctype=linechart&sid=ref2017-d120816a.63-8-AEO2017&sourcekey=0.
U.S. Energy Information Administration. (2017). “Annual Energy Outlook 2017. Natural Gas: Use by Sector: Transportation.” Retrieved January 19, 2019, from https://www.eia.gov/outlooks/aeo/data/browser/#/?id=13-AEO2017®ion=0-0&cases=ref2017&start=2015&end=2050&f=A&linechart=~ref2017-d120816a.19-13-AEO2017&map=&ctype=linechart&sid=ref2017-d120816a.63-8-AEO2017&sourcekey=0.
UChicago Argonne LLC. (2019). “Welcome to Autonomie.” Retrieved February 5, 2019, from http://www.autonomie.net/.
USForex Inc. (2019). “Average annual exchange rate (2018): USD to CAD.” Retrieved January 19, 2019, from https://www.ofx.com/en-us/forex-news/historical-exchange-rates/monthly-average-rates/.
Visnic, B. (2018, July 31). “Toyota launches second-gen fuel-cell Class 8.” Retrieved January 30, 2019, from https://www.sae.org/news/2018/07/toyota-project-portal-2.0-reveal.