supplementary figure 1. a-c) tem and (d-f) sem images … figure 2. hrtem images of different parts...
TRANSCRIPT

Supplementary Figure 1. (a-c) TEM and (d-f) SEM images of different individual pentacle
nanocrystals prepared through the standard procedure.

Supplementary Figure 2. HRTEM images of different parts of an individual pentacle
nanocrystal prepared through the standard procedure. The scale bars in all images are 2 nm.

Supplementary Figure 3. XRD pattern of the pentacle Au-Cu alloy nanocrystals prepared
through the standard procedure.

Supplementary Figure 4. EDX spectrum of pentacle Au-Cu alloy nanocrystals prepared
through the standard procedure. Mo came from the grid of STEM.

Supplementary Figure 5. TEM images of Au-Cu alloy nanocrystals obtained at different
reaction time points in the standard synthetic procedure: (a) 8 min, (b) 12 min, (c) 20 min, and (d)
30 min.

Supplementary Figure 6. (a,b) TEM images of the products obtained under the standard
condition except that different amounts of HDA were used: (a) 30 mg and (b) 90 mg. (c,d) TEM
images of the products obtained with the reaction allowed to proceed under the standard
condition except using (c) DDA and (d) ODA as the capping agent instead, respectively.

Supplementary Figure 7. TEM images of the products obtained under the standard reaction
condition except for using different amounts of glucose: (a) 35 μL and (b) 1 mL.
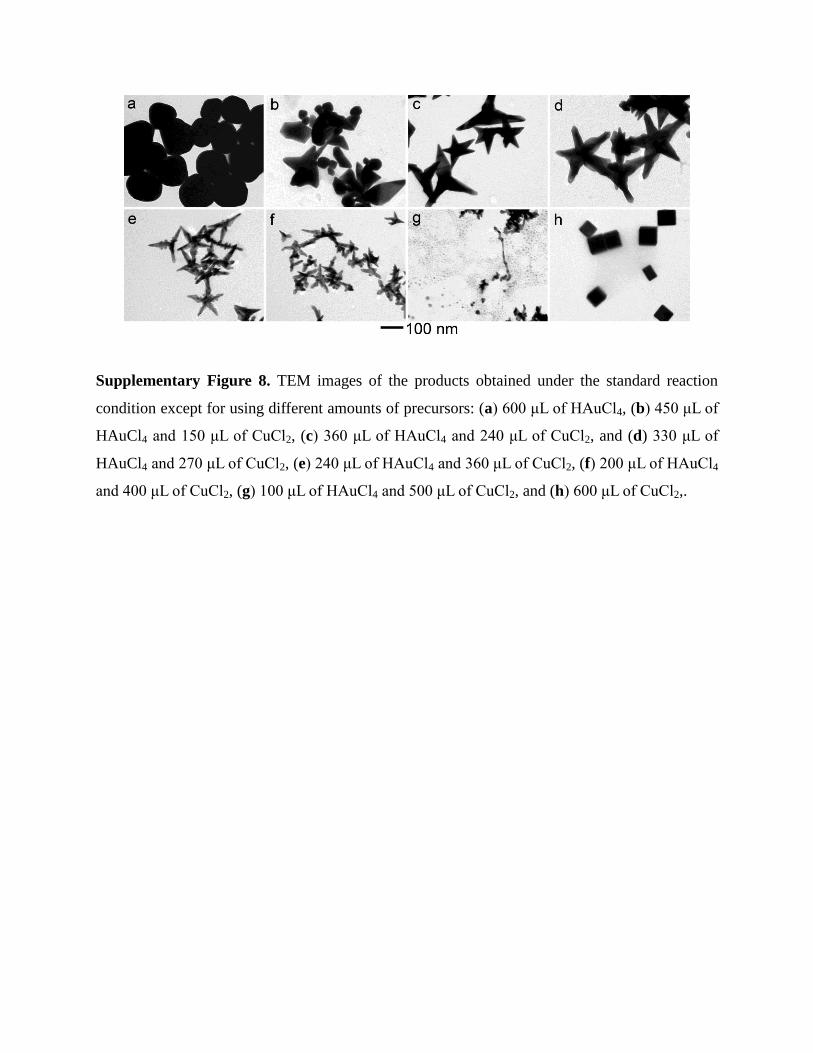
Supplementary Figure 8. TEM images of the products obtained under the standard reaction
condition except for using different amounts of precursors: (a) 600 μL of HAuCl4, (b) 450 μL of
HAuCl4 and 150 μL of CuCl2, (c) 360 μL of HAuCl4 and 240 μL of CuCl2, and (d) 330 μL of
HAuCl4 and 270 μL of CuCl2, (e) 240 μL of HAuCl4 and 360 μL of CuCl2, (f) 200 μL of HAuCl4
and 400 μL of CuCl2, (g) 100 μL of HAuCl4 and 500 μL of CuCl2, and (h) 600 μL of CuCl2,.

Supplementary Figure 9. HRTEM images of the branches of (a) 45-nm and (b) 100-nm
pentacle Au-Cu alloy nanocrytals, clearly illustrating the stepped edges. We have partially
assigned the indices of high-index facets in both images.

Supplementary Figure 10. (a) STEM image of a typical 45-nm pentacle Au-Cu bimetallic
nanocrystal. (b,c) STEM-EDX elemental mapping images of (b) Cu and (c) Au of the
nanocrystal in a. (d) The merged image of a, b, and c. (e,f) Line-scanning profiles recorded of
the 45-nm pentacle nanocrystal along two different directions marked by orange lines in a.

Supplementary Figure 11. (a-c) Micrographs corresponding to (a) 0, (b) 6, and (c) 10 min of
irradiation in photothermal therapy. Dead cells were stained with propidium iodide. Scale bars,
50 µm.

Supplementary Figure 12. IR thermal images of a 4T1 tumor-bearing mouse exposed to the 808
nm NIR laser at the power density of 1 W·cm-2
, recorded at different time points with (lower
panel) and without (upper panel) injection of 70-nm pentacle Au-Cu nanocrystals (30 μL of 1
mg·mL-1
solution for each mouse).
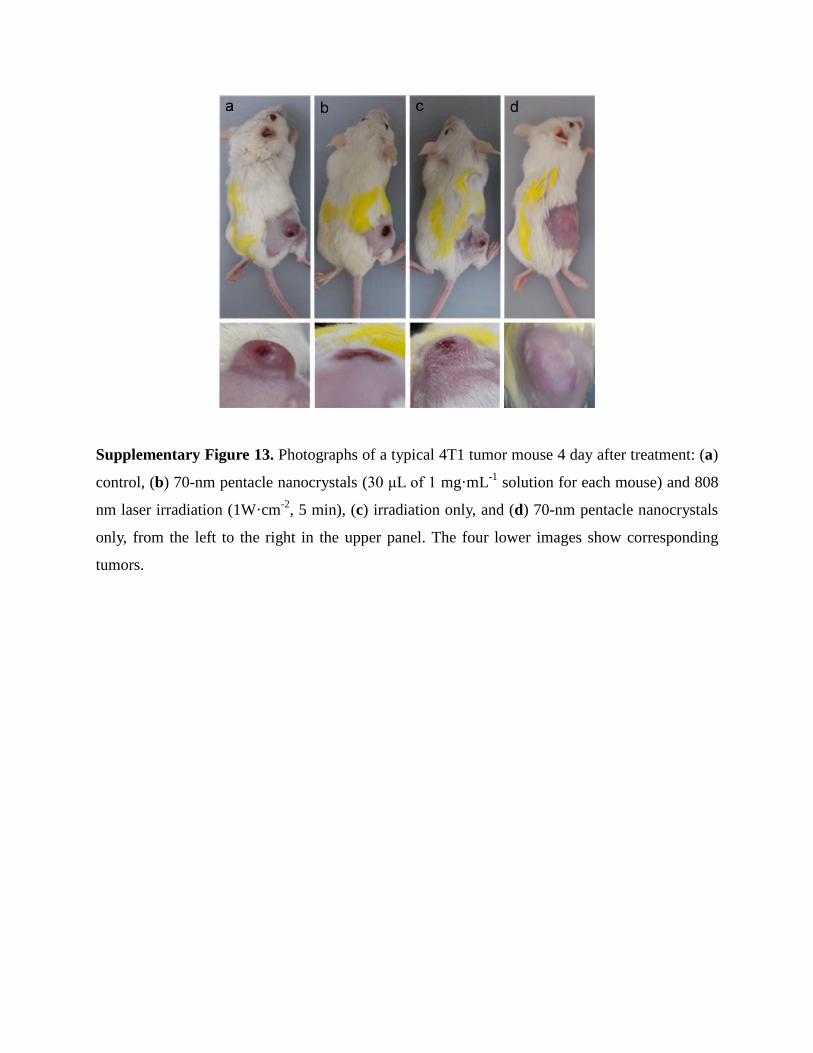
Supplementary Figure 13. Photographs of a typical 4T1 tumor mouse 4 day after treatment: (a)
control, (b) 70-nm pentacle nanocrystals (30 μL of 1 mg·mL-1
solution for each mouse) and 808
nm laser irradiation (1W·cm-2
, 5 min), (c) irradiation only, and (d) 70-nm pentacle nanocrystals
only, from the left to the right in the upper panel. The four lower images show corresponding
tumors.

Supplementary Figure 14. H&E stained tumor sections collected from (a) control, (b)
irradiation only, (c) 70-nm pentacle nanocrystals only, and (d) 70-nm pentacle nanocrystals +
irradiation groups of mice 4 days post treatment. Scale bars, 100 µm.

Supplementary Figure 15. H&E stained images of major organs from control mice (upper panel)
and pentacle Au-Cu nanocrystals treated (lower panel) mice at day 1. No noticeable abnormality
was observed. The scale bar in the first image is 100 μm, which applies to all the images.

Supplementary Figure 16. Thermal profiling corresponding to the group of mice with
intravenous injection of PEGylated pentacle nanocrystals (red) and the control group (black).
Error bars are based on standard deviations of 3 mice per group.

Supplementary Figure 17. TEM images of conventional (a) 5-nm and (b) 50-nm Au
nanoparticles.

Supplementary Figure 18. The schematic models of a pentacle nanocrystal viewed from
different angles.

Supplementary Figure 19. Plots of the apparent rate constants (kapp) as a function of the surface
concentration (S), relating to the use of different types of Au-Cu bimetallic nanocrystals as
catalysts for the reduction of p-nitrophenol into p-aminophenol by NaBH4.

Supplementary Table 1. ICP-AES data of samples obtained at different reaction time points in
the standard procedure.
Samples shown in
Figure S5a Figure S5b Figure S5c Figure S5d
Reaction time 8 min 12 min 20 min 30 min
Au 95.3% 90.8% 88.3% 87.4%
Cu 4.7% 9.2% 11.7% 12.6%