supplementary materials and methods -...
TRANSCRIPT
Supplementary Materials and Methods 1
Germ cell isolation and flow cytometry 2
Mice heterozygous for the Dnmt3ltm1Enls mutant allele (Hata et al., 2002) were 3
intercrossed to generate Dnmt3l KO pups and littermate controls. Five postnatal mice 4
of the same genotype were used for each experiment. Seminiferous tubules were 5
treated with collagenase IV and DNase I to remove interstitial Leydig cells and 6
peritubular myoid cells, followed by trypsin digestion to generate cell suspensions 7
(Ogawa et al., 1997). THY1+ cells were isolated by magnetic-activated cell sorting 8
(MACS) (Miltenyi Biotec, Auburn, CA, USA), following the manufacturer's 9
instructions. Briefly, the dispersed testicular cells were placed in the MACS buffer 10
and incubated with a biotin-conjugated anti-CD90.2 (THY1) antibody (Lot 25136 and 11
Lot 80806, BD Pharmingen, San Diego, CA, USA) at 4°C for 10 min. After being 12
washed, the cells were resuspended and labeled with anti-biotin microbeads (Miltenyi 13
Biotec) at 4°C for 15 min and placed in collection tubes for isolation. The isolation 14
processes were done within 5 hours to maximize the living cells. A 15
PE-Cy5-conjugated anti-CD49f antibody (BD Pharmingen) was used for the SPC 16
population analysis. The date of birth for timed postnatal mice was defined as 0 dpp. 17
18
Immunohistochemistry 19
Development | Supplementary Material
Mouse testes were fixed with 4% paraformaldehyde (PFA), transferred into 20
sucrose gradients for dehydration, embedded in OCT compound (Tissue-Tek O.C.T. 21
Compound, Sakura, CA, U.S.A.), and cut into 8-µm-thick sections. The sections were 22
blocked with 10% goat serum before incubation with primary antibodies, anti-PLZF 23
(sc-22839; Santa Cruz Biotechnology, Santa Cruz, CA, USA) and anti-H3K9me3 24
(ab8898; Abcam, Cambridge, MA, USA). For whole-mount staining, seminiferous 25
tubules were digested with collagenase IV and fixed in 4% PFA. Tissues were washed 26
with PBS, treated with 0.5% Triton X-100 in PBS, and blocked in 10% goat serum 27
with 2% BSA. After incubation with the primary antibody, anti-PLZF (sc-22839; 28
Santa Cruz Biotechnology), sections and tubules were incubated with secondary 29
antibodies, stained with Hoechst33342 (Sigma, St. Louis, MO, USA), and mounted 30
with a mounting medium (P36934, Invitrogen, Carlsbad, CA, USA). 31
The specificity of the PLZF antibody was evaluated using testes from wild-type 32
and homozygous luxoid (Plzflu/lu) mice at 8 dpp (Buaas et al., 2004) (see Fig. S10 in 33
supplementary material). 34
35
Immunocytochemistry 36
The isolated THY1+ cells were placed onto poly-L-lysine slides (Thermo 37
Scientific, Waltham, MA, USA) and fixed in 4% PFA at 4°C overnight. After being 38
Development | Supplementary Material
washed with PBST, the slides were blocked with 10% serum plus 1% bovine serum 39
albumin (BSA) for 1 hour at room temperature and incubated at 4°C overnight with 40
the following primary antibodies: anti-PLZF (sc-28319; Santa Cruz Biotechnology), 41
anti-H3K9me3 (ab8898; Abcam), and anti-Ki67 (ab15580; Abcam). After incubation 42
with secondary antibodies, the slides were counterstained with Hoechst 33342 and 43
mounted with a mounting medium (P36934, Invitrogen). Approximately 100 cells 44
were scored for each independent experiment. The slides were analyzed using a Leica 45
TCS SP5 II confocal microscope. 46
47
Quantitative reverse transcription PCR 48
Reverse transcription reactions were performed using the SuperScript 49
First-Strand Synthesis System (Invitrogen). qPCR was performed in a Roche Light 50
Cycler® 480II using SYBR Green PCR master mix. The primers used are listed in 51
Table S1 of the supplementary material. Hprt1 was used as an internal standard. 52
53
Western Blotting for anti-DNMT3L signal detection 54
Please note that the following extended protocol is necessary for detecting 55
DNMT3L from THY1+ SPCs as there are strong non-specific signals with similar 56
molecular weight to DNMT3L in this cell type. Regular western protocol is applicable 57
Development | Supplementary Material
to embryonic stem cells or embryonic testes. To detect DNMT3L signal in SPCs 58
using Western blotting, 15 to 20 µg total proteins were loaded per gel well. The 10% 59
polyacrylamide gels were electrophoresed at 60 V, 30 minutes (min) and at 100 V, 2.5 60
hours (hr) in order to separate the non-specific signals near the real anti-DNMT3L 61
signal at ~50 KDa. After gel-membrane transfer, the PVDF membrane was blocked 62
with Bløk-PO (WBAVDP001, Millipore) for 2 hr at room temperature and then 63
moved to 4°C overnight with gentle rocking. The membranes were then transferred to 64
a new blocking solution of 5% dry milk in 1 X PBST (PBS plus 0.1% Tween-20) for 65
a second round of blocking overnight at 4°C with gentle rocking. Primary 66
anti-DNMT3L antibody (from Prof. Xiaodong Cheng and CST #13451, Lot 1) was 67
diluted in the Bløk-PO solution (a dilution of 1:1000) and incubated 68
with membranes for 1 hr at room temperature under agitation. We then washed the 69
membranes with 1 X PBST six times for 10 min each time with gentle rocking and 70
incubated them in diluted HRP-conjugated secondary antibodies (a dilution of 1:5000 71
in Bløk-PO solution) for 1 hr at room temperature under agitation. 72
The membranes were washed with PBST six times for 10 min each time with gentle 73
rocking to reduce background. Signals were detected using the Immobilon Western 74
Chemiluminescent HRP Substrate (ECL) (Millipore). 75
76
Development | Supplementary Material
DNA extraction and bisulfite sequencing 77
Genomic DNA was extracted from THY1+ cells using a DNeasy Blood and 78
Tissue kit (#69504, Qiagen, Valencia, CA, USA). The isolated genomic DNA 79
underwent bisulfite treatment using an EZ DNA methylation kit (Zymo Research, 80
Orange, CA). The PCR products were purified and cloned for subsequent sequencing 81
using a pGEM-T Easy kit (Promega, Madison, WI, USA). 82
83
CD49f+GSC culture, transfection, and luciferase assay 84
DNA segments of the Cdk2 promoter were amplified and purified using a gel 85
extraction kit (Qiagen). The amplified products were cloned into the pGL4.17 vector 86
(Promega) to generate promoter reporter plasmids. We replaced the “CGGA” ETS1 87
binding site (EBS) sequence (-674 to -670) of the Cdk2 promoter to ATTG, in order 88
to validate its importance to Cdk2 expression in germ cells. 89
Mouse AP+ GSCs were derived from newborn testes as previously described 90
(Huang et al., 2009). Briefly, newborn testes (0~2 dpp) were collected and washed in 91
Hank’s buffer (Gibco) containing penicillin (100 units/ml) and streptomycin (100 92
µg/ml). The testes were digested in 0.1% protease type XIV (Sigma)/MCDB-201 93
medium (Sigma) at 4°C overnight, transferred to SMEM medium (Sigma) containing 94
10% fetal calf serum (FCS) for enzyme inhibition, and filtered through a 70-µm nylon 95
Development | Supplementary Material
cell strainer. The cells were incubated with a PE-Cy5-conjugated anti-CD49f antibody 96
(BD Pharmingen) for 1 h on ice and then with anti-PE rat anti-mouse IgM-conjugated 97
magnetic Dynabeads (4 beads/cell: Dynal, Oslo, Norway) for 40 min at 4°C. The 98
CD49f+ GSCs were isolated via MACS (Miltenyi Biotec). Cell electroporation was 99
performed using an electroporator at 250 volts for 3 0.1-ms pulses at a spacing of 250 100
ms. The electroporated cells were seeded onto a laminin-coated plate at a density of 8 101
× 104 cells/cm2 and cultured in serum-free basic culture medium composed of 102
MCDB-201 medium containing 1× insulin/transferrin/selenium and 10 ng/ml of 103
epidermal growth factor (Gibco) for 48 hours. The luciferase activity was determined 104
using the ONE-Glo Luciferase Assay System (Promega) and was recorded with a 105
Berthold LB 960 Centro microplate luminometer (Berthold Technologies, Bad 106
Wilbad, Germany). The values were normalized to the values obtained in cells 107
transfected with an empty vector (pGL4.17). 108
109
RNA Sequencing and bioinformatics analysis 110
Total RNA for the library preparation, sequencing, and RNA-Seq analysis was 111
extracted using TRI Reagent (Ambion, Austin, TX, USA). The RNA concentration 112
and quality were determined using a NanoDrop ND-1000 spectrophotometer (Thermo 113
Scientific) and an Agilent 2100 Bioanalyzer (Agilent Technologies, Palo Alto, CA). 114
Development | Supplementary Material
Poly-T oligo-attached magnetic beads were used to purify 2 µg RNA, and the mRNA 115
was fragmented into small pieces using divalent cations at an elevated temperature. 116
The cleaved mRNA fragments were copied into first-strand cDNA using reverse 117
transcriptase and random primers, followed by second-strand cDNA synthesis using 118
DNA polymerase I and RNase H. These cDNA fragments underwent end-repair, a 119
single A base addition, and adapter ligation. The products were then purified and 120
enriched using PCR to create the final cDNA library. Paired-end 100-nucleotide reads 121
from each mRNA library were obtained using HiScanSQ (Illumina Inc., CIC 122
bioGUNE, Bilbao, Spain). 123
TopHat and Cufflinks, proposed by Trapnell et al., were used for the gene 124
discovery and comprehensive expression analysis (Trapnell et al., 2012; Kim et al., 125
2013; Trapnell et al., 2013). We applied the Tuxedo protocol with two popular tools. 126
Short sequencing reads were aligned against the mm10 reference sequence using 127
TopHat. The mapped reads were provided as input to Cufflinks for transcript 128
fragment assembly. After the assembly, we employed Cuffdiff to identify 129
differentially expressed genes and transcripts. The statistical significance was filtered 130
using the selection criterion of a 2-fold difference from the corresponding genes. To 131
specifically explore repeat elements in the genes, we retrieved the mouse gene 132
annotation associated with repeat information from the University of California Santa 133
Development | Supplementary Material
Cruz (UCSC) Table Browser (Karolchik et al., 2004) and utilized BEDTools (Quinlan 134
and Hall, 2010) to quantify the numbers of repeat elements in the reads. The gene 135
ontology (GO) and pathway analyses were performed using Panther software (Mi et 136
al., 2013) and the Kyoto Encyclopedia of Genes and Genomes (KEGG) pathway 137
database (Kanehisa and Goto, 2000). The sequences have been deposited in the NCBI 138
GEO database and are available under accession number GSE54411. AW, wild-type 139
and AD, Dnmt3l KO. 140
Development | Supplementary Material
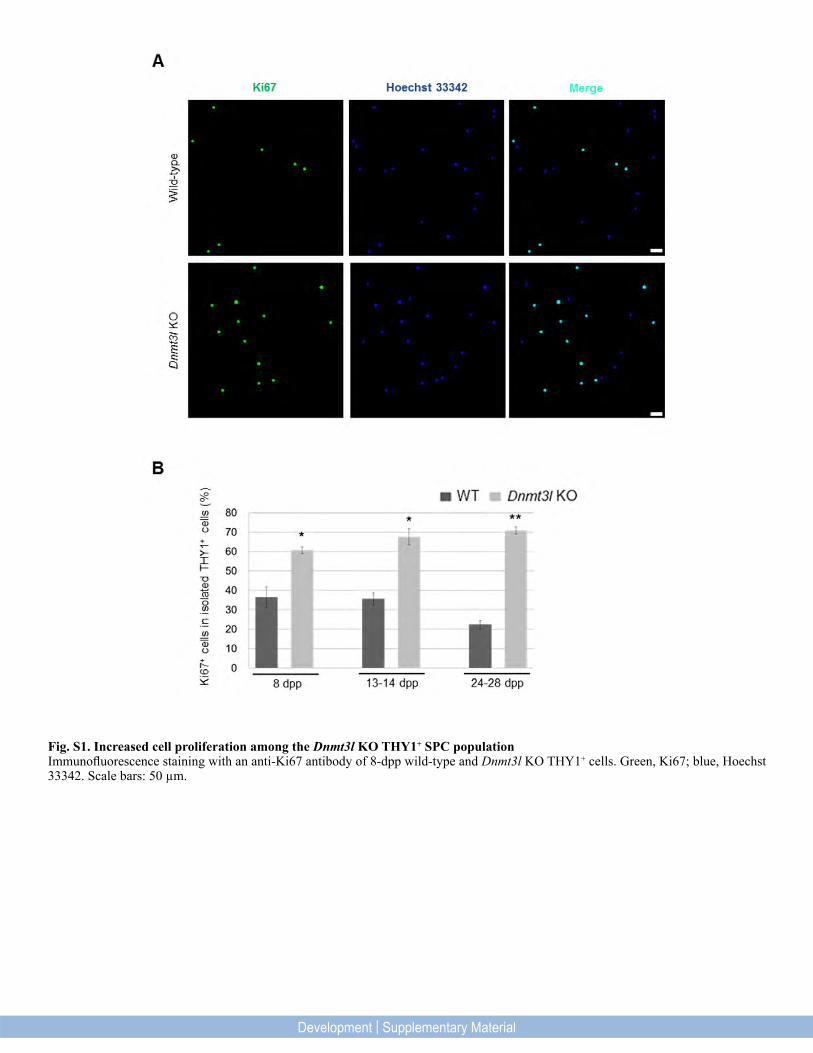
Fig. S1. Increased cell proliferation among the Dnmt3l KO THY1+ SPC populationImmunofluorescence staining with an anti-Ki67 antibody of 8-dpp wild-type and Dnmt3l KO THY1+ cells. Green, Ki67; blue, Hoechst 33342. Scale bars: 50 µm.
Development | Supplementary Material
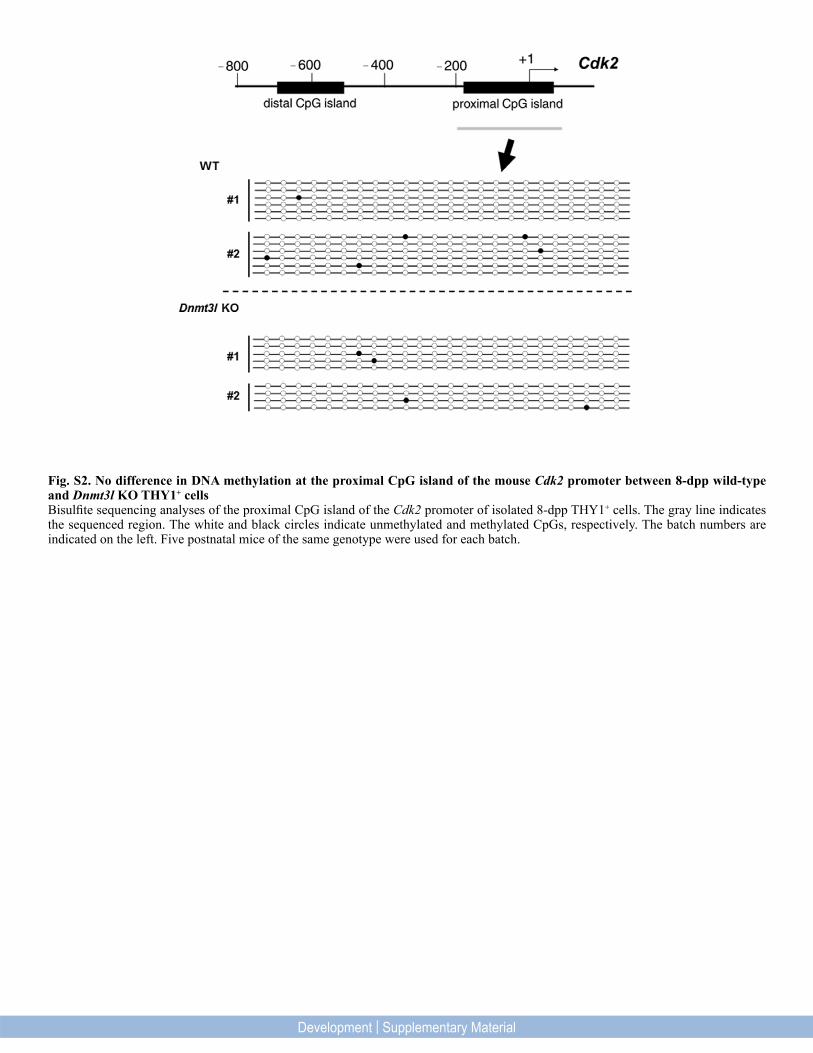
Fig. S2. No difference in DNA methylation at the proximal CpG island of the mouse Cdk2 promoter between 8-dpp wild-type and Dnmt3l KO THY1+ cellsBisulfite sequencing analyses of the proximal CpG island of the Cdk2 promoter of isolated 8-dpp THY1+ cells. The gray line indicates the sequenced region. The white and black circles indicate unmethylated and methylated CpGs, respectively. The batch numbers are indicated on the left. Five postnatal mice of the same genotype were used for each batch.
Development | Supplementary Material
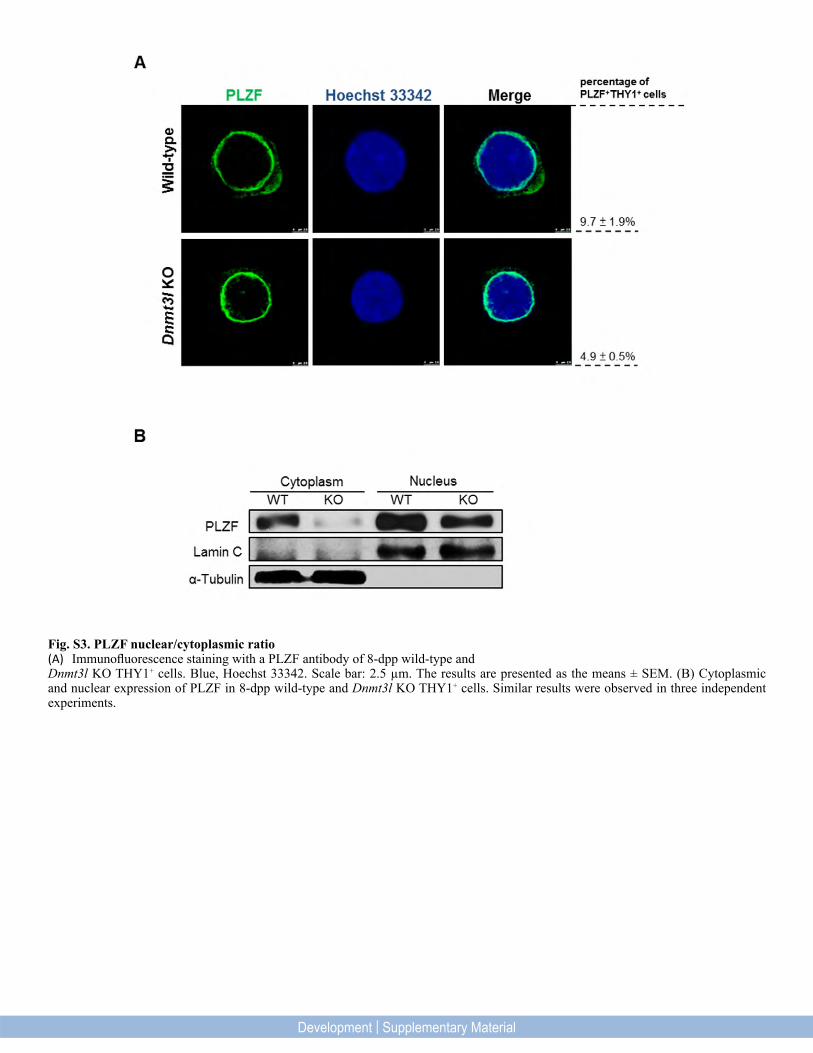
Fig. S3. PLZF nuclear/cytoplasmic ratio(A) Immunofluorescence staining with a PLZF antibody of 8-dpp wild-type andDnmt3l KO THY1+ cells. Blue, Hoechst 33342. Scale bar: 2.5 µm. The results are presented as the means ± SEM. (B) Cytoplasmic and nuclear expression of PLZF in 8-dpp wild-type and Dnmt3l KO THY1+ cells. Similar results were observed in three independent experiments.
Development | Supplementary Material
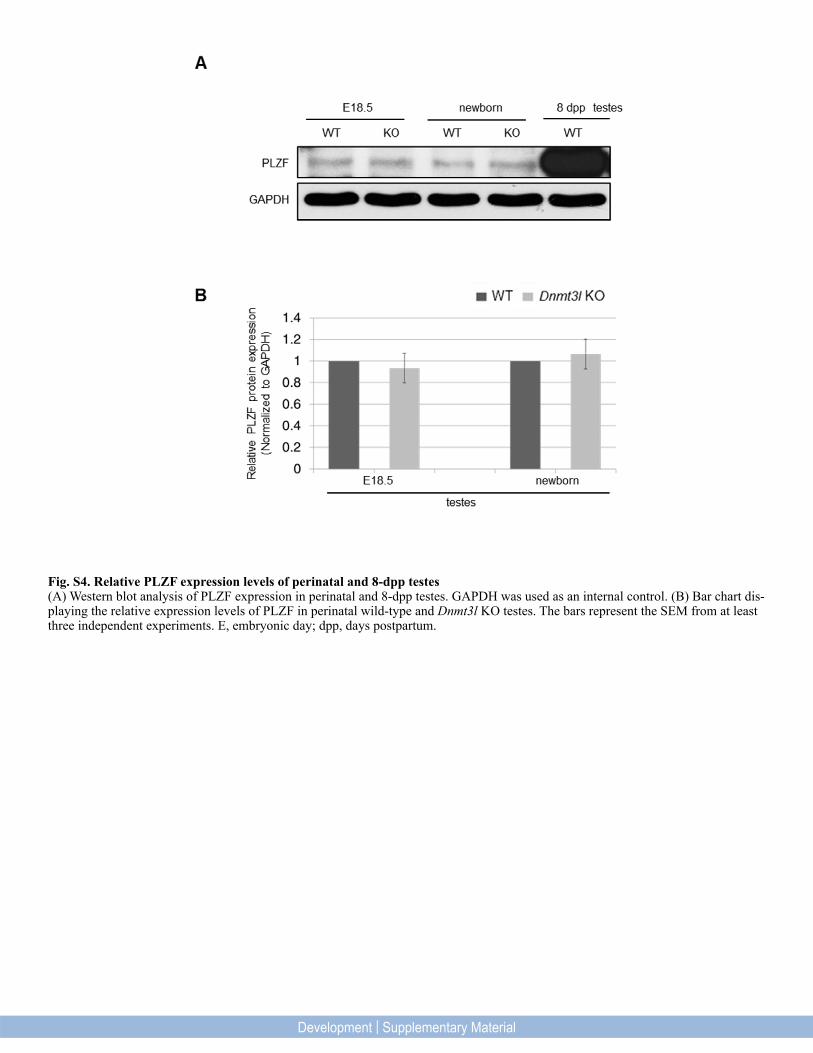
Fig. S4. Relative PLZF expression levels of perinatal and 8-dpp testes(A) Western blot analysis of PLZF expression in perinatal and 8-dpp testes. GAPDH was used as an internal control. (B) Bar chart dis-playing the relative expression levels of PLZF in perinatal wild-type and Dnmt3l KO testes. The bars represent the SEM from at least three independent experiments. E, embryonic day; dpp, days postpartum.
Development | Supplementary Material
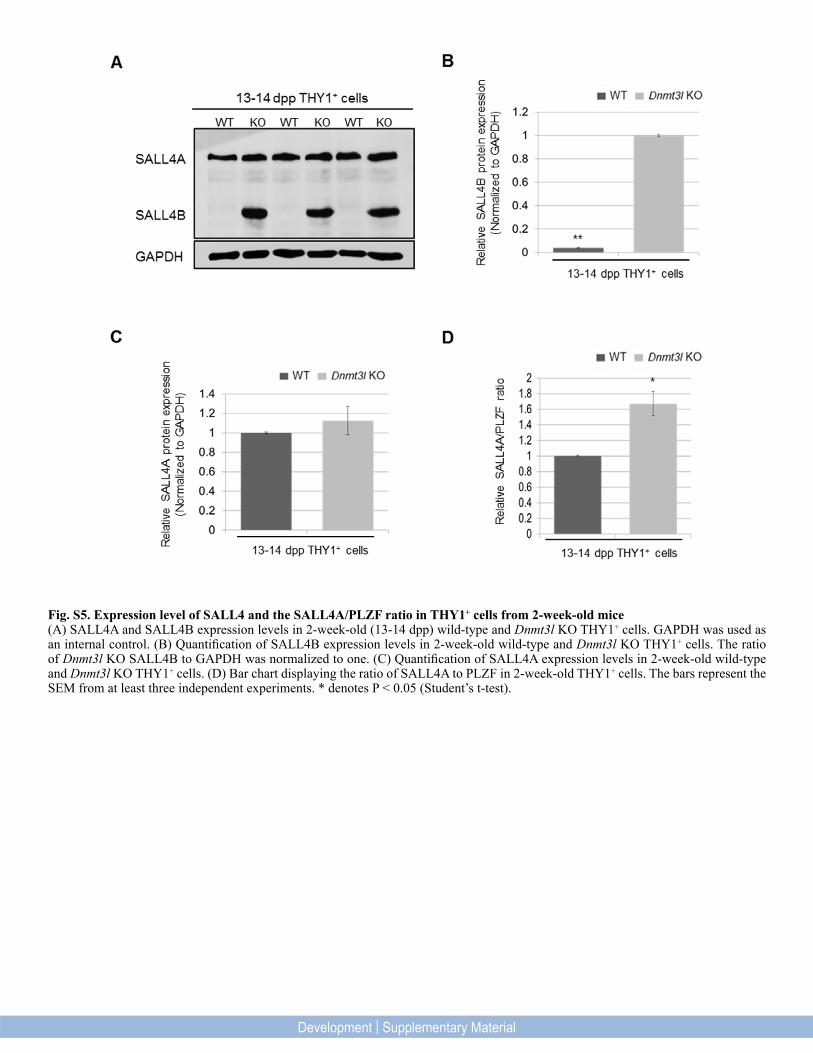
Fig. S5. Expression level of SALL4 and the SALL4A/PLZF ratio in THY1+ cells from 2-week-old mice(A) SALL4A and SALL4B expression levels in 2-week-old (13-14 dpp) wild-type and Dnmt3l KO THY1+ cells. GAPDH was used as an internal control. (B) Quantification of SALL4B expression levels in 2-week-old wild-type and Dnmt3l KO THY1+ cells. The ratio of Dnmt3l KO SALL4B to GAPDH was normalized to one. (C) Quantification of SALL4A expression levels in 2-week-old wild-type and Dnmt3l KO THY1+ cells. (D) Bar chart displaying the ratio of SALL4A to PLZF in 2-week-old THY1+ cells. The bars represent the SEM from at least three independent experiments. * denotes P < 0.05 (Student’s t-test).
Development | Supplementary Material
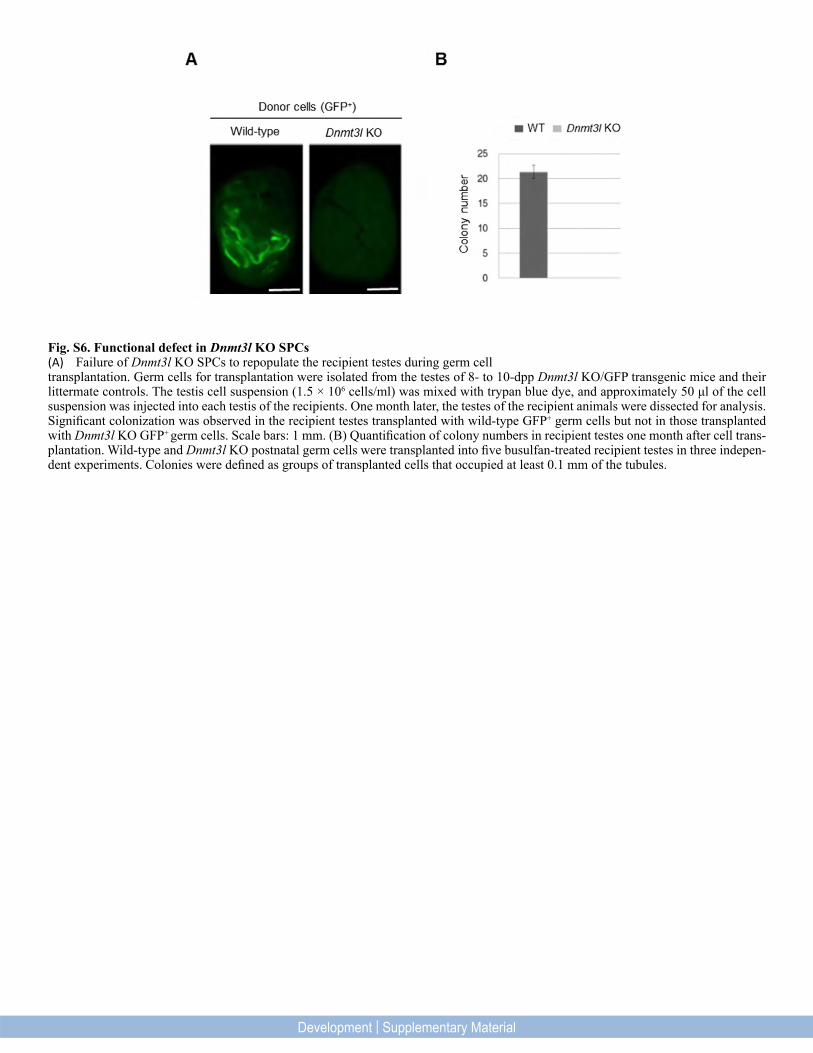
Fig. S6. Functional defect in Dnmt3l KO SPCs(A) Failure of Dnmt3l KO SPCs to repopulate the recipient testes during germ cell transplantation. Germ cells for transplantation were isolated from the testes of 8- to 10-dpp Dnmt3l KO/GFP transgenic mice and their littermate controls. The testis cell suspension (1.5 × 10⁶ cells/ml) was mixed with trypan blue dye, and approximately 50 μl of the cell suspension was injected into each testis of the recipients. One month later, the testes of the recipient animals were dissected for analysis. Significant colonization was observed in the recipient testes transplanted with wild-type GFP+ germ cells but not in those transplanted with Dnmt3l KO GFP+ germ cells. Scale bars: 1 mm. (B) Quantification of colony numbers in recipient testes one month after cell trans-plantation. Wild-type and Dnmt3l KO postnatal germ cells were transplanted into five busulfan-treated recipient testes in three indepen-dent experiments. Colonies were defined as groups of transplanted cells that occupied at least 0.1 mm of the tubules.
Development | Supplementary Material
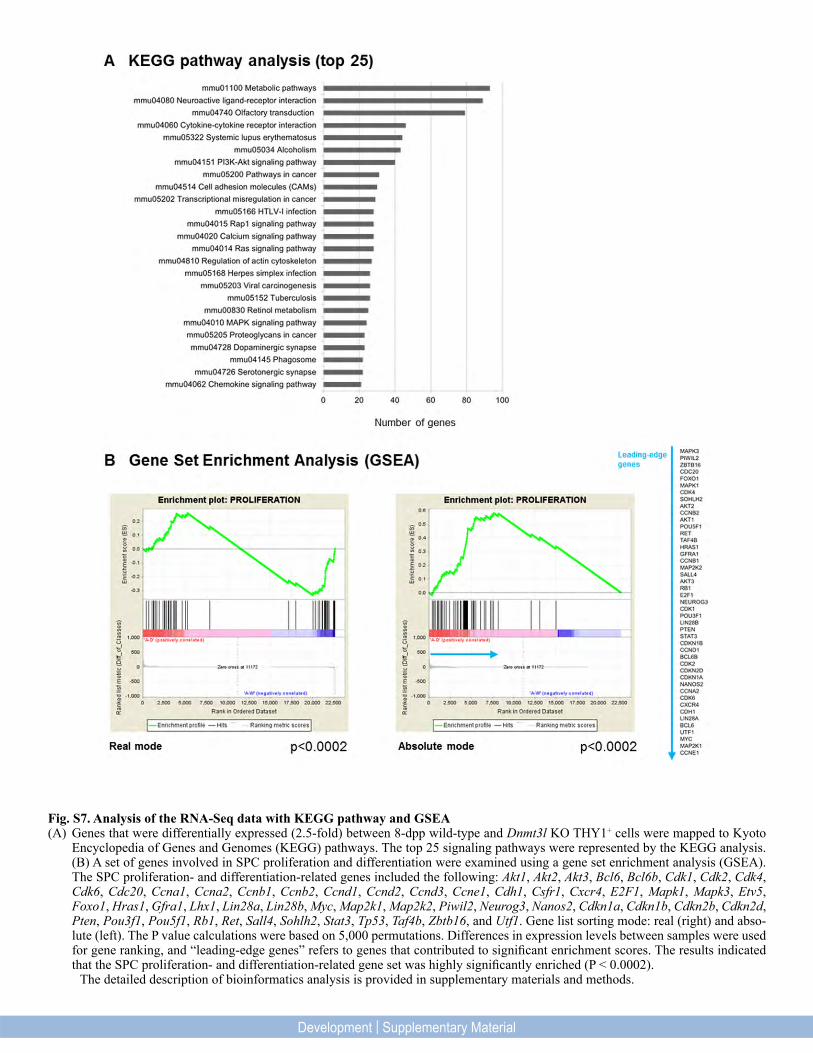
Fig. S7. Analysis of the RNA-Seq data with KEGG pathway and GSEA (A) Genes that were differentially expressed (2.5-fold) between 8-dpp wild-type and Dnmt3l KO THY1+ cells were mapped to Kyoto
Encyclopedia of Genes and Genomes (KEGG) pathways. The top 25 signaling pathways were represented by the KEGG analysis. (B) A set of genes involved in SPC proliferation and differentiation were examined using a gene set enrichment analysis (GSEA). The SPC proliferation- and differentiation-related genes included the following: Akt1, Akt2, Akt3, Bcl6, Bcl6b, Cdk1, Cdk2, Cdk4, Cdk6, Cdc20, Ccna1, Ccna2, Ccnb1, Ccnb2, Ccnd1, Ccnd2, Ccnd3, Ccne1, Cdh1, Csfr1, Cxcr4, E2F1, Mapk1, Mapk3, Etv5, Foxo1, Hras1, Gfra1, Lhx1, Lin28a, Lin28b, Myc, Map2k1, Map2k2, Piwil2, Neurog3, Nanos2, Cdkn1a, Cdkn1b, Cdkn2b, Cdkn2d, Pten, Pou3f1, Pou5f1, Rb1, Ret, Sall4, Sohlh2, Stat3, Tp53, Taf4b, Zbtb16, and Utf1. Gene list sorting mode: real (right) and abso-lute (left). The P value calculations were based on 5,000 permutations. Differences in expression levels between samples were used for gene ranking, and “leading-edge genes” refers to genes that contributed to significant enrichment scores. The results indicated that the SPC proliferation- and differentiation-related gene set was highly significantly enriched (P < 0.0002).
The detailed description of bioinformatics analysis is provided in supplementary materials and methods.
Development | Supplementary Material
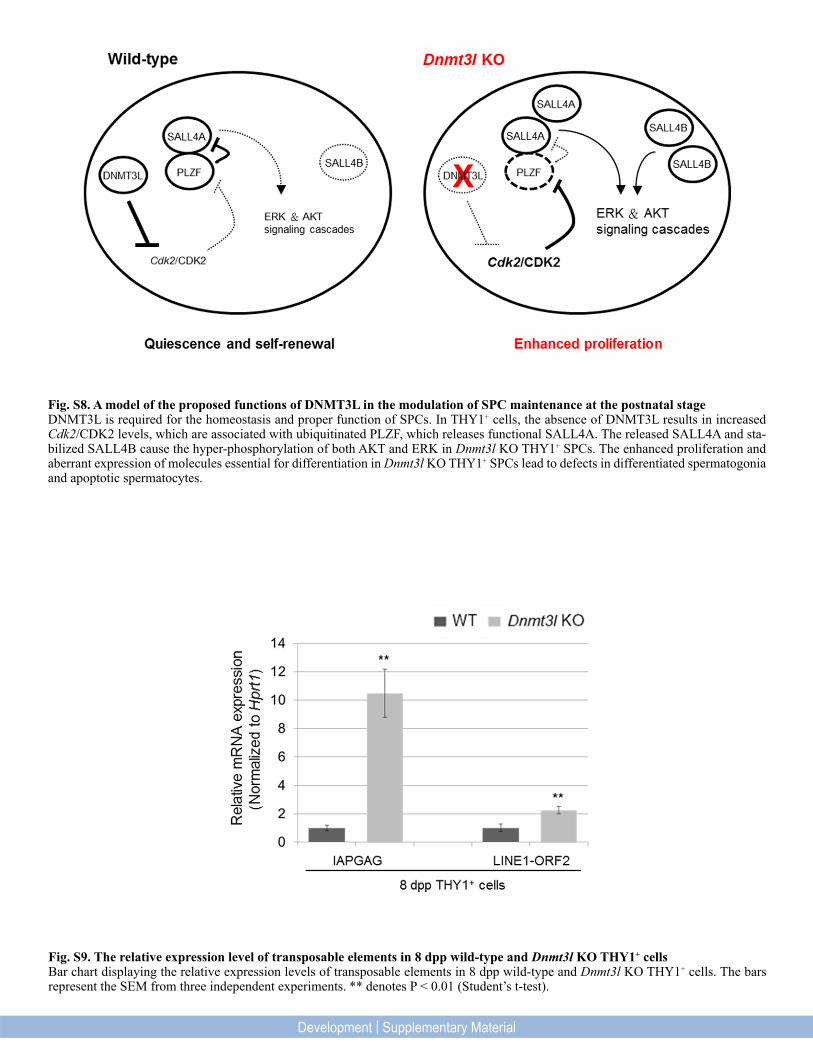
Fig. S8. A model of the proposed functions of DNMT3L in the modulation of SPC maintenance at the postnatal stage DNMT3L is required for the homeostasis and proper function of SPCs. In THY1+ cells, the absence of DNMT3L results in increased Cdk2/CDK2 levels, which are associated with ubiquitinated PLZF, which releases functional SALL4A. The released SALL4A and sta-bilized SALL4B cause the hyper-phosphorylation of both AKT and ERK in Dnmt3l KO THY1+ SPCs. The enhanced proliferation and aberrant expression of molecules essential for differentiation in Dnmt3l KO THY1+ SPCs lead to defects in differentiated spermatogonia and apoptotic spermatocytes.
Fig. S9. The relative expression level of transposable elements in 8 dpp wild-type and Dnmt3l KO THY1+ cells Bar chart displaying the relative expression levels of transposable elements in 8 dpp wild-type and Dnmt3l KO THY1+ cells. The bars represent the SEM from three independent experiments. ** denotes P < 0.01 (Student’s t-test).
Development | Supplementary Material
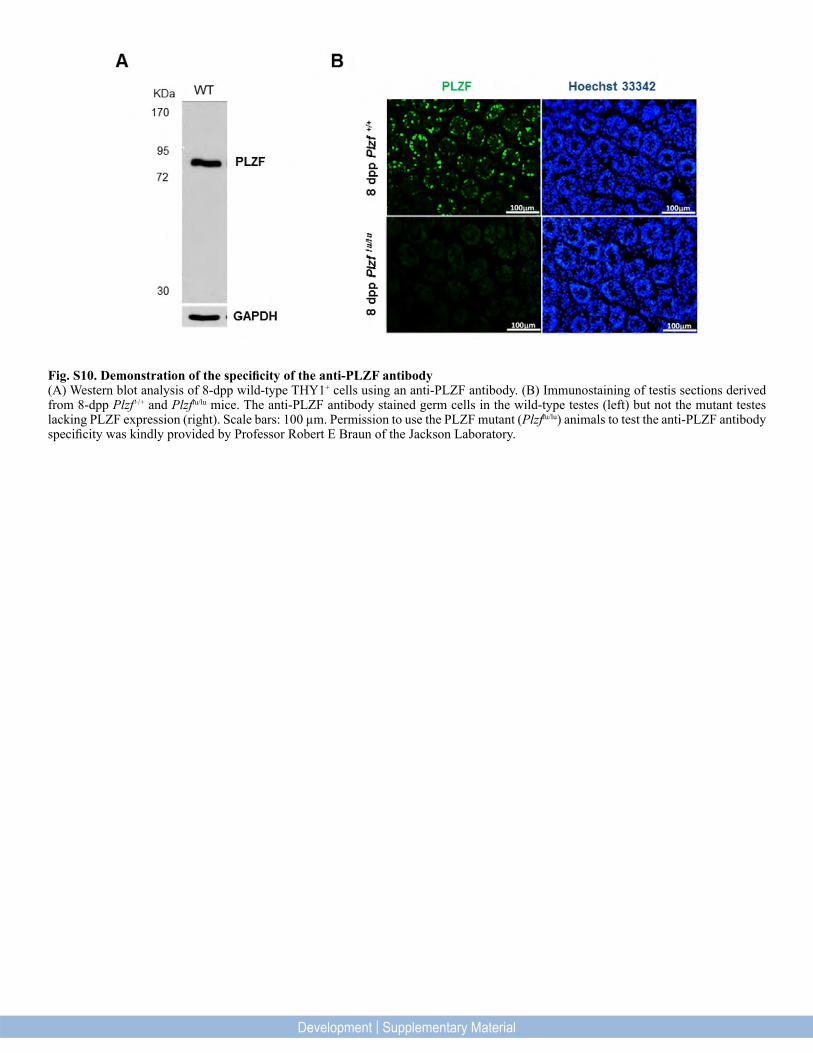
Fig. S10. Demonstration of the specificity of the anti-PLZF antibody(A) Western blot analysis of 8-dpp wild-type THY1+ cells using an anti-PLZF antibody. (B) Immunostaining of testis sections derived from 8-dpp Plzf+/+ and Plzflu/lu mice. The anti-PLZF antibody stained germ cells in the wild-type testes (left) but not the mutant testes lacking PLZF expression (right). Scale bars: 100 µm. Permission to use the PLZF mutant (Plzflu/lu) animals to test the anti-PLZF antibody specificity was kindly provided by Professor Robert E Braun of the Jackson Laboratory.
Development | Supplementary Material
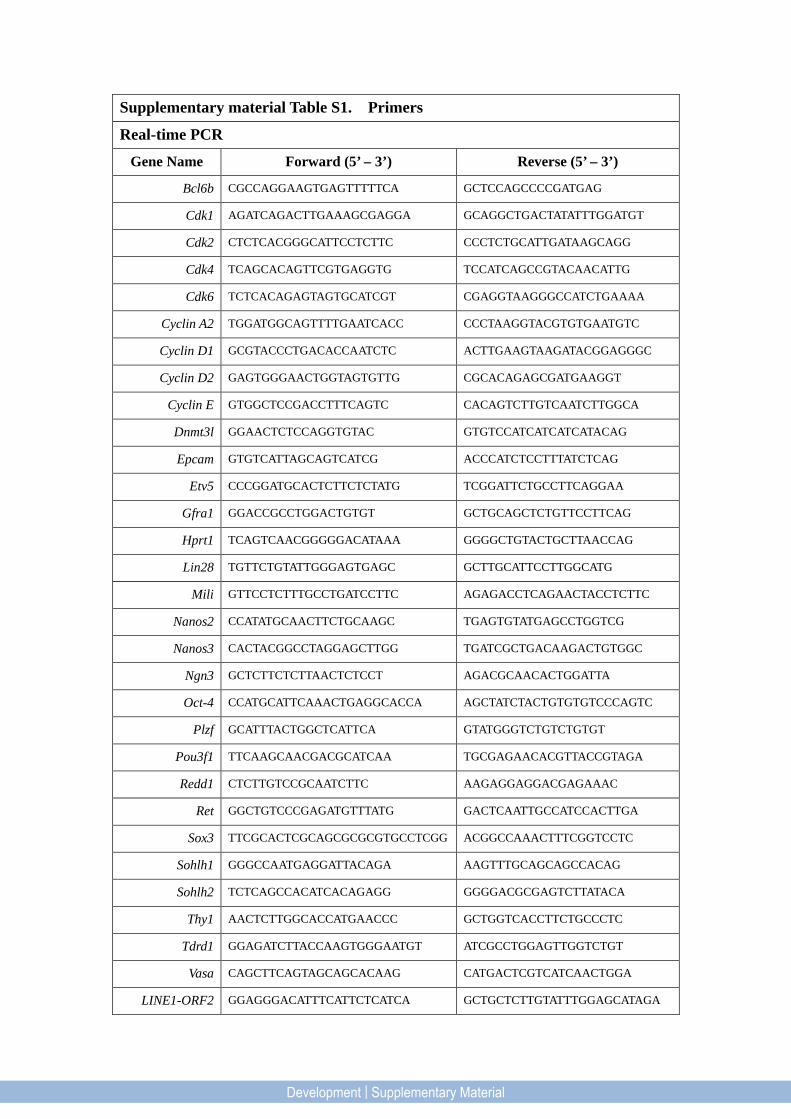
Supplementary material Table S1. Primers
Real-time PCR
Gene Name Forward (5’ – 3’) Reverse (5’ – 3’)
Bcl6b CGCCAGGAAGTGAGTTTTTCA GCTCCAGCCCCGATGAG
Cdk1 AGATCAGACTTGAAAGCGAGGA GCAGGCTGACTATATTTGGATGT
Cdk2 CTCTCACGGGCATTCCTCTTC CCCTCTGCATTGATAAGCAGG
Cdk4 TCAGCACAGTTCGTGAGGTG TCCATCAGCCGTACAACATTG
Cdk6 TCTCACAGAGTAGTGCATCGT CGAGGTAAGGGCCATCTGAAAA
Cyclin A2 TGGATGGCAGTTTTGAATCACC CCCTAAGGTACGTGTGAATGTC
Cyclin D1 GCGTACCCTGACACCAATCTC ACTTGAAGTAAGATACGGAGGGC
Cyclin D2 GAGTGGGAACTGGTAGTGTTG CGCACAGAGCGATGAAGGT
Cyclin E GTGGCTCCGACCTTTCAGTC CACAGTCTTGTCAATCTTGGCA
Dnmt3l GGAACTCTCCAGGTGTAC GTGTCCATCATCATCATACAG
Epcam GTGTCATTAGCAGTCATCG ACCCATCTCCTTTATCTCAG
Etv5 CCCGGATGCACTCTTCTCTATG TCGGATTCTGCCTTCAGGAA
Gfra1 GGACCGCCTGGACTGTGT GCTGCAGCTCTGTTCCTTCAG
Hprt1 TCAGTCAACGGGGGACATAAA GGGGCTGTACTGCTTAACCAG
Lin28 TGTTCTGTATTGGGAGTGAGC GCTTGCATTCCTTGGCATG
Mili GTTCCTCTTTGCCTGATCCTTC AGAGACCTCAGAACTACCTCTTC
Nanos2 CCATATGCAACTTCTGCAAGC TGAGTGTATGAGCCTGGTCG
Nanos3 CACTACGGCCTAGGAGCTTGG TGATCGCTGACAAGACTGTGGC
Ngn3 GCTCTTCTCTTAACTCTCCT AGACGCAACACTGGATTA
Oct-4 CCATGCATTCAAACTGAGGCACCA AGCTATCTACTGTGTGTCCCAGTC
Plzf GCATTTACTGGCTCATTCA GTATGGGTCTGTCTGTGT
Pou3f1 TTCAAGCAACGACGCATCAA TGCGAGAACACGTTACCGTAGA
Redd1 CTCTTGTCCGCAATCTTC AAGAGGAGGACGAGAAAC
Ret GGCTGTCCCGAGATGTTTATG GACTCAATTGCCATCCACTTGA
Sox3 TTCGCACTCGCAGCGCGCGTGCCTCGG ACGGCCAAACTTTCGGTCCTC
Sohlh1 GGGCCAATGAGGATTACAGA AAGTTTGCAGCAGCCACAG
Sohlh2 TCTCAGCCACATCACAGAGG GGGGACGCGAGTCTTATACA
Thy1 AACTCTTGGCACCATGAACCC GCTGGTCACCTTCTGCCCTC
Tdrd1 GGAGATCTTACCAAGTGGGAATGT ATCGCCTGGAGTTGGTCTGT
Vasa CAGCTTCAGTAGCAGCACAAG CATGACTCGTCATCAACTGGA
LINE1-ORF2 GGAGGGACATTTCATTCTCATCA GCTGCTCTTGTATTTGGAGCATAGA
Development | Supplementary Material
IAPGAG AACCAATGCTAATTTCACCTTGGT GCCAATCAGCAGGCGTTAGT
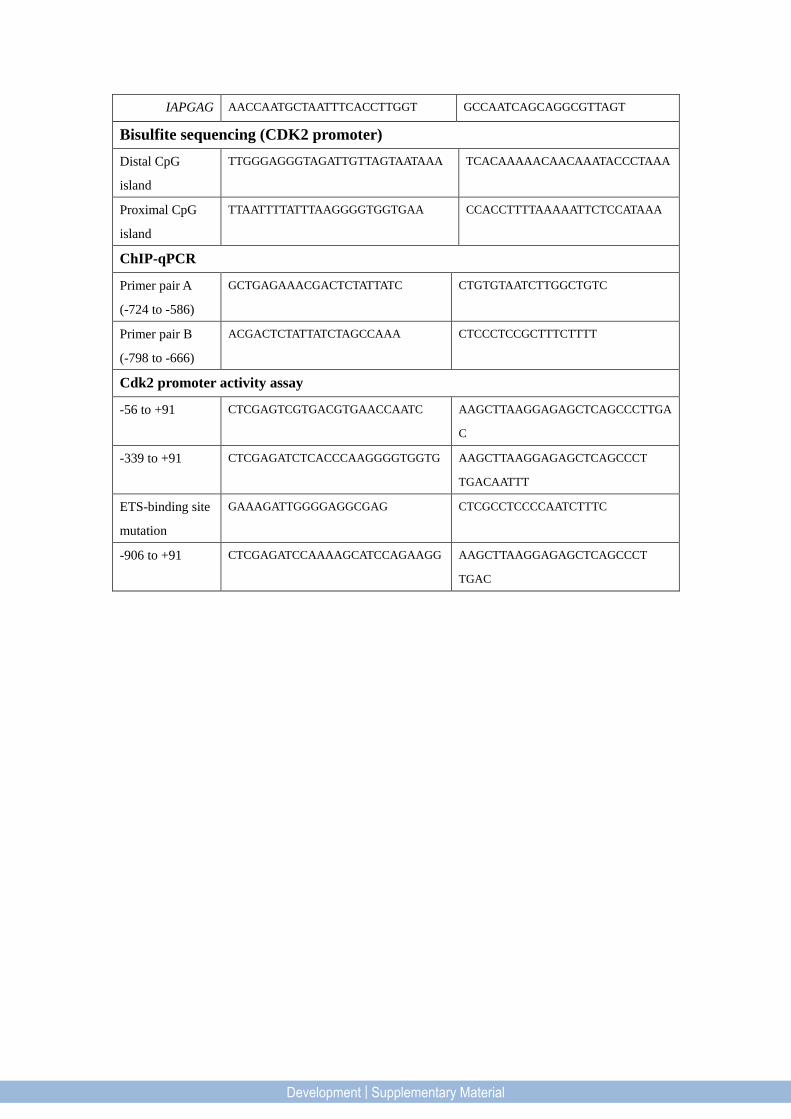
Bisulfite sequencing (CDK2 promoter)
Distal CpG
island
TTGGGAGGGTAGATTGTTAGTAATAAA TCACAAAAACAACAAATACCCTAAA
Proximal CpG
island
TTAATTTTATTTAAGGGGTGGTGAA CCACCTTTTAAAAATTCTCCATAAA
ChIP-qPCR
Primer pair A
(-724 to -586)
GCTGAGAAACGACTCTATTATC CTGTGTAATCTTGGCTGTC
Primer pair B
(-798 to -666)
ACGACTCTATTATCTAGCCAAA CTCCCTCCGCTTTCTTTT
Cdk2 promoter activity assay
-56 to +91 CTCGAGTCGTGACGTGAACCAATC AAGCTTAAGGAGAGCTCAGCCCTTGA
C
-339 to +91 CTCGAGATCTCACCCAAGGGGTGGTG AAGCTTAAGGAGAGCTCAGCCCT
TGACAATTT
ETS-binding site
mutation
GAAAGATTGGGGAGGCGAG CTCGCCTCCCCAATCTTTC
-906 to +91 CTCGAGATCCAAAAGCATCCAGAAGG AAGCTTAAGGAGAGCTCAGCCCT
TGAC
Development | Supplementary Material
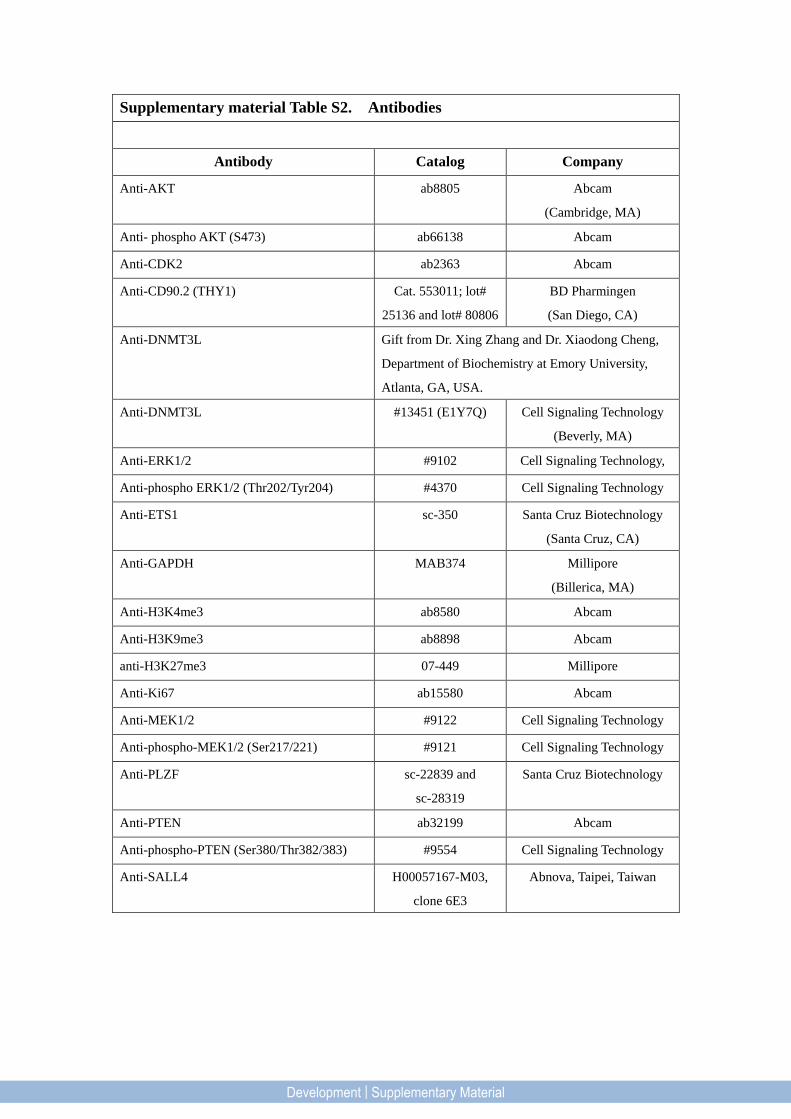
Supplementary material Table S2. Antibodies
Antibody Catalog Company
Anti-AKT ab8805 Abcam
(Cambridge, MA)
Anti- phospho AKT (S473) ab66138 Abcam
Anti-CDK2 ab2363 Abcam
Anti-CD90.2 (THY1) Cat. 553011; lot#
25136 and lot# 80806
BD Pharmingen
(San Diego, CA)
Anti-DNMT3L Gift from Dr. Xing Zhang and Dr. Xiaodong Cheng,
Department of Biochemistry at Emory University,
Atlanta, GA, USA.
Anti-DNMT3L #13451 (E1Y7Q) Cell Signaling Technology
(Beverly, MA)
Anti-ERK1/2 #9102 Cell Signaling Technology,
Anti-phospho ERK1/2 (Thr202/Tyr204) #4370 Cell Signaling Technology
Anti-ETS1 sc-350 Santa Cruz Biotechnology
(Santa Cruz, CA)
Anti-GAPDH MAB374 Millipore
(Billerica, MA)
Anti-H3K4me3 ab8580 Abcam
Anti-H3K9me3 ab8898 Abcam
anti-H3K27me3 07-449 Millipore
Anti-Ki67 ab15580 Abcam
Anti-MEK1/2 #9122 Cell Signaling Technology
Anti-phospho-MEK1/2 (Ser217/221) #9121 Cell Signaling Technology
Anti-PLZF sc-22839 and
sc-28319
Santa Cruz Biotechnology
Anti-PTEN ab32199 Abcam
Anti-phospho-PTEN (Ser380/Thr382/383) #9554 Cell Signaling Technology
Anti-SALL4 H00057167-M03,
clone 6E3
Abnova, Taipei, Taiwan
Development | Supplementary Material