supporting information - pnas · npf1183 (npcph1a, tp1) 0.20 0.22 85 83 tp1 c258h ¶ 0.03 0.03
TRANSCRIPT
Supporting InformationRockwell et al. 10.1073/pnas.1107844108
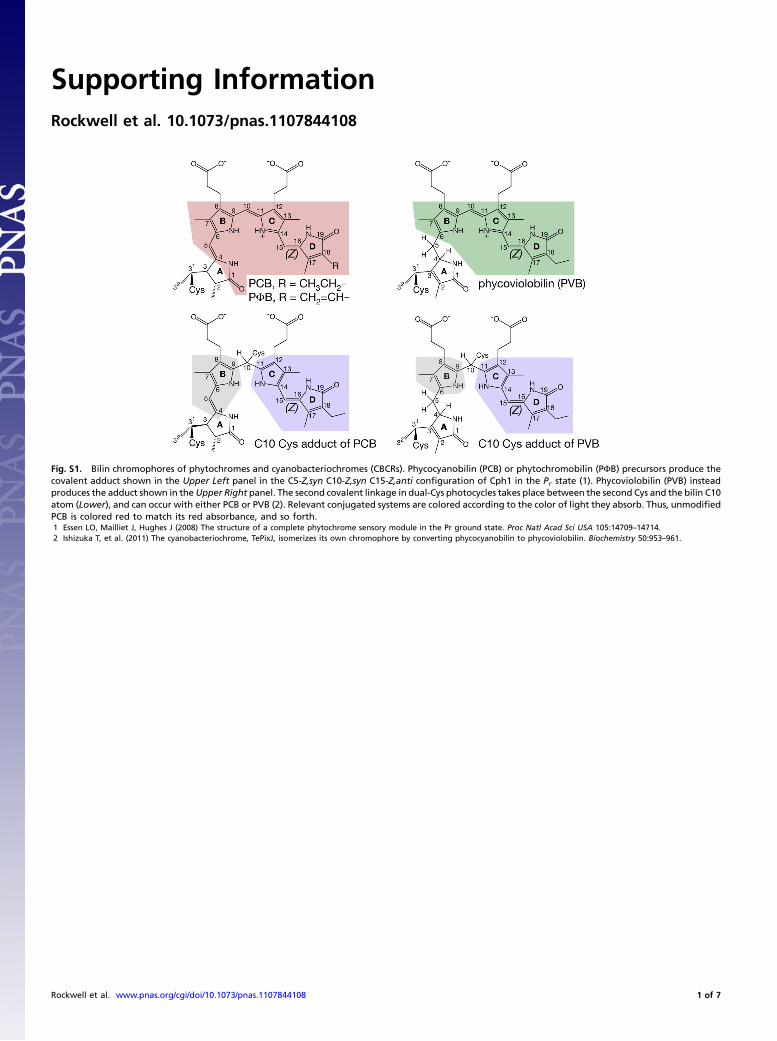
Fig. S1. Bilin chromophores of phytochromes and cyanobacteriochromes (CBCRs). Phycocyanobilin (PCB) or phytochromobilin (PΦB) precursors produce thecovalent adduct shown in the Upper Left panel in the C5-Z,syn C10-Z,syn C15-Z,anti configuration of Cph1 in the Pr state (1). Phycoviolobilin (PVB) insteadproduces the adduct shown in theUpper Right panel. The second covalent linkage in dual-Cys photocycles takes place between the second Cys and the bilin C10atom (Lower), and can occur with either PCB or PVB (2). Relevant conjugated systems are colored according to the color of light they absorb. Thus, unmodifiedPCB is colored red to match its red absorbance, and so forth.1 Essen LO, Mailliet J, Hughes J (2008) The structure of a complete phytochrome sensory module in the Pr ground state. Proc Natl Acad Sci USA 105:14709–14714.2 Ishizuka T, et al. (2011) The cyanobacteriochrome, TePixJ, isomerizes its own chromophore by converting phycocyanobilin to phycoviolobilin. Biochemistry 50:953–961.
Rockwell et al. www.pnas.org/cgi/doi/10.1073/pnas.1107844108 1 of 7

Fig. S2. Spectroscopic characterization of dual-cysteine photosensors. (A) Photochemical difference spectra for denatured 15E UB1 (blue), VO1 (orange), anddark-evolved TP1 (red), shown as (15Z-15E). (B) Difference spectra for native wild-type and C546A VO1 under the indicated conditions. (C) Absorbance spectrafor NpF2164-GAF2 in the 15Z state (violet) and 15E state (orange). (D) CD spectra for NpF2164-GAF2. (E) Difference spectra for native C298A UB1 under theindicated conditions. (F) Difference spectra for native UB1 at photoequilibrium with the indicated light sources. (G) Photochemical progress curves for UB1using the conditions from (F). (H) Photochemical progress curves for VO1 with PCB (circles) or PΦB (triangles).
Rockwell et al. www.pnas.org/cgi/doi/10.1073/pnas.1107844108 2 of 7

Fig. S3. Sequence alignment of insert-Cys CBCRs. Proteins in this study are highlighted. Both Cys residues and the Asp-motif are indicated, and β strand colorsmatch Fig. 1A.
Rockwell et al. www.pnas.org/cgi/doi/10.1073/pnas.1107844108 3 of 7

Fig. S4. Comparison of PCB and PΦB adducts of VO1 and UB1. (A)–(D) Characterization of VO1 and UB1 by CD spectroscopy. PCB and PΦB adducts are shown inthe 15Z (purple) and 15E (orange) states. VO1 does not invert CD upon photoconversion, like the CBCR Tlr0924 (1) or BphPs. UB1 does invert CD, like Cph1and plant phytochrome (2). (E)–(H) Absorption spectra are shown for PCB (blue) and PΦB (red) adducts, with peak wavelengths for the two observed bilintransitions indicated. The second transitions of both proteins show no redshift with PΦB in the 15Z state, unlike the first transitions and unlike both transitionsof 15E VO1.1 Rockwell NC, et al. (2008) A second conserved GAF domain cysteine is required for the blue/green photoreversibility of cyanobacteriochrome Tlr0924 from Thermosynechococcus
elongatus. Biochemistry 47:7304–7316.2 Rockwell NC, Shang L, Martin SS, Lagarias JC (2009) Distinct classes of red/far-red photochemistry within the phytochrome superfamily. Proc Natl Acad Sci USA 106:6123–6127.
Rockwell et al. www.pnas.org/cgi/doi/10.1073/pnas.1107844108 4 of 7

Fig. S5. Controls for reaction of CBCRs with hydrogen peroxide. (A) 15ZH2O2 products were denatured with acidic guanidinium chloride and characterized byabsorbance spectroscopy. (B) H2O2 products of VO1 in the indicated states were denatured with acidic guanidinium chloride. (C)–(D) The response of 15Z Y176Hand H260Cmutant Cph1 to H2O2 was assessed. The 15Z state (purple) was treated with H2O2 in darkness to yield chemical products (blue). Blue traces are scaledto reflect the 1∶1 dilution of sample upon peroxide addition.
Fig. S6. Overview of novel 2-Cys photosensors. (A) Amino acids amplified for expression are indicated. (B) Characterization of purified proteins by SDS-PAGEand zinc blotting.
Table S1. Characterization of phytochromes and CBCRs*
Protein Native SAR Denatured SAR % conversion % recovery
NpF2164-GAF2 0.18 0.24 50 81NpF2164-GAF3 (VO1) 0.22 0.26 85 98VO1-PΦB 0.18 0.23 N/D 89VO1 C546A
† 0.20 0.15 55 N/DVO1-His6 0.23 0.29 90 101NpR1597g2 (UB1) 0.28 0.50 75 (40)‡ 97UB1-PΦB 0.11 0.10 N/D 103UB1 C298A 0.65 0.4 70 82§
NpF1183 (NpCph1a, TP1) 0.20 0.22 85 83TP1 C258H
¶ 0.03 0.03 <10 N/DCph1 H260C 0.18 0.11 60 24
*Specific absorbance ratio (SAR) was calculated from peak absorbances of the bilin band and the protein band at280 nm. Denatured SAR (in acidic guanidinium chloride) permits more direct comparison of proteins withdifferent peak wavelengths in the native state. Percent conversion to 15E photoproduct for PCB adductswas estimated from the denatured spectra relative to standards, but the absence of suitable PΦB standardsprecluded a similar approach for those samples. Percent recovery of the ground state was estimated fromthe 15Z maxima of the forward and reverse difference spectra. N/D, not determined.
†Values are reported for photoconversion with violet light in the presence of 50 mM DTT.‡Value in parentheses is for 400 nm photoequilibrium.§Recovery is for 500 nm light without DTT. Recovery with 436 nm light and 50 mM DTT, 62%. Recovery in thepresence of DTT is not corrected for presence of any 15Z DTT adduct.
¶Forward photochemistry was too inefficient to allow characterization of the reverse reaction.
Rockwell et al. www.pnas.org/cgi/doi/10.1073/pnas.1107844108 5 of 7

Table S2. Peak wavelengths*
Protein Native λmax (nm) Denatured λmax (nm)
NpF2164-GAF2 382 (−); 446 (+) 672; 580NpF2164-GAF3 (VO1) 398 (−); 588 (−) 677; 582VO1-PΦB 418 (−); 602 (−) 680; 586VO1 C546A
† 614; 592 676; 582VO1-His6 398; 588 676; 578NpR1597-GAF2 (UB1) 378 (−); 448 (+) 676; 576 (674; 578)‡
UB1-PΦB 396 (−); 474 (+) 682; 578UB1 C298A
§ 622; 558 674; 578 (674; 586)NpF1183 (NpCph1a, TP1)¶ 392; 598, 670 674; 578TP1 C258H 612; – 662; –Cph1 H260C 406; 570 682; 582Cph1∥ 662; 704 674; 582α-PEC** 563; 506 599; 508
*Peak wavelengths are reported for the bilin transition of longestwavelength (S1) as 15Z; 15E. All proteins were expressed as intein-CBDfusion proteins with coexpression of PCB unless otherwise stated. Wheremeasured, the CD sign for each transition is reported in parentheses forthe native protein. Values for denatured samples were derived fromdifference spectra.
†Values are reported for photoconversion with violet light in the presence of50 mM DTT.
‡Values in parentheses are for 334 nm illumination.§Values in parentheses are in the presence of DTT. The free 15E value wasderived from the DTT-addition difference spectrum to avoid overlap withthe free 15Z state.
¶Multiple values for the 15E state of TP1 reflect thermal evolution ofphotoproduct, which proceeded as a first-order process with anapparent rate constant of 0.2 min−1.
∥Peak wavelengths (1) are references for covalent PCB adducts.**Values for α-phycoerythrocyanin (α-PEC) calculated from spectra provided
by Kai-Hong Zhao (Huazhong Agricultural University) as references forcovalent PVB adducts.
1 Shang L, Rockwell NC, Martin SS, Lagarias JC (2010) Biliverdin amides reveal roles for propionateside chains in bilin reductase recognition and in holophytochrome assembly and photoconversion.Biochemistry 49:6070–6082.
Rockwell et al. www.pnas.org/cgi/doi/10.1073/pnas.1107844108 6 of 7

Table S3. Accession information for insert-Cys CBCRs*
Name† Locus tag Organism Amino acids
Aazo_4225 Aazo_4225 Nostoc azollae 0708 650–791AmaxDRAFT_4613 AmaxDRAFT_4613 Arthrospira maxima CS-328 387–510NIES39_J03990-GAF2 NIES39_J03990 Arthrospira platensis NIES-39 349–472MC7420_3869 MC7420_3869 Microcoleus chthonoplastes PCC 7420 378–501Sy7002A0689 SYNPCC7002_A0689 Synechococcus sp. PCC 7002 211–337cce_1413 cce_1413 Cyanothece sp. ATCC 51142 219–337cce_4289 cce_4289 Cyanothece sp. ATCC 51142 236–350CY0110_23126 CY0110_23126 Cyanothece sp. CCY0110 214–327Ct8802_1740-GAF2 Cyan8802_1740 Cyanothece sp. PCC 8802 225–343NpF2164-GAF2 Npun_F2164 Nostoc punctiforme ATCC 29133‡ 287–415S7335_348 S7335_348 Synechococcus sp. PCC 7335 47–165Ct7822_2884-GAF2 Cyan7822_2884 Cyanothece sp. PCC 7822 250–368Ct7822_5290-GAF2 Cyan7822_5290 Cyanothece sp. PCC 7822 275–392Ct7424_1855-GAF2 PCC7424_1855 Cyanothece sp. PCC 7424 259–377MC7420_107 MC7420_107 Microcoleus chthonoplastes PCC 7420 264–382Aazo_0203 Aazo_0203 Nostoc azollae 0708 294–411NpR1597-GAF2 (UB1) Npun_R1597 Nostoc punctiforme ATCC 29133‡ 254–372Ava_1210 Ava_1210 Anabaena variabilis ATCC 29413 252–370all4261-GAF2 all4261 Nostoc sp. PCC 7120 252–370L8106_25145 L8106_25145 Lyngbya sp. PCC 8106 564–688L8106_05116-GAF4 L8106_05116 Lyngbya sp. PCC 8106 954–1072MC7420_7724-GAF2 MC7420_7724 Microcoleus chthonoplastes PCC 7420 499–650NIES39_C00690 NIES39_C00690 Arthrospira platensis NIES-39 407–529L8106_24225-GAF2 L8106_24225 Lyngbya sp. PCC 8106 385–508Osci3400013 OSCI_3400013 Oscillatoria sp. PCC 6506 567–690Ct8802_4055-GAF3 Cyan8802_4055 Cyanothece sp. PCC 8802 492–617Ct8802_4055-GAF4 Cyan8802_4055 Cyanothece sp. PCC 8802 701–824Ct8802_4055-GAF2 Cyan8802_4055 Cyanothece sp. PCC 8802 285–408NpF2164-GAF3 (VO1) Npun_F2164 Nostoc punctiforme ATCC 29133‡ 499–622CwDRAFT_2358 CwatDRAFT_2358 Crocosphaera watsonii WH 8501 106–230Ct8802_4055-GAF5 Cyan8802_4055 Cyanothece sp. PCC 8802 901–1026
*Accession information is provided in the form of the GenBank locus tag. The numbers of the aligned amino acids are shown,corresponding to the first through sixth GAF beta strands. This alignment is intended to show the sequence diversity in thissubfamily; therefore, some identical CBCR sequences from closely related Cyanothece and Arthrospira species are not shown.
†Name given in Fig. S3.‡Also known as Nostoc punctiforme sp. PCC 73102.
Rockwell et al. www.pnas.org/cgi/doi/10.1073/pnas.1107844108 7 of 7