supporting informations10 pae 1-3 pae 2-3 pae 3-3 pae 4-4 0.0 0.2 0.4 0.6 0.8 1.0 0 200 400 600 800...
TRANSCRIPT

S1
Supporting Information
Aromatic-Rich Hydrocarbon Porous Networks through Alkyne Metathesis
Haishen Yang,a, b, †
Youlong Zhu,b,†
Ya Du,b Dazhi Tan,
b Yinghua Jin
b and Wei Zhang
b,*
aShanghai Key Laboratory of Materials Protection and Advanced Materials in Electric Power,
College of Environmental and Chemical Engineering, Shanghai University of Electric Power,
Shanghai 200090, P. R. China.
bDepartment of Chemistry and Biochemistry, University of Colorado, Boulder, CO 80309,
USA. Tel: (+1) 303-492-0652; Fax: (+1) 303-492-5894; E-mail: [email protected]
†These authors contributed equally to this work.
Table of Contents
1. Typical synthetic procedure of the monomers 1-4 .......................................................................... 2
2. Typical synthetic procedure of PAE series ...................................................................................... 3
3. Thermal gravimetric analysis of PAE series ................................................................................... 4
4. FT-IR spectra of starting materials and PAE series ....................................................................... 5
5. Powder X-Ray Diffraction of PAE 2-2 ............................................................................................. 9
6. N2 adsorption (filled symbol) and desorption (open symbol) isotherms PAE series .................... 9
7. Pore size distribution of PAE series ............................................................................................... 10
9. SEM images of PAE series .............................................................................................................. 15
10. 1H and
13C NMR spectra of selected compounds ........................................................................ 15
11. References ....................................................................................................................................... 17
Electronic Supplementary Material (ESI) for Materials Chemistry Frontiers.This journal is © the Partner Organisations 2017

S2
1. Typical synthetic procedure of the monomers 1-4
Synthesis of 1,3,5-Tripropynylbenzene (1)
To a solution of anhydrous zinc bromide (3.10 g, 13.77 mmol) in THF (12 mL) was added 1-
propynyl lithium (0.69 g, 15.0 mmol) dropwise at rt, followed by Pd(PPh3)4 (0.66 g, 0.57 mmol)
and 1,3,5-tribromobenzene (0.95 g, 3.00 mmol). The reaction mixture was heated at 80 °C
overnight, and was cooled to room temperature. The reaction was quenched with saturated
aqueous solution of ammonium chloride and dichloromethane (100 mL) was added. The
organic layer was washed successively with water (50 mL) and brine (50 mL) and then dried
over anhydrous MgSO4. The volatiles were evaporated and the residue was purified through
flash column chromatography (hexane/ether 50/1) to afford 1 (0.42 g, 73%): 1H NMR (500
MHz, CDCl3) δ 7.28 (s, 3H), 2.02 (s, 12H). The 1H NMR data is consistent with the literature
report.1
Synthesis of 1,3,5-tris(p-propynylphenyl)benzene (2)
The procedure of Negish-coupling reaction described for the preparation of 1 was followed.
1,3,5-tris(p-propynylphenyl)benzene (2) (0.57 g, 82%) was obtained from 1,3,5-tris(p-
bromophenyl)benzene (0.90 g, 1.66 mmol), propynyl lithium (0.38 g, 8.26 mmol), ZnBr2 (1.70
g, 7.55 mmol), and Pd(PPh3)4 (0.36 g, 0.31 mmol). The physical data of 2: 1H NMR (300 MHz,
CDCl3) δ 7.73 (s, 3H), 7.65 – 7.55 (m, 6H), 7.54 – 7.45 (m, 6H), 2.09 (s, 9H). 13
C NMR (75
MHz, CDCl3) δ 141.7, 139.9, 132.0, 127.1, 124.9, 123.4, 86.8, 79.5, 4.4. HRMS (ESI): calcd.
for C33H24+ [M
+]: 420.1878. Found: 420.1873.

S3
Synthesis of Tetrakis(p-propynylphenyl)methane (3)
The procedure of Negish-coupling reaction described for the preparation of 1 was followed.
Tetrakis(p-propynylphenyl)methane (3) (0.61 g, 82%) was obtained from tetrakis(p-
bromophenyl)methane (1.0 g, 1.57 mmol), propynyl lithium (0.47 g, 10.22 mmol), ZnBr2 (2.10
g, 9.33 mmol), and Pd(PPh3)4 (0.45 g, 0.39 mmol). The physical data of 3: 1H NMR (500 MHz,
CDCl3) δ 7.26 (d, 8H, J = 8.5 Hz), 7.05 (d, 8H, J = 8.5 Hz), 2.04 (s, 12H). The 1H NMR data is
consistent with the literature report.2
Synthesis of 1,3,5,7-Tetrakis(p-propynylphenyl)adamantane (4)
The procedure of Negish-coupling reaction described for the preparation of 1 was followed. 1,3,
5,7-Tetrakis(p-propynylphenyl)adamantane (4) (0.20 g, 25%) was obtained from 1,3,5,7-
tetrakis(p-bromophenyl)adamantane (1.02 g, 1.36 mmol), propynyl lithium (0.44 g, 0.37 mmol),
and ZnBr2 (1.96 g, 8.7 mmol), and Pd(PPh3)4 (0.43 g, 0.37 mmol). The physical data of 4: 1H
NMR (300 MHz, CDCl3) δ 7.37 (s, 16H), 2.09 (s, 12H), 2.04 (s, 12H); 13
C NMR (75 MHz,
CDCl3) δ 148.5, 131.5, 124.9, 121.8, 85.5, 79.5, 46.8, 39.2, 4.3. HRMS (ESI): calcd. for
C92H80Li+ [2M+Li
+]: 1191.6415. Found: 1191.6378.
2. Typical synthetic procedure of PAE series
Typical synthetic procedure described for the preparation porous poly(aryleneethylnylene)
networks through alkyne metathesis was followed.2 The triphenolsilane (5.1 mg, 0.01 mmol)
and molybdenum(VI) trisamide precursor (8.3 mg, 0.01 mmol) were premixed in dry CCl4 (1.3
mL) for 15 minutes at rt to generate the catalyst in situ. Subsequently, a solution of 1,3,5-tris(p-
propynylphenyl)benzene (2) (116.9 mg, 0.28 mmol) in CHCl3 (5.1 mL) was added followed by
5 Å molecular sieves (1.26 g, pellet, 8 ‒ 12 mesh). The reaction was heated at 55 °C for 22 h
without stirring. Acetone (~ 100 mL) was added, and the gel like network was broken into tiny
pieces. The suspension was separated from the molecular sieves by decantation. The acetone
suspension was centrifuged and most of the solvent was removed. The resultant mixture was
poured into conc. ammonium hydroxide (100 mL) with vigorous stirring. The yellow solid was
collected by filtration, washed with water (2 x 30 mL), and dried under high vacuum overnight
to yield the network (87 mg, 92%). Elemental analysis for PAE 2-2: (C27H15)n Calcd. C,
95.55%; H, 4.45%. Found. C, 83.36%; H, 4.60%.

S4
Following similar procedure, PAE 1-1 was obtained as a white solid (38 mg, 82%) from the
monomer 1 (80 mg, 0.42 mmol) following the similar procedure. Elemental analysis for PAE
1-1: (C9H3)n Calcd. C, 97.28%; H, 2.72%. Found. C, 76.52%; H, 3.16%; PAE 1-2 was obtained
as a white solid (73 mg, quantitative) from monomer 1 (31 mg, 0.16 mmol) and 2 (68 mg, 0.16
mmol) following the similar procedure. Elemental analysis for PAE 1-2: (C36H18)n Calcd. C,
95.97%; H, 4.03%. Found. C, 84.22%; H, 3.81%; PAE 2-3 was obtained as a white solid (121
mg, quantitative) from monomer 2 (84 mg, 0.20 mmol) and 3 (71 mg, 0.15 mmol) following
the similar procedure. Elemental analysis for PAE 2-3: (C64H35.53)n Calcd. C, 95.55%; H,
4.45%. Found. C, 86.83%; H, 4.32%; PAE 1-3 was obtained as a white solid (102 mg,
quantitative) from the monomer 1 (51 mg, 0.27 mmol) and 3 (94 mg, 0.2 mmol) following the
similar procedure. Elemental analysis for PAE 1-3: (C40.7H19.9)n Calcd. C, 96.06%; H, 3.94%;
Found. C 77.31%; H, 3.70%; PAE 4-4 was obtained as a white solid (99 mg, quantitative) from
the monomer 4 (120 mg, 0.20 mmol) following the similar procedure. Elemental analysis for
PAE 4-4: (C18H28)n Calcd. C, 88.45%; H, 11.55%. Found. C, 80.51%; H, 3.79%.
3. Thermal gravimetric analysis of PAE series
Samples were run on a TA Instruments Q-500 series thermal gravimetric analyzer with samples
held in a platinum pan under nitrogen atmosphere. A 10 K min-1
ramp rate was used. The
materials show a good thermal stability up to at least 400 °C.
0 100 200 300 400 500 600 700
0
10
20
30
40
50
60
70
80
90
100
Weig
ht
(%)
Temperature (°C)
PAE 1-1
PAE 1-2
PAE 2-2
PAE 3-3
PAE 1-3
PAE 2-3
PAE 4-4
Figure S1. TGA of PAE series

S5
4. FT-IR spectra of starting materials and PAE series
4000 3500 3000 2500 2000 1500 1000 500
40
50
60
70
80
90
100
Tra
nsm
itta
nce (
%)
Wavenumber (cm-1)
monomer 1
PAE 1-1
Figure S2. FT-IR spectra of monomer 1 and as synthesized PAE 1-1.

S6
4000 3500 3000 2500 2000 1500 1000 500
40
50
60
70
80
90
100
Tra
nsm
itta
nce (
%)
Wavenumber (cm-1)
monomer 2
PAE 2-2
Figure S3. FT-IR spectra of monomer 2 and as synthesized PAE 2-2.
4000 3500 3000 2500 2000 1500 1000 500
20
30
40
50
60
70
80
90
100
Tra
nsm
itta
nce (
%)
Wavenumber (cm-1)
monomer 1
monomer 2
PAE 1-2
Figure S4. FT-IR spectra of monomers 1 and 2 and as synthesized PAE 1-2.

S7
4000 3500 3000 2500 2000 1500 1000 500
40
50
60
70
80
90
100
110
120
Tra
nsm
itta
nce (
%)
Wavenumber (cm-1)
monomer 1
monomer 3
PAE 1-3
Figure S5. FT-IR spectra of monomers 1 and 3 and as synthesized PAE 1-3.
4000 3500 3000 2500 2000 1500 1000 500
20
30
40
50
60
70
80
90
100
Tra
nsm
itta
nce (
%)
Wavenumber (cm-1)
monomer 2
monomer 3
PAE 2-3
Figure S6. FT-IR spectra of monomers 2 and 3 and as synthesized PAE 2-3.

S8
4000 3500 3000 2500 2000 1500 1000 500
40
50
60
70
80
90
100
Tra
nsm
itta
nce (
%)
Wavenumber (cm-1)
sm 4
PAE 4-4
Figure S7. FT-IR spectra of monomer 3 and as synthesized PAE 3-3.
4000 3500 3000 2500 2000 1500 1000 500
40
50
60
70
80
90
Tra
nsm
itta
nce (
%)
Wavenumber (cm-1)
monomer 4
PAE 4-4
Figure S8. FT-IR spectra of monomer 4 and as synthesized PAE 4-4.

S9
5. Powder X-Ray Diffraction of PAE 2-2
0 5 10 15 20 25 30 35
0
500
1000
1500
2000
2500
3000
Inte
nsit
y (
a.u
.)
Two Theta (°)
PAE 2-2
Figure S9. Powder X-ray diffraction of PAE 2-2.
6. N2 adsorption (filled symbol) and desorption (open symbol) isotherms PAE series
0.0 0.2 0.4 0.6 0.8 1.0
0
200
400
600
800
1000
1200
1400
1600
Volu
me @
ST
P (
cm
3∙g
-1)
Relative Pressure (P/P0)
PAE 1-1
PAE 1-2
PAE 2-2
Figure S10. N2 adsorption (filled symbol) and desorption (open symbol) isotherms for PAE
series containing planar monomers 1 and 2.
S10
PAE 1-3
PAE 2-3
PAE 3-3
PAE 4-4
0.0 0.2 0.4 0.6 0.8 1.0
0
200
400
600
800
1000
Volu
me @
ST
P (
cm
3∙g
-1)
Relative Pressure (P/P0)
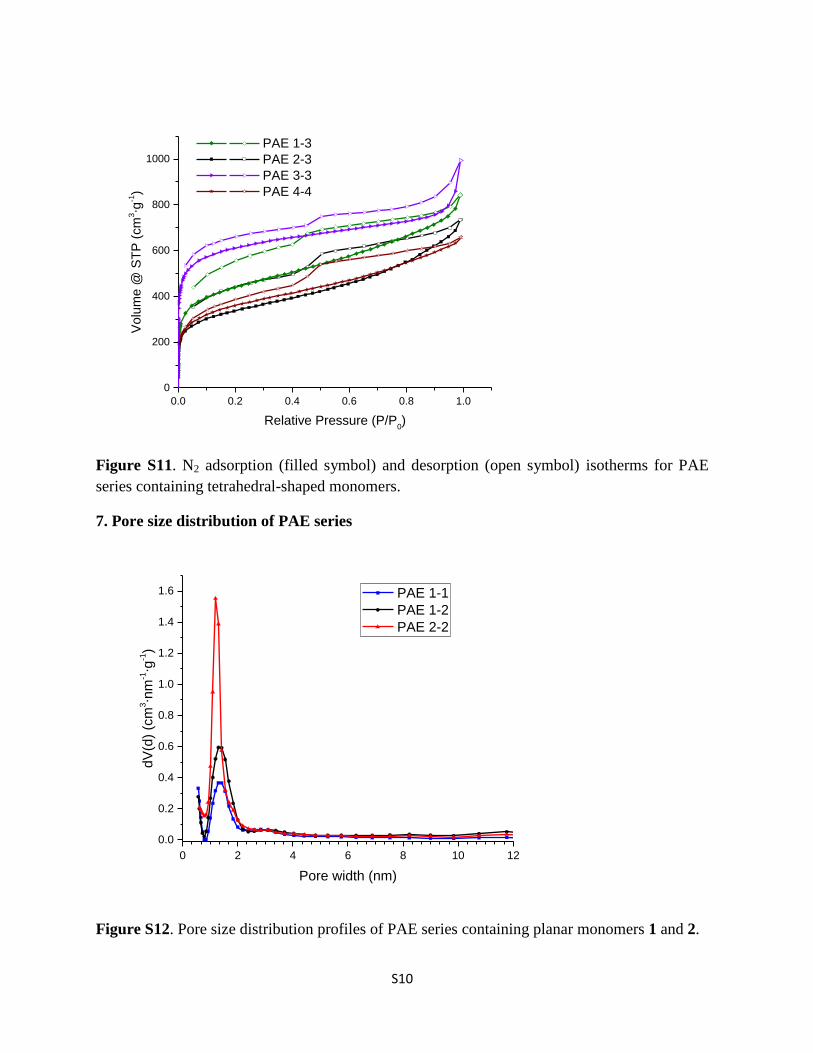
Figure S11. N2 adsorption (filled symbol) and desorption (open symbol) isotherms for PAE
series containing tetrahedral-shaped monomers.
7. Pore size distribution of PAE series
0 2 4 6 8 10 12
0.0
0.2
0.4
0.6
0.8
1.0
1.2
1.4
1.6
dV
(d)
(cm
3∙n
m-1∙g
-1)
Pore width (nm)
PAE 1-1
PAE 1-2
PAE 2-2
Figure S12. Pore size distribution profiles of PAE series containing planar monomers 1 and 2.

S11
0 2 4 6 8 10 12
0.00
0.02
0.04
0.06
0.08
0.10
0.12
0.14
0.16d
V(d
) (c
m3∙n
m-1∙g
-1)
Pore width (nm)
PAE 3-3
PAE 1-3
PAE 4-4
PAE 2-3
Figure S13. Pore size distribution profiles of PAE series containing tetrahedral-shaped
monomers.
8. Solid State NMR of the as synthesized networks
Figure S14. 13
C-CPMAS of the PAE 1-1

S12
Figure S15. 13
C-CPMAS of the PAE 1-2.
Figure S16. 13
C-CPMAS of the PAE 2-2.

S13
Figure S17. 13
C-CPMAS of the PAE 3-3.
Figure S18. 13
C-CPMAS of the PAE 4-4.
S14
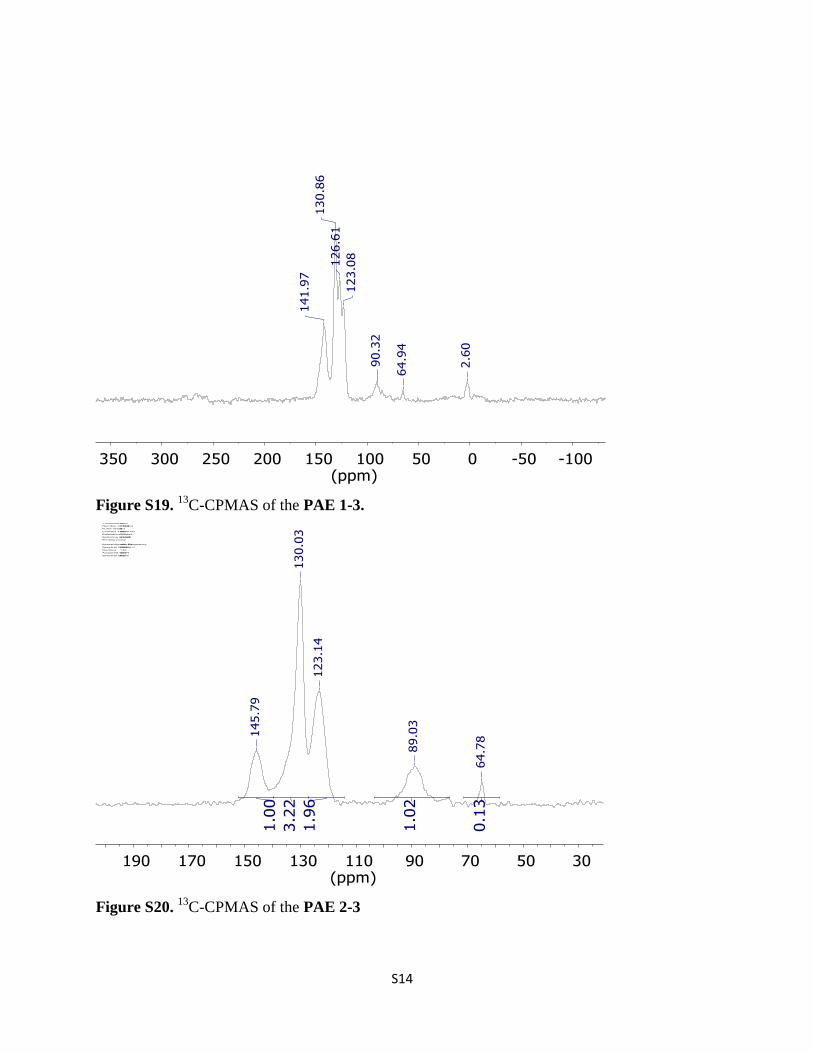
Figure S19. 13
C-CPMAS of the PAE 1-3.
Figure S20. 13
C-CPMAS of the PAE 2-3
S15
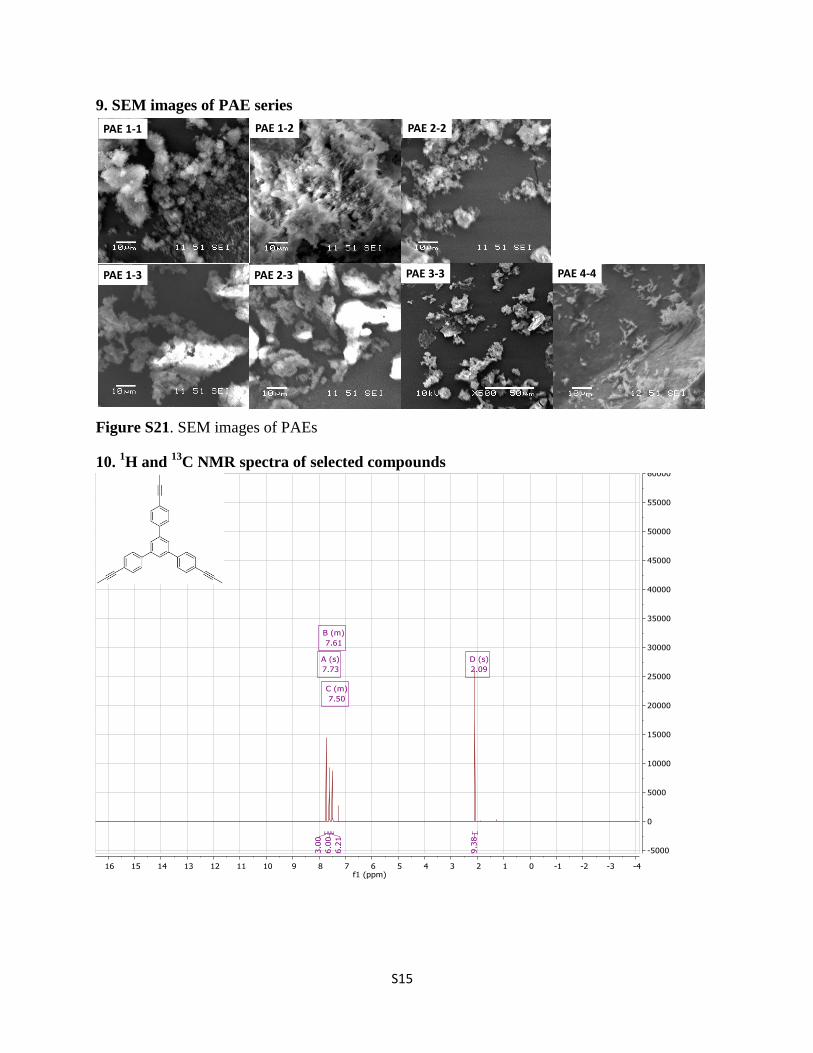
9. SEM images of PAE series
Figure S21. SEM images of PAEs
10. 1H and
13C NMR spectra of selected compounds
PAE 1-1 PAE 1-2
PAE 1-3
PAE 2-2
PAE 2-3 PAE 3-3 PAE 4-4

S16

S17
11. References
(1) Liu, J.; Zhang, S.; Zhang, W.-X.; Xi, Z. Organometallics 2009, 28, 413.
(2) Zhu, Y.; Yang, H.; Jin, Y.; Zhang, W. Chem. Mater. 2013, 25, 3718.