system status briefing - eskom.co.za · summary of eskom system performance stream fix new plant 1...
TRANSCRIPT
System Status Briefing
Jan Oberholzer
Chief Operating Officer
04 September 2019

3 Prognosis for the next seven months (Summer Plan)
4 9-point Generation Recovery Plan
5 Conclusion
Contents
2 Review of Winter 2019
1 Overview
Overview
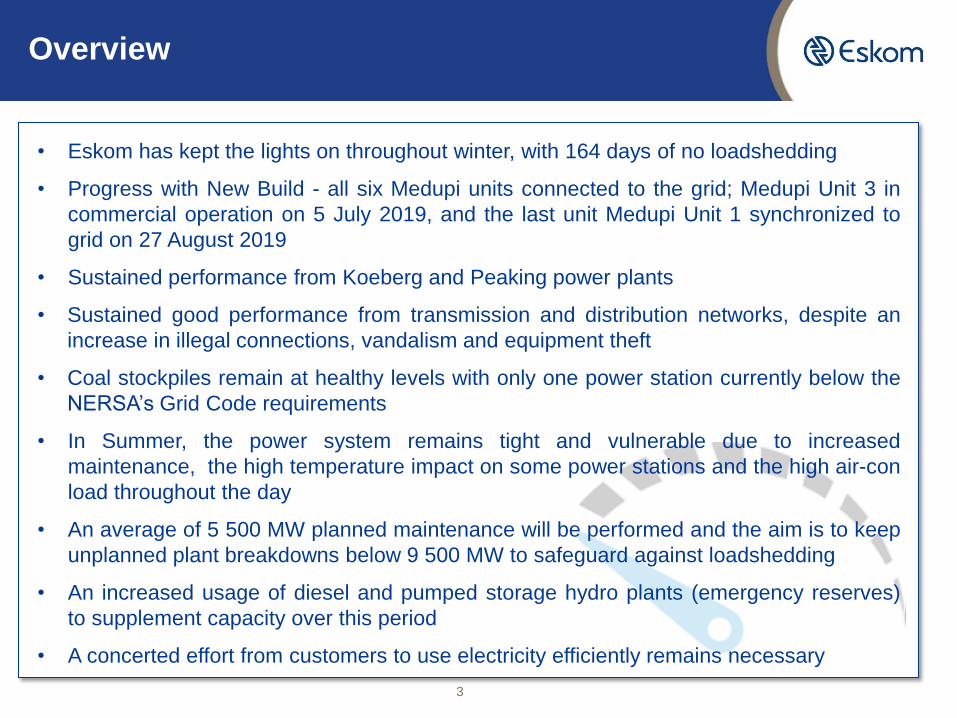
• Eskom has kept the lights on throughout winter, with 164 days of no loadshedding
• Progress with New Build - all six Medupi units connected to the grid; Medupi Unit 3 in
commercial operation on 5 July 2019, and the last unit Medupi Unit 1 synchronized to
grid on 27 August 2019
• Sustained performance from Koeberg and Peaking power plants
• Sustained good performance from transmission and distribution networks, despite an
increase in illegal connections, vandalism and equipment theft
• Coal stockpiles remain at healthy levels with only one power station currently below the
NERSA’s Grid Code requirements
• In Summer, the power system remains tight and vulnerable due to increased
maintenance, the high temperature impact on some power stations and the high air-con
load throughout the day
• An average of 5 500 MW planned maintenance will be performed and the aim is to keep
unplanned plant breakdowns below 9 500 MW to safeguard against loadshedding
• An increased usage of diesel and pumped storage hydro plants (emergency reserves)
to supplement capacity over this period
• A concerted effort from customers to use electricity efficiently remains necessary
3

Overview of Transmission, Distribution and New Build performance
Performance Status Division
Transmission
• Medupi Unit 3 in commercial operation on 5 July 2019
• Units synchronised to the National Grid:
‒ Medupi Unit 1 (27 August 2019) and Kusile Unit 3 (14 April 2019)
• 41 km of transmission lines constructed, against a target of 29km for the period April – August 2019 (year end target 155km)
New Build
Distribution
• Transmission performance experiences challenges:
‒ 18 interruptions YTD vs YE target of 34
‒ 2.65 SM<1 losses YTD vs YE target of 3.53
‒ 1 major incident (Apollo-Njala operating error)
‒ 3 incidents involving severe plant failures (with a combined SM impact of 1.36) impacted restoration response times
• Localised network outages are impacted by an increase in illegal connections,
vandalism and equipment theft
• Frequency of interruptions – 14.6 (YTD) vs YE target of 19.6
• 62 241 customer electrification (YTD) vs YE target of 177 000
• Outage durations – 37.7 vs YE target of 38
As at end Jan 2019
5
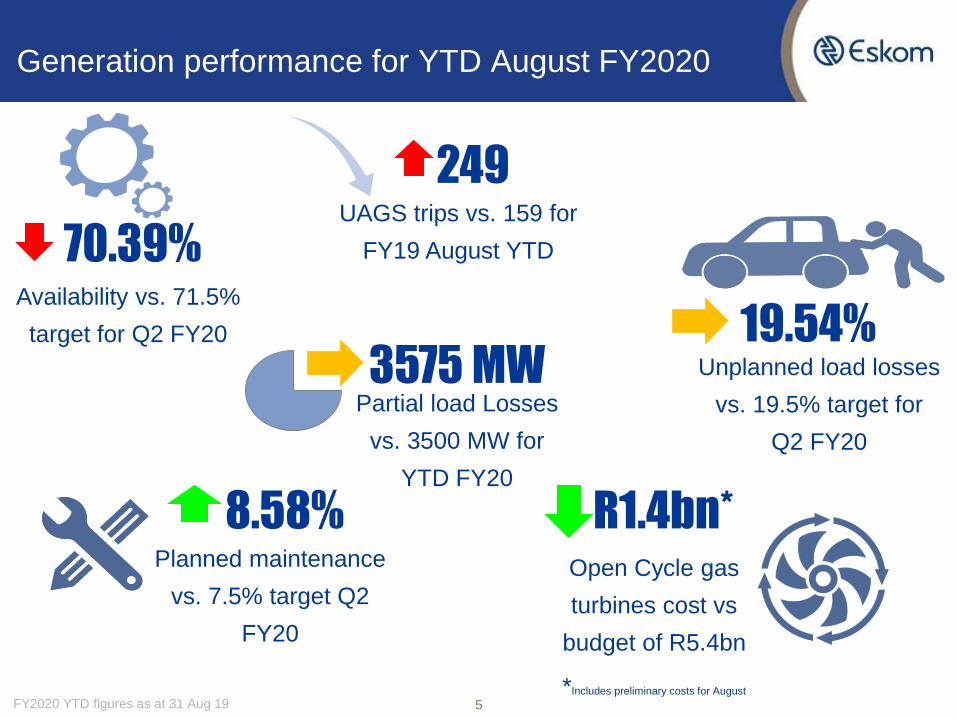
Generation performance for YTD August FY2020
19.54% Unplanned load losses
vs. 19.5% target for
Q2 FY20
70.39% Availability vs. 71.5%
target for Q2 FY20
R1.4bn* Open Cycle gas
turbines cost vs
budget of R5.4bn
*Includes preliminary costs for August
8.58% Planned maintenance
vs. 7.5% target Q2
FY20
249 UAGS trips vs. 159 for
FY19 August YTD
3575 MW Partial load Losses
vs. 3500 MW for
YTD FY20
FY2020 YTD figures as at 31 Aug 19

Performance has been improving since the beginning of FY20, with a decline in August, as per seasonal trends. This is still below the aspiration
Percentage (%)
FY2020 YTD figures as at 31 Aug 19
70.0 67.7 71.5 71.4 71.6 69.8 70.4
10.1 12.5 9.4 5.7 5.5 9.6 8.6
18.3 18.5 17.6 21.4 21.3 19.2 19.5
FY
19
YE
FY
20
YT
D
1.5 1.3
Ap
r’19
Ma
y’1
9
1.5
Ju
n’1
9
1.5 1.6
Ju
l’19
1.5
Au
g’1
9
1.6
OCLF
UCLF
PCLF
EAF
Contributing factors
• Undesired coal quality
• Financial and capacity
constraints leading to
minimal refurbishments and
maintenance on ageing
fleet (Midlife
Refurbishments)
• Outage execution slips
• Ops and maintenance skills
– availability and training
Generation monthly and YTD performance
9 Point
Recovery
Plan

7
1.35
19.54
1.30
2.96
2.15
1.58
8.15
2.05
0
5
10
15
20
4.70
FLLs BTLs Outage Slip Trips PLLs Total UCLF
Partial Load Losses (PLLs) contributed the most to UCLF for FY2020 August YTD
LT5 adds 1.35% UCLF to the base over an extended period
Major Events add 1.30% to the base over an extended period
UCLF improved in August at 19.2% as compared to June and July where it was 21.4% and 21.3% respectively.
Major events of 1.30% comprise 5 events at 4 stations (Kriel 2 & 3, Matla 5, Hendrina 6 and Kusile 1) each with a load loss > 300
GWh
Other full load losses of 2.05% comprise 230 separate full load loss events (load losses < 300 GWh)
Note: 300 GWh is equivalent to a 600 MW unit being out for approximately 3 weeks
Other FLLs
LT5
Major events
Build-up of UCLF for FY2020 August YTD from major contributors
Key insights
Full Load Losses, Partial Load Losses, slips and major incidents have been the major contributors to the increase in unplanned losses
Figures as at 29 July 2019 FY2020 YTD figures as at 31 Aug 19

8
Partial Load Loss Breakdown YTD August FY2020
Generation Partial load loss UCLF performance for the 2020 financial year
Key Insights
• Kendal, Arnot, Tutuka, Medupi and Kriel contribute about 62% of the total Partial Load Losses YTD.
• Draught Plant, Gas cleaning, Milling Plant, Feed water and Ash Plant were the main contributors (79% contribution)
for August YTD.
Duvha
15%
13%
13%
11% 10%
9%
6%
6%
4%
13%
Kendal
Tutuka
Arnot
Duvha
Kriel Medupi
Majuba
Camden
Matla
Other
29%
15%
13%
12%
10%
7%
7%
4% 5%
Gas Cleaning
Draught Plant
Ash Plant
Feed Water
Mills
Boiler
Turbine
Cooling Water
Other

3 Prognosis for the next seven months (Summer Plan)
4 9 Point Generation Recovery Plan
5 Conclusion
Contents
Review of Winter 2019
1 Overview
2

Eskom implemented no loadshedding in Winter
No loadshedding was implemented, against the risk of 26 days of potential Stage 1
loadshedding as forecasted in the Winter plan:
1. Energy Availability Factor 70.39 (August 2019 YTD) vs 67.7 (April 2019)
2. Successful implementation of 9 point Generation Recovery Plan
3. Generation unit breakdowns were maintained below 9 500 MW for most of the time
4. Demand was lower for most of Winter due to warmer weather and the economic climate
5. Other emergency resources such as demand response products and interruptible
contracts (ILS) also contributed significantly towards demand peak shaving
6. Three non-commercial units from Medupi and Kusile, delivered an average production of
1 300 MW during commissioning phase
7. The Cahora Bassa (Apollo HVDC line 2) was successfully recovered, connecting the full
compliment of 1 200 MW of imported renewable energy to the grid
8. Kriel Unit 2 (475 MW) & Matla Unit 5 (575 MW) returned to service adding 1 050 MW to
the grid
10
Less diesel was utilized than planned YTD actual R1.4bn versus
budget of R5.4bn

4 9 Point Generation Recovery Plan
5 Conclusion
Contents
3 Prognosis for the next seven months (Summer Plan)
2 Review of Winter 2019
1 Overview
Overall objective for Summer (next 7 months)
• Avoid loadshedding
• Execute an average of 5 500 MW of planned maintenance
• Keep unplanned plant breakdowns below 9 500 MW to safeguard against loadshedding
• Drive sustainable transmission and distribution network performance
• Encourage public participation and energy saving initiatives

What drives the summer plan?
• Customer usage generally changes from a typically high demand peak usage in the evenings during winter, to a reduced but sustained flat demand all day in summer
• Eskom uses this opportunity to take more generating units out of service for maintenance (Average of 5 500 MW)
• Warmer than normal temperatures expected, impacting the demand profile and plant performance (Average max. demand 30 000 MW)
• Three unplanned breakdowns (UCLF) scenarios considered: 8 500 MW, 9 500 MW and 10 500 MW
• The Summer Plan balances the need for increased maintenance against the risk of unreliable plant performance
• The usage of pumped storage and OCGT diesel generation to supplement capacity is necessary but consistent usage could result in a rapid depletion of emergency resources which could lead to loadshedding
• No coal related risks are expected throughout the summer months
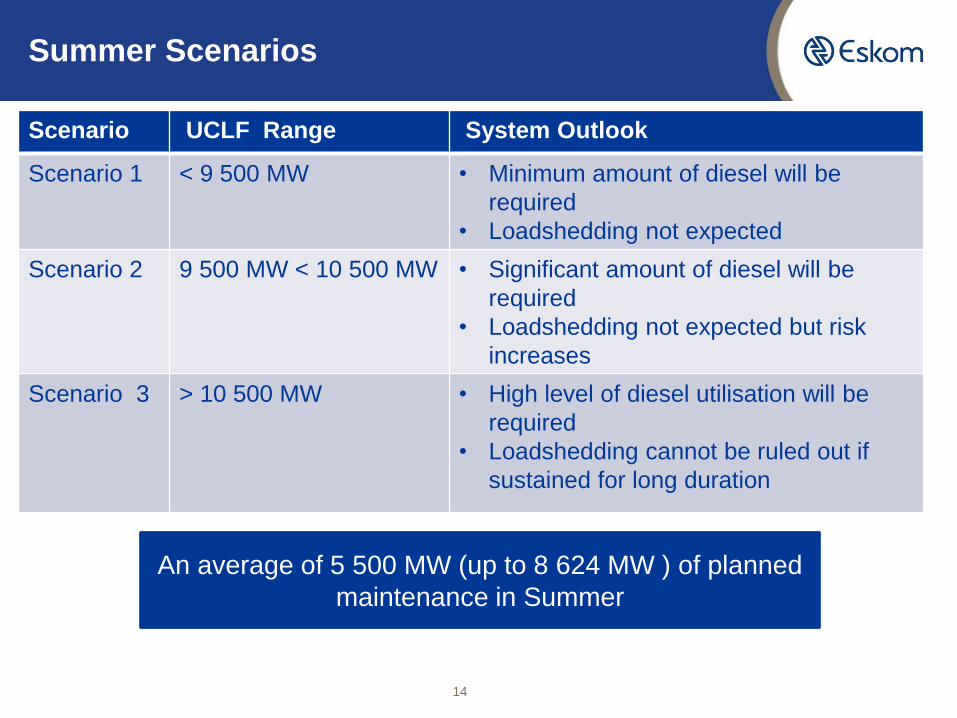
Summer Scenarios
14
Scenario UCLF Range System Outlook
Scenario 1 < 9 500 MW • Minimum amount of diesel will be
required
• Loadshedding not expected
Scenario 2 9 500 MW < 10 500 MW • Significant amount of diesel will be
required
• Loadshedding not expected but risk
increases
Scenario 3 > 10 500 MW • High level of diesel utilisation will be
required
• Loadshedding cannot be ruled out if
sustained for long duration
An average of 5 500 MW (up to 8 624 MW ) of planned
maintenance in Summer
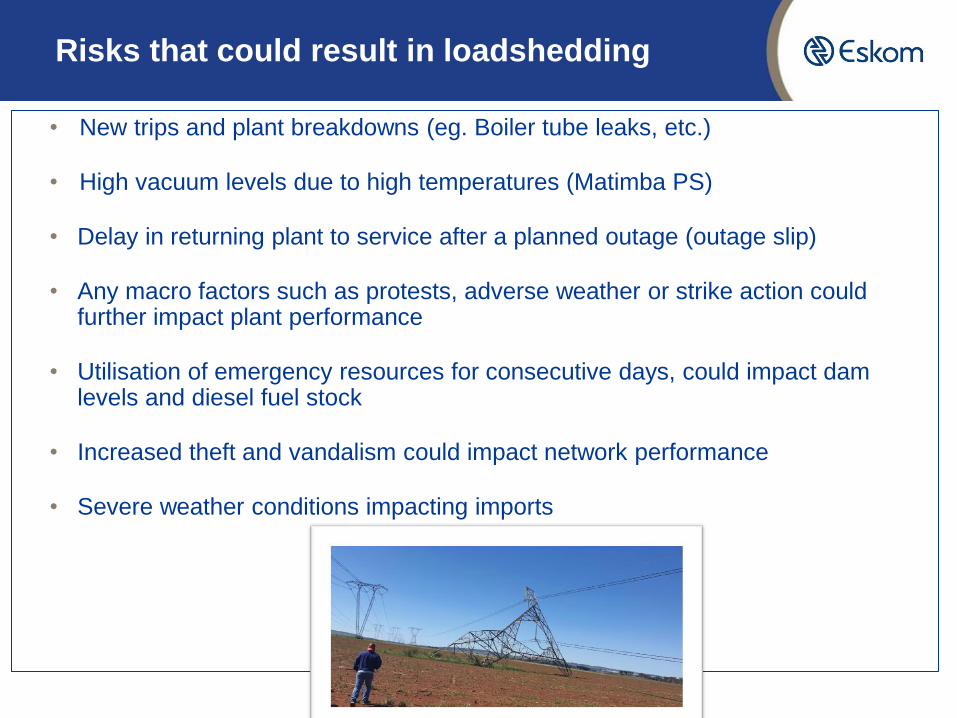
Risks that could result in loadshedding
• New trips and plant breakdowns (eg. Boiler tube leaks, etc.)
• High vacuum levels due to high temperatures (Matimba PS)
• Delay in returning plant to service after a planned outage (outage slip)
• Any macro factors such as protests, adverse weather or strike action could further impact plant performance
• Utilisation of emergency resources for consecutive days, could impact dam levels and diesel fuel stock
• Increased theft and vandalism could impact network performance
• Severe weather conditions impacting imports

4 9 point Generation Recovery Plan
5 Conclusion
Contents
3 Prognosis for the next seven months (Summer Plan)
2 Review of Winter 2019
1 Overview
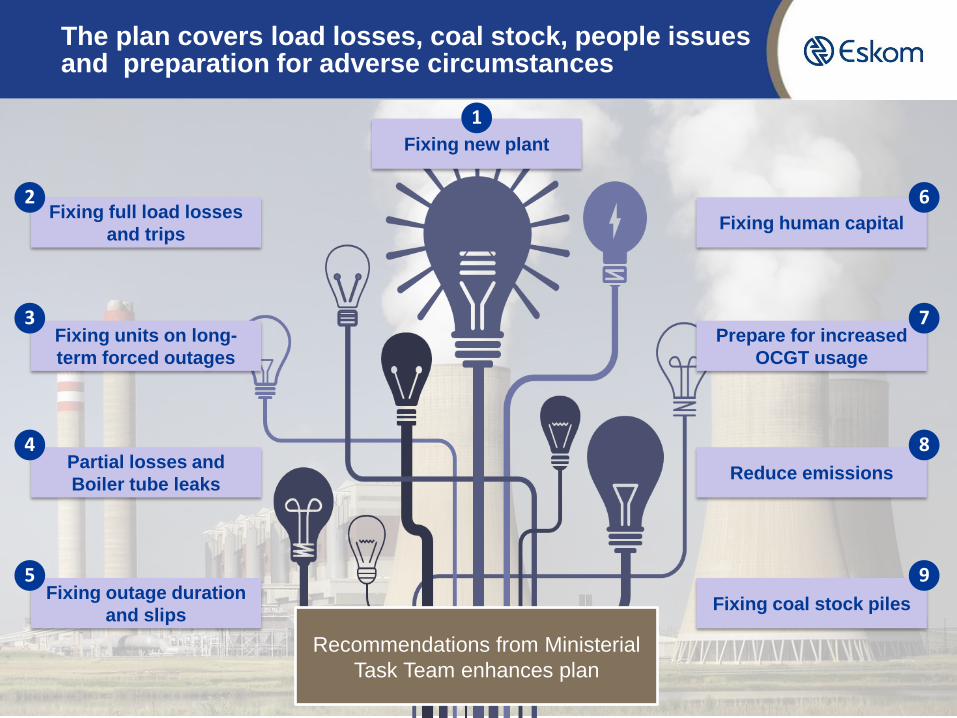
The plan covers load losses, coal stock, people issues and preparation for adverse circumstances
Fixing coal stock piles
Prepare for increased
OCGT usage
Fixing human capital
Reduce emissions
Fixing new plant
Fixing outage duration
and slips
Fixing units on long-
term forced outages
Fixing full load losses
and trips
Partial losses and
Boiler tube leaks
1
3
4
2
5
7
8
6
9
Recommendations from Ministerial
Task Team enhances plan
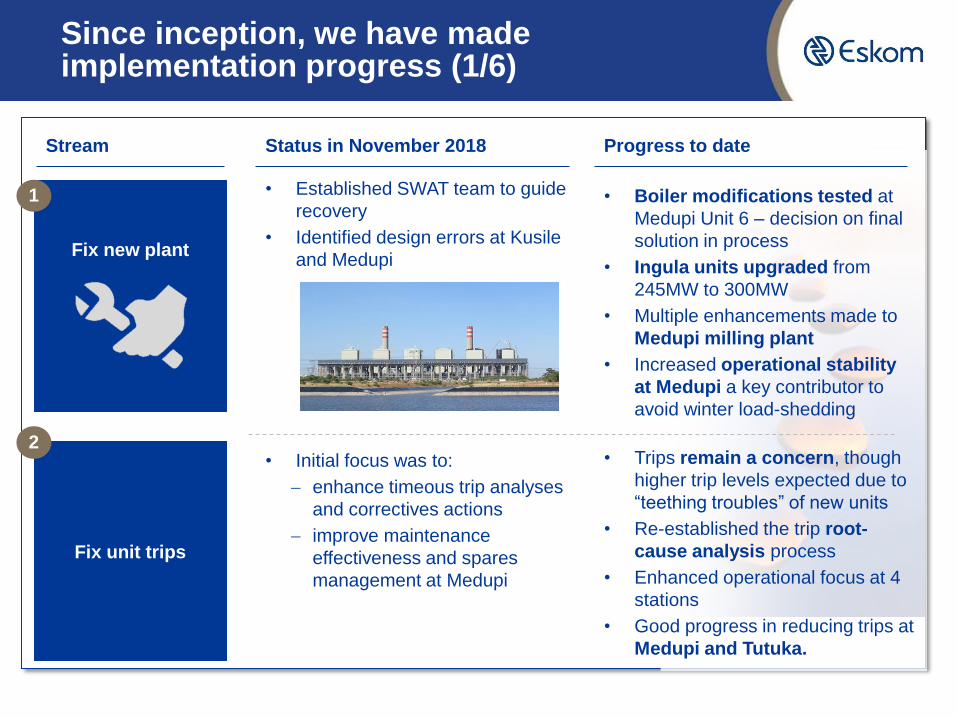
Since inception, we have made implementation progress (1/6)
Summary of Eskom system performance Stream
Fix new plant
1
Fix unit trips
2
Status in November 2018
• Established SWAT team to guide
recovery
• Identified design errors at Kusile
and Medupi
• Initial focus was to:
enhance timeous trip analyses
and correctives actions
improve maintenance
effectiveness and spares
management at Medupi
Progress to date
• Boiler modifications tested at
Medupi Unit 6 – decision on final
solution in process
• Ingula units upgraded from
245MW to 300MW
• Multiple enhancements made to
Medupi milling plant
• Increased operational stability
at Medupi a key contributor to
avoid winter load-shedding
• Trips remain a concern, though
higher trip levels expected due to
“teething troubles” of new units
• Re-established the trip root-
cause analysis process
• Enhanced operational focus at 4
stations
• Good progress in reducing trips at
Medupi and Tutuka.

Fix units on long-term forced outages 3 Stream
Status/Progress
Lethabo
Unit 5
(600MW)
• High Pressure steam pipe failure on 10 October 2018
• Procurement process unlocked with National Treasury, contractors
appointed and work commenced
• Planned outage scope executed during repair time
Grootvlei
Unit 2
(200 MW)
• Auxiliary steam range pipe burst on 26 January ‘18
• Also experienced Generator issues
• Initial delay due to funding constraints
Kriel
Unit 2
(600MW)
• Stator earth fault on 03 May ‘18
Duvha
Unit 4
(600MW)
• On 23 August ‘17, turbine tripped on generator stator earth
fault – returned on 6 Nov 2018 but was shut down again to
address a Generator H2 leak
Targeted Return
Date end Dec
2019
Returned
Returned
Returned
Description
Matla
Unit 5
(575MW)
• Cold reheat non return valve leak experience on
05 February 2019
Under assessment.
Return date to be
confirmed
Progress at risk Returned Progress in line with plan
Returned
Duvha
Unit 1
(600MW)
• Generator Stator fault on 17 Jul 2019
• Stator rewind required
• Return date Dec 2019
Assessment phase
Duvha
Unit 3
(600MW)
• Progress pending legal action To be confirmed
Since inception, we have made implementation progress (2/6)

Since inception, we have made implementation progress (3/6)
Fix partial losses
(PLLs) and Boiler
tube leaks
4
Fix outage
duration and
slips
5
• 63 outages scheduled to
address load losses till
Dec 2019
• Boiler tube failure
strategy in place
• Allocated specialist
resources at each station
to focus on planning,
readiness and execution
• Developed plan to focus
on Rotek performance –
enabling contracts, skills,
spares and quality
management
• Year-to-date PLLs of 3 575 MW against a
target of 3 500 MW
• Detailed review of boiler tube leaks
conducted and implementation plans per
station in process.
• Timeous and quality execution of
outages still a challenge
• Outage staff relinked to power stations
for direct control over execution
• All funding for the FY20,21,22 released
• Strong operational focus on availability
of spares
• 71 outages (FY20), 12 completed, 9 in
execution and 8 deferred.
Stream Status in November 2018 Progress to date
Up front
planning
Outage
readiness
Execution
quality
1. There will be continued focus to drive the outage plan, however funding is a constraint 2 Failures including preventables.

Since inception, we have made implementation progress (4/6)
Fix human capital
6
Prepare for
increased OCGT
usage
7
• Identified critical vacancies
and skills gaps at Power
station management,
operations and
maintenance areas
• Tank levels for diesel was
low with constrained
supply and excessive
usage
• Finance developed
plan to secure
supply of diesel
• Generation Group Executive appointed
• Support staff relinked to Power Station
Managers to support on-site operational
control
• All Generation critical vacancies
identified, targeted to be filled by
December 2019
• External appointment of 205 Eskom
trained plant operators
• All 9 Point Plan identified critical skills to
be filled as part of the above process.
• Lower than anticipated usage
• July 2019 load factor of 3.92%
• Tank levels in recent weeks
above 90%
• Final approval of five-year diesel
purchasing agreements
targeted to be approved by end
September 2019.
Stream Status in November 2018 Progress to date

Since inception, we have made implementation progress (5/6)
Reduce
Emissions
8 • Eskom not implementing
emission retrofit projects
within committed timelines
could lead to medium term
risk of 9 000 MW.
• Non-compliance to
Atmospheric Emission
License limits could lead to a
short term risk of 4 470 MW
• Stream focus changed to “Reduce
emissions”
• Focus on 7 of the 87 generation units
where emissions are high - a potential
risk of 4 470 MW
• Strong focus on expediting projects to
ensure timeous legal compliance.
• Kendal emissions have reduced in August
reducing the number of units which are
operating with high emissions to 4.
• Matla emissions reduced on the one high
emitting unit
Stream Status in November 2018 Progress to date

Since inception, we have made implementation progress (6/6)
Status in November 2018 Progress to date
Challenge • 1 station below Grid Code
requirement but above 15 days
• 10 stations below Grid Code
requirement
• 5 of the 10 stations below 10 days
Stock pile
levels
• 50.0 days as at 03 Sept 2019
• Actual stock days 35.6 days on
31 March 2019
• All stations reach expected level
by Dec 2019
• 25.2 days
• Projecting to grow to 28.2 days
by 31 March 2019
• All stations reach expected level
by Feb 2020
Stations
impacted
• Kriel • Arnot, Camden, Duvha, Hendrina,
Kendal, Komati, Kriel, Majuba ,
Matla and Tutuka
• Rain: Mitigations in place include compacted dry strategic stockpiles and wet coal
handling procedure – continued focus on remaining 2 power stations to ensure
sufficient dry coal.
Fix coal stockpiles 9 Stream
• Coal Quality – Good progress with coal quality related OCLF at 0.66%.
Significant improvements at Matla. Further improvements not necessarily
financially viable.
Risks
Coal Quality

4 9 Point Generation Recovery Plan
5 Conclusion
Contents
3 Prognosis for the next seven months (Summer Plan)
2 Review of Winter 2019
1 Overview

Conclusion
Summary of Eskom system performance • Eskom is committed to recovering its operational performance
• The generation 9-point recovery plan is on track and has yielded some
positive results
• Reducing outage slips remains a key focus area during summer
maintenance season
• While planned plant maintenance remains a priority (average 5 500 MW),
keeping unplanned plant breakdowns below 9 500 MW is necessary to
safeguard against loadshedding
• Heightened focus on sustained transmission and distribution network
performance
• No risk foreseen for coal stock days in summer
• The summer plan will be reviewed on a regular basis in response to
changes on system performance
• We appeal to customers to continue to use electricity sparingly, as the risk
of loadshedding remains
25

1 Use the cold water tap
rather than using the geyser
every time
2 When you leave the room,
remember to switch off the
lights
3
0o
OFF
Set your swimming pool pump
cycle to run twice a day, three
hours at a time for optimal
energy use. And avoid running a cycle
between 5pm and 9pm to support the power
system
4 Set air-conditioners’
average temperature in
summer at 23ºC
5 Be energy efficient and
change your light bulbs to
energy efficient lights/LED’s
6 At the end of the day, turn off
computers, copiers, printers
and fax machines at the
switch. Avoid stand-by or
sleep mode.
2 3
It can be this easy for households to save
electricity (and costs) during summer

Thank you