table a-16. standard error of median annual salaries … · 2,000: 1,500 2,500: hispanic or latino...
TRANSCRIPT
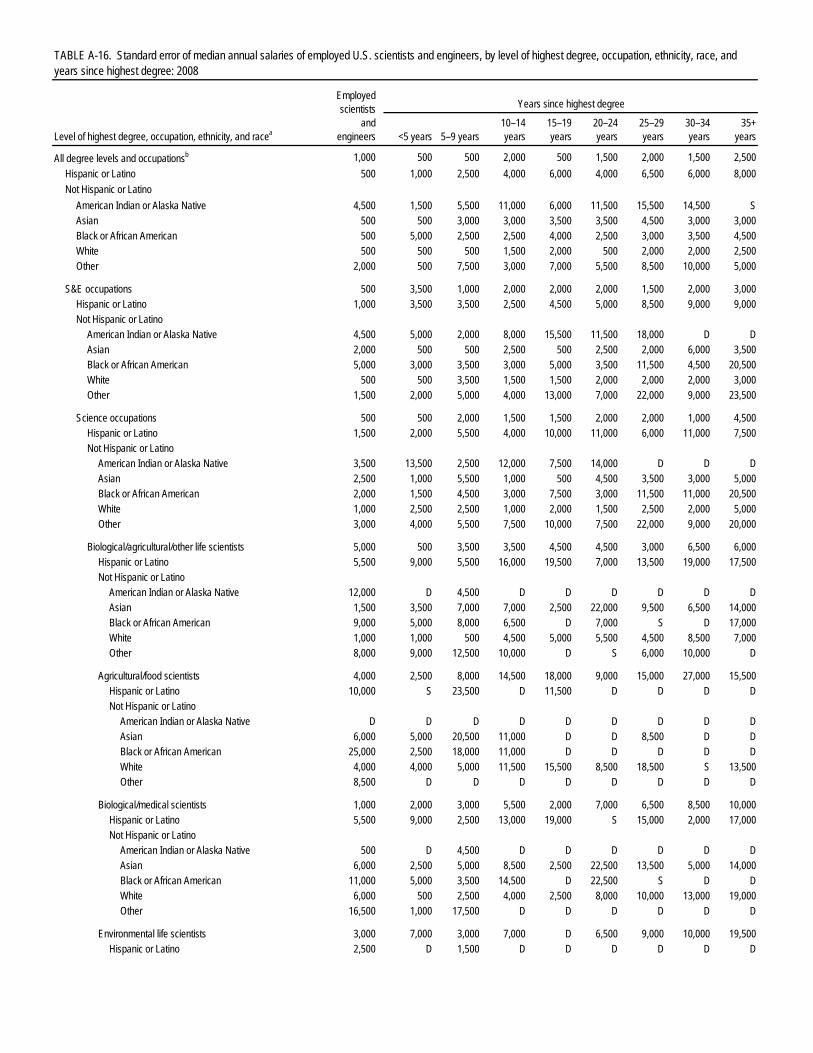
All degree levels and occupationsb 1,000 500 500 2,000 500 1,500 2,000 1,500 2,500Hispanic or Latino 500 1,000 2,500 4,000 6,000 4,000 6,500 6,000 8,000Not Hispanic or Latino
American Indian or Alaska Native 4,500 1,500 5,500 11,000 6,000 11,500 15,500 14,500 SAsian 500 500 3,000 3,000 3,500 3,500 4,500 3,000 3,000Black or African American 500 5,000 2,500 2,500 4,000 2,500 3,000 3,500 4,500White 500 500 500 1,500 2,000 500 2,000 2,000 2,500Other 2,000 500 7,500 3,000 7,000 5,500 8,500 10,000 5,000
S&E occupations 500 3,500 1,000 2,000 2,000 2,000 1,500 2,000 3,000
Hispanic or Latino 1,000 3,500 3,500 2,500 4,500 5,000 8,500 9,000 9,000Not Hispanic or Latino
American Indian or Alaska Native 4,500 5,000 2,000 8,000 15,500 11,500 18,000 D DAsian 2,000 500 500 2,500 500 2,500 2,000 6,000 3,500Black or African American 5,000 3,000 3,500 3,000 5,000 3,500 11,500 4,500 20,500White 500 500 3,500 1,500 1,500 2,000 2,000 2,000 3,000Other 1,500 2,000 5,000 4,000 13,000 7,000 22,000 9,000 23,500
Science occupations 500 500 2,000 1,500 1,500 2,000 2,000 1,000 4,500
Hispanic or Latino 1,500 2,000 5,500 4,000 10,000 11,000 6,000 11,000 7,500Not Hispanic or Latino
American Indian or Alaska Native 3,500 13,500 2,500 12,000 7,500 14,000 D D DAsian 2,500 1,000 5,500 1,000 500 4,500 3,500 3,000 5,000Black or African American 2,000 1,500 4,500 3,000 7,500 3,000 11,500 11,000 20,500White 1,000 2,500 2,500 1,000 2,000 1,500 2,500 2,000 5,000Other 3,000 4,000 5,500 7,500 10,000 7,500 22,000 9,000 20,000
Biological/agricultural/other life scientists 5,000 500 3,500 3,500 4,500 4,500 3,000 6,500 6,000
Hispanic or Latino 5,500 9,000 5,500 16,000 19,500 7,000 13,500 19,000 17,500Not Hispanic or Latino
American Indian or Alaska Native 12,000 D 4,500 D D D D D DAsian 1,500 3,500 7,000 7,000 2,500 22,000 9,500 6,500 14,000Black or African American 9,000 5,000 8,000 6,500 D 7,000 S D 17,000White 1,000 1,000 500 4,500 5,000 5,500 4,500 8,500 7,000Other 8,000 9,000 12,500 10,000 D S 6,000 10,000 D
Agricultural/food scientists 4,000 2,500 8,000 14,500 18,000 9,000 15,000 27,000 15,500
Hispanic or Latino 10,000 S 23,500 D 11,500 D D D DNot Hispanic or Latino
American Indian or Alaska Native D D D D D D D D DAsian 6,000 5,000 20,500 11,000 D D 8,500 D DBlack or African American 25,000 2,500 18,000 11,000 D D D D DWhite 4,000 4,000 5,000 11,500 15,500 8,500 18,500 S 13,500Other 8,500 D D D D D D D D
Biological/medical scientists 1,000 2,000 3,000 5,500 2,000 7,000 6,500 8,500 10,000
Hispanic or Latino 5,500 9,000 2,500 13,000 19,000 S 15,000 2,000 17,000Not Hispanic or Latino
American Indian or Alaska Native 500 D 4,500 D D D D D DAsian 6,000 2,500 5,000 8,500 2,500 22,500 13,500 5,000 14,000Black or African American 11,000 5,000 3,500 14,500 D 22,500 S D DWhite 6,000 500 2,500 4,000 2,500 8,000 10,000 13,000 19,000Other 16,500 1,000 17,500 D D D D D D
Environmental life scientists 3,000 7,000 3,000 7,000 D 6,500 9,000 10,000 19,500
Hispanic or Latino 2,500 D 1,500 D D D D D D
TABLE A-16. Standard error of median annual salaries of employed U.S. scientists and engineers, by level of highest degree, occupation, ethnicity, race, and years since highest degree: 2008
Level of highest degree, occupation, ethnicity, and racea
Employed scientists
and engineers
Years since highest degree
<5 years 5–9 years10–14years
15–19 years
20–24 years
25–29 years
30–34 years
35+ years
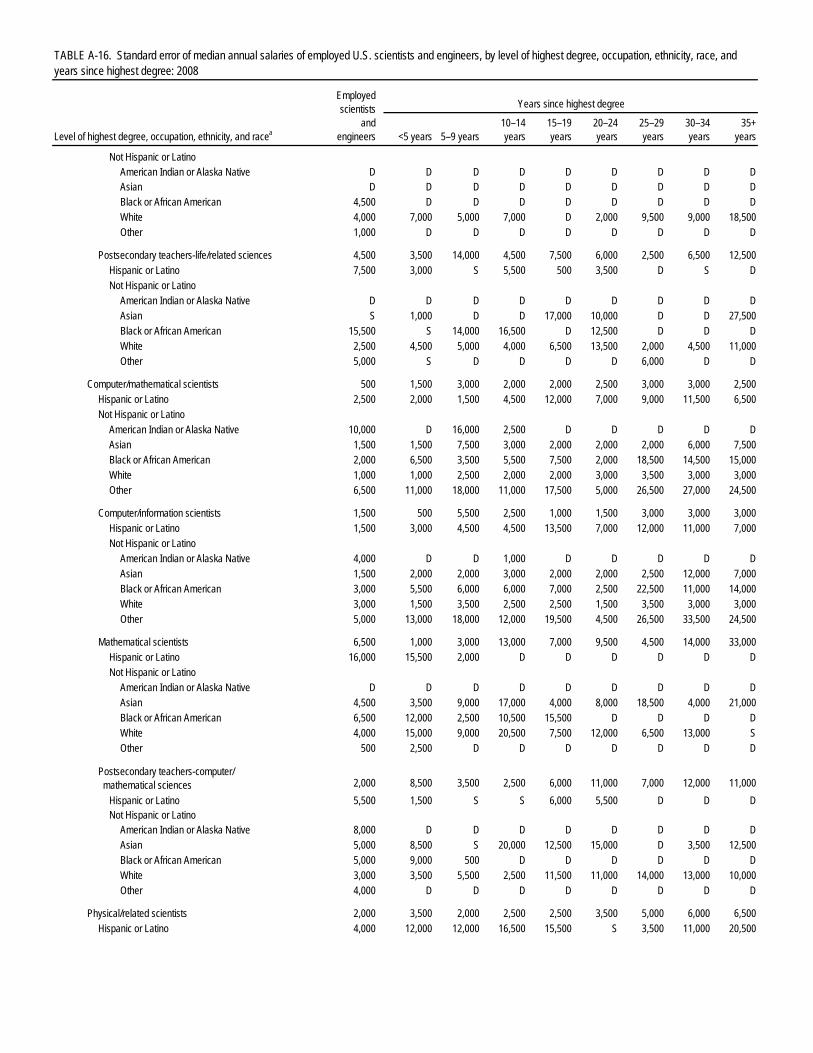
Not Hispanic or Latino American Indian or Alaska Native D D D D D D D D DAsian D D D D D D D D DBlack or African American 4,500 D D D D D D D DWhite 4,000 7,000 5,000 7,000 D 2,000 9,500 9,000 18,500Other 1,000 D D D D D D D D
Postsecondary teachers-life/related sciences 4,500 3,500 14,000 4,500 7,500 6,000 2,500 6,500 12,500
Hispanic or Latino 7,500 3,000 S 5,500 500 3,500 D S DNot Hispanic or Latino
American Indian or Alaska Native D D D D D D D D DAsian S 1,000 D D 17,000 10,000 D D 27,500Black or African American 15,500 S 14,000 16,500 D 12,500 D D DWhite 2,500 4,500 5,000 4,000 6,500 13,500 2,000 4,500 11,000Other 5,000 S D D D D 6,000 D D
Computer/mathematical scientists 500 1,500 3,000 2,000 2,000 2,500 3,000 3,000 2,500
Hispanic or Latino 2,500 2,000 1,500 4,500 12,000 7,000 9,000 11,500 6,500Not Hispanic or Latino
American Indian or Alaska Native 10,000 D 16,000 2,500 D D D D DAsian 1,500 1,500 7,500 3,000 2,000 2,000 2,000 6,000 7,500Black or African American 2,000 6,500 3,500 5,500 7,500 2,000 18,500 14,500 15,000White 1,000 1,000 2,500 2,000 2,000 3,000 3,500 3,000 3,000Other 6,500 11,000 18,000 11,000 17,500 5,000 26,500 27,000 24,500
Computer/information scientists 1,500 500 5,500 2,500 1,000 1,500 3,000 3,000 3,000
Hispanic or Latino 1,500 3,000 4,500 4,500 13,500 7,000 12,000 11,000 7,000Not Hispanic or Latino
American Indian or Alaska Native 4,000 D D 1,000 D D D D DAsian 1,500 2,000 2,000 3,000 2,000 2,000 2,500 12,000 7,000Black or African American 3,000 5,500 6,000 6,000 7,000 2,500 22,500 11,000 14,000White 3,000 1,500 3,500 2,500 2,500 1,500 3,500 3,000 3,000Other 5,000 13,000 18,000 12,000 19,500 4,500 26,500 33,500 24,500
Mathematical scientists 6,500 1,000 3,000 13,000 7,000 9,500 4,500 14,000 33,000
Hispanic or Latino 16,000 15,500 2,000 D D D D D DNot Hispanic or Latino
American Indian or Alaska Native D D D D D D D D DAsian 4,500 3,500 9,000 17,000 4,000 8,000 18,500 4,000 21,000Black or African American 6,500 12,000 2,500 10,500 15,500 D D D DWhite 4,000 15,000 9,000 20,500 7,500 12,000 6,500 13,000 SOther 500 2,500 D D D D D D D
Postsecondary teachers-computer/ mathematical sciences 2,000 8,500 3,500 2,500 6,000 11,000 7,000 12,000 11,000
Hispanic or Latino 5,500 1,500 S S 6,000 5,500 D D DNot Hispanic or Latino
American Indian or Alaska Native 8,000 D D D D D D D DAsian 5,000 8,500 S 20,000 12,500 15,000 D 3,500 12,500Black or African American 5,000 9,000 500 D D D D D DWhite 3,000 3,500 5,500 2,500 11,500 11,000 14,000 13,000 10,000Other 4,000 D D D D D D D D
Physical/related scientists 2,000 3,500 2,000 2,500 2,500 3,500 5,000 6,000 6,500
Hispanic or Latino 4,000 12,000 12,000 16,500 15,500 S 3,500 11,000 20,500

TABLE A-16. Standard error of median annual salaries of employed U.S. scientists and engineers, by level of highest degree, occupation, ethnicity, race, and years since highest degree: 2008
Level of highest degree, occupation, ethnicity, and racea
Employed scientists
and engineers
Years since highest degree
<5 years 5–9 years10–14years
15–19 years
20–24 years
25–29 years
30–34 years
35+ years
Not Hispanic or Latino American Indian or Alaska Native 8,500 S 27,500 D D D D D DAsian 2,000 9,000 1,000 16,000 8,000 2,500 14,500 10,500 5,000Black or African American 6,000 10,500 18,000 6,000 D D 11,000 25,500 18,000White 1,500 500 3,000 3,500 4,500 4,500 6,000 6,000 12,000Other 5,000 8,000 1,500 D D D S 14,000 D
Chemists, except biochemists 2,000 1,000 4,500 7,000 2,500 6,000 8,500 8,500 5,500
Hispanic or Latino 13,500 12,000 8,500 7,500 D D 10,500 D DNot Hispanic or Latino
American Indian or Alaska Native D D D D D D D D DAsian 3,500 9,000 2,500 16,000 9,000 10,000 S 9,500 5,500Black or African American 9,500 6,500 24,500 5,500 D D D 16,500 DWhite 2,500 2,000 5,000 7,500 4,500 8,500 14,000 11,000 12,500Other 9,500 S 7,000 D D D D D D
Earth/atmospheric/ocean scientists 3,000 2,000 6,000 8,000 6,000 7,500 6,500 7,500 28,500
Hispanic or Latino 19,000 20,000 D 10,000 23,000 D D D DNot Hispanic or Latino
American Indian or Alaska Native 10,000 D D D D D D D DAsian 14,500 14,500 13,000 12,000 D 500 D D DBlack or African American 6,000 16,500 D D D D D D DWhite 4,000 2,000 5,500 8,500 8,000 6,500 5,500 10,500 27,500Other 6,500 11,000 1,500 D D D D D D
Physicists/astronomers 3,000 11,000 10,000 5,500 6,500 8,000 4,000 26,000 14,000
Hispanic or Latino 11,000 12,000 13,000 D D D D D DNot Hispanic or Latino
American Indian or Alaska Native D D D D D D D D DAsian 11,000 8,500 15,000 D 15,500 4,500 2,500 D DBlack or African American S 1,000 D D D D D D DWhite 5,500 3,000 4,000 6,000 6,500 7,000 11,500 27,500 6,000Other 10,500 5,500 D D D D D D D
Postsecondary teachers-physical/ related sciences 3,500 1,500 3,000 5,000 6,500 5,000 9,000 4,500 14,500
Hispanic or Latino 2,500 8,500 8,500 5,500 7,000 8,000 28,000 D DNot Hispanic or Latino
American Indian or Alaska Native D D D D D D D D DAsian 10,000 3,000 5,000 D 18,500 15,000 17,000 13,000 11,500Black or African American 5,500 11,500 2,000 3,000 D D D 20,000 DWhite 3,000 1,000 5,500 7,000 6,000 5,000 10,500 2,500 24,500Other S S D D 11,000 D D D D
Other physical/related scientists 3,000 3,500 2,500 4,000 14,500 20,000 13,000 7,500 32,000
Hispanic or Latino 16,000 13,500 8,000 D D D D D DNot Hispanic or Latino
American Indian or Alaska Native D D D D D D D D DAsian 11,000 S D D D D D D DBlack or African American 31,000 D 9,000 D D D D D DWhite 4,000 5,000 2,500 3,000 12,500 23,500 10,500 8,500 28,500Other 3,000 D D D D D D D D
Social/related scientists 500 2,500 1,500 3,000 5,500 7,500 4,000 8,000 4,000
Hispanic or Latino 8,000 10,500 2,500 24,500 4,500 3,500 22,500 S 8,500
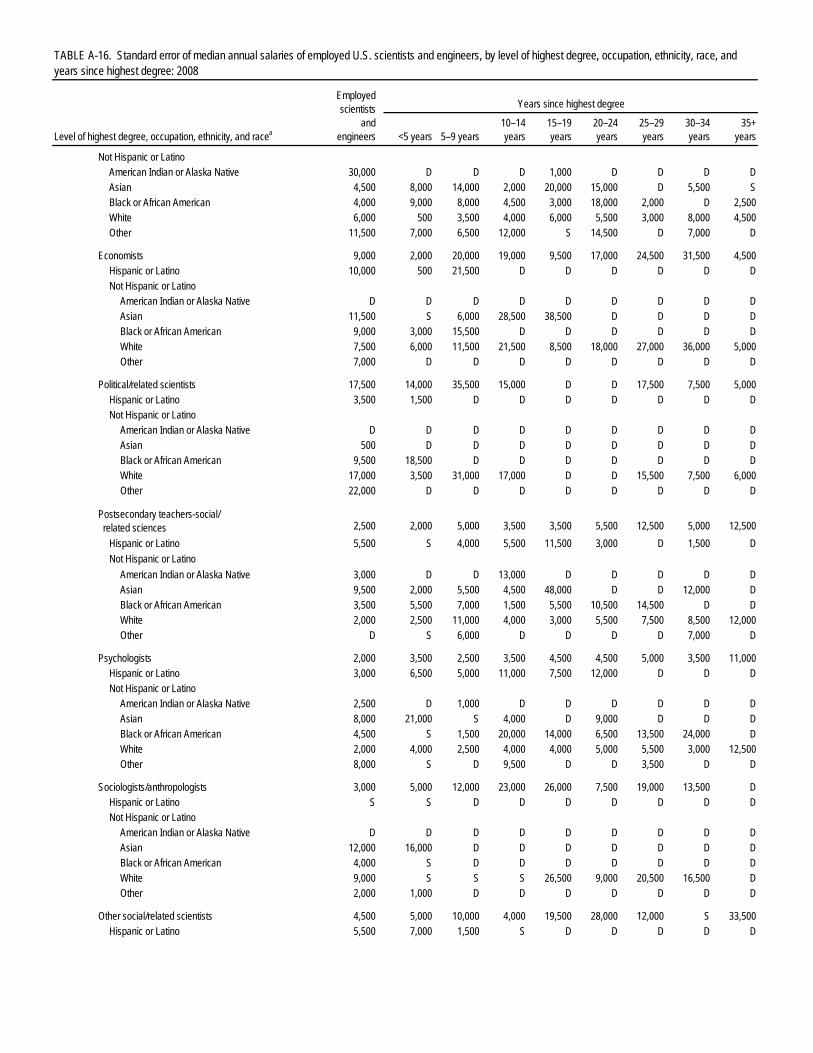
TABLE A-16. Standard error of median annual salaries of employed U.S. scientists and engineers, by level of highest degree, occupation, ethnicity, race, and years since highest degree: 2008
Level of highest degree, occupation, ethnicity, and racea
Employed scientists
and engineers
Years since highest degree
<5 years 5–9 years10–14years
15–19 years
20–24 years
25–29 years
30–34 years
35+ years
Not Hispanic or Latino American Indian or Alaska Native 30,000 D D D 1,000 D D D DAsian 4,500 8,000 14,000 2,000 20,000 15,000 D 5,500 SBlack or African American 4,000 9,000 8,000 4,500 3,000 18,000 2,000 D 2,500White 6,000 500 3,500 4,000 6,000 5,500 3,000 8,000 4,500Other 11,500 7,000 6,500 12,000 S 14,500 D 7,000 D
Economists 9,000 2,000 20,000 19,000 9,500 17,000 24,500 31,500 4,500
Hispanic or Latino 10,000 500 21,500 D D D D D DNot Hispanic or Latino
American Indian or Alaska Native D D D D D D D D DAsian 11,500 S 6,000 28,500 38,500 D D D DBlack or African American 9,000 3,000 15,500 D D D D D DWhite 7,500 6,000 11,500 21,500 8,500 18,000 27,000 36,000 5,000Other 7,000 D D D D D D D D
Political/related scientists 17,500 14,000 35,500 15,000 D D 17,500 7,500 5,000
Hispanic or Latino 3,500 1,500 D D D D D D DNot Hispanic or Latino
American Indian or Alaska Native D D D D D D D D DAsian 500 D D D D D D D DBlack or African American 9,500 18,500 D D D D D D DWhite 17,000 3,500 31,000 17,000 D D 15,500 7,500 6,000Other 22,000 D D D D D D D D
Postsecondary teachers-social/ related sciences 2,500 2,000 5,000 3,500 3,500 5,500 12,500 5,000 12,500
Hispanic or Latino 5,500 S 4,000 5,500 11,500 3,000 D 1,500 DNot Hispanic or Latino
American Indian or Alaska Native 3,000 D D 13,000 D D D D DAsian 9,500 2,000 5,500 4,500 48,000 D D 12,000 DBlack or African American 3,500 5,500 7,000 1,500 5,500 10,500 14,500 D DWhite 2,000 2,500 11,000 4,000 3,000 5,500 7,500 8,500 12,000Other D S 6,000 D D D D 7,000 D
Psychologists 2,000 3,500 2,500 3,500 4,500 4,500 5,000 3,500 11,000
Hispanic or Latino 3,000 6,500 5,000 11,000 7,500 12,000 D D DNot Hispanic or Latino
American Indian or Alaska Native 2,500 D 1,000 D D D D D DAsian 8,000 21,000 S 4,000 D 9,000 D D DBlack or African American 4,500 S 1,500 20,000 14,000 6,500 13,500 24,000 DWhite 2,000 4,000 2,500 4,000 4,000 5,000 5,500 3,000 12,500Other 8,000 S D 9,500 D D 3,500 D D
Sociologists/anthropologists 3,000 5,000 12,000 23,000 26,000 7,500 19,000 13,500 D
Hispanic or Latino S S D D D D D D DNot Hispanic or Latino
American Indian or Alaska Native D D D D D D D D DAsian 12,000 16,000 D D D D D D DBlack or African American 4,000 S D D D D D D DWhite 9,000 S S S 26,500 9,000 20,500 16,500 DOther 2,000 1,000 D D D D D D D
Other social/related scientists 4,500 5,000 10,000 4,000 19,500 28,000 12,000 S 33,500
Hispanic or Latino 5,500 7,000 1,500 S D D D D D

TABLE A-16. Standard error of median annual salaries of employed U.S. scientists and engineers, by level of highest degree, occupation, ethnicity, race, and years since highest degree: 2008
Level of highest degree, occupation, ethnicity, and racea
Employed scientists
and engineers
Years since highest degree
<5 years 5–9 years10–14years
15–19 years
20–24 years
25–29 years
30–34 years
35+ years
Not Hispanic or Latino American Indian or Alaska Native D D D D D D D D DAsian 11,500 2,000 21,500 S 15,500 D D 6,500 DBlack or African American 6,500 2,500 500 D D D D D DWhite 6,000 1,000 8,000 3,000 21,000 40,000 4,500 31,000 33,000Other 28,500 2,500 D D D D D D D
Engineering occupations 1,000 500 500 1,500 1,500 1,500 500 2,500 3,500
Hispanic or Latino 3,000 500 5,000 3,000 7,000 6,500 18,500 11,000 12,000Not Hispanic or Latino
American Indian or Alaska Native 9,500 4,500 23,500 D 43,000 D D D DAsian 1,000 500 3,500 4,500 5,000 1,000 3,000 8,000 5,000Black or African American 3,500 4,000 6,500 3,000 5,000 21,500 8,500 3,500 DWhite 1,000 1,500 500 2,000 2,000 2,000 500 3,000 4,000Other 3,500 4,500 9,000 5,500 8,500 11,500 9,000 17,500 S
Aerospace/aeronautical/astronautical engineers 2,500 1,500 3,500 3,000 8,000 4,000 7,000 5,000 11,000
Hispanic or Latino 15,000 500 8,500 D D 11,000 D D DNot Hispanic or Latino
American Indian or Alaska Native D D D D D D D D DAsian 4,000 1,000 7,000 2,500 7,000 5,500 D 6,000 17,000Black or African American 22,500 1,000 D D D D D D DWhite 4,000 4,000 4,500 6,500 8,500 5,000 9,000 11,500 10,500Other 9,000 16,500 6,000 D D D D D D
Chemical engineers 2,500 3,500 1,500 3,000 5,000 5,500 4,500 9,500 8,000
Hispanic or Latino 10,000 1,000 7,500 D S D D D DNot Hispanic or Latino
American Indian or Alaska Native D D D D D D D D DAsian 4,000 1,500 3,000 3,500 9,500 27,500 10,000 25,500 19,500Black or African American 6,000 D D D D D D D DWhite 2,500 4,000 1,000 2,000 7,500 7,000 2,500 8,500 12,000Other 11,000 4,000 D D D D D D D
Civil/architectural/sanitary engineers 1,000 1,500 500 1,000 2,000 3,000 4,000 4,500 6,500
Hispanic or Latino 5,500 2,000 1,000 5,500 11,500 D 25,500 S 8,000Not Hispanic or Latino
American Indian or Alaska Native 2,500 D D D D D D D DAsian 1,500 1,500 6,000 5,000 13,000 15,000 3,500 3,500 5,000Black or African American 4,000 5,000 7,500 8,000 10,000 10,000 D D DWhite 500 500 500 500 2,500 3,500 3,500 6,000 7,000Other 9,000 4,000 5,000 13,000 D D D D D
Electrical/computer hardware engineers 1,500 500 4,000 2,000 2,000 3,000 2,500 4,500 7,000
Hispanic or Latino 4,000 1,500 10,000 3,500 6,000 25,000 7,000 11,500 DNot Hispanic or Latino
American Indian or Alaska Native 10,000 D D D D D D D DAsian 3,000 14,500 8,000 5,000 2,000 4,500 6,000 19,500 11,000Black or African American 5,000 1,500 1,000 6,500 D 21,500 11,000 2,000 DWhite 1,500 1,000 3,500 2,000 2,500 3,000 3,000 5,000 6,500Other 3,500 3,000 3,000 D D 9,500 D D D
Industrial engineers 3,000 1,500 10,000 4,000 3,500 6,000 10,500 6,500 9,500
Hispanic or Latino 3,000 3,500 21,500 7,000 12,000 D D D DNot Hispanic or Latino
American Indian or Alaska Native D D D D D D D D DAsian 2,500 1,000 1,000 7,500 D 10,000 D D D
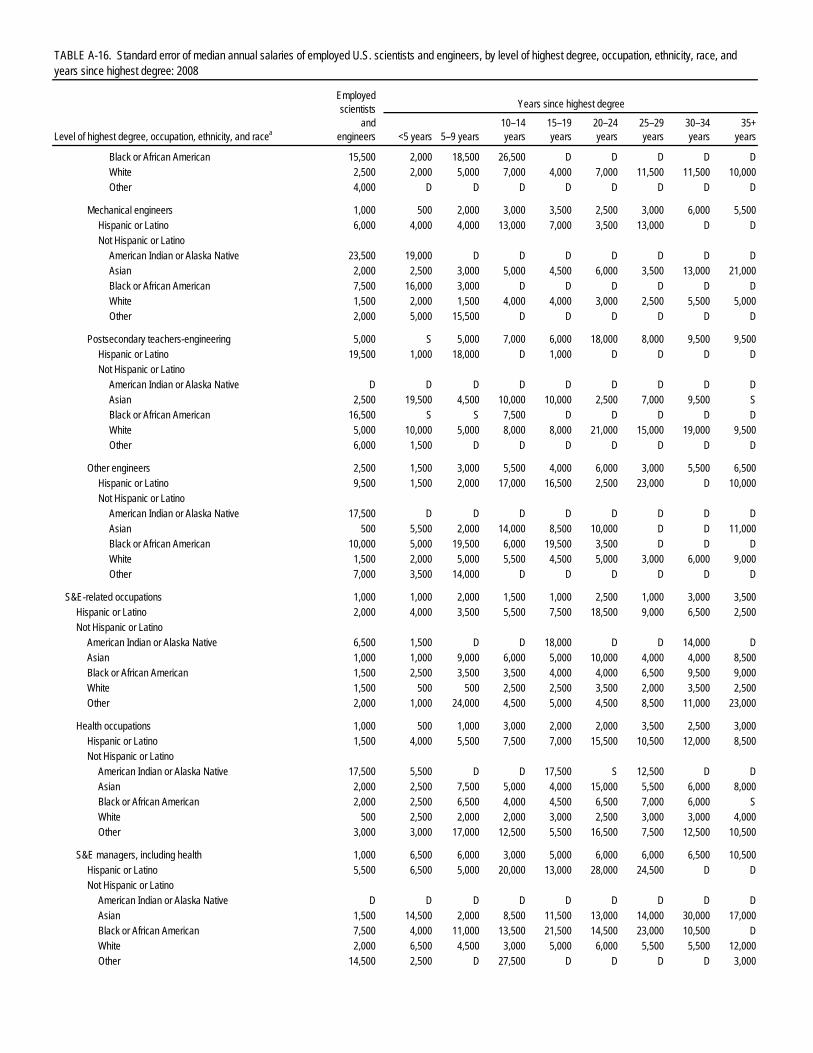
TABLE A-16. Standard error of median annual salaries of employed U.S. scientists and engineers, by level of highest degree, occupation, ethnicity, race, and years since highest degree: 2008
Level of highest degree, occupation, ethnicity, and racea
Employed scientists
and engineers
Years since highest degree
<5 years 5–9 years10–14years
15–19 years
20–24 years
25–29 years
30–34 years
35+ years
Black or African American 15,500 2,000 18,500 26,500 D D D D DWhite 2,500 2,000 5,000 7,000 4,000 7,000 11,500 11,500 10,000Other 4,000 D D D D D D D D
Mechanical engineers 1,000 500 2,000 3,000 3,500 2,500 3,000 6,000 5,500
Hispanic or Latino 6,000 4,000 4,000 13,000 7,000 3,500 13,000 D DNot Hispanic or Latino
American Indian or Alaska Native 23,500 19,000 D D D D D D DAsian 2,000 2,500 3,000 5,000 4,500 6,000 3,500 13,000 21,000Black or African American 7,500 16,000 3,000 D D D D D DWhite 1,500 2,000 1,500 4,000 4,000 3,000 2,500 5,500 5,000Other 2,000 5,000 15,500 D D D D D D
Postsecondary teachers-engineering 5,000 S 5,000 7,000 6,000 18,000 8,000 9,500 9,500
Hispanic or Latino 19,500 1,000 18,000 D 1,000 D D D DNot Hispanic or Latino
American Indian or Alaska Native D D D D D D D D DAsian 2,500 19,500 4,500 10,000 10,000 2,500 7,000 9,500 SBlack or African American 16,500 S S 7,500 D D D D DWhite 5,000 10,000 5,000 8,000 8,000 21,000 15,000 19,000 9,500Other 6,000 1,500 D D D D D D D
Other engineers 2,500 1,500 3,000 5,500 4,000 6,000 3,000 5,500 6,500
Hispanic or Latino 9,500 1,500 2,000 17,000 16,500 2,500 23,000 D 10,000Not Hispanic or Latino
American Indian or Alaska Native 17,500 D D D D D D D DAsian 500 5,500 2,000 14,000 8,500 10,000 D D 11,000Black or African American 10,000 5,000 19,500 6,000 19,500 3,500 D D DWhite 1,500 2,000 5,000 5,500 4,500 5,000 3,000 6,000 9,000Other 7,000 3,500 14,000 D D D D D D
S&E-related occupations 1,000 1,000 2,000 1,500 1,000 2,500 1,000 3,000 3,500
Hispanic or Latino 2,000 4,000 3,500 5,500 7,500 18,500 9,000 6,500 2,500Not Hispanic or Latino
American Indian or Alaska Native 6,500 1,500 D D 18,000 D D 14,000 DAsian 1,000 1,000 9,000 6,000 5,000 10,000 4,000 4,000 8,500Black or African American 1,500 2,500 3,500 3,500 4,000 4,000 6,500 9,500 9,000White 1,500 500 500 2,500 2,500 3,500 2,000 3,500 2,500Other 2,000 1,000 24,000 4,500 5,000 4,500 8,500 11,000 23,000
Health occupations 1,000 500 1,000 3,000 2,000 2,000 3,500 2,500 3,000
Hispanic or Latino 1,500 4,000 5,500 7,500 7,000 15,500 10,500 12,000 8,500Not Hispanic or Latino
American Indian or Alaska Native 17,500 5,500 D D 17,500 S 12,500 D DAsian 2,000 2,500 7,500 5,000 4,000 15,000 5,500 6,000 8,000Black or African American 2,000 2,500 6,500 4,000 4,500 6,500 7,000 6,000 SWhite 500 2,500 2,000 2,000 3,000 2,500 3,000 3,000 4,000Other 3,000 3,000 17,000 12,500 5,500 16,500 7,500 12,500 10,500
S&E managers, including health 1,000 6,500 6,000 3,000 5,000 6,000 6,000 6,500 10,500
Hispanic or Latino 5,500 6,500 5,000 20,000 13,000 28,000 24,500 D DNot Hispanic or Latino
American Indian or Alaska Native D D D D D D D D DAsian 1,500 14,500 2,000 8,500 11,500 13,000 14,000 30,000 17,000Black or African American 7,500 4,000 11,000 13,500 21,500 14,500 23,000 10,500 DWhite 2,000 6,500 4,500 3,000 5,000 6,000 5,500 5,500 12,000Other 14,500 2,500 D 27,500 D D D D 3,000
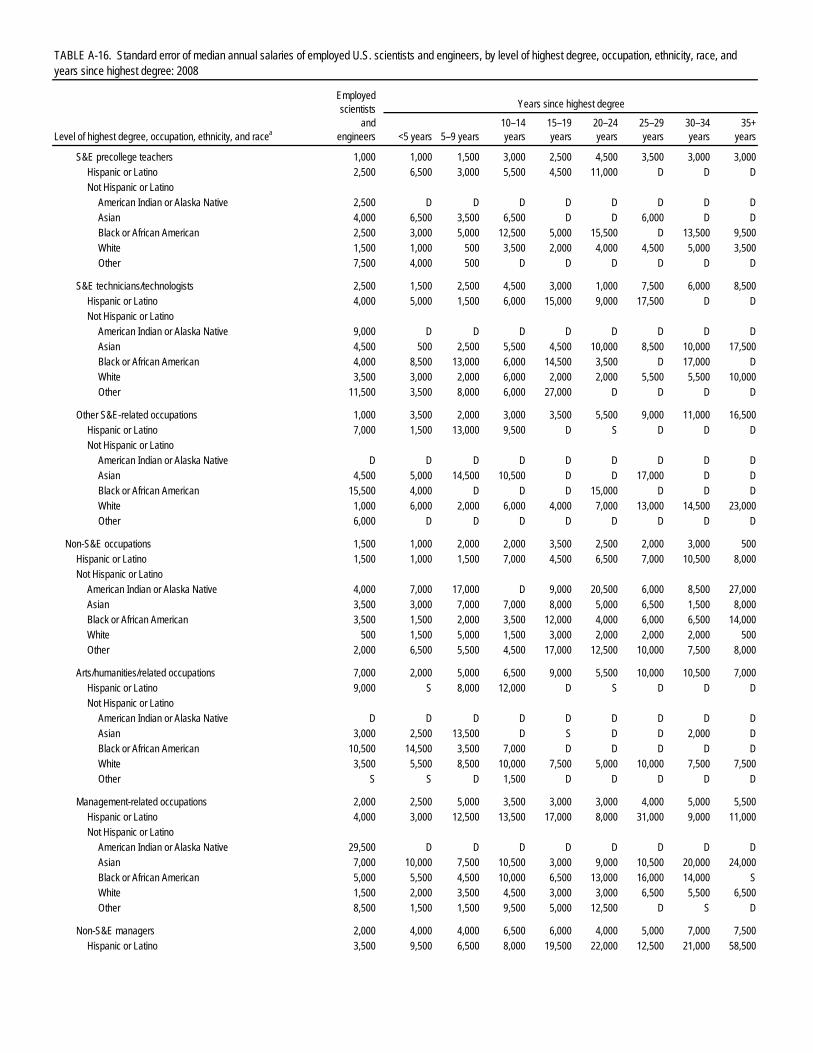
TABLE A-16. Standard error of median annual salaries of employed U.S. scientists and engineers, by level of highest degree, occupation, ethnicity, race, and years since highest degree: 2008
Level of highest degree, occupation, ethnicity, and racea
Employed scientists
and engineers
Years since highest degree
<5 years 5–9 years10–14years
15–19 years
20–24 years
25–29 years
30–34 years
35+ years
S&E precollege teachers 1,000 1,000 1,500 3,000 2,500 4,500 3,500 3,000 3,000Hispanic or Latino 2,500 6,500 3,000 5,500 4,500 11,000 D D DNot Hispanic or Latino
American Indian or Alaska Native 2,500 D D D D D D D DAsian 4,000 6,500 3,500 6,500 D D 6,000 D DBlack or African American 2,500 3,000 5,000 12,500 5,000 15,500 D 13,500 9,500White 1,500 1,000 500 3,500 2,000 4,000 4,500 5,000 3,500Other 7,500 4,000 500 D D D D D D
S&E technicians/technologists 2,500 1,500 2,500 4,500 3,000 1,000 7,500 6,000 8,500
Hispanic or Latino 4,000 5,000 1,500 6,000 15,000 9,000 17,500 D DNot Hispanic or Latino
American Indian or Alaska Native 9,000 D D D D D D D DAsian 4,500 500 2,500 5,500 4,500 10,000 8,500 10,000 17,500Black or African American 4,000 8,500 13,000 6,000 14,500 3,500 D 17,000 DWhite 3,500 3,000 2,000 6,000 2,000 2,000 5,500 5,500 10,000Other 11,500 3,500 8,000 6,000 27,000 D D D D
Other S&E-related occupations 1,000 3,500 2,000 3,000 3,500 5,500 9,000 11,000 16,500
Hispanic or Latino 7,000 1,500 13,000 9,500 D S D D DNot Hispanic or Latino
American Indian or Alaska Native D D D D D D D D DAsian 4,500 5,000 14,500 10,500 D D 17,000 D DBlack or African American 15,500 4,000 D D D 15,000 D D DWhite 1,000 6,000 2,000 6,000 4,000 7,000 13,000 14,500 23,000Other 6,000 D D D D D D D D
Non-S&E occupations 1,500 1,000 2,000 2,000 3,500 2,500 2,000 3,000 500
Hispanic or Latino 1,500 1,000 1,500 7,000 4,500 6,500 7,000 10,500 8,000Not Hispanic or Latino
American Indian or Alaska Native 4,000 7,000 17,000 D 9,000 20,500 6,000 8,500 27,000Asian 3,500 3,000 7,000 7,000 8,000 5,000 6,500 1,500 8,000Black or African American 3,500 1,500 2,000 3,500 12,000 4,000 6,000 6,500 14,000White 500 1,500 5,000 1,500 3,000 2,000 2,000 2,000 500Other 2,000 6,500 5,500 4,500 17,000 12,500 10,000 7,500 8,000
Arts/humanities/related occupations 7,000 2,000 5,000 6,500 9,000 5,500 10,000 10,500 7,000
Hispanic or Latino 9,000 S 8,000 12,000 D S D D DNot Hispanic or Latino
American Indian or Alaska Native D D D D D D D D DAsian 3,000 2,500 13,500 D S D D 2,000 DBlack or African American 10,500 14,500 3,500 7,000 D D D D DWhite 3,500 5,500 8,500 10,000 7,500 5,000 10,000 7,500 7,500Other S S D 1,500 D D D D D
Management-related occupations 2,000 2,500 5,000 3,500 3,000 3,000 4,000 5,000 5,500
Hispanic or Latino 4,000 3,000 12,500 13,500 17,000 8,000 31,000 9,000 11,000Not Hispanic or Latino
American Indian or Alaska Native 29,500 D D D D D D D DAsian 7,000 10,000 7,500 10,500 3,000 9,000 10,500 20,000 24,000Black or African American 5,000 5,500 4,500 10,000 6,500 13,000 16,000 14,000 SWhite 1,500 2,000 3,500 4,500 3,000 3,000 6,500 5,500 6,500Other 8,500 1,500 1,500 9,500 5,000 12,500 D S D
Non-S&E managers 2,000 4,000 4,000 6,500 6,000 4,000 5,000 7,000 7,500
Hispanic or Latino 3,500 9,500 6,500 8,000 19,500 22,000 12,500 21,000 58,500
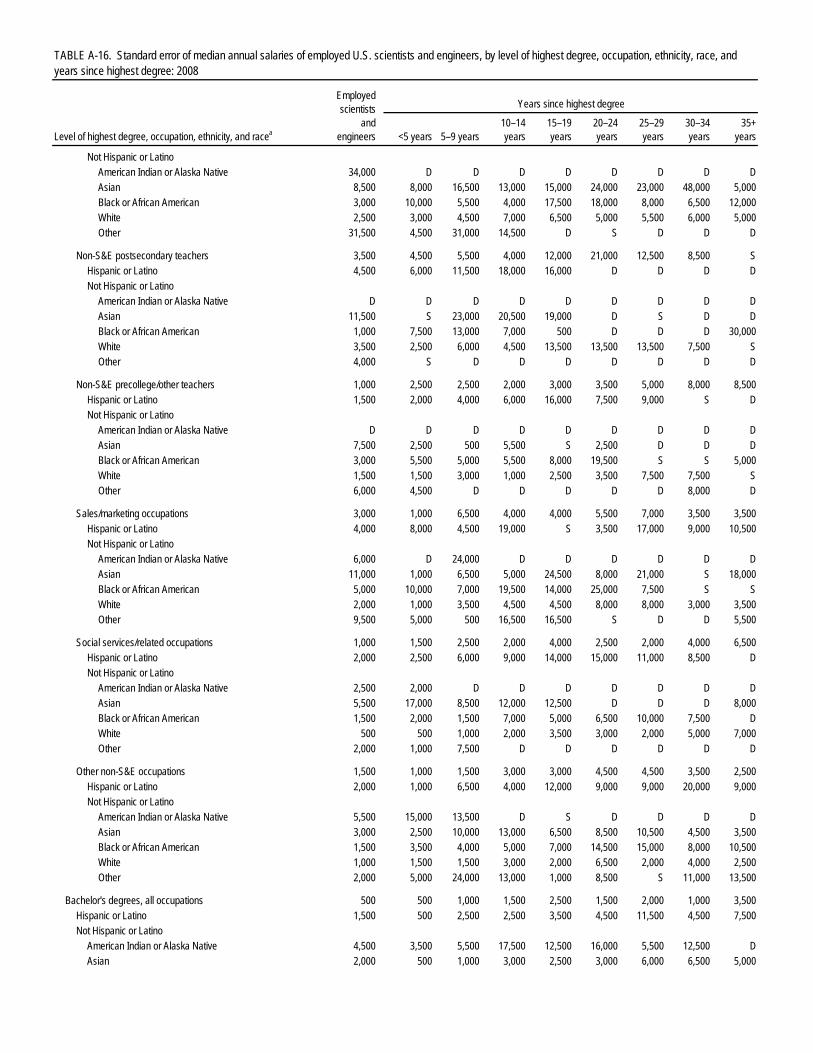
TABLE A-16. Standard error of median annual salaries of employed U.S. scientists and engineers, by level of highest degree, occupation, ethnicity, race, and years since highest degree: 2008
Level of highest degree, occupation, ethnicity, and racea
Employed scientists
and engineers
Years since highest degree
<5 years 5–9 years10–14years
15–19 years
20–24 years
25–29 years
30–34 years
35+ years
Not Hispanic or Latino American Indian or Alaska Native 34,000 D D D D D D D DAsian 8,500 8,000 16,500 13,000 15,000 24,000 23,000 48,000 5,000Black or African American 3,000 10,000 5,500 4,000 17,500 18,000 8,000 6,500 12,000White 2,500 3,000 4,500 7,000 6,500 5,000 5,500 6,000 5,000Other 31,500 4,500 31,000 14,500 D S D D D
Non-S&E postsecondary teachers 3,500 4,500 5,500 4,000 12,000 21,000 12,500 8,500 S
Hispanic or Latino 4,500 6,000 11,500 18,000 16,000 D D D DNot Hispanic or Latino
American Indian or Alaska Native D D D D D D D D DAsian 11,500 S 23,000 20,500 19,000 D S D DBlack or African American 1,000 7,500 13,000 7,000 500 D D D 30,000White 3,500 2,500 6,000 4,500 13,500 13,500 13,500 7,500 SOther 4,000 S D D D D D D D
Non-S&E precollege/other teachers 1,000 2,500 2,500 2,000 3,000 3,500 5,000 8,000 8,500
Hispanic or Latino 1,500 2,000 4,000 6,000 16,000 7,500 9,000 S DNot Hispanic or Latino
American Indian or Alaska Native D D D D D D D D DAsian 7,500 2,500 500 5,500 S 2,500 D D DBlack or African American 3,000 5,500 5,000 5,500 8,000 19,500 S S 5,000White 1,500 1,500 3,000 1,000 2,500 3,500 7,500 7,500 SOther 6,000 4,500 D D D D D 8,000 D
Sales/marketing occupations 3,000 1,000 6,500 4,000 4,000 5,500 7,000 3,500 3,500
Hispanic or Latino 4,000 8,000 4,500 19,000 S 3,500 17,000 9,000 10,500Not Hispanic or Latino
American Indian or Alaska Native 6,000 D 24,000 D D D D D DAsian 11,000 1,000 6,500 5,000 24,500 8,000 21,000 S 18,000Black or African American 5,000 10,000 7,000 19,500 14,000 25,000 7,500 S SWhite 2,000 1,000 3,500 4,500 4,500 8,000 8,000 3,000 3,500Other 9,500 5,000 500 16,500 16,500 S D D 5,500
Social services/related occupations 1,000 1,500 2,500 2,000 4,000 2,500 2,000 4,000 6,500
Hispanic or Latino 2,000 2,500 6,000 9,000 14,000 15,000 11,000 8,500 DNot Hispanic or Latino
American Indian or Alaska Native 2,500 2,000 D D D D D D DAsian 5,500 17,000 8,500 12,000 12,500 D D D 8,000Black or African American 1,500 2,000 1,500 7,000 5,000 6,500 10,000 7,500 DWhite 500 500 1,000 2,000 3,500 3,000 2,000 5,000 7,000Other 2,000 1,000 7,500 D D D D D D
Other non-S&E occupations 1,500 1,000 1,500 3,000 3,000 4,500 4,500 3,500 2,500
Hispanic or Latino 2,000 1,000 6,500 4,000 12,000 9,000 9,000 20,000 9,000Not Hispanic or Latino
American Indian or Alaska Native 5,500 15,000 13,500 D S D D D DAsian 3,000 2,500 10,000 13,000 6,500 8,500 10,500 4,500 3,500Black or African American 1,500 3,500 4,000 5,000 7,000 14,500 15,000 8,000 10,500White 1,000 1,500 1,500 3,000 2,000 6,500 2,000 4,000 2,500Other 2,000 5,000 24,000 13,000 1,000 8,500 S 11,000 13,500
Bachelor's degrees, all occupations 500 500 1,000 1,500 2,500 1,500 2,000 1,000 3,500
Hispanic or Latino 1,500 500 2,500 2,500 3,500 4,500 11,500 4,500 7,500Not Hispanic or Latino
American Indian or Alaska Native 4,500 3,500 5,500 17,500 12,500 16,000 5,500 12,500 DAsian 2,000 500 1,000 3,000 2,500 3,000 6,000 6,500 5,000
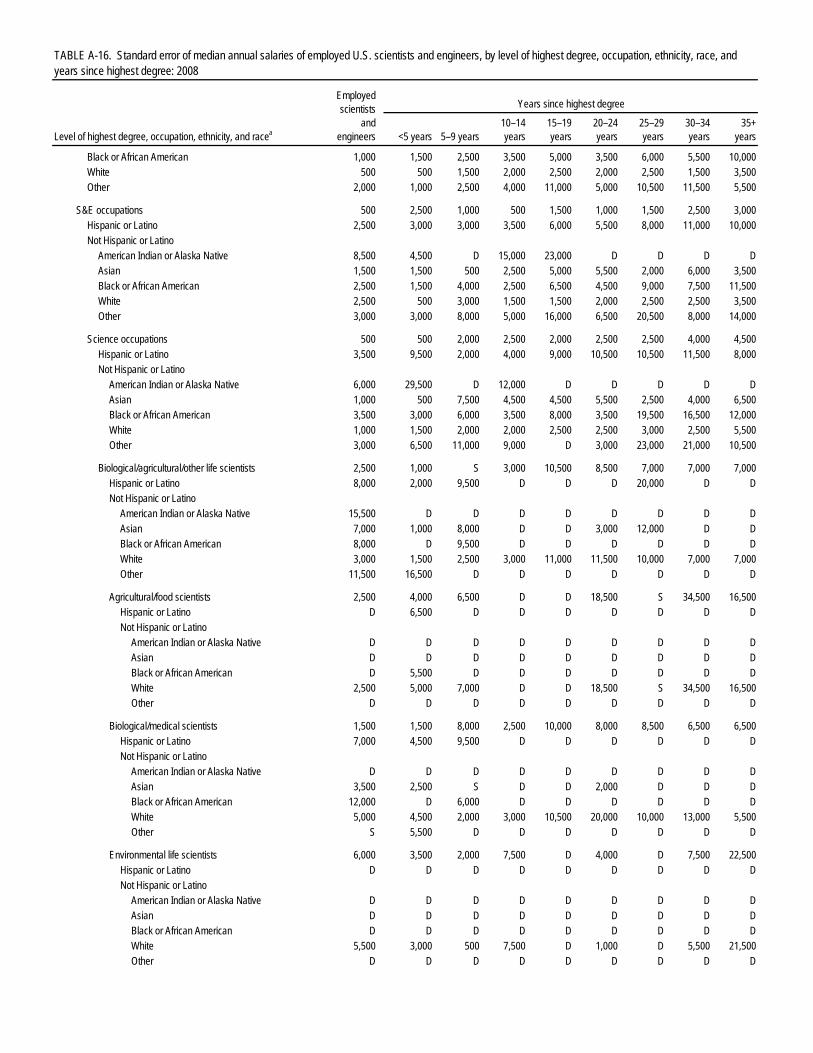
TABLE A-16. Standard error of median annual salaries of employed U.S. scientists and engineers, by level of highest degree, occupation, ethnicity, race, and years since highest degree: 2008
Level of highest degree, occupation, ethnicity, and racea
Employed scientists
and engineers
Years since highest degree
<5 years 5–9 years10–14years
15–19 years
20–24 years
25–29 years
30–34 years
35+ years
Black or African American 1,000 1,500 2,500 3,500 5,000 3,500 6,000 5,500 10,000White 500 500 1,500 2,000 2,500 2,000 2,500 1,500 3,500Other 2,000 1,000 2,500 4,000 11,000 5,000 10,500 11,500 5,500
S&E occupations 500 2,500 1,000 500 1,500 1,000 1,500 2,500 3,000
Hispanic or Latino 2,500 3,000 3,000 3,500 6,000 5,500 8,000 11,000 10,000Not Hispanic or Latino
American Indian or Alaska Native 8,500 4,500 D 15,000 23,000 D D D DAsian 1,500 1,500 500 2,500 5,000 5,500 2,000 6,000 3,500Black or African American 2,500 1,500 4,000 2,500 6,500 4,500 9,000 7,500 11,500White 2,500 500 3,000 1,500 1,500 2,000 2,500 2,500 3,500Other 3,000 3,000 8,000 5,000 16,000 6,500 20,500 8,000 14,000
Science occupations 500 500 2,000 2,500 2,000 2,500 2,500 4,000 4,500
Hispanic or Latino 3,500 9,500 2,000 4,000 9,000 10,500 10,500 11,500 8,000Not Hispanic or Latino
American Indian or Alaska Native 6,000 29,500 D 12,000 D D D D DAsian 1,000 500 7,500 4,500 4,500 5,500 2,500 4,000 6,500Black or African American 3,500 3,000 6,000 3,500 8,000 3,500 19,500 16,500 12,000White 1,000 1,500 2,000 2,000 2,500 2,500 3,000 2,500 5,500Other 3,000 6,500 11,000 9,000 D 3,000 23,000 21,000 10,500
Biological/agricultural/other life scientists 2,500 1,000 S 3,000 10,500 8,500 7,000 7,000 7,000
Hispanic or Latino 8,000 2,000 9,500 D D D 20,000 D DNot Hispanic or Latino
American Indian or Alaska Native 15,500 D D D D D D D DAsian 7,000 1,000 8,000 D D 3,000 12,000 D DBlack or African American 8,000 D 9,500 D D D D D DWhite 3,000 1,500 2,500 3,000 11,000 11,500 10,000 7,000 7,000Other 11,500 16,500 D D D D D D D
Agricultural/food scientists 2,500 4,000 6,500 D D 18,500 S 34,500 16,500
Hispanic or Latino D 6,500 D D D D D D DNot Hispanic or Latino
American Indian or Alaska Native D D D D D D D D DAsian D D D D D D D D DBlack or African American D 5,500 D D D D D D DWhite 2,500 5,000 7,000 D D 18,500 S 34,500 16,500Other D D D D D D D D D
Biological/medical scientists 1,500 1,500 8,000 2,500 10,000 8,000 8,500 6,500 6,500
Hispanic or Latino 7,000 4,500 9,500 D D D D D DNot Hispanic or Latino
American Indian or Alaska Native D D D D D D D D DAsian 3,500 2,500 S D D 2,000 D D DBlack or African American 12,000 D 6,000 D D D D D DWhite 5,000 4,500 2,000 3,000 10,500 20,000 10,000 13,000 5,500Other S 5,500 D D D D D D D
Environmental life scientists 6,000 3,500 2,000 7,500 D 4,000 D 7,500 22,500
Hispanic or Latino D D D D D D D D DNot Hispanic or Latino
American Indian or Alaska Native D D D D D D D D DAsian D D D D D D D D DBlack or African American D D D D D D D D DWhite 5,500 3,000 500 7,500 D 1,000 D 5,500 21,500Other D D D D D D D D D
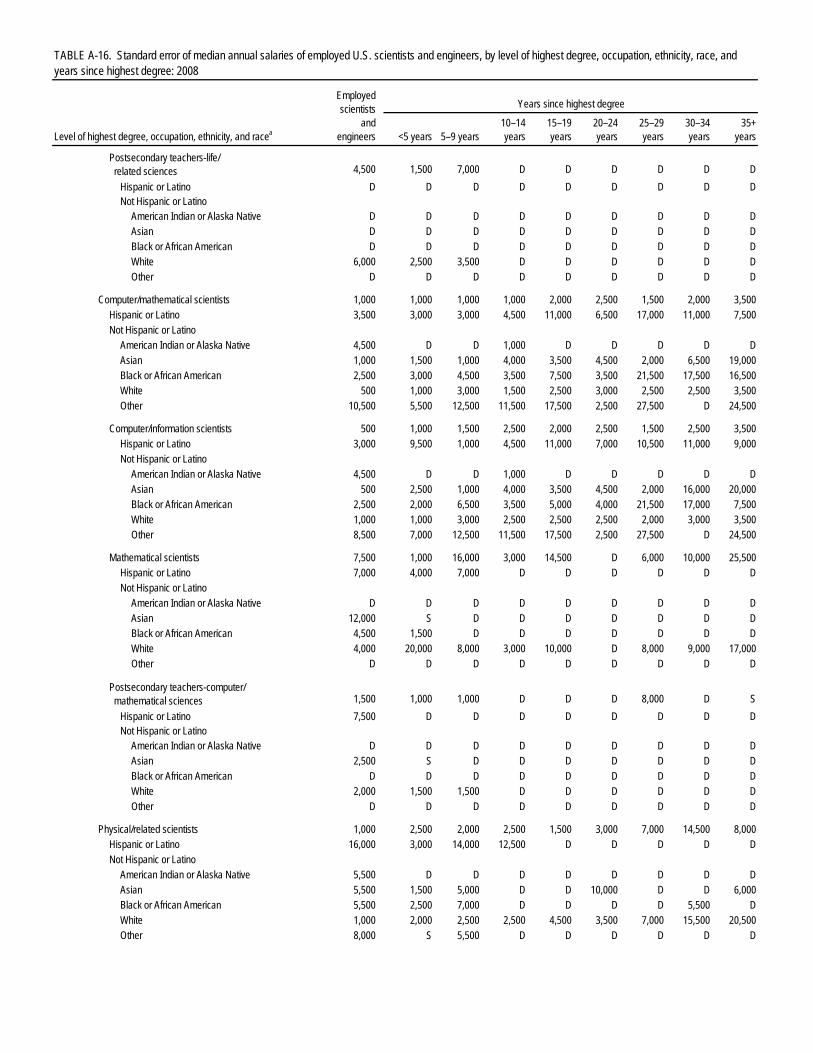
TABLE A-16. Standard error of median annual salaries of employed U.S. scientists and engineers, by level of highest degree, occupation, ethnicity, race, and years since highest degree: 2008
Level of highest degree, occupation, ethnicity, and racea
Employed scientists
and engineers
Years since highest degree
<5 years 5–9 years10–14years
15–19 years
20–24 years
25–29 years
30–34 years
35+ years
Postsecondary teachers-life/ related sciences 4,500 1,500 7,000 D D D D D D
Hispanic or Latino D D D D D D D D DNot Hispanic or Latino
American Indian or Alaska Native D D D D D D D D DAsian D D D D D D D D DBlack or African American D D D D D D D D DWhite 6,000 2,500 3,500 D D D D D DOther D D D D D D D D D
Computer/mathematical scientists 1,000 1,000 1,000 1,000 2,000 2,500 1,500 2,000 3,500
Hispanic or Latino 3,500 3,000 3,000 4,500 11,000 6,500 17,000 11,000 7,500Not Hispanic or Latino
American Indian or Alaska Native 4,500 D D 1,000 D D D D DAsian 1,000 1,500 1,000 4,000 3,500 4,500 2,000 6,500 19,000Black or African American 2,500 3,000 4,500 3,500 7,500 3,500 21,500 17,500 16,500White 500 1,000 3,000 1,500 2,500 3,000 2,500 2,500 3,500Other 10,500 5,500 12,500 11,500 17,500 2,500 27,500 D 24,500
Computer/information scientists 500 1,000 1,500 2,500 2,000 2,500 1,500 2,500 3,500
Hispanic or Latino 3,000 9,500 1,000 4,500 11,000 7,000 10,500 11,000 9,000Not Hispanic or Latino
American Indian or Alaska Native 4,500 D D 1,000 D D D D DAsian 500 2,500 1,000 4,000 3,500 4,500 2,000 16,000 20,000Black or African American 2,500 2,000 6,500 3,500 5,000 4,000 21,500 17,000 7,500White 1,000 1,000 3,000 2,500 2,500 2,500 2,000 3,000 3,500Other 8,500 7,000 12,500 11,500 17,500 2,500 27,500 D 24,500
Mathematical scientists 7,500 1,000 16,000 3,000 14,500 D 6,000 10,000 25,500
Hispanic or Latino 7,000 4,000 7,000 D D D D D DNot Hispanic or Latino
American Indian or Alaska Native D D D D D D D D DAsian 12,000 S D D D D D D DBlack or African American 4,500 1,500 D D D D D D DWhite 4,000 20,000 8,000 3,000 10,000 D 8,000 9,000 17,000Other D D D D D D D D D
Postsecondary teachers-computer/ mathematical sciences 1,500 1,000 1,000 D D D 8,000 D S
Hispanic or Latino 7,500 D D D D D D D DNot Hispanic or Latino
American Indian or Alaska Native D D D D D D D D DAsian 2,500 S D D D D D D DBlack or African American D D D D D D D D DWhite 2,000 1,500 1,500 D D D D D DOther D D D D D D D D D
Physical/related scientists 1,000 2,500 2,000 2,500 1,500 3,000 7,000 14,500 8,000
Hispanic or Latino 16,000 3,000 14,000 12,500 D D D D DNot Hispanic or Latino
American Indian or Alaska Native 5,500 D D D D D D D DAsian 5,500 1,500 5,000 D D 10,000 D D 6,000Black or African American 5,500 2,500 7,000 D D D D 5,500 DWhite 1,000 2,000 2,500 2,500 4,500 3,500 7,000 15,500 20,500Other 8,000 S 5,500 D D D D D D

TABLE A-16. Standard error of median annual salaries of employed U.S. scientists and engineers, by level of highest degree, occupation, ethnicity, race, and years since highest degree: 2008
Level of highest degree, occupation, ethnicity, and racea
Employed scientists
and engineers
Years since highest degree
<5 years 5–9 years10–14years
15–19 years
20–24 years
25–29 years
30–34 years
35+ years
Chemists, except biochemists 1,500 14,000 4,500 4,500 6,000 8,500 6,500 15,000 5,000Hispanic or Latino 13,500 7,000 7,000 D D D D D DNot Hispanic or Latino
American Indian or Alaska Native D D D D D D D D DAsian 5,000 11,000 4,000 D D 10,000 D D 6,500Black or African American 9,000 2,500 D D D D D D DWhite 1,500 6,000 1,000 5,500 9,000 12,500 6,000 16,500 16,500Other 14,500 D 15,500 D D D D D D
Earth/atmospheric/ocean scientists 6,000 2,000 4,500 2,500 5,500 6,500 3,500 15,500 20,000
Hispanic or Latino 6,500 S D D D D D D DNot Hispanic or Latino
American Indian or Alaska Native D D D D D D D D DAsian 23,000 D D D D D D D DBlack or African American 2,000 5,500 D D D D D D DWhite 4,500 6,000 1,500 2,000 6,500 6,500 3,500 16,500 SOther 6,000 12,000 D D D D D D D
Physicists/astronomers S 500 S D D D D D D
Hispanic or Latino D D D D D D D D DNot Hispanic or Latino
American Indian or Alaska Native D D D D D D D D DAsian D D D D D D D D DBlack or African American D D D D D D D D DWhite 4,000 4,500 2,500 D D D D D DOther D D D D D D D D D
Postsecondary teachers-physical/ related sciences 2,500 2,000 11,500 D D D D D D
Hispanic or Latino 2,500 2,500 D D D D D D DNot Hispanic or Latino
American Indian or Alaska Native D D D D D D D D DAsian 1,500 4,500 D D D D D D DBlack or African American D D D D D D D D DWhite 2,000 500 11,000 D D D D D DOther 5,000 5,000 D D D D D D D
Other physical/related scientists 5,500 6,000 3,500 13,000 3,500 12,500 13,000 6,000 S
Hispanic or Latino 12,500 D D D D D D D DNot Hispanic or Latino
American Indian or Alaska Native D D D D D D D D DAsian D D D D D D D D DBlack or African American D D D D D D D D DWhite 5,500 1,000 1,000 D 3,500 13,000 12,500 6,000 29,500Other D D D D D D D D D
Social/related scientists 4,000 3,000 8,500 8,000 18,000 21,000 13,500 7,000 7,500
Hispanic or Latino 2,000 2,000 7,000 D D D D D DNot Hispanic or Latino
American Indian or Alaska Native D D D D D D D D DAsian 11,500 8,000 7,500 D D D D D DBlack or African American 14,500 S D D D D D D DWhite 3,000 5,500 12,000 12,500 21,500 28,500 27,500 7,000 16,500Other 3,000 7,000 D D D D D D D
Economists 8,500 13,000 D D D 10,000 D D D
Hispanic or Latino D D D D D D D D D

TABLE A-16. Standard error of median annual salaries of employed U.S. scientists and engineers, by level of highest degree, occupation, ethnicity, race, and years since highest degree: 2008
Level of highest degree, occupation, ethnicity, and racea
Employed scientists
and engineers
Years since highest degree
<5 years 5–9 years10–14years
15–19 years
20–24 years
25–29 years
30–34 years
35+ years
Not Hispanic or Latino American Indian or Alaska Native D D D D D D D D DAsian D D D D D D D D DBlack or African American D D D D D D D D DWhite 8,500 7,500 D D D D D D DOther D D D D D D D D D
Political/related scientists 1,500 S D D D D D D D
Hispanic or Latino D D D D D D D D DNot Hispanic or Latino
American Indian or Alaska Native D D D D D D D D DAsian D D D D D D D D DBlack or African American D D D D D D D D DWhite 2,000 4,000 D D D D D D DOther D D D D D D D D D
Postsecondary teachers-social/ related sciences 1,000 3,500 3,500 D D D D D D
Hispanic or Latino D D D D D D D D DNot Hispanic or Latino
American Indian or Alaska Native D D D D D D D D DAsian D D D D D D D D DBlack or African American D D D D D D D D DWhite 3,000 2,000 3,500 D D D D D DOther D D D D D D D D D
Psychologists 2,000 6,500 5,500 D D D D D D
Hispanic or Latino S D D D D D D D DNot Hispanic or Latino
American Indian or Alaska Native D D D D D D D D DAsian S D D D D D D D DBlack or African American 11,000 D D D D D D D DWhite 2,500 S D D D D D D DOther D D D D D D D D D
Sociologists/anthropologists 2,000 7,500 D D D D D D D
Hispanic or Latino D D D D D D D D DNot Hispanic or Latino
American Indian or Alaska Native D D D D D D D D DAsian D D D D D D D D DBlack or African American D D D D D D D D DWhite 3,500 4,500 D D D D D D DOther D D D D D D D D D
Other social/related scientists 4,000 3,000 13,000 11,500 15,000 30,000 16,500 6,500 32,000
Hispanic or Latino 3,500 D D D D D D D DNot Hispanic or Latino
American Indian or Alaska Native D D D D D D D D DAsian 6,000 3,500 D D D D D D DBlack or African American 12,500 D D D D D D D DWhite 6,500 2,500 13,500 11,500 S 27,500 11,000 6,500 41,000Other D D D D D D D D D
Engineering occupations 2,000 2,000 1,000 2,000 2,000 2,500 2,500 2,500 3,500
Hispanic or Latino 3,000 2,000 1,500 4,500 5,000 6,000 19,000 12,500 11,000

TABLE A-16. Standard error of median annual salaries of employed U.S. scientists and engineers, by level of highest degree, occupation, ethnicity, race, and years since highest degree: 2008
Level of highest degree, occupation, ethnicity, and racea
Employed scientists
and engineers
Years since highest degree
<5 years 5–9 years10–14years
15–19 years
20–24 years
25–29 years
30–34 years
35+ years
Not Hispanic or Latino American Indian or Alaska Native 9,000 5,500 24,500 D D D D D DAsian 2,500 1,500 2,500 4,000 8,000 9,000 3,000 14,500 4,000Black or African American 4,500 4,000 8,000 5,000 7,500 23,500 10,500 8,500 DWhite 1,000 2,000 1,000 2,500 2,000 2,500 2,500 3,500 5,500Other 5,000 2,500 6,000 5,500 5,500 13,000 10,000 14,000 S
Aerospace/aeronautical/astronautical engineers 4,500 500 1,000 4,500 7,000 3,000 9,500 10,000 16,500
Hispanic or Latino 14,000 4,500 13,000 D D D D D DNot Hispanic or Latino
American Indian or Alaska Native D D D D D D D D DAsian 5,000 1,500 4,500 D D D D 4,500 DBlack or African American 25,500 1,000 D D D D D D DWhite 4,000 2,000 3,000 10,000 7,000 4,000 9,000 15,500 15,500Other 6,500 3,500 D D D D D D D
Chemical engineers 3,500 2,000 4,000 3,000 12,500 5,000 6,000 6,500 13,500
Hispanic or Latino 13,000 1,000 9,500 D D D D D DNot Hispanic or Latino
American Indian or Alaska Native D D D D D D D D DAsian 6,500 7,000 11,500 D D D D D DBlack or African American 8,000 5,000 D D D D D D DWhite 4,500 1,500 2,500 3,500 8,000 6,000 3,000 6,500 11,500Other D S D D D D D D D
Civil/architectural/sanitary engineers 2,000 500 2,000 2,000 2,000 3,000 4,000 7,500 8,000
Hispanic or Latino 6,000 1,000 3,000 7,500 11,500 D 30,500 D 8,000Not Hispanic or Latino
American Indian or Alaska Native D D D D D D D D DAsian 6,500 1,000 16,500 4,000 8,500 D 7,500 9,000 5,500Black or African American 6,000 14,000 4,000 D 16,000 6,500 D D DWhite 2,500 1,000 3,000 4,000 2,500 3,000 4,000 5,500 5,000Other 10,500 1,500 8,000 D D D D D D
Electrical/computer hardware engineers 1,500 2,000 4,000 1,500 2,500 500 3,000 3,000 8,000
Hispanic or Latino 4,000 8,000 10,000 3,500 5,000 17,000 8,500 D DNot Hispanic or Latino
American Indian or Alaska Native D D D D D D D D DAsian 3,000 5,000 2,000 3,000 12,000 3,000 3,000 D 8,500Black or African American 5,500 3,500 10,500 D D 21,500 11,000 5,500 DWhite 1,000 1,000 1,500 2,500 4,000 1,500 4,000 3,000 8,000Other 5,500 3,000 2,000 D D D D D D
Industrial engineers 2,000 1,500 2,000 3,500 6,000 7,000 9,000 7,500 7,000
Hispanic or Latino 2,000 8,000 9,500 D D D D D DNot Hispanic or Latino
American Indian or Alaska Native D D D D D D D D DAsian 2,000 2,500 1,000 10,500 D 9,000 D D DBlack or African American 8,500 9,500 24,500 D D D D D DWhite 4,500 2,500 500 10,500 3,500 7,500 11,000 11,500 7,500Other 4,000 D D D D D D D D
Mechanical engineers 2,000 1,000 1,000 3,500 3,000 2,500 2,000 3,500 5,500
Hispanic or Latino 6,000 8,500 1,500 11,000 19,000 3,500 D D DNot Hispanic or Latino
American Indian or Alaska Native 22,000 D D D D D D D DAsian 6,500 2,000 7,500 14,000 6,000 11,500 4,000 15,000 20,000

TABLE A-16. Standard error of median annual salaries of employed U.S. scientists and engineers, by level of highest degree, occupation, ethnicity, race, and years since highest degree: 2008
Level of highest degree, occupation, ethnicity, and racea
Employed scientists
and engineers
Years since highest degree
<5 years 5–9 years10–14years
15–19 years
20–24 years
25–29 years
30–34 years
35+ years
Black or African American 10,500 7,000 2,500 D D D D D DWhite 2,500 1,000 1,000 4,000 3,500 3,000 3,500 4,000 4,000Other 1,500 2,000 D D D D D D D
Postsecondary teachers-engineering S 5,500 3,000 D D D D D 12,000
Hispanic or Latino D D D D D D D D DNot Hispanic or Latino
American Indian or Alaska Native D D D D D D D D DAsian D D D D D D D D DBlack or African American 1,500 D D D D D D D DWhite S S D D D D D D 10,500Other D D D D D D D D D
Other engineers 1,000 4,000 3,500 3,000 5,000 1,500 3,000 9,500 8,000
Hispanic or Latino 13,500 2,000 6,000 13,000 17,500 3,000 20,000 D 6,000Not Hispanic or Latino
American Indian or Alaska Native D D D D D D D D DAsian 11,500 7,500 11,000 D D D D D 9,000Black or African American 19,500 7,500 D 10,500 D D D D DWhite 2,500 500 3,000 3,000 7,000 5,500 3,000 9,000 9,500Other 11,000 2,500 D D D D D D D
S&E-related occupations 1,000 3,500 1,000 1,000 500 2,500 2,500 3,500 1,000
Hispanic or Latino 5,000 1,500 1,000 4,000 4,000 9,500 14,500 6,000 8,000Not Hispanic or Latino
American Indian or Alaska Native 6,000 12,000 6,000 D D D D D DAsian 6,000 2,500 7,000 2,500 3,000 6,000 9,000 17,500 4,500Black or African American 2,500 2,500 3,500 6,000 9,500 8,500 6,500 13,000 13,000White 1,500 1,500 500 3,000 2,500 3,000 2,500 4,000 2,000Other 3,500 1,500 8,000 8,000 4,500 4,500 10,000 16,500 28,500
Health occupations 1,500 1,000 500 2,500 2,500 2,000 2,000 4,500 4,000
Hispanic or Latino 1,500 2,000 2,000 4,000 3,500 12,500 15,000 15,000 12,500Not Hispanic or Latino
American Indian or Alaska Native 5,000 4,000 D D D D D D DAsian 3,500 9,000 10,000 9,500 3,000 8,000 10,500 15,500 4,000Black or African American 2,000 3,000 8,000 6,000 7,500 5,500 7,000 10,000 8,000White 1,000 500 1,000 2,500 1,500 2,000 1,500 5,000 3,000Other 2,500 3,000 6,000 14,500 3,500 D 9,000 19,500 4,000
S&E managers, including health 2,000 15,000 4,500 4,000 4,000 10,000 6,000 8,000 8,000
Hispanic or Latino 7,500 D 4,500 11,500 D 27,500 3,500 D DNot Hispanic or Latino
American Indian or Alaska Native D D D D D D D D DAsian 4,500 D D 12,000 15,000 25,000 D 36,000 23,000Black or African American 10,000 D 14,500 D 18,500 15,000 23,500 D DWhite 2,500 3,500 8,500 6,000 4,000 9,500 8,000 9,000 15,000Other 25,500 D D D D D D D 2,500
S&E precollege teachers 1,500 1,000 2,000 3,000 3,000 6,500 2,500 5,000 2,500
Hispanic or Latino 3,500 1,000 2,000 D 5,500 3,000 D D DNot Hispanic or Latino
American Indian or Alaska Native 12,000 D D D D D D D DAsian 2,000 2,000 D D D D D D DBlack or African American 2,000 13,000 1,500 12,500 D D D D 14,000White 1,500 500 2,000 3,000 4,000 6,000 2,500 5,000 4,000Other 500 D D D D D D D D

TABLE A-16. Standard error of median annual salaries of employed U.S. scientists and engineers, by level of highest degree, occupation, ethnicity, race, and years since highest degree: 2008
Level of highest degree, occupation, ethnicity, and racea
Employed scientists
and engineers
Years since highest degree
<5 years 5–9 years10–14years
15–19 years
20–24 years
25–29 years
30–34 years
35+ years
S&E technicians/technologists 2,500 2,500 2,000 6,000 2,500 1,000 9,000 6,000 9,500Hispanic or Latino 3,000 1,000 2,500 15,500 18,500 9,000 16,000 D DNot Hispanic or Latino
American Indian or Alaska Native 9,000 D D D D D D D DAsian 4,000 1,500 5,500 1,500 8,500 15,000 9,500 11,000 17,000Black or African American 4,500 7,500 1,500 D D 3,500 D 14,000 DWhite 3,000 3,000 5,500 6,000 2,500 1,500 10,000 5,500 11,500Other 17,500 2,500 8,500 D D D D D D
Other S&E-related occupations 3,000 2,500 5,500 6,000 10,000 5,500 16,500 12,500 9,000
Hispanic or Latino 8,500 D D D D S D D DNot Hispanic or Latino
American Indian or Alaska Native D D D D D D D D DAsian 5,500 1,000 17,000 34,500 D D 32,500 D DBlack or African American 17,000 D D D D 15,000 D D DWhite 4,500 9,500 7,500 6,000 11,500 6,500 11,000 12,500 17,500Other 6,500 D D D D D D D D
Non-S&E occupations 1,000 500 5,500 2,500 1,000 2,500 2,500 3,000 3,500
Hispanic or Latino 5,500 1,000 1,500 4,000 6,000 8,000 5,500 10,500 10,000Not Hispanic or Latino
American Indian or Alaska Native 7,500 1,500 9,000 D D D D S DAsian 2,500 500 6,000 6,000 5,500 4,000 8,500 5,500 6,000Black or African American 1,500 1,000 2,000 3,500 2,500 6,000 4,500 9,000 9,000White 500 500 1,000 3,000 3,000 3,500 4,000 3,500 1,500Other 2,000 1,500 6,500 9,000 22,500 16,500 10,500 8,000 11,000
Arts/humanities/related occupations 2,500 1,000 6,500 13,000 13,000 4,500 9,500 16,000 11,000
Hispanic or Latino 14,500 6,500 D 14,000 D D D D DNot Hispanic or Latino
American Indian or Alaska Native D D D D D D D D DAsian 3,000 1,000 S D D D D D DBlack or African American 13,500 14,000 12,500 D D D D D DWhite 3,000 1,500 S 9,000 12,500 7,500 15,000 16,500 10,000Other 8,000 S D D D D D D D
Management-related occupations 3,000 1,000 4,500 4,000 3,000 4,500 5,500 5,000 8,000
Hispanic or Latino 1,500 2,000 4,000 10,000 3,500 16,000 D 10,500 11,000Not Hispanic or Latino
American Indian or Alaska Native 20,000 D D D D D D D DAsian 3,000 4,500 7,000 15,500 13,500 5,000 23,500 19,500 SBlack or African American 1,500 5,500 8,000 11,000 19,000 13,000 8,500 D SWhite 3,500 500 3,000 7,000 3,000 5,500 6,500 7,000 8,500Other 6,500 3,500 1,500 12,000 D D D D D
Non-S&E managers 3,500 1,500 5,500 5,500 6,000 6,000 6,000 10,000 11,500
Hispanic or Latino 8,000 10,000 D 11,000 28,500 28,500 20,000 D DNot Hispanic or Latino
American Indian or Alaska Native D D D D D D D D DAsian 5,500 D 14,000 33,000 D 15,000 24,500 D 9,500Black or African American 4,000 5,000 7,000 D 10,500 29,500 18,500 6,000 DWhite 4,500 3,000 15,500 6,500 5,500 7,000 6,500 10,000 11,500Other S 8,500 D D 97,000 D D D D
Non-S&E postsecondary teachers 4,000 4,000 S 8,000 D S 8,000 11,500 D
Hispanic or Latino 3,500 D D D D D D D D

TABLE A-16. Standard error of median annual salaries of employed U.S. scientists and engineers, by level of highest degree, occupation, ethnicity, race, and years since highest degree: 2008
Level of highest degree, occupation, ethnicity, and racea
Employed scientists
and engineers
Years since highest degree
<5 years 5–9 years10–14years
15–19 years
20–24 years
25–29 years
30–34 years
35+ years
Not Hispanic or Latino American Indian or Alaska Native D D D D D D D D DAsian D D D D D D D D DBlack or African American 1,000 5,000 D D D D D D DWhite 1,500 3,500 D D D D 11,000 17,500 DOther 3,500 D D D D D D D D
Non-S&E precollege/other teachers 2,000 3,500 2,500 10,500 4,000 4,500 5,000 6,000 9,000
Hispanic or Latino 1,500 3,500 2,500 S S D 9,500 D DNot Hispanic or Latino
American Indian or Alaska Native D D D D D D D D DAsian 5,000 D D D 9,500 D D D DBlack or African American 3,500 1,500 4,500 7,500 D 13,500 D D 5,000White 2,500 3,000 2,500 S 3,500 4,000 5,500 5,500 10,500Other S 3,000 D D D D D D D
Sales/marketing occupations 2,000 500 1,000 4,500 4,500 3,500 11,000 6,000 2,500
Hispanic or Latino 6,500 7,000 7,500 21,000 S 4,500 5,500 D 8,000Not Hispanic or Latino
American Indian or Alaska Native 14,000 D 24,000 D D D D D DAsian 3,000 6,000 16,500 20,500 21,500 6,500 14,500 S 10,500Black or African American 5,000 3,500 2,000 5,500 19,500 29,000 7,500 31,000 SWhite 500 1,000 4,500 4,000 6,500 8,000 9,000 6,000 3,000Other 3,500 3,000 500 18,000 D S D D D
Social services/related occupations 1,000 500 1,500 3,000 2,000 6,000 3,000 3,000 6,500
Hispanic or Latino 1,500 1,000 9,000 11,000 D 5,500 S D DNot Hispanic or Latino
American Indian or Alaska Native D D D D D D D D DAsian 6,500 5,000 D D D D D D DBlack or African American 3,500 1,500 1,000 1,500 5,000 D 10,500 5,500 DWhite 1,000 500 4,000 2,000 4,000 5,000 2,500 4,000 5,500Other 6,000 7,000 3,000 D D D D D D
Other non-S&E occupations 500 500 1,000 3,000 2,000 3,000 3,500 2,000 2,500
Hispanic or Latino 3,000 1,500 2,500 5,000 6,500 6,500 8,500 17,000 9,000Not Hispanic or Latino
American Indian or Alaska Native 6,000 1,000 3,500 D D D D D DAsian 1,500 2,000 1,500 9,500 5,000 8,500 10,000 9,500 3,500Black or African American 2,500 1,500 3,000 7,000 6,500 11,500 14,500 6,500 14,000White 1,000 500 3,000 5,000 4,500 3,500 5,000 1,500 3,000Other 3,500 1,500 13,500 D 1,000 13,000 D D 16,000
Master's degrees, all occupations 500 3,000 1,500 1,500 2,500 4,500 1,500 2,000 5,500
Hispanic or Latino 1,500 3,000 5,000 6,000 6,500 4,000 21,500 7,500 13,000Not Hispanic or Latino
American Indian or Alaska Native 2,500 2,500 13,500 D 3,500 7,500 D D DAsian 2,500 500 2,500 2,000 4,500 4,500 5,500 3,500 3,500Black or African American 1,000 3,000 4,000 5,000 6,000 5,500 3,500 7,500 14,500White 1,500 1,000 3,000 2,500 2,000 4,000 3,000 3,000 4,000Other 2,000 5,500 3,000 22,500 12,000 15,000 10,000 S 23,500
S&E occupations 1,000 2,000 1,500 2,000 1,500 5,000 2,500 4,000 6,000
Hispanic or Latino 5,000 3,500 4,000 7,000 5,500 8,000 16,500 D DNot Hispanic or Latino
American Indian or Alaska Native 7,000 7,000 D D D D D D DAsian 1,500 1,000 2,500 3,000 3,000 1,000 5,500 7,500 6,000
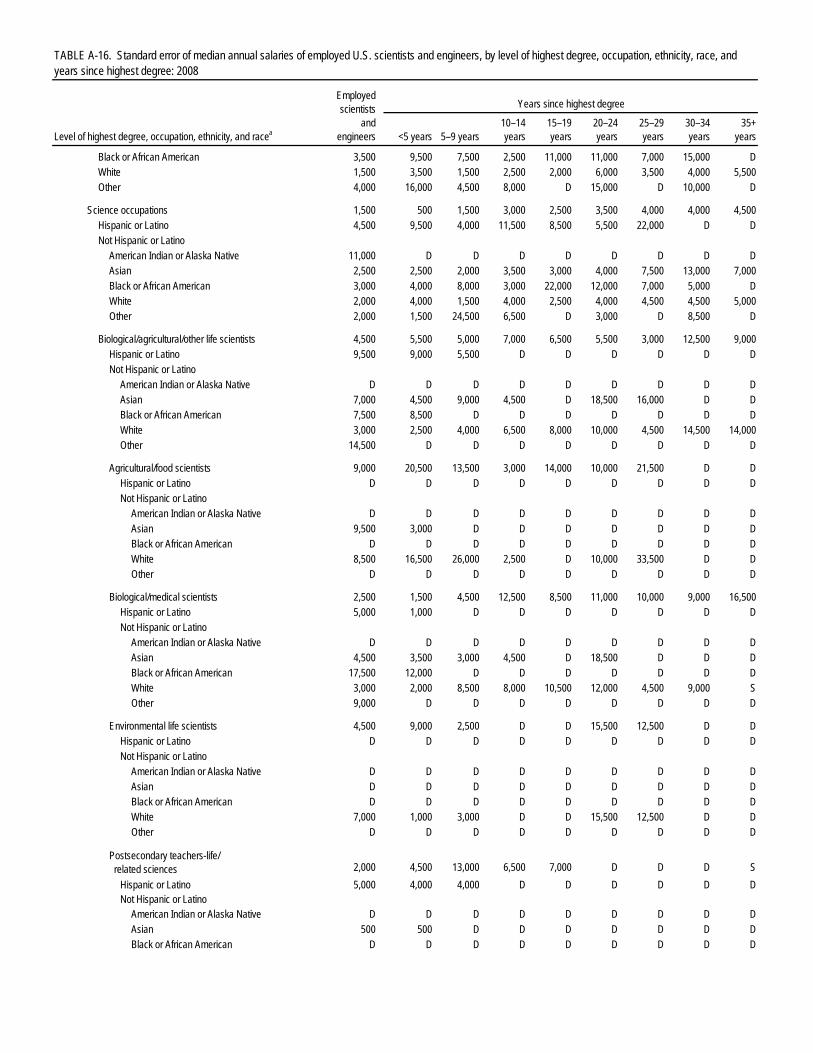
TABLE A-16. Standard error of median annual salaries of employed U.S. scientists and engineers, by level of highest degree, occupation, ethnicity, race, and years since highest degree: 2008
Level of highest degree, occupation, ethnicity, and racea
Employed scientists
and engineers
Years since highest degree
<5 years 5–9 years10–14years
15–19 years
20–24 years
25–29 years
30–34 years
35+ years
Black or African American 3,500 9,500 7,500 2,500 11,000 11,000 7,000 15,000 DWhite 1,500 3,500 1,500 2,500 2,000 6,000 3,500 4,000 5,500Other 4,000 16,000 4,500 8,000 D 15,000 D 10,000 D
Science occupations 1,500 500 1,500 3,000 2,500 3,500 4,000 4,000 4,500
Hispanic or Latino 4,500 9,500 4,000 11,500 8,500 5,500 22,000 D DNot Hispanic or Latino
American Indian or Alaska Native 11,000 D D D D D D D DAsian 2,500 2,500 2,000 3,500 3,000 4,000 7,500 13,000 7,000Black or African American 3,000 4,000 8,000 3,000 22,000 12,000 7,000 5,000 DWhite 2,000 4,000 1,500 4,000 2,500 4,000 4,500 4,500 5,000Other 2,000 1,500 24,500 6,500 D 3,000 D 8,500 D
Biological/agricultural/other life scientists 4,500 5,500 5,000 7,000 6,500 5,500 3,000 12,500 9,000
Hispanic or Latino 9,500 9,000 5,500 D D D D D DNot Hispanic or Latino
American Indian or Alaska Native D D D D D D D D DAsian 7,000 4,500 9,000 4,500 D 18,500 16,000 D DBlack or African American 7,500 8,500 D D D D D D DWhite 3,000 2,500 4,000 6,500 8,000 10,000 4,500 14,500 14,000Other 14,500 D D D D D D D D
Agricultural/food scientists 9,000 20,500 13,500 3,000 14,000 10,000 21,500 D D
Hispanic or Latino D D D D D D D D DNot Hispanic or Latino
American Indian or Alaska Native D D D D D D D D DAsian 9,500 3,000 D D D D D D DBlack or African American D D D D D D D D DWhite 8,500 16,500 26,000 2,500 D 10,000 33,500 D DOther D D D D D D D D D
Biological/medical scientists 2,500 1,500 4,500 12,500 8,500 11,000 10,000 9,000 16,500
Hispanic or Latino 5,000 1,000 D D D D D D DNot Hispanic or Latino
American Indian or Alaska Native D D D D D D D D DAsian 4,500 3,500 3,000 4,500 D 18,500 D D DBlack or African American 17,500 12,000 D D D D D D DWhite 3,000 2,000 8,500 8,000 10,500 12,000 4,500 9,000 SOther 9,000 D D D D D D D D
Environmental life scientists 4,500 9,000 2,500 D D 15,500 12,500 D D
Hispanic or Latino D D D D D D D D DNot Hispanic or Latino
American Indian or Alaska Native D D D D D D D D DAsian D D D D D D D D DBlack or African American D D D D D D D D DWhite 7,000 1,000 3,000 D D 15,500 12,500 D DOther D D D D D D D D D
Postsecondary teachers-life/ related sciences 2,000 4,500 13,000 6,500 7,000 D D D S
Hispanic or Latino 5,000 4,000 4,000 D D D D D DNot Hispanic or Latino
American Indian or Alaska Native D D D D D D D D DAsian 500 500 D D D D D D DBlack or African American D D D D D D D D D
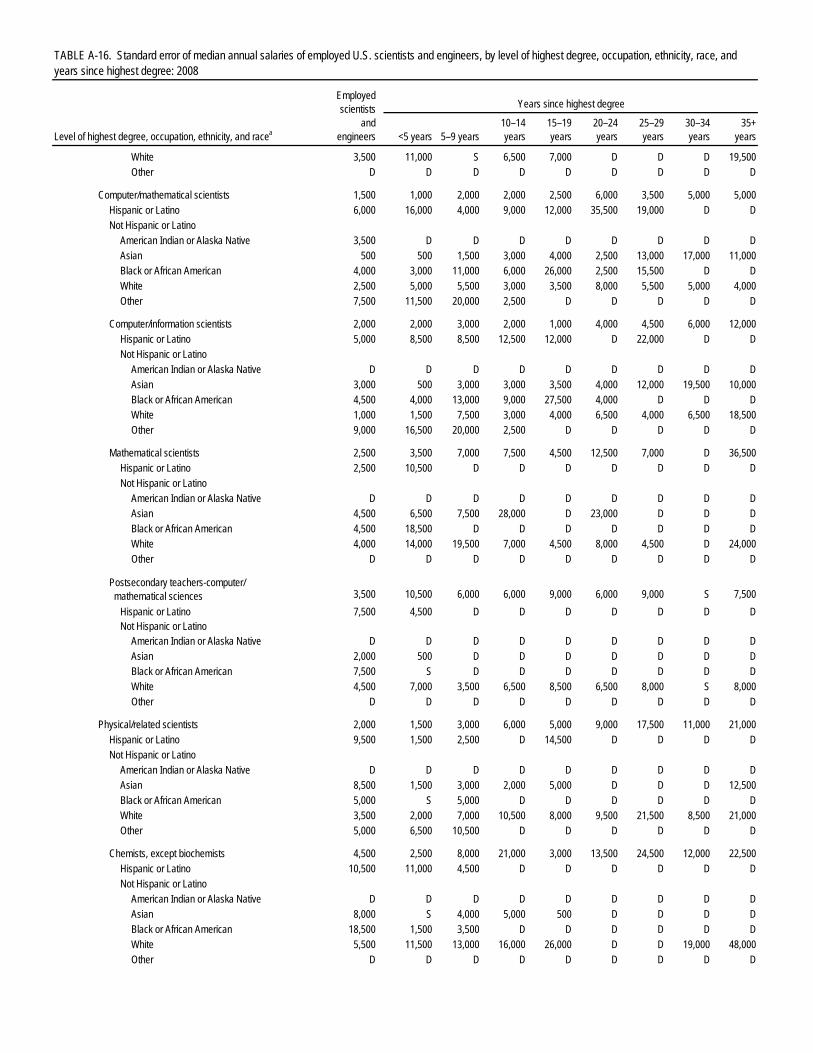
TABLE A-16. Standard error of median annual salaries of employed U.S. scientists and engineers, by level of highest degree, occupation, ethnicity, race, and years since highest degree: 2008
Level of highest degree, occupation, ethnicity, and racea
Employed scientists
and engineers
Years since highest degree
<5 years 5–9 years10–14years
15–19 years
20–24 years
25–29 years
30–34 years
35+ years
White 3,500 11,000 S 6,500 7,000 D D D 19,500Other D D D D D D D D D
Computer/mathematical scientists 1,500 1,000 2,000 2,000 2,500 6,000 3,500 5,000 5,000
Hispanic or Latino 6,000 16,000 4,000 9,000 12,000 35,500 19,000 D DNot Hispanic or Latino
American Indian or Alaska Native 3,500 D D D D D D D DAsian 500 500 1,500 3,000 4,000 2,500 13,000 17,000 11,000Black or African American 4,000 3,000 11,000 6,000 26,000 2,500 15,500 D DWhite 2,500 5,000 5,500 3,000 3,500 8,000 5,500 5,000 4,000Other 7,500 11,500 20,000 2,500 D D D D D
Computer/information scientists 2,000 2,000 3,000 2,000 1,000 4,000 4,500 6,000 12,000
Hispanic or Latino 5,000 8,500 8,500 12,500 12,000 D 22,000 D DNot Hispanic or Latino
American Indian or Alaska Native D D D D D D D D DAsian 3,000 500 3,000 3,000 3,500 4,000 12,000 19,500 10,000Black or African American 4,500 4,000 13,000 9,000 27,500 4,000 D D DWhite 1,000 1,500 7,500 3,000 4,000 6,500 4,000 6,500 18,500Other 9,000 16,500 20,000 2,500 D D D D D
Mathematical scientists 2,500 3,500 7,000 7,500 4,500 12,500 7,000 D 36,500
Hispanic or Latino 2,500 10,500 D D D D D D DNot Hispanic or Latino
American Indian or Alaska Native D D D D D D D D DAsian 4,500 6,500 7,500 28,000 D 23,000 D D DBlack or African American 4,500 18,500 D D D D D D DWhite 4,000 14,000 19,500 7,000 4,500 8,000 4,500 D 24,000Other D D D D D D D D D
Postsecondary teachers-computer/ mathematical sciences 3,500 10,500 6,000 6,000 9,000 6,000 9,000 S 7,500
Hispanic or Latino 7,500 4,500 D D D D D D DNot Hispanic or Latino
American Indian or Alaska Native D D D D D D D D DAsian 2,000 500 D D D D D D DBlack or African American 7,500 S D D D D D D DWhite 4,500 7,000 3,500 6,500 8,500 6,500 8,000 S 8,000Other D D D D D D D D D
Physical/related scientists 2,000 1,500 3,000 6,000 5,000 9,000 17,500 11,000 21,000
Hispanic or Latino 9,500 1,500 2,500 D 14,500 D D D DNot Hispanic or Latino
American Indian or Alaska Native D D D D D D D D DAsian 8,500 1,500 3,000 2,000 5,000 D D D 12,500Black or African American 5,000 S 5,000 D D D D D DWhite 3,500 2,000 7,000 10,500 8,000 9,500 21,500 8,500 21,000Other 5,000 6,500 10,500 D D D D D D
Chemists, except biochemists 4,500 2,500 8,000 21,000 3,000 13,500 24,500 12,000 22,500
Hispanic or Latino 10,500 11,000 4,500 D D D D D DNot Hispanic or Latino
American Indian or Alaska Native D D D D D D D D DAsian 8,000 S 4,000 5,000 500 D D D DBlack or African American 18,500 1,500 3,500 D D D D D DWhite 5,500 11,500 13,000 16,000 26,000 D D 19,000 48,000Other D D D D D D D D D

TABLE A-16. Standard error of median annual salaries of employed U.S. scientists and engineers, by level of highest degree, occupation, ethnicity, race, and years since highest degree: 2008
Level of highest degree, occupation, ethnicity, and racea
Employed scientists
and engineers
Years since highest degree
<5 years 5–9 years10–14years
15–19 years
20–24 years
25–29 years
30–34 years
35+ years
Earth/atmospheric/ocean scientists 5,000 2,500 6,500 15,500 11,500 8,500 20,000 8,500 22,500Hispanic or Latino 30,000 D 1,500 D D D D D DNot Hispanic or Latino
American Indian or Alaska Native D D D D D D D D DAsian 14,500 S 9,500 D D D D D DBlack or African American D D D D D D D D DWhite 4,500 2,500 7,000 14,500 16,000 9,500 23,000 8,000 21,500Other D D D D D D D D D
Physicists/astronomers 21,500 2,000 S D D D D D D
Hispanic or Latino 8,000 4,000 D D D D D D DNot Hispanic or Latino
American Indian or Alaska Native D D D D D D D D DAsian D D D D D D D D DBlack or African American 1,500 500 D D D D D D DWhite 7,000 3,000 32,000 D D D D D DOther D D D D D D D D D
Postsecondary teachers-physical/ related sciences 7,500 1,000 S D D 22,000 D S D
Hispanic or Latino 3,500 3,500 D D D D D D DNot Hispanic or Latino
American Indian or Alaska Native D D D D D D D D DAsian D 1,000 D D D D D D DBlack or African American 1,500 1,000 D D D D D D DWhite S 1,000 S D D 22,000 D S DOther D D D D D D D D D
Other physical/related scientists 7,000 4,000 18,000 12,500 12,000 D D D D
Hispanic or Latino D D D D D D D D DNot Hispanic or Latino
American Indian or Alaska Native D D D D D D D D DAsian D D D D D D D D DBlack or African American D D D D D D D D DWhite 11,500 6,000 17,500 16,500 12,000 D D D DOther D D D D D D D D D
Social/related scientists 2,500 2,000 1,500 7,500 11,000 4,000 7,000 9,000 12,500
Hispanic or Latino 5,500 2,000 3,000 D 4,500 8,000 D D DNot Hispanic or Latino
American Indian or Alaska Native D D D D D D D D DAsian 9,000 6,000 14,500 4,500 35,500 D D D DBlack or African American 4,000 6,000 8,500 D D D D D DWhite 1,500 4,500 1,500 9,000 13,000 8,500 7,500 9,000 13,000Other 1,500 11,500 D D D D D D D
Economists 15,500 7,000 7,500 17,500 14,500 D S D 20,000
Hispanic or Latino 1,500 1,000 D D D D D D DNot Hispanic or Latino
American Indian or Alaska Native D D D D D D D D DAsian 9,500 S D D D D D D DBlack or African American 5,000 4,000 D D D D D D DWhite 15,000 5,500 32,000 8,000 14,500 D S D 20,000Other D D D D D D D D D
Political/related scientists 11,500 3,500 D D D D D D D
Hispanic or Latino 3,000 3,000 D D D D D D D

TABLE A-16. Standard error of median annual salaries of employed U.S. scientists and engineers, by level of highest degree, occupation, ethnicity, race, and years since highest degree: 2008
Level of highest degree, occupation, ethnicity, and racea
Employed scientists
and engineers
Years since highest degree
<5 years 5–9 years10–14years
15–19 years
20–24 years
25–29 years
30–34 years
35+ years
Not Hispanic or Latino American Indian or Alaska Native D D D D D D D D DAsian D D D D D D D D DBlack or African American 26,000 26,000 D D D D D D DWhite 9,500 2,500 D D D D D D DOther D D D D D D D D D
Postsecondary teachers-social/ related sciences 7,000 1,000 S S 11,500 11,000 9,000 D S
Hispanic or Latino 17,500 4,000 D D D D D D DNot Hispanic or Latino
American Indian or Alaska Native D D D D D D D D DAsian 2,500 2,000 D D D D D D DBlack or African American S S D D D D D D DWhite 10,000 3,000 S S S 21,500 15,000 D SOther 4,500 D D D D D D D D
Psychologists 2,000 1,500 4,500 4,000 6,500 9,500 6,500 5,000 10,500
Hispanic or Latino 2,500 3,000 11,500 D 8,000 D D D DNot Hispanic or Latino
American Indian or Alaska Native D D D D D D D D DAsian 3,000 S D D D D D D DBlack or African American 5,500 15,000 2,500 D D D D D DWhite 2,000 1,500 4,500 6,500 8,500 12,000 7,000 5,500 10,500Other S D D D D D D D D
Sociologists/anthropologists 9,000 6,500 2,000 D D D D D D
Hispanic or Latino 3,000 3,000 D D D D D D DNot Hispanic or Latino
American Indian or Alaska Native D D D D D D D D DAsian D D D D D D D D DBlack or African American S S D D D D D D DWhite 16,000 4,500 D D D D D D DOther D D D D D D D D D
Other social/related scientists 6,500 4,000 7,000 5,000 5,000 D 18,500 12,000 14,000
Hispanic or Latino 19,000 3,500 9,500 D D D D D DNot Hispanic or Latino
American Indian or Alaska Native D D D D D D D D DAsian 14,000 4,500 15,500 D D D D D DBlack or African American S 2,500 D D D D D D DWhite 12,000 6,500 3,500 10,000 6,000 D 24,000 11,000 9,500Other 2,000 D D D D D D D D
Engineering occupations 2,000 2,500 4,000 2,000 3,500 3,000 4,000 3,000 8,500
Hispanic or Latino 5,000 1,500 5,500 7,000 17,000 D 40,500 D DNot Hispanic or Latino
American Indian or Alaska Native 12,500 D D D D D D D DAsian 5,500 2,000 3,000 4,000 2,000 11,500 10,500 5,000 12,500Black or African American 5,500 9,500 7,000 6,000 7,500 D D D DWhite 1,000 1,000 2,500 1,500 3,500 3,000 5,000 3,000 9,500Other 9,500 1,000 2,000 12,500 D D D D D
Aerospace/aeronautical/astronautical engineers 4,500 5,000 3,000 5,000 6,000 8,500 19,500 12,000 17,000
Hispanic or Latino 27,000 6,000 D D D D D D D

TABLE A-16. Standard error of median annual salaries of employed U.S. scientists and engineers, by level of highest degree, occupation, ethnicity, race, and years since highest degree: 2008
Level of highest degree, occupation, ethnicity, and racea
Employed scientists
and engineers
Years since highest degree
<5 years 5–9 years10–14years
15–19 years
20–24 years
25–29 years
30–34 years
35+ years
Not Hispanic or Latino American Indian or Alaska Native D D D D D D D D DAsian 12,500 500 11,000 D 24,000 D D D DBlack or African American 32,500 11,500 D D D D D D DWhite 5,000 2,500 4,500 6,000 D 7,500 16,500 13,500 17,000Other 10,500 D D D D D D D D
Chemical engineers 5,000 8,000 11,000 6,500 11,500 23,000 18,000 9,500 10,500
Hispanic or Latino S 2,500 D D D D D D DNot Hispanic or Latino
American Indian or Alaska Native D D D D D D D D DAsian 4,500 1,500 D D D D D 22,500 DBlack or African American D D D D D D D D DWhite 7,500 3,000 12,500 13,000 11,000 22,500 11,500 D 15,500Other D D D D D D D D D
Civil/architectural/sanitary engineers 2,500 1,500 4,500 5,000 4,500 8,500 11,000 5,000 21,000
Hispanic or Latino 7,000 5,000 6,500 D D D D D DNot Hispanic or Latino
American Indian or Alaska Native D D D D D D D D DAsian 3,500 1,500 12,000 9,000 10,500 D 7,000 2,500 12,000Black or African American 9,500 4,000 D D D D D D DWhite 2,000 1,000 6,500 5,000 4,000 9,500 17,000 7,000 28,000Other 13,000 9,000 D D D D D D D
Electrical/computer hardware engineers 1,000 500 1,000 3,000 4,500 4,000 4,500 4,500 8,000
Hispanic or Latino 5,000 5,000 19,500 8,000 D D D D DNot Hispanic or Latino
American Indian or Alaska Native D D D D D D D D DAsian 2,500 1,000 2,500 6,000 10,000 10,500 8,000 12,000 DBlack or African American 5,000 4,000 10,500 7,000 D D D D DWhite 2,500 4,000 5,500 5,000 4,000 9,500 5,500 5,500 10,500Other 7,000 6,000 D D D D D D D
Industrial engineers 3,000 8,000 12,000 6,000 5,000 14,500 S 22,000 D
Hispanic or Latino 14,500 9,500 S D D D D D DNot Hispanic or Latino
American Indian or Alaska Native D D D D D D D D DAsian 4,000 3,000 D D D D D D DBlack or African American 9,000 D D D D D D D DWhite 4,000 9,500 10,000 6,000 9,500 19,000 D 10,500 DOther D D D D D D D D D
Mechanical engineers 2,500 2,000 8,500 6,000 3,000 9,500 7,500 9,500 20,000
Hispanic or Latino 13,000 7,500 28,500 D D D D D DNot Hispanic or Latino
American Indian or Alaska Native D D D D D D D D DAsian 2,500 5,500 4,500 7,500 6,000 8,500 18,500 17,000 DBlack or African American 10,000 8,000 D D D D D D DWhite 3,000 1,000 5,500 11,000 4,500 11,500 8,000 4,000 25,500Other 15,500 6,000 1,500 D D D D D D
Postsecondary teachers-engineering 3,500 1,000 12,000 D D 2,500 D D D
Hispanic or Latino 5,000 1,000 D D D D D D DNot Hispanic or Latino
American Indian or Alaska Native D D D D D D D D DAsian 2,500 2,500 D D D D D D D

TABLE A-16. Standard error of median annual salaries of employed U.S. scientists and engineers, by level of highest degree, occupation, ethnicity, race, and years since highest degree: 2008
Level of highest degree, occupation, ethnicity, and racea
Employed scientists
and engineers
Years since highest degree
<5 years 5–9 years10–14years
15–19 years
20–24 years
25–29 years
30–34 years
35+ years
Black or African American 2,000 S D D D D D D DWhite 2,500 S 10,000 D D 2,500 D D DOther D D D D D D D D D
Other engineers 3,500 4,500 5,000 7,000 7,000 4,000 6,500 8,500 25,000
Hispanic or Latino 10,500 3,500 2,500 D D D D D DNot Hispanic or Latino
American Indian or Alaska Native D D D D D D D D DAsian 4,000 5,000 3,500 13,500 9,000 7,500 D D DBlack or African American 4,000 2,000 6,000 D D D D D DWhite 17,500 8,000 9,500 8,500 7,000 3,500 13,000 11,000 26,000Other 7,000 S D D D D D D D
S&E-related occupations 2,000 500 3,500 2,000 2,500 2,000 3,500 5,500 4,000
Hispanic or Latino 2,500 4,500 9,000 6,500 8,000 25,500 18,500 D DNot Hispanic or Latino
American Indian or Alaska Native 11,000 D D D D D D D DAsian 2,000 6,500 6,000 11,000 10,000 16,500 6,500 12,500 7,000Black or African American 1,500 3,500 2,500 9,000 6,500 11,000 4,000 9,000 SWhite 1,500 2,000 2,500 3,500 2,500 2,000 4,000 4,500 4,000Other 6,500 2,500 19,500 15,500 D 13,500 12,000 D D
Health occupations 2,000 500 3,000 4,500 5,000 2,500 3,000 10,000 13,500
Hispanic or Latino 4,000 7,500 5,500 9,000 D D D D DNot Hispanic or Latino
American Indian or Alaska Native 15,000 D D D D D D D DAsian 4,000 5,000 7,000 8,500 11,500 2,000 25,500 20,000 10,500Black or African American 2,000 4,000 3,000 22,500 5,500 18,000 2,000 D DWhite 2,500 3,000 2,500 5,000 4,000 3,500 4,000 11,500 15,500Other 5,500 7,000 D 9,500 D D D D D
S&E managers, including health 4,000 4,500 5,500 5,000 7,000 4,500 8,000 6,000 21,000
Hispanic or Latino 10,000 7,000 D D D D D D DNot Hispanic or Latino
American Indian or Alaska Native D D D D D D D D DAsian 3,500 21,500 4,000 18,000 15,000 25,500 10,500 D DBlack or African American 9,500 3,000 19,500 D D D D D DWhite 4,500 12,500 8,000 4,500 11,000 4,000 6,000 14,000 22,500Other 9,500 D D D D D D D D
S&E precollege teachers 3,000 1,500 1,500 1,000 2,000 2,500 5,500 4,500 17,500
Hispanic or Latino 9,000 19,000 D D 10,000 D D D DNot Hispanic or Latino
American Indian or Alaska Native D D D D D D D D DAsian 2,500 3,000 D 8,500 D D D D DBlack or African American 5,000 4,500 8,500 11,500 D D D D SWhite 3,500 1,500 1,500 1,500 2,500 3,500 4,500 7,000 18,000Other 10,000 10,000 D D D D D D D
S&E technicians/technologists 4,500 5,000 7,500 2,500 2,000 13,500 1,500 15,500 12,000
Hispanic or Latino 15,500 13,500 D D D D D D DNot Hispanic or Latino
American Indian or Alaska Native D D D D D D D D DAsian 2,000 12,000 7,500 10,000 1,500 12,500 38,000 24,500 DBlack or African American 8,500 3,000 D D D D D D DWhite 6,000 1,500 11,000 9,500 8,000 S 3,500 16,000 14,500Other 24,000 D D D D D D D D

TABLE A-16. Standard error of median annual salaries of employed U.S. scientists and engineers, by level of highest degree, occupation, ethnicity, race, and years since highest degree: 2008
Level of highest degree, occupation, ethnicity, and racea
Employed scientists
and engineers
Years since highest degree
<5 years 5–9 years10–14years
15–19 years
20–24 years
25–29 years
30–34 years
35+ years
Other S&E-related occupations 4,500 2,500 2,500 6,000 3,000 9,500 6,500 14,500 14,000Hispanic or Latino 2,500 1,500 D D D D D D DNot Hispanic or Latino
American Indian or Alaska Native D D D D D D D D DAsian 13,500 8,000 18,000 D D D D D DBlack or African American D D D D D D D D DWhite 4,000 D 3,000 22,500 2,500 15,500 5,500 31,000 13,500Other D D D D D D D D D
Non-S&E occupations 1,500 1,000 2,000 3,000 3,500 2,500 1,500 4,500 7,000
Hispanic or Latino 2,500 2,500 6,000 9,000 12,500 4,500 11,000 6,000 10,000Not Hispanic or Latino
American Indian or Alaska Native 3,500 6,000 9,500 D 7,500 D D D DAsian 3,000 3,000 7,500 12,000 7,500 15,000 11,500 21,000 12,000Black or African American 2,000 6,500 7,000 5,500 7,500 5,000 12,000 10,500 21,000White 1,500 500 3,000 3,500 4,000 3,000 2,500 5,000 6,000Other 6,500 5,500 4,500 S 13,000 22,000 D D 23,500
Arts/humanities/related occupations 2,000 4,000 4,000 21,000 9,500 5,000 20,000 S S
Hispanic or Latino 11,500 17,000 D D D D D D DNot Hispanic or Latino
American Indian or Alaska Native D D D D D D D D DAsian 5,500 2,500 D D D D D D DBlack or African American S D D D D D D D DWhite 2,500 7,500 10,500 S 14,500 6,000 21,000 20,500 SOther 2,500 S D D D D D D D
Management-related occupations 1,500 6,000 6,500 2,000 9,500 5,500 8,500 11,000 9,000
Hispanic or Latino 12,500 25,500 16,000 21,500 12,500 29,500 D D DNot Hispanic or Latino
American Indian or Alaska Native S D D D D D D D DAsian 4,000 6,000 8,000 9,000 3,500 15,000 D 18,500 20,000Black or African American 5,500 6,500 4,000 6,500 D D D 26,000 DWhite 3,000 9,000 9,500 7,500 11,500 6,500 8,500 13,000 10,500Other 9,000 12,500 D D D D D D D
Non-S&E managers 3,000 9,500 5,000 4,500 9,500 12,000 10,500 7,500 10,000
Hispanic or Latino 5,500 14,000 10,000 7,000 D D D 43,500 DNot Hispanic or Latino
American Indian or Alaska Native 8,500 D D D D D D D DAsian 11,500 8,000 32,000 11,500 47,000 77,000 39,000 D 16,000Black or African American 5,500 12,500 7,000 15,500 D 8,500 D D DWhite 3,500 7,000 6,000 4,000 6,000 11,000 14,000 8,000 8,500Other 38,000 34,500 D 18,500 D D D D D
Non-S&E postsecondary teachers 6,500 2,500 6,500 3,000 S S 7,000 S S
Hispanic or Latino 5,500 6,000 D D D D D D DNot Hispanic or Latino
American Indian or Alaska Native D D D D D D D D DAsian 4,000 3,000 S D D D D D DBlack or African American 4,000 S D D D D D D DWhite 7,000 3,500 9,000 13,000 S S 6,000 22,500 SOther D D D D D D D D D
Non-S&E precollege/other teachers 1,000 1,500 3,500 3,500 2,000 5,500 5,500 6,500 S
Hispanic or Latino 4,000 3,000 4,000 D D D S D D
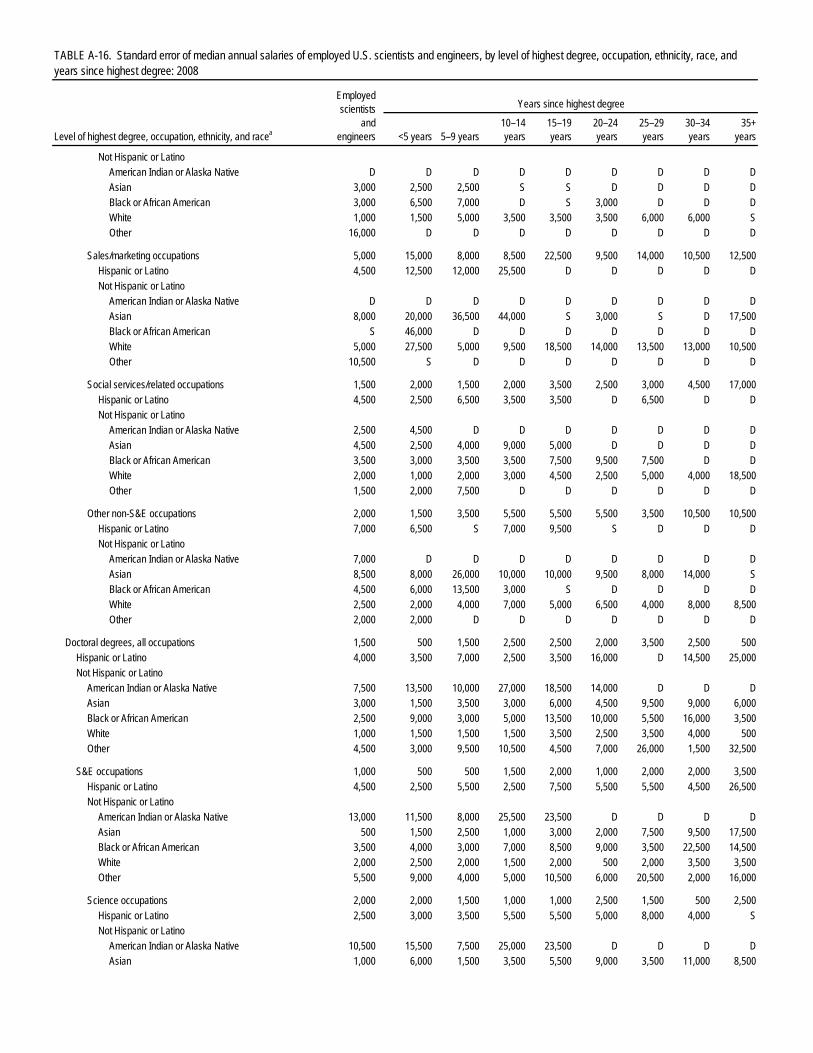
TABLE A-16. Standard error of median annual salaries of employed U.S. scientists and engineers, by level of highest degree, occupation, ethnicity, race, and years since highest degree: 2008
Level of highest degree, occupation, ethnicity, and racea
Employed scientists
and engineers
Years since highest degree
<5 years 5–9 years10–14years
15–19 years
20–24 years
25–29 years
30–34 years
35+ years
Not Hispanic or Latino American Indian or Alaska Native D D D D D D D D DAsian 3,000 2,500 2,500 S S D D D DBlack or African American 3,000 6,500 7,000 D S 3,000 D D DWhite 1,000 1,500 5,000 3,500 3,500 3,500 6,000 6,000 SOther 16,000 D D D D D D D D
Sales/marketing occupations 5,000 15,000 8,000 8,500 22,500 9,500 14,000 10,500 12,500
Hispanic or Latino 4,500 12,500 12,000 25,500 D D D D DNot Hispanic or Latino
American Indian or Alaska Native D D D D D D D D DAsian 8,000 20,000 36,500 44,000 S 3,000 S D 17,500Black or African American S 46,000 D D D D D D DWhite 5,000 27,500 5,000 9,500 18,500 14,000 13,500 13,000 10,500Other 10,500 S D D D D D D D
Social services/related occupations 1,500 2,000 1,500 2,000 3,500 2,500 3,000 4,500 17,000
Hispanic or Latino 4,500 2,500 6,500 3,500 3,500 D 6,500 D DNot Hispanic or Latino
American Indian or Alaska Native 2,500 4,500 D D D D D D DAsian 4,500 2,500 4,000 9,000 5,000 D D D DBlack or African American 3,500 3,000 3,500 3,500 7,500 9,500 7,500 D DWhite 2,000 1,000 2,000 3,000 4,500 2,500 5,000 4,000 18,500Other 1,500 2,000 7,500 D D D D D D
Other non-S&E occupations 2,000 1,500 3,500 5,500 5,500 5,500 3,500 10,500 10,500
Hispanic or Latino 7,000 6,500 S 7,000 9,500 S D D DNot Hispanic or Latino
American Indian or Alaska Native 7,000 D D D D D D D DAsian 8,500 8,000 26,000 10,000 10,000 9,500 8,000 14,000 SBlack or African American 4,500 6,000 13,500 3,000 S D D D DWhite 2,500 2,000 4,000 7,000 5,000 6,500 4,000 8,000 8,500Other 2,000 2,000 D D D D D D D
Doctoral degrees, all occupations 1,500 500 1,500 2,500 2,500 2,000 3,500 2,500 500
Hispanic or Latino 4,000 3,500 7,000 2,500 3,500 16,000 D 14,500 25,000Not Hispanic or Latino
American Indian or Alaska Native 7,500 13,500 10,000 27,000 18,500 14,000 D D DAsian 3,000 1,500 3,500 3,000 6,000 4,500 9,500 9,000 6,000Black or African American 2,500 9,000 3,000 5,000 13,500 10,000 5,500 16,000 3,500White 1,000 1,500 1,500 1,500 3,500 2,500 3,500 4,000 500Other 4,500 3,000 9,500 10,500 4,500 7,000 26,000 1,500 32,500
S&E occupations 1,000 500 500 1,500 2,000 1,000 2,000 2,000 3,500
Hispanic or Latino 4,500 2,500 5,500 2,500 7,500 5,500 5,500 4,500 26,500Not Hispanic or Latino
American Indian or Alaska Native 13,000 11,500 8,000 25,500 23,500 D D D DAsian 500 1,500 2,500 1,000 3,000 2,000 7,500 9,500 17,500Black or African American 3,500 4,000 3,000 7,000 8,500 9,000 3,500 22,500 14,500White 2,000 2,500 2,000 1,500 2,000 500 2,000 3,500 3,500Other 5,500 9,000 4,000 5,000 10,500 6,000 20,500 2,000 16,000
Science occupations 2,000 2,000 1,500 1,000 1,000 2,500 1,500 500 2,500
Hispanic or Latino 2,500 3,000 3,500 5,500 5,500 5,000 8,000 4,000 SNot Hispanic or Latino
American Indian or Alaska Native 10,500 15,500 7,500 25,000 23,500 D D D DAsian 1,000 6,000 1,500 3,500 5,500 9,000 3,500 11,000 8,500

TABLE A-16. Standard error of median annual salaries of employed U.S. scientists and engineers, by level of highest degree, occupation, ethnicity, race, and years since highest degree: 2008
Level of highest degree, occupation, ethnicity, and racea
Employed scientists
and engineers
Years since highest degree
<5 years 5–9 years10–14years
15–19 years
20–24 years
25–29 years
30–34 years
35+ years
Black or African American 1,000 4,500 4,000 6,500 11,000 9,000 14,000 22,500 14,500White 1,500 2,500 1,500 2,500 2,500 2,000 1,000 1,000 3,500Other 6,000 10,000 3,500 3,500 10,500 8,000 16,500 1,500 11,500
Biological/agricultural/other life scientists 2,000 3,000 2,000 2,500 2,500 4,000 4,500 2,500 4,000
Hispanic or Latino 3,000 4,000 6,000 4,000 13,000 6,000 13,000 39,000 26,000Not Hispanic or Latino
American Indian or Alaska Native 28,500 D D D D D D D DAsian 4,500 2,000 4,500 7,500 4,500 16,500 18,000 18,000 27,500Black or African American 12,000 2,000 4,000 S D 21,500 9,000 D DWhite 500 4,000 3,000 2,000 3,500 5,000 3,000 3,500 4,000Other 10,000 2,500 10,000 12,500 3,500 30,500 8,500 D D
Agricultural/food scientists 2,000 2,000 5,500 3,500 3,000 3,000 13,000 11,500 28,000
Hispanic or Latino 4,000 18,500 20,500 D D D D D DNot Hispanic or Latino
American Indian or Alaska Native D D D D D D D D DAsian 4,000 10,500 D 11,000 D D D D DBlack or African American 3,500 24,500 15,000 11,000 D D D D DWhite 4,500 3,500 7,500 4,000 6,500 2,500 11,500 20,500 37,000Other 13,000 D D D D D D D D
Biological/medical scientists 4,000 500 1,000 4,000 1,000 4,500 6,500 8,500 10,500
Hispanic or Latino 6,500 4,000 14,000 2,500 35,500 24,500 D S 20,500Not Hispanic or Latino
American Indian or Alaska Native 23,000 D D D D D D D DAsian 2,500 1,500 8,000 6,500 4,500 23,500 20,500 39,500 SBlack or African American 21,500 1,500 4,500 35,000 D 22,500 D 6,500 DWhite 3,000 4,000 3,000 4,000 1,000 5,000 6,000 8,000 11,000Other 18,500 500 9,500 6,000 11,000 D D D D
Environmental life scientists 3,500 6,000 6,000 17,000 8,500 9,500 D D S
Hispanic or Latino 13,000 D 15,500 D D D D D DNot Hispanic or Latino
American Indian or Alaska Native D D D D D D D D DAsian 14,500 D D D D D D D DBlack or African American D D D D D D D D DWhite 6,000 18,500 9,000 15,000 D 12,000 D D DOther D D D D D D D D D
Postsecondary teachers-life/ related sciences 500 2,500 4,000 3,500 5,500 9,000 5,000 5,000 6,500
Hispanic or Latino 5,000 10,000 2,500 5,500 5,000 D D S DNot Hispanic or Latino
American Indian or Alaska Native D D D D D D D D DAsian 6,500 5,000 1,500 8,000 17,000 D D 21,500 SBlack or African American 2,000 4,500 3,000 6,000 D 12,500 D D DWhite 2,500 1,500 5,500 4,500 2,500 3,500 4,500 6,500 5,000Other 2,000 D D D D D D D D
Computer/mathematical scientists 2,000 500 4,500 1,500 5,000 3,500 3,500 6,000 1,000
Hispanic or Latino 8,000 4,500 6,500 18,000 22,500 5,500 3,000 D 21,000Not Hispanic or Latino
American Indian or Alaska Native D D D D D D D D DAsian 4,000 3,500 500 5,000 8,000 6,000 5,000 26,500 7,500Black or African American 13,000 3,000 3,500 D 13,500 11,500 38,500 25,000 4,500

TABLE A-16. Standard error of median annual salaries of employed U.S. scientists and engineers, by level of highest degree, occupation, ethnicity, race, and years since highest degree: 2008
Level of highest degree, occupation, ethnicity, and racea
Employed scientists
and engineers
Years since highest degree
<5 years 5–9 years10–14years
15–19 years
20–24 years
25–29 years
30–34 years
35+ years
White 2,500 7,500 7,000 2,000 6,500 4,500 6,500 10,500 1,000Other 6,500 11,500 14,500 D D 26,500 D D D
Computer/information scientists 2,500 2,000 3,500 5,000 2,000 3,500 10,500 26,000 7,500
Hispanic or Latino 8,000 17,000 D 14,500 D D D D DNot Hispanic or Latino
American Indian or Alaska Native D D D D D D D D DAsian 6,000 5,500 8,500 5,500 4,000 24,000 17,500 25,500 SBlack or African American 17,000 6,500 16,000 D D D D D DWhite 5,000 7,500 17,500 7,000 9,000 4,000 18,000 28,000 6,500Other 12,500 16,000 29,000 D D D D D D
Mathematical scientists 1,500 5,500 7,500 12,500 3,000 11,000 36,000 19,000 14,500
Hispanic or Latino 4,000 15,000 4,500 D D D D D DNot Hispanic or Latino
American Indian or Alaska Native D D D D D D D D DAsian 2,000 4,500 13,500 6,500 33,000 38,000 D D DBlack or African American 3,500 D 5,500 D D D D D DWhite 5,500 3,000 6,000 7,500 7,500 12,000 18,500 19,000 16,000Other 29,000 D D D D D D D D
Postsecondary teachers-computer/ mathematical sciences 2,500 2,500 3,500 4,000 3,000 5,500 8,000 10,000 6,000
Hispanic or Latino 5,500 3,000 10,500 3,000 6,000 D D D 21,000Not Hispanic or Latino
American Indian or Alaska Native D D D D D D D D DAsian 3,000 1,500 5,000 6,500 4,000 4,500 16,000 3,500 12,000Black or African American 2,000 19,000 8,000 2,000 D D D D 4,500White 3,000 4,500 5,000 5,000 4,000 9,000 8,000 11,000 10,000Other 14,500 3,500 D D D D D D D
Physical/related scientists 2,000 4,000 2,500 3,000 3,500 2,000 2,000 5,000 5,000
Hispanic or Latino 6,000 1,500 2,000 9,000 12,500 12,000 8,500 20,000 40,500Not Hispanic or Latino
American Indian or Alaska Native 26,500 D D D D D D D DAsian 2,500 6,500 7,000 2,500 2,500 7,000 17,000 13,500 2,000Black or African American 8,500 5,000 7,500 9,000 D 10,000 18,500 16,500 DWhite 500 3,000 3,500 3,000 5,000 2,000 8,000 6,000 6,000Other 9,500 7,000 4,500 1,000 11,000 D D D D
Chemists, except biochemists 500 2,000 2,000 3,500 6,500 4,500 7,000 6,000 7,500
Hispanic or Latino 4,000 16,000 7,500 17,000 15,500 D D D DNot Hispanic or Latino
American Indian or Alaska Native D D D D D D D D DAsian 4,500 18,000 1,500 3,000 5,500 18,000 14,000 9,500 19,000Black or African American 16,000 8,500 5,000 D D D D D DWhite 4,000 3,500 3,000 8,000 4,000 5,000 6,500 6,000 10,500Other 21,000 D 6,000 D D D D D D
Earth/atmospheric/ocean scientists 2,000 3,000 5,500 7,000 11,000 8,500 16,000 10,000 29,000
Hispanic or Latino 5,000 18,500 5,000 D D D D D DNot Hispanic or Latino
American Indian or Alaska Native D D D D D D D D DAsian 5,000 7,500 15,500 12,000 9,500 500 D D DBlack or African American D D D D D D D D DWhite 6,000 1,500 6,000 6,000 9,500 6,000 13,500 14,000 22,000Other 23,000 D 12,500 D D D D D D
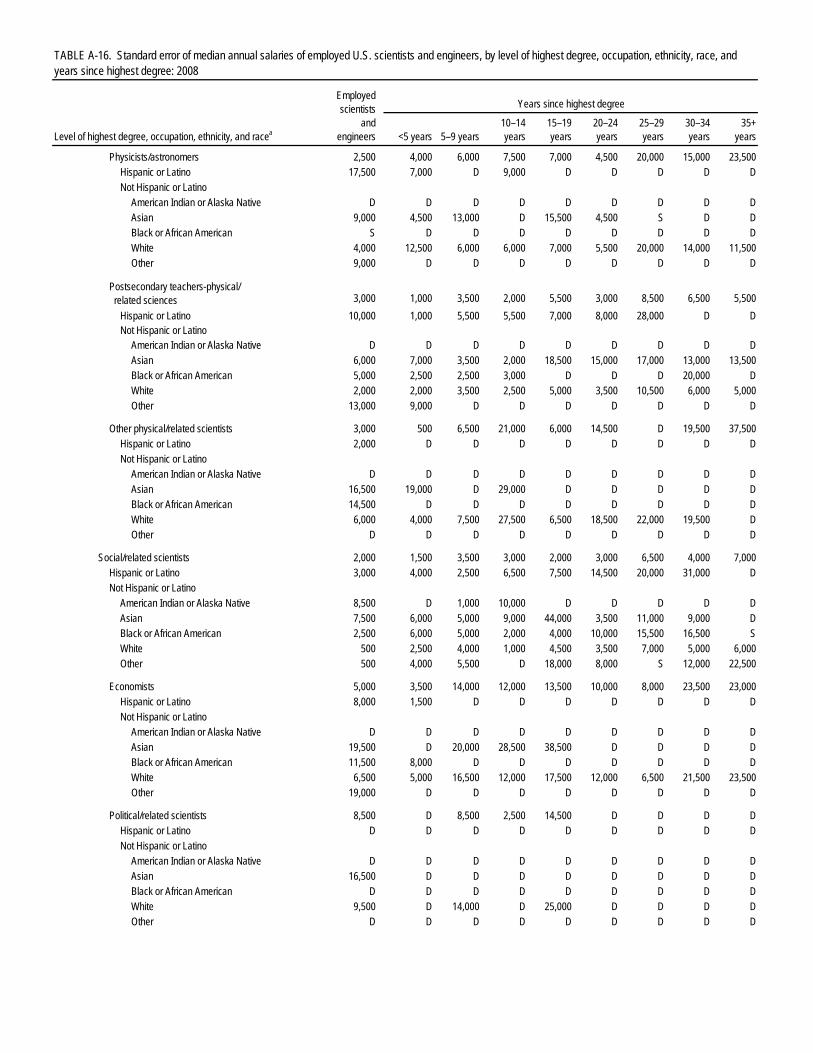
TABLE A-16. Standard error of median annual salaries of employed U.S. scientists and engineers, by level of highest degree, occupation, ethnicity, race, and years since highest degree: 2008
Level of highest degree, occupation, ethnicity, and racea
Employed scientists
and engineers
Years since highest degree
<5 years 5–9 years10–14years
15–19 years
20–24 years
25–29 years
30–34 years
35+ years
Physicists/astronomers 2,500 4,000 6,000 7,500 7,000 4,500 20,000 15,000 23,500Hispanic or Latino 17,500 7,000 D 9,000 D D D D DNot Hispanic or Latino
American Indian or Alaska Native D D D D D D D D DAsian 9,000 4,500 13,000 D 15,500 4,500 S D DBlack or African American S D D D D D D D DWhite 4,000 12,500 6,000 6,000 7,000 5,500 20,000 14,000 11,500Other 9,000 D D D D D D D D
Postsecondary teachers-physical/ related sciences 3,000 1,000 3,500 2,000 5,500 3,000 8,500 6,500 5,500
Hispanic or Latino 10,000 1,000 5,500 5,500 7,000 8,000 28,000 D DNot Hispanic or Latino
American Indian or Alaska Native D D D D D D D D DAsian 6,000 7,000 3,500 2,000 18,500 15,000 17,000 13,000 13,500Black or African American 5,000 2,500 2,500 3,000 D D D 20,000 DWhite 2,000 2,000 3,500 2,500 5,000 3,500 10,500 6,000 5,000Other 13,000 9,000 D D D D D D D
Other physical/related scientists 3,000 500 6,500 21,000 6,000 14,500 D 19,500 37,500
Hispanic or Latino 2,000 D D D D D D D DNot Hispanic or Latino
American Indian or Alaska Native D D D D D D D D DAsian 16,500 19,000 D 29,000 D D D D DBlack or African American 14,500 D D D D D D D DWhite 6,000 4,000 7,500 27,500 6,500 18,500 22,000 19,500 DOther D D D D D D D D D
Social/related scientists 2,000 1,500 3,500 3,000 2,000 3,000 6,500 4,000 7,000
Hispanic or Latino 3,000 4,000 2,500 6,500 7,500 14,500 20,000 31,000 DNot Hispanic or Latino
American Indian or Alaska Native 8,500 D 1,000 10,000 D D D D DAsian 7,500 6,000 5,000 9,000 44,000 3,500 11,000 9,000 DBlack or African American 2,500 6,000 5,000 2,000 4,000 10,000 15,500 16,500 SWhite 500 2,500 4,000 1,000 4,500 3,500 7,000 5,000 6,000Other 500 4,000 5,500 D 18,000 8,000 S 12,000 22,500
Economists 5,000 3,500 14,000 12,000 13,500 10,000 8,000 23,500 23,000
Hispanic or Latino 8,000 1,500 D D D D D D DNot Hispanic or Latino
American Indian or Alaska Native D D D D D D D D DAsian 19,500 D 20,000 28,500 38,500 D D D DBlack or African American 11,500 8,000 D D D D D D DWhite 6,500 5,000 16,500 12,000 17,500 12,000 6,500 21,500 23,500Other 19,000 D D D D D D D D
Political/related scientists 8,500 D 8,500 2,500 14,500 D D D D
Hispanic or Latino D D D D D D D D DNot Hispanic or Latino
American Indian or Alaska Native D D D D D D D D DAsian 16,500 D D D D D D D DBlack or African American D D D D D D D D DWhite 9,500 D 14,000 D 25,000 D D D DOther D D D D D D D D D

TABLE A-16. Standard error of median annual salaries of employed U.S. scientists and engineers, by level of highest degree, occupation, ethnicity, race, and years since highest degree: 2008
Level of highest degree, occupation, ethnicity, and racea
Employed scientists
and engineers
Years since highest degree
<5 years 5–9 years10–14years
15–19 years
20–24 years
25–29 years
30–34 years
35+ years
Postsecondary teachers-social/ related sciences 500 2,000 500 2,500 2,500 3,000 6,000 2,500 3,500
Hispanic or Latino 2,500 2,500 1,500 5,500 8,500 21,500 D D DNot Hispanic or Latino
American Indian or Alaska Native 1,500 D D D D D D D DAsian 6,500 8,500 1,000 5,000 46,000 13,500 2,500 12,000 DBlack or African American 3,500 4,000 6,500 7,000 5,000 10,500 14,500 3,000 DWhite 500 1,500 2,000 2,000 2,500 3,000 7,500 3,000 3,000Other 6,500 7,000 4,500 D D D D 16,500 D
Psychologists 1,000 6,000 4,000 3,500 2,000 4,500 6,500 10,000 14,500
Hispanic or Latino 6,500 7,000 9,000 7,500 11,000 24,500 30,500 D DNot Hispanic or Latino
American Indian or Alaska Native 16,500 D D D D D D D DAsian 14,000 D 7,000 18,500 12,500 S D D DBlack or African American 2,500 19,500 2,500 11,500 9,000 20,500 29,500 12,500 DWhite 1,000 5,000 5,000 4,500 2,500 4,000 4,500 9,500 9,000Other 14,500 4,000 12,500 13,500 D D D D D
Sociologists/anthropologists 7,500 17,500 6,000 6,000 27,500 6,500 14,000 34,000 S
Hispanic or Latino 13,000 D 10,500 D D D D D DNot Hispanic or Latino
American Indian or Alaska Native D D D D D D D D DAsian 13,000 S D D D D D D DBlack or African American S 6,000 D D D D D D DWhite 9,500 9,500 7,000 9,000 8,500 7,000 24,000 32,000 SOther 4,500 12,000 D D D D D D D
Other social/related scientists 3,000 5,000 11,500 5,000 4,000 5,500 14,000 16,000 S
Hispanic or Latino 500 13,000 D D D D D D DNot Hispanic or Latino
American Indian or Alaska Native D D D D D D D D DAsian 18,500 D 17,500 S 54,500 D D D DBlack or African American 11,000 11,000 9,000 D D D D D DWhite 5,500 12,500 12,500 10,500 5,500 5,000 17,500 18,500 SOther 15,000 D D D D D D D D
Engineering occupations 1,500 3,000 500 4,500 4,000 1,500 6,000 2,500 4,000
Hispanic or Latino 1,500 3,000 1,000 5,000 21,500 6,000 7,000 18,000 DNot Hispanic or Latino
American Indian or Alaska Native 15,000 D D D D D D D DAsian 2,500 1,000 2,500 9,000 3,500 2,000 5,500 7,000 6,500Black or African American 6,500 9,000 9,500 4,500 9,500 D D 10,000 DWhite 3,000 2,000 2,500 6,500 2,000 3,500 5,000 5,500 2,000Other 6,500 D 11,000 21,000 23,000 7,000 D D D
Aerospace/aeronautical/astronautical engineers 6,500 1,000 5,500 6,000 8,500 3,000 5,000 5,000 D
Hispanic or Latino 6,500 D D D D D D D DNot Hispanic or Latino
American Indian or Alaska Native D D D D D D D D DAsian 9,000 D D 17,500 5,000 2,500 D D DBlack or African American D D D D D D D D DWhite 6,500 4,500 5,500 7,500 15,500 6,500 6,000 4,500 DOther D D D D D D D D D
Chemical engineers 3,000 4,500 3,000 6,000 7,000 3,000 18,500 15,500 29,000
Hispanic or Latino 13,000 12,500 D D D D D D D

TABLE A-16. Standard error of median annual salaries of employed U.S. scientists and engineers, by level of highest degree, occupation, ethnicity, race, and years since highest degree: 2008
Level of highest degree, occupation, ethnicity, and racea
Employed scientists
and engineers
Years since highest degree
<5 years 5–9 years10–14years
15–19 years
20–24 years
25–29 years
30–34 years
35+ years
Not Hispanic or Latino American Indian or Alaska Native D D D D D D D D DAsian 7,500 2,500 4,500 29,500 5,500 3,500 D D DBlack or African American 2,500 7,000 D D D D D D DWhite 4,500 5,500 7,500 6,000 7,000 13,000 22,000 12,500 29,000Other D D D D D D D D D
Civil/architectural/sanitary engineers 6,000 4,500 5,500 16,500 8,500 8,500 13,500 5,000 7,000
Hispanic or Latino 10,000 13,500 D D D D D D DNot Hispanic or Latino
American Indian or Alaska Native D D D D D D D D DAsian 4,000 7,000 5,500 S D D D D DBlack or African American D D D D D D D D DWhite 8,000 6,000 8,000 22,500 9,000 16,500 12,000 D 5,000Other D D D D D D D D D
Electrical/computer hardware engineers 3,500 500 7,000 4,000 10,500 4,000 22,500 5,000 12,500
Hispanic or Latino 9,000 4,000 7,000 D 8,500 D D D DNot Hispanic or Latino
American Indian or Alaska Native D D D D D D D D DAsian 1,000 4,000 8,500 5,000 9,000 8,500 12,500 13,000 43,500Black or African American 4,000 3,000 D D D D D D DWhite 5,500 5,500 3,000 13,500 11,000 5,500 44,500 8,000 13,500Other 9,000 D D D D D D D D
Industrial engineers 14,500 11,000 4,500 D D D 33,000 30,500 D
Hispanic or Latino 3,000 D D D D D D D DNot Hispanic or Latino
American Indian or Alaska Native D D D D D D D D DAsian 21,000 D D D D D D D DBlack or African American 3,000 D D D D D D D DWhite 16,000 D 6,500 D D D 33,000 D DOther D D D D D D D D D
Mechanical engineers 500 3,000 2,500 5,000 5,000 2,000 14,000 19,500 14,500
Hispanic or Latino 7,500 D D D D D D D DNot Hispanic or Latino
American Indian or Alaska Native D D D D D D D D DAsian 5,500 3,500 4,000 6,000 8,500 8,500 11,000 D DBlack or African American 15,000 D D D D D D D DWhite 6,500 11,500 3,500 2,000 13,500 4,500 27,000 23,000 21,000Other D D D D D D D D D
Postsecondary teachers-engineering 3,000 5,000 3,000 3,500 1,500 4,500 15,000 6,500 6,500
Hispanic or Latino 2,500 15,000 D D 1,000 6,500 D D DNot Hispanic or Latino
American Indian or Alaska Native D D D D D D D D DAsian 5,000 5,500 4,500 10,000 10,000 2,500 7,000 9,500 24,000Black or African American 6,000 D 19,000 3,500 12,000 D D 12,500 DWhite 3,000 4,000 3,500 2,000 3,500 6,000 13,500 4,500 6,000Other 15,000 D D D D D D D D
Other engineers 500 500 3,500 9,000 2,500 1,000 7,500 11,000 6,000
Hispanic or Latino 17,500 19,000 14,500 1,500 D D D D DNot Hispanic or Latino
American Indian or Alaska Native D D D D D D D D DAsian 3,000 4,500 4,000 10,500 10,500 11,500 11,000 S 13,500
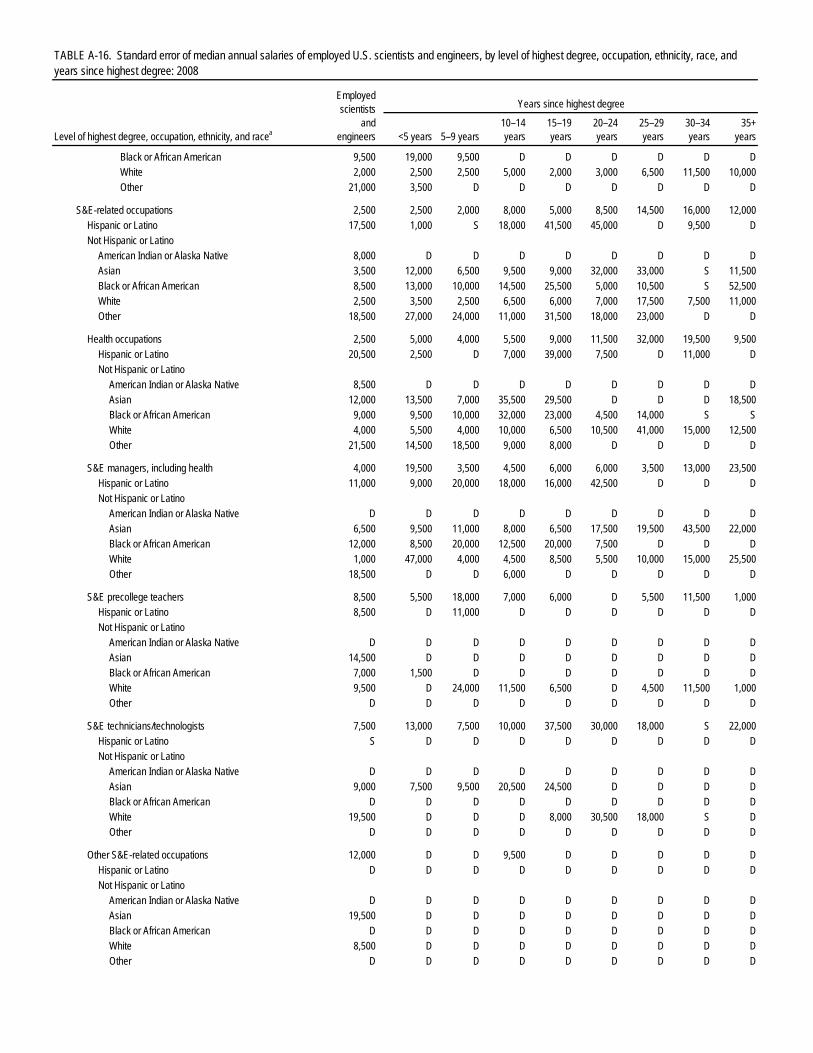
TABLE A-16. Standard error of median annual salaries of employed U.S. scientists and engineers, by level of highest degree, occupation, ethnicity, race, and years since highest degree: 2008
Level of highest degree, occupation, ethnicity, and racea
Employed scientists
and engineers
Years since highest degree
<5 years 5–9 years10–14years
15–19 years
20–24 years
25–29 years
30–34 years
35+ years
Black or African American 9,500 19,000 9,500 D D D D D DWhite 2,000 2,500 2,500 5,000 2,000 3,000 6,500 11,500 10,000Other 21,000 3,500 D D D D D D D
S&E-related occupations 2,500 2,500 2,000 8,000 5,000 8,500 14,500 16,000 12,000
Hispanic or Latino 17,500 1,000 S 18,000 41,500 45,000 D 9,500 DNot Hispanic or Latino
American Indian or Alaska Native 8,000 D D D D D D D DAsian 3,500 12,000 6,500 9,500 9,000 32,000 33,000 S 11,500Black or African American 8,500 13,000 10,000 14,500 25,500 5,000 10,500 S 52,500White 2,500 3,500 2,500 6,500 6,000 7,000 17,500 7,500 11,000Other 18,500 27,000 24,000 11,000 31,500 18,000 23,000 D D
Health occupations 2,500 5,000 4,000 5,500 9,000 11,500 32,000 19,500 9,500
Hispanic or Latino 20,500 2,500 D 7,000 39,000 7,500 D 11,000 DNot Hispanic or Latino
American Indian or Alaska Native 8,500 D D D D D D D DAsian 12,000 13,500 7,000 35,500 29,500 D D D 18,500Black or African American 9,000 9,500 10,000 32,000 23,000 4,500 14,000 S SWhite 4,000 5,500 4,000 10,000 6,500 10,500 41,000 15,000 12,500Other 21,500 14,500 18,500 9,000 8,000 D D D D
S&E managers, including health 4,000 19,500 3,500 4,500 6,000 6,000 3,500 13,000 23,500
Hispanic or Latino 11,000 9,000 20,000 18,000 16,000 42,500 D D DNot Hispanic or Latino
American Indian or Alaska Native D D D D D D D D DAsian 6,500 9,500 11,000 8,000 6,500 17,500 19,500 43,500 22,000Black or African American 12,000 8,500 20,000 12,500 20,000 7,500 D D DWhite 1,000 47,000 4,000 4,500 8,500 5,500 10,000 15,000 25,500Other 18,500 D D 6,000 D D D D D
S&E precollege teachers 8,500 5,500 18,000 7,000 6,000 D 5,500 11,500 1,000
Hispanic or Latino 8,500 D 11,000 D D D D D DNot Hispanic or Latino
American Indian or Alaska Native D D D D D D D D DAsian 14,500 D D D D D D D DBlack or African American 7,000 1,500 D D D D D D DWhite 9,500 D 24,000 11,500 6,500 D 4,500 11,500 1,000Other D D D D D D D D D
S&E technicians/technologists 7,500 13,000 7,500 10,000 37,500 30,000 18,000 S 22,000
Hispanic or Latino S D D D D D D D DNot Hispanic or Latino
American Indian or Alaska Native D D D D D D D D DAsian 9,000 7,500 9,500 20,500 24,500 D D D DBlack or African American D D D D D D D D DWhite 19,500 D D D 8,000 30,500 18,000 S DOther D D D D D D D D D
Other S&E-related occupations 12,000 D D 9,500 D D D D D
Hispanic or Latino D D D D D D D D DNot Hispanic or Latino
American Indian or Alaska Native D D D D D D D D DAsian 19,500 D D D D D D D DBlack or African American D D D D D D D D DWhite 8,500 D D D D D D D DOther D D D D D D D D D
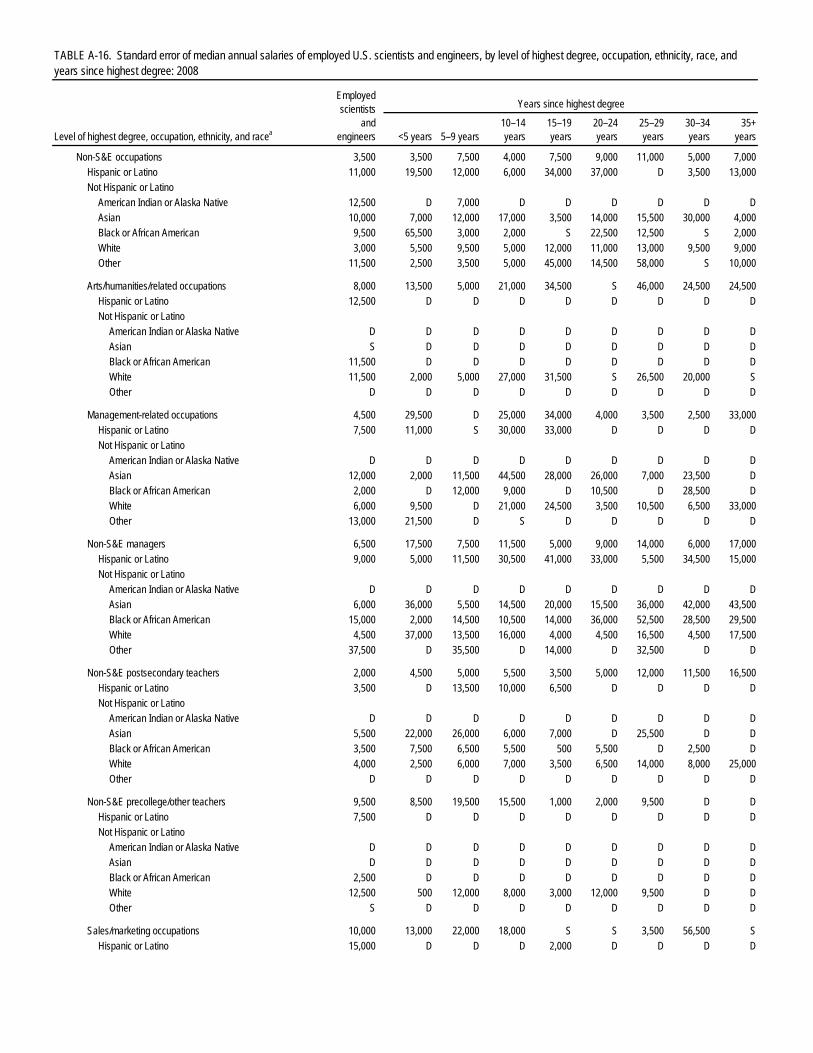
TABLE A-16. Standard error of median annual salaries of employed U.S. scientists and engineers, by level of highest degree, occupation, ethnicity, race, and years since highest degree: 2008
Level of highest degree, occupation, ethnicity, and racea
Employed scientists
and engineers
Years since highest degree
<5 years 5–9 years10–14years
15–19 years
20–24 years
25–29 years
30–34 years
35+ years
Non-S&E occupations 3,500 3,500 7,500 4,000 7,500 9,000 11,000 5,000 7,000Hispanic or Latino 11,000 19,500 12,000 6,000 34,000 37,000 D 3,500 13,000Not Hispanic or Latino
American Indian or Alaska Native 12,500 D 7,000 D D D D D DAsian 10,000 7,000 12,000 17,000 3,500 14,000 15,500 30,000 4,000Black or African American 9,500 65,500 3,000 2,000 S 22,500 12,500 S 2,000White 3,000 5,500 9,500 5,000 12,000 11,000 13,000 9,500 9,000Other 11,500 2,500 3,500 5,000 45,000 14,500 58,000 S 10,000
Arts/humanities/related occupations 8,000 13,500 5,000 21,000 34,500 S 46,000 24,500 24,500
Hispanic or Latino 12,500 D D D D D D D DNot Hispanic or Latino
American Indian or Alaska Native D D D D D D D D DAsian S D D D D D D D DBlack or African American 11,500 D D D D D D D DWhite 11,500 2,000 5,000 27,000 31,500 S 26,500 20,000 SOther D D D D D D D D D
Management-related occupations 4,500 29,500 D 25,000 34,000 4,000 3,500 2,500 33,000
Hispanic or Latino 7,500 11,000 S 30,000 33,000 D D D DNot Hispanic or Latino
American Indian or Alaska Native D D D D D D D D DAsian 12,000 2,000 11,500 44,500 28,000 26,000 7,000 23,500 DBlack or African American 2,000 D 12,000 9,000 D 10,500 D 28,500 DWhite 6,000 9,500 D 21,000 24,500 3,500 10,500 6,500 33,000Other 13,000 21,500 D S D D D D D
Non-S&E managers 6,500 17,500 7,500 11,500 5,000 9,000 14,000 6,000 17,000
Hispanic or Latino 9,000 5,000 11,500 30,500 41,000 33,000 5,500 34,500 15,000Not Hispanic or Latino
American Indian or Alaska Native D D D D D D D D DAsian 6,000 36,000 5,500 14,500 20,000 15,500 36,000 42,000 43,500Black or African American 15,000 2,000 14,500 10,500 14,000 36,000 52,500 28,500 29,500White 4,500 37,000 13,500 16,000 4,000 4,500 16,500 4,500 17,500Other 37,500 D 35,500 D 14,000 D 32,500 D D
Non-S&E postsecondary teachers 2,000 4,500 5,000 5,500 3,500 5,000 12,000 11,500 16,500
Hispanic or Latino 3,500 D 13,500 10,000 6,500 D D D DNot Hispanic or Latino
American Indian or Alaska Native D D D D D D D D DAsian 5,500 22,000 26,000 6,000 7,000 D 25,500 D DBlack or African American 3,500 7,500 6,500 5,500 500 5,500 D 2,500 DWhite 4,000 2,500 6,000 7,000 3,500 6,500 14,000 8,000 25,000Other D D D D D D D D D
Non-S&E precollege/other teachers 9,500 8,500 19,500 15,500 1,000 2,000 9,500 D D
Hispanic or Latino 7,500 D D D D D D D DNot Hispanic or Latino
American Indian or Alaska Native D D D D D D D D DAsian D D D D D D D D DBlack or African American 2,500 D D D D D D D DWhite 12,500 500 12,000 8,000 3,000 12,000 9,500 D DOther S D D D D D D D D
Sales/marketing occupations 10,000 13,000 22,000 18,000 S S 3,500 56,500 S
Hispanic or Latino 15,000 D D D 2,000 D D D D

TABLE A-16. Standard error of median annual salaries of employed U.S. scientists and engineers, by level of highest degree, occupation, ethnicity, race, and years since highest degree: 2008
Level of highest degree, occupation, ethnicity, and racea
Employed scientists
and engineers
Years since highest degree
<5 years 5–9 years10–14years
15–19 years
20–24 years
25–29 years
30–34 years
35+ years
Not Hispanic or Latino American Indian or Alaska Native D D D D D D D D DAsian 26,000 15,500 18,500 5,500 25,500 D D D DBlack or African American 15,500 D D D D D D D DWhite 12,000 12,500 17,000 42,000 S 8,500 4,000 53,500 SOther 23,000 D D D D D D D D
Social services/related occupations 11,000 8,500 18,500 10,000 2,000 13,500 D S 2,000
Hispanic or Latino 5,000 1,000 14,000 D D D D D DNot Hispanic or Latino
American Indian or Alaska Native D D D D D D D D DAsian 5,500 D D D D D D D DBlack or African American 16,000 3,500 500 500 D D D D DWhite 13,000 12,500 5,000 6,000 2,000 18,000 D S 3,000Other 20,500 D D D D D D D D
Other non-S&E occupations 5,500 24,500 10,500 27,500 7,500 S 7,000 S 15,000
Hispanic or Latino S 500 11,500 3,000 D D D D DNot Hispanic or Latino
American Indian or Alaska Native D D D D D D D D DAsian 6,500 2,500 29,000 12,000 D D D D DBlack or African American 2,500 10,500 9,000 10,500 D D D D DWhite 15,000 1,000 10,500 S 27,500 S 11,500 D 11,000Other S D D D D D D D D
NOTES: Scientists and engineers include any person who has ever received bachelor's or higher degree in S&E or S&E-related field through 30 June 2007, plus any person holding non-S&E bachelor's or higher degree who was employed in S&E or S&E-related occupation on 1 October 2003. See http://sestat.nsf.gov/docs/occ03maj.html for detailed description of occupational classification. Standard errors are rounded up to nearest 500.
SOURCE: National Science Foundation/National Center for Science and Engineering Statistics, Scientists and Engineers Statistical Data System (SESTAT): 2008.
D = standard error is not computed when value is suppressed to avoid disclosure of confidential information. S = suppressed; data cell not published.
a "Other" includes Native Hawaiian or Other Pacific Islander and Not Hispanic or Latino respondents reporting two or more races. b Total includes professional degrees not broken out separately.
S&E = science and engineering.